patterson-uti energy, inc. 450 gears road, suite 500...
TRANSCRIPT

P A T T E R S O N - U T I 2 0 0 7 A N N U A L R E P O R T
Patterson-UTI Energy, Inc.450 Gears Road, Suite 500Houston, Texas 77067Telephone: (281) 765-7100Fax: (281) 765-7175www.patenergy.com
P A T T E R S O N - U T I 2 0 0 7 A N N U A L R E P O R T
Financial Highlights
(in thousands, except per share amounts – unaudited) Year Ended December 31, 2003 2004 2005 2006 2007Revenues $ 776,170 $ 1,000,769 $ 1,740,455 $ 2,546,586 $ 2,114,194Operating income 66,282 148,467 581,296 1,039,164 670,276Net income 43,187 94,346 372,740 673,254 438,639Earnings per share Basic 0.27 0.57 2.19 4.08 2.83 Diluted 0.26 0.56 2.15 4.02 2.79Cash dividends per share — 0.06 0.16 0.28 0.44Total assets 1,039,521 1,256,785 1,795,781 2,192,503 2,465,199Long-term debt — — — 120,000 50,000Shareholders’ equity 789,814 961,501 1,367,011 1,562,466 1,896,030Working capital 198,399 235,480 382,448 335,052 227,577
Operational Highlights
(dollars in thousands – unaudited)
Operating days 68,798 77,355 100,591 108,192 89,095Average drilling revenue per day $ 9.30 $ 10.47 $ 14.77 $ 20.05 $ 19.55Average drilling margin per day (1) $ 2.39 $ 3.27 $ 7.05 $ 10.79 $ 8.74Average rigs operating 188 211 276 296 244
(1) Average margin per day represents average revenue per day minus average direct operating costs per day and excludes provisions for bad debts, other charges, depreciation, depletion, amortization and impairment and selling, general and administrative expenses.
Patterson-UTI Energy, Inc. provides onshore contract drilling services to exploration and production companies in North America. The Company’s land-based drilling rigs operate in oil and natural gas producing regions of Texas, New Mexico, Oklahoma, Arkansas, Louisiana, Mississippi, Alabama, Colorado, Utah, Wyoming, Montana, North Dakota, South Dakota, Pennsylvania and western Canada. Patterson-UTI Energy, Inc. is also engaged in the businesses of pressure pumping services and drilling and completion fl uid services.
C O M PA NY P ROFI LE ON THE COVER
Rig 476 is one of our “walking” rigs, on location in the Jonah fi eld in Wyoming. “Walking” rigs provide for increased effi ciency as they enable customers to drill multiple wells on a single pad without rigging down.
P A T T E R S O N - U T I 2 0 0 7 A N N U A L R E P O R T
CORPORATE OFFICE
Patterson-UTI Energy, Inc.450 Gears Road, Suite 500Houston, Texas 77067Telephone: (281) 765-7100Fax: (281) 765-7175www.patenergy.com
COMMON STOCK
Nasdaq: PTEN
TRANSFER AGENT
Continental Stock Transfer & Trust Company17 Battery Place, 8th FloorNew York, NY 10004Telephone: (800) 509-5586www.continentalstock.com
INDEPENDENT AUDITOR
PricewaterhouseCoopers LLP
CORPORATE COUNSEL
Fulbright & Jaworski LLP
DIRECTORS
Mark S. Siegel Chairman, Patterson-UTI Energy, Inc.; President, Remy Investors and Consultants, Incorporated
Kenneth N. Berns Senior Vice President,Patterson-UTI Energy, Inc.
Charles O. Buckner Retired Partner,Ernst & Young LLP
Curtis W. Huff Managing PartnerIntervale Capital LLC
Terry H. Hunt Energy Consultantand Investor
Kenneth R. Peak President and Chief Executive Offi cer, Contango Oil & Gas
Cloyce A. Talbott Former President andChief Executive Offi cer, Patterson-UTI Energy, Inc.
CORPORATE OFFICERS
Mark S. Siegel Chairman
Douglas J. Wall President andChief Executive Offi cer
Kenneth N. Berns Senior Vice President
John E. Vollmer III Senior Vice President –Corporate Development,Chief Financial Offi cerand Treasurer
William L. Moll, Jr. General Counseland Secretary
Gregory W. PipkinChief Accounting Offi cerand Assistant Secretary
C OR POR ATE I N FOR M ATION

CONTENTS
Letter to Shareholders 2
Contract Drilling 4
Pressure Pumping 8
Form 10-K 13
Corporate Information Inside Back Cover
Earnings Per Share(in dollars)
$5.00
4.00
3.00
2.00
1.00
0.0003 04 05 06 07
Revenues(in millions of dollars)
$3,000
2,500
2,000
1,500
1,000
500
003 04 05 06 07

We are pleased to report that Patterson-UTI Energy, Inc. has completed another outstanding year in 2007, marked by successes in many areas. Even more important, we believe that the Company’s performance over the past fi ve years proves the wisdom of our strategic direction and the strong execution by our management. Finally, 2007 was also a year in which we made a number of organizational changes which we believe will position the Company for continued success.
2007 Highlights■ Revenues for 2007 were $2.1 billion, the
second highest level ever achieved in the Company’s nearly 30 year history;
■ Net income for the twelve months ended December 31, 2007 totaled $438.6 million, or $2.79 per share, the second highest levels ever achieved;
■ Universal Well Services, our pressure pumping business, had revenues of $202.8 million and operating income of $64.3 million, both records for this business unit.
Five-Year Highlights – 2003-2007■ Compound annual growth rate (“CAGR”)
in revenue of 22%;■ CAGR in net income of 59%;■ CAGR in earnings per diluted share of 61%;■ Average return on equity of 24% over
the fi ve-year period, which we believe is among the best in the entire oil services industry;
■ Initiated quarterly cash dividends in 2004 and increased the amount each subsequent year;
■ Bought back approximately 20.4 million shares of the Company’s common stock.
We believe that this outstanding record of fi nancial and shareholder returns, without the use of signifi cant leverage, refl ects management’s disciplined and targeted investments in new and upgraded equipment in both our drilling and pressure pumping businesses, and our unwavering commitment to return excess capital to our shareholders through both dividends and stock buybacks.
Building Long-Term Shareholder Value We have continued to make signifi cant investments in our core business units, bringing our three-year total of capital expenditures to approximately $1.6 billion, including approximately $600 million for 2007. During this three-year period, we have signifi cantly upgraded our drilling rig fl eet, including the deployment of approximately 70 new and like-new rigs, so that our fl eet will be well-matched to expected future drilling activity, with its increasing emphasis on unconventional plays. (Please see the Contract Drilling section of this annual report for more details.) In 2008, we plan to invest approximately $500 million in our businesses, including the continuation of our rig fl eet upgrades, activation of new rigs and expansion of our pressure pumping business in Appalachia. We are also pleased that during this same three-year period, we have returned almost $700 million to our shareholders in the form of dividends and buybacks. With approximately $1.6 billion reinvested in our company’s assets and $700 million returned to our shareholders during the last three years, our balance sheet remains strong and currently has no debt.
Contract Drilling OperationsThe combination of rig newbuilds and reactivations in the U.S. land drilling industry over the last few years has caused a short-term excess supply of rigs. Despite
DEAR FE LLOW S HARE HOLDE R S :
2 P A T T E R S O N - U T I 2 0 0 7 A N N U A L R E P O R T

this oversupply, our contract drilling operations remained fundamentally strong in 2007 as we averaged 244 rigs operating during the year, albeit down from 296 rigs operating in 2006. The oversupply of rigs in 2007 was understandable in light of the changes in direction of prices in the natural gas market. Natural gas prices rose from an average of approximately $2.00 in 1998 to an average of almost $9.00 in 2005. This change in natural gas prices occasioned a commensurate increase in the number of wells drilled, thereby encouraging rig newbuilds and reactivations. After this seven-year period of increased natural gas prices, the price declined to average approximately $7.00 in 2006 and 2007 – resulting in slower growth in the number of wells drilled and an oversupply of rigs. We responded to the excess supply of rigs in the market by stacking rigs in a systematic and disciplined manner. Recently, we have seen a number of encouraging signs in the marketplace. First, the pace of additional rigs entering the market has declined signifi cantly. Second, with the price of natural gas increasing in 2008, we believe that we will see a reacceleration in the number of wells drilled. This increase in the number of wells drilled will, of course, require additional rigs which we expect will bring the market into greater equilibrium. Ultimately, increased wells should continue to be the principal mechanism to meet demand for natural gas and to offset steep decline rates. We are well-positioned to meet this expected increase in rig demand as we currently have approximately 90 marketable rigs available to reactivate when the need arises.
Pressure Pumping BusinessOver the last three years, we have invested more than $100 million on new capital equipment in this business. We invested $48 million in 2007, with a large amount of that directed towards upgrading our fracturing capabilities. Much of this additional equipment came on stream late in the year, and will continue to be activated in 2008. We have continued to increase our capacity, and we are well-positioned in the Appalachian market, including for the emerging Marcellus shale play. We expect this additional equipment to drive signifi cant growth in the coming years. (Please see the Pressure Pumping section of this annual report for more details.)
ConclusionWe wish to salute and thank Cloyce A. Talbott, one of the Company’s founders, who retired as Chief Executive Offi cer in September, 2007, but remains with our company as a member of our Board of Directors and consultant. Under Cloyce’s strong and steady leadership, the Company went from a start-up to an industry leader that is well-positioned for future growth with a strong management team. We also wish to acknowledge the extraordinary commitment to excellence that is consistently demonstrated by our employees up and down the organization and to express our appreciation for the support that we continue to receive from our fellow shareholders. We intend to do all that we can to continue to merit the trust and confi dence that has been placed in us.
Respectfully submitted,
Cash Dividends Per Share(in dollars)
$0.50
0.40
0.30
0.20
0.10
0.0003 04 05 06 07
Cash Flow From Operating Activities(in millions of dollars)
$1,000
800
600
400
200
003 04 05 06 07
Douglas J. WallPresident and Chief Executive Offi cer
Mark S. SiegelChairman

Contract Drilling
One of four hydraulic jack “stompers” that allows a rig to “walk” to the next wellbore without dismantling the rig.
Patterson-UTI took delivery of components for fi fteen new rigs. These Custom Advance Technology rigs are equipped with 1500 HP electric drawworks that incorporate state-of-the-art EDS systems, 500 ton top drives, iron roughnecks, hydraulic catwalks and other automated pipe handling equipment. These rigs have deep drilling capacities, yet move and rig-up quickly. Rig 201 (at right) was completed during 2007 and the remainder of these rigs are expected to be commissioned in 2008.
In recent years, new areas of exploration and development have evolved, and will likely continue to evolve, to address the need for additional supplies of natural gas in North America. A resurgence of drilling in the Rocky Mountain region and the emergence of unconventional shale “plays” have become signifi cant sources of natural gas supply. To address these opportunities, we have continued to expand our areas of operation and modify our rig fl eet. In 2007, we completed and activated nine new rigs. Eight of these rigs were our highly-acclaimed “walking” rigs. We now have eleven of these rigs which are designed to drill multiple wells from a pad, and “walk” between wellbores, as opposed to the traditional skid type method of moving. Ten of the “walking” rigs are located in the Rockies. The eleventh rig is deployed in the Barnett Shale – and has already drilled the longest horizontal in this very exciting play. Also during 2007, Patterson-UTI took delivery of components for fi fteen new Custom Advance Technology rigs. We are exceptionally pleased with the performance of the fi rst of these rigs which was constructed and activated in 2007. We expect to activate the remaining fourteen rigs in 2008. Patterson-UTI has also continued to make other signifi cant improvements to its rig fl eet. These improvements include additional 1600 HP triplex pumps, high-effi ciency mud systems, top drives, electronic drilling systems, iron roughnecks, and other equipment to continuously improve drilling effi ciency and safety.
4 P A T T E R S O N - U T I 2 0 0 7 A N N U A L R E P O R T

Iron Roughnecks improve pipe handling effi ciency and overall safety on rigs. Patterson-UTI has approximately 200 Iron Roughnecks.

C ONTR ACT DR I LLI NGPatterson-UTI has approximately 350 currently marketable land-based drilling rigs that operate in oil and natural gas producing regions of the United States and western Canada. In 2007, we moved three drilling rigs to Appalachia to drill in the emerging Marcellus shale play.
Average DrillingRigs Operated(for the year ended December 31)
350
300
250
200
150
10003 04 05 06 07
Average Drilling Revenue Per Day(in thousands of dollars)
$25
20
15
10
503 04 05 06 07
6 P A T T E R S O N - U T I 2 0 0 7 A N N U A L R E P O R T

A view of the rig fl oor from the driller’s console. State-of-the-art Electronic Drilling Systems are standard features on new Patterson-UTI rigs.

Pressure PumpingOur pressure pumping business, Universal Well Services, continues to build on its 25 year tradition of offering pressure pumping services in the Appalachian Basin. With cementing, hydraulic fracturing, acidizing, and nitrogen capabilities, we service the full range of needs for our customers, both large and small. Universal’s team of engineers, geologists and operating personnel are well known and highly respected by our customer base. With nearly 1,000 employees and eight strategically located service centers, Universal has been able to capitalize on the rapidly expanding Appalachian market. Our facilities are conveniently located in the heart of the exploding Marcellus shale play. We continue to add equipment that has been specifi cally designed for the unique nature of Appalachian well locations. We are an integral part of the many industry associations and technical societies working hand in hand with our customers to support the area and bring in new applicable technologies. These long-standing relationships are showcased in the many technical papers and presentations we have done in cooperation with industry partners. Universal has also expanded its capabilities by adding well testing, fl owback and slickline services in the Appalachian Basin and the Rockies, which are being utilized by new and long time customers.
Small fi eld locations require fi t-for-purpose equipment.
The ability to provide a variety of treatment choices allows Universal to access all segments of the market.
8 P A T T E R S O N - U T I 2 0 0 7 A N N U A L R E P O R T

Safety is a value for all Patterson-UTI employees.

PR E S SUR E PUM PI NGUniversal’s core pressure pumping business is strategically located throughout the Appalachian Basin, while we provide fl owback and well testing services in both Appalachia and the Rockies.
Number of Pressure Pumping Jobs(for the year ended December 31)
15,000
12,500
10,000
7,500
5,00003 04 05 06 07
Average Pressure Pumping Revenue Per Job(in thousands of dollars)
$15
12
9
603 04 05 06 07
Pressure pumping, fl owback and well testing servicesFlowback and well testing services
Universal’s strengths focus on personnel and equipment that capitalize on the unique nature and demands of the Appalachian Region.
1 0 P A T T E R S O N - U T I 2 0 0 7 A N N U A L R E P O R T

An early morning for a Kentucky-based nitrogen crew.

Financial Review

UNITED STATES SECURITIES AND EXCHANGE COMMISSIONWashington, D.C. 20549
Form 10-K(Mark One)
¥ ANNUAL REPORT PURSUANT TO SECTION 13 OR 15(d)OF THE SECURITIES EXCHANGE ACT OF 1934
For the fiscal year ended December 31, 2007
or
n TRANSITION REPORT PURSUANT TO SECTION 13 OR 15(d)OF THE SECURITIES EXCHANGE ACT OF 1934
For the transition period from toCommission File Number 0-22664
Patterson-UTI Energy, Inc.(Exact name of registrant as specified in its charter)
Delaware(State or other jurisdiction ofincorporation or organization)
75-2504748(I.R.S. Employer
Identification No.)
4510 Lamesa Highway, Snyder, Texas(Address of principal executive offices)
79549(Zip Code)
Registrant’s telephone number, including area code:(325) 574-6300
Securities Registered Pursuant to 12(b) of the Act:None
Securities Registered Pursuant to 12(g) of the Act:(Title of class)
Common Stock, $.01 Par Value
Indicate by check mark if the registrant is a well-known seasoned issuer, as defined in Rule 405 of the Securities Act. Yes ¥ or No n
Indicate by check mark if the registrant is not required to file reports pursuant to Section 13 or Section 15(d) of the Act. Yes n or No ¥
Indicate by check mark whether the registrant (1) has filed all reports required to be filed by Section 13 or 15(d) of the Securities ExchangeAct of 1934 during the preceding 12 months (or for such shorter period that the registrant was required to file such reports), and (2) has beensubject to such filing requirements for the past 90 days. Yes ¥ No n
Indicate by check mark if disclosure of delinquent filers pursuant to Item 405 of Regulation S-K is not contained herein, and will not becontained, to the best of the registrant’s knowledge, in definitive proxy or information statements incorporated by reference in Part III of thisForm 10-K or any amendment to this Form 10-K. ¥
Indicate by check mark whether the registrant is a large accelerated filer, an accelerated filer, a non-accelerated filer, or a smaller reportingcompany. See the definitions of “large accelerated filer,” “accelerated filer” and “smaller reporting company” in Rule 12b-2 of the ExchangeAct. (Check one):
Large accelerated filer ¥ Accelerated filer n Non-accelerated filer n Smaller reporting company n
Indicate by check mark whether the registrant is a shell company (as defined in Rule 12b-2 of the Act). Yes n No ¥
The aggregate market value of the voting and non-voting common equity held by non-affiliates of the registrant as of June 29, 2007, thelast business day of the registrant’s most recently completed second fiscal quarter, was $4,052,686,260, calculated by reference to the closingprice of $26.21 for the common stock on the Nasdaq National Market on that date.
As of February 15, 2008, the registrant had outstanding 154,027,206 shares of common stock, $.01 par value, its only class of commonstock.
Documents incorporated by reference:
Definitive Proxy Statement for the 2008 Annual Meeting of Stockholders (Part III).


FORWARD-LOOKING STATEMENTS
Certain statements made in this Annual Report on Form 10-K and in other public filings and press releases bythe Company contain “forward-looking” information (as defined in the Private Securities Litigation Reform Act of1995) that involves risk and uncertainty. These forward-looking statements may include, but are not limited to,references to liquidity, financing of operations, impact of inflation, future capital expenditures, oil and natural gasprices and demand for drilling rigs. Our forward-looking statements can be identified by the fact that they do notrelate strictly to historic or current facts and often use words such as “believes,” “budgeted,” “expects,” “project,”“will,” “could,” “may,” “plans,” “intends,” “strategy,” or “anticipates,” and other words and expressions of similarmeaning. Although we believe that the expectations reflected in such forward-looking statements are reasonable,we can give no assurance that such expectation will prove to have been correct. Forward-looking statements may bemade by management orally or in writing, including, but not limited to, Management’s Discussion and Analysis ofFinancial Condition and Results of Operations included in this Annual Report on Form 10-K and other sections ofour filings with the Securities and Exchange Commission under the Securities Exchange Act of 1934 and theSecurities Act of 1933.
Forward-looking statements are not guarantees of future performance and a variety of factors could causeactual results to differ materially from the anticipated or expected results expressed in or suggested by theseforward-looking statements. Factors that might cause or contribute to such differences include, but are not limitedto, declines in oil and natural gas prices that could adversely affect demand for the Company’s services and theirassociated effect on day rates, rig utilization and planned capital expenditures, excess availability of land drillingrigs, including as a result of the reactivation or construction of new land drilling rigs, adverse industry conditions,difficulty in integrating acquisitions, demand for oil and natural gas, shortages of rig equipment and ability to retainmanagement and field personnel. Refer to “Risk Factors” contained in Part 1 of this Annual Report on Form 10-Kfor a more complete discussion of these and other factors that might affect our performance and financial results.These forward-looking statements are intended to relay the Company’s expectations about the future, and speakonly as of the date they are made. We undertake no obligation to publicly update or revise any forward-lookingstatement, whether as a result of new information, future events or otherwise.
PART I
Item 1. Business
Available Information
This Annual Report on Form 10-K, along with our Quarterly Reports on Form 10-Q, Current Reports onForm 8-K and amendments to those reports filed or furnished pursuant to Section 13(a) or 15(d) of the SecuritiesExchange Act of 1934, are available free of charge through our Internet website (www.patenergy.com) as soon asreasonably practicable after we electronically file such material with, or furnish it to, the United States Securitiesand Exchange Commission (“SEC”). You may read and copy any materials we file with the SEC at the SEC’s PublicReference Room at 100 F Street, NE, Washington, DC 20549. You may obtain information on the operation of thePublic Reference Room by calling the SEC at 1-800-SEC-0330.
Overview
Based on publicly available information, we believe we are the second largest operator of land-based drillingrigs in North America. The Company was formed in 1978 and reincorporated in 1993 as a Delaware corporation.Our contract drilling business operates primarily in Texas, New Mexico, Oklahoma, Arkansas, Louisiana,Mississippi, Colorado, Utah, Wyoming, Montana, North Dakota, South Dakota, Pennsylvania and western Canada(Alberta, British Columbia and Saskatchewan).
As of December 31, 2007, we had a drilling fleet that consisted of 350 currently marketable land-based drillingrigs. A drilling rig includes the structure, power source and machinery necessary to cause a drill bit to penetrateearth to a depth desired by the customer. A drilling rig is considered currently marketable at a point in time if it is
1

operating or can be made ready to operate without significant capital expenditures. We also have a substantialinventory of drilling rig components and equipment.
We provide pressure pumping services to oil and natural gas operators primarily in the Appalachian Basin.These services consist primarily of well stimulation and cementing for completion of new wells and remedial workon existing wells. We provide drilling fluids, completion fluids and related services to oil and natural gas operatorsoffshore in the Gulf of Mexico and on land in Texas, Southeastern New Mexico, Oklahoma and the Gulf Coastregion of Louisiana. Drilling and completion fluids are used by oil and natural gas operators during the drillingprocess to control pressure when drilling oil and natural gas wells. We own and invest in oil and natural gas assets asa working interest owner. Our oil and natural gas interests are located primarily in producing regions of West andSouth Texas, Southeastern New Mexico, Utah and Mississippi.
Industry Segments
Our revenues, operating profits and identifiable assets are primarily attributable to four industry segments:
• contract drilling,
• pressure pumping services,
• drilling and completion fluids services, and
• oil and natural gas exploration and production.
All of our industry segments had operating profits in 2007, 2006 and 2005.
See “Management’s Discussion and Analysis of Financial Condition and Results of Operations” and Note 15of Notes to Consolidated Financial Statements included as a part of Items 7 and 8, respectively, of this Report forfinancial information pertaining to these industry segments.
Contract Drilling Operations
General — We market our contract drilling services to major and independent oil and natural gas operators. Asof December 31, 2007, we had 350 currently marketable land-based drilling rigs which were based in the followingregions:
• 107 in the Permian Basin region (West Texas and Southeastern New Mexico),
• 51 in South Texas,
• 42 in the Ark-La-Tex region and Mississippi,
• 75 in the Mid-Continent region (Oklahoma and North Central Texas),
• 52 in the Rocky Mountain region (Colorado, Utah, Wyoming, Montana, North Dakota and South Dakota),
• 3 in the Appalachian Basin, and
• 20 in Western Canada (Alberta, British Columbia and Saskatchewan).
Our marketable drilling rigs have rated maximum depth capabilities ranging from 5,000 feet to 30,000 feet.Sixty-nine of these drilling rigs are electric rigs and 281 are mechanical rigs. An electric rig differs from amechanical rig in that the electric rig converts the diesel power (the sole energy source for a mechanical rig) intoelectricity to power the rig. We also have a substantial inventory of drilling rig components and equipment whichmay be used in the activation of additional drilling rigs or as replacement parts for marketable rigs.
Drilling rigs are typically equipped with engines, drawworks, masts, pumps to circulate the drilling fluid,blowout preventers, drill pipe and other related equipment. Over time, components on a drilling rig are replaced orrebuilt. We spend significant funds each year on an ongoing program to modify and upgrade our drilling rigs toensure that our drilling equipment is competitive. We have spent $1.4 billion during the last three years on capitalexpenditures to modify, upgrade and maintain our drilling fleet. During fiscal years 2007, 2006 and 2005, we spentapproximately $540 million, $531 million and $329 million, respectively, on these capital expenditures.
2
Depth and complexity of the well and drill site conditions are the principal factors in determining the size ofdrilling rig used for a particular job. Our rigs are capable of vertical or horizontal drilling.
Our contract drilling operations depend on the availability of drill pipe, drill bits, replacement parts and otherrelated rig equipment, fuel and qualified personnel. Some of these have been in short supply from time to time.
Drilling Contracts — Most of our drilling contracts are with established customers on a competitive bid ornegotiated basis. Typically, the contracts are short-term to drill a single well or a series of wells. Customer demandfor drilling contracts with a term of one or more years increased during 2005 due to the scarcity of available drillingrigs in the market place. In response to this demand, we entered into long-term contracts in 2005 and 2006 and, to alesser extent, in 2007. These long-term contracts provide for the use of drilling rigs for fixed periods of time duringwhich multiple wells are drilled. During 2007, our average number of days to drill a well (which includes moving tothe drill site, rigging up and rigging down) was approximately 21 days. We may continue to enter into long-termcontracts when considered beneficial to the Company.
The drilling contracts obligate us to provide and operate a drilling rig and to pay certain operating expenses,including wages of drilling personnel and necessary maintenance expenses. Most drilling contracts are subject totermination by the customer on short notice. We generally indemnify our customers against claims by ouremployees and claims that might arise from surface pollution caused by spills of fuel, lubricants and other solventswithin our control. The customers generally indemnify us against claims that might arise from other surface andsubsurface pollution, except claims that might arise from our gross negligence. Each drilling contract will containthe actual terms setting forth our rights and obligations and those of the particular customer.
The contracts provide for payment on a daywork, footage, or turnkey basis, or a combination thereof. In eachcase, we provide the rig and crews. Our bid for each contract depends upon location, depth and anticipatedcomplexity of the well, on-site drilling conditions, equipment to be used, estimated risks involved, estimatedduration of the job, availability of drilling rigs and other factors particular to each proposed well.
Daywork Contracts
Under daywork contracts, we provide the drilling rig and crew to the customer. The customer supervises thedrilling of the well. Our compensation is based on a contracted rate per day during the period the drilling rig isutilized. We often receive a lower rate when the drilling rig is moving, or when drilling operations are interrupted orrestricted by adverse weather conditions or other conditions beyond our control. Daywork contracts typicallyprovide separately for mobilization of the drilling rig.
Footage Contracts
Under footage contracts, we contract to drill a well to a certain depth under specified conditions for a fixedprice per foot. The customer provides drilling fluids, casing, cementing and well design expertise. These contractsrequire us to bear the cost of services and supplies that we provide until the well has been drilled to the agreed depth.If we drill the well in less time than estimated, we have the opportunity to improve our profits over those that wouldbe attainable under a daywork contract. Profits are reduced and losses may be incurred if the well requires moredays to drill to the contracted depth than estimated. Footage contracts generally contain greater risks for a drillingcontractor than daywork contracts. Under footage contracts, the drilling contractor assumes certain risks associatedwith loss of the well from fire, blowouts and other risks. Due to market conditions, we have entered into very fewfootage contracts in recent years.
Turnkey Contracts
Under turnkey contracts, we contract to drill a well to a certain depth under specified conditions for a fixed fee.In a turnkey arrangement, we are required to bear the costs of services, supplies and equipment beyond thosetypically provided under a footage contract. In addition to the drilling rig and crew, we are required to provide thedrilling and completion fluids, casing, cementing, and the technical well design and engineering services during thedrilling process. We also assume certain risks associated with drilling the well such as fires, blowouts, cratering ofthe well bore and other such risks. Compensation occurs only when the agreed scope of the work has been
3

completed, which requires us to make larger up-front working capital commitments prior to receiving paymentsunder a turnkey drilling contract. Under a turnkey contract, we have the opportunity to improve our profits if thedrilling process goes as expected and there are no complications or time delays. However, given the increasedexposure we have under a turnkey contract, profits can be significantly reduced and losses can be incurred ifcomplications or delays occur during the drilling process. Turnkey contracts generally involve the highest degree ofrisk among the three different types of drilling contracts: daywork, footage and turnkey. Due to market conditions,we have entered into very few turnkey contracts in recent years.
Revenues by Contract Type — Information regarding our revenues by contract type for the last three yearsfollows:
Type of Revenues 2007 2006 2005Year Ended December 31,
Daywork . . . . . . . . . . . . . . . . . . . . . . . . . . . . . . . . . . . . . . . . . . . . . . . . . 100% 100% 98%
Footage . . . . . . . . . . . . . . . . . . . . . . . . . . . . . . . . . . . . . . . . . . . . . . . . . . 0 0 1
Turnkey . . . . . . . . . . . . . . . . . . . . . . . . . . . . . . . . . . . . . . . . . . . . . . . . . . 0 0 1
Contract Drilling Activity — Information regarding our contract drilling activity for the last three yearsfollows:
2007 2006 2005Year Ended December 31,
Average rigs operating(1) . . . . . . . . . . . . . . . . . . . . . . . . . . . . . . . . . 244 296 276
Number of rigs operated . . . . . . . . . . . . . . . . . . . . . . . . . . . . . . . . . 338 331 307
Number of wells drilled . . . . . . . . . . . . . . . . . . . . . . . . . . . . . . . . . . 4,237 5,050 4,594
Number of operating days . . . . . . . . . . . . . . . . . . . . . . . . . . . . . . . . 89,095 108,221 100,591
(1) A rig is operating when it is drilling, being moved, assembled, dismantled or otherwise earning revenue undercontract.
Drilling Rigs and Related Equipment — We estimate the depth capacity with respect to rigs that werecurrently marketable as of December 31, 2007 to be as follows:
Depth Rating (Ft.) Mechanical Electric Total
5,000 to 7,999 . . . . . . . . . . . . . . . . . . . . . . . . . . . . . . . . . . . . . . . . . . 4 — 48,000 to 11,999 . . . . . . . . . . . . . . . . . . . . . . . . . . . . . . . . . . . . . . . . . 74 2 76
12,000 to 15,999 . . . . . . . . . . . . . . . . . . . . . . . . . . . . . . . . . . . . . . . . 186 33 219
16,000 to 30,000 . . . . . . . . . . . . . . . . . . . . . . . . . . . . . . . . . . . . . . . . 17 34 51
Totals . . . . . . . . . . . . . . . . . . . . . . . . . . . . . . . . . . . . . . . . . . . . . . . 281 69 350
At December 31, 2007, we owned and operated 324 trucks and 441 trailers used to rig down, transport and rigup our drilling rigs. Our ownership of trucks and trailers reduces our dependency upon third parties for theseservices and enhances the efficiency of our contract drilling operations particularly in periods of high drilling rigutilization.
Most repair and overhaul work to our drilling rig equipment is performed at our yard facilities located in Texas,New Mexico, Oklahoma, Wyoming, Utah and Western Canada.
Pressure Pumping Operations
General — We provide pressure pumping services to oil and natural gas operators primarily in the Appa-lachian Basin. Pressure pumping services are primarily well stimulation and cementing for the completion of newwells and remedial work on existing wells. Most wells drilled in the Appalachian Basin require some form offracturing or other stimulation to enhance the flow of oil and natural gas by pumping fluids under pressure into the
4

well bore. Generally, Appalachian Basin wells require cementing services before production commences. Thecementing process inserts material between the wall of the well bore and the casing to center and stabilize thecasing.
Equipment — Our pressure pumping equipment at December 31, 2007 follows:
• 34 cement pumper trucks,
• 57 fracturing pumper trucks,
• 47 nitrogen pumper trucks,
• 26 blender trucks,
• 24 acid trucks,
• 46 bulk cement trucks,
• 19 bulk nitrogen trucks,
• 3 bulk nitrogen tractor trailer combinations,
• 51 bulk sand trucks,
• 14 sand pneumatic trucks, and
• 26 connection trucks.
Drilling and Completion Fluids Operations
General — We provide drilling fluids, completion fluids and related services to oil and natural gas operatorsoffshore in the Gulf of Mexico and on land in Texas, Southeastern New Mexico, Oklahoma and the Gulf Coastregion of Louisiana. We serve our offshore customers through six stockpoint facilities located along the Gulf ofMexico in Texas and Louisiana and our land-based customers through fourteen stockpoint facilities in Texas,Louisiana, Oklahoma and New Mexico.
Drilling Fluids — Drilling fluid products and systems are used to cool and lubricate the bit during drillingoperations, contain formation pressures (thereby minimizing blowout risk), suspend and remove rock cuttings fromthe hole and maintain the stability of the wellbore. Technical services are provided to ensure that the products andsystems are applied effectively to optimize drilling operations.
Completion Fluids — After a well is drilled, the well casing is set and cemented into place. At that point, thedrilling fluid services are complete and the drilling fluids are circulated out of the well and replaced with completionfluids. Completion fluids, also known as clear brine fluids, are solids-free, clear salt solutions that have high specificgravities. Combined with a range of specialty chemicals, these fluids are used to control bottom-hole pressures andto meet specific corrosion, inhibition, viscosity and fluid loss requirements.
Raw Materials — Our drilling and completion fluids operations depend on the availability of the followingraw materials:
Drilling
barite and bentoniteCompletion
calcium chloride, calcium bromide and zinc bromide
We obtain these raw materials through purchases made on the spot market and supply contracts with producersof these raw materials.
Barite Grinding Facility — We operate a barite grinding facility with two barite grinding mills in Houma,Louisiana. This facility allows us to grind raw barite into the powder additive used in drilling fluids.
Other Equipment — We own and operate 20 trucks and 92 trailers and lease another 34 trucks which are usedto transport drilling and completion fluids and related equipment.
5
Oil and Natural Gas Operations
General — We have been engaged in the development, exploration, acquisition and production of oil andnatural gas. Through October 31, 2007, we served as operator with respect to several properties and were activelyinvolved in the development, exploration, acquisition and production of oil and natural gas. Effective November 1,2007, we sold the related operations portion of our exploration and production business. We continue to own andinvest in oil and natural gas assets as a working interest owner. Our oil and natural gas interests are located primarilyin producing regions of West and South Texas, Southeastern New Mexico, Utah and Mississippi.
Customers
The customers of each of our three oil service business segments are oil and natural gas operators. Ourcustomer base includes both major and independent oil and natural gas operators. During 2007, no single customeraccounted for 10% or more of our consolidated operating revenues.
Competition
Contract Drilling and Pressure Pumping Businesses — Our land drilling and pressure pumping businesses arehighly competitive. At times, available land drilling rigs and pressure pumping equipment exceed the demand forsuch equipment. The equipment can also be moved from one market to another in response to market conditions.
Drilling and Completion Fluids Business — The drilling and completion fluids industry is highly competitiveand price is generally the most important factor. Other competitive factors include the availability of chemicals andexperienced personnel, the reputation of the fluids services provider in the drilling industry and relationships withcustomers. Some of our competitors have substantially more resources and longer operating histories than we have.
Government and Environmental Regulation
All of our operations and facilities are subject to numerous Federal, state, foreign, and local laws, rules andregulations related to various aspects of our business, including:
• drilling of oil and natural gas wells,
• containment and disposal of hazardous materials, oilfield waste, other waste materials and acids,
• use of underground storage tanks, and
• use of underground injection wells.
To date, applicable environmental laws and regulations have not required the expenditure of significantresources. We do not anticipate any material capital expenditures for environmental control facilities or extraor-dinary expenditures to comply with environmental rules and regulations in the foreseeable future. However,compliance costs under existing laws or under any new requirements could become material, and we could incurliability in any instance of noncompliance.
Our business is generally affected by political developments and by Federal, state, foreign, and local laws andregulations that relate to the oil and natural gas industry. The adoption of laws and regulations affecting the oil andnatural gas industry for economic, environmental and other policy reasons could increase costs relating to drillingand production. They could have an adverse effect on our operations. State and Federal environmental laws andregulations currently apply to our operations and may become more stringent in the future.
We believe we use operating and disposal practices that are standard in the industry. However, hydrocarbonsand other materials may have been disposed of or released in or under properties currently or formerly owned oroperated by us or our predecessors. In addition, some of these properties have been operated by third parties overwhom we have no control of their treatment of hydrocarbon and other materials or the manner in which they mayhave disposed of or released such materials.
6

The Federal Comprehensive Environmental Response Compensation and Liability Act of 1980, as amended,commonly known as CERCLA, and comparable state statutes impose strict liability on:
• owners and operators of sites, and
• persons who disposed of or arranged for the disposal of “hazardous substances” found at sites.
The Federal Resource Conservation and Recovery Act (“RCRA”), as amended, and comparable state statutesgovern the disposal of “hazardous wastes.” Although CERCLA currently excludes petroleum from the definition of“hazardous substances,” and RCRA also excludes certain classes of exploration and production wastes fromregulation, such exemptions by Congress under both CERCLA and RCRA may be deleted, limited, or modified inthe future. If such changes are made to CERCLA and/or RCRA, we could be required to remove and remediatepreviously disposed of materials (including materials disposed of or released by prior owners or operators) fromproperties (including ground water contaminated with hydrocarbons) and to perform removal or remedial actions toprevent future contamination.
The Federal Water Pollution Control Act and the Oil Pollution Act of 1990, as amended, and implementingregulations govern:
• the prevention of discharges, including oil and produced water spills, and
• liability for drainage into waters.
The Oil Pollution Act is more comprehensive and stringent than previous oil pollution liability and preventionlaws. It imposes strict liability for a comprehensive and expansive list of damages from an oil spill into waters fromfacilities. Liability may be imposed for oil removal costs and a variety of public and private damages. Penalties mayalso be imposed for violation of Federal safety, construction and operating regulations, and for failure to report aspill or to cooperate fully in a clean-up.
The Oil Pollution Act also expands the authority and capability of the Federal government to direct andmanage oil spill clean-up and operations, and requires operators to prepare oil spill response plans in cases where itcan reasonably be expected that substantial harm will be done to the environment by discharges on or into navigablewaters. We have spill prevention control and countermeasure plans in place for our oil and natural gas properties ineach of the areas in which we operate and for each of the stockpoints operated by our drilling and completion fluidsbusiness. Failure to comply with ongoing requirements or inadequate cooperation during a spill event may subject aresponsible party, such as us, to civil or criminal actions. Although the liability for owners and operators is the sameunder the Federal Water Pollution Act, the damages recoverable under the Oil Pollution Act are potentially muchgreater and can include natural resource damages.
Our operations are also subject to Federal, state and local regulations for the control of air emissions. TheFederal Clean Air Act, as amended, and various state and local laws impose certain air quality requirements on us.Amendments to the Clean Air Act revised the definition of “major source” such that emissions from both wellheadand associated equipment involved in oil and natural gas production may be added to determine if a source is a“major source.” As a consequence, more facilities may become major sources and thus would be required to obtainoperating permits. This permitting process may require capital expenditures in order to comply with permit limits.
Risks and Insurance
Our operations are subject to the many hazards inherent in the drilling business, including:
• accidents at the work location,
• blow-outs,
• cratering,
• fires, and
• explosions.
7

These hazards could cause:
• personal injury or death,
• suspension of drilling operations, or
• serious damage or destruction of the equipment involved and, in addition to environmental damage, couldcause substantial damage to producing formations and surrounding areas.
Damage to the environment, including property contamination in the form of either soil or ground watercontamination, could also result from our operations, particularly through:
• oil or produced water spillage,
• natural gas leaks, and
• fires.
In addition, we could become subject to liability for reservoir damages. The occurrence of a significant event,including pollution or environmental damages, could materially affect our operations, cash flows and financialcondition.
As a protection against operating hazards, we maintain insurance coverage we believe to be adequate,including:
• all-risk physical damages,
• employer’s liability,
• commercial general liability, and
• workers compensation insurance.
We believe that we are adequately insured for public liability and property damage to others with respect to ouroperations. However, such insurance may not be sufficient to protect us against liability for all consequences of:
• personal injury,
• well disasters,
• extensive fire damage,
• damage to the environment, or
• other hazards.
We also carry insurance to cover physical damage to, or loss of, our drilling rigs. However, it does not cover thefull replacement cost of the rigs and we do not carry insurance against loss of earnings resulting from such damage.In view of the difficulties that may be encountered in renewing such insurance at reasonable rates, no assurance canbe given that:
• we will be able to maintain the type and amount of coverage that we believe to be adequate at reasonablerates, or
• any particular types of coverage will be available.
In addition to insurance coverage, we also attempt to obtain indemnification from our customers for certainrisks. These indemnity agreements typically require our customers to hold us harmless in the event of loss ofproduction or reservoir damage. These contractual indemnifications, if obtained, may not be supported by adequateinsurance maintained by the customer.
8

Employees
We had approximately 8,100 full-time employees at December 31, 2007. The number of employees fluctuatesdepending on the current and expected demand for our services. We consider our employee relations to besatisfactory. None of our employees are represented by a union.
Seasonality
Seasonality does not significantly affect our overall operations. However, our drilling operations in Canada,and our pressure pumping division in the Appalachian Basin to a lesser extent, are subject to slow periods of activityduring the Spring thaw.
Raw Materials and Subcontractors
We use many suppliers of raw materials and services. These materials and services have historically beenavailable, although there is no assurance that such materials and services will continue to be available on favorableterms or at all. We also utilize numerous independent subcontractors from various trades.
Item 1A. Risk Factors.
We wish to caution you that there are risks and uncertainties that could affect our business. These risks anduncertainties include, but are not limited to, the risks described below and elsewhere in this Report, particularlyfound in “Forward Looking Statements.” The following is not intended to be a complete discussion of all potentialrisks or uncertainties, as it is not possible to predict or identify all risk factors.
We are Dependent on the Oil and Natural Gas Industry and Market Prices for Oil and Natural Gas.Declines in Oil and Natural Gas Prices Have Adversely Affected Our Operations.
Our revenue, profitability and rate of growth are substantially dependent upon prevailing prices for natural gasand, to a lesser extent, oil. For many years, oil and natural gas prices and markets have been extremely volatile.Prices are affected by:
• market supply and demand,
• international military, political and economic conditions, and
• the ability of the Organization of Petroleum Exporting Countries, commonly known as OPEC, to set andmaintain production and price targets.
All of these factors are beyond our control. During 2006, the average market price of natural gas retreated fromrecord highs that were set in 2005. The price dropped from an average of $8.98 per Mcf in 2005 to an average of $6.94per Mcf in 2006 and an average of $7.18 per Mcf in 2007. This resulted in our customers moderating their increase indrilling activities in 2007. This moderation combined with the reactivation and construction of new land drilling rigsin the United States has resulted in excess capacity compared to recent demand. Additionally, drilling activity inCanada has slowed significantly. As a result of these factors, our average number of rigs operating declined to 244 in2007 compared to 296 in 2006. We expect oil and natural gas prices to continue to be volatile and to affect ourfinancial condition, operations and ability to access sources of capital. A significant decrease in market prices fornatural gas could result in a material decrease in demand for drilling rigs and adversely affect our operating results.
A General Excess of Operable Land Drilling Rigs Adversely Affects Our Profit Margins Particularly inTimes of Weaker Demand.
The North American land drilling industry has experienced periods of downturn in demand over the lastdecade. During these periods, there have been substantially more drilling rigs available than necessary to meetdemand. As a result, drilling contractors have had difficulty sustaining profit margins during the downturn periods.
In addition to adverse effects that future declines in demand could have on us, ongoing factors which couldcontinue to adversely affect utilization rates and pricing, even in an environment of high oil and natural gas pricesand increased drilling activity, include:
• movement of drilling rigs from region to region,
9
• reactivation of land-based drilling rigs, or
• construction of new drilling rigs.
As a result of an increase in drilling activity and increased prices for drilling services in 2005 and 2006,construction of new drilling rigs increased significantly in that time period. The addition of new drilling rigs to themarket has resulted in excess capacity compared to demand, and construction of new drilling rigs has moderated in2007. We cannot predict either the future level of demand for our contract drilling services or future conditions inthe oil and natural gas contract drilling business.
Shortages of Drill Pipe, Replacement Parts and Other Related Rig Equipment Adversely Affects OurOperating Results.
During periods of increased demand for drilling services, the industry has experienced shortages of drill pipe,replacement parts and other related rig equipment. These shortages can cause the price of these items to increasesignificantly and require that orders for the items be placed well in advance of expected use. These price increasesand delays in delivery may require us to increase capital and repair expenditures in our contract drilling segment.Severe shortages could impair our ability to operate our drilling rigs.
The Oil Service Business Segments in Which We Operate Are Highly Competitive with Excess Capacity,which Adversely Affect Our Operating Results.
Our land drilling and pressure pumping businesses are highly competitive. At times, available land drilling rigsand pressure pumping equipment exceed the demand for such equipment. This excess capacity has resulted insubstantial competition for drilling and pressure pumping contracts. The fact that drilling rigs and pressure pumpingequipment are mobile and can be moved from one market to another in response to market conditions heightens thecompetition in the industry.
We believe that price competition for drilling and pressure pumping contracts will continue for the foreseeablefuture due to the existence of available rigs and pressure pumping equipment.
In recent years, many drilling and pressure pumping companies have consolidated or merged with othercompanies. Although this consolidation has decreased the total number of competitors, we believe the competitionfor drilling and pressure pumping services will continue to be intense.
The drilling and completion fluids services industry is highly competitive. Price is generally the mostimportant factor. Other competitive factors include the availability of chemicals and experienced personnel, thereputation of the fluids services provider in the drilling industry and relationships with customers. Some of ourcompetitors have substantially more resources and longer operating histories than we have.
Labor Shortages Adversely Affect Our Operating Results.
During periods of increasing demand for contract drilling and pressure pumping services, the industryexperiences shortages of qualified personnel. During these periods, our ability to attract and retain sufficientqualified personnel to market and operate our drilling rigs and pressure pumping equipment is adversely affected,which negatively impacts both our operations and profitability. Operationally, it is more difficult to hire qualifiedpersonnel, which adversely affects our ability to mobilize inactive rigs and pressure pumping equipment in responseto the increased demand for such services. Additionally, wage rates for drilling and pressure pumping personnel arelikely to increase, resulting in higher operating costs.
Continued Growth Through Rig Acquisition is Not Assured.
We have increased our drilling rig fleet in the past through mergers and acquisitions. The land drilling industryhas experienced significant consolidation, and there can be no assurance that acquisition opportunities will beavailable in the future. Additionally, we are likely to continue to face intense competition from other companies foravailable acquisition opportunities.
10

There can be no assurance that we will:
• have sufficient capital resources to complete additional acquisitions,
• successfully integrate acquired operations and assets,
• effectively manage the growth and increased size,
• successfully deploy idle or stacked rigs,
• maintain the crews and market share to operate drilling rigs acquired, or
• successfully improve our financial condition, results of operations, business or prospects as a result of anycompleted acquisition.
We may incur substantial indebtedness to finance future acquisitions and also may issue equity securities orconvertible securities in connection with any such acquisitions. Debt service requirements could represent asignificant burden on our results of operations and financial condition and the issuance of additional equity wouldbe dilutive to existing stockholders. Also, continued growth could strain our management, operations, employeesand other resources.
The Nature of our Business Operations Presents Inherent Risks of Loss that, if not Insured or Indemni-fied Against, Could Adversely Affect Our Operating Results.
Our operations are subject to many hazards inherent in the contract drilling, pressure pumping, and drilling andcompletion fluids businesses, which in turn could cause personal injury or death, work stoppage, or serious damageto our equipment. Our operations could also cause environmental and reservoir damages. We maintain insurancecoverage and have indemnification agreements with many of our customers. However, there is no assurance thatsuch insurance or indemnification agreements would adequately protect us against liability or losses from allconsequences of these hazards. Additionally, there can be no assurance that insurance would be available to coverany or all of these risks, or, even if available, that insurance premiums or other costs would not rise significantly inthe future, so as to make the cost of such insurance prohibitive.
We have elected in some cases to accept a greater amount of risk through increased deductibles on certaininsurance policies. For example, we maintain a $1.0 million per occurrence deductible on our workers’ compen-sation, general liability and equipment insurance coverages.
Violations of Environmental Laws and Regulations Could Materially Adversely Affect Our OperatingResults.
The drilling of oil and natural gas wells is subject to various Federal, state, foreign, and local laws, rules andregulations. The cost of compliance with these laws and regulations could be substantial. A failure to comply withthese requirements could expose us to substantial civil and criminal penalties. In addition, Federal law imposes avariety of regulations on “responsible parties” related to the prevention of oil spills and liability for damages fromsuch spills. As an owner and operator of land-based drilling rigs, we may be deemed to be a responsible party underFederal law. Our operations and facilities are subject to numerous state and Federal environmental laws, rules andregulations, including, without limitation, laws concerning the containment and disposal of hazardous substances,oil field waste and other waste materials, the use of underground storage tanks and the use of underground injectionwells.
Some of Our Contract Drilling Services are Provided Under Turnkey and Footage Contracts, Which areFinancially Risky.
At times, a portion of our contract drilling is performed under turnkey and footage contracts, which involvesignificant risks. Under turnkey drilling contracts, we contract to drill a well to a certain depth under specifiedconditions at a fixed price. Under footage contracts, we contract to drill a well to a certain depth under specifiedconditions at a fixed price per foot. The risk to us under these types of drilling contracts are greater than on a welldrilled on a daywork basis. Unlike daywork contracts, we must bear the cost of services until the target depth is
11
reached. In addition, we must assume most of the risk associated with the drilling operations, generally assumed bythe operator of the well on a daywork contract, including blowouts, loss of hole from fire, machinery breakdownsand abnormal drilling conditions. Accordingly, if severe drilling problems are encountered in drilling wells undersuch contracts, we could suffer substantial losses.
Anti-takeover Measures in Our Charter Documents and Under State Law Could Discourage an Acquisi-tion and Thereby Affect the Related Purchase Price.
We are a Delaware corporation subject to the Delaware General Corporation Law, including Section 203, ananti-takeover law enacted in 1988. We have also enacted certain anti-takeover measures, including a stockholders’rights plan. In addition, our Board of Directors has the authority to issue up to one million shares of preferred stockand to determine the price, rights (including voting rights), conversion ratios, preferences and privileges of thatstock without further vote or action by the holders of the common stock. As a result of these measures and others,potential acquirers might find it more difficult or be discouraged from attempting to effect an acquisition transactionwith us. This may deprive holders of our securities of certain opportunities to sell or otherwise dispose of thesecurities at above-market prices pursuant to any such transactions.
Item 1B. Unresolved Staff Comments.
None.
Item 2. Properties
Our corporate headquarters are located in Snyder, Texas and include approximately 37,000 square feet ofoffice and storage space. These headquarters are located at 4510 Lamesa Highway, Snyder, Texas, and ourtelephone number at that address is (325) 574-6300. We also have administrative offices, yards and stockpointfacilities in many of the areas in which we operate. The facilities are primarily used to support day-to-dayoperations, including the repair and maintenance of equipment as well as the storage of equipment, inventory andsupplies and to facilitate administrative responsibilities and sales.
Contract Drilling Operations — Our drilling services are supported by several administrative offices and yardfacilities located throughout our areas of operations including Texas, New Mexico, Oklahoma, Colorado, Utah,Wyoming and western Canada.
Pressure Pumping — Our pressure pumping services are supported by several offices and yard facilitieslocated throughout our areas of operations including Pennsylvania, Ohio, New York, West Virginia, Kentucky,Tennessee, Wyoming and Colorado.
Drilling and Completion Fluids — Our drilling and completion fluids services are supported by severaladministrative offices and stockpoint facilities located throughout our areas of operations including Texas,Louisiana, New Mexico and Oklahoma.
We own our headquarters in Snyder, Texas, as well as several of our other facilities. We also lease a number offacilities and we do not believe that any one of the leased facilities is individually material to our operations. Webelieve that our existing facilities are suitable and adequate to meet our needs.
Item 3. Legal Proceedings.
We are party to various legal proceedings arising in the normal course of our business. We do not believe thatthe outcome of these proceedings, either individually or in the aggregate, will have a material adverse effect on ourresults of operations, cash flows or financial condition.
Item 4. Submission of Matters to a Vote of Security Holders.
None.
12

PART II
Item 5. Market for Registrant’s Common Equity, Related Stockholder Matters and Issuer Purchases ofEquity Securities.
(a) Market Information
Our common stock, par value $0.01 per share, is publicly traded on the Nasdaq National Market and is quotedunder the symbol “PTEN.” Our common stock is included in the S&P MidCap 400 Index and several other marketindexes. The following table provides high and low sales prices of our common stock for the periods indicated:
High Low
2007:First quarter . . . . . . . . . . . . . . . . . . . . . . . . . . . . . . . . . . . . . . . . . . . . . . . . . . . . $24.89 $21.13
Second quarter . . . . . . . . . . . . . . . . . . . . . . . . . . . . . . . . . . . . . . . . . . . . . . . . . . 27.66 22.17
Third quarter . . . . . . . . . . . . . . . . . . . . . . . . . . . . . . . . . . . . . . . . . . . . . . . . . . . 26.48 20.79
Fourth quarter . . . . . . . . . . . . . . . . . . . . . . . . . . . . . . . . . . . . . . . . . . . . . . . . . . . 23.22 18.44
2006:First quarter . . . . . . . . . . . . . . . . . . . . . . . . . . . . . . . . . . . . . . . . . . . . . . . . . . . . $38.49 $25.61
Second quarter . . . . . . . . . . . . . . . . . . . . . . . . . . . . . . . . . . . . . . . . . . . . . . . . . . 35.65 25.24
Third quarter . . . . . . . . . . . . . . . . . . . . . . . . . . . . . . . . . . . . . . . . . . . . . . . . . . . 29.11 21.84
Fourth quarter . . . . . . . . . . . . . . . . . . . . . . . . . . . . . . . . . . . . . . . . . . . . . . . . . . . 28.21 20.81
(b) Holders
As of February 15, 2008, there were approximately 2,100 holders of record of our common stock.
(c) Dividends and Buyback Program
We paid cash dividends during the years ended December 31, 2007 and 2006 as follows:
Per Share Total(In thousands)
2007:Paid on March 30, 2007 . . . . . . . . . . . . . . . . . . . . . . . . . . . . . . . . . . . . . . $0.08 $12,527
Paid on June 29, 2007 . . . . . . . . . . . . . . . . . . . . . . . . . . . . . . . . . . . . . . . 0.12 18,860
Paid on September 28, 2007 . . . . . . . . . . . . . . . . . . . . . . . . . . . . . . . . . . . 0.12 18,690
Paid on December 28, 2007 . . . . . . . . . . . . . . . . . . . . . . . . . . . . . . . . . . . 0.12 18,484
Total cash dividends declared and paid . . . . . . . . . . . . . . . . . . . . . . . . . . . $0.44 $68,561
2006:Paid on March 30, 2006 . . . . . . . . . . . . . . . . . . . . . . . . . . . . . . . . . . . . . . $0.04 $ 6,906
Paid on June 30, 2006 . . . . . . . . . . . . . . . . . . . . . . . . . . . . . . . . . . . . . . . 0.08 13,413
Paid on September 29, 2006 . . . . . . . . . . . . . . . . . . . . . . . . . . . . . . . . . . . 0.08 13,024
Paid on December 29, 2006 . . . . . . . . . . . . . . . . . . . . . . . . . . . . . . . . . . . 0.08 12,482
Total cash dividends declared and paid . . . . . . . . . . . . . . . . . . . . . . . . . . . $0.28 $45,825
13

On February 13, 2008, our Board of Directors approved a cash dividend on our common stock in the amount of$0.12 per share to be paid on March 28, 2008 to holders of record as of March 12, 2008. The amount and timing ofall future dividend payments, if any, is subject to the discretion of the Board of Directors and will depend uponbusiness conditions, results of operations, financial condition, terms of our credit facilities and other factors.
The table below sets forth the information with respect to purchases of our common stock made by us duringthe quarter ended December 31, 2007.
Period covered
Total numberof sharespurchased
Average pricepaid per
share
Total numberof shares(or units)
purchased aspart of
publicly announcedplans or
programs(1)
Approximatedollar value
of sharesthat may yetbe purchased
under theplans or
programs(In thousands)(1)
October 1–31, 2007 . . . . . . . . . . . . . . . . . . — $ — — $199,726
November 1–30, 2007(2) . . . . . . . . . . . . . . 254,126 $18.87 250,000 $195,009
December 1–31, 2007 . . . . . . . . . . . . . . . . 783,850 $19.60 783,850 $179,646
Total . . . . . . . . . . . . . . . . . . . . . . . . . . . . . 1,037,976 $19.42 1,033,850 $179,646
(1) On August 1, 2007, our Board of Directors approved a stock buyback program authorizing purchases of up to$250 million of our common stock in open market or privately negotiated transactions.
(2) On November 30, 2007, we purchased 4,126 shares from employees to provide the respective employees withthe funds necessary to satisfy their tax withholding obligations with respect to the vesting of restricted shares onthat date. The price paid was $18.85 per share, which was the closing price of our common stock onNovember 30, 2007.
(d) Securities Authorized for Issuance Under Equity Compensation Plans
Equity compensation to our employees, officers and directors as of December 31, 2007 follows:
Plan Category
Number ofSecurities to
be Issuedupon Exerciseof Outstanding
Options, Warrantsand Rights
Weighted-AverageExercise Priceof Outstanding
Options, Warrantsand Rights
Number ofSecurities Remaining
Available forFuture Issuance
under EquityCompensation Plans(Excluding Securities
Reflected inColumn(a))
Equity Compensation Plan Information
(a) (b) (c)
Equity compensation plans approved bysecurity holders(1) . . . . . . . . . . . . . . . . 6,733,337 $18.27 2,283,045
Equity compensation plans not approvedby security holders(2) . . . . . . . . . . . . . 669,747 $ 9.91 —
Total . . . . . . . . . . . . . . . . . . . . . . . . . . 7,403,084 $17.52 2,283,045
(1) The Patterson-UTI Energy, Inc. 2005 Long-Term Incentive Plan (the “2005 Plan”) provides for awards ofincentive stock options, non-incentive stock options, tandem and freestanding stock appreciation rights,restricted stock awards, other stock unit awards, performance share awards, performance unit awards anddividend equivalents to key employees, officers and directors, which are subject to certain vesting and forfeitureprovisions. All options are granted with an exercise price equal to or greater than the fair market value of thecommon stock at the time of grant. The vesting schedule and term are set by the Compensation Committee of
14

the Board of Directors. All securities remaining available for future issuance under equity compensation plansapproved by security holders in column (c) are available under this plan.
(2) The Amended and Restated Patterson-UTI Energy, Inc. 2001 Long-Term Incentive Plan (the “2001 Plan”) wasapproved by the Board of Directors in July 2001. In connection with the approval of the 2005 Plan, the Board ofDirectors approved a resolution that no further options, restricted stock or other awards would be granted underany equity compensation plan, other than the 2005 Plan. The terms of the 2001 Plan provided for grants of stockoptions, stock appreciation rights, shares of restricted stock and performance awards to eligible employeesother than officers and directors. No Incentive Stock Options could be awarded under the Plan. All options weregranted with an exercise price equal to or greater than the fair market value of the common stock at the time ofgrant. The vesting schedule and term were set by the Compensation Committee of the Board of Directors.
15

(e) Performance Graph
The following graph compares the cumulative stockholder return of our common stock for the period fromDecember 31, 2002 through December 31, 2007, with the cumulative total return of the Standard & Poors 500 StockIndex, the Standard & Poors MidCap Index, the Oilfield Service Index and a peer group determined by us. Our peergroup consists of Grey Wolf, Inc., Helmerich & Payne, Inc., Nabors Industries, Ltd., Pioneer Drilling Co. and UnitCorp. All of the companies in our peer group are providers of land-based drilling services. The graph assumesinvestment of $100 on December 31, 2002 and reinvestment of all dividends.
Comparison of Cumulative Total Returns(in dollars)
Patterson-UTI Energy, Inc.
Peer Group Index
S&P 500 Stock Index
Oilfield Service Index (OSX)
S&P MidCap Index
350
$400
250
300
200
100
150
50
0
02 03 04 05 0706
Company/Index2002($)
2003($)
2004($)
2005($)
2006($)
2007($)
Fiscal Year Ended December 31,
Patterson-UTI Energy, Inc. . . . . . . . . . . . . . . . . . 100.00 109.15 129.56 220.73 157.34 134.84
Peer Group Index . . . . . . . . . . . . . . . . . . . . . . . . 100.00 113.82 147.78 225.64 182.13 189.00
S&P 500 Stock Index . . . . . . . . . . . . . . . . . . . . . 100.00 128.68 142.69 149.70 173.34 182.87
Oilfield Service Index (OSX). . . . . . . . . . . . . . . . 100.00 116.47 157.50 236.16 269.34 393.90
S&P MidCap Index . . . . . . . . . . . . . . . . . . . . . . . 100.00 135.62 157.97 177.81 196.15 211.80
The foregoing graph is based on historical data and is not necessarily indicative of future performance. Thisgraph shall not be deemed to be “soliciting material” or to be “filed” with the SEC or subject to the Regulations of14A or 14C under the Exchange Act or to the liabilities of Section 18 under such act.
16

Item 6. Selected Financial Data.
Our selected consolidated financial data as of December 31, 2007, 2006, 2005, 2004 and 2003, and for each ofthe five years in the period ended December 31, 2007 should be read in conjunction with “Management’sDiscussion and Analysis of Financial Condition and Results of Operations” and the Consolidated FinancialStatements and related Notes thereto, included as Items 7 and 8, respectively, of this Report. Certain reclassi-fications have been made to the historical financial data to conform with the 2007 presentation.
2007 2006 2005 2004 2003Years Ended December 31,
(In thousands, except per share amounts)
Income Statement Data:Operating revenues:
Contract drilling . . . . . . . . . . . . . . . $1,741,647 $2,169,370 $1,485,684 $ 809,691 $ 639,694Pressure pumping . . . . . . . . . . . . . . 202,812 145,671 93,144 66,654 46,083Drilling and completion fluids . . . . . 128,098 192,358 122,011 90,557 69,230Oil and natural gas . . . . . . . . . . . . . 41,637 39,187 39,616 33,867 21,163
Total . . . . . . . . . . . . . . . . . . . . . . 2,114,194 2,546,586 1,740,455 1,000,769 776,170
Operating costs and expenses:Contract drilling . . . . . . . . . . . . . . . 963,150 1,002,001 776,313 556,869 475,224Pressure pumping . . . . . . . . . . . . . . 105,273 77,755 54,956 37,561 26,184Drilling and completion fluids . . . . . 108,752 150,372 98,530 76,503 61,424Oil and natural gas . . . . . . . . . . . . . 10,864 13,374 9,566 7,978 4,808Depreciation, depletion,
amortization and impairment . . . . 249,206 196,370 156,393 122,800 100,834Selling, general and administrative . . 64,623 55,065 39,110 31,983 27,685Embezzlement costs (recoveries) . . . (43,955) 3,081 20,043 19,122 17,849(Gain) loss on disposal of assets . . . (16,545) 3,819 (1,231) (1,411) (1,927)Other operating expenses
(income) . . . . . . . . . . . . . . . . . . . 2,550 5,585 5,479 897 (2,193)
Total . . . . . . . . . . . . . . . . . . . . . . 1,443,918 1,507,422 1,159,159 852,302 709,888
Operating income . . . . . . . . . . . . . . . . 670,276 1,039,164 581,296 148,467 66,282Other income . . . . . . . . . . . . . . . . . . . 531 4,670 3,463 680 2,694
Income before income taxes andcumulative effect of change inaccounting principle . . . . . . . . . . . . 670,807 1,043,834 584,759 149,147 68,976
Income tax expense. . . . . . . . . . . . . . . 232,168 371,267 212,019 54,801 25,320
Income before cumulative effect ofchange in accounting principle . . . . . 438,639 672,567 372,740 94,346 43,656
Cumulative effect of change inaccounting principle, net of relatedincome tax expense of $398 in 2006and benefit of $287 in 2003. . . . . . . — 687 — — (469)
Net income . . . . . . . . . . . . . . . . . . . . . $ 438,639 $ 673,254 $ 372,740 $ 94,346 $ 43,187
Income before cumulative effect ofchange in accounting principle percommon share:Basic . . . . . . . . . . . . . . . . . . . . . . . $ 2.83 $ 4.07 $ 2.19 $ 0.57 $ 0.27
Diluted . . . . . . . . . . . . . . . . . . . . . . $ 2.79 $ 4.02 $ 2.15 $ 0.56 $ 0.27
17

2007 2006 2005 2004 2003Years Ended December 31,
(In thousands, except per share amounts)
Net income per common share:Basic . . . . . . . . . . . . . . . . . . . . . . . $ 2.83 $ 4.08 $ 2.19 $ 0.57 $ 0.27
Diluted . . . . . . . . . . . . . . . . . . . . . . $ 2.79 $ 4.02 $ 2.15 $ 0.56 $ 0.26
Cash dividends per common share . . . . $ 0.44 $ 0.28 $ 0.16 $ 0.06 $ —
Weighted average number ofcommon shares outstanding:
Basic . . . . . . . . . . . . . . . . . . . . . . . 154,755 165,159 170,426 166,258 161,272
Diluted . . . . . . . . . . . . . . . . . . . . . . 156,997 167,413 173,767 169,211 164,572
Balance Sheet Data:Total assets . . . . . . . . . . . . . . . . . . . . . $2,465,199 $2,192,503 $1,795,781 $1,256,785 $1,039,521Borrowings under line of credit . . . . . . 50,000 120,000 — — —Stockholders’ equity . . . . . . . . . . . . . . 1,896,030 1,562,466 1,367,011 961,501 789,814Working capital . . . . . . . . . . . . . . . . . 227,577 335,052 382,448 235,480 198,399
18

Item 7. Management’s Discussion and Analysis of Financial Condition and Results of Operations
This Item 7 contains forward-looking statements, which are made pursuant to the “Safe Harbor” provisions ofthe Private Securities Litigation Reform Act of 1995.
Management Overview — We are a leading provider of contract services to the North American oil and naturalgas industry. Our services primarily involve the drilling, on a contract basis, of land-based oil and natural gas wellsand, to a lesser extent, we provide pressure pumping services and drilling and completion fluid services. In additionto the aforementioned contract services, we have also engaged in the development, exploration, acquisition andproduction of oil and natural gas. For the three years ended December 31, 2007, our operating revenues consisted ofthe following (dollars in thousands):
2007 2006 2005
Contract drilling . . . . . . . . . . . . . . . $1,741,647 82% $2,169,370 84% $1,485,684 86%
Pressure pumping . . . . . . . . . . . . . . 202,812 10 145,671 6 93,144 5
Drilling and completion fluids . . . . . 128,098 6 192,358 8 122,011 7
Oil and natural gas . . . . . . . . . . . . . 41,637 2 39,187 2 39,616 2
$2,114,194 100% $2,546,586 100% $1,740,455 100%
We provide our contract services to oil and natural gas operators in many of the oil and natural gas producingregions of North America. Our contract drilling operations are focused in various regions of Texas, New Mexico,Oklahoma, Arkansas, Louisiana, Mississippi, Colorado, Utah, Wyoming, Montana, North Dakota, South Dakota,Pennsylvania and Western Canada, while our pressure pumping services are focused primarily in the AppalachianBasin. Our drilling and completion fluids services are provided to operators offshore in the Gulf of Mexico and onland in Texas, Southeastern New Mexico, Oklahoma and the Gulf Coast region of Louisiana. The oil and natural gasproperties in which we hold working interests are primarily located in West and South Texas, SoutheasternNew Mexico, Utah and Mississippi.
Typically, the profitability of our business is most readily assessed by two primary indicators in our contractdrilling segment: our average number of rigs operating and our average revenue per operating day. During 2007, ouraverage number of rigs operating was 244 compared to 296 in 2006 and 276 in 2005. Our average revenue peroperating day was $19,550 in 2007 compared to $20,050 in 2006 and $14,770 in 2005. Our consolidated net incomefor 2007 decreased by $235 million, or 35%, as compared to 2006. This decrease was primarily due to our contractdrilling segment experiencing a decrease in the average number of rigs operating, a decrease in the average revenueper operating day and an increase in the average costs per operating day in 2007 as compared to 2006.
Our revenues, profitability and cash flows are highly dependent upon the market prices of oil and natural gas.During periods of improved commodity prices, the capital spending budgets of oil and natural gas operators tend toexpand, which results in increased demand for our contract services. Conversely, in periods when these commodityprices deteriorate, the demand for our contract services generally weakens and we experience downward pressureon pricing for our services. In addition, our operations are highly impacted by competition, the availability of excessequipment, labor issues and various other factors which are more fully described as “Risk Factors” in Item 1A ofthis Annual Report.
We believe that the liquidity shown on our balance sheet as of December 31, 2007, which includesapproximately $228 million in working capital (including $17.4 million in cash) and $266 million availableunder a $375 million line of credit, provides us with the ability to pursue acquisition opportunities, expand into newregions, make improvements to our assets, pay cash dividends and survive downturns in our industry.
Commitments and Contingencies — We maintain letters of credit in the aggregate amount of $59.4 million forthe benefit of various insurance companies as collateral for retrospective premiums and retained losses which couldbecome payable under the terms of the underlying insurance contracts. These letters of credit expire at various timesduring each calendar year. No amounts have been drawn under the letters of credit.
As of December 31, 2007, we had non-cancelable commitments to purchase approximately $83.0 million ofequipment.
19

A receiver was appointed to take control of and liquidate the assets of our former CFO in connection with hisembezzlement of Company funds. In May 2007, the court approved a plan of distribution for the assets recovered bythe receiver. We expect to recover a total of approximately $44.5 million pursuant to the approved plan, and we haverecognized this recovery in our consolidated statement of income in 2007, net of professional fees incurred as aresult of the embezzlement. As of December 31, 2007, we had received cash payments from the receiver ofapproximately $41.2 million, with the remaining $3.3 million of the recovery consisting of notes receivable,investments and other assets that are being transferred to us.
Trading and investing — We have not engaged in trading activities that include high-risk securities, such asderivatives and non-exchange traded contracts. We invest cash primarily in highly liquid, short-term investmentssuch as overnight deposits, money markets and highly rated municipal and commercial bonds.
Description of business — We conduct our contract drilling operations in Texas, New Mexico, Oklahoma,Arkansas, Louisiana, Mississippi, Colorado, Utah, Wyoming, Montana, North Dakota, South Dakota, Pennsylvaniaand western Canada. For the years ended December 31, 2007, 2006 and 2005, revenue earned outside of theUnited States was $72.9 million, $98.5 million and $84.4 million, respectively. Additionally, we had long-livedassets located outside of the United States of $91.6 million, $78.9 million and $60.7 million as of December 31,2007, 2006 and 2005, respectively. As of December 31, 2007, we had 350 currently marketable land-based drillingrigs. We provide pressure pumping services to oil and natural gas operators primarily in the Appalachian Basin.These services consist primarily of well stimulation and cementing for completion of new wells and remedial workon existing wells. We provide drilling fluids, completion fluids and related services to oil and natural gas operatorsoffshore in the Gulf of Mexico and on land in Texas, Southeastern New Mexico, Oklahoma and the Gulf Coastregion of Louisiana. Drilling and completion fluids are used by oil and natural gas operators during the drillingprocess to control pressure when drilling oil and natural gas wells. We also invest on a working interest basis inproduction of oil and natural gas.
Critical Accounting Policies
In addition to established accounting policies, our consolidated financial statements are impacted by certainestimates and assumptions made by management. The following is a discussion of our critical accounting policiespertaining to property and equipment, oil and natural gas properties, goodwill, revenue recognition and the use ofestimates.
Property and equipment — Property and equipment, including betterments which extend the useful life of theasset, are stated at cost. Maintenance and repairs are charged to expense when incurred. We provide for thedepreciation of our property and equipment using the straight-line method over the estimated useful lives. Ourmethod of depreciation does not change when equipment becomes idle; we continue to depreciate idled equipmenton a straight-line basis. No provision for salvage value is considered in determining depreciation of our property andequipment. We review our assets for impairment when events or changes in circumstances indicate that the carryingvalues of certain assets either exceed their respective fair values or may not be recovered over their estimatedremaining useful lives. The cyclical nature of our industry has resulted in fluctuations in rig utilization over periodsof time. Management believes that the contract drilling industry will continue to be cyclical and rig utilization willfluctuate. Based on management’s expectations of future trends, we estimate future cash flows over the life of therespective assets in our assessment of impairment. These estimates of cash flows are based on historical cyclicaltrends in the industry as well as management’s expectations regarding the continuation of these trends in the future.Provisions for asset impairment are charged to income when estimated future cash flows, on an undiscounted basis,are less than the asset’s net book value. Impairment charges are recorded based on discounted cash flows. Therewere no material impairment charges related to property and equipment during the years 2007, 2006 or 2005.
Oil and natural gas properties — Working interests in oil and natural gas properties are accounted for usingthe successful efforts method of accounting. Under the successful efforts method of accounting, exploration costswhich result in the discovery of oil and natural gas reserves and all development costs are capitalized to theappropriate well. Exploration costs which do not result in discovering oil and natural gas reserves are charged toexpense when such determination is made. In accordance with Statement of Financial Accounting Standards No. 19,“Financial Accounting and Reporting by Oil and Gas Producing Companies,” (“SFAS No. 19”) costs of exploratory
20

wells are initially capitalized to wells in progress until the outcome of the drilling is known. We review wells inprogress quarterly to determine whether sufficient progress is being made in assessing the reserves and theeconomic operating viability of the respective projects. If no progress has been made in assessing the reserves andthe economic operating viability of a project after one year following the completion of drilling, we consider thecosts of the well to be impaired and recognize the costs as expense. Geological and geophysical costs, includingseismic costs and costs to carry and retain undeveloped properties, are charged to expense when incurred. Thecapitalized costs of both developmental and successful exploratory type wells, consisting of lease and wellequipment, lease acquisition costs and intangible development costs, are depreciated, depleted and amortized on theunits-of-production method, based on engineering estimates of proved oil and natural gas reserves of eachrespective field. We review our proved oil and natural gas properties for impairment when an event occurs suchas downward revisions in reserve estimates or decreases in oil and natural gas prices. Proved properties are groupedby field and undiscounted cash flow estimates are prepared internally and reviewed by an independent petroleumengineer. If the net book value of a field exceeds its undiscounted cash flow estimate, impairment expense ismeasured and recognized as the difference between its net book value and discounted cash flow. Unproved oil andnatural gas properties are reviewed quarterly to determine impairment. The intent to drill, lease expiration andabandonment of area are considered. Assessment of impairment is made on a lease-by-lease basis. If an unprovedproperty is determined to be impaired, then costs related to that property are expensed. Impairment expense ofapproximately $3.9 million, $5.0 million and $4.4 million for the years ended December 31, 2007, 2006 and 2005,respectively, is included in depreciation, depletion and impairment in the accompanying financial statements.
Goodwill — Goodwill is considered to have an indefinite useful economic life and is not amortized. As such,we assess impairment of our goodwill annually as of December 31 or on an interim basis if events or circumstancesindicate that the fair value of the asset has decreased below its carrying value.
Revenue recognition — Revenues are recognized when services are performed, except for revenues earnedunder turnkey contract drilling arrangements which are recognized using the completed contract method ofaccounting, as described below. We follow the percentage-of-completion method of accounting for footage contractdrilling arrangements. Under the percentage-of-completion method, management estimates are relied upon in thedetermination of the total estimated expenses to be incurred drilling the well. Due to the nature of turnkey contractdrilling arrangements and risks therein, we follow the completed contract method of accounting for sucharrangements. Under this method, revenues and expenses related to a well in progress are deferred and recognizedin the period the well is completed. Provisions for losses on incomplete or in-process wells are made when estimatedtotal expenses are expected to exceed estimated total revenues. We recognize reimbursements received from thirdparties for out-of-pocket expenses incurred as revenues and account for out-of-pocket expenses as direct costs.
Use of estimates — The preparation of financial statements in conformity with accounting principles generallyaccepted in the United States of America requires management to make certain estimates and assumptions thataffect the reported amounts of assets and liabilities and disclosures of contingent assets and liabilities at the date ofthe financial statements and the reported amounts of revenues and expenses during the reporting period. Actualresults could differ from such estimates.
Key estimates used by management include:
• allowance for doubtful accounts,
• depreciation and depletion,
• asset impairment,
• reserves for self-insured levels of insurance coverages, and
• fair values of assets and liabilities assumed in acquisitions.
For additional information on our accounting policies, see Note 1 of Notes to Consolidated FinancialStatements included as a part of Item 8 of this Report.
21

Liquidity and Capital Resources
As of December 31, 2007, we had working capital of $228 million including cash and cash equivalents of$17.4 million. For 2007, our sources of cash flow included:
• $812 million from operating activities,
• $34.2 million in proceeds from the disposal of property and equipment, and
• $3.2 million from the exercise of stock options and related tax benefits associated with stock-basedcompensation.
During 2007, we used $70.9 million to repurchase shares of our common stock, $68.6 million to pay dividendson our common stock, $70.0 million to repay borrowings under our line of credit, $29.0 million to acquire threeelectric land-based drilling rigs and $608 million:
• to make capital expenditures for the betterment and refurbishment of our drilling rigs,
• to acquire and procure drilling equipment and facilities to support our drilling operations,
• to fund capital expenditures for our pressure pumping and drilling and completion fluids divisions, and
• to fund leasehold acquisition and exploration and development of oil and natural gas properties.
As of December 31, 2007, we had $50.0 million in borrowings outstanding under our $375 million revolvingline of credit and $59.4 million in outstanding letters of credit such that we had available borrowing capacity ofapproximately $266 million at December 31, 2007.
We paid cash dividends during the year ended December 31, 2007 as follows:
Per Share Total(In thousands)
Paid on March 30, 2007 . . . . . . . . . . . . . . . . . . . . . . . . . . . . . . . . . . . . . . $0.08 $12,527
Paid on June 29, 2007 . . . . . . . . . . . . . . . . . . . . . . . . . . . . . . . . . . . . . . . 0.12 18,860
Paid on September 28, 2007 . . . . . . . . . . . . . . . . . . . . . . . . . . . . . . . . . . . 0.12 18,690
Paid on December 28, 2007 . . . . . . . . . . . . . . . . . . . . . . . . . . . . . . . . . . . 0.12 18,484
Total cash dividends declared and paid . . . . . . . . . . . . . . . . . . . . . . . . . . . $0.44 $68,561
On February 13, 2008, our Board of Directors approved a cash dividend on our common stock in the amount of$0.12 per share to be paid on March 28, 2008 to holders of record as of March 12, 2008. The amount and timing ofall future dividend payments, if any, is subject to the discretion of the Board of Directors and will depend uponbusiness conditions, results of operations, financial condition, terms of our credit facilities and other factors.
On August 1, 2007, our Board of Directors approved a stock buyback program (“2007 Program”), authorizingpurchases of up to $250 million of our common stock in open market or privately negotiated transactions. Duringthe year ended December 31, 2007, we purchased 3,308,850 shares of our common stock under the 2007 Program ata cost of approximately $70.4 million. As of December 31, 2007, we are authorized to purchase approximately$180 million of our outstanding common stock under the 2007 Program.
We believe that the current level of cash and short-term investments, together with cash generated fromoperations, should be sufficient to meet our capital needs. From time to time, acquisition opportunities areevaluated. The timing, size or success of any acquisition and the associated capital commitments are unpredictable.Should opportunities for growth requiring capital arise, we believe we would be able to satisfy these needs through acombination of working capital, cash generated from operations, our existing credit facility and additional debt orequity financing. However, there can be no assurance that such capital would be available.
22

Contractual Obligations
The following table presents information with respect to our contractual obligations as of December 31, 2007(dollars in thousands):
TotalLess Than 1
Year 1-3 Years 3-5 YearsMore Than 5
Years
Payments Due by Period
Borrowings under line of credit(1) . . $ 50,000 $ — $50,000 $ — $ —
Commitments to purchaseequipment(2) . . . . . . . . . . . . . . . . 82,998 82,998 — — —
$132,998 $82,998 $50,000 $ — $ —
(1) Our line of credit is a revolving line of credit that matures on December 16, 2009. So long as we are incompliance with our obligations under the credit agreement, no principal repayments are required untilmaturity.
(2) Represents non-cancelable commitments to purchase equipment to be delivered throughout 2008.
Off-Balance Sheet Arrangements
We had no off-balance sheet arrangements at December 31, 2007.
Results of Operations
Comparison of the years ended December 31, 2007 and 2006
The following tables summarize operations by business segment for the years ended December 31, 2007 and2006:
Contract Drilling 2007 2006 % ChangeYear Ended December 31,
(Dollars in thousands)
Revenues . . . . . . . . . . . . . . . . . . . . . . . . . . . . . . . . . . . . . . $1,741,647 $2,169,370 (19.7)%
Direct operating costs . . . . . . . . . . . . . . . . . . . . . . . . . . . . . $ 963,150 $1,002,001 (3.9)%
Selling, general and administrative . . . . . . . . . . . . . . . . . . . $ 5,893 $ 7,313 (19.4)%
Depreciation . . . . . . . . . . . . . . . . . . . . . . . . . . . . . . . . . . . . $ 213,812 $ 168,607 26.8%
Operating income . . . . . . . . . . . . . . . . . . . . . . . . . . . . . . . . $ 558,792 $ 991,449 (43.6)%
Operating days . . . . . . . . . . . . . . . . . . . . . . . . . . . . . . . . . . 89,095 108,192 (17.7)%
Average revenue per operating day . . . . . . . . . . . . . . . . . . . $ 19.55 $ 20.05 (2.5)%
Average direct operating costs per operating day . . . . . . . . . $ 10.81 $ 9.26 16.7%Average rigs operating . . . . . . . . . . . . . . . . . . . . . . . . . . . . 244 296 (17.6)%
Capital expenditures . . . . . . . . . . . . . . . . . . . . . . . . . . . . . . $ 539,506 $ 531,087 1.6%
The demand for our contract drilling services is impacted by the market price of oil and, to a larger extent,natural gas. However, the reactivation and construction of new land drilling rigs in the United States has resulted inexcess capacity compared to recent demand. Additionally, drilling activity in Canada has decreased significantly.As a result, our average rigs operating declined to 244 in 2007 from 296 in 2006. The average market price of naturalgas for each of the fiscal quarters and full years in 2007 and 2006 follow:
1st Quarter 2nd Quarter 3rd Quarter 4th Quarter Year
2007:Average natural gas price(1) . . . . . . . $7.44 $7.76 $6.35 $7.19 $7.18
2006:Average natural gas price(1) . . . . . . . $7.93 $6.74 $6.26 $6.87 $6.94
23
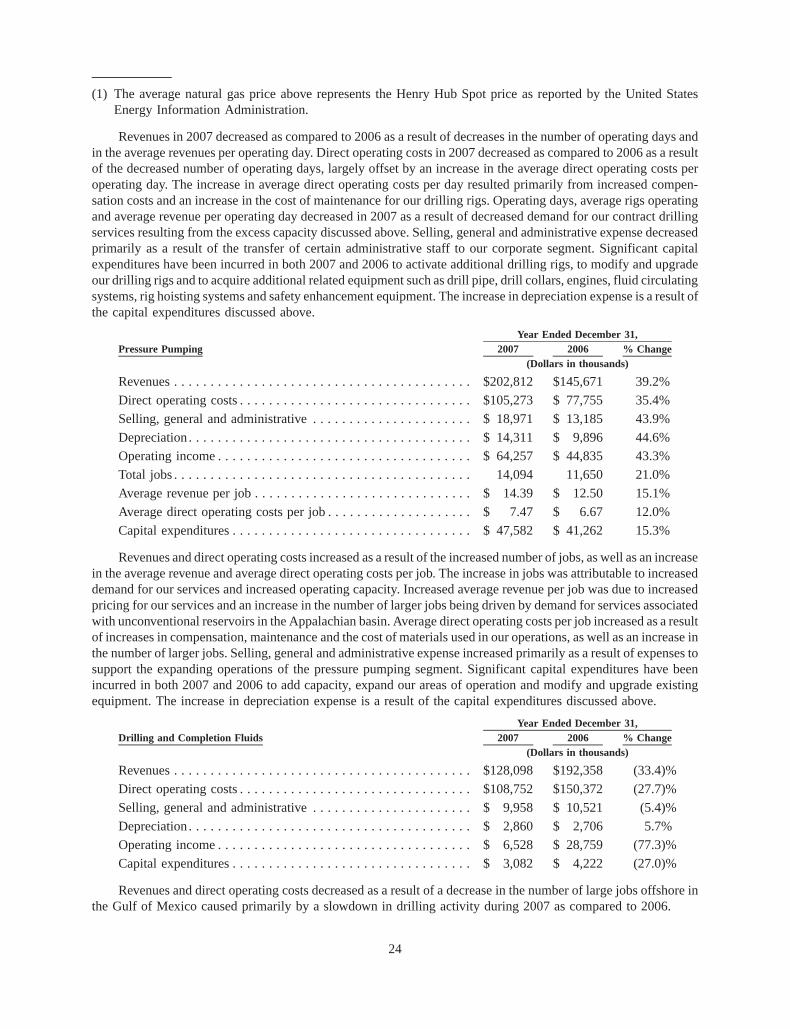
(1) The average natural gas price above represents the Henry Hub Spot price as reported by the United StatesEnergy Information Administration.
Revenues in 2007 decreased as compared to 2006 as a result of decreases in the number of operating days andin the average revenues per operating day. Direct operating costs in 2007 decreased as compared to 2006 as a resultof the decreased number of operating days, largely offset by an increase in the average direct operating costs peroperating day. The increase in average direct operating costs per day resulted primarily from increased compen-sation costs and an increase in the cost of maintenance for our drilling rigs. Operating days, average rigs operatingand average revenue per operating day decreased in 2007 as a result of decreased demand for our contract drillingservices resulting from the excess capacity discussed above. Selling, general and administrative expense decreasedprimarily as a result of the transfer of certain administrative staff to our corporate segment. Significant capitalexpenditures have been incurred in both 2007 and 2006 to activate additional drilling rigs, to modify and upgradeour drilling rigs and to acquire additional related equipment such as drill pipe, drill collars, engines, fluid circulatingsystems, rig hoisting systems and safety enhancement equipment. The increase in depreciation expense is a result ofthe capital expenditures discussed above.
Pressure Pumping 2007 2006 % ChangeYear Ended December 31,
(Dollars in thousands)
Revenues . . . . . . . . . . . . . . . . . . . . . . . . . . . . . . . . . . . . . . . . . $202,812 $145,671 39.2%
Direct operating costs . . . . . . . . . . . . . . . . . . . . . . . . . . . . . . . . $105,273 $ 77,755 35.4%
Selling, general and administrative . . . . . . . . . . . . . . . . . . . . . . $ 18,971 $ 13,185 43.9%
Depreciation . . . . . . . . . . . . . . . . . . . . . . . . . . . . . . . . . . . . . . . $ 14,311 $ 9,896 44.6%Operating income . . . . . . . . . . . . . . . . . . . . . . . . . . . . . . . . . . . $ 64,257 $ 44,835 43.3%
Total jobs . . . . . . . . . . . . . . . . . . . . . . . . . . . . . . . . . . . . . . . . . 14,094 11,650 21.0%
Average revenue per job . . . . . . . . . . . . . . . . . . . . . . . . . . . . . . $ 14.39 $ 12.50 15.1%
Average direct operating costs per job . . . . . . . . . . . . . . . . . . . . $ 7.47 $ 6.67 12.0%
Capital expenditures . . . . . . . . . . . . . . . . . . . . . . . . . . . . . . . . . $ 47,582 $ 41,262 15.3%
Revenues and direct operating costs increased as a result of the increased number of jobs, as well as an increasein the average revenue and average direct operating costs per job. The increase in jobs was attributable to increaseddemand for our services and increased operating capacity. Increased average revenue per job was due to increasedpricing for our services and an increase in the number of larger jobs being driven by demand for services associatedwith unconventional reservoirs in the Appalachian basin. Average direct operating costs per job increased as a resultof increases in compensation, maintenance and the cost of materials used in our operations, as well as an increase inthe number of larger jobs. Selling, general and administrative expense increased primarily as a result of expenses tosupport the expanding operations of the pressure pumping segment. Significant capital expenditures have beenincurred in both 2007 and 2006 to add capacity, expand our areas of operation and modify and upgrade existingequipment. The increase in depreciation expense is a result of the capital expenditures discussed above.
Drilling and Completion Fluids 2007 2006 % ChangeYear Ended December 31,
(Dollars in thousands)
Revenues . . . . . . . . . . . . . . . . . . . . . . . . . . . . . . . . . . . . . . . . . $128,098 $192,358 (33.4)%
Direct operating costs . . . . . . . . . . . . . . . . . . . . . . . . . . . . . . . . $108,752 $150,372 (27.7)%
Selling, general and administrative . . . . . . . . . . . . . . . . . . . . . . $ 9,958 $ 10,521 (5.4)%
Depreciation . . . . . . . . . . . . . . . . . . . . . . . . . . . . . . . . . . . . . . . $ 2,860 $ 2,706 5.7%
Operating income . . . . . . . . . . . . . . . . . . . . . . . . . . . . . . . . . . . $ 6,528 $ 28,759 (77.3)%
Capital expenditures . . . . . . . . . . . . . . . . . . . . . . . . . . . . . . . . . $ 3,082 $ 4,222 (27.0)%
Revenues and direct operating costs decreased as a result of a decrease in the number of large jobs offshore inthe Gulf of Mexico caused primarily by a slowdown in drilling activity during 2007 as compared to 2006.
24

Oil and Natural Gas Production and Exploration 2007 2006 % ChangeYear Ended December 31,
(Dollars in thousands, exceptcommodity prices)
Revenues . . . . . . . . . . . . . . . . . . . . . . . . . . . . . . . . . . . . . . . . . . . $41,637 $39,187 6.3%
Direct operating costs. . . . . . . . . . . . . . . . . . . . . . . . . . . . . . . . . . $10,864 $13,374 (18.8)%
Selling, general and administrative . . . . . . . . . . . . . . . . . . . . . . . . $ 2,365 $ 2,785 (15.1)%
Depreciation, depletion and impairment . . . . . . . . . . . . . . . . . . . . $17,410 $14,368 21.2%
Operating income. . . . . . . . . . . . . . . . . . . . . . . . . . . . . . . . . . . . . $10,998 $ 8,660 27.0%
Capital expenditures . . . . . . . . . . . . . . . . . . . . . . . . . . . . . . . . . . . $17,516 $21,198 (17.4)%
Average net daily oil production (Bbls) . . . . . . . . . . . . . . . . . . . . . 971 983 (1.2)%
Average net daily gas production (Mcf) . . . . . . . . . . . . . . . . . . . . 4,996 5,143 (2.9)%
Average oil sales price (per Bbl) . . . . . . . . . . . . . . . . . . . . . . . . . . $ 68.82 $ 63.83 7.8%
Average gas sales price (per Mcf) . . . . . . . . . . . . . . . . . . . . . . . . . $ 7.37 $ 6.82 8.1%
Revenues increased due to an increase in the average sales price of both oil and natural gas in 2007 compared to2006. Average net daily oil and natural gas production decreased in 2007 primarily due to the sale of certainproperties in the first half of 2007. The decrease in direct operating costs is primarily due to a decrease ofapproximately $3.0 million in costs associated with the abandonment of exploratory wells in 2007 compared to2006. Selling, general and administrative expenses decreased in 2007 primarily due to the transfer in the fourthquarter of the operating responsibilities associated with oil and natural gas wells resulting in reduced headcount inour oil and natural gas production and exploration segment. Depreciation, depletion and impairment expense in2007 includes approximately $3.9 million incurred to impair certain oil and natural gas properties compared toapproximately $5.0 million incurred to impair certain oil and natural gas properties in 2006. Depletion expenseincreased approximately $4.7 million primarily due to the completion of new wells in 2007.
Corporate and Other 2007 2006 % ChangeYear Ended December 31,
(Dollars in thousands)
Selling, general and administrative . . . . . . . . . . . . . . . . . . . . . . . $ 27,436 $21,261 29.0%
Depreciation . . . . . . . . . . . . . . . . . . . . . . . . . . . . . . . . . . . . . . . . $ 813 $ 793 2.5%Other operating expenses . . . . . . . . . . . . . . . . . . . . . . . . . . . . . . $ 2,550 $ 5,585 (54.3)%
Embezzlement costs (recoveries) . . . . . . . . . . . . . . . . . . . . . . . . . $(43,955) $ 3,081 N/A%
(Gain) loss on disposal of assets . . . . . . . . . . . . . . . . . . . . . . . . . $(16,545) $ 3,819 N/A%
Interest income . . . . . . . . . . . . . . . . . . . . . . . . . . . . . . . . . . . . . . $ 2,355 $ 5,925 (60.3)%
Interest expense . . . . . . . . . . . . . . . . . . . . . . . . . . . . . . . . . . . . . $ 2,187 $ 1,602 36.5%
Other income . . . . . . . . . . . . . . . . . . . . . . . . . . . . . . . . . . . . . . . $ 363 $ 347 4.6%
Capital expenditures . . . . . . . . . . . . . . . . . . . . . . . . . . . . . . . . . . $ — $ 150 (100.0)%
Selling, general and administrative expense increased primarily as a result of compensation expense related totransfers of certain administrative staff from our drilling segment to our corporate segment as well as increases instock-based compensation expense. Other operating expenses decreased due to a decrease in bad debt expense of$2.9 million. In 2007, we sold certain oil and natural gas properties resulting in a gain of $21.6 million This gain wasreduced by approximately $5.1 million in losses associated with the disposal of other assets. Gains and losses on thedisposal of assets are considered as part of our corporate activities due to the fact that such transactions relate todecisions of the executive management group regarding corporate strategy. Embezzlement costs (recoveries) in2007 includes an expected recovery of $44.5 million reduced by professional fees incurred as a result of theembezzlement. Embezzlement costs (recoveries) in 2006 include professional fees incurred as a result of theembezzlement reduced by insurance proceeds of $2.3 million.
25

Comparison of the years ended December 31, 2006 and 2005
The following tables summarize operations by business segment for the years ended December 31, 2006 and2005:
Contract Drilling 2006 2005 % ChangeYear Ended December 31,
(Dollars in thousands)
Revenues . . . . . . . . . . . . . . . . . . . . . . . . . . . . . . . . . . . . . . $2,169,370 $1,485,684 46.0%
Direct operating costs . . . . . . . . . . . . . . . . . . . . . . . . . . . . . $1,002,001 $ 776,313 29.1%Selling, general and administrative . . . . . . . . . . . . . . . . . . . $ 7,313 $ 5,069 44.3%
Depreciation . . . . . . . . . . . . . . . . . . . . . . . . . . . . . . . . . . . . $ 168,607 $ 131,740 28.0%
Operating income . . . . . . . . . . . . . . . . . . . . . . . . . . . . . . . . $ 991,449 $ 572,562 73.2%
Operating days . . . . . . . . . . . . . . . . . . . . . . . . . . . . . . . . . . 108,192 100,591 7.6%
Average revenue per operating day . . . . . . . . . . . . . . . . . . . $ 20.05 $ 14.77 35.7%
Average direct operating costs per operating day . . . . . . . . . $ 9.26 $ 7.72 19.9%
Average rigs operating . . . . . . . . . . . . . . . . . . . . . . . . . . . . 296 276 7.2%
Capital expenditures . . . . . . . . . . . . . . . . . . . . . . . . . . . . . . $ 531,087 $ 329,073 61.4%
Our average number of rigs operating increased to 296 in 2006 from 276 in 2005. The average market price ofnatural gas for each of the fiscal quarters and full years in 2006 and 2005 follow:
1st Quarter 2nd Quarter 3rd Quarter 4th Quarter Year
2006:Average natural gas price(1) . . . . . . . $7.93 $6.74 $6.26 $ 6.87 $6.94
2005:Average natural gas price(1) . . . . . . . $6.62 $7.14 $9.82 $12.64 $8.98
(1) The average natural gas price above represents the Henry Hub Spot price as reported by the United StatesEnergy Information Administration.
26

Revenues and direct operating costs increased as a result of the increased number of operating days, as well asan increase in the average revenue and average direct operating cost per operating day. Operating days and averagerigs operating increased as a result of increased demand for our contract drilling services and the increase in thenumber of marketable rigs in our fleet due to our rig activation program. Average revenue per operating dayincreased as a result of increased demand and pricing for our drilling services. Average direct operating costs peroperating day increased primarily as a result of increased compensation costs and an increase in the cost ofmaintenance for our rigs. Significant capital expenditures were incurred to activate additional drilling rigs, tomodify and upgrade our drilling rigs and to acquire additional related equipment such as drill pipe, drill collars,engines, fluid circulating systems, rig hoisting systems and safety enhancement equipment. The increase indepreciation expense was a result of the capital expenditures and acquisitions.
Pressure Pumping 2006 2005 % ChangeYear Ended December 31,
(Dollars in thousands)
Revenues . . . . . . . . . . . . . . . . . . . . . . . . . . . . . . . . . . . . . . . . . . $145,671 $93,144 56.4%
Direct operating costs . . . . . . . . . . . . . . . . . . . . . . . . . . . . . . . . . $ 77,755 $54,956 41.5%
Selling, general and administrative . . . . . . . . . . . . . . . . . . . . . . . $ 13,185 $ 9,430 39.8%
Depreciation . . . . . . . . . . . . . . . . . . . . . . . . . . . . . . . . . . . . . . . $ 9,896 $ 7,094 39.5%
Operating income . . . . . . . . . . . . . . . . . . . . . . . . . . . . . . . . . . . . $ 44,835 $21,664 107.0%
Total jobs. . . . . . . . . . . . . . . . . . . . . . . . . . . . . . . . . . . . . . . . . . 11,650 9,615 21.2%
Average revenue per job . . . . . . . . . . . . . . . . . . . . . . . . . . . . . . . $ 12.50 $ 9.69 29.0%
Average direct operating costs per job . . . . . . . . . . . . . . . . . . . . . $ 6.67 $ 5.72 16.6%
Capital expenditures . . . . . . . . . . . . . . . . . . . . . . . . . . . . . . . . . . $ 41,262 $25,508 61.8%
Revenues and direct operating costs increased as a result of the increased number of jobs, as well as an increasein the average revenue and average direct operating cost per job. The increase in jobs was attributable to increaseddemand for our services and increased operating capacity which has been added. Increased average revenue per jobwas due to increased pricing for our services and an increase in the number of larger jobs. Average direct operatingcosts per job increased as a result of increases in compensation and the cost of materials used in our operations, aswell as an increase in the number of larger jobs. Selling, general and administrative expense increased as a result ofadditional expenses to support the expanded operations of the pressure pumping segment. Significant capitalexpenditures were incurred to add capacity and modify and upgrade existing equipment. The increase indepreciation expense was a result of the capital expenditures discussed above.
Drilling and Completion Fluids 2006 2005 % ChangeYear Ended December 31,
(Dollars in thousands)
Revenues . . . . . . . . . . . . . . . . . . . . . . . . . . . . . . . . . . . . . . . . . $192,358 $122,011 57.7%
Direct operating costs . . . . . . . . . . . . . . . . . . . . . . . . . . . . . . . . $150,372 $ 98,530 52.6%
Selling, general and administrative . . . . . . . . . . . . . . . . . . . . . . $ 10,521 $ 8,912 18.1%
Depreciation . . . . . . . . . . . . . . . . . . . . . . . . . . . . . . . . . . . . . . . $ 2,706 $ 2,368 14.3%
Operating income . . . . . . . . . . . . . . . . . . . . . . . . . . . . . . . . . . . $ 28,759 $ 12,201 135.7%
Capital expenditures . . . . . . . . . . . . . . . . . . . . . . . . . . . . . . . . . $ 4,222 $ 3,042 38.8%
27

Revenues and direct operating costs increased primarily as a result of an increase in large jobs offshore in theGulf of Mexico during 2006.
Oil and Natural Gas Production and Exploration 2006 2005 % ChangeYear Ended December 31,
(Dollars in thousands, exceptcommodity prices)
Revenues . . . . . . . . . . . . . . . . . . . . . . . . . . . . . . . . . . . . . . . . . . . $39,187 $39,616 (1.1)%
Direct operating costs. . . . . . . . . . . . . . . . . . . . . . . . . . . . . . . . . . $13,374 $ 9,566 39.8%Selling, general and administrative . . . . . . . . . . . . . . . . . . . . . . . . $ 2,785 $ 2,189 27.2%
Depreciation, depletion and impairment . . . . . . . . . . . . . . . . . . . . $14,368 $14,456 (0.6)%
Operating income. . . . . . . . . . . . . . . . . . . . . . . . . . . . . . . . . . . . . $ 8,660 $13,405 (35.4)%
Capital expenditures . . . . . . . . . . . . . . . . . . . . . . . . . . . . . . . . . . . $21,198 $17,163 23.5%
Average net daily oil production (Bbls) . . . . . . . . . . . . . . . . . . . . . 983 860 14.3%
Average net daily gas production (Mcf) . . . . . . . . . . . . . . . . . . . . 5,143 7,016 (26.7)%
Average oil sales price (per Bbl) . . . . . . . . . . . . . . . . . . . . . . . . . . $ 63.83 $ 54.30 17.6%
Average gas sales price (per Mcf) . . . . . . . . . . . . . . . . . . . . . . . . . $ 6.82 $ 7.64 (10.7)%
Direct operating costs increased primarily due to $4.2 million in costs associated with the abandonment ofexploratory wells. Depreciation, depletion and impairment expense includes $5.0 million and $4.4 million incurredduring 2006 and 2005, respectively, to reflect the impairment of certain oil and natural gas properties. Average netdaily oil production increased due to the completion of new wells in 2006. Average net daily natural gas productiondecreased as a result of production declines and the sale of certain natural gas properties.
Corporate and Other 2006 2005 % ChangeYear Ended December 31,
(Dollars in thousands)
Selling, general and administrative . . . . . . . . . . . . . . . . . . . . . . . . $21,261 $13,510 57.4%
Depreciation . . . . . . . . . . . . . . . . . . . . . . . . . . . . . . . . . . . . . . . . $ 793 $ 735 7.9%
Other operating expenses . . . . . . . . . . . . . . . . . . . . . . . . . . . . . . . $ 5,585 $ 5,479 1.9%
Embezzlement costs . . . . . . . . . . . . . . . . . . . . . . . . . . . . . . . . . . . $ 3,081 $20,043 (84.6)%
(Gain) loss on disposal of assets . . . . . . . . . . . . . . . . . . . . . . . . . . $ 3,819 $ (1,231) N/A%
Interest income . . . . . . . . . . . . . . . . . . . . . . . . . . . . . . . . . . . . . . $ 5,925 $ 3,551 66.9%
Interest expense . . . . . . . . . . . . . . . . . . . . . . . . . . . . . . . . . . . . . . $ 1,602 $ 516 210.5%
Other income . . . . . . . . . . . . . . . . . . . . . . . . . . . . . . . . . . . . . . . . $ 347 $ 428 (18.9)%
Capital expenditures . . . . . . . . . . . . . . . . . . . . . . . . . . . . . . . . . . . $ 150 $ 5,308 (97.2)%
Selling, general and administrative expense increased primarily as a result of an increase of $7.8 million instock-based compensation expense which was impacted by the adoption of a new accounting standard in 2006requiring the expensing of stock options. Other operating expenses include bad debt expense of $5.4 million and$1.2 million in 2006 and 2005, respectively. Embezzlement costs in 2005 includes payments made to or for thebenefit of Jonathan D. Nelson, our former CFO, for assets and services that were not received by the Company andin 2006 includes continuing professional fees incurred as a result of the embezzlement, net of insurance proceeds of$2.3 million received in connection with the loss. Interest expense in 2006 increased due to borrowings under ourline of credit during 2006.
Income Taxes
2007 2006 2005Year Ended December 31,
(Dollars in thousands)
Income before income tax . . . . . . . . . . . . . . . . . . . . . . . . . . . $670,807 $1,043,834 $584,759
Income tax expense . . . . . . . . . . . . . . . . . . . . . . . . . . . . . . . . 232,168 371,267 212,019
Effective tax rate . . . . . . . . . . . . . . . . . . . . . . . . . . . . . . . . . . 34.6% 35.6% 36.3%
28
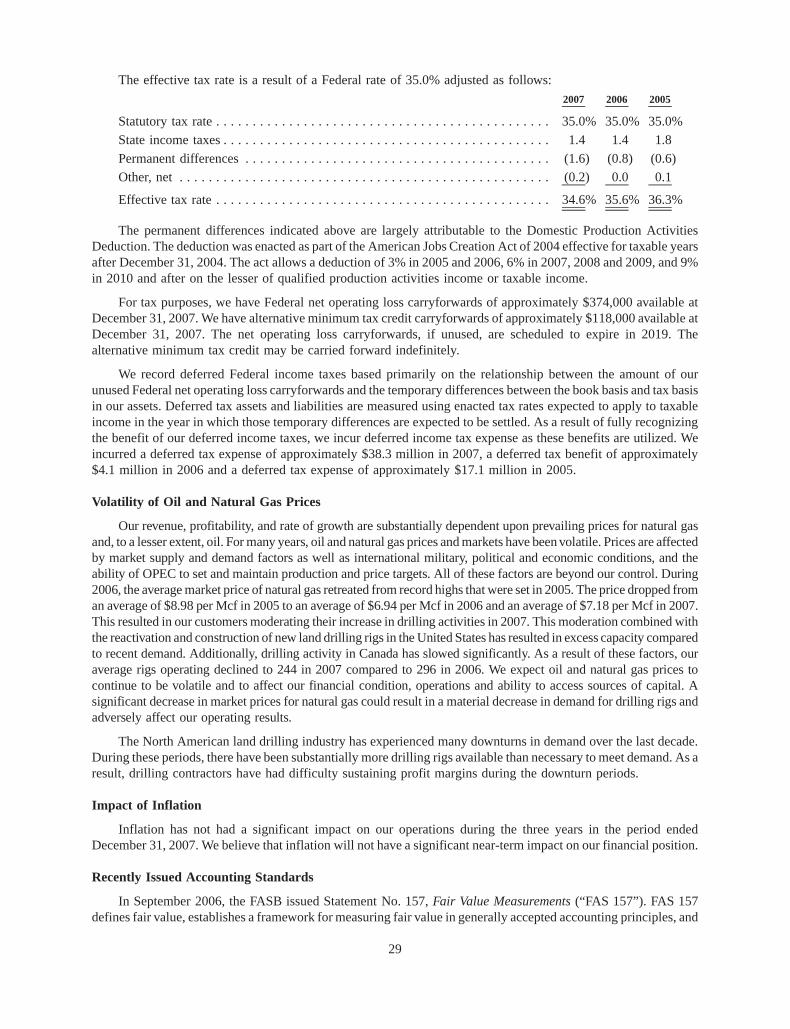
The effective tax rate is a result of a Federal rate of 35.0% adjusted as follows:
2007 2006 2005
Statutory tax rate . . . . . . . . . . . . . . . . . . . . . . . . . . . . . . . . . . . . . . . . . . . . . . 35.0% 35.0% 35.0%
State income taxes . . . . . . . . . . . . . . . . . . . . . . . . . . . . . . . . . . . . . . . . . . . . . 1.4 1.4 1.8
Permanent differences . . . . . . . . . . . . . . . . . . . . . . . . . . . . . . . . . . . . . . . . . . (1.6) (0.8) (0.6)Other, net . . . . . . . . . . . . . . . . . . . . . . . . . . . . . . . . . . . . . . . . . . . . . . . . . . . (0.2) 0.0 0.1
Effective tax rate . . . . . . . . . . . . . . . . . . . . . . . . . . . . . . . . . . . . . . . . . . . . . . 34.6% 35.6% 36.3%
The permanent differences indicated above are largely attributable to the Domestic Production ActivitiesDeduction. The deduction was enacted as part of the American Jobs Creation Act of 2004 effective for taxable yearsafter December 31, 2004. The act allows a deduction of 3% in 2005 and 2006, 6% in 2007, 2008 and 2009, and 9%in 2010 and after on the lesser of qualified production activities income or taxable income.
For tax purposes, we have Federal net operating loss carryforwards of approximately $374,000 available atDecember 31, 2007. We have alternative minimum tax credit carryforwards of approximately $118,000 available atDecember 31, 2007. The net operating loss carryforwards, if unused, are scheduled to expire in 2019. Thealternative minimum tax credit may be carried forward indefinitely.
We record deferred Federal income taxes based primarily on the relationship between the amount of ourunused Federal net operating loss carryforwards and the temporary differences between the book basis and tax basisin our assets. Deferred tax assets and liabilities are measured using enacted tax rates expected to apply to taxableincome in the year in which those temporary differences are expected to be settled. As a result of fully recognizingthe benefit of our deferred income taxes, we incur deferred income tax expense as these benefits are utilized. Weincurred a deferred tax expense of approximately $38.3 million in 2007, a deferred tax benefit of approximately$4.1 million in 2006 and a deferred tax expense of approximately $17.1 million in 2005.
Volatility of Oil and Natural Gas Prices
Our revenue, profitability, and rate of growth are substantially dependent upon prevailing prices for natural gasand, to a lesser extent, oil. For many years, oil and natural gas prices and markets have been volatile. Prices are affectedby market supply and demand factors as well as international military, political and economic conditions, and theability of OPEC to set and maintain production and price targets. All of these factors are beyond our control. During2006, the average market price of natural gas retreated from record highs that were set in 2005. The price dropped froman average of $8.98 per Mcf in 2005 to an average of $6.94 per Mcf in 2006 and an average of $7.18 per Mcf in 2007.This resulted in our customers moderating their increase in drilling activities in 2007. This moderation combined withthe reactivation and construction of new land drilling rigs in the United States has resulted in excess capacity comparedto recent demand. Additionally, drilling activity in Canada has slowed significantly. As a result of these factors, ouraverage rigs operating declined to 244 in 2007 compared to 296 in 2006. We expect oil and natural gas prices tocontinue to be volatile and to affect our financial condition, operations and ability to access sources of capital. Asignificant decrease in market prices for natural gas could result in a material decrease in demand for drilling rigs andadversely affect our operating results.
The North American land drilling industry has experienced many downturns in demand over the last decade.During these periods, there have been substantially more drilling rigs available than necessary to meet demand. As aresult, drilling contractors have had difficulty sustaining profit margins during the downturn periods.
Impact of Inflation
Inflation has not had a significant impact on our operations during the three years in the period endedDecember 31, 2007. We believe that inflation will not have a significant near-term impact on our financial position.
Recently Issued Accounting Standards
In September 2006, the FASB issued Statement No. 157, Fair Value Measurements (“FAS 157”). FAS 157defines fair value, establishes a framework for measuring fair value in generally accepted accounting principles, and
29

expands disclosures about fair value measurement. FAS 157 is effective for financial statements issued for fiscalyears beginning after November 15, 2007 and interim periods within those fiscal years. FAS 157 will be effective forus beginning in the quarter ending March 31, 2008. The application of FAS 157 is not expected to have a materialimpact to us.
In February 2007, the FASB issued Statement No. 159, The Fair Value Option for Financial Assets andFinancial Liabilities Including an Amendment of FASB Statement No. 115 (“FAS 159”). FAS 159 permits entities tochoose to measure many financial instruments and certain other items at fair value. FAS 159 is effective as of thebeginning of an entity’s first fiscal year that begins after November 15, 2007 and will be effective for us beginning inthe quarter ending March 31, 2008. The application of FAS 159 is not expected to have a material impact to us.
In December 2007, the FASB issued Statement No. 141(R), Business Combinations (“FAS 141(R)”) andStatement No. 160, Noncontrolling Interests in Consolidated Financial Statements, an amendment of ARB No. 51(“FAS 160”). FAS 141(R) is a revision of Statement No. 141, Business Combinations, and calls for significantchanges from current practice in accounting for business combinations. FAS 141(R) is effective for businesscombinations for which the acquisition date is on or after the beginning of the first annual reporting periodbeginning on or after December 15, 2008. FAS 160 amends ARB 51 to establish accounting and reporting standardsfor the noncontrolling interest in a subsidiary and for the deconsolidation of a subsidiary. FAS 160 is effective forfiscal years beginning on or after December 15, 2008. Both FAS 141(R) and FAS 160 will be effective for usbeginning the quarter ending March 31, 2009. The application of FAS 141(R) and FAS 160 are not expected to havea material impact to us.
Item 7A. Quantitative and Qualitative Disclosures About Market Risk
We currently have exposure to interest rate market risk associated with borrowings under our credit facility.The revolving credit facility calls for periodic interest payments at a floating rate ranging from LIBOR plus 0.625%to 1.0% or at the prime rate. The applicable rate above LIBOR is based upon our debt to capitalization ratio. A 1%increase (100 basis points) in LIBOR and the prime rate would result in additional annual interest expense ofapproximately $500,000 based upon the level of borrowings we had outstanding at December 31, 2007.
We conduct some business in Canadian dollars through our Canadian land-based drilling operations. Theexchange rate between Canadian dollars and U.S. dollars has fluctuated during the last several years. If the value ofthe Canadian dollar against the U.S. dollar weakens, revenues and earnings of our Canadian operations will bereduced and the value of our Canadian net assets will decline when they are translated to U.S. dollars.
Item 8. Financial Statements and Supplementary Data.
Financial Statements are filed as a part of this Report at the end of Part IV hereof beginning at page F-1, Indexto Consolidated Financial Statements, and are incorporated herein by this reference.
Item 9. Changes in and Disagreements with Accountants on Accounting and Financial Disclosure.
None.
Item 9A. Controls and Procedures.
Disclosure Controls and Procedures:
Under the supervision and with the participation of our management, including our Chief Executive Officer(CEO) and Chief Financial Officer (CFO), we conducted an evaluation of the effectiveness of our disclosurecontrols and procedures, as such term is defined in Rules 13a-15(e) and 15d-15(e) promulgated under the Securitiesand Exchange Act of 1934, as amended (the Exchange Act), as of the end of the period covered by this AnnualReport on Form 10-K. Based on this evaluation, our CEO and CFO concluded that, as of December 31, 2007, ourdisclosure controls and procedures were effective to ensure that information required to be disclosed by us in reportsthat we file or submit under the Exchange Act is recorded, processed, summarized and reported within the timeperiods specified in SEC rules and forms and is accumulated and reported to our management, including our CEOand CFO, as appropriate to allow timely decisions regarding required disclosure.
30

Management’s Report on Internal Control over Financial Reporting:
Our management is responsible for establishing and maintaining adequate internal control over financialreporting, as defined in Exchange Act Rule 13a-15(f). Under the supervision and with the participation of ourmanagement, including our CEO and CFO, we carried out an evaluation of the effectiveness of our internal controlover financial reporting as of December 31, 2007, based on the Internal Control-Integrated Framework issued bythe Committee of Sponsoring Organizations of the Treadway Commission. Based on this evaluation, our man-agement has concluded that our internal control over financial reporting was effective as of December 31, 2007.
The effectiveness of our internal control over financial reporting as of December 31, 2007 has been audited byPricewaterhouseCoopers LLP, an independent registered public accounting firm, as stated in their report whichappears on page F-2 of this Report and is incorporated by reference into Item 8 of this Annual Report on Form 10-K.
Changes in Internal Control over Financial Reporting:
There have been no changes in our internal control over financial reporting during the most recently completedfiscal quarter that have materially affected, or are reasonably likely to materially affect, our internal control overfinancial reporting.
Item 9B. Other Information
None.
31

PART III
The information required by Part III is omitted from this Report because we will file a definitive proxystatement pursuant to Regulation 14A of the Securities Exchange Act of 1934 no later than 120 days after the end ofthe fiscal year covered by this Report and certain information included therein is incorporated herein by reference.
Item 10. Directors, Executive Officers and Corporate Governance.
The information required by this Item is incorporated herein by reference to the Proxy Statement.
Item 11. Executive Compensation.
The information required by this Item is incorporated herein by reference to the Proxy Statement.
Item 12. Security Ownership of Certain Beneficial Owners and Management and Related StockholderMatters.
The information required by this Item is incorporated herein by reference to the Proxy Statement.
Item 13. Certain Relationships and Related Transactions, and Director Independence.
The information required by this Item is incorporated herein by reference to the Proxy Statement.
Item 14. Principal Accountant Fees and Services.
The information required by this Item is incorporated herein by reference to the Proxy Statement.
32
PART IV
Item 15. Exhibits and Financial Statement Schedule.
(a)(1) Financial Statements
See Index to Consolidated Financial Statements on page F-1 of this Report.
(a)(2) Financial Statement Schedule
Schedule II — Valuation and qualifying accounts is filed herewith on page S-1.
All other financial statement schedules have been omitted because they are not applicable or the informationrequired therein is included elsewhere in the financial statements or notes thereto.
(a)(3) Exhibits
The following exhibits are filed herewith or incorporated by reference herein.
3.1 Restated Certificate of Incorporation, as amended (filed August 9, 2004 as Exhibit 3.1 to the Company’sQuarterly Report on Form 10-Q for the quarterly period ended June 30, 2004 and incorporated herein byreference).
3.2 Amendment to Restated Certificate of Incorporation, as amended (filed August 9, 2004 as Exhibit 3.2 to theCompany’s Quarterly Report on Form 10-Q for the quarterly period ended June 30, 2004 and incorporatedherein by reference).
3.3 Second Amended and Restated Bylaws (filed August 6, 2007 as Exhibit 3.3 to the Company’s QuarterlyReport on Form 10-Q for the quarterly period ended June 30, 2007 and incorporated herein by reference).
4.1 Rights Agreement dated January 2, 1997, between Patterson Energy, Inc. and Continental Stock Transfer &Trust Company (filed January 14, 1997 as Exhibit 2 to the Company’s Registration Statement on Form 8-Aand incorporated herein by reference).
4.2 Amendment to Rights Agreement dated as of October 23, 2001 (filed October 31, 2001 as Exhibit 3.4 to theCompany’s Quarterly Report on Form 10-Q for the quarterly period ended September 30, 2001 andincorporated herein by reference).
4.3 Restated Certificate of Incorporation, as amended (See Exhibits 3.1 and 3.2).
4.4 Registration Rights Agreement with Bear, Stearns and Co. Inc., dated March 25, 1994, as assigned byREMY Capital Partners III, L.P. (filed March 19, 2002 as Exhibit 4.3 to the Company’s Annual Report onForm 10-K for the fiscal year ended December 31, 2001 and incorporated herein by reference).
10.1 For additional material contracts, see Exhibits 4.1, 4.2 and 4.4.
10.2 Patterson-UTI Energy, Inc., 1993 Stock Incentive Plan, as amended (filed March 13, 1998 as Exhibit 10.1 tothe Company’s Registration Statement on Form S-8 (File No. 333-47917) and incorporated herein byreference).*
10.3 Patterson-UTI Energy, Inc. Non-Employee Directors’ Stock Option Plan, as amended (filed November 4,1997 as Exhibit 10.1 to the Company’s Registration Statement on Form S-8 (File No. 333-39471) andincorporated herein by reference).*
10.4 Amended and Restated Patterson-UTI Energy, Inc. 2001 Long-Term Incentive Plan (filed November 27,2002 as Exhibit 4.4 to Post Effective Amendment No. 1 to the Company’s Registration Statement onForm S-8 (File No. 333-60470) and incorporated herein by reference).*
10.5 Patterson-UTI Energy, Inc. Amended and Restated 1997 Long-Term Incentive Plan (filed July 28, 2003 asExhibit 4.7 to the Company’s Quarterly Report on Form 10-Q for the quarterly period ended June 30, 2003and incorporated herein by reference).*
10.6 Amendment to the Patterson-UTI Energy, Inc. Amended and Restated 1997 Long-Term Incentive Plan(filed August 9, 2004 as Exhibit 10.7 to the Company’s Quarterly Report on Form 10-Q for the quarterlyperiod ended June 30, 2004 and incorporated herein by reference).*
10.7 Amended and Restated Patterson-UTI Energy, Inc. Non-Employee Director Stock Option Plan(filedJuly 28, 2003 as Exhibit 4.8 to the Company’s Quarterly Report on Form 10-Q for the quarterly periodended June 30, 2003 and incorporated herein by reference).*
33

10.8 Amended and Restated Patterson-UTI Energy, Inc. 1996 Employee Stock Option Plan (filed July 25, 2001as Exhibit 4.4 to Post-Effective Amendment No. 1 to the Company’s Registration Statement on Form S-8(File No. 333-60466) and incorporated herein by reference).*
10.9 Patterson-UTI Energy, Inc. 2005 Long-Term Incentive Plan, including Form of Executive OfficerRestricted Stock Award Agreement, Form of Executive Officer Stock Option Agreement, Form ofNon-Employee Director Restricted Stock Award Agreement and Form of Non-Employee DirectorStock Option Agreement (filed June 21, 2005 as Exhibit 10.1 to the Company’s Current Report onForm 8-K, and incorporated herein by reference).*
10.10 Restricted Stock Award Agreement dated April 28, 2004 between Patterson-UTI Energy, Inc. and Mark S.Siegel (filed August 9, 2004 as Exhibit 10.1 to the Company’s Quarterly Report on Form 10-Q for thequarterly period ended June 30, 2004 and incorporated herein by reference).*
10.11 Restricted Stock Award Agreement dated April 28, 2004 between Patterson-UTI Energy, Inc. and CloyceA. Talbott (filed August 9, 2004 as Exhibit 10.2 to the Company’s Quarterly Report on Form 10-Q for thequarterly period ended June 30, 2004 and incorporated herein by reference).*
10.12 Restricted Stock Award Agreement dated April 28, 2004 between Patterson-UTI Energy, Inc. and KennethN. Berns (filed August 9, 2004 as Exhibit 10.4 to the Company’s Quarterly Report on Form 10-Q for thequarterly period ended June 30, 2004 and incorporated herein by reference).*
10.13 Restricted Stock Award Agreement dated April 28, 2004 between Patterson-UTI Energy, Inc. and John E.Vollmer III (filed August 9, 2004 as Exhibit 10.6 to the Company’s Quarterly Report on Form 10-Q for thequarterly period ended June 30, 2004 and incorporated herein by reference).*
10.14 Patterson-UTI Energy, Inc. Change in Control Agreement, effective as of January 29, 2004, by and betweenPatterson-UTI Energy, Inc. and Mark S. Siegel (filed on February 4, 2004 as Exhibit 10.2 to the Company’sAnnual Report on Form 10-K for the year ended December 31, 2003 and incorporated herein byreference).*
10.15 Employment Agreement, dated as of September 1, 2007 between Patterson-UTI Energy, Inc. and Cloyce A.Talbott (filed on September 24, 2007 as Exhibit 10.1 to the Company’s Current Report on Form 8-K, andincorporated herein by reference).*
10.16 Patterson-UTI Energy, Inc. Change in Control Agreement, effective as of January 29, 2004, by and betweenPatterson-UTI Energy, Inc. and Kenneth N. Berns (filed on February 4, 2004 as Exhibit 10.5 to theCompany’s Annual Report on Form 10-K for the year ended December 31, 2003 and incorporated herein byreference).*
10.17 Patterson-UTI Energy, Inc. Change in Control Agreement, effective as of January 29, 2004, by and betweenPatterson-UTI Energy, Inc. and John E. Vollmer III (filed on February 4, 2004 as Exhibit 10.7 to theCompany’s Annual Report on Form 10-K for the year ended December 31, 2003 and incorporated herein byreference).*
10.18 Form of Letter Agreement regarding termination, effective as of January 29, 2004, entered into byPatterson-UTI Energy, Inc. with each of Mark S. Siegel, Kenneth N. Berns and John E. Vollmer III (filed onFebruary 25, 2005 as Exhibit 10.23 to the Company’s Annual Report on Form 10-K for the year endedDecember 31, 2004 and incorporated herein by reference).*
10.19 Form of Indemnification Agreement entered into by Patterson-UTI Energy, Inc. with each of Mark S.Siegel, Cloyce A. Talbott, Douglas J. Wall, Kenneth N. Berns, Curtis W. Huff, Terry H. Hunt, Kenneth R.Peak, Charles O. Buckner, John E. Vollmer III, William L. Moll, Jr. and Gregory W. Pipkin (filed April 28,2004 as Exhibit 10.11 to the Company’s Annual Report on Form 10-K, as amended, for the year endedDecember 31, 2003 and incorporated herein by reference).*
10.20 Severance Agreement between Patterson-UTI Energy, Inc. and Douglas J. Wall, effective as of August 31,2007 (filed September 4, 2007 as Exhibit 10.3 to the Company’s Current Report on Form 8-K andincorporated herein by reference).*
10.21 Patterson-UTI Energy, Inc. Change in Control Agreement, effective as of August 31, 2007, by and betweenPatterson-UTI Energy, Inc. and Douglas J. Wall (filed September 4, 2007 as Exhibit 10.2 to the Company’sCurrent Report on Form 8-K and incorporated herein by reference).*
34
10.22 Patterson-UTI Energy, Inc. Change in Control Agreement, effective as of August 31, 2007, by and betweenPatterson-UTI Energy, Inc. and William L. Moll, Jr. (filed November 5, 2007 as Exhibit 10.7 to theCompany’s Quarterly Report on Form 10-Q for the quarterly period ended September 30, 2007 andincorporated herein by reference).*
10.23 First Amendment to Change in Control Agreement Between Patterson-UTI Energy, Inc. and Mark S.Siegel, entered into November 1, 2007 (filed November 5, 2007 as Exhibit 10.8 to the Company’s QuarterlyReport on Form 10-Q for the quarterly period ended September 30, 2007 and incorporated herein byreference).*
10.24 First Amendment to Change in Control Agreement Between Patterson-UTI Energy, Inc. and Douglas J.Wall, entered into November 1, 2007 (filed November 5, 2007 as Exhibit 10.9 to the Company’s QuarterlyReport on Form 10-Q for the quarterly period ended September 30, 2007 and incorporated herein byreference).*
10.25 First Amendment to Change in Control Agreement Between Patterson-UTI Energy, Inc. and John E.Vollmer, III, entered into November 1, 2007 (filed November 5, 2007 as Exhibit 10.10 to the Company’sQuarterly Report on Form 10-Q for the quarterly period ended September 30, 2007 and incorporated hereinby reference).*
10.26 First Amendment to Change in Control Agreement Between Patterson-UTI Energy, Inc. and Kenneth N.Berns, entered into November 1, 2007 (filed November 5, 2007 as Exhibit 10.11 to the Company’sQuarterly Report on Form 10-Q for the quarterly period ended September 30, 2007 and incorporated hereinby reference).*
10.27 First Amendment to Change in Control Agreement Between Patterson-UTI Energy, Inc. and William L.Moll, Jr., entered into November 1, 2007 (filed November 5, 2007 as Exhibit 10.12 to the Company’sQuarterly Report on Form 10-Q for the quarterly period ended September 30, 2007 and incorporated hereinby reference).*
10.28 Credit Agreement dated as of December 17, 2004 among Patterson-UTI Energy, Inc., as the Borrower,Bank of America, N.A., as administrative agent, L/C Issuer and a Lender and the other lenders and agentsparty thereto (filed on December 23, 2004 as Exhibit 10.1 to the Company’s Current Report on Form 8-Kand incorporated herein by reference).
10.29 Commitment Increase and Joinder Agreement, dated as of August 2, 2006, by and among Patterson-UTIEnergy, Inc., the guarantors party thereto, the lenders party thereto, and Bank of America, N.A. asAdministrative Agent, L/C Issuer and Lender (filed August 21, 2006 as Exhibit 10.1 to the Company’sCurrent Report on Form 8-K and incorporated herein by reference).
10.30 Letter Agreement dated February 6, 2006 between Patterson-UTI Energy, Inc. and John E. Vollmer III(filed May 1, 2006 as Exhibit 10.25 to the Company’s Annual Report on Form 10-K, as amended, andincorporated herein by reference).*
14.1 Patterson-UTI Energy, Inc. Code of Business Conduct and Ethics for Senior Financial Executives (filed onFebruary 4, 2004 as Exhibit 14.1 to the Company’s Annual Report on Form 10-K for the year endedDecember 31, 2003 and incorporated herein by reference).
21.1 Subsidiaries of the Registrant.
23.1 Consent of Independent Registered Public Accounting Firm.
31.1 Certification of Chief Executive Officer pursuant to Rule 13a-14(a)/15d-14(a) of the Securities ExchangeAct of 1934, as amended.
31.2 Certification of Chief Financial Officer pursuant to Rule 13a-14(a)/15d-14(a) of the Securities ExchangeAct of 1934, as amended.
32.1 Certification of Chief Executive Officer and Chief Financial Officer pursuant to 18 USC Section 1350, asadopted pursuant to Section 906 of the Sarbanes-Oxley Act of 2002.
* Management Contract or Compensatory Plan identified as required by Item 15(a)(3) of Form 10-K.
35


INDEX TO CONSOLIDATED FINANCIAL STATEMENTS
Page
Report of Independent Registered Public Accounting Firm. . . . . . . . . . . . . . . . . . . . . . . . . . . . . . . . . . . F-2
Consolidated Financial Statements:
Consolidated Balance Sheets as of December 31, 2007 and 2006 . . . . . . . . . . . . . . . . . . . . . . . . . . . . . . F-3
Consolidated Statements of Income for the years ended December 31, 2007, 2006 and 2005. . . . . . . . . . F-4
Consolidated Statements of Changes In Stockholders’ Equity for the years ended December 31, 2007,2006 and 2005 . . . . . . . . . . . . . . . . . . . . . . . . . . . . . . . . . . . . . . . . . . . . . . . . . . . . . . . . . . . . . . . . . F-5
Consolidated Statements of Changes In Cash Flows for the years ended December 31, 2007, 2006 and2005. . . . . . . . . . . . . . . . . . . . . . . . . . . . . . . . . . . . . . . . . . . . . . . . . . . . . . . . . . . . . . . . . . . . . . . . . F-6
Notes to Consolidated Financial Statements . . . . . . . . . . . . . . . . . . . . . . . . . . . . . . . . . . . . . . . . . . . . . . F-7
Financial Statement Schedule . . . . . . . . . . . . . . . . . . . . . . . . . . . . . . . . . . . . . . . . . . . . . . . . . . . . . . . . S-1
F-1

Report of Independent Registered Public Accounting Firm
To the Board of Directors and Shareholders ofPatterson-UTI Energy, Inc.:
In our opinion, the consolidated financial statements listed in the accompanying index present fairly, in allmaterial respects, the financial position of Patterson-UTI Energy, Inc. and its subsidiaries at December 31, 2007 and2006, and the results of their operations and their cash flows for each of the three years in the period endedDecember 31, 2007 in conformity with accounting principles generally accepted in the United States of America. Inaddition, in our opinion, the financial statement schedule listed in the index appearing under Item 15(a)(2) presentsfairly, in all material respects, the information set forth therein when read in conjunction with the relatedconsolidated financial statements. Also in our opinion, the Company maintained, in all material respects, effectiveinternal control over financial reporting as of December 31, 2007, based on criteria established in InternalControl — Integrated Framework issued by the Committee of Sponsoring Organizations of the Treadway Com-mission (COSO). The Company’s management is responsible for these financial statements and financial statementschedule, for maintaining effective internal control over financial reporting and for its assessment of the effec-tiveness of internal control over financial reporting, included in Management’s Report on Internal Control overFinancial Reporting appearing under Item 9A. Our responsibility is to express opinions on these financialstatements, on the financial statement schedule, and on the Company’s internal control over financial reportingbased on our integrated audits. We conducted our audits in accordance with the standards of the Public CompanyAccounting Oversight Board (United States). Those standards require that we plan and perform the audits to obtainreasonable assurance about whether the financial statements are free of material misstatement and whether effectiveinternal control over financial reporting was maintained in all material respects. Our audits of the financialstatements included examining, on a test basis, evidence supporting the amounts and disclosures in the financialstatements, assessing the accounting principles used and significant estimates made by management, and evaluatingthe overall financial statement presentation. Our audit of internal control over financial reporting included obtainingan understanding of internal control over financial reporting, assessing the risk that a material weakness exists, andtesting and evaluating the design and operating effectiveness of internal control based on the assessed risk. Ouraudits also included performing such other procedures as we considered necessary in the circumstances. We believethat our audits provide a reasonable basis for our opinions.
A company’s internal control over financial reporting is a process designed to provide reasonable assuranceregarding the reliability of financial reporting and the preparation of financial statements for external purposes inaccordance with generally accepted accounting principles. A company’s internal control over financial reportingincludes those policies and procedures that (i) pertain to the maintenance of records that, in reasonable detail,accurately and fairly reflect the transactions and dispositions of the assets of the company; (ii) provide reasonableassurance that transactions are recorded as necessary to permit preparation of financial statements in accordancewith generally accepted accounting principles, and that receipts and expenditures of the company are being madeonly in accordance with authorizations of management and directors of the company; and (iii) provide reasonableassurance regarding prevention or timely detection of unauthorized acquisition, use, or disposition of the company’sassets that could have a material effect on the financial statements.
Because of its inherent limitations, internal control over financial reporting may not prevent or detectmisstatements. Also, projections of any evaluation of effectiveness to future periods are subject to the risk thatcontrols may become inadequate because of changes in conditions, or that the degree of compliance with thepolicies or procedures may deteriorate.
/s/ PricewaterhouseCoopers LLP
Houston, TexasFebruary 18, 2008
F-2

PATTERSON-UTI ENERGY, INC. AND SUBSIDIARIES
CONSOLIDATED BALANCE SHEETS
2007 2006December 31,
(In thousands,except share data)
ASSETSCurrent assets:
Cash and cash equivalents . . . . . . . . . . . . . . . . . . . . . . . . . . . . . . . . . . . . . . . . . $ 17,434 $ 13,385Accounts receivable, net of allowance for doubtful accounts of $10,014 and
$7,484 at December 31, 2007 and 2006, respectively . . . . . . . . . . . . . . . . . . . 373,279 484,106Accrued Federal and state income taxes receivable . . . . . . . . . . . . . . . . . . . . . . — 5,448Inventory . . . . . . . . . . . . . . . . . . . . . . . . . . . . . . . . . . . . . . . . . . . . . . . . . . . . . 44,416 43,947Deferred tax assets, net . . . . . . . . . . . . . . . . . . . . . . . . . . . . . . . . . . . . . . . . . . . 35,370 48,868Deposits on equipment purchases . . . . . . . . . . . . . . . . . . . . . . . . . . . . . . . . . . . 1,650 24,746Other . . . . . . . . . . . . . . . . . . . . . . . . . . . . . . . . . . . . . . . . . . . . . . . . . . . . . . . . 50,636 32,170
Total current assets . . . . . . . . . . . . . . . . . . . . . . . . . . . . . . . . . . . . . . . . . . 522,785 652,670Property and equipment, net . . . . . . . . . . . . . . . . . . . . . . . . . . . . . . . . . . . . . . . . . 1,841,404 1,435,804Goodwill . . . . . . . . . . . . . . . . . . . . . . . . . . . . . . . . . . . . . . . . . . . . . . . . . . . . . . . 96,198 99,056Other . . . . . . . . . . . . . . . . . . . . . . . . . . . . . . . . . . . . . . . . . . . . . . . . . . . . . . . . . . 4,812 4,973
Total assets . . . . . . . . . . . . . . . . . . . . . . . . . . . . . . . . . . . . . . . . . . . . . . . . $2,465,199 $2,192,503
LIABILITIES AND STOCKHOLDERS’ EQUITYCurrent liabilities:
Accounts payable:Trade . . . . . . . . . . . . . . . . . . . . . . . . . . . . . . . . . . . . . . . . . . . . . . . . . . . . . . $ 133,330 $ 138,372Accrued revenue distributions . . . . . . . . . . . . . . . . . . . . . . . . . . . . . . . . . . . . 4,221 15,359Other . . . . . . . . . . . . . . . . . . . . . . . . . . . . . . . . . . . . . . . . . . . . . . . . . . . . . . 19,365 18,424
Accrued Federal and state income taxes payable . . . . . . . . . . . . . . . . . . . . . . . . 1,458 —Accrued expenses . . . . . . . . . . . . . . . . . . . . . . . . . . . . . . . . . . . . . . . . . . . . . . . 136,834 145,463
Total current liabilities . . . . . . . . . . . . . . . . . . . . . . . . . . . . . . . . . . . . . . . . 295,208 317,618Borrowings under line of credit. . . . . . . . . . . . . . . . . . . . . . . . . . . . . . . . . . . . . . . 50,000 120,000Deferred tax liabilities, net . . . . . . . . . . . . . . . . . . . . . . . . . . . . . . . . . . . . . . . . . . 219,490 187,960Other . . . . . . . . . . . . . . . . . . . . . . . . . . . . . . . . . . . . . . . . . . . . . . . . . . . . . . . . . . 4,471 4,459
Total liabilities . . . . . . . . . . . . . . . . . . . . . . . . . . . . . . . . . . . . . . . . . . . . . 569,169 630,037
Commitments and contingencies (see Note 9) . . . . . . . . . . . . . . . . . . . . . . . . . . . . — —Stockholders’ equity:
Preferred stock, par value $.01; authorized 1,000,000 shares, no shares issued . . — —Common stock, par value $.01; authorized 300,000,000 shares with 177,385,808
and 176,656,401 issued and 153,942,800 and 156,542,512 outstanding atDecember 31, 2007 and 2006, respectively . . . . . . . . . . . . . . . . . . . . . . . . . . . 1,773 1,766
Additional paid-in capital . . . . . . . . . . . . . . . . . . . . . . . . . . . . . . . . . . . . . . . . . 703,581 681,069Retained earnings . . . . . . . . . . . . . . . . . . . . . . . . . . . . . . . . . . . . . . . . . . . . . . . 1,716,620 1,346,542Accumulated other comprehensive income. . . . . . . . . . . . . . . . . . . . . . . . . . . . . 20,207 8,390Treasury stock, at cost, 23,443,008 shares and 20,113,889 shares at
December 31, 2007 and 2006, respectively . . . . . . . . . . . . . . . . . . . . . . . . . . . (546,151) (475,301)
Total stockholders’ equity . . . . . . . . . . . . . . . . . . . . . . . . . . . . . . . . . . . . . 1,896,030 1,562,466
Total liabilities and stockholders’ equity . . . . . . . . . . . . . . . . . . . . . . . . . . . $2,465,199 $2,192,503
The accompanying notes are an integral part of these consolidated financial statements.
F-3

PATTERSON-UTI ENERGY, INC. AND SUBSIDIARIES
CONSOLIDATED STATEMENTS OF INCOME
2007 2006 2005Year Ended December 31,
(In thousands, except per share data)
Operating revenues:Contract drilling . . . . . . . . . . . . . . . . . . . . . . . . . . . . . . . . . . . . . $1,741,647 $2,169,370 $1,485,684Pressure pumping . . . . . . . . . . . . . . . . . . . . . . . . . . . . . . . . . . . . 202,812 145,671 93,144Drilling and completion fluids . . . . . . . . . . . . . . . . . . . . . . . . . . . 128,098 192,358 122,011Oil and natural gas . . . . . . . . . . . . . . . . . . . . . . . . . . . . . . . . . . . 41,637 39,187 39,616
2,114,194 2,546,586 1,740,455Operating costs and expenses:
Contract drilling . . . . . . . . . . . . . . . . . . . . . . . . . . . . . . . . . . . . . 963,150 1,002,001 776,313Pressure pumping . . . . . . . . . . . . . . . . . . . . . . . . . . . . . . . . . . . . 105,273 77,755 54,956Drilling and completion fluids . . . . . . . . . . . . . . . . . . . . . . . . . . . 108,752 150,372 98,530Oil and natural gas . . . . . . . . . . . . . . . . . . . . . . . . . . . . . . . . . . . 10,864 13,374 9,566Depreciation, depletion and impairment . . . . . . . . . . . . . . . . . . . . 249,206 196,370 156,393Selling, general and administrative . . . . . . . . . . . . . . . . . . . . . . . 64,623 55,065 39,110Embezzlement costs (recoveries) . . . . . . . . . . . . . . . . . . . . . . . . . (43,955) 3,081 20,043(Gain) loss on disposal of assets . . . . . . . . . . . . . . . . . . . . . . . . . (16,545) 3,819 (1,231)Other operating expenses . . . . . . . . . . . . . . . . . . . . . . . . . . . . . . 2,550 5,585 5,479
1,443,918 1,507,422 1,159,159Operating income . . . . . . . . . . . . . . . . . . . . . . . . . . . . . . . . . . . . . . 670,276 1,039,164 581,296Other income (expense):
Interest income . . . . . . . . . . . . . . . . . . . . . . . . . . . . . . . . . . . . . . 2,355 5,925 3,551Interest expense . . . . . . . . . . . . . . . . . . . . . . . . . . . . . . . . . . . . . (2,187) (1,602) (516)Other . . . . . . . . . . . . . . . . . . . . . . . . . . . . . . . . . . . . . . . . . . . . . 363 347 428
531 4,670 3,463Income before income taxes and cumulative effect of change in
accounting principle . . . . . . . . . . . . . . . . . . . . . . . . . . . . . . . . . . 670,807 1,043,834 584,759Income tax expense (benefit):
Current . . . . . . . . . . . . . . . . . . . . . . . . . . . . . . . . . . . . . . . . . . . . 193,897 375,373 194,918Deferred . . . . . . . . . . . . . . . . . . . . . . . . . . . . . . . . . . . . . . . . . . . 38,271 (4,106) 17,101
232,168 371,267 212,019Income before cumulative effect of change in accounting
principle . . . . . . . . . . . . . . . . . . . . . . . . . . . . . . . . . . . . . . . . . . . 438,639 672,567 372,740Cumulative effect of change in accounting principle, net of related
income tax expense of $398 . . . . . . . . . . . . . . . . . . . . . . . . . . . . — 687 —Net income . . . . . . . . . . . . . . . . . . . . . . . . . . . . . . . . . . . . . . . . . . $ 438,639 $ 673,254 $ 372,740
Income before cumulative effect of change in accounting principleper common share:
Basic . . . . . . . . . . . . . . . . . . . . . . . . . . . . . . . . . . . . . . . . . . . $ 2.83 4.07 $ 2.19
Diluted . . . . . . . . . . . . . . . . . . . . . . . . . . . . . . . . . . . . . . . . . . $ 2.79 4.02 $ 2.15
Net income per common share:Basic . . . . . . . . . . . . . . . . . . . . . . . . . . . . . . . . . . . . . . . . . . . $ 2.83 $ 4.08 $ 2.19
Diluted . . . . . . . . . . . . . . . . . . . . . . . . . . . . . . . . . . . . . . . . . . $ 2.79 $ 4.02 $ 2.15
Weighted average number of common shares outstanding:Basic . . . . . . . . . . . . . . . . . . . . . . . . . . . . . . . . . . . . . . . . . . . 154,755 165,159 170,426
Diluted . . . . . . . . . . . . . . . . . . . . . . . . . . . . . . . . . . . . . . . . . . 156,997 167,413 173,767
Cash dividends per common share . . . . . . . . . . . . . . . . . . . . . . . . . $ 0.44 $ 0.28 $ 0.16
The accompanying notes are an integral part of these consolidated financial statements.
F-4

PATTERSON-UTI ENERGY, INC. AND SUBSIDIARIES
CONSOLIDATED STATEMENTS OF CHANGES IN STOCKHOLDERS’ EQUITY
Number ofShares Amount
AdditionalPaid-inCapital
DeferredCompensation
RetainedEarnings
AccumulatedOther
ComprehensiveIncome
TreasuryStock Total
Common Stock
(In thousands)
Balance, December 31, 2004 . . . . . . . . . . 171,626 $1,716 $597,280 $(5,420) $ 373,712 $ 7,350 $ (13,137) $ 961,501
Issuance of restricted stock . . . . . . . . . 305 3 8,040 (8,043) — — — —
Amortization of deferred compensationexpense . . . . . . . . . . . . . . . . . . . . — — — 2,825 — — — 2,825
Forfeitures of restricted shares. . . . . . . . (65) — (1,351) 1,351 — — — —
Exercise of stock options . . . . . . . . . . . 4,043 40 43,434 — — — — 43,474
Tax benefit related to stock-basedcompensation . . . . . . . . . . . . . . . . — — 24,748 — — — — 24,748
Foreign currency translation adjustment(net of tax of $705) . . . . . . . . . . . . — — — — — 1,215 — 1,215
Purchase of treasury stock . . . . . . . . . . — — — — — — (12,153) (12,153)
Payment of cash dividend (see Note 10) . . — — — — (27,339) — — (27,339)
Net income . . . . . . . . . . . . . . . . . . . — — — — 372,740 — — 372,740
Balance, December 31, 2005 . . . . . . . . . . 175,909 1,759 672,151 (9,287) 719,113 8,565 (25,290) 1,367,011
Elimination of deferred compensation dueto change in accounting principle . . . . — — (9,287) 9,287 — — — —
Issuance of restricted stock . . . . . . . . . 613 6 (6) — — — — —
Forfeitures of restricted shares. . . . . . . . (47) (1) 1 — — — — —
Exercise of stock options . . . . . . . . . . . 181 2 1,944 — — — — 1,946
Tax benefit related to stock-basedcompensation . . . . . . . . . . . . . . . . — — 1,087 — — — — 1,087
Stock based compensation, net ofcumulative effect of change inaccounting principle . . . . . . . . . . . . — — 15,179 — — — — 15,179
Foreign currency translation adjustment,(net of tax of $6) . . . . . . . . . . . . . . — — — — — (175) — (175)
Payment of cash dividend (see Note 10) . . — — — — (45,825) — — (45,825)
Purchase of treasury stock . . . . . . . . . . — — — — — — (450,011) (450,011)
Net income . . . . . . . . . . . . . . . . . . . — — — — 673,254 — — 673,254
Balance, December 31, 2006 . . . . . . . . . . 176,656 1,766 681,069 — 1,346,542 8,390 (475,301) 1,562,466
Issuance of restricted stock . . . . . . . . . 601 6 (6) — — — — —
Forfeitures of restricted shares. . . . . . . . (101) (1) 1 — — — — —
Exercise of stock options . . . . . . . . . . . 230 2 2,048 — — — — 2,050
Tax benefit related to stock-basedcompensation . . . . . . . . . . . . . . . . — — 1,105 — — — — 1,105
Stock based compensation . . . . . . . . . . — — 19,364 — — — — 19,364
Foreign currency translation adjustment,(net of tax of $6,755) . . . . . . . . . . . — — — — — 11,817 — 11,817
Payment of cash dividend (see Note 10) . . — — — — (68,561) — — (68,561)
Purchase of treasury stock . . . . . . . . . . — — — — — — (70,850) (70,850)
Net income . . . . . . . . . . . . . . . . . . . — — — — 438,639 — — 438,639
Balance, December 31, 2007 . . . . . . . . . . 177,386 $1,773 $703,581 $ — $1,716,620 $20,207 $(546,151) $1,896,030
The accompanying notes are an integral part of these consolidated financial statements.
F-5
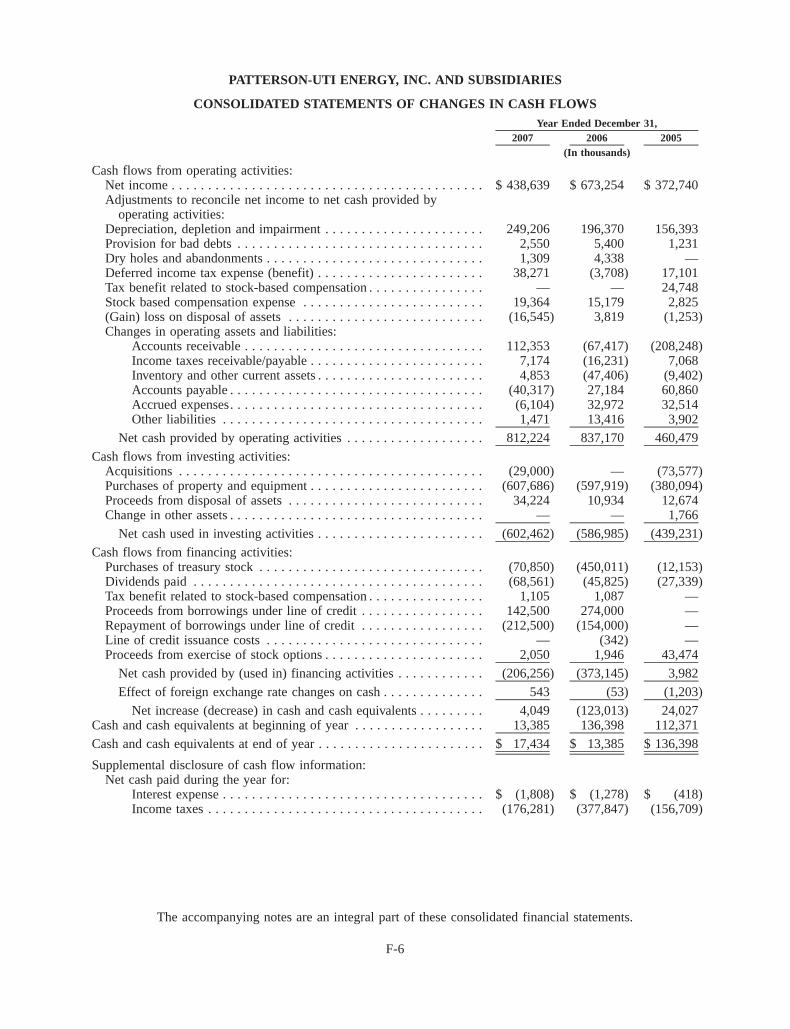
PATTERSON-UTI ENERGY, INC. AND SUBSIDIARIES
CONSOLIDATED STATEMENTS OF CHANGES IN CASH FLOWS
2007 2006 2005Year Ended December 31,
(In thousands)
Cash flows from operating activities:Net income . . . . . . . . . . . . . . . . . . . . . . . . . . . . . . . . . . . . . . . . . . . $ 438,639 $ 673,254 $ 372,740Adjustments to reconcile net income to net cash provided by
operating activities:Depreciation, depletion and impairment . . . . . . . . . . . . . . . . . . . . . . 249,206 196,370 156,393Provision for bad debts . . . . . . . . . . . . . . . . . . . . . . . . . . . . . . . . . . 2,550 5,400 1,231Dry holes and abandonments . . . . . . . . . . . . . . . . . . . . . . . . . . . . . . 1,309 4,338 —Deferred income tax expense (benefit) . . . . . . . . . . . . . . . . . . . . . . . 38,271 (3,708) 17,101Tax benefit related to stock-based compensation . . . . . . . . . . . . . . . . — — 24,748Stock based compensation expense . . . . . . . . . . . . . . . . . . . . . . . . . 19,364 15,179 2,825(Gain) loss on disposal of assets . . . . . . . . . . . . . . . . . . . . . . . . . . . (16,545) 3,819 (1,253)Changes in operating assets and liabilities:
Accounts receivable . . . . . . . . . . . . . . . . . . . . . . . . . . . . . . . . . 112,353 (67,417) (208,248)Income taxes receivable/payable . . . . . . . . . . . . . . . . . . . . . . . . 7,174 (16,231) 7,068Inventory and other current assets . . . . . . . . . . . . . . . . . . . . . . . 4,853 (47,406) (9,402)Accounts payable . . . . . . . . . . . . . . . . . . . . . . . . . . . . . . . . . . . (40,317) 27,184 60,860Accrued expenses. . . . . . . . . . . . . . . . . . . . . . . . . . . . . . . . . . . (6,104) 32,972 32,514Other liabilities . . . . . . . . . . . . . . . . . . . . . . . . . . . . . . . . . . . . 1,471 13,416 3,902
Net cash provided by operating activities . . . . . . . . . . . . . . . . . . . 812,224 837,170 460,479
Cash flows from investing activities:Acquisitions . . . . . . . . . . . . . . . . . . . . . . . . . . . . . . . . . . . . . . . . . . (29,000) — (73,577)Purchases of property and equipment . . . . . . . . . . . . . . . . . . . . . . . . (607,686) (597,919) (380,094)Proceeds from disposal of assets . . . . . . . . . . . . . . . . . . . . . . . . . . . 34,224 10,934 12,674Change in other assets . . . . . . . . . . . . . . . . . . . . . . . . . . . . . . . . . . . — — 1,766
Net cash used in investing activities . . . . . . . . . . . . . . . . . . . . . . . (602,462) (586,985) (439,231)
Cash flows from financing activities:Purchases of treasury stock . . . . . . . . . . . . . . . . . . . . . . . . . . . . . . . (70,850) (450,011) (12,153)Dividends paid . . . . . . . . . . . . . . . . . . . . . . . . . . . . . . . . . . . . . . . . (68,561) (45,825) (27,339)Tax benefit related to stock-based compensation . . . . . . . . . . . . . . . . 1,105 1,087 —Proceeds from borrowings under line of credit . . . . . . . . . . . . . . . . . 142,500 274,000 —Repayment of borrowings under line of credit . . . . . . . . . . . . . . . . . (212,500) (154,000) —Line of credit issuance costs . . . . . . . . . . . . . . . . . . . . . . . . . . . . . . — (342) —Proceeds from exercise of stock options . . . . . . . . . . . . . . . . . . . . . . 2,050 1,946 43,474
Net cash provided by (used in) financing activities . . . . . . . . . . . . (206,256) (373,145) 3,982
Effect of foreign exchange rate changes on cash . . . . . . . . . . . . . . 543 (53) (1,203)
Net increase (decrease) in cash and cash equivalents . . . . . . . . . 4,049 (123,013) 24,027Cash and cash equivalents at beginning of year . . . . . . . . . . . . . . . . . . 13,385 136,398 112,371
Cash and cash equivalents at end of year . . . . . . . . . . . . . . . . . . . . . . . $ 17,434 $ 13,385 $ 136,398
Supplemental disclosure of cash flow information:Net cash paid during the year for:
Interest expense . . . . . . . . . . . . . . . . . . . . . . . . . . . . . . . . . . . . $ (1,808) $ (1,278) $ (418)Income taxes . . . . . . . . . . . . . . . . . . . . . . . . . . . . . . . . . . . . . . (176,281) (377,847) (156,709)
The accompanying notes are an integral part of these consolidated financial statements.
F-6
PATTERSON-UTI ENERGY, INC. AND SUBSIDIARIES
NOTES TO CONSOLIDATED FINANCIAL STATEMENTS
1. Description of Business and Summary of Significant Accounting Policies
A description of the business and basis of presentation follows:
Description of business — Patterson-UTI Energy, Inc., together with its wholly-owned subsidiaries, (collec-tively referred to herein as “Patterson-UTI” or the “Company”) is a leading provider of onshore contract drillingservices to major and independent oil and natural gas operators in Texas, New Mexico, Oklahoma, Arkansas,Louisiana, Mississippi, Colorado, Utah, Wyoming, Montana, North Dakota, South Dakota, Pennsylvania andWestern Canada. The Company provides pressure pumping services to oil and natural gas operators primarily in theAppalachian Basin. The Company provides drilling fluids, completion fluids and related services to oil and naturalgas operators offshore in the Gulf of Mexico and on land in Texas, Southeastern New Mexico, Oklahoma and theGulf Coast region of Louisiana. The Company owns and invests in oil and natural gas assets as a working interestowner. The Company’s oil and natural gas interests are located primarily in producing regions of West and SouthTexas, Southeastern New Mexico, Utah and Mississippi.
Basis of presentation — The consolidated financial statements include the accounts of Patterson-UTI and itswholly-owned subsidiaries. All significant intercompany accounts and transactions have been eliminated. TheCompany has no controlling financial interests in any entity that is not a wholly-owned subsidiary and which wouldrequire consolidation.
The U.S. dollar is the functional currency for all of the Company’s operations except for its Canadianoperations, which use the Canadian dollar as their functional currency. The effects of exchange rate changes arereflected in accumulated other comprehensive income, which is a separate component of stockholders’ equity.
A summary of the significant accounting policies follows:
Management estimates — The preparation of financial statements in conformity with accounting principlesgenerally accepted in the United States of America requires management to make estimates and assumptions thataffect the reported amounts of assets and liabilities and disclosure of contingent assets and liabilities at the date ofthe financial statements and the reported amounts of revenues and expenses during the reporting period. Actualresults could differ from such estimates.
Revenue recognition — Revenues are recognized when services are performed, except for revenues earnedunder turnkey contract drilling arrangements which are recognized using the completed contract method ofaccounting, as described below. The Company follows the percentage-of-completion method of accounting forfootage and daywork contract drilling arrangements. Under the percentage-of-completion method, managementestimates are relied upon in the determination of the total estimated expenses to be incurred drilling the well. Due tothe nature of turnkey contract drilling arrangements and risks therein, the Company follows the completed contractmethod of accounting for such arrangements. Under this method, all drilling revenues and expenses related to a wellin progress are deferred and recognized in the period the well is completed. Provisions for losses on incomplete orin-process wells are made when estimated total expenses are expected to exceed estimated total revenues. TheCompany recognizes reimbursements received from third parties for out-of-pocket expenses incurred as revenuesand accounts for these out-of-pocket expenses as direct costs.
Accounts receivable — Trade accounts receivable are recorded at the invoiced amount and do not bear interest.The allowance for doubtful accounts represents the Company’s estimate of the amount of probable credit lossesexisting in the Company’s accounts receivable. The Company reviews the adequacy of its allowance for doubtfulaccounts at least quarterly. Significant individual accounts receivable balances and balances which have beenoutstanding greater than 90 days are reviewed individually for collectibility. Account balances, when determined tobe uncollectible, are charged against the allowance.
F-7

Inventories — Inventories consist primarily of chemical products to be used in conjunction with theCompany’s drilling and completion fluids and pressure pumping activities. The inventories are stated at the lowerof cost or market, determined by the first-in, first-out method.
Property and equipment — Property and equipment is carried at cost less accumulated depreciation. Depre-ciation is provided on the straight-line method over the estimated useful lives. The method of depreciation does notchange when equipment becomes idle. The estimated useful lives, in years, are defined below.
Useful Lives
Drilling rigs and other equipment . . . . . . . . . . . . . . . . . . . . . . . . . . . . . . . . . . . . . . . . . 2-15
Buildings . . . . . . . . . . . . . . . . . . . . . . . . . . . . . . . . . . . . . . . . . . . . . . . . . . . . . . . . . . . 15-20
Other . . . . . . . . . . . . . . . . . . . . . . . . . . . . . . . . . . . . . . . . . . . . . . . . . . . . . . . . . . . . . . 3-12
Oil and natural gas properties — Working interests in oil and natural gas properties are accounted for usingthe successful efforts method of accounting. Under the successful efforts method of accounting, exploration costswhich result in the discovery of oil and natural gas reserves and all development costs are capitalized to theappropriate well. Exploration costs which do not result in discovering oil and natural gas reserves are charged toexpense when such determination is made. Costs of exploratory wells are initially capitalized to wells in progressuntil the outcome of the drilling is known. The Company reviews wells in progress quarterly to determine whethersufficient progress is being made in assessing the reserves and the economic operating viability of the respectiveprojects. If no progress has been made in assessing the reserves and the economic operating viability of a projectafter one year following the completion of drilling, the Company considers the costs of the well to be impaired andrecognizes the costs as expense. Geological and geophysical costs, including seismic costs, and costs to carry andretain undeveloped properties are charged to expense when incurred. The capitalized costs of both developmentaland successful exploratory type wells, consisting of lease and well equipment, lease acquisition costs and intangibledevelopment costs, are depreciated, depleted and amortized on the units-of-production method, based on engi-neering estimates of proved oil and natural gas reserves of each respective field. The Company reviews its proved oiland natural gas properties for impairment when an event occurs such as downward revisions in reserve estimates ordecreases in oil and natural gas prices. Proved properties are grouped by field and undiscounted cash flow estimatesare provided by an independent petroleum engineer. If the net book value of a field exceeds its undiscounted cashflow estimate, impairment expense is measured and recognized as the difference between its net book value anddiscounted cash flow. Unproved oil and natural gas properties are reviewed quarterly to determine impairment. TheCompany’s intent to drill, lease expiration and abandonment of area are considered. Assessment of impairment ismade on a lease-by-lease basis. If an unproved property is determined to be impaired, costs related to that propertyare expensed.
Goodwill — Goodwill is considered to have an indefinite useful economic life and is not amortized. As such,the Company assesses impairment of its goodwill annually or on an interim basis if events or circumstances indicatethat the fair value of the asset has decreased below its carrying value.
Depreciation, depletion and impairment — The following table summarizes depreciation, depletion andimpairment expense for 2007, 2006 and 2005 (in millions):
2007 2006 2005
Depreciation and impairment expense . . . . . . . . . . . . . . . . . . . . . . . . . $234.7 $186.6 $146.1
Depletion expense . . . . . . . . . . . . . . . . . . . . . . . . . . . . . . . . . . . . . . . . 14.5 9.8 10.3
Total . . . . . . . . . . . . . . . . . . . . . . . . . . . . . . . . . . . . . . . . . . . . . . . . $249.2 $196.4 $156.4
Maintenance and repairs — Maintenance and repairs are charged to expense when incurred. Renewals andbetterments which extend the life or improve existing property and equipment are capitalized.
Retirements — Upon disposition or retirement of property and equipment, the cost and related accumulateddepreciation are removed and any resulting gain or loss is reflected in the consolidated statement of income.
Net income per common share — The Company provides a dual presentation of its net income per commonshare in its Consolidated Statements of Income: Basic net income per common share (“Basic EPS”) and diluted net
F-8

income per common share (“Diluted EPS”). Basic EPS excludes dilution and is computed by dividing net incomeby the weighted average number of common shares outstanding during the period excluding nonvested restrictedstock. Diluted EPS is based on the weighted-average number of common shares outstanding plus the impact ofdilutive instruments, including stock options, warrants and restricted stock using the treasury stock method. Thefollowing table presents information necessary to calculate net income per share for the years ended December 31,2007, 2006 and 2005 as well as potentially dilutive securities excluded from the weighted average number of dilutedcommon shares outstanding, as their inclusion would have been anti-dilutive (in thousands, except per shareamounts):
2007 2006 2005
Net income . . . . . . . . . . . . . . . . . . . . . . . . . . . . . . . . . . . . . . . $438,639 $673,254 $372,740
Weighted average number of common shares outstandingexcluding nonvested restricted stock . . . . . . . . . . . . . . . . . . . 154,755 165,159 170,426
Basic net income per common share . . . . . . . . . . . . . . . . . . . . . $ 2.83 $ 4.08 $ 2.19
Weighted average number of common shares outstandingexcluding nonvested restricted stock . . . . . . . . . . . . . . . . . . . 154,755 165,159 170,426
Dilutive effect of stock options and restricted shares . . . . . . . . . 2,242 2,254 3,341
Weighted average number of diluted common sharesoutstanding. . . . . . . . . . . . . . . . . . . . . . . . . . . . . . . . . . . . . . 156,997 167,413 173,767
Diluted net income per common share . . . . . . . . . . . . . . . . . . . $ 2.79 $ 4.02 $ 2.15
Potentially dilutive securities excluded as anti-dilutive . . . . . . . . 2,460 800 —
Income taxes — The asset and liability method is used in accounting for income taxes. Under this method,deferred tax assets and liabilities are recognized for operating loss and tax credit carryforwards and for the future taxconsequences attributable to differences between the financial statement carrying amounts of existing assets andliabilities and their respective tax bases. Deferred tax assets and liabilities are measured using enacted tax ratesexpected to apply to taxable income in the year in which those temporary differences are expected to be recovered orsettled. The effect on deferred tax assets and liabilities of a change in tax rates is recognized in the results ofoperations in the period that includes the enactment date. If applicable, a valuation allowance is recorded to reducethe carrying amounts of deferred tax assets unless it is more likely than not that such assets will be realized.
The Company adopted FASB Interpretation No. 48, Accounting for Uncertainty in Income Taxes — aninterpretation of FASB Statement No. 109 (“FIN 48”) on January 1, 2007. FIN 48 clarifies the accounting foruncertainty in income taxes recognized in an enterprise’s financial statements and prescribes a recognitionthreshold and measurement attribute for the financial statement recognition and measurement of a tax positiontaken or expected to be taken in a tax return. As a result of the adoption of FIN 48 the Company reduced a reserve foran uncertain tax position with respect to a business combination that had originally been recorded as goodwill (seeNote 5). The impact of adjustments to reserves with respect to other uncertain tax positions was not material. Inconnection with the adoption of FIN 48, the Company established a policy to account for interest and penalties withrespect to income taxes as operating expenses.
Stock based compensation — Prior to January 1, 2006, the Company accounted for stock based compensationrelated to employee stock options and shares of restricted stock using the recognition and measurement principles ofAPB Opinion No. 25, Accounting for Stock Issued to Employees (“APB 25”), and related interpretations. Under theprovisions of APB 25, expense associated with stock option grants was measured based on the intrinsic value of theoption at the date of grant and expense associated with restricted stock grants was measured based on the fair valueof the shares at the date of grant. Reductions in compensation expense associated with awards that were forfeitedprior to vesting were recognized as those grants were forfeited. Effective January 1, 2006, the Company adopted theprovisions of Financial Accounting Standards Board Statement No. 123(R), Share-Based Payment(“SFAS 123(R)”). SFAS 123(R) requires the recognition of expense associated with the grant of both stockoptions and restricted stock based on the estimated fair value of the options or restricted stock at the date of grant,net of estimated forfeitures.
F-9
Statement of cash flows — For purposes of reporting cash flows, cash and cash equivalents include cash ondeposit and money market funds.
Recently Issued Accounting Standards — In September 2006, the FASB issued Statement No. 157, Fair ValueMeasurements (“FAS 157”). FAS 157 defines fair value, establishes a framework for measuring fair value ingenerally accepted accounting principles, and expands disclosures about fair value measurement. FAS 157 iseffective for financial statements issued for fiscal years beginning after November 15, 2007 and interim periodswithin those fiscal years. FAS 157 will be effective for the Company beginning in the quarter ending March 31,2008. The application of FAS 157 is not expected to have a material impact to the Company.
In February 2007, the FASB issued Statement No. 159, The Fair Value Option for Financial Assets andFinancial Liabilities Including an Amendment of FASB Statement No. 115 (“FAS 159”). FAS 159 permits entities tochoose to measure many financial instruments and certain other items at fair value. FAS 159 is effective as of thebeginning of an entity’s first fiscal year that begins after November 15, 2007 and will be effective for the Companybeginning in the quarter ending March 31, 2008. The application of FAS 159 is not expected to have a materialimpact to the Company.
In December 2007, the FASB issued Statement No. 141(R), Business Combinations (“FAS 141(R)”) andStatement No. 160, Noncontrolling Interests in Consolidated Financial Statements, an amendment of ARB No. 51(“FAS 160”). FAS 141(R) is a revision of Statement No. 141, Business Combinations, and calls for significantchanges from current practice in accounting for business combinations. FAS 141(R) is effective for businesscombinations for which the acquisition date is on or after the beginning of the first annual reporting periodbeginning on or after December 15, 2008. FAS 160 amends ARB 51 to establish accounting and reporting standardsfor the noncontrolling interest in a subsidiary and for the deconsolidation of a subsidiary. FAS 160 is effective forfiscal years beginning on or after December 15, 2008. Both FAS 141(R) and FAS 160 will be effective for theCompany beginning the quarter ending March 31, 2009. The application of FAS 141(R) and FAS 160 are notexpected to have a material impact to the Company.
Reclassifications — Certain reclassifications have been made to the 2006 and 2005 consolidated financialstatements in order for them to conform with the 2007 presentation.
2. Acquisitions
2007 Acquisitions
On October 9, 2007, the Company acquired three recently refurbished SCR electric land-based drilling rigsand spare drilling equipment for $29.0 million. The transaction was accounted for as an acquisition of assets and thepurchase price was allocated among the assets acquired based on their estimated fair market values.
2005 Acquisitions
Key Energy Services, Inc. — On January 15, 2005, the Company purchased land drilling assets from KeyEnergy Services, Inc. for $61.8 million. The assets included 25 active and 10 stacked land-based drilling rigs,related drilling equipment, yard facilities and a rig moving fleet consisting of approximately 45 trucks and100 trailers. The transaction was accounted for as an acquisition of assets and the purchase price was allocatedamong the assets acquired based on their estimated fair market values.
Other — On June 17, 2005, the Company acquired one land-based drilling rig for $3.6 million and onSeptember 29, 2005, the Company acquired five land-based drilling rigs and related drilling equipment for$8.2 million. The transactions were accounted for as acquisitions of assets and the purchase price was allocatedamong the assets acquired based on their estimated fair market values.
F-10
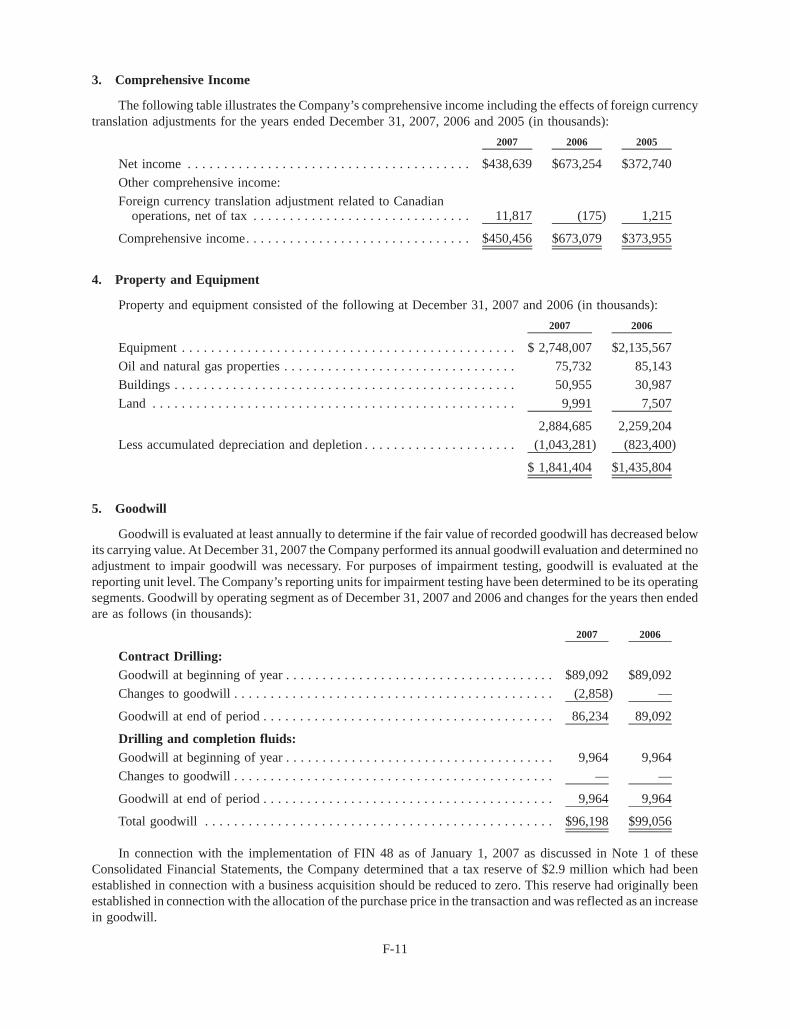
3. Comprehensive Income
The following table illustrates the Company’s comprehensive income including the effects of foreign currencytranslation adjustments for the years ended December 31, 2007, 2006 and 2005 (in thousands):
2007 2006 2005
Net income . . . . . . . . . . . . . . . . . . . . . . . . . . . . . . . . . . . . . . . $438,639 $673,254 $372,740
Other comprehensive income:
Foreign currency translation adjustment related to Canadianoperations, net of tax . . . . . . . . . . . . . . . . . . . . . . . . . . . . . . 11,817 (175) 1,215
Comprehensive income. . . . . . . . . . . . . . . . . . . . . . . . . . . . . . . $450,456 $673,079 $373,955
4. Property and Equipment
Property and equipment consisted of the following at December 31, 2007 and 2006 (in thousands):
2007 2006
Equipment . . . . . . . . . . . . . . . . . . . . . . . . . . . . . . . . . . . . . . . . . . . . . . $ 2,748,007 $2,135,567
Oil and natural gas properties . . . . . . . . . . . . . . . . . . . . . . . . . . . . . . . . 75,732 85,143
Buildings . . . . . . . . . . . . . . . . . . . . . . . . . . . . . . . . . . . . . . . . . . . . . . . 50,955 30,987
Land . . . . . . . . . . . . . . . . . . . . . . . . . . . . . . . . . . . . . . . . . . . . . . . . . . 9,991 7,507
2,884,685 2,259,204
Less accumulated depreciation and depletion . . . . . . . . . . . . . . . . . . . . . (1,043,281) (823,400)
$ 1,841,404 $1,435,804
5. Goodwill
Goodwill is evaluated at least annually to determine if the fair value of recorded goodwill has decreased belowits carrying value. At December 31, 2007 the Company performed its annual goodwill evaluation and determined noadjustment to impair goodwill was necessary. For purposes of impairment testing, goodwill is evaluated at thereporting unit level. The Company’s reporting units for impairment testing have been determined to be its operatingsegments. Goodwill by operating segment as of December 31, 2007 and 2006 and changes for the years then endedare as follows (in thousands):
2007 2006
Contract Drilling:Goodwill at beginning of year . . . . . . . . . . . . . . . . . . . . . . . . . . . . . . . . . . . . . $89,092 $89,092
Changes to goodwill . . . . . . . . . . . . . . . . . . . . . . . . . . . . . . . . . . . . . . . . . . . . (2,858) —
Goodwill at end of period . . . . . . . . . . . . . . . . . . . . . . . . . . . . . . . . . . . . . . . . 86,234 89,092
Drilling and completion fluids:Goodwill at beginning of year . . . . . . . . . . . . . . . . . . . . . . . . . . . . . . . . . . . . . 9,964 9,964
Changes to goodwill . . . . . . . . . . . . . . . . . . . . . . . . . . . . . . . . . . . . . . . . . . . . — —
Goodwill at end of period . . . . . . . . . . . . . . . . . . . . . . . . . . . . . . . . . . . . . . . . 9,964 9,964
Total goodwill . . . . . . . . . . . . . . . . . . . . . . . . . . . . . . . . . . . . . . . . . . . . . . . . $96,198 $99,056
In connection with the implementation of FIN 48 as of January 1, 2007 as discussed in Note 1 of theseConsolidated Financial Statements, the Company determined that a tax reserve of $2.9 million which had beenestablished in connection with a business acquisition should be reduced to zero. This reserve had originally beenestablished in connection with the allocation of the purchase price in the transaction and was reflected as an increasein goodwill.
F-11

6. Accrued Expenses
Accrued expenses consisted of the following at December 31, 2007 and 2006 (in thousands):
2007 2006
Salaries, wages, payroll taxes and benefits . . . . . . . . . . . . . . . . . . . . . . . . . . $ 33,816 $ 42,751
Workers’ compensation liability . . . . . . . . . . . . . . . . . . . . . . . . . . . . . . . . . . 70,989 69,330
Sales, use and other taxes . . . . . . . . . . . . . . . . . . . . . . . . . . . . . . . . . . . . . . 12,119 11,043
Insurance, other than workers’ compensation . . . . . . . . . . . . . . . . . . . . . . . . 16,308 13,328
Other . . . . . . . . . . . . . . . . . . . . . . . . . . . . . . . . . . . . . . . . . . . . . . . . . . . . . 3,602 9,011
$136,834 $145,463
7. Asset Retirement Obligation
Statement of Financial Accounting Standards No. 143, Accounting for Asset Retirement Obligations,(“SFAS 143”), requires that the Company record a liability for the estimated costs to be incurred in connectionwith the abandonment of oil and natural gas properties in the future. The following table describes the changes to theCompany’s asset retirement obligations during 2007 and 2006 (in thousands):
2007 2006
Balance at beginning of year . . . . . . . . . . . . . . . . . . . . . . . . . . . . . . . . . . . . . . . . $1,829 $1,725
Liabilities incurred . . . . . . . . . . . . . . . . . . . . . . . . . . . . . . . . . . . . . . . . . . . . . . . 276 154
Liabilities settled . . . . . . . . . . . . . . . . . . . . . . . . . . . . . . . . . . . . . . . . . . . . . . . . (862) (104)
Accretion expense . . . . . . . . . . . . . . . . . . . . . . . . . . . . . . . . . . . . . . . . . . . . . . . 61 54
Revision in estimated costs of plugging oil and natural gas wells . . . . . . . . . . . . . 289 —
Asset retirement obligation at end of year . . . . . . . . . . . . . . . . . . . . . . . . . . . . . . $1,593 $1,829
8. Borrowings Under Line of Credit
The Company has an unsecured revolving line of credit (“LOC”) with a maximum borrowing capacity of$375 million. Interest is paid on outstanding LOC balances at a floating rate ranging from LIBOR plus 0.625% to1.0% or the prime rate. Any outstanding borrowings must be repaid at maturity on December 16, 2009. Thisarrangement includes various fees, including a commitment fee on the average daily unused amount (0.15% atDecember 31, 2007). There are customary restrictions and covenants associated with the LOC. Financial covenantsprovide for a maximum debt to capitalization ratio and a minimum interest coverage ratio. The Company does notexpect that the restrictions and covenants will restrict its ability to operate or react to opportunities that might arise.As of December 31, 2007, the Company had outstanding borrowings of $50.0 million under the LOC and$59.4 million in letters of credit were outstanding. As a result, the Company had available borrowing capacity of$266 million at December 31, 2007. The weighted average interest rate on borrowings outstanding at December 31,2007 was 5.47%. The carrying value of borrowings outstanding under the LOC approximates fair value due to thefloating interest rate.
9. Commitments, Contingencies and Other Matters
Commitments — The Company maintains letters of credit in the aggregate amount of $59.4 million for thebenefit of various insurance companies as collateral for retrospective premiums and retained losses which maybecome payable under the terms of the underlying insurance contracts. These letters of credit are typically renewedannually. No amounts have been drawn under the letters of credit.
As of December 31, 2007, the Company has non-cancelable commitments to purchase approximately$83.0 million of equipment.
Contingencies — The Company’s contract services and oil and natural gas exploration and productionoperations are subject to inherent risks, including blowouts, cratering, fire and explosions which could result in
F-12

personal injury or death, suspended drilling operations, damage to, or destruction of equipment, damage toproducing formations and pollution or other environmental hazards.
As a protection against these hazards, the Company maintains general liability insurance coverage of$2.0 million per occurrence with $4.0 million of aggregate coverage and excess liability and umbrella coveragesup to $100 million per occurrence and in the aggregate. The Company maintains a $1.0 million per occurrencedeductible on its workers’ compensation insurance and its general liability insurance coverages.
The Company believes it is adequately insured for public liability and property damage to others with respectto its operations. However, such insurance may not be sufficient to protect the Company against liability for allconsequences of well disasters, extensive fire damage, or damage to the environment. The Company also carriesinsurance to cover physical damage to, or loss of, its rigs. However, it does not cover the full replacement cost of therigs and the Company does not carry insurance against loss of earnings resulting from such damage. There can be noassurance that such insurance coverage will always be available on terms that are satisfactory to the Company.
In November 2005, the Company discovered that its former Chief Financial Officer, Jonathan D. Nelson(“Nelson”), had fraudulently diverted approximately $77.5 million in Company funds for his own benefit. As aresult, the Audit Committee of the Board of Directors commenced an investigation into Nelson’s activities andretained independent counsel and independent forensic accountants to assist with the investigation. Nelson has beensentenced and is serving a term of imprisonment arising out of his embezzlement. A receiver was appointed to takecontrol of and liquidate the assets of Nelson. In May 2007, the court approved a plan of distribution for the assetsrecovered by the receiver. The Company expects to recover a total of approximately $44.5 million pursuant to theapproved plan, and has recognized this recovery in the Company’s consolidated statement of income in 2007, net ofprofessional fees incurred as a result of the embezzlement. As of December 31, 2007, the Company had receivedcash payments from the receiver of approximately $41.2 million, with the remaining $3.3 million of the expectedrecovery consisting of notes receivable, investments and other assets that have been or are expected to be transferredto the Company.
The Company is party to various legal proceedings arising in the normal course of its business. The Companydoes not believe that the outcome of these proceedings, either individually or in the aggregate, will have a materialadverse effect on its financial condition, results of operations or cash flows.
Other Matters — The Company has Change in Control Agreements with its Chairman of the Board, ChiefExecutive Officer, two Senior Vice Presidents and its General Counsel (the “Key Employees”). Each Change inControl Agreement generally has an initial term with automatic twelve month renewals unless the Company notifiesthe Key Employee at least ninety days before the end of such renewal period that the term will not be extended. If achange in control of the Company occurs during the term of the agreement and the Key Employee’s employment isterminated (i) by the Company other than for cause or other than automatically as a result of death, disability orretirement or (ii) by the Key Employee for good reason (as those terms are defined in the Change in ControlAgreements), then the Key Employee shall generally be entitled to, among other things,
• a bonus payment equal to the greater of the highest bonus paid after the Change in Control Agreement wasentered into and the average of the two annual bonuses earned in the two fiscal years immediately precedinga change in control (such bonus payment prorated for the portion of the fiscal year preceding the terminationdate);
• a payment equal to 2.5 times (in the case of the Chairman of the Board and Chief Executive Officer), 2 times(in the case of the Senior Vice Presidents) or 1.5 times (in the case of the General Counsel) of the sum of(i) the highest annual salary in effect for such Key Employee and (ii) the average of the three annual bonusesearned by the Key Employee for the three fiscal years preceding the termination date; and
• continued coverage under the Company’s welfare plans for up to three years (in the case of the Chairman ofthe Board and Chief Executive Officer) or two years (in the case of the Senior Vice Presidents and GeneralCounsel).
F-13

Each Change in Control Agreement provides the Key Employee with a full gross-up payment for any excisetaxes imposed on payments and benefits received under the Change in Control Agreements or otherwise, includingother taxes that may be imposed as a result of the gross-up payment.
10. Stockholders’ Equity
Cash Dividends — The Company paid cash dividends during the years ended December 31, 2007, 2006 and2005 as follows:
Per Share Total(In thousands)
2007:Paid on March 30, 2007 . . . . . . . . . . . . . . . . . . . . . . . . . . . . . . . . . . . . . . $0.08 $12,527
Paid on June 29, 2007 . . . . . . . . . . . . . . . . . . . . . . . . . . . . . . . . . . . . . . . 0.12 18,860
Paid on September 28, 2007 . . . . . . . . . . . . . . . . . . . . . . . . . . . . . . . . . . . 0.12 18,690
Paid on December 28, 2007 . . . . . . . . . . . . . . . . . . . . . . . . . . . . . . . . . . . 0.12 18,484
Total cash dividends declared and paid . . . . . . . . . . . . . . . . . . . . . . . . . . . $0.44 $68,561
2006:Paid on March 30, 2006 . . . . . . . . . . . . . . . . . . . . . . . . . . . . . . . . . . . . . . $0.04 $ 6,906
Paid on June 30, 2006 . . . . . . . . . . . . . . . . . . . . . . . . . . . . . . . . . . . . . . . 0.08 13,413
Paid on September 29, 2006 . . . . . . . . . . . . . . . . . . . . . . . . . . . . . . . . . . . 0.08 13,024
Paid on December 29, 2006 . . . . . . . . . . . . . . . . . . . . . . . . . . . . . . . . . . . 0.08 12,482
Total cash dividends declared and paid . . . . . . . . . . . . . . . . . . . . . . . . . . . $0.28 $45,825
2005:Paid on March 4, 2005. . . . . . . . . . . . . . . . . . . . . . . . . . . . . . . . . . . . . . . $0.04 $ 6,746
Paid on June 1, 2005 . . . . . . . . . . . . . . . . . . . . . . . . . . . . . . . . . . . . . . . . 0.04 6,790
Paid on September 1, 2005. . . . . . . . . . . . . . . . . . . . . . . . . . . . . . . . . . . . 0.04 6,904
Paid on December 1, 2005 . . . . . . . . . . . . . . . . . . . . . . . . . . . . . . . . . . . . 0.04 6,899
Total cash dividends declared and paid . . . . . . . . . . . . . . . . . . . . . . . . . . . $0.16 $27,339
On February 13, 2008, the Company’s Board of Directors approved a cash dividend on its common stock in theamount of $0.12 per share to be paid on March 28, 2008 to holders of record as of March 12, 2008. The amount andtiming of all future dividend payments, if any, is subject to the discretion of the Board of Directors and will dependupon business conditions, results of operations, financial condition, terms of the Company’s credit facilities andother factors.
The Company has granted restricted shares of the Company’s common stock (“Restricted Shares”) to certainemployees under the Patterson-UTI Energy, Inc. 1997 Long-Term Incentive Plan, as amended, and the Patterson-UTI Energy, Inc. 2005 Long-Term Incentive Plan. As required by SFAS 123(R), the Restricted Shares were valuedbased upon the market price of the Company’s common stock on the date of the grant. The restrictions on theseshares lapse at various dates through 2010.
On June 7, 2004, the Company’s Board of Directors authorized a stock buyback program (“2004 Program”) forthe purchase of up to $30 million of the Company’s outstanding common stock in open market or privatelynegotiated transactions. During 2004, the Company purchased 100,000 shares of its common stock under the 2004Program in the open market for approximately $1.5 million. During 2005, the Company purchased 355,000 sharesof its common stock under the 2004 Program in the open market for approximately $12.2 million. On March 27,2006, the Company’s Board of Directors increased the 2004 Program to allow for future purchases of up to$200 million of the Company’s outstanding common stock. During the second quarter of 2006, the Companycompleted the purchase of 6,704,800 shares of its common stock under the 2004 Program in the open market at acost of approximately $200 million. On August 2, 2006, the Company’s Board of Directors again increased the 2004
F-14

Program to allow for future purchases of up to $250 million of the Company’s outstanding common stock. Duringthe remainder of 2006, the Company purchased an additional 9,940,542 shares of its common stock under the 2004Program in the open market at a cost of approximately $250 million.
On August 1, 2007, the Company’s Board of Directors approved a new stock buyback program (“2007Program”), authorizing purchases of up to $250 million of the Company’s common stock in open market orprivately negotiated transactions. During the year ended December 31, 2007, the Company purchased3,308,850 shares of its common stock under the 2007 Program at a cost of approximately $70.4 million. As ofDecember 31, 2007, the Company is authorized to purchase approximately $180 million of the Company’soutstanding common stock under the 2007 Program. Shares purchased under the 2004 and 2007 stock buybackprograms have been accounted for as treasury stock.
Additionally, the Company purchased 20,269 shares of treasury stock from employees during 2007. Theseshares were purchased at fair market value upon the vesting of restricted stock to provide the employees with thefunds necessary to satisfy their respective tax withholding obligations. The total purchase price for these shares wasapproximately $496,000.
11. Stock-based Compensation
The Company adopted FASB 123(R) on January 1, 2006 and recognizes the cost of share-based paymentsunder the fair-value-based method. The Company uses share-based payments to compensate employees and non-employee directors. All awards have been equity instruments in the form of stock options or restricted stock awardsand have included both service and performance conditions. The Company issues shares of common stock whenvested stock option awards are exercised and when restricted stock awards are granted. For the year endedDecember 31, 2007, the Company recognized $19.4 million in stock-based compensation expense and a relatedincome tax benefit of approximately $6.7 million. For the year ended December 31, 2006, the Company recognized$16.3 million in stock-based compensation expense and a related income tax benefit of approximately $5.8 millionand recognized a benefit in the form of a cumulative effect of change in accounting principle associated with theadoption of FAS 123(R) of $1.1 million, with a related tax expense of $398,000.
During 2005, the Company’s shareholders approved the Patterson-UTI Energy, Inc. 2005 Long-TermIncentive Plan (the “2005 Plan”) and the Board of Directors adopted a resolution that no future grants wouldbe made under any of the Company’s other previously existing plans. The Company’s share-based compensationplans at December 31, 2007 follow:
Plan Name
SharesAuthorizedfor Grant
Options &Restricted
SharesOutstanding
SharesAvailablefor Grant
Patterson-UTI Energy, Inc. 2005 Long-Term Incentive Plan . . 6,250,000 3,079,250 2,283,045
Patterson-UTI Energy, Inc. Amended and Restated 1997Long-Term Incentive Plan, as amended (“1997 Plan”) . . . . — 4,903,337 —
Amended and Restated Patterson-UTI Energy, Inc. 2001Long-Term Incentive Plan (“2001 Plan”) . . . . . . . . . . . . . . — 669,747 —
Amended and Restated Non-Employee Director Stock OptionPlan of Patterson-UTI Energy, Inc. (“Non-EmployeeDirector Plan”) . . . . . . . . . . . . . . . . . . . . . . . . . . . . . . . . . — 120,000 —
Amended and Restated Patterson-UTI Energy, Inc. 1996Employee Stock Option Plan (“1996 Plan”) . . . . . . . . . . . . — 81,600 —
Patterson-UTI Energy, Inc., 1993 Incentive Stock Plan, asamended (“1993 Plan”) . . . . . . . . . . . . . . . . . . . . . . . . . . . — 39,300 —
A summary of the 2005 Plan follows:
• The Compensation Committee of the Board of Directors administers the plan.
• All employees including officers and directors are eligible for awards.
F-15

• The Compensation Committee determines the vesting schedule for awards. Awards typically vest over 1 yearfor non-employee directors and 3 to 4 years for employees.
• The Compensation Committee sets the term of awards and no option term can exceed 10 years.
• All options granted under the plan are granted with an exercise price equal to or greater than the fair marketvalue of the Company’s common stock at the time the option is granted.
• The plan provides for awards of incentive stock options, non-incentive stock options, tandem and free-standing stock appreciation rights, restricted stock awards, other stock unit awards, performance shareawards, performance unit awards and dividend equivalents. As of December 31, 2007, only non-incentivestock options and restricted stock awards had been granted under the plan.
Options granted under the 1997 Plan typically vest over three or five years as dictated by the CompensationCommittee. These options have terms of no more than ten years. All options were granted with an exercise priceequal to the fair market value of the related common stock at the time of grant. Restricted Stock Awards grantedunder the 1997 Plan typically vest over four years.
Options granted under the 2001 Plan typically vest over five years as dictated by the CompensationCommittee. These options have terms of no more than ten years. All options were granted with an exercise priceequal to the fair market value of the Company’s common stock at the time of grant.
Options granted under the Non-Employee Director Plan vest on the first anniversary of the option grant andhave a term of five years. All options were granted with an exercise price equal to the fair market value of the relatedcommon stock at the time of grant.
Options granted under the 1996 plan typically vest over one, four or five years as dictated by the CompensationCommittee. These options have terms of no more than ten years. All options were granted with an exercise priceequal to the fair market value of the Company’s common stock at the time of grant.
Options granted under the 1993 Plan typically vest over five years as dictated by the CompensationCommittee. These options have terms of no more than ten years. All options were granted with an exercise priceequal to the fair market value of the Company’s common stock at the time of grant.
Stock Options — The Company accounted for all stock options under the intrinsic value method prior toJanuary 1, 2006. Accordingly, no compensation expense was recognized in periods prior to 2006 for stock optionsbecause they had no intrinsic value when granted as exercise prices were equal to the grant date market value of therelated common stock. The Modified Prospective Application (“MPA”) method was applied to transition from theintrinsic value method to the fair-value-based method for stock options. The effects of the application of the MPAmethod follow:
• Previously reported amounts and disclosures are not affected.
• Compensation cost, net of estimated forfeitures for the unvested portion of awards outstanding at January 1,2006, is recognized under the fair-value-based method as the awards vest. Compensation cost is based on thegrant-date estimated fair value of stock options as calculated for the Company’s previously reported proforma disclosures under FASB Statement No. 123, Accounting for Stock-Based Compensation (“FAS 123”).
• The fair-value based method is applied to new awards and to any awards outstanding at January 1, 2006 thatare modified, repurchased or cancelled after that date.
F-16

The Company estimates grant date fair values of stock options using the Black-Scholes-Merton valuationmodel (“Black-Scholes”), except for stock options granted prior to 1996 that are not subject to FAS 123(R) and werenot subject to FAS 123 pro forma disclosures. Volatility assumptions are based on the historic volatility of theCompany’s common stock over the most recent period equal to the expected term of the options as of the date theoptions were granted. The expected term assumptions are based on the Company’s experience with respect toemployee stock option activity. Dividend yield assumptions are based on the expected dividends at the time theoptions were granted. The risk-free interest rate assumptions are determined by reference to United States Treasuryyields. Weighted-average assumptions used to estimate grant date fair values for stock options granted in the yearsended December 31, 2007, 2006 and 2005 follow:
2007 2006 2005
Volatility . . . . . . . . . . . . . . . . . . . . . . . . . . . . . . . . . . . . . . . . . . . . . . . . . 36.37% 33.18% 26.95%
Expected term (in years) . . . . . . . . . . . . . . . . . . . . . . . . . . . . . . . . . . . . . . 4.00 4.00 4.00
Dividend yield . . . . . . . . . . . . . . . . . . . . . . . . . . . . . . . . . . . . . . . . . . . . . 1.97% 1.09% 0.65%
Risk-free interest rate . . . . . . . . . . . . . . . . . . . . . . . . . . . . . . . . . . . . . . . . 4.55% 4.87% 3.84%
Stock option activity for the year ended December 31, 2007 follows:
Shares
Weighted-AverageExercise
Price
Outstanding at beginning of year . . . . . . . . . . . . . . . . . . . . . . . . . . . . . . . . . 6,575,096 $16.18
Granted. . . . . . . . . . . . . . . . . . . . . . . . . . . . . . . . . . . . . . . . . . . . . . . . . . . . 1,060,000 $23.92
Exercised . . . . . . . . . . . . . . . . . . . . . . . . . . . . . . . . . . . . . . . . . . . . . . . . . . (229,812) $ 8.92
Forfeited . . . . . . . . . . . . . . . . . . . . . . . . . . . . . . . . . . . . . . . . . . . . . . . . . . . (2,183) $14.64
Expired . . . . . . . . . . . . . . . . . . . . . . . . . . . . . . . . . . . . . . . . . . . . . . . . . . . . (17) $14.64
Outstanding at end of year . . . . . . . . . . . . . . . . . . . . . . . . . . . . . . . . . . . . . . 7,403,084 $17.52
Exercisable at end of year . . . . . . . . . . . . . . . . . . . . . . . . . . . . . . . . . . . . . . 5,879,750 $15.54
Options outstanding at December 31, 2007 have an aggregate intrinsic value of approximately $29.8 millionand a weighted-average remaining contractual term of 5.9 years. Options exercisable at December 31, 2007 have anaggregate intrinsic value of approximately $29.8 million and a weighted-average remaining contractual term of5.1 years. Additional information with respect to options granted, vested and exercised during the years endedDecember 31, 2007, 2006 and 2005 follows:
2007 2006 2005
Weighted-average grant-date fair value of stock options granted (pershare) . . . . . . . . . . . . . . . . . . . . . . . . . . . . . . . . . . . . . . . . . . . . . . $ 7.09 $ 8.62 $ 6.33
Grant-date fair value of stock options vested during the year (inthousands) . . . . . . . . . . . . . . . . . . . . . . . . . . . . . . . . . . . . . . . . . . . $5,613 $6,900 $15,738
Aggregate intrinsic value of stock options exercised (in thousands) . . . $3,186 $3,377 $73,467
As of December 31, 2007, options to purchase 1,523,334 shares were outstanding and not vested. All of thesenon-vested options are expected to ultimately vest. Additional information as of December 31, 2007 with respect tothese options that are expected to vest follows:
Aggregate intrinsic value . . . . . . . . . . . . . . . . . . . . . . . . . . . . . . . . . . . . . . . . . . . . . . $ 0
Weighted-average remaining contractual term . . . . . . . . . . . . . . . . . . . . . . . . . . . . . . . 9.03 years
Weighted-average remaining expected term. . . . . . . . . . . . . . . . . . . . . . . . . . . . . . . . . 3.03 years
Weighted-average remaining vesting period . . . . . . . . . . . . . . . . . . . . . . . . . . . . . . . . 1.97 years
Unrecognized compensation cost . . . . . . . . . . . . . . . . . . . . . . . . . . . . . . . . . . . . . . . . $9.3 million
F-17

Restricted Stock — Under all restricted stock awards to date, shares were issued when granted, nonvestedshares are subject to forfeiture for failure to fulfill service conditions and, in certain cases, performance conditions.Nonforfeitable dividends are paid on nonvested restricted shares. Restricted stock awards prior to January 1, 2006were valued at the grant date market value of the underlying common stock, recognized as contra equity deferredcompensation and amortized to expense under the “graded-vesting” method. Implementation of FAS 123(R) did notchange the accounting for the Company’s nonvested stock awards, except as follows:
• Prior to January 1, 2006, forfeitures were recognized as they occurred;
• From January 1, 2006 forward, forfeitures are estimated in the determination of periodic compensation cost;
• Contra equity deferred compensation was reversed against paid-in-capital at January 1, 2006; and
• Compensation expense is recognized as attributed to each period.
The Company uses the “graded-vesting” attribution method to determine periodic compensation cost fromrestricted stock awards.
Restricted stock activity for the year ended December 31, 2007 follows:
Shares
Weighted-Average GrantDate Fair Value
Nonvested restricted stock outstanding at beginning of year . . . . . . . . . . 1,188,200 $25.92
Granted . . . . . . . . . . . . . . . . . . . . . . . . . . . . . . . . . . . . . . . . . . . . . . . . 601,150 $24.60
Vested . . . . . . . . . . . . . . . . . . . . . . . . . . . . . . . . . . . . . . . . . . . . . . . . . (197,645) $19.37
Forfeited . . . . . . . . . . . . . . . . . . . . . . . . . . . . . . . . . . . . . . . . . . . . . . . (101,555) $26.51
Nonvested restricted stock outstanding at end of year . . . . . . . . . . . . . . 1,490,150 $26.22
As of December 31, 2007, approximately 1,440,000 shares of nonvested restricted stock outstanding areexpected to vest. Additional information as of December 31, 2007 with respect to these shares that are expected tovest follows:
Aggregate intrinsic value . . . . . . . . . . . . . . . . . . . . . . . . . . . . . . . . . . . . . . . . . . . . . $28.1 million
Weighted-average remaining vesting period. . . . . . . . . . . . . . . . . . . . . . . . . . . . . . . . 1.97 years
Unrecognized compensation cost . . . . . . . . . . . . . . . . . . . . . . . . . . . . . . . . . . . . . . . $16.5 million
Dividends on Equity Awards — Nonforfeitable dividends paid on equity awards are recognized as follows:
• Dividends are recognized as reductions of retained earnings for the portion of equity awards expected to vest.
• Dividends are recognized as additional compensation cost for the portion of equity awards that are notexpected to vest or that ultimately do not vest.
Vesting expectations, in regard to these dividend payments, correspond with forfeiture assumptions used torecognize compensation cost.
F-18

Prior Period Pro Forma Disclosures — Prior to January 1, 2006, the Company accounted for share-basedcompensation under the intrinsic value method. Other than the restricted stock discussed above, no additional share-based compensation expense was reflected in earnings prior to January 1, 2006 since the exercise price was equal tothe grant-date market value of the underlying common stock for all stock options granted prior to that date. Theeffect of share-based compensation, as if the Company had applied the fair-value-based method proscribed byFAS 123, on net income and earnings per share for the year ended December 31, 2005 is as follows (in thousands,except per share amounts):
2005
Net income, as reported . . . . . . . . . . . . . . . . . . . . . . . . . . . . . . . . . . . . . . . . . . . . . . . . . $372,740
Add back: Share-based employee compensation cost, net of related tax effects, includedin net income as reported . . . . . . . . . . . . . . . . . . . . . . . . . . . . . . . . . . . . . . . . . . . . . . 1,795
Deduct: Share-based employee compensation cost, net of related tax effects, that wouldhave been included in net income if the fair-value-based method had been applied toall awards. . . . . . . . . . . . . . . . . . . . . . . . . . . . . . . . . . . . . . . . . . . . . . . . . . . . . . . . . . (11,119)
Pro-forma net income . . . . . . . . . . . . . . . . . . . . . . . . . . . . . . . . . . . . . . . . . . . . . . . . . . . $363,416
Net income per common share:
Basic, as reported . . . . . . . . . . . . . . . . . . . . . . . . . . . . . . . . . . . . . . . . . . . . . . . . . . . . . . $ 2.19
Basic, pro-forma . . . . . . . . . . . . . . . . . . . . . . . . . . . . . . . . . . . . . . . . . . . . . . . . . . . . . . $ 2.13
Diluted, as reported . . . . . . . . . . . . . . . . . . . . . . . . . . . . . . . . . . . . . . . . . . . . . . . . . . . . $ 2.15
Diluted, pro-forma . . . . . . . . . . . . . . . . . . . . . . . . . . . . . . . . . . . . . . . . . . . . . . . . . . . . . $ 2.11
12. Leases
The Company incurred rent expense of $33.9 million, $31.8 million and $22.5 million, for the years 2007,2006 and 2005, respectively. Rent expense is primarily related to short-term equipment rentals that are passedthrough to customers. The Company’s obligations under non-cancelable operating lease agreements are notmaterial to the Company’s operations or cash flows.
13. Income Taxes
The Company adopted FASB Interpretation No. 48, Accounting for Uncertainty in Income Taxes — aninterpretation of FASB Statement No. 109 (“FIN 48”), on January 1, 2007. FIN 48 clarifies the accounting foruncertainty in income taxes recognized in an enterprise’s financial statements and prescribes a recognitionthreshold and measurement attribute for the financial statement recognition and measurement of a tax positiontaken or expected to be taken in a tax return. As a result of the adoption of FIN 48 the Company reduced a reservethat had been established for an uncertain tax position that was taken with respect to a business combination. Thereserve had originally been recorded as goodwill (see Note 5). The impact of adjustments to reserves with respect toother uncertain tax positions was not material. As of December 31, 2007, the Company had no unrecognized taxbenefits. In connection with the adoption of FIN 48, the Company established a policy to account for interest andpenalties related to uncertain income tax positions as operating expenses. As of December 31, 2007, the tax yearsended December 31, 2004 through December 31, 2006 are open for examination by U.S. taxing authorities. As ofDecember 31, 2007, the tax years ended December 31, 2003 through December 31, 2006 are open for examinationby Canadian taxing authorities.
F-19
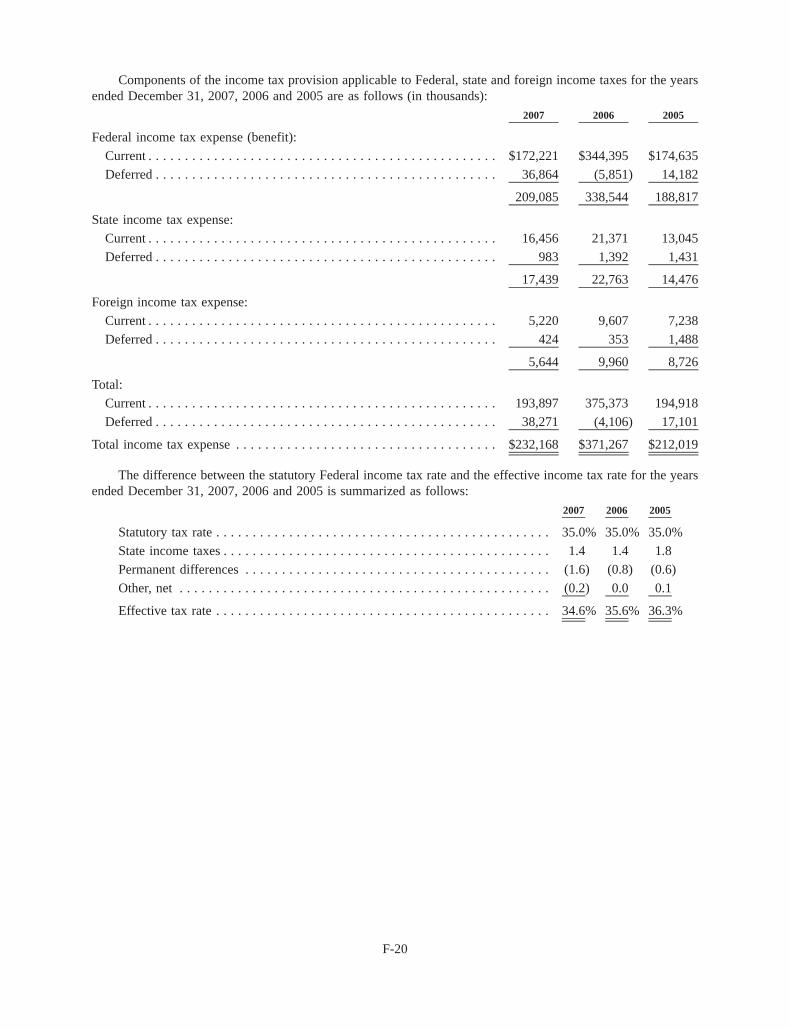
Components of the income tax provision applicable to Federal, state and foreign income taxes for the yearsended December 31, 2007, 2006 and 2005 are as follows (in thousands):
2007 2006 2005
Federal income tax expense (benefit):
Current . . . . . . . . . . . . . . . . . . . . . . . . . . . . . . . . . . . . . . . . . . . . . . . . $172,221 $344,395 $174,635
Deferred . . . . . . . . . . . . . . . . . . . . . . . . . . . . . . . . . . . . . . . . . . . . . . . 36,864 (5,851) 14,182
209,085 338,544 188,817
State income tax expense:
Current . . . . . . . . . . . . . . . . . . . . . . . . . . . . . . . . . . . . . . . . . . . . . . . . 16,456 21,371 13,045
Deferred . . . . . . . . . . . . . . . . . . . . . . . . . . . . . . . . . . . . . . . . . . . . . . . 983 1,392 1,431
17,439 22,763 14,476
Foreign income tax expense:
Current . . . . . . . . . . . . . . . . . . . . . . . . . . . . . . . . . . . . . . . . . . . . . . . . 5,220 9,607 7,238
Deferred . . . . . . . . . . . . . . . . . . . . . . . . . . . . . . . . . . . . . . . . . . . . . . . 424 353 1,488
5,644 9,960 8,726
Total:
Current . . . . . . . . . . . . . . . . . . . . . . . . . . . . . . . . . . . . . . . . . . . . . . . . 193,897 375,373 194,918
Deferred . . . . . . . . . . . . . . . . . . . . . . . . . . . . . . . . . . . . . . . . . . . . . . . 38,271 (4,106) 17,101
Total income tax expense . . . . . . . . . . . . . . . . . . . . . . . . . . . . . . . . . . . . $232,168 $371,267 $212,019
The difference between the statutory Federal income tax rate and the effective income tax rate for the yearsended December 31, 2007, 2006 and 2005 is summarized as follows:
2007 2006 2005
Statutory tax rate . . . . . . . . . . . . . . . . . . . . . . . . . . . . . . . . . . . . . . . . . . . . . . 35.0% 35.0% 35.0%
State income taxes . . . . . . . . . . . . . . . . . . . . . . . . . . . . . . . . . . . . . . . . . . . . . 1.4 1.4 1.8
Permanent differences . . . . . . . . . . . . . . . . . . . . . . . . . . . . . . . . . . . . . . . . . . (1.6) (0.8) (0.6)
Other, net . . . . . . . . . . . . . . . . . . . . . . . . . . . . . . . . . . . . . . . . . . . . . . . . . . . (0.2) 0.0 0.1
Effective tax rate . . . . . . . . . . . . . . . . . . . . . . . . . . . . . . . . . . . . . . . . . . . . . . 34.6% 35.6% 36.3%
F-20

The tax effect of significant temporary differences representing deferred tax assets and liabilities and changestherein were as follows (in thousands):
December31,
2007Net
Change
December31,
2006Net
Change
December31,
2005Net
Change
December31,
2004
Deferred tax assets:
Current:
Federal net operating losscarryforwards . . . . . . . . $ 374 $ (1,496) $ 1,870 $ — $ 1,870 $ — $ 1,870
Workers’ compensationallowance . . . . . . . . . . . 26,586 223 26,363 6,902 19,461 4,584 14,877
Embezzlement costs . . . . . . 660 (13,634) 14,294 14,294 — — —
Other . . . . . . . . . . . . . . . . 18,404 3,903 14,501 3,137 11,364 4,386 6,978
46,024 (11,004) 57,028 24,333 32,695 8,970 23,725
Non-current:
Federal net operating losscarryforwards . . . . . . . . — (374) 374 (1,871) 2,245 (1,870) 4,115
AMT credit . . . . . . . . . . . . 118 — 118 — 118 — 118
Federal benefit of foreigndeferred tax liabilities . . . 8,973 424 8,549 353 8,196 1,488 6,708
Federal benefit of statedeferred tax liabilities . . . 5,427 735 4,692 460 4,232 717 3,515
Embezzlement costs . . . . . . — — — — — (22,178) 22,178
Other . . . . . . . . . . . . . . . . 9,999 2,890 7,109 6,172 937 174 763
24,517 3,675 20,842 5,114 15,728 (21,669) 37,397
Total deferred tax assets . . . . . . 70,541 (7,329) 77,870 29,447 48,423 (12,699) 61,122
Deferred tax liabilities:
Current:
Other . . . . . . . . . . . . . . . . (10,654) (2,492) (8,161) (1,848) (6,313) 1,421 (7,734)
Non-current:
Property and equipmentbasis difference . . . . . . . (231,965) (28,466) (203,500) (23,775) (179,725) (6,381) (173,344)
Other . . . . . . . . . . . . . . . . (12,042) (6,741) (5,301) (110) (5,191) (663) (4,528)
(244,007) (35,207) (208,801) (23,885) (184,916) (7,044) (177,872)
Total deferred tax liabilities . . . . (254,661) (37,699) (216,962) (25,733) (191,229) (5,623) (185,606)
Net deferred tax liability . . . . . . $(184,120) $(45,028) $(139,092) $ 3,714 $(142,806) $(18,322) $(124,484)
In assessing the realizability of deferred tax assets, management considers whether it is more likely than notthat some portion or all of the deferred tax assets will not be realized. The ultimate realization of deferred tax assetsis dependent upon the generation of future taxable income during the periods in which those temporary differencesbecome deductible. Management considers the scheduled reversal of deferred tax liabilities, projected futuretaxable income and tax planning strategies in making this assessment. The Company expects the deferred tax assetsat December 31, 2007 to be realized as a result of the reversal during the carryforward period of existing taxabletemporary differences giving rise to deferred tax liabilities and the generation of taxable income in the carryforwardperiod; therefore, no valuation allowance is necessary.
Management deducted accumulated net embezzlement losses in the Company’s 2005 tax returns, whichcorresponds with the period in which the embezzlement was detected.
F-21

Other deferred tax assets consist primarily of various allowance accounts and tax deferred expenses expectedto generate future tax benefit of approximately $28 million. Other deferred tax liabilities consist primarily ofreceivables from insurance companies and tax deferred income not yet recognized for tax purposes.
For tax purposes, the Company has Federal net operating loss carryforwards of approximately $374,000available at December 31, 2007. The Company has alternative minimum tax credit carryforwards of approximately$118,000 available at December 31, 2007. The net operating loss carryforwards, if unused, are scheduled to expirein 2019. The alternative minimum tax credit may be carried forward indefinitely.
14. Employee Benefits
The Company maintains a 401(k) plan for all eligible employees. The Company’s operating results includeexpenses of approximately $4.2 million in 2007, $3.1 million in 2006 and $2.7 million in 2005 for the Company’scontributions to the plan.
15. Business Segments
The Company’s revenues, operating profits and identifiable assets are primarily attributable to four businesssegments: (i) contract drilling of oil and natural gas wells, (ii) pressure pumping services, (iii) drilling andcompletion fluids services to operators in the oil and natural gas industry, and (iv) the exploration, development,acquisition and production of oil and natural gas. Each of these segments represents a distinct type of business basedupon the type and nature of services and products offered. These segments have separate management teams whichreport to the Company’s chief operating decision maker and have distinct and identifiable revenues and expenses.
Contract Drilling — The Company markets its contract drilling services to major and independent oil andnatural gas operators. As of December 31, 2007, the Company had 350 currently marketable land-based drillingrigs, of which 107 of the drilling rigs were based in the Permian Basin region, 51 in South Texas, 42 in the Ark-La-Tex region and Mississippi, 75 in the Mid-Continent region, 52 in the Rocky Mountain region, 3 in the AppalachianBasin and 20 in Western Canada.
Pressure Pumping — The Company provides pressure pumping services primarily in the Appalachian Basin.Pressure pumping services consist primarily of well stimulation and cementing for the completion of new wells andremedial work on existing wells. Well stimulation involves processes inside a well designed to enhance the flow ofoil, natural gas, or other desired substances from the well. Cementing is the process of inserting material betweenthe hole and the pipe to center and stabilize the pipe in the hole.
Drilling and Completion Fluids — The Company provides drilling fluids, completion fluids and relatedservices to oil and natural gas operators offshore in the Gulf of Mexico and on land in Texas, Southeastern NewMexico, Oklahoma and the Gulf Coast region of Louisiana. Drilling and completion fluids are used by oil andnatural gas operators during the drilling process to control pressure when drilling oil and natural gas wells.
Oil and Natural Gas — The Company has been engaged in the development, exploration, acquisition andproduction of oil and natural gas. Through October 31, 2007, the Company served as operator with respect to severalproperties and was actively involved in the development, exploration, acquisition and production of oil and naturalgas. Effective November 1, 2007 the Company sold the related operations portion of its exploration and productionbusiness. The Company continues to own and invest in oil and natural gas assets as a working interest owner. TheCompany’s oil and natural gas interest are located primarily in producing regions of West and south Texas,Southeastern New Mexico, Utah and Mississippi.
F-22
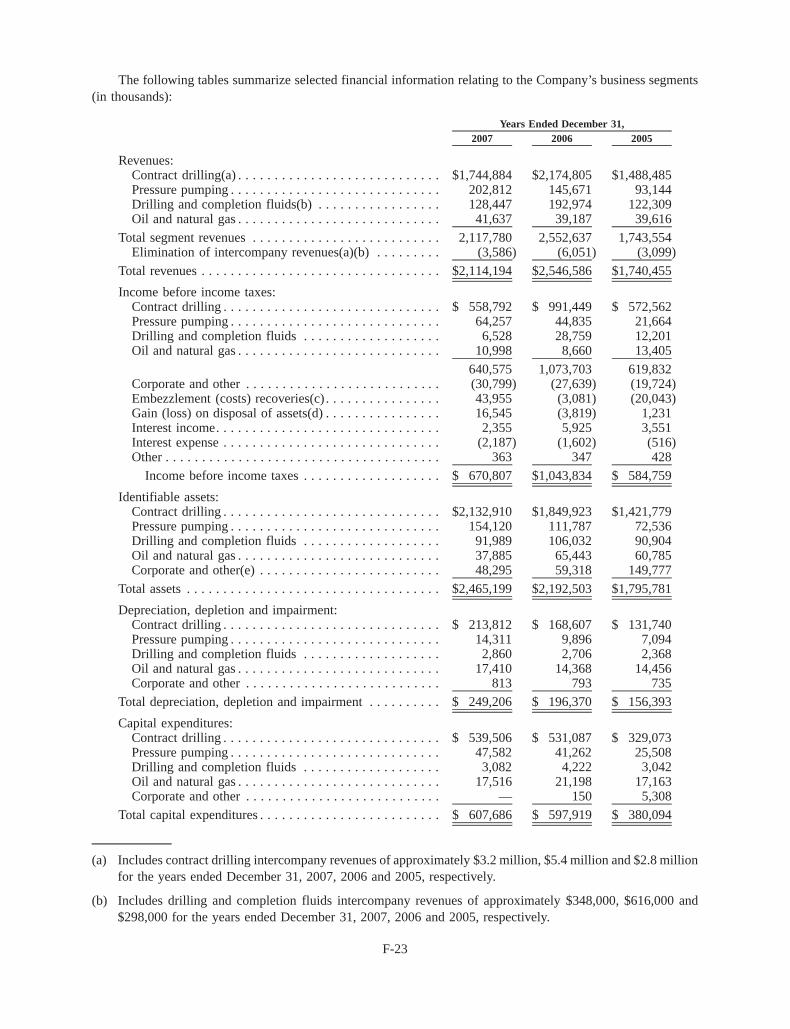
The following tables summarize selected financial information relating to the Company’s business segments(in thousands):
2007 2006 2005Years Ended December 31,
Revenues:Contract drilling(a) . . . . . . . . . . . . . . . . . . . . . . . . . . . . $1,744,884 $2,174,805 $1,488,485Pressure pumping . . . . . . . . . . . . . . . . . . . . . . . . . . . . . 202,812 145,671 93,144Drilling and completion fluids(b) . . . . . . . . . . . . . . . . . 128,447 192,974 122,309Oil and natural gas . . . . . . . . . . . . . . . . . . . . . . . . . . . . 41,637 39,187 39,616
Total segment revenues . . . . . . . . . . . . . . . . . . . . . . . . . . 2,117,780 2,552,637 1,743,554Elimination of intercompany revenues(a)(b) . . . . . . . . . (3,586) (6,051) (3,099)
Total revenues . . . . . . . . . . . . . . . . . . . . . . . . . . . . . . . . . $2,114,194 $2,546,586 $1,740,455
Income before income taxes:Contract drilling . . . . . . . . . . . . . . . . . . . . . . . . . . . . . . $ 558,792 $ 991,449 $ 572,562Pressure pumping . . . . . . . . . . . . . . . . . . . . . . . . . . . . . 64,257 44,835 21,664Drilling and completion fluids . . . . . . . . . . . . . . . . . . . 6,528 28,759 12,201Oil and natural gas . . . . . . . . . . . . . . . . . . . . . . . . . . . . 10,998 8,660 13,405
640,575 1,073,703 619,832Corporate and other . . . . . . . . . . . . . . . . . . . . . . . . . . . (30,799) (27,639) (19,724)Embezzlement (costs) recoveries(c) . . . . . . . . . . . . . . . . 43,955 (3,081) (20,043)Gain (loss) on disposal of assets(d) . . . . . . . . . . . . . . . . 16,545 (3,819) 1,231Interest income. . . . . . . . . . . . . . . . . . . . . . . . . . . . . . . 2,355 5,925 3,551Interest expense . . . . . . . . . . . . . . . . . . . . . . . . . . . . . . (2,187) (1,602) (516)Other . . . . . . . . . . . . . . . . . . . . . . . . . . . . . . . . . . . . . . 363 347 428
Income before income taxes . . . . . . . . . . . . . . . . . . . $ 670,807 $1,043,834 $ 584,759
Identifiable assets:Contract drilling . . . . . . . . . . . . . . . . . . . . . . . . . . . . . . $2,132,910 $1,849,923 $1,421,779Pressure pumping . . . . . . . . . . . . . . . . . . . . . . . . . . . . . 154,120 111,787 72,536Drilling and completion fluids . . . . . . . . . . . . . . . . . . . 91,989 106,032 90,904Oil and natural gas . . . . . . . . . . . . . . . . . . . . . . . . . . . . 37,885 65,443 60,785Corporate and other(e) . . . . . . . . . . . . . . . . . . . . . . . . . 48,295 59,318 149,777
Total assets . . . . . . . . . . . . . . . . . . . . . . . . . . . . . . . . . . . $2,465,199 $2,192,503 $1,795,781
Depreciation, depletion and impairment:Contract drilling . . . . . . . . . . . . . . . . . . . . . . . . . . . . . . $ 213,812 $ 168,607 $ 131,740Pressure pumping . . . . . . . . . . . . . . . . . . . . . . . . . . . . . 14,311 9,896 7,094Drilling and completion fluids . . . . . . . . . . . . . . . . . . . 2,860 2,706 2,368Oil and natural gas . . . . . . . . . . . . . . . . . . . . . . . . . . . . 17,410 14,368 14,456Corporate and other . . . . . . . . . . . . . . . . . . . . . . . . . . . 813 793 735
Total depreciation, depletion and impairment . . . . . . . . . . $ 249,206 $ 196,370 $ 156,393
Capital expenditures:Contract drilling . . . . . . . . . . . . . . . . . . . . . . . . . . . . . . $ 539,506 $ 531,087 $ 329,073Pressure pumping . . . . . . . . . . . . . . . . . . . . . . . . . . . . . 47,582 41,262 25,508Drilling and completion fluids . . . . . . . . . . . . . . . . . . . 3,082 4,222 3,042Oil and natural gas . . . . . . . . . . . . . . . . . . . . . . . . . . . . 17,516 21,198 17,163Corporate and other . . . . . . . . . . . . . . . . . . . . . . . . . . . — 150 5,308
Total capital expenditures . . . . . . . . . . . . . . . . . . . . . . . . . $ 607,686 $ 597,919 $ 380,094
(a) Includes contract drilling intercompany revenues of approximately $3.2 million, $5.4 million and $2.8 millionfor the years ended December 31, 2007, 2006 and 2005, respectively.
(b) Includes drilling and completion fluids intercompany revenues of approximately $348,000, $616,000 and$298,000 for the years ended December 31, 2007, 2006 and 2005, respectively.
F-23
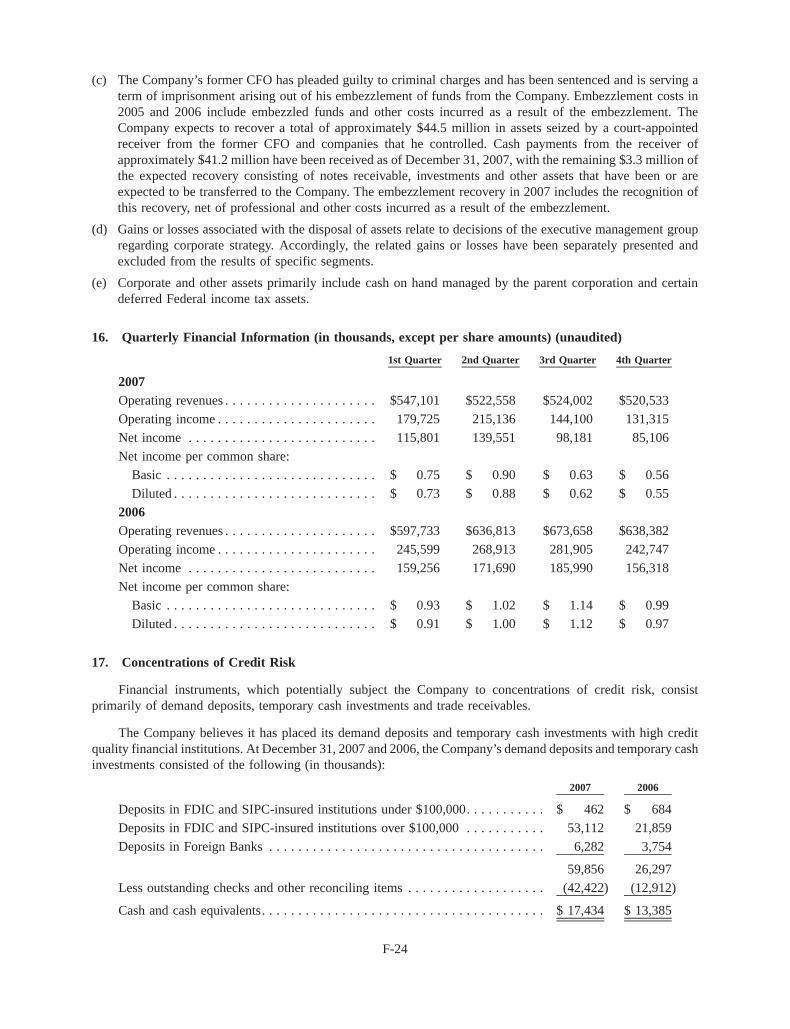
(c) The Company’s former CFO has pleaded guilty to criminal charges and has been sentenced and is serving aterm of imprisonment arising out of his embezzlement of funds from the Company. Embezzlement costs in2005 and 2006 include embezzled funds and other costs incurred as a result of the embezzlement. TheCompany expects to recover a total of approximately $44.5 million in assets seized by a court-appointedreceiver from the former CFO and companies that he controlled. Cash payments from the receiver ofapproximately $41.2 million have been received as of December 31, 2007, with the remaining $3.3 million ofthe expected recovery consisting of notes receivable, investments and other assets that have been or areexpected to be transferred to the Company. The embezzlement recovery in 2007 includes the recognition ofthis recovery, net of professional and other costs incurred as a result of the embezzlement.
(d) Gains or losses associated with the disposal of assets relate to decisions of the executive management groupregarding corporate strategy. Accordingly, the related gains or losses have been separately presented andexcluded from the results of specific segments.
(e) Corporate and other assets primarily include cash on hand managed by the parent corporation and certaindeferred Federal income tax assets.
16. Quarterly Financial Information (in thousands, except per share amounts) (unaudited)
1st Quarter 2nd Quarter 3rd Quarter 4th Quarter
2007Operating revenues . . . . . . . . . . . . . . . . . . . . . $547,101 $522,558 $524,002 $520,533
Operating income . . . . . . . . . . . . . . . . . . . . . . 179,725 215,136 144,100 131,315
Net income . . . . . . . . . . . . . . . . . . . . . . . . . . 115,801 139,551 98,181 85,106
Net income per common share:
Basic . . . . . . . . . . . . . . . . . . . . . . . . . . . . . $ 0.75 $ 0.90 $ 0.63 $ 0.56
Diluted . . . . . . . . . . . . . . . . . . . . . . . . . . . . $ 0.73 $ 0.88 $ 0.62 $ 0.55
2006Operating revenues . . . . . . . . . . . . . . . . . . . . . $597,733 $636,813 $673,658 $638,382
Operating income . . . . . . . . . . . . . . . . . . . . . . 245,599 268,913 281,905 242,747
Net income . . . . . . . . . . . . . . . . . . . . . . . . . . 159,256 171,690 185,990 156,318
Net income per common share:
Basic . . . . . . . . . . . . . . . . . . . . . . . . . . . . . $ 0.93 $ 1.02 $ 1.14 $ 0.99
Diluted . . . . . . . . . . . . . . . . . . . . . . . . . . . . $ 0.91 $ 1.00 $ 1.12 $ 0.97
17. Concentrations of Credit Risk
Financial instruments, which potentially subject the Company to concentrations of credit risk, consistprimarily of demand deposits, temporary cash investments and trade receivables.
The Company believes it has placed its demand deposits and temporary cash investments with high creditquality financial institutions. At December 31, 2007 and 2006, the Company’s demand deposits and temporary cashinvestments consisted of the following (in thousands):
2007 2006
Deposits in FDIC and SIPC-insured institutions under $100,000. . . . . . . . . . . $ 462 $ 684
Deposits in FDIC and SIPC-insured institutions over $100,000 . . . . . . . . . . . 53,112 21,859
Deposits in Foreign Banks . . . . . . . . . . . . . . . . . . . . . . . . . . . . . . . . . . . . . . 6,282 3,754
59,856 26,297
Less outstanding checks and other reconciling items . . . . . . . . . . . . . . . . . . . (42,422) (12,912)
Cash and cash equivalents. . . . . . . . . . . . . . . . . . . . . . . . . . . . . . . . . . . . . . . $ 17,434 $ 13,385
F-24

Concentrations of credit risk with respect to trade receivables are primarily focused on companies involved inthe exploration and development of oil and natural gas properties. The concentration is somewhat mitigated by thediversification of customers for which the Company provides services. As is general industry practice, the Companytypically does not require customers to provide collateral. No significant losses from individual customers wereexperienced during the years ended December 31, 2007, 2006, or 2005. The Company recognized bad debt expensefor 2007, 2006 and 2005 of $2.6 million, $5.4 million and $1.2 million, respectively.
The carrying values of cash and cash equivalents and trade receivables approximate fair value due to the short-term maturity of these items.
18. Related Party Transactions
Joint Operation of Oil and Natural Gas Properties — Through October 31, 2007, the Company served asoperator with respect to several properties and was actively involved in the development, exploration, acquisitionand production of oil and natural gas. Effective November 1, 2007, the Company sold the operations portion of itsexploration and production business. The Company continues to own and invest in oil and natural gas assets as aworking interest owner. During the time that the Company served as operator, it served as operator with respect tocertain oil and natural gas properties in which certain of its affiliated persons have participated, either individuallyor through entities they control. These participations have typically been through working interests in prospects orproperties originated or acquired by Patterson Petroleum, LLC, a wholly owned subsidiary of Patterson-UTI.
During the time that the Company served as operator, sales of working interests to affiliated parties were madeby Patterson-UTI at its cost, comprised of Patterson-UTI’s costs of acquiring and preparing the working interests forsale plus a promote fee in some cases. These costs were paid by the working interest owners on a pro rata basis basedupon their working interest ownership percentage. The price at which working interests were sold to affiliatedpersons was the same price at which working interests were sold to unaffiliated persons except that in some casesthe affiliated persons also paid a promote fee. The affiliated persons received oil and natural gas production revenue(net of royalty) of $19.0 million, $15.8 million and $15.5 million from these properties in 2007, 2006 and 2005,respectively. These persons or entities in turn paid for joint operating costs (including drilling and other devel-opment expenses) of $9.2 million, $14.1 million and $9.5 million incurred in 2007, 2006 and 2005, respectively.These activities resulted in a payable to the affiliated persons of $0 and approximately $1.5 million and a receivablefrom the affiliated persons of $0 and approximately $1.6 million at December 31, 2007 and 2006, respectively.
F-25

PATTERSON-UTI ENERGY, INC. AND SUBSIDIARIESSCHEDULE II — VALUATION AND QUALIFYING ACCOUNTS
Description Beginning Balance
Charged toCosts and
Expenses(1) Deductions(2) Ending Balance(In thousands)
Year Ended December 31, 2007Deducted from asset accounts:
Allowance for doubtful accounts . . . . . . . . . $7,484 $2,550 $ 20 $10,014
Year Ended December 31, 2006Deducted from asset accounts:
Allowance for doubtful accounts . . . . . . . . . $2,199 $5,400 $115 $ 7,484
Year Ended December 31, 2005Deducted from asset accounts:
Allowance for doubtful accounts . . . . . . . . . $1,909 $1,231 $941 $ 2,199
(1) Net of recoveries.
(2) Uncollectible accounts written off.
S-1
SIGNATURES
Pursuant to the requirements of Section 13 or 15(d) of the Securities Exchange Act of 1934, Patterson-UTIEnergy, Inc. has duly caused this Report on Form 10-K to be signed on its behalf by the undersigned, thereunto dulyauthorized.
PATTERSON-UTI ENERGY, INC.
By: /s/ DOUGLAS J. WALL
Douglas J. WallPresident and Chief Executive Officer
Date: February 19, 2008
Pursuant to the requirements of the Securities Exchange Act of 1934, this Report on Form 10-K has beensigned by the following persons on behalf of Patterson-UTI Energy, Inc. and in the capacities indicated as ofFebruary 19, 2008.
Signature Title
/s/ MARK S. SIEGEL
Mark S. Siegel
Chairman of the Board
/s/ DOUGLAS J. WALL
Douglas J. Wall(Principal Executive Officer)
President and Chief Executive Officer
/s/ JOHN E. VOLLMER III
John E. Vollmer III(Principal Financial Officer)
Senior Vice President — Corporate Development, ChiefFinancial Officer and Treasurer
/s/ GREGORY W. PIPKIN
Gregory W. Pipkin(Principal Accounting Officer)
Chief Accounting Officer and Assistant Secretary
/s/ KENNETH N. BERNS
Kenneth N. Berns
Senior Vice President and Director
/s/ CHARLES O. BUCKNER
Charles O. Buckner
Director
/s/ CLOYCE A. TALBOTT
Cloyce A. Talbott
Director
/s/ CURTIS W. HUFF
Curtis W. Huff
Director
/s/ TERRY H. HUNT
Terry H. Hunt
Director
/s/ KENNETH R. PEAK
Kenneth R. Peak
Director

EXHIBIT 31.1
CERTIFICATIONS
I, Douglas J. Wall, certify that,
1. I have reviewed this annual report on Form 10-K of Patterson-UTI Energy, Inc.
2. Based on my knowledge, this report does not contain any untrue statement of a material fact or omit to statea material fact necessary to make the statements made, in light of the circumstances under which such statementswere made, not misleading with respect to the period covered by this report;
3. Based on my knowledge, the financial statements, and other financial information included in this report,fairly present in all material respects the financial condition, results of operations and cash flows of the registrant asof, and for, the periods presented in this report;
4. The registrant’s other certifying officer(s) and I are responsible for establishing and maintaining disclosurecontrols and procedures (as defined in Exchange Act Rules 13a-15(e) and 15d-15(e)) and internal control overfinancial reporting (as defined in Exchange Act Rules 13a-15(f) and 15d-15(f)) for the registrant and have:
(a) Designed such disclosure controls and procedures, or caused such disclosure controls and proceduresto be designed under our supervision, to ensure that material information relating to the registrant, including itsconsolidated subsidiaries, is made known to us by others within those entities, particularly during the period inwhich this report is being prepared;
(b) Designed such internal control over financial reporting, or caused such internal control over financialreporting to be designed under our supervision, to provide reasonable assurance regarding the reliability offinancial reporting and the preparation of financial statements for external purposes in accordance withgenerally accepted accounting principles;
(c) Evaluated the effectiveness of the registrant’s disclosure controls and procedures and presented in thisreport our conclusions about the effectiveness of the disclosure controls and procedures, as of the end of theperiod covered by this report based on such evaluation; and
(d) Disclosed in this report any change in the registrant’s internal control over financial reporting thatoccurred during the registrant’s most recent fiscal quarter (the registrant’s fourth fiscal quarter in the case of anannual report) that has materially affected, or is reasonably likely to materially affect, the registrant’s internalcontrol over financial reporting; and
5. The registrant’s other certifying officers and I have disclosed, based on our most recent evaluation ofinternal control over financial reporting, to the registrant’s auditors and the audit committee of the registrant’s boardof directors (or persons performing the equivalent functions):
(a) All significant deficiencies and material weaknesses in the design or operation of internal controlover financial reporting which are reasonably likely to adversely affect the registrant’s ability to record,process, summarize and report financial information; and
(b) Any fraud, whether or not material, that involves management or other employees who have asignificant role in the registrant’s internal control over financial reporting.
/s/ DOUGLAS J. WALL
Douglas J. WallPresident and Chief Executive Officer
Date: February 19, 2008
EXHIBIT 31.2
CERTIFICATIONS
I, John E. Vollmer III, certify that:
1. I have reviewed this annual report on Form 10-K of Patterson-UTI Energy, Inc.
2. Based on my knowledge, this report does not contain any untrue statement of a material fact or omit to statea material fact necessary to make the statements made, in light of the circumstances under which such statementswere made, not misleading with respect to the period covered by this report;
3. Based on my knowledge, the financial statements, and other financial information included in this report,fairly present in all material respects the financial condition, results of operations and cash flows of the registrant asof, and for, the periods presented in this report;
4. The registrant’s other certifying officers and I are responsible for establishing and maintaining disclosurecontrols and procedures (as defined in Exchange Act Rules 13a-15(e) and 15d-15(e)) and internal control overfinancial reporting (as defined in Exchange Act Rules 13a-15(f) and 15d-15(f)) for the registrant and have:
(a) Designed such disclosure controls and procedures, or caused such disclosure controls and proceduresto be designed under our supervision, to ensure that material information relating to the registrant, including itsconsolidated subsidiaries, is made known to us by others within those entities, particularly during the period inwhich this report is being prepared;
(b) Designed such internal control over financial reporting, or caused such internal control over financialreporting to be designed under our supervision, to provide reasonable assurance regarding the reliability offinancial reporting and the preparation of financial statements for external purposes in accordance withgenerally accepted accounting principles;
(c) Evaluated the effectiveness of the registrant’s disclosure controls and procedures and presented in thisreport our conclusions about the effectiveness of the disclosure controls and procedures, as of the end of theperiod covered by this report based on such evaluation; and
(d) Disclosed in this report any change in the registrant’s internal control over financial reporting thatoccurred during the registrant’s most recent fiscal quarter (the registrant’s fourth fiscal quarter in the case of anannual report) that has materially affected, or is reasonably likely to materially affect, the registrant’s internalcontrol over financial reporting; and
5. The registrant’s other certifying officers and I have disclosed, based on our most recent evaluation ofinternal control over financial reporting, to the registrant’s auditors and the audit committee of the registrant’s boardof directors (or persons performing the equivalent functions):
(a) All significant deficiencies and material weaknesses in the design or operation of internal controlover financial reporting which are reasonably likely to adversely affect the registrant’s ability to record,process, summarize and report financial information; and
(b) Any fraud, whether or not material, that involves management or other employees who have asignificant role in the registrant’s internal control over financial reporting.
/s/ JOHN E. VOLLMER III
John E. Vollmer IIISenior Vice President — Corporate Development, Chief
Financial Officer and Treasurer
Date: February 19, 2008

Exhibit 32.1
CERTIFICATION PURSUANT TO18 U.S.C. SECTION 1350,
AS ADOPTED PURSUANT TOSECTION 906 OF THE SARBANES-OXLEY ACT OF 2002
NOT FILED PURSUANT TO THE SECURITIES EXCHANGE ACT OF 1934
In connection with the Annual Report of Patterson-UTI Energy, Inc. (the “Company”) on Form 10-K for the periodending December 31, 2007, as filed with the Securities and Exchange Commission on the date hereof (the “Report”),Douglas J. Wall, Chief Executive Officer, and John E. Vollmer III, Chief Financial Officer, of the Company, each certify,pursuant to 18 U.S.C. Section 1350, as adopted pursuant to Section 906 of the Sarbanes-Oxley Act of 2002, that:
(1) The Report fully complies with the requirements of section 13(a) or 15(d) of the Securities ExchangeAct of 1934; and
(2) The information contained in the Report fairly presents, in all material respects, the financialcondition and results of operations of the Company.
A signed original of this written statement required by Section 906 has been provided to the Company and willbe retained by the Company and furnished to the Securities and Exchange Commission upon request.
/s/ DOUGLAS J. WALL
Douglas J. WallChief Executive OfficerFebruary 19, 2008
/s/ JOHN E. VOLLMER III
John E. Vollmer IIIChief Financial OfficerFebruary 19, 2008
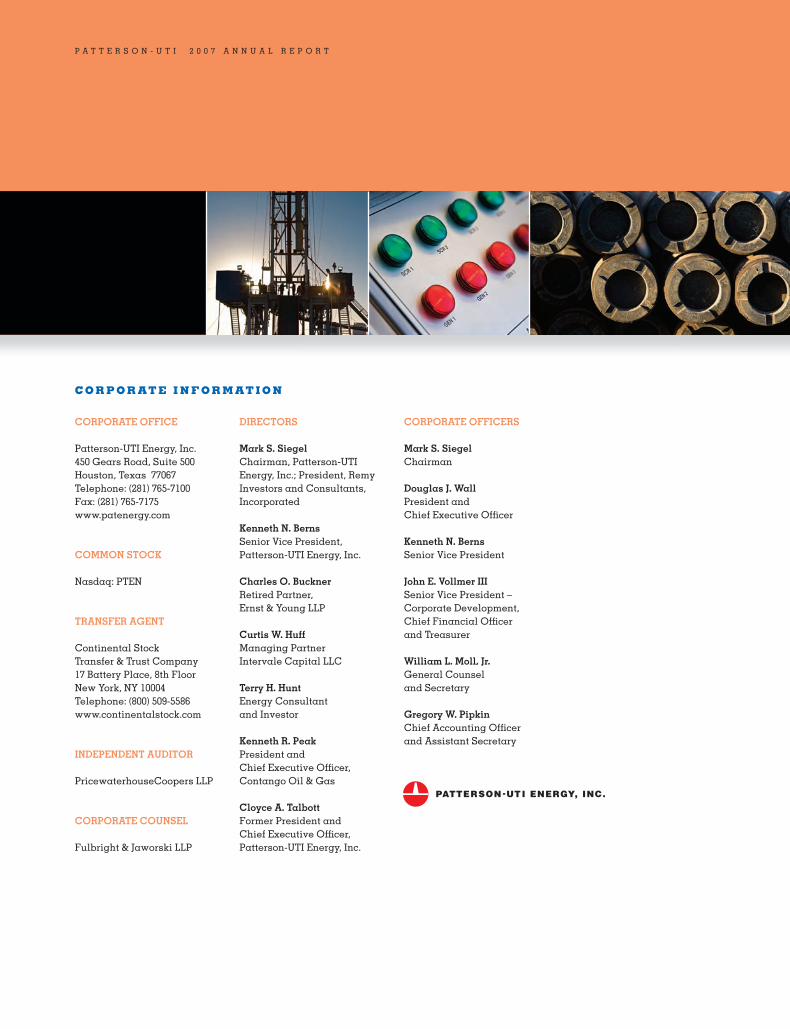
P A T T E R S O N - U T I 2 0 0 7 A N N U A L R E P O R T
Financial Highlights
(in thousands, except per share amounts – unaudited) Year Ended December 31, 2003 2004 2005 2006 2007Revenues $ 776,170 $ 1,000,769 $ 1,740,455 $ 2,546,586 $ 2,114,194Operating income 66,282 148,467 581,296 1,039,164 670,276Net income 43,187 94,346 372,740 673,254 438,639Earnings per share Basic 0.27 0.57 2.19 4.08 2.83 Diluted 0.26 0.56 2.15 4.02 2.79Cash dividends per share — 0.06 0.16 0.28 0.44Total assets 1,039,521 1,256,785 1,795,781 2,192,503 2,465,199Long-term debt — — — 120,000 50,000Shareholders’ equity 789,814 961,501 1,367,011 1,562,466 1,896,030Working capital 198,399 235,480 382,448 335,052 227,577
Operational Highlights
(dollars in thousands – unaudited)
Operating days 68,798 77,355 100,591 108,192 89,095Average drilling revenue per day $ 9.30 $ 10.47 $ 14.77 $ 20.05 $ 19.55Average drilling margin per day (1) $ 2.39 $ 3.27 $ 7.05 $ 10.79 $ 8.74Average rigs operating 188 211 276 296 244
(1) Average margin per day represents average revenue per day minus average direct operating costs per day and excludes provisions for bad debts, other charges, depreciation, depletion, amortization and impairment and selling, general and administrative expenses.
Patterson-UTI Energy, Inc. provides onshore contract drilling services to exploration and production companies in North America. The Company’s land-based drilling rigs operate in oil and natural gas producing regions of Texas, New Mexico, Oklahoma, Arkansas, Louisiana, Mississippi, Alabama, Colorado, Utah, Wyoming, Montana, North Dakota, South Dakota, Pennsylvania and western Canada. Patterson-UTI Energy, Inc. is also engaged in the businesses of pressure pumping services and drilling and completion fl uid services.
C O M PA NY P ROFI LE ON THE COVER
Rig 476 is one of our “walking” rigs, on location in the Jonah fi eld in Wyoming. “Walking” rigs provide for increased effi ciency as they enable customers to drill multiple wells on a single pad without rigging down.
P A T T E R S O N - U T I 2 0 0 7 A N N U A L R E P O R T
CORPORATE OFFICE
Patterson-UTI Energy, Inc.450 Gears Road, Suite 500Houston, Texas 77067Telephone: (281) 765-7100Fax: (281) 765-7175www.patenergy.com
COMMON STOCK
Nasdaq: PTEN
TRANSFER AGENT
Continental Stock Transfer & Trust Company17 Battery Place, 8th FloorNew York, NY 10004Telephone: (800) 509-5586www.continentalstock.com
INDEPENDENT AUDITOR
PricewaterhouseCoopers LLP
CORPORATE COUNSEL
Fulbright & Jaworski LLP
DIRECTORS
Mark S. Siegel Chairman, Patterson-UTI Energy, Inc.; President, Remy Investors and Consultants, Incorporated
Kenneth N. Berns Senior Vice President,Patterson-UTI Energy, Inc.
Charles O. Buckner Retired Partner,Ernst & Young LLP
Curtis W. Huff Managing PartnerIntervale Capital LLC
Terry H. Hunt Energy Consultantand Investor
Kenneth R. Peak President and Chief Executive Offi cer, Contango Oil & Gas
Cloyce A. Talbott Former President andChief Executive Offi cer, Patterson-UTI Energy, Inc.
CORPORATE OFFICERS
Mark S. Siegel Chairman
Douglas J. Wall President andChief Executive Offi cer
Kenneth N. Berns Senior Vice President
John E. Vollmer III Senior Vice President –Corporate Development,Chief Financial Offi cerand Treasurer
William L. Moll, Jr. General Counseland Secretary
Gregory W. PipkinChief Accounting Offi cerand Assistant Secretary
C OR POR ATE I N FOR M ATION

P A T T E R S O N - U T I 2 0 0 7 A N N U A L R E P O R T
Patterson-UTI Energy, Inc.450 Gears Road, Suite 500Houston, Texas 77067Telephone: (281) 765-7100Fax: (281) 765-7175www.patenergy.com