patterns of microbial beta diversity in alpine temperature
TRANSCRIPT

Page 1/22
Temperature and Precipitation Drive ElevationalPatterns of Microbial Beta Diversity in AlpineGrasslandsXiaoqin Yang
Institute of Tibetan Plateau Research, Chinese Academy of SciencesYue Li
China University of GeosciencesBin Niu
Institute of Tibetan Plateau Research, Chinese Academy of SciencesQiuyu Chen
Institute of Tibetan Plateau Research, Chinese Academy of SciencesYilun Hu
Institute of Tibetan Plateau Research, Chinese Academy of SciencesYibo Yang
Institute of Tibetan Plateau Research, Chinese Academy of SciencesLili Song
Institute of Tibetan Plateau Research, Chinese Academy of SciencesJianjun Wang
Nanjing Institute of Geography and LimnologyGengxin Zhang ( [email protected] )
Institute of Tibetan Plateau Research, Chinese Academy of Sciences https://orcid.org/0000-0001-9245-1981
Research Article
Keywords: soil microbes, elevational gradient, temperature, precipitation, LCBD, communitycomposition
Posted Date: July 7th, 2021
DOI: https://doi.org/10.21203/rs.3.rs-662462/v1
License: This work is licensed under a Creative Commons Attribution 4.0 International License. Read Full License

Page 2/22
AbstractUnderstanding the mechanisms underlying biodiversity patterns is a central issue in ecology, while howtemperature and precipitation jointly control the elevational patterns of microbes is understudied. Here,we studied the effects of temperature, precipitation and their interactions on the alpha and beta diversityof soil archaea and bacteria in alpine grasslands along an elevational gradient of 4,300-5,200 m on theTibetan Plateau. Alpha diversity was examined on the basis of species richness and evenness, and betadiversity was quanti�ed with the recently developed metric of local contributions to beta diversity (LCBD).Typical alpine steppe and meadow ecosystems were distributed below and above 4,850 m, respectively,which was consistent with the two main constraints of mean annual temperature (MAT) and meanannual precipitation (MAP). Species richness and evenness showed decreasing elevational patterns inarchaea and nonsigni�cant or U-shaped patterns in bacteria. The LCBD of both groups exhibitedsigni�cant U-shaped elevational patterns, with the lowest values occurring at 4,800 m. For the threediversity metrics, soil pH was the primary explanatory variable in archaea, explaining over 20.1% of theobserved variation, whereas vegetation richness, total nitrogen and the K/Al ratio presented the strongesteffects on bacteria, with relative importance values of 16.1%, 12.5% and 11.6%, respectively. For themicrobial community composition of both archaea and bacteria, the moisture index showed thedominant effect, explaining 17.6% of the observed variation, followed by MAT and MAP. Taken together,temperature and precipitation exerted considerable indirect effects on microbial richness and evennessthrough local environmental and energy supply-related variables, such as vegetation richness, whereastemperature exerted a larger direct in�uence on LCBD and the community composition. Our �ndingshighlighted the profound in�uence of temperature and precipitation interactions on microbial betadiversity in alpine grasslands on the Tibetan Plateau.
1. IntroductionSpatial patterns of biodiversity are increasingly well documented [1]; however, the mechanismsunderlying these patterns remain unclear [2]. Climate factors have been identi�ed as the main driversshaping diversity gradients [3]. For instance, a positive correlation between temperature and speciesrichness has been found along latitudinal [4] and elevational gradients [5–7]. The main hypothesesexplaining spatial diversity gradients are (1) the metabolic theory of ecology, relating higher mutation andspeciation rates towards warmer areas [8], and (2) the productivity-diversity hypothesis, focusing on thepositive effect of resources on species coexistence and diversity [9]. Furthermore, precipitation has beenreported to be the main driver of biodiversity [10], which supports the water availability hypothesis,focusing on direct or indirect (via effects on productivity and soil environmental properties) constraintson biodiversity. For instance, precipitation constrains aboveground vegetation and soil moisture acrossbioclimatic zones, which indirectly in�uences species physiology [11], structure [12] and their interactions[13]. Thus, warmer and wetter conditions increase productivity, which can further in�uence biodiversity[14].
Page 3/22
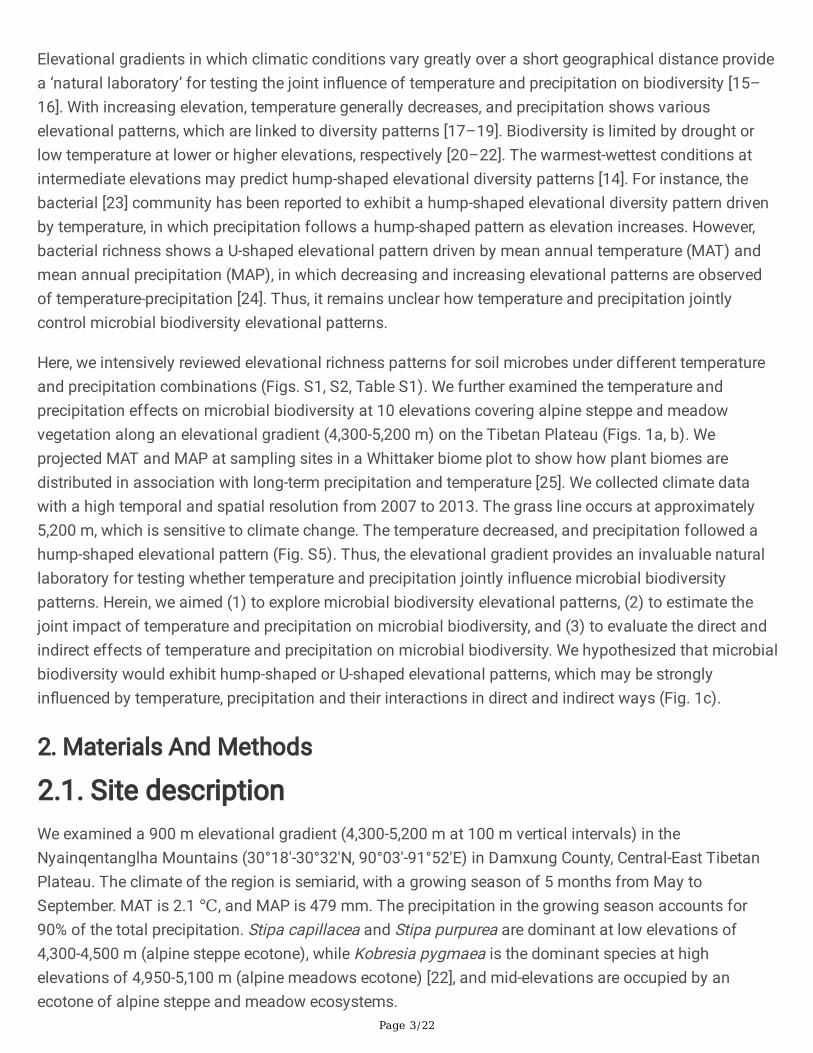
Elevational gradients in which climatic conditions vary greatly over a short geographical distance providea ‘natural laboratory’ for testing the joint in�uence of temperature and precipitation on biodiversity [15–16]. With increasing elevation, temperature generally decreases, and precipitation shows variouselevational patterns, which are linked to diversity patterns [17–19]. Biodiversity is limited by drought orlow temperature at lower or higher elevations, respectively [20–22]. The warmest-wettest conditions atintermediate elevations may predict hump-shaped elevational diversity patterns [14]. For instance, thebacterial [23] community has been reported to exhibit a hump-shaped elevational diversity pattern drivenby temperature, in which precipitation follows a hump-shaped pattern as elevation increases. However,bacterial richness shows a U-shaped elevational pattern driven by mean annual temperature (MAT) andmean annual precipitation (MAP), in which decreasing and increasing elevational patterns are observedof temperature-precipitation [24]. Thus, it remains unclear how temperature and precipitation jointlycontrol microbial biodiversity elevational patterns.
Here, we intensively reviewed elevational richness patterns for soil microbes under different temperatureand precipitation combinations (Figs. S1, S2, Table S1). We further examined the temperature andprecipitation effects on microbial biodiversity at 10 elevations covering alpine steppe and meadowvegetation along an elevational gradient (4,300-5,200 m) on the Tibetan Plateau (Figs. 1a, b). Weprojected MAT and MAP at sampling sites in a Whittaker biome plot to show how plant biomes aredistributed in association with long-term precipitation and temperature [25]. We collected climate datawith a high temporal and spatial resolution from 2007 to 2013. The grass line occurs at approximately5,200 m, which is sensitive to climate change. The temperature decreased, and precipitation followed ahump-shaped elevational pattern (Fig. S5). Thus, the elevational gradient provides an invaluable naturallaboratory for testing whether temperature and precipitation jointly in�uence microbial biodiversitypatterns. Herein, we aimed (1) to explore microbial biodiversity elevational patterns, (2) to estimate thejoint impact of temperature and precipitation on microbial biodiversity, and (3) to evaluate the direct andindirect effects of temperature and precipitation on microbial biodiversity. We hypothesized that microbialbiodiversity would exhibit hump-shaped or U-shaped elevational patterns, which may be stronglyin�uenced by temperature, precipitation and their interactions in direct and indirect ways (Fig. 1c).
2. Materials And Methods
2.1. Site descriptionWe examined a 900 m elevational gradient (4,300-5,200 m at 100 m vertical intervals) in theNyainqentanglha Mountains (30°18′-30°32′N, 90°03′-91°52′E) in Damxung County, Central-East TibetanPlateau. The climate of the region is semiarid, with a growing season of 5 months from May toSeptember. MAT is 2.1 ℃, and MAP is 479 mm. The precipitation in the growing season accounts for90% of the total precipitation. Stipa capillacea and Stipa purpurea are dominant at low elevations of4,300-4,500 m (alpine steppe ecotone), while Kobresia pygmaea is the dominant species at highelevations of 4,950-5,100 m (alpine meadows ecotone) [22], and mid-elevations are occupied by anecotone of alpine steppe and meadow ecosystems.

Page 4/22
We set up eight HOBO weather stations (Onset Inc., Bourne, MA, USA) at 4,300, 4,400, 4,500, 4,650, 4,800,4,950, 5,100, and 5,200 m and recorded air temperature and precipitation at 1-hour intervals. We collectedclimate data with a high temporal and spatial resolution from 2007 to 2013. At 4,600, 4,700, 4,900 and5,000 m, temperature and precipitation were predicted from the data of the eight weather stations using alinear model. We calculated 13 temperature and 8 precipitation variables (Table S3), such as MAT andMAP as the long-term measurement for temperature and precipitation; precipitation seasonality(coe�cient of variation) (PSCV), which is the ratio of the standard deviation of the monthly totalprecipitation to the mean monthly total precipitation [26]. To characterize the joint in�uence oftemperature and precipitation on the microbial community, we calculated the ratio of growing seasonprecipitation to the total accumulated temperature above 5°C (GSP/AccT) [22], which could serve as asubstitute for the climate moisture index [27]. Statistical dependence between the climate variables wasassessed using Spearman’s rank correlation coe�cients. Except for MAT, MAP and GSP/AccT, all theother pairwise Spearman’s rank correlations were less than 0.75. Thus, seven climate variables wereretained, including MAT, the minimum temperature of the coldest month (MTCM), GSP/AccT, MAP, theprecipitation of the driest month (PMD), PSCV and the mean annual coldest temperature (Tmin).
2.2. Soil sample collectionThe results obtained from an adequate number of sample replications are more accurate for revealing thecommunity distribution at each elevation. In August 2013, nine nested samples (10 cm depth) werecollected at distances of 1 and 10 m at each elevation. Five soil cores were randomly taken from eachsite using a soil sampler tube (5 cm in diameter) and were then mixed as a composite sample. At eachelevation, nine replications were performed. In total, there were 89 samples (we removed one samplecollected at 10 m above 5,000 m because of contamination) collected over the whole elevationalgradient. A total of 250 g of soil was sieved through a 2 mm mesh, and subsamples (approximately 50 g)were transferred to plastic bags and placed into a − 80°C refrigerator for soil bacterial communityanalysis. The remaining soil (approximately 200 g) was kept at 4 ℃ for soil property measurement.
2.3. Environmental variablesSoil samples were dried naturally at room temperature. Then, soil water content (SWC), pH, total nitrogen(TN), total phosphorus (TP), total organic carbon (TOC), soluble organic carbon (DOC) and solubleorganic nitrogen (DON) were determined as potential explanatory variables of biodiversity. Brie�y, 5 g soilsamples were dried at 105°C for 12 hours, and SWC was calculated based on weight loss before andafter drying. Five grams of soil was added to distilled water (soil:water = 1:2.5), after which the mixturewas stirred for 1 min and sat for 30 min, and the pH was determined with a pH metre (Sartorius PB-10,Germany). TN was determined using a modi�ed Kjeldahl method [28] and quanti�ed with an elementalanalyser (Vario Macro Cube, Elementar, Germany). TOC, DOC and DON were measured with a TOCanalyser (TOC-VCPH, Shimadzu, Japan). TP was measured using the molybdenum blue method [29].
We measured soil geochemical elements and calculated the weathering index to evaluate its in�uence onbiodiversity. Raw soil samples were digested by pressurized acid digestion using a mixture of HNO3 and

Page 5/22
HF in a Te�on digestion vessel [30]. Speci�cally, 20–30 mg soil samples were added to the vessel with 1ml HNO3 and 1 ml HF, and the mixture was then placed in an oven at 190°C for 24 hours. The coolingsolutions were evaporated until they were nearly dry on a hot plate at 150°C, after which 1 ml HNO3 wasadded, and the steps were repeated once. Next, 2 ml HNO3 and 3 ml ultrapure water were added to theresidue, and the mixture was heated at 150°C for 24 hours. Finally, the digestant was diluted to 50 mlusing ultrapure water. Metal elements, including Ca, Mg, Fe, Al, K, Na, Ba, Mn, Ti and P, were measuredusing inductively coupled plasma optical emission spectroscopy (Leeman Labs, USA). Principalcomponent analysis (PCA) was applied to extract the two principal component axes of the metalelements. The chemical index of alteration (CIA = [(Al2O3)/(Al2O3 + CaO + K2O + Na2O)] * 100) [31] and theTi/Al, Na/Al, K/Al and Na/K ratios were calculated as indicators of weathering.
The normalized difference vegetation index (NDVI) is an indicator that re�ects the growth state andcoverage of vegetation. We downloaded Landsat 8 remote sensing image data(https://earthexplorer.usgs.gov/), applied ENVI 5.1 software for radiation calibration and atmosphericcorrection, and calculated the NDVI of the sampling site vegetation community through the band mathmodule. The aspect and slope of the sampling sites were extracted from SRTMDEM 90 m-resolution rawelevation data (http://www.gscloud.cn/home) as potential explanatory variables of biodiversity. For theevaluation of the vegetation community, we established a 1 m × 1 m quadrat at each elevation andrecorded species present and the number of individuals of each species. Then, vegetation richness, theShannon index and evenness were calculated.
2.4. Community analysesTotal soil DNA was extracted from 0.5 g soil subsamples by using the FastDNA® SPIN kit for soil (MPBiomedicals, USA). DNA extraction e�ciency was determined by agar gel electrophoresis, and theobtained DNA concentration and purity were detected with a NanoDrop 2000c UV-Vis spectrophotometer(Thermo Fisher Scienti�c, USA). We used the 515F (5’-GTGCCAGCMGCCGCGGTAA-3’) and 806R (5’-GGACTACHVGGGTWTCTAAT-3’) primers to amplify the 16S rRNA gene V4 region [32]. The PCRampli�cation steps were as follows: predenaturation at 94°C for 3 min, denaturation at 94°C for 30 s,annealing at 56°C for 30 s, elongation at 72°C for 45 s (28 cycles) and elongation for 5 min until thetemperature dropped to 4°C. After the PCR products were puri�ed by gel cutting, double-stranded DNAwas quanti�ed accurately by using PicoGreen (Invitrogen, Carlsbad, California). Then, the sequencingtemplate was prepared by using the Ion PGMTM Template OT2 400 Kit (Life Technologies, USA).Sequencing data were derived via the Ion Torrent PGM (Life Technologies, USA) approach [33]. Allsequences were converted to FASTQ format using SAMtools [34]. Then, standardization processing wasperformed on a Linux system terminal. The sequences were processed with QIIME (v1.8). UCHIME wasused to remove chimaeric sequences, and UCLUST was used to divide operational taxa with 97%similarity into operational taxonomic units (OTUs). The representative sequences of each OTU were thencompared with data from the Ribosomal Database Project (RDP) for systematic classi�cation [35].Across all soil samples, we obtained a total of 2,904,266 high-quality sequences, with 32,632 sequences
Page 6/22
per sample on average. The raw data were deposited in the NCBI Sequence Read Archive database, andthe project ID is PRJNA734468.
2.5. Literature analysis
We searched the data in the Web of Science (1990-September 2020) using the combined keywords(‘altitude’ or ‘elevation’) and (‘diversity’ or ‘richness’) and (‘micro*’). We included studies on soil microbessuch as archaea, bacteria and fungi involving ≥ 3 sampling sites on each elevational gradient. We furthercompiled the elevational patterns of richness and then classi�ed those patterns as signi�cantlydecreasing (D), increasing (I), hump-shaped (H), U-shaped (U) and nonsigni�cant (N) according to theresults of the analysed papers [36].
2.6. Statistical analysesThe alpha and beta diversities of a community represent different facets of biodiversity driven bydifferent environmental factors. We thus calculated species richness and Pielou’s evenness [37] torepresent microbial alpha diversity and local contributions to beta diversity (LCBD) [38] and thecommunity composition to represent beta diversity. Species richness is the number of species in theecosystem, and evenness represents the extent of evenly distributed species [36, 39]. We used Pielou’sevenness because it is a good measure of the community distribution of relative abundance [40].
LCBD values quantify the relative contributions of individual sites to total beta diversity [38]. A high LCBDvalue for a site indicates that the site harbours a unique community composition. We computed LCBDvalues by using Hellinger-transformed abundance data and the LCBD.comp function by using adespatial(v0.3-8). Variations in community composition (beta diversity) [41] are a measure of differences in themicrobial community composition between pairwise sites [42]. Principal coordinate analysis (PCoA)based on the community Bray-Curtis distance metric and PERMANOVA (Adonis statistic) was used to testthe community composition along elevational gradients in the ‘vegan’ package (V 2.5.6).
To explore the elevational patterns of microbial richness, evenness and LCBD, we used linear or quadraticmodel. The more appropriate model was selected based on the lower value of Akaike’s informationcriterion (AIC) [43]. Before evaluating the in�uence of different explanatory variables with differentmeasurement units on microbial biodiversity, all variables were Z-score transformed. We conductedrandom forest analysis to estimate the relative importance of individual variables to communitybiodiversity using the ggRandomForests (V2.0.1) package [44]. A Mantel test was used to test thecorrelation between the microbial community and environmental variables. We classi�ed all variablesinto three groups: climate variables, such as temperature and precipitation; local factors, such as soilphysicochemical properties and the weathering index; and energy variables, such as vegetation, solublecarbon and nitrogen. We applied variation partitioning analysis (VPA) to identify the contributions ofclimate, energy and local variables (Table S4) to explaining microbial biodiversity. Before the analysis,collinear variables were removed by backward selection.

Page 7/22
We used structural equation models (SEMs) to test and quantify the direct and indirect effects oftemperature and precipitation on microbial biodiversity. We ran all alternative models based on the fullmodel (Fig. 1c) using AIC and model �t statistics [45]. We chose the �nal model with the lowest AIC value,and the detailed modelling �t indices are presented in Table S6. In addition, suitable model �ts wereevaluated on the basis of the AIC value, a nonsigni�cant χ2 test (P > 0.05), the comparative �t index (CFI > 0.95) and the standardized root mean squared residual (SRMR < 0.05). We ran the SEMs using the lavaanpackage (V0.6.5) [46], which provides multiple latent variable models to explain the underlyingrelationships in the models. All statistical analyses and plots were conducted in R statistical softwareV3.6.1 by using the packages vegan V2.5.6, ggplot2 V3.2.1, and corrplot V0.84.
3. Results3.1. Literature analysis of richness
We compiled the elevational patterns of precipitation and species richness from the literature.Temperature shows a decreasing elevational pattern, whereas precipitation regimes differ acrosselevational gradients, which means that the species richness elevational patterns correspond to differentprecipitation patterns. Decreasing-increasing (D-I) and decreasing-hump-shaped (D-H) elevationalpatterns of temperature-precipitation accounted for 60.6% and 27.3%, respectively, of 33 examined cases,whereas decreasing-decreasing (D-D) and decreasing-U-shaped (D-U) elevational patterns of temperature-precipitation accounted for only a small proportion (6.1%) (Fig. S1, Table S1). In total, 36.4% of the casesexhibited nonsigni�cant elevational patterns in all temperature-precipitation combinations, followed bydecreasing (21.2%) and hump-shaped (18.2%) elevational patterns (Figs. S1, S2). Microbial richnessshowed hump-shaped elevational patterns in association with D-D elevational patterns of temperature-precipitation. In 30.0%, 25.0%, 20.0% and 20.0% of cases, microbial richness exhibited decreasing,nonsigni�cant, hump-shaped and U-shaped elevational patterns, respectively, in association with D-Ielevational patterns of temperature-precipitation. Microbial richness exhibited nonsigni�cant elevationalpatterns in association with D-U elevational patterns of temperature-precipitation. In 55.6%, 11.1% and11.1% of cases, microbial richness exhibited nonsigni�cant, hump-shaped and U-shaped elevationalpatterns, respectively, in association with D-H pattern elevational patterns of temperature-precipitation.Thus, there were no general elevational patterns of richness in association with different temperature andprecipitation combinations. We further reviewed the main drivers shaping richness elevational patterns. In54.5% of cases, local environmental variables were shown to be the most important drivers of speciesrichness, followed by climate (30.3%) and energy (6.1%) variables (Table S1).
3.2. Biodiversity patterns of microbial communityGenerally, alpha and beta diversity showed U-shaped and hump-shaped elevational patterns, respectively,at approximately 4,700-4,900 m. For species richness, the whole archaea and the phylum Crenarchaeotaexhibited a signi�cant (P < 0.01) decreasing pattern, while bacteria showed nonsigni�cant pattern(Figs. 2a, S8). Most bacterial phyla exhibited signi�cant elevational patterns in richness (12 out of 14
Page 8/22
phyla), among which approximately 36%, 29% and 14% were U-shaped, hump-shaped and decreasingpatterns (P < 0.05), respectively (Fig. S8). For species evenness, archaea and bacteria showed signi�cant(P < 0.05) decreasing and U-shaped patterns with R2 values of 0.18 and 0.35, respectively (Figs. 2b, S9).Approximately 64% of phyla showed signi�cant (P < 0.05) elevational patterns in evenness, among whichapproximately 29%, 29% and 7% were U-shaped, hump-shaped and decreasing patterns, respectively (Fig.S9). For instance, Acidobacteria, Firmicutes and Proteobacteria exhibited signi�cant U-shaped patterns;Gemmatimonadetes showed a signi�cant hump-shaped pattern; and Crenarchaeota exhibited asigni�cant decreasing elevational pattern (Fig. S9).
We observed consistent signi�cant U-shaped LCBD-elevation relationships for archaeal (R2 = 0.18, P < 0.01) and bacterial (R2 = 0.38, P < 0.01) communities (Fig. 2c). U-shaped patterns were also found formost bacterial phyla (12/14), such as Acidobacteria, Actinobacteria and Proteobacteria (P < 0.05) (Fig.S10). Interestingly, the lowest LCBD values for the whole microbial communities and their phyla occurredat approximately 4,700-4,900 m. The microbial community composition was mainly differentiated byelevation (Adonis statistic: R2 > 0.11, P = 0.001; Figs. 2d, e).
3.3. Underlying drivers of elevational biodiversityTypical alpine steppe and meadow ecosystems were distributed below and above 4,850 m, which wasconsistent with the two main constraints of MAT and MAP (Fig. 1a). The climate and vegetation ecotonealso occurred at approximately 4,800-4,900 m in conceptual Whittaker biome plot (Fig. 1b). Climate, localand energy variables varied substantially along elevational gradients. For instance, MAT (− 1.9–2.84 ℃),MAP (313–552 mm) and PSCV (134–141) showed signi�cant (P 0.05) decreasing, hump-shaped and U-shaped elevational patterns, respectively (Figs. S3, S5). Energy variables, such as the vegetation Shannonindex (1.28–1.92), showed increasing and hump-shaped elevational patterns (P 0.05), while the localvariable of soil pH showed a signi�cant (P 0.05) U-shaped elevational pattern (Fig. S3).
Soil pH was the most important explanatory variable, explaining 20.1%, 55.8% and 21.4% of the variationin archaeal richness, evenness and LCBD, respectively (Figs. 3a, b, c). Vegetation richness, TN and theK/Al ratio had the strongest effects on bacterial richness, evenness and LCBD, with relative importancevalues of 16.1%, 12.5% and 11.6%, respectively (Figs. 3e, f, g). The moisture index (GSP/AccT ratio) wasthe most important explanatory factor, explaining over 17.6% variation of microbial communitycomposition represented by the �rst axis of PCoA (PCoA1), followed by MAT and MAP (Figs. 3d, h).Microbial richness, evenness and LCBD at the phylum level were driven by different variables. Forrichness, Tmin, PMD, pH, vegetation richness and TP were the most important predictors, explaining15.7%, 27.3%, 18.1%, 32.6% and 45.3% of the variation in Acidobacteria, Betaproteobacteria,Gemmatimonadetes, Firmicutes and Cyanobacteria, respectively (Fig. S16). For evenness, Tmin, pH andslope were the primary drivers, explaining 21.5%, 48.7% and 56.8% of the variation in Deltaproteobacteria,Gammaproteobacteria and Crenarchaeota, respectively (Fig. S17). For LCBD, MTCM and slope had thestrongest effects on Actinobacteria and Crenarchaeota, with relative importance values of 14.3% and25.8%, respectively (Fig. S18).

Page 9/22
Temperature and precipitation exerted considerable indirect effects on microbial richness and evennessthrough local and energy variables, whereas temperature directly in�uenced microbial LCBD and PCoA1.The total effects of temperature were larger than those of precipitation in explaining the variations inmicrobial evenness, LCBD and PCoA1 (Figs. 4, S19). Local and energy variables had direct effects onmicrobial alpha and beta diversity (R > 0.22) (Fig. 4). For archaea, the �nal SEMs explained 20.9%, 29.1%,37.8% and 65.1% of the variation in richness, evenness, LCBD and PCoA1 (Figs. 4a-d), respectively.Temperature had a larger indirect in�uence on microbial evenness, LCBD and PCoA1 than precipitation,with R values over 0.22 and 0.07 (Table S6). Temperature had direct effects on archaeal LCBD andPCoA1, with R values of 0.24 and 0.37 (P 0.05), respectively (Figs. 4c, d). For bacteria, the �nal SEMsexplained 15.1%, 54.7%, 67% and 78.5% of the variation in richness, evenness, LCBD and PCoA1 (Figs. 4e-h), respectively. Temperature had a larger indirect in�uence on microbial alpha and beta diversity thanprecipitation, with R values over 0.2 and 0.07 (Table S6), respectively. Temperature had signi�cant(P 0.05) direct effects on bacterial LCBD and PCoA1, with R values over 0.39.
Such effects of climate, energy and local variables were further statistically supported by linear orquadratic regression analysis (Fig. S13), Mantel’s test (Fig. S14) and variation partitioning analysis (Fig.S15). For instance, DON, MAT, TP and PMD were the most important drivers of archaeal richness,evenness, LCBD and PCoA1 (P 0.05), with R2 values of 0.12, 0.18, 0.26 and 0.42, respectively. PSCV, the�rst PCA axis of metal variables (metal.pc1), MTCM and TP were the most important drivers of bacterialrichness, evenness, LCBD and PCoA1, with R2 values of 0.05, 0.30, 0.51 and 0.70 (P 0.05), respectively(Fig. S13). The microbial communities were most signi�cantly correlated with the GSP/AccT ratio (R > 0.37, P < 0.01) (Fig. S14). Variation partitioning analyses showed that the combined effects of climate,energy and local variables explained over 18% of the variation in microbial LCBD and PCoA1, whereas theeffects of these three groups of variables explained only slightly over 3% of the variation in microbialrichness and evenness. Climate variables showed pure effects larger than local and energy variables inexplaining microbial LCBD and PCoA1 (Fig. S15).
4. DiscussionTemperature and precipitation have been suggested to shape soil microbial biodiversity alongenvironmental gradients [47–48]; however, their joint in�uence on the elevational patterns of soilmicrobes has rarely been reported. Here, we tested the hypotheses that microbial alpha and beta diversityare mainly constrained by precipitation at low elevations but by low temperature at high elevations,resulting in hump-shaped and U-shaped elevational patterns associated with the combination oftemperature and precipitation in alpine grasslands in semiarid regions. We found clear elevationalpatterns of species richness, evenness, LCBD and the community composition, which were primarilyexplained by the moisture index, representing the combination of temperature and precipitation.Furthermore, temperature had considerable direct and indirect effects on microbial alpha and betadiversity, while precipitation exerted relatively minor and indirect effects. Overall, these results supportedour hypotheses and further suggested that the response of microbial alpha and beta diversity to

Page 10/22
temperature and precipitation may vary with elevation because of elevational shifts in temperature andprecipitation limiting microbial growth.
4.1. Elevational patterns of microbial communitybiodiversityMicrobial alpha and beta diversity can provide different insights into elevational diversity patterns [36,49]. Soil microbial alpha diversity has shown decreasing (34%) or nonsigni�cant (33%) elevationalpatterns in meta-analyses [50]; however, species richness showed nonsigni�cant (36.4%) and decreasing(21.2%) elevational patterns in our literature review, which was in line with 35% and 30% of the casesshowing nonsigni�cant and decreasing elevational patterns, respectively [36]. These resultsdemonstrated that a decreasing or nonsigni�cant pattern was probably a feature of the microbial alphadiversity elevational pattern [3]. Furthermore, the differences in the distribution of elevational diversityindicate the importance of considering habitat differences associated with different combinations oftemperature and precipitation [21].
The declining elevational patterns of archaeal richness were consistent with the genes of soil ammonia-oxidizing archaea identi�ed within the same elevational gradient [51], although the maximum diversity ofsoil archaea was found at mid-elevations [52]. Bacterial richness showed a nonsigni�cant elevationalpattern in alpine grasslands, which was consistent with previous studies; for instance, 25.0% and 55.6%of the studies showed nonsigni�cant elevational patterns among D-D and D-H elevational patterns oftemperature-precipitation, respectively. The diversity patterns of the dominant phyla contributedsigni�cantly to the whole community pattern; thus, U-shaped (36%) and hump-shaped (29%) patterns forbacterial phyla contributed to a nonsigni�cant pattern of whole bacterial richness. These phylum patternswere also in line with hump-shaped and U-shaped elevational patterns in places where precipitationfollowed a hump-shaped elevational pattern [7, 53]. However, the U-shaped elevational pattern of bacterialevenness contrasted with increasing, decreasing and nonsigni�cant patterns of stream bacterialevenness reported along multiple mountainsides across Asia and Europe [36]. When we scaled down tothe phylum level, most of the phyla (> 58%) showed signi�cant U-shaped and hump-shaped elevationalpatterns of evenness, which have rarely been documented [15]. For LCBD, the whole archaeal andbacterial communities and their phyla exhibited a consistent U-shaped pattern, suggesting that suchpattern is probably a general feature of the elevational pattern of microbial beta diversity [15, 54], mainlybecause of the greater uniqueness of the community composition at both ends of the elevationalgradient [38]. The microbial community composition was signi�cantly affected by elevation, which wasin line with previous �ndings [5, 55, 56].
4.2. Underlying mechanisms of microbial biodiversityDespite the increasing attention given to the elevational biodiversity patterns of microbes, the joint effectsof temperature and precipitation on microbial biodiversity patterns have not been well studied.Temperature and precipitation put restrictions on how many species can survive at different elevations;
Page 11/22
i.e., temperatures or precipitation levels determine the minimum and maximum niches within which aspecies can survive or restrict species productivity, which in turn limits the total number of individuals[57–58]. The alpha and beta diversity of �ora and fauna along elevational gradients are commonly drivenby temperature and precipitation in arid and semiarid ecotones or environments [59–60]. We found thatthe moisture index, representing the combination of temperature and precipitation, was the primary driverof the microbial community composition. To the best of our knowledge, this is the �rst report indicatingthat the interactions of temperature and precipitation exert a profound in�uence on microbial betadiversity along elevational gradients. Furthermore, the lowest values of the U-shaped LCBD patternoccurred at mid-elevations (4,700-4,900 m) (Fig. 2), where the relationship between the moisture indexand LCBD showed a transition (Fig. S11). Thus, interactions of temperature and precipitation at mid-elevations may support more similar microbial communities, thereby shaping U-shaped elevationalpatterns of LCBD, which contrasts with �ndings showing that temperature alone drives the elevationalpatterns of stream bacteria, diatoms and macroinvertebrates along six elevational gradients [54]. Onepossible reason for the contrasting results between the two studies on microbes could be habitatdifferences. Furthermore, mid-elevations (4,700-4,900 m) are transition ecotones of soil nutrientavailability and vegetation under a temperature-precipitation regime, which may also impact microbialbeta diversity [61].
In our study, MAT and MAP were both found to be the main drivers of the soil microbial communitycomposition, in accord with the metabolic theory of ecology [23–24], the productivity-diversity hypothesisand the water availability hypothesis [62]. This result was consistent with those of earlier reports on thestream microbial community composition driven by mean temperature and mean precipitation alongelevational gradients in Norway, Spain and China [63]. However, precipitation was shown to be theprimary factor shaping bacterial community structure along the same elevational gradient according toterminal restriction fragment length polymorphism analysis [64]. The microbial community compositionis dependent on the long-term development of near-ground temperature and soil moisture regimes [19].Thus, long-term (2007–2013) climate data with a high temporal and spatial resolution could preciselyreveal the impacts of temperature and precipitation on the microbial community, which may explain theinconsistent results of different articles.
Climate has direct and indirect effects on microbial diversity [65]. However, temperature both directly andindirectly in�uences microbial alpha and beta diversity, which has rarely been reported [49, 66]. Withincreasing temperature, vegetation richness increases and soil pH decreases, indirectly in�uencingmicrobial richness [67]. For microbial LCBD and the microbial community composition, the direct effectsof temperature were dominant, mainly explained by temperature impacting microbial metabolism ratesand growth rates [8]. The larger total effects of temperature than precipitation in explaining variations inmicrobial alpha and beta diversity were in line with reports of plant and animal diversity along anelevational gradient [68]. Precipitation can directly in�uence the microbial community through shifts inosmotic pressure and resource availability, which can induce responses related to microbial physiologicalstress, growth and metabolic activity [69]. Thus, precipitation de�cits can limit soil microbe growth andactivity by inhibiting the diffusion of nutrients and carbon substrates in soil samples [70]. Our results

Page 12/22
clearly indicated that precipitation exerted an indirect effect on microbial alpha and beta diversity vialocal environmental and energy supply-related variables, such as vegetation richness. Changes inprecipitation or evapotranspiration in�uence vegetation types, soil pH and other soil characteristics,especially in arid and semiarid environments [2, 71]; thus, precipitation has a considerable indirect impacton microbial alpha and beta diversity.
In addition to the main effects of temperature and precipitation, local and energy variables played asecondary role in shaping diversity patterns. Soil pH was the main driver of the richness, evenness andLCBD of archaea, which was in line with previous studies in soil bacteria [64, 72, 73]. However, the �ndingthat soil pH had a minor impact on bacterial alpha and beta diversity was unexpected. Soil pH is anintegrated functional index related to soil characteristics [74] that imposes physiological stress onindividual growth and the microbial distribution [75]. Archaea inhabit more restricted ecological niches,which may make them more sensitive to soil pH variations along elevational gradients than bacteria [76].Vegetation is the key driver of soil microbial diversity through the alteration of soil nutrient cycling [77–78]. For instance, plant diversity exerts a substantial in�uence on soil bacterial beta diversity [79].Vegetation richness was found to have the strongest impact on bacterial richness, which was in line withprevious studies [80–81] and in accord with the productivity hypothesis, which emphasizes the positiveeffect of resources on species diversity [9, 58]. Higher-diversity plant communities are composed of morediverse leaves and roots, and the release of more diverse root exudates can promote soil microbialdiversity [82]. For instance, the diversity of soil bacteria peaks under conditions of high phosphorusavailability but relatively low total carbon levels [83]. Vegetation richness showed signi�cant positiverelationships with TP and TOC (Fig. S4). Furthermore, vegetation richness and bacterial richness showeda nonlinear relationship (Fig. S12). These results indicated that energy variables were limiting factors forbacterial richness. The unexplained variations (> 85%) in microbial richness may have been caused byunmeasured environmental factors or biological factors [84]. It was further concluded that the elevationalpatterns of the alpha and beta diversity of microbial phyla were driven by distinct variables largely due toniche differentiation among taxa along elevational gradients [15]. For instance, the richness ofAcidobacteria showed a decreasing elevational pattern and was strongly correlated with temperature,which was consistent with Bryant’s �ndings [85].
5. ConclusionsOur literature analysis revealed that soil species richness is dominated by a nonsigni�cant elevationalpattern, followed by signi�cant decreasing patterns under different combinations of temperature andprecipitation. Furthermore, archaeal richness and evenness exhibited decreasing elevational patterns,while bacterial richness and evenness showed nonsigni�cant and U-shaped elevational patterns,respectively. The LCBD values of both microbial groups and most phyla (12/14) showed signi�cant U-shaped elevational patterns, and the lowest values were found at mid-elevations. The variations inspecies richness, evenness and LCBD were primarily explained by local environmental variables or energyvariables, such as soil pH, K/Al, TN and vegetation richness, while the community composition was moststrongly explained by the moisture index, followed by MAT and MAP. Our results also highlighted that

Page 13/22
temperature exerted considerable direct and indirect effects on microbial alpha and beta diversity, whileprecipitation exerted relatively minor and indirect effects. Overall, these results suggested thattemperature, precipitation and their interactions profoundly in�uence microbial beta diversity alongelevational gradients in alpine grasslands in semiarid areas.
DeclarationsCon�ict of Interest
The authors declare that they have no con�icts of interest.
Author Contributions
Xiaoqin Yang: Conceptualization, Investigation, Validation, Data analyzation, Writing-original draft,Writing-review & editing. Jianjun Wang: Conceptualization, Validation, Formal analysis and Methodology,Writing-review & editing. Gengxin Zhang: Supervision,Resources, Funding acquisition, Conceptualization,Validation, Writing-review & editing. Yue Li: Data analyzation. Yibo Yang: Data curation, Writing-review &editing. Bin Niu, Qiuyu Chen, Yilun Hu, Lili Song: Writing-review & editing. All co-authors participated indiscussions and revised the manuscript.
Acknowledgements
We are grateful to Conghai Han for soil sample collection. This research was supported by grants fromthe National Natural Science Foundation of China (41871066, 41471055), the Strategic Priority ResearchProgram (A) of the Chinese Academy of Sciences (XDA20050101), and the Second Tibetan PlateauScienti�c Expedition and Research Program (STEP) (2019QZKK0503).
References1. Gaston KJ (2000) Global patterns in biodiversity. Nature 405:220–227
2. Rahbek C, Borregaard MK, Colwell RK et al (2019) Humboldt’s enigma: what causes global patternsof mountain biodiversity? Science 365:1108–1113
3. Peters MK, Hemp A, Appelhans T et al (2019) Climate-land-use interactions shape tropical mountainbiodiversity and ecosystem functions. Nature 568:88–92
4. Zhou J, Deng Y, Shen L et al (2016) Temperature mediates continental-scale diversity of microbes inforest soils. Nat Commun 7:12083
5. Tian J, Wu B, Chen H et al (2017) Patterns and drivers of fungal diversity along an altitudinalgradient on Mount Gongga, China. J Soils Sediments 17:2856–2865
�. Duclos TR, DeLuca WV, King DI (2019) Direct and indirect effects of climate on bird abundance alongelevation gradients in the Northern Appalachian Mountains. Divers Distrib 25:1670–1683

Page 14/22
7. Shen C, Gunina A, Luo Y et al (2020) Contrasting patterns and drivers of soil bacterial and fungaldiversity across a mountain gradient. Environ Microbiol 22:3287–3301
�. Price CA, Weitz JS, Savage VM et al (2012) Testing the metabolic theory of ecology. Ecol Lett15:1465–1474
9. Hurlbert AH, Stegen JC (2014) When should species richness be energy limited, and how would weknow? Ecol Lett 17:401–413
10. Miyamoto Y, Nakano T, Hattori M et al (2014) The mid-domain effect in ectomycorrhizal fungi: rangeoverlap along an elevation gradient on Mount Fuji, Japan. ISME J 8:1739–1746
11. Lennon JT, Aanderud ZT, Lehmkuhl BK et al (2012) Mapping the niche space of soil microorganismsusing taxonomy and traits. Ecology 93:1867–1879
12. Angel R, Soares MIM, Ungar ED et al (2010) Biogeography of soil archaea and bacteria along a steepprecipitation gradient. ISME J 4:553–563
13. Treves DS, Xia B, Zhou J et al (2003) A two-species test of the hypothesis that spatial isolationin�uences microbial diversity in soil. Microb Ecol 45:20–28
14. McCain CM (2009) Global analysis of bird elevational diversity. Glob Ecol Biogeogr 18:346–360
15. Yeh CF, Soininen J, Teittinen A et al (2019) Elevational patterns and hierarchical determinants ofbiodiversity across microbial taxonomic scales. Mol Ecol 28:86–99
1�. Hu A, Wang J, Sun H et al (2020) Mountain biodiversity and ecosystem functions: interplay betweengeology and contemporary environments. ISME J 14:931–944
17. McCain CM, Grytnes JA (2010) Elevational Gradients in Species Richness, Encyclopedia of LifeSciences. John Wiley & Sons, Chichester
1�. Lanzen A, Epelde L, Blanco F et al (2016) Multi-targeted metagenetic analysis of the in�uence ofclimate and environmental parameters on soil microbial communities along an elevational gradient.Sci Rep 6:28257
19. Frindte K, Pape R, Werner K et al (2019) Temperature and soil moisture control microbial communitycomposition in an arctic-alpine ecosystem along elevational and micro-topographic gradients. ISMEJ 13:2031–2043
20. Gorban AN, Pokidysheva LI, Smirnova EV et al (2011) Law of the Minimum Paradoxes. Bull MathBiol 73:2013–2044
21. Kessler M, Kluge J, Hemp A et al (2011) A global comparative analysis of elevational speciesrichness patterns of ferns. Glob Ecol Biogeogr 20:868–880
22. Wang Z, Luo T, Li R et al (2013) Causes for the unimodal pattern of biomass and productivity inalpine grasslands along a large altitudinal gradient in semi-arid regions. J Veg Sci 24:189–201
23. Nottingham AT, Fierer N, Turner BL et al (2018) Microbes follow Humboldt: temperature drives plantand soil microbial diversity patterns from the Amazon to the Andes. Ecology 99:2455–2466
24. Singh D, Lee-Cruz L, Kim WS et al (2014) Strong elevational trends in soil bacterial communitycomposition on Mt. Halla, South Korea. Soil Biol Biochem 68:140–149

Page 15/22
25. Deshmukh A, Singh RA (2019) Whittaker biome-based framework to account for the impact ofclimate change on catchment behavior. Water Resour Res 55:11208–11224
2�. Hijmans RJ, Cameron SE, Parra JL et al (2005) Very high resolution interpolated climate surfaces forglobal land areas. Int J Climatol 25:1965–1978
27. Fang J, Yoda K (1990) Climate and vegetation in China III water balance and distribution ofvegetation. Ecol Res 5:9–23
2�. Bremner JM (1960) Determination of nitrogen in soil by the Kjeldahl method. J Agr Sci 55:11–33
29. Shi Y, Li Y, Xiang X et al (2018) Spatial scale affects the relative role of stochasticity versusdeterminism in soil bacterial communities in wheat �elds across the North China Plain. Microbiome6:27
30. Yang Y, Fang X, Galy A et al (2016) Plateau uplift forcing climate change around 8.6 Ma on thenortheastern Tibetan Plateau: evidence from an integrated sedimentary Sr record. PalaeogeogrPalaeoclimatol Palaeoecol 461:418–431
31. Nesbitt HW, Young GM (1982) Early proterozoic climates and plate motions inferred from majorelement chemistry of lutites. Nature 299:715–717
32. Caporaso JG, Lauber CL, Walters WA et al (2011) Global patterns of 16S rRNA diversity at a depth ofmillions of sequences per sample. Proc Natl Acad Sci USA108:4516–4522
33. Van den Hoecke S, Verhelst J, Vuylsteke M et al (2015) Analysis of the genetic diversity of in�uenzaA viruses using next-generation DNA sequencing. BMC Genom 16:79
34. Li H, Handsaker B, Wysoker A et al (2009) The sequence alignment/map (SAM) format andSAMtools. Bioinformatics 25:2078–2079
35. Cole JR, Wang Q, Cardenas E et al (2009) The Ribosomal Database Project: improved alignmentsand new tools for rRNA analysis. Nucleic Acids Res 37:D141–D145
3�. Wang J, Meier S, Soininen J et al (2017) Regional and global elevational patterns of microbialspecies richness and evenness. Ecography 40:393–402
37. Pielou EC (1966) Measurement of diversity in different types of biological collections. J Theor Biol13:131–144
3�. Legendre P, De Caceres M (2013) Beta diversity as the variance of community data: dissimilaritycoe�cients and partitioning. Ecol Lett 16:951–963
39. Roberts FS (2019) Measurement of Biodiversity: Richness and Evenness. Springer, Cham
40. Jost L (2010) The relation between evenness and diversity. Diversity 2:207–232
41. Martiny JB, Eisen JA, Penn K et al (2011) Drivers of bacterial beta-diversity depend on spatial scale.Proc Natl Acad Sci USA 108:7850–7854
42. Wang J, Wu Y, Jiang H et al (2008) High beta diversity of bacteria in the shallow terrestrialsubsurface. Environ Microbiol 10:2537–2549
43. Yamaoka K, Nakagawa T, Uno T (1978) Application of Akaikes information criterion (AIC) inevaluation of linear pharmacokinetic equations. J Pharmacokinet Pharmacodyn 6:165–175

Page 16/22
44. Lawrence RL, Wood SD, Sheley RL (2006) Mapping invasive plants using hyperspectral imagery andBreiman Cutler classi�cations (RandomForest). Remote Sens Environ 100:356–362
45. Grace JB, Anderson TM, Olff H et al (2010) On the speci�cation of structural equation models forecological systems. Ecol Monog 80:67–87
4�. Rosseel Y (2012) Lavaan: an R package for structural equation modeling. J Stat Softw 48:1–36
47. Tedersoo L, Bahram M, Polme S et al (2014) Global diversity and geography of soil fungi. Science346:1256688
4�. Bahram M, Hildebrand F, Forslund SK et al (2018) Structure and function of the global topsoilmicrobiome. Nature 560:233–237
49. Zheng Y, Ji N, Wu B et al (2020) Climatic factors have unexpectedly strong impacts on soil bacterialβ-diversity in 12 forest ecosystems. Soil Biol Biochem 142:107699
50. Looby CI, Martin PH (2020) Diversity and function of soil microbes on montane gradients: the stateof knowledge in a changing world. FEMS Microbiol Ecol 96:�aa122
51. Yuan Y, Si G, Li W et al (2015) Altitudinal distribution of ammonia-oxidizing archaea and bacteria inalpine grassland soils along the south-facing slope of Nyqentangula mountains, central TibetanPlateau. Geomicrobiol J 32:77–88
52. Singh D, Takahashi K, Park J et al (2016) Similarities and contrasts in the archaeal community oftwo Japanese mountains: Mt. Norikura compared to Mt. Fuji Microb Ecol 71:428–441
53. Shearer CA, Zelski SE, Raja HA et al (2015) Distributional patterns of freshwater ascomycetescommunities along an Andes to Amazon elevational gradient in Peru. Biodivers Conserv 24:1877–1897
54. Wang J, Legendre P, Soininen J et al (2019) Temperature drives local contributions to beta diversityin mountain streams: stochastic and deterministic processes. Glob Ecol Biogeogr 29:420–432
55. Zhang Y, Cong J, Lu H et al (2015) Soil bacterial diversity patterns and drivers along an elevationalgradient on Shennongjia Mountain, China. Microbiol Biotechnol 8:739–746
5�. Sheng Y, Cong W, Yang L et al (2019) Forest soil fungal community elevational distribution patternand their ecological assembly processes. Front Microbiol 10:02226
57. Brown JH (2001) Mammals on mountainsides: elevational patterns of diversity. Global Ecol Biogeogr10:101–109
5�. Hawkins BA, Field R, Cornell HV et al (2003) Energy, water, and broad-scale geographic patterns ofspecies richness. Ecology 84:3105–3117
59. Jankowski JE, Ciecka AL, Meyer NY et al (2009) Beta diversity along environmental gradients:implications of habitat specialization in tropical montane landscapes. J Anim Ecol 78:315–327
�0. Sundqvist MK, Sanders NJ, Wardle DA et al (2013) Community and ecosystem responses toelevational gradients: processes, mechanisms, and insights for global change. Annu Rev Ecol EvolSyst 44:261–280

Page 17/22
�1. Condit R, Engelbrecht BMJ, Pino D et al (2013) Species distributions in response to individual soilnutrients and seasonal drought across a community of tropical trees. Proc Natl Acad Sci USA110:5064–5068
�2. Wang J, Pan F, Soininen J et al (2016) Nutrient enrichment modi�es temperature-biodiversityrelationships in large-scale �eld experiments. Nat Commun 7:13960
�3. Picazo F, Vilmi A, Aalto J et al (2020) Climate mediates continental scale patterns of streammicrobial functional diversity. Microbiome 8:1–14
�4. Yuan Y, Si G, Wang J et al (2014) Bacterial community in alpine grasslands along an altitudinalgradient on the Tibetan Plateau. FEMS Microbiol Ecol 87:121–132
�5. Shigyo N, Umeki K, Hirao T (2019) Plant functional diversity and soil properties control elevationaldiversity gradients of soil bacteria. FEMS Microbiol Ecol 95:�z025
��. Wang S, Bao X, Feng K et al (2021) Warming-driven migration of core microbiota indicates soilproperty changes at continental scale. Sci Bull 01:021
�7. Ma M, Collins SL, Du G (2020) Direct and indirect effects of temperature and precipitation on alpineseed banks in the Tibetan Plateau. Ecol Appl 30:e02096
��. Peters MK, Hemp A, Appelhans T (2016) Predictors of elevational biodiversity gradients change fromsingle taxa to the multi-taxa community level. Nat Commun 7:3736
�9. Jenerette GD, Scott RL, Huxman TE (2008) Whole ecosystem metabolic pulses followingprecipitation events. Funct Ecol 22:924–930
70. Chen Q, Niu B, Hu Y et al (2020) Warming and increased precipitation indirectly affect thecomposition and turnover of labile-fraction soil organic matter by directly affecting vegetation andmicroorganisms. Sci Total Environ 714:136787
71. Rengel Z (2011) Soil pH, Soil Health and Climate Change. Springer-Verlag, Berlin
72. Shen C, Xiong J, Zhang H et al (2013) Soil pH drives the spatial distribution of bacterial communitiesalong elevation on Changbai Mountain. Soil Biol Biochem 57:204–211
73. Shen C, Liang W, Shi Y et al (2014) Contrasting elevational diversity patterns between eukaryotic soilmicrobes and plants. Ecology 95:3190–3202
74. Siciliano SD, Palmer AS, Winsley T et al (2014) Soil fertility is associated with fungal and bacterialrichness, whereas pH is associated with community composition in polar soil microbialcommunities. Soil Biol Biochem 78:10–20
75. Barcenas-Moreno G, Baath E, Rousk J (2016) Functional implications of the pH-trait distribution ofthe microbial community in a re-inoculation experiment across a pH gradient. Soil Biol Biochem93:69–78
7�. Bates ST, Berg-Lyons D, Caporaso JG et al (2011) Examining the global distribution of dominantarchaeal populations in soil. ISME J 5:908–917
77. Prescott CE, Grayston SJ (2013) Tree species in�uence on microbial communities in litter and soil:current knowledge and research needs. For Ecol Manag 309:19–27

Page 18/22
7�. Leff JW, Bardgett RD, Wilkinson A et al (2018) Predicting the structure of soil communities from plantcommunity taxonomy, phylogeny, and traits. ISME J 12:1794–1805
79. Wang J, Wang Y, He N et al (2020) Plant functional traits regulate soil bacterial diversity acrosstemperate deserts. Sci Total Environ 715:136976
�0. Delgado-Baquerizo M, Fry EL, Eldridge DJ et al (2018) Plant attributes explain the distribution of soilmicrobial communities in two contrasting regions of the globe. New Phytol 219:574–587
�1. Vetaas OR, Paudel KP, Christensen M (2019) Principal factors controlling biodiversity along anelevation gradient: water, energy and their interaction. J Biogeogr 46:1652–1663
�2. Santonja M, Rancon A, Fromin N et al (2017) Plant litter diversity increases microbial abundance,fungal diversity, and carbon and nitrogen cycling in a Mediterranean shrubland. Soil Biol Biochem111:124–134
�3. Delgado-Baquerizo M, Reich PB, Khachane AN et al (2017) It is elemental: soil nutrient stoichiometrydrives bacterial diversity. Environ Microbiol 19:1176–1188
�4. Dini-Andreote F, Stegen JC, van Elsas JD et al (2015) Disentangling mechanisms that mediate thebalance between stochastic and deterministic processes in microbial succession. Proc Natl Acad SciUSA 112:E1326–E1332
�5. Bryant JA, Lamanna C, Morlon H et al (2008) Microbes on mountainsides: contrasting elevationalpatterns of bacterial and plant diversity. Proc Natl Acad Sci USA 105:11505–11511
Figures

Page 19/22
Figure 1
Sampling maps, Whittaker biome of sampling sites and hypothesized mechanisms for microbialcommunities. (a) Sampling sites with a nested design on Nyainqentanglha Mountain, Tibet. Thiselevational gradient extends across the alpine steppe and meadow ecosystems. (b) The mean annualtemperature (MAT) and mean annual precipitation (MAP) of the sampling sites were projected onto theWhittaker biome plot. (c) Conceptual model showing hypothesized relationships among temperature,precipitation, local and energy variables and microbial diversity. The abbreviations for the environmentalvariables and their groups are listed in Table S4. Alpha or Beta div: microbial alpha or beta diversity.

Page 20/22
Figure 2
Elevational patterns in microbial community biodiversity. Species richness (a), evenness (b) and the localcontribution to beta diversity (LCBD, c) were considered in the archaeal or bacterial communities and theirphyla. The abbreviations for the phyla are listed in Table S2. A linear or quadratic model was selectedbased on the lower value of Akaike’s information criterion. The biodiversity trends of the whole archaealand bacterial communities are presented with bold red and black lines, respectively, and the trends ofphylum biodiversity are shown with �ne coloured lines. The solid and dotted lines represent signi�cant (P

Page 21/22
0.05) and nonsigni�cant (P 0.05) results, respectively. Principal coordinate analysis (PCoA) plots of thecomposition of archaea (d) and bacteria (e). MAT and MAP of the sampling sites are shown in PCoAplots. The contours in grey indicate linear relationships between PCoA ordination values and elevations.ACI: Acidobacteria; ACT: Actinobacteria; ARM: Armatimonadetes; BAC: Bacteroidetes; CHF: Chloro�exi;CRE: Crenarchaeota; CYA: Cyanobacteria; FIR: Firmicutes; GEM: Gemmatimonadetes; NIT: Nitrospirae;PLA: Planctomycetes; PRO: Proteobacteria; VER: Verrucomicrobia.
Figure 3
Relative importance of environmental variables for archaeal and bacterial richness (a, e), evenness (b, f),LCBD (c, g) and PCoA1 (d, h). Relative importance was determined through random forest analysisincluding three groups of predictors: climate, energy and local variables. The abbreviations for theenvironmental variables and their groups are listed in Table S4.

Page 22/22
Figure 4
Structural equation models of archaeal and bacterial richness (a, e), evenness (b, f), LCBD (c, g) andPCoA1 (d, h). The environmental variables included four groups of predictors: temperature, precipitation,energy and local variables. R2 denotes the proportion of variance explained for endogenous variables.Blue and red arrows indicate positive and negative relationships, respectively. Arrow widths andaccompanying numbers represent the standardized path coe�cients of the modelled relationships (*P <0.05, **P < 0.01, ***P < 0.001). Composite and observed variables are indicated in ovals and rectangles,respectively. More details on the model �t are summarized in Tables S5-S6. The standardized totaleffects are listed in Fig. S19 and Table S7.
Supplementary Files
This is a list of supplementary �les associated with this preprint. Click to download.
SupplementaryMaterial.docx