patterns in the distribution of freshwater fishes in rivers
TRANSCRIPT

Patterns in the distribution of freshwater fishes in rivers of Central Western
Ghats, India and their associations with environmental gradients
Anuradha BhatCentre for Ecological Science, Indian Institute of Science, Bangalore 560012, India
(Tel.: +49-0221-5796366, E-mail: [email protected])
Received 25 February 2003; in revised form 16 March 2004; accepted 26 March 2004
Key words: community structure, species richness, composition, stream parameters, correlation, multivariate analysis
Abstract
The community ecology of freshwater fishes in four river systems (Sharavati, Aghanashini, Bedti and Kali)of the central Western Ghats (India) has been studied for the first time. Patterns of fish species distributionswere analysed and important stream and environmental parameters determining the species richness andcomposition of this region were identified. Upstream–downstream trends in species richness and diversityas well as changes in stream characteristics were studied using univariate correlation analyses. Preliminaryanalyses on changes in species composition and feeding guilds showed the presence of a gradual speciesturnover along the stream gradient. There were associated changes in the major feeding guild compositions,with a higher proportion of insectivore and algivore/herbivore composition in the upper reaches shifting toa predominance of omnivores and carnivores downstream. Pearson’s product–moment correlation analysesalong with stepwise multiple regression analyses identified stream depth and altitude as the importantparameters determining species richness. Canonical correspondence analysis was performed to study spe-cies associations with environmental parameters. The analysis showed a strong species–environmentalcorrelation to the CCA axes, a high significance for the CCA axis 1 as well as for the overall test. The plotsof the species and site scores on the CCA axes showed a clear segregation of species based on their relationswith environmental and stream properties. This study is an important step in our understanding of thecommunity structure of fish species of these rivers and would be helpful in future efforts on the conservationof aquatic communities and their habitats.
Introduction
One of the interesting aspects of community ecologystudies has been that of patterns in assemblagestructure and their relationships to biotic and abi-otic factors. At the global scale, river size (surfacearea of the drainage basin and themean annual riverdischarge) and the energy availability (net primaryproductivity) are two important factors influencingfish species richness patterns (Oberdorff et al.,1995). Species richness at local scales, however, aremore dependent on biological factors like compe-
tition (Grossman, 1982; Ross et al., 1985) and pre-dation (Moyle & Vondracek, 1985) as well asphysical factors like habitat diversity (Gorman &Karr, 1978), water chemistry, flow regimes, tem-perature and channel morphology (Horwitz, 1978;Schlosser, 1982). Earliest studies on the relationshipof community diversity to habitat diversity dem-onstrated an increase in community diversity withvegetation complexity (MacArthur, 1964; Rosen-weig & Winakur, 1969; Pianka, 1967). For fishcommunities, substrate complexity, stream flowand water quality characteristics were found to be
Hydrobiologia 529: 83–97, 2004.� 2004 Kluwer Academic Publishers. Printed in the Netherlands. 83
important in determining local richness (Gorman&Karr, 1978).
The River Continuum Concept, originallypostulated for aquatic invertebrates, predicts thatthere is an upstream–downstream gradient ofchanging physical conditions and associated bioticchanges (Vannote et al., 1980). Species assortthemselves along environmental gradients like pH,temperature etc. and their diversity increases ingoing from upstream to downstream. Fromobservations on tropical and temperate ecosys-tems, Lowe-McConnell (1975) explained this pat-tern as being related to habitat diversity which alsoincreases along the upstream to downstream gra-dient. This, in addition to a greater richness ofdetritus and plankton downstream, could lead togreater diversity in the higher trophic levels.
Studies in temperate (Fausch et al., 1984; Belliardet al., 1997) and tropical systems like Western Africa(Hugeuny, 1989) and in the LowerNtemRiver Basinof Cameroon (Kamdem Toham & Teugels, 1997,1998) highlight the occurrence of a distinct pattern inthe longitudinal zonation of species: they found asequential shift in species composition together withan increase in species diversity along the stream gra-dient, influenced by environmental and physicalcharacteristics of the stream likewidth, depth, currentvelocity and substrate type, as well as biotic charac-teristics like canopy cover and instream cover. In-stream cover is known to influence habitat featureslike depth and stream current (Angermeier & Karr,1983) and also enhance invertebrate productionimportant for fish feeding (Benke et al., 1984).Wright&Li (2002), in studying thepatternof streamphysicalparameters and community distribution, developed aframework for using multivariate ordination tech-niques to integrate continuous and patchy patterns.Fish communities were found to be strongly corre-lated to large, landscape-scale physical gradients andwere generally distributed along a continuous longi-tudinal gradient.
The Western Ghats (WG), located along thesouthwest coastline of the Indian subcontinent, is abiodiversity ‘hotspot’ (Myers et al., 2000) and isextremely rich in its fish diversity as well as ende-micity (Bhat, 2003; Dahanukar et al., 2004). Verylittle, however, is known of the community ecologyanddistributionpatterns of fish fauna in the streamsand rivers of this region except for some isolatedstudies (parts of the Western and the Eastern Ghat
hill streams) for fishes (Arunachalam, 2000) andinvertebrates (Sivaramakrishnan et al., 1995). Themain objective of this work is to study the patternsof species distribution in some rivers of the centralWestern Ghats. Some of the questions addressedhere are as follows.What are the patterns of changesin important stream characteristics like width,depth and current along the streams in the WesternGhats? How does the community structure of fisheschange along these longitudinal stream gradients?Are these similar to patterns found in other regionsof the world, especially to those observed in othertropical streams? In answering them, we test thehypothesis that there is a gradation of speciesdiversity as well as community structure character-ized by species additions and replacements and thatthe compositions change markedly from upstreamto downstream. Finally, what is the relationship offish composition to varying environmental gradi-ents along these rivers?
Materials and methods
Study area
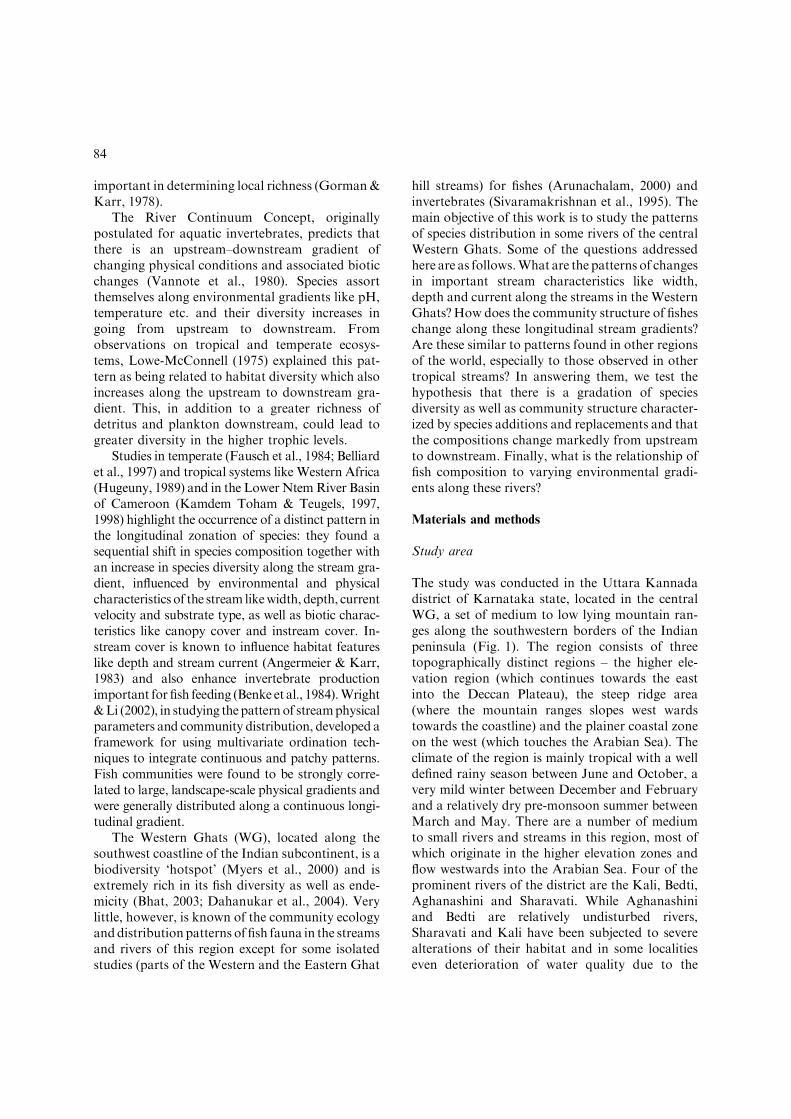
The study was conducted in the Uttara Kannadadistrict of Karnataka state, located in the centralWG, a set of medium to low lying mountain ran-ges along the southwestern borders of the Indianpeninsula (Fig. 1). The region consists of threetopographically distinct regions – the higher ele-vation region (which continues towards the eastinto the Deccan Plateau), the steep ridge area(where the mountain ranges slopes west wardstowards the coastline) and the plainer coastal zoneon the west (which touches the Arabian Sea). Theclimate of the region is mainly tropical with a welldefined rainy season between June and October, avery mild winter between December and Februaryand a relatively dry pre-monsoon summer betweenMarch and May. There are a number of mediumto small rivers and streams in this region, most ofwhich originate in the higher elevation zones andflow westwards into the Arabian Sea. Four of theprominent rivers of the district are the Kali, Bedti,Aghanashini and Sharavati. While Aghanashiniand Bedti are relatively undisturbed rivers,Sharavati and Kali have been subjected to severealterations of their habitat and in some localitieseven deterioration of water quality due to the
84

construction of dams and reservoirs as well asindustries along the rivers (Bhat, 2002).
Sampling
The present study was conducted on the four riversystems – Sharavati, Aghanashini, Bedti and Kali –details of the length, catchment areas and dischargeare summarized in Table 1. Fishes were sampledregularly (using a variety of fishing nets of varyingmesh sizes – gill nets, cast nets and dragnets) over aperiod of 2 years (January 1997–April 1999) on 24sampling sites (details are tabulated in Appendix 1).
Due to the specific topography of the WesternGhats, such that after a relatively gentle slopefrom the Western coastline, there is a steep rise inelevation at �250 m and further eastwards, thesemountains join the Deccan Plateau (at �650 m),the sites were chosen such that each river had 6sampling sites: three on the higher elevation zone(>250 m) and three on the mid and lower elevationzones (<250 m).
100–150 m stretches of the river at each sitewere sampled. For the study, a ‘sample’ is definedas the collection made at a particular habitat usinga particular sampling tool (cast nets, gillnets or
Figure 1. Map of the study region (Uttara Kannada) indicating the sampling sites (shown by a dot and the site code).
Table 1. River lengths, catchment area, annual discharge, and other physical attributes
River Total length
(km)
Catchment
area (km2)
Annual discharge
(million m3)
No. of
major dams
Pollution
Sharavati 128 2208 4545 2 Unpolluted
Aghanashini 75 2146 966 – Unpolluted
Bedti 152 3902 4925 – Minimal – some sewage discharged
Kali 184 5179 6537 4 Industrial effluents
85

dragnets). A total of 340 samples were collectedfrom the entire study region (including all the 24sites on the four rivers). The fishes were identifiedand some representative specimens were collectedand preserved (in 4% formaldehyde solution).Identification was carried out based on keys(Jayaram, 1999; Talwar & Jhingran, 1991) andwith the help of taxonomic expertise from theRegional Station of the Zoological Survey of Indiaat Chennai. A detailed description of samplingmethodology is presented in Bhat (2003).
Physical characteristics
At each site, the following physical parametersof the stream were measured at 4–5 points,each 25 m apart – (a) stream depth, measuredat three separate parts of the stream – two mea-surements at 1/3 distance of the stream widthfrom both sides of the bank and one at the centre ofthe stream, (b) stream width and (c) stream velocityat the point of maximum flow. The stream velocitywas calculated by measuring the time taken for acork to cover a unit distance. Data on the watertemperature, pH (pH meter – Salvin Instruments,India), % canopy cover (based on a visual estima-tion of sky visible from the centre of the stream) andthe type of riparian vegetation along the streamwere also collected. The% canopy cover values weredivided into five categories – 0–20% (category 1),20–40% (category 2), 40–60% (category 3), 60–80%(category 4) and 80–100% (category 5).Altitudes forthe areas closest to the sampling sites were notedwith the help of 1:50 000 scale maps of the Geolog-ical Survey of India. Substrate types found in thesampling sites were divided into the following cat-egories – (1) rocks, (2) pebbles and gravel and (3)sand and silt. A value of 0 or 1was designated for theabsence or presence of either of these variables ateach of the sites.
Not much is known about the feeding ecol-ogy of most of the non-commercial native fishesin the Indian subcontinent. However, informationon the major feeding habits of some of the spe-cies available in the literature (Talwar & Jhin-gran, 1991) was collected for interpretationof distribution patterns of feeding guilds.These guilds have been broadly categorisedinto seven divisions – algivore, herbivore, insecti-vore, larvivore, omnivore, carnivore and piscivore.
Data analyses
Total species richness at upstream and down-stream reaches of the four rivers was measured bycalculating the total number of species collectedfrom the three sites on each stream reach. Speciesdiversity at each stream reach was measured usingthe Shannon–Weiner index and differences inspecies composition across reaches were calculatedas the Jaccard index of coefficient of species simi-larity (Ludwig & Reynolds, 1988). Comparison ofspecies richness across upstream–downstreamreaches was done after rarefaction of the data andcalculation of mean species richness values for 200randomised Monte Carlo simulations. This wasdone in order to remove any biases which can beencountered due to differences in sampling effortacross sites (Colwell & Coddington, 1994).Spearman rank (non-parametric) correlations wereused for studying changes in species richness andabiotic parameters along the river gradient whilecorrelations between species richness and eachabiotic parameter was done with Pearson’s prod-uct–moment (parametric) correlation method.
Trends in upstream to downstream gradients
Mean values of the physical parameters were usedin all the correlation analysis (Table 2). The loca-tion of a site on the stream gradient was deter-mined by the stream order on which it was locatedas well as its elevation from sea level. Two mea-sures of habitat quality were used for the analyses– (a) size measured by the mean width, current anddepth and (b) variability, measured by the per-centage coefficient of variation of width, currentand depth. Percent coefficient of variation (% CV)is a measure of habitat variability and diversity(Gorman & Karr, 1978) and was included in theanalyses to test for correlations between habitatdiversity and species richness.
Fish communities in tropical streams areknown to show a gradual species turnover alongthe gradient – due to addition of more species,replacement of a species by another occupying thesame niche, or deletion of species (Kamdem To-ham & Tuegels, 1998). Based on qualitative datafrom literature, changes in feeding guild structureof fish communities along gradients in rivers ofWG were compared. As a preliminary study, the
86

proportions for each feeding guild in the upstreamand downstream reaches were calculated withinAghanashini and Bedti.
Multivariate analyses
Two methods of analyses were employed in calcu-lating correlations and understanding the associa-tion of species richness and composition to thevarious environmental parameters. Multipleregression method using a stepwise selection ofparameters was used to study correlation of multi-ple environmental parameters to species richness. Asimplifiedmodel for species richness based on large-scale physical parameters was thus developed.
Ordination analysis with the direct gradient tech-nique of the canonical correspondence analyses wasperformed to study the association of these environ-mental parameters to species composition. Thismethod chooses the ordination axes on the basis of
species and environmental data and determines loca-tions for sites (samples) and species in ecological spaceassuming a Gaussian-type response of species toenvironmental gradients (Ter Braak, 1985, 1986). Forthis study, additional variables like the % canopycover, pH value and the three categories of substratetypes (rock, pebbles and sand) were also includedalong with the width, depth, current velocity andaltitude parameters. Species abundance data was logtransformed (ln(x)) to obtain a more normal distri-bution. All the species collected from the 24 samplingsites were included in the analysis, after downweigh-ting for rare specieswith less than20 individuals.CCAwas conducted with the forward selection procedurewhere the significance of each variable was testedwitha Monte Carlo simulation algorithm (with 999 ran-dom permutations) before adding to the model.However, all the variables were included in the finalmodel. The relative contribution of the ordinationaxes was evaluated by the canonical coefficients and
Table 2. Mean values of stream width, depth, current velocity and altitude for each study site on Sharavati (S), Kali (K), Aghanashini
(A) and Bedti (B)
Site River Width (m) Depth (m) Current (m/s) Altitude (m)
Allanki S 86.7 1.68 1.51 30
Gersoppa bate S 123.2 – 2.86 40
Gersoppa nursery S 183.3 – 1.00 40
Jog falls S 17.20 0.43 0.65 496
Joginmatha S 157.7 3.65 – 374
Chainagate S 15.0 2.00 2.04 476
Balur A 29.6 0.70 1.31 633
Bilgi A 24.1 0.57 1.28 630
Manihole A 25.7 0.67 0.86 603
Serkuli A 15.3 0.68 2.48 500
Kirtigadde A 79.5 0.77 1.88 38
Hulidevarakodlu A 79.1 0.64 1.27 28
Pattnahole B 19.5 0.40 1.71 472
Kumbri B 41.1 0.89 1.08 428
Manchikeri B 19.2 0.55 2.49 422
Ganeshpal B 23.5 0.37 1.22 395
Ramanguli B 69.8 0.46 1.24 60
Hoskambi B 54.4 0.82 2.84 20
Bommanahalli K 43.5 0.16 – 427
Dandelappa K 57.5 – 1.25 440
Maulangi K 121.6 0.66 0.88 460
Ganeshgudi K 152.0 2.40 1.88 80
Nujji K 27.9 0.76 1.03 560
Kadra K 187.5 – – 20
– indicated where readings could not be taken.
87

interset correlations. The interset correlations are thecorrelation coefficients between the environmentalvariable and the ordination axes. The species–envi-ronment correlation is a measure of the associationbetween species and the environmental variable (TerBraak, 1988).
All the statistical analyses and generation ofgraphs were performed using the STATISTICA(Statsoft version 5.0) and CANOCO (version 3.12)software packages.
Results
10 771 individuals of 92 species belonging to 25families and 45 genera were collected from the fourrivers. Appendix 2 shows the names and codes forthe most abundant species collected in this region.
Species richness and diversity
Total species richness aswell as abundancewas highestfor Bedti upstream reaches (SR ¼ 47) while the lowestwas recorded for Sharavati downstream region(SR ¼ 26).Within rivers, Aghanashini had the highestnumber of species shared between its two reaches
(JI ¼ 2.30) whereas Sharavati showed the least over-lap of species between the reaches (JI ¼ 0.46). Abun-dances and sampling efforts at each reach being
Table 3. Total species richness, abundance, rarefied species
richness and Jaccard index of species similarity between upstream
and downstream reach of each study river
Total
species
richness
Individuals Species
richness
for 500
individuals
Jaccard
index
Sharavati
upstream
36 905 28 0.46
Sharavati
downstream
26 524 36
Aghanashini
upstream
37 1835 24 2.30
Aghanashini
downstream
35 1129 25
Bedti upstream 47 3117 23 0.62
Bedti
downstream
36 1310 25
Kali upstream 38 1196 27 1.36
Kali downstream 33 685 28
Table 4. Results of the correlation analyses (Spearman’s rank correlation) of environmental parameters with stream gradient (Panel
A), (Pearson’s product–moment correlation) of environmental parameters with species richness (SR) (Panel B)
Parameter Aghanashini Bedti Sharavati Kali
Panel A
Mean width (m) 0.60 0.77 0.31 0.77
Mean depth (m) 0.37 0.60 )0.10 0.20
Mean current velocity (m/s) 0.25 0.25 0.20 0.80
% CV (width) 0.14 0.60 0.02 )0.20
% CV (depth) 0.02 )0.20 0.30 0.90
% CV (velocity) )0.25 0.31 )0.30 0.20
Species richness (SR) 0.88 0.65 )0.40 0.30
Shannon’s index 0.60 0.03 )0.60 )0.14
Panel B
Mean width (m) 0.55 0.36 )0.24 0.48
Mean depth (m) 0.44 0.88 0.13 )0.34
Mean current velocity (m/sec) 0.70 0.18 )0.25 )0.42
% CV (width) 0.19 0.05 0.79 )0.24
% CV (depth) 0.18 0.49 0.55 )0.03% CV (velocity) )0.03 )0.26 )0.39 )0.92
Altitude (m) )0.92 )0.15 0.47 0.10
Values of the correlation coefficient (r) are shown. Significant correlations (p < 0.05) indicated in bold. CV = Coefficient of variation.
88

Table 5. Species addition, substitution and deletion along
upstream–downstream gradient on Aghanashini and Bedti
Code Upstream sites Downstream sites
Aghanashini
Na + ) ) ) ) )Ps + + + + ) )
Lp + + + + ) )
Pn + + + + + )
Br + ) ) + ) )
Path + + ) + + )
Pfi + + + + + +
Pj + + + + + +
Pa + + + + + +
Rd + + + + + +
Da + + + + + +
Sb + + + + + +
Gg + + + + + +
Ma + + + + + +
Al + ) ) + ) +
Nb + ) + + ) )
Np + ) ) + ) )Pt + ) ) + + +
Gd ) + ) ) ) )
Ba ) + ) ) ) )
Ga ) + + ) ) )
Mc ) + + + ) )
Mm ) + + + + +
Cn ) + + + + +
Gk ) ) + + + +
Pss + ) ) + + +
Pf ) ) + ) ) )
Pso ) ) ) + + +
Lk ) + + + ) )
Nr ) ) + ) + )
Nd ) ) + ) ) )
Ns ) ) ) + ) )
Pv ) ) ) + ) )Lt ) ) ) + ) )
Omb ) ) ) + ) +
Pb ) ) ) + ) +
Nan ) ) ) ) + )
Hl ) ) ) ) + )
Mcyp ) ) ) ) + )
Hb ) ) ) ) + )
Ic ) ) ) ) + +
Glg ) ) ) + +
Pew ) ) ) ) + +
Table 5. (Continued)
Code Upstream sites Downstream sites
Pek ) ) ) ) + +
Tk ) ) ) ) + +
Aghanashini
Na + ) ) ) ) )Xc ) ) ) ) + +
Tt ) ) ) ) + +
Ecan ) ) ) ) + +
Esur ) ) ) ) ) +
Pc ) ) ) ) ) +
Al + ) ) ) ) )
Bedti
Pn + + ) ) + )
Nd + + ) ) ) )
Ps + + ) ) ) +
Pf + + ) ) ) )
Pc + + ) + ) )
Br + ) ) ) ) )
Pa + + + + + +
Pj + + + + + +
Mm + + + + + +
Rd + + + + + +
Da + + + + + +
Gg + + + + + +
Omb + + + + ) )
Cn + + + + + )
Path + + + + ) +
Mc + ) + + ) )
Pss + ) + + ) )
Tk ) + + + ) )
Ga ) + ) ) ) )Sw ) ) + ) ) )
Lt ) ) + ) ) )
Nbo ) ) ) + ) )
Lp ) ) ) + ) )
Pad ) ) ) + ) )
On ) ) ) + ) )
Np ) ) ) + ) )
Pt ) ) + + ) )Ma ) ) + + + +
Pb ) ) + + + +
Sbo ) ) + + + +
Gk ) ) + + + +
Glg ) ) ) + + +
Pfi ) ) ) + + +
Pew ) ) ) ) + )
Continued on p. 90
89

different, comparisons across reaches, based on rare-faction and Monte Carlo simulations show that, ingeneral, for a given number of individuals sampled(e.g. 500 individuals, based on the least number ofindividuals sampled at a reach), downstream reacheswere more diverse than upstream reaches (Table 3).
Patterns of species richness and abiotic parametersalong longitudinal gradients
The Spearman rank correlation analyses for trendsin species richness along the gradient show higherpositive correlations in Aghanashini and Bedtias contrasted to Kali and Sharavati, whichshow weak positive and negative correla-tions, respectively. The Shannon index alsoshows similar trends (Table 4, Panel A).Mean width, depth, and current in Aghanashin-i Bedti and Kali increased downstream. How-ever, mean depth in Sharavati seemed todecrease along the gradient. Variability in habi-tat structure (determined by% CV) was unclear formost parameters in these rivers (Table 4, Panel A).
Correlations between species richness and abioticparameters
While species richness was positively correlated tomean values of the depth, width and current velocityparameters and negatively to altitude inAghanashiniand Bedti, its correlation to most of the parameters
Table 5. (Continued)
Code Upstream sites Downstream sites
Pek ) ) ) ) + )
Esur ) ) ) ) + +
Xc ) ) ) ) + +
Ob ) ) ) ) + +
Bedti
Ic ) ) ) ) + )
Tt ) ) ) ) + +
Hl ) ) ) ) + +
Mcyp ) ) ) ) ) +
Gers ) ) ) ) ) +
Orm ) ) ) ) ) +
Presence and absence (of most abundant species) indicated by
+ and), respectively.
Figure 2. Relative proportions of feeding guilds on upstream and downstream reaches for Aghanashini (a) and Bedti (b).
90

in Kali and Sharavati were negative (Table 4, PanelB). Its correlation with habitat variability, however,was found to be inconsistent for all four rivers.
Changes in species composition along streamgradient and pattern of distribution of feeding guilds
A gradual change in species composition andspecies abundance (consisting of addition, substi-
tution and deletion of species) was observed alongthe upstream – downstream gradient (Table 5).Smaller sized cyprinids that are common in upperstretches (e.g. Brachydanio rerio, Aplocheilus line-atus and Glyptothorax annadalei which are char-acteristically present in swift moving runs or moreturbulent habitats like riffles and rapids) were re-placed by larger sized species which are common inslower moving habitats (e.g. Puntius sarana, Labeo
Figure 3. CCA plots showing species scores (a), site scores and environmental vectors and centroids (b). Names for site codes are given
in Appendix 1 and full species names are given in Appendix 2. W¼ stream width; D¼ stream depth; Vel¼ stream velocity;
Alt¼ altitude; % Can¼% canopy cover; Peb¼ pebble substratum; Sand¼ sandy substratum; Rock¼ rocky substratum.
91

spp.) and some brackish-water dwelling species(Arius caelutus, Tetrodon travancoria, Etroplus su-ratensis, Gerres spp., etc.). Some generalist specieswere found to be distributed all along the rivers(Garra gotyla stenorhynchus, Rasbora daniconius,Danio aequipinnatus, Puntius filamentosus).
Insectivores were found to be evenly distributedalong the gradient. Some common trends were ob-served: herbivoreswere seen to bepresent only in theupstream regions, while piscivores were presentonly in the downstream regions. While algivoresdecreased in numbers, carnivores as well as omni-vores were found to increase downstream in bothAghanashini and Bedti (Fig. 2(a) and (b)). Most ofthe guilds were present all along the stream gradientand the species richness of most of the guilds in-creased downstream. However, the proportion ofeach guild category changed – upstream regionswere characterized by a higher proportion of algi-
vores (e.g. Gonoproktopterus curmuca, Puntius dor-salis andLepidocephalus thermalis), herbivores (e.g.Osteocheilus nashii and Labeo fimbriatus) and lar-vivores (e.g. Aplocheilus lineatus), while this chan-ged to an increased proportion of omnivores,carnivores (Carangx ignobilis, Arius caelutus, etc.)and even some piscivores (Megalops cyprinoides,Nandus nandus) downstream.
Multivariate analyses
The final model from the multiple regressionanalysis based on a forward stepwise selection,chose the depth and altitude parameters. Thisanalysis showed a significant correlation betweenthe chosen parameters (depth and altitude) andspecies richness (R2 ¼ 0.58, R ¼ 0.76, F ¼ 6.46;p ¼ 0.02). Mean depth showed a highly significantpositive correlation (b ¼ 0.59, p ¼ 0.02), while
Table 6. Results of the canonical correspondence analysis. The total inertia is total variance in species abundance data
Axes 1 2 3 4 Total inertia
Eigenvalues 0.227 0.150 0.095 0.080 1.630
Species–environment correlations 0.959 0.927 0.948 0.944
Cumulative percentage variance
of species data 14.0 23.2 29.0 33.9
of species-environment relation 28.6 47.5 59.5 69.5
Test of significance
CCA axis 1 F-ratio = 2.27, p < 0.005
Overall test F-ratio = 1.48, p < 0.005
The species–environmental correlations scale the strength of the relationship between species and environment for the axes. F ratio
statistics are listed for the first and for all the axes combined.
Table 7. CCA regression/canonical coefficients (A) and Interset correlations (B) of environmental variables with CCA axes
Variable CCA axis 1 CCA axis 2 CCA axis 3 CCA axis 4
A B A B A B A B
Width )0.25 0.43 0.03 0.28 )1.03 )0.02 )0.94 0.13
Depth 0.28 0.41 0.62 0.45 1.39 0.39 0.22 0.02
Velocity )0.10 0.36 0.03 )0.002 0.20 0.09 )0.19 )0.29
Altitude )0.06 )0.88 )1.50 )0.09 2.64 0.24 )0.49 )0.16
Sand 0.005 0.46 0.18 0.10 1.34 0.30 0.22 1.59
Pebble )0.47 )0.04 2.38 0.15 )0.98 0.08 )0.20 )0.51
Rock )1.03 )0.60 1.79 )0.04 )0.82 )0.27 1.39 0.27
pH )0.88 )0.36 1.58 0.12 )2.13 0.26 0.01 0.18
Canopy )0.44 )0.21 )0.32 )0.17 )0.96 0.22 )0.25 )0.44
Statistically significant values are in bold (p < 0.05).
92

altitude showed a negative correlation (b ¼ )0.40,p ¼ 0.09).
Association of species composition to streamenvironmental gradients
The plots of the species and site scores (on the firsttwo axes) produced from CCA show the distribu-tion of species and sites in ordination space (Figs.3(a) and 3(b), respectively). Here, 40 of the mostabundant species have been depicted, to provideinsight into their composition and distribution.Species common to downstream sites (Glossogobiusgiuris, Periophthalmus weberi and P. koelreuteri,together with the brackish-water species, Xenonto-don cancila, Osteobrama bakeri and Ichthyocamuscarci) had higher scores on the CCA axis 1, whilespecies common to upstream sites (Brachydaniorerio, Puntius narayani and P. sahyadrensis, Aploc-heilus lineatus, Osteocheilus nashi, etc.) had morenegative values on this axis. Species occupying bothupstream and downstream regions (i.e. more widelydistributed) were clustered in the centre (e.g. Garragotyla stenorhynchus, Rasbora daniconius, Danioaequipinnatus, Mystus malabaricus, etc.).
The positions of the environmental vectorsindicate their correlation to the axes as well as toeach other (Fig. 3(b)). The species–environmentcorrelation was high for both the axes (0.96 and0.93, respectively) and theMonte Carlo tests for thefirst axis and the overall test were significant(p < 0.01). The canonical axes 1 and 2 (Eigen-values ¼ 0.22 and 0.15) explained 23.2% of thecumulative variance of the species data, while theyexplained 47.5% of the cumulative variance of thespecies–environment relation (Table 6). Out of thenine variables used in the model, two were found tobe significant (depth and altitude; p < 0.05)accounting for 30% of the total 80% variance of theentire set of variables. Highest correlations are ob-served for altitude ()0.88 in the CCA axis 1), pebblesubstratum type ()0.51 in the CCA axis 4), rockysubstratum ()0.60 in the CCA axis 1) and depthparameters (0.45 in the CCA axis 2) (Table 7).
Discussion
The Western Ghats, while being extremely rich inits fish biodiversity, has not so far been investi-
gated with regards to species distributions andtheir interactions with environmental and physicalparameters. This study is, therefore, the first of itskind for the Western Ghats; patterns observed andstudied in detail for most temperate, and sometropical regions, have been tested and analyses forthis region as well.
In general, fish communities displayed a con-tinuous distribution, with a gradual increase inrichness towards downstream regions. Univariateand regression analyses for correlations betweenspecies richness (SR) and environmental and streamcharacteristics showed that species richness is posi-tively correlated to stream depth and width andnegatively to altitude. Stream habitat complexityhowever, does not seem to contribute significantlyto the increase in species numbers in the lowerreaches. It is possible that other aspects of streamstructural characteristics (e.g. greater stream livingspace and moderating environmental conditions)could influence fish communities (Rahel & Hubert,1991; Reyes-Gavilan et al., 1996). In this study, theobserved increase in SR downstream is likely to bedue to an increase in stream size as well as to theinfluence of the adjacent marine environment.While diversity (as shown by species richness andthe Shannon index) clearly increased downstreamand was positively related to the abiotic parametersfor Aghanashini and Bedti, our findings for Shara-vati and Kali were contrasting. Recent modifica-tions of natural stream habitats due to constructionof reservoirs anddams aswell as industrial pollutionon Sharavati and Kali are likely causes for this.
The increase in species richness resulted morefrom a longitudinal downstream addition of speciesrather than any sizable reduction or loss of species.In fact, a large number of species found upstreamwere also found to occur in the downstream sites.Many of the species additions were found to beestuarine or brackish-water species also occurring infreshwater systems. Longitudinal gradients in guildstructure were also observed in these rivers, withmost herbivores occupying the upper reaches andmost piscivores being found downstream. Othergroups like omnivores and carnivores, thoughpresentall along thegradient, increaseddownstreamwhile algivores reduced in proportion. However,more detailed studies on the feeding habits andpreferences of these species are required for a betterunderstanding of patterns in feeding guilds.
93

Nine environmental variables were used for themultivariate ordination analysis, out of which fourvariables (depth, altitude, pebble substratum typeand% canopy cover) contributed to more than half(47%) of the total variance explained by the vari-ables (80%). Out of these, altitude was found to bethe most important variable (variance ex-plained ¼ 20%) in explaining the distribution ofspecies, while depth, substratum types pebble, rock,sand, pH and % canopy cover also contributedsubstantially. The second most important vari-able observed in our study was depth (varianceexplained = 10%). This was also found to have asignificant positive relation with species richness.Studies conducted in other tropical areas (KamdemToham & Teugels, 1998) report catchment area asthe most important variable, reflecting similar gra-dients in other physical variables like depth, widthand distance from source. Angermeier & Karr(1983, in Panama) and Hugueny (1990, in WestAfrica) found a significant relationship betweenspecies richness and width as well as an increasinggradient of depth.
The substratum type (pebble, rock and sand)wasalso found to be a major environmental parameterexplaining the distribution of species in the sam-pling sites. Diversity of substratum types did notsubstantially increase downstream. However, spe-cies preferences for certain substrates can be ob-served from this study. For example, upstream siteswith more rocks and gravel were associated withspecies like Lepidocephalus thermalis, Mystus mal-abaricus and Osteocheilus nashii while sites withmore sandy and silty substrata at downstream siteswere associated with Periophthalmus spp., Glos-sogobius giuris, etc. The % canopy cover variable isalso observed to be an important parameter. Specieslike Puntius ticto, Puntius bimaculatus, Mast-acembelus armatus and Aplocheilus lineatus weremost often associatedwith amaximal canopy cover,while species like Salmostoma boopis, Puntius fila-mentosus, P. jerdoni, Glossogobius giuris frequentlyoccurred in more open water and low canopy con-ditions. The functional role of overhanging vege-tation in determining the temperature andhydrological regime and also as a source of organicnutrients (through fallen leaves and litter) has al-ready been documented (Lowe-McConnell, 1975).These interesting associations deservemore detailedinvestigations.
The relation of sites to species can be understoodby overlaying the species CCA plot (Fig. 3(a)) withthe sites plot (Fig. 3(b)). The clusters with higherscores on the first axis are the downstream sites onall the four rivers, while upstream sites are clusteredtogether with negative values for the first axis.Downstream sites are characterized by greaterwidth and depth parameters and sandy substratum.Upstream sites have a predominance of rocks andpebbles as well as greater % canopy cover. It isinteresting to note that site 16 (Dandeli, situated onKali and themost polluted site of all) is located as anoutlier (not shown in the graph as it lies far above theother clusters). This site is located just about akilometer downstreamof localmills and is subjectedto pollution from the effluents discharged. Speciescomposition at this site is restricted to extremelytolerant species like Parambassis dayii and intro-duced larvivorous species like Aphanius dispar.
The rivers of the WG, which were until recentlyundisturbed, are now facing the consequences ofour ever increasing demands; one of the mainreasons for their exploitation is the harnessing ofenergy as hydroelectric power. In particular, riverslike Kali and Sharavati have been subjected todeforestation and habitat alterations to such anextent that their effect on aquatic communities isevident. Fish based indices like the Index of BioticIntegrity (Karr, 1981), successfully applied forassessment of aquatic habitats in many other re-gions, can be used to assess anthropogenic impactsas well as for conservation prioritization (Bhat,2002). An understanding of the mechanismsdetermining the spatial segregation of species is ofgreat importance in the conservation and man-agement of aquatic resources. The present study isa step in this direction and hopes to provide a basisfor conservation and management strategies.
Acknowledgements
I thank Madhav Gadgil and N.V. Joshi (Center forEcological Sciences, Indian Institute of Science,India) for their support and encouragement forcarrying out this study. I am indebted to M. Ar-unachalam (M.S. University, Tamil Nadu, India)for providing insights on aquatic studies. Paul An-germeier (Virginia Tech, USA.) gave some invalu-able comments in substantially improving this
94

work. I also thank Sridhar Patgar, Vamana Hari-kantha and Sridhar Harikantha for their help dur-ing fieldwork. Critical comments from ananonymous reviewer in improving the quality of themanuscript are deeply appreciated. The study wasfinancially supported by the Ministry of Environ-ment and Forest, Government of India.
References
Angermeier, P. L. & J. R. Karr, 1983. Fish communities along
environmental gradients in a system of tropical streams.
Environmental Biology of Fishes 9(2): 117–135.
Arunachalam, M., 2000. Assemblage structure of stream fishes
in the Western Ghats (India). Hydrobiologia 430: 1–31.
Belliard, J., P. Boet & E. Tales, 1997. Regional and longitudinal
patterns of fish community in the Seine River basin, France.
Environmental Biology of Fishes 50: 133–147.
Benke, A. C., T. C. Van Ardsall Jr., D. M. Gillespie & F. K.
Parish, 1984. Invertebrate productivity in a subtropical
blackwater river: the importance of habitat and life history.
Ecological Monographs 54: 25–63.
Bhat, A., 2002. A study of the diversity and ecology of fresh-
water fishes of four river systems of the Uttara Kannada
District, Karnataka, India. Ph.D. Dissertation, Indian
Institute of Science, Bangalore, India. p. 178.
Bhat, A., 2003. Diversity and composition of freshwater fishes
in streams of Central Western Ghats, India. Environmental
Biology of Fishes 68: 25–38.
Colwell, R. K. & J. A. Coddington, 1994. Estimating terres-
trial biodiversity through extrapolation. Philosophical Trans-
actions of the Royal Society, London B 345: 101–118.
Dahanukar, N., R. Raut & A. Bhat, 2004. Distribution,
endemism and threat status of freshwater fishes in the Wes-
tern Ghats of India. Journal of Biogeography 31: 123–136.
Fausch, K. D., J. R. Karr & P. R. Yant, 1984. Regional
application of an index of biotic integrity based on stream
fish communities. Transactions of the American Fisheries
Society 113: 39–55.
Gorman, O. T. & J. R. Karr, 1978. Habitat structure and
stream fish communities. Ecology 59: 507–515.
Grossman, G. D., 1982. Dynamics and organisation of a rocky
intertidal fish assemblage: the persistence and resilience of
taxocene structure. American Naturalist 119: 611–637.
Horwitz, R. J., 1978. Temporal variability patterns and the
distributional patterns of stream fishes. Ecological Mono-
graphs 48: 307–321.
Hugueny, B., 1989. West African Rivers as biogeographic is-
lands. Oecologia 79: 235–243.
Jayaram,K. C., 1999. The Freshwater Fishes of the IndianRegion.
Narendra Publishing House, Delhi-6, pp. 551 + XVIII plates.
Kamdem Toham, A. & G. G. Tuegels, 1997. Patterns of
microhabitat use among fourteen abundant fish of the lower
Ntem River basin (Cameroon). Aquatic Living Resources
10: 289–298.
Kamdem Toham, A. & G. G. Tuegels, 1998. Diversity patterns
of fish assemblages in the Lower Ntem River Basin (Cam-
eroon), with notes on potential effects of deforestation. Ar-
chives of Hydrobiology 141(4): 421–446.
Karr, J. R., 1981. Assessment of Biotic Integrity using fish
communities. Fisheries 6(6): 21–27.
Lowe-McConnell, R. H., 1975. Fish Communities in Tropical
Freshwaters: Their Distribution, Ecology and Evolution,
Longman, London, England.
Ludwig, J. A. & J. F. Reynolds, 1988. Statistical Ecology: A
Primer on Methods and Computing, John Wiley and Sons,
USA.
Mac Arthur, R. H., 1964. Environmental factors affecting bird
species diversity. American Naturalist 98: 387–397.
Moyle, P. B. & B. Vondracek, 1985. Persistence and structure of
the fish assemblage in a small Californian stream. Ecology
66: 1–13.
Myers, N., R. A. Mittermeier, C. G. Mittermeier, G. A. B. da
Fonesca & J. Kent, 2000. Biodiversity hotspots for conser-
vation priorities. Nature 403: 853–858.
Oberdorff, T., J. F. Guegan & B. Hugueny, 1995. Global pat-
terns of fish species richness in rivers. Ecography 18: 345–352.
Pianka, E. R., 1967. On lizard species diversity: North Ameri-
can flatland deserts. Ecology 48: 333–351.
Rahel, F. J. &W. A. Hubert, 1991. Fish assemblages and habitat
gradients in a Rocky Mountain-great plains stream: biotic
zonation and additive patterns of community change.
Transactions of the American Fisheries Society 120: 319–332.
Reyes-Gavlan, F. G., R. Garrido, A. G. Nicieza, M. M. Toledo
& F. Brana, 1996. Fish community variation along physical
gradient in short streams of northern Spain and the disrup-
tive effect of dams. Environmental Biology of Fishes 321:
155–163.
Ross, S. T., W. J. Matthews & A. A. Echelle, 1985. Persistence
of stream fish assemblages: effects of environmental change.
American Naturalist 126: 24–40.
Rosenzweig, M. L. & J. Winakur, 1969. Population ecology of
desert rodent communities: habitat and environmental
complexity. Ecology 50: 558–572.
Schlosser, I. J., 1982. Fish community structure and function
along two habitat gradients in a headwater stream. Ecolog-
ical Monographs 52: 395–414.
Sivaramakrishnan, K. G., K. Venkataraman, S. Sridhar & S.
Marimuthu, 1995. Spatial distribution of benthic macroin-
vertebrate distributions along river Kaveri and its tributaries
(India). International Journal of Ecology and Environmental
Science 21: 141–161.
Talwar, P. K. & A. Jhingran, 1991. Inland fishes of India and
adjacent countries, Oxford and IBH Publishing Co. Pvt.
Ltd., New Delhi, 2 volumes: xix + 1158.
Ter Braak, C. J. F., 1985. Correspondence analyses of incidence
and abundance data: properties in terms of a unimodal re-
sponse model. Biometrics 41: 859–873.
Ter Braak, C. J. F., 1986. Canonical correspondence analyses:
A new eigenvector method for multivariate direct gradient
analysis. Ecology 67: 1167–1179.
Ter Braak, C. J. F., 1988. CANOCO – A Fortran program for
canonical community ordination by (partial) (detrended)
(canonical) correspondence analysis, principal component
analysis and redundancy analysis (version 2.1). Technical
Report No. LWA- 88-02.TNCO, Institute of Applied
95

Computer Science, Statistical Department Wageningen, 6700
AC Wageningen, The Netherlands. 95 pp.
Vannote, R. L., G. W. Minshall, J. R. Sedell & C. E. Cushing,
1980. The river continuum concept. Canadian Journal of
Fisheries and Aquatic Sciences 37: 130–137.
Wright, K. K. & J. L. Li, 2002. From continua to patches:
examining stream community structure over large environ-
mental gradients. Canadian Journal of Fisheries and Aquatic
Sciences 59: 1404–1417.
Appendix 1. Study locations with latitude, longitude, altitude, canopy cover, dominant substrate types etc.
S. no. Sampling site (code) River Canopy Altitude (m) Latitude Longitude Substrate types
1 Allanki (1) Sharavati 1 30 14� 14¢ 584 74� 34¢ 177 S
2 Gersoppa bate (2) Sharavati 2 40 14� 14¢ 272 74� 38¢ 986 S
3 Gersoppa nursery (3) Sharavati 2 40 14� 14¢ 571 74� 40¢ 121 S
4 Jog falls (4) Sharavati 3 496 14� 13¢ 882 74� 49¢ 112 R
5 Joginmatha (6) Sharavati 2 476 14� 13¢ 882 74� 49¢ 394 S, R
6 Chaina Gate (5) Sharavati 1 374 14� 11¢ 578 74� 49¢ 660 R
7 Kirtigadde (24) Aghanashini 3 28 14� 25¢ 778 74� 36¢ 109 S, P
8 Hulidevarakodlu (23) Aghanashini 3 38 14� 26¢ 540 74� 38¢ 489 S, P
9 Bilgi Bridge (7) Aghanashini 5 630 14� 21¢ 542 74� 47¢ 432 S, P, R
10 Tattikai (8) Aghanashini 5 500 14� 30¢ 417 74� 45¢ 465 S, P, R
11 Manihole (9) Aghanishini 4 603 14� 26¢ 083 74� 47¢ 341 S, P, R
12 Balur (10) Aghanashini 4 633 14� 28¢ 861 74�48¢ 584 S, P, R
13 Hoskambi (22) Bedti 3 20 14� 40¢ 798 74�29¢ 380 S, P
14 Ramanguli (21) Bedti 3 60 14� 47¢ 798 74� 36¢ 504 S, P
15 Pattnahole (11) Bedti 4 472 14� 42¢ 959 74� 42¢ 275 S, P, R
16 Manchikeri (13) Bedti 3 422 14� 53¢ 467 74� 47¢ 178 R
17 Kumbri (14) Bedti 4 428 14� 54¢ 751 74� 48¢ 228 P, R
18 Ganeshpal (12) Bedti 3 395 14� 46¢ 993 74� 45¢ 551 P, R
19 Kadra (20) Kali 1 20 14� 54¢ 404 74� 19¢ 353 S
20 Nujji (19) Kali 5 560 15� 06¢ 107 74� 22¢ 886 S, P, R
21 Ganeshgudi (18) Kali 3 80 15� 16¢ 627 74�32¢ 157 S, R
22 Maulangi (17) Kali 2 460 15� 15¢ 371 74� 35¢ 536 S, P, R
23 Dandeli (16) Kali 3 440 15� 14¢ 725 74� 38¢ 204 S, R
24 B.P. Damsite (15) Kali 2 427 15� 09¢ 991 74� 42¢ 611 S, R
S = sandy-silty; P = pebble-gravel; R = rocky. Canopy categories: 1 = 0–20%; 2 = 20–40%; 3 = 40–60%; 4 = 60–80%; 5 = 80–
100% canopy cover.
96

Appendix 2. Species names, codes and family names of the
dominant species collected from the Uttara Kannada region.
Code Family
Cyprinidae
Gd Gonoproktopterus dubius (Day)
Gk Gonoproktopterus kolus (Sykes)
Lk Labeo kawrus (Sykes)
Lp Labeo spp (potail?) (Sykes)
Lpr Labeo porcellus (Heckel)
Ob Osteobrama bakeri (Heckel)
On Osteocheilus nashii (Day)
Pa Puntius amphibius (Valenciennes)
Pb Puntius bimaculatus (Bleeker)
Pc Puntius conchonius (Hamilton-Buchanan)
Pf Puntius fasciatus (fasciatus)
Pfi Puntius filamentosus (Valenciennes)
Pj Puntius jerdoni (Day)
Pn Puntius narayani (Hora)
Ps Puntius sahyadrensis (Silas)
Pss Puntius sarana sarana (Hamilton-Buchanan)
Pso Puntius sophore ( Hamilton-Buchanan)
Pt Puntius ticto (Hamilton-Buchanan)
Pv Puntius vittatus (Day)
Tk Tor khudree (Sykes)
Sb Salmostoma boopis (Day)
Br Brachydanio rerio (Hamilton-Buchanan)
Da Danio aequipinnatus (McClelland)
Ed Esomus danricus (Hamilton-Buchanan)
Rd Rasbora daniconius (Hamilton-Buchanan)
Gg Garra gotyla stenorhynchus (Jerdon)
Balitoridae
Ba Bhavania australis (Jerdon)
Na Nemacheilus anguilla (Annandale)
Nd Nemacheilus denisoni (Day)
Nb Nemacheilus botia (Hamilton-Buchanan)
Np Nemacheilus pulchellus (Day)
Nr Nemacheilus rupelli (Sykes)
Ns Nemacheilus striatus (Day)
Lt Lepidocephalus thermalis (Valenciennes)
Bagridae
Mc Mystus cavacius (Hamilton-Buchanan)
Mm Mystus malabaricus (Jerdon)
Hb Horabagrus brachysoma (Gunther)
Siluridae
Sw Silurus wynaadensis (Day)
Ga Glyptothorax annandalei (Hora)
Omb Ompok bimaculatus (Bloch)
Appendix 2. (Continued)
Code Family
Belonidae
Xc Xenontodon cancila (Hamilton-Buchanan)
Aplocheilidae
Al Aplocheilus lineatus (Valenciennes)
Peocilidae
Ad Aphanius dispar (Ruppell)
Syngnathidae
Ic Ichthyocamus carce (Hamilton-Buchanan)
Mastecembelidae
Ma Mastacembelus armatus (Lacepede)
Chandidae
Cn Chanda nama (Hamilton-Buchanan)
Path Parambassis thomasii (Day)
Pad Parambassis dayii (Bleeker)
Gobidae
Glg Glossogobius giuris (Hamilton-Buchanan)
Pew Periophthalmus weberi (Eggert)
Pek Periophthalmus koelreuteri (Pallas)
Nandidae
Nan Nandus nandus (Hamilton-Buchanan)
Cichlidae
Esur Etroplus suratensis
Orm Oreochromis mossambica (Peters)
Megalopidae
Mcyp Megalops cyprinoides (Lacepede)
Teraodontidae
Tt Tetrodon travancoricus (Hora and Nair)
Eleotridae
Ecan Eleotris canarensis (Bloch and Schneider)
Gerridae
Gers Gerres setifer (Hamilton-Buchanan)
Hemiramphidae
Hyl Hyporhampus limbatus (Valenciennes)
97