patterns in the covid-19 cases among learners and staff in
TRANSCRIPT

1
Patterns in the COVID-19 cases among learners and staff in Gauteng schools
Analysis of school-level data to 8 July1
21 July 2020
Summary
The current report analyses school-level data submitted by Gauteng schools on staff and
learners found to have tested positive for COVID-19 in the period 25 May to 8 July.
The percentage of educators who were found to be infected, according to the new
Gauteng Department of Education data, is not that different to estimates for
demographically similar people in the Gauteng population as a whole, and is not higher
than one would expect. Specifically, positive cases among educators according to the
submitted data are between 10% and 20% higher than what one finds in the population as a
whole. This should be compared to existing evidence from outside South Africa that
education workers may be 55% more likely than non-essential workers to become infected,
and increased likelihood figures of 600% for health workers and 80% for the police.
It is also found that the upward trend in the number of educator cases in Gauteng is in
line with the upward trend for the Gauteng population as a whole.
There is a risk that schools have under-reported the number of confirmed cases, even though
the message around the need to reveal one’s status and to self-isolate has been widely
disseminated. Caution should thus be exercised in interpreting the statistics, though those
relating to differences between the primary and secondary levels, and rates of change over
time, are less likely to be affected by under-reporting. Clearly, there is a need for further
monitoring of this kind, across all the country’s provinces.
Cases as a percentage of everyone is nine times higher for educators than for the learners
who attended school. This is what one might expect, given the medical evidence on lower
levels of morbidity, but even infection, among younger children. Moreover, learners in
Grade 12 are around three times as likely to be positive as learners in Grade 7. This
would also be in line with the medical evidence.
Given current concerns, the co-existence of educator and learner cases in the same school is
an important matter. Of the 709 schools in the dataset, 505 reported at least one educator case,
207 reported at least one learner case, and 56 reported both learner and educator cases. The
overlap between schools with educator cases and schools with learner cases is thus
rather small. The 709 schools are about a quarter of all schools in the province. The
breakdown for just the 2,081 public ordinary schools in the province is represented in the
following pie graph.
1 Analysis produced by Martin Gustafsson ([email protected]), for the national Department of
Basic Education (DBE), in collaboration with Albert Chanee ([email protected]),
Gauteng Department of Education. Inputs from Dr Stephen Taylor and Dr Faith Kumalo in the DBE
are much appreciated.

2
1,440
434
16245
No cases
Only
educator
cases
Only
learner
cases
Both types of cases
The number of cases per school was on the whole low. Among the schools with educator
cases, 69% reported just one case for the entire period, and 96% reported no more than
three cases. The corresponding percentages for learner cases are similarly low.
In the 56 schools where both learners and educator cases are reported, the correlation between
the number of learners infected and the number of educators infected is low. Nonetheless,
multivariate modelling reveals that in schools offering Grade 12, having learner cases is a
statistically significant predictor of whether a school will have at least one educator case,
though more learner cases in one school are not associated with more educator cases beyond the first case. In primary schools, on the other hand, learner cases do not predict the
presence or extent of educator cases at all. Despite this, the probability that a primary school
will report educator cases is only slightly lower than that for secondary schools.
The modelling cannot produce evidence of cause and effect, or on the route of
transmission. The limited correlation seen between learner cases and educator cases at the
secondary level could reflect transmissions occurring within the school, either from learners
to educators or vice versa, though the wider evidence suggests this correlation is more likely
to be the result of higher rates of infection in the community around the school, and infections
occurring outside the school.
The findings of the analysis are in line with the World Health Organization message that
on the whole it is rare, though not impossible, for learners to infect teachers and each
other, because children are weak transmitters of the virus. But the analysis also underlines
that the message needs to be somewhat different for the primary and secondary levels, as
there seem to be somewhat higher risks of infection in secondary schools.
A spatial analysis of the data for the province as a whole finds no evidence of clustering of
schools with infections in specific geographic areas. Schools with cases appear to be
relatively evenly spread across the Gauteng schooling system. One exception is the Sedibeng East district, where 41% of schools reported having a case. This figure is considerably higher
than that for any other district.
Monitoring of the kind presented in this report is vital if informed decisions are to be
taken about risk mitigation. As more data becomes available through systems such as
Gauteng’s daily reporting initiative, the scope for analysing important relationships, such as
the extent to which educator and learner cases are following each other across schools, will
become increasingly possible. Gaining a clearer idea of differences in the impact of the
pandemic on the primary and secondary levels is vital.

3
1 Introduction
Data collected by the Gauteng Department of Education (GDE) on people found to be
infected by the coronavirus in schools can help in answering a number of questions that
education stakeholders are concerned about.
There are risks to the well-being of children, and to society at large, associated with both
school closures and with schools being open during the pandemic. It is important to process
the emerging evidence relating to these risks to reduce the ‘fear of the unknown’ element of
the pandemic. Researchers have been underlining the harm done to children by school
closures, and bodies such as the World Health Organization (WHO) have cautiously been
evaluating evidence that school re-openings are less harmful than is often believed, though
there are clearly risks. The following, from a May 2020 guide issued by the WHO, is
informed by evidence that children are exceptionally weak transmitters of the virus2.
To date, there have been few educational institutions involved in COVID-19 outbreaks, but
from these studies, it appears that disease transmission was primarily related to social events
linked to school or university life rather than transmission within classrooms. These studies
also suggest that the introduction of the virus was likely by an adult member of staff.
The WHO has also acknowledged separate evidence that school closures and re-openings
have not been found to slow down or accelerate the trajectory of the pandemic to a significant
degree within a country3.
One matter that has received too little attention is the likelihood that different levels of the
schooling system need to be treated differently, given that adolescents have been found to be
more likely to transmit the virus than younger children. This report specifically addresses this
matter.
2 Description of the school-level data
The core data used for the current analysis is a spreadsheet of 965 submissions of pandemic-
related statistics from 709 schools. The number of records per school ranged from one (516
schools) to five (4 schools). Submissions are dated from 25 May to 8 July. Learners in grades
7 to 12 could attend school from 2 June, and teachers were expected to come to school during
the previous week.
Submissions focussed in particular on the number of COVID-19 cases found among learners
and staff. In total, 294 learners, 753 educators, 76 administrative staff, 33 general assistants
and 3 ‘youth brigades’4 were tested positive for COVID-19. The 294 learners come to 0.09%
of Gauteng’s grades 7 and 12 learners combined. The 753 educators come to 0.82% of
Gauteng’s educators5. Details by education district, including the number of schools closed
temporarily due to the presence of cases, are given in Appendix 2. The reporting procedure did not require the school to submit any characteristics of those tested positive, for instance
the ages of learners.
There are essentially two ways in which cases were reported to the GDE. Firstly, learners or
staff who did not pass the temperature screening process conducted at the school were
referred to a medical practitioner, who may have deemed it necessary for a COVID-19 test to
2 World Health Organization, 2020a: 1 3 World Health Organization, 2020b: 6 4 Youth brigades are unemployed youths recruited to assist with pandemic-related work, such as the
temperature screening of people arriving at the school. 5 A denominator of 91,702 educators was used, which includes publicly and privately paid educators in
any school (but not pre-school).

4
be conducted, which may have led to a positive result. In such a situation, the school would
have been fully aware of the possibility of a case, and the risk that a detected positive case
would not be reported to the GDE can be considered low. Secondly, learners and staff could,
completely independently of the school, have been tested for COVID-19, and in the case of a
positive result, reported this to the school. Here there is a larger risk of under-reporting, as
reporting to the school may not have occurred. At the same time, the message that positive
staff and learners should be open about their status, and should stay away from school while
infectious, has been clearly communicated among schools. These issues should be kept in
mind when interpreting the percentages in the report. Yet the possibility that levels of under-
reporting would be different at the primary and secondary levels, or different over time, is
likely to be low. Thus, estimates of differences across the primary and secondary levels, and
rates of change over time, are likely to be relatively reliable.
With respect to educator infections, 69% of the schools with educator cases reported just one
case for the entire period, and 96% reported no more than three cases. The maximum was one
school reporting nine educator cases. Among schools reporting learner cases, 75% reported
just one case, 96% reported no more than three cases, and the maximum was one school, an
independent combined school, with eight learner cases.
Of the 709 schools, 604 are public ordinary, 30 independent subsidised, 30 independent non-
subsidised, 43 public special schools, and two are independent special schools. The 709
schools would be 24% of the 2,962 schools in total across these categories in the province. The corresponding percentages would be 29% for public ordinary schools, 29% for public
special schools, and 8% for independent schools as a whole. The lower figure for independent
schools could be due to more compliant reporting by public schools, or independent schools
may in fact have had fewer cases.
Of the 709 schools, 505 reported at least one educator case, 207 reported at least one learner
case, and 56 reported both learner and educator cases.
The data identifies 377 of the 709 schools as primary, and 296 as secondary. Table 1 below,
which focusses on public ordinary schools only, illustrates that schools with Grade 12 were
three times as likely to report learner cases as schools without Grade 12 (but with Grade 7):
15% of schools with Grade 12 reported learner cases, against 5% of schools without Grade
12. The difference between the two categories of schools was much smaller when it came to
educator cases. These patterns would be consistent with the medical evidence that younger
children are less likely to show symptoms of COVID-19 – as discussed previously, the
evidence also points to children being weak transmitters of the virus. But the patterns are also
consistent with the evidence that learner cases are not a driver of educator cases in schools.
Table 1: Breakdown of public ordinary schools
Percentages of schools at that level
Schools in the
province Percentages of
all schools With learner
cases With educator
cases
With both learner and
educator cases
With Grade 12 615 30 15 24 5 Without Grade 12 1,466 70 5 20 1
All 2,081 100 8 21 2
If one takes into account school size differences, by weighting schools by each school’s
number of educators, very similar patterns emerge. The key change, relative to Table 1 is that
the ‘With learner cases’ percentages rise, to 18% for ‘With Grade 12’ and 6% ‘Without Grade
12’. This reflects the fact that larger schools have a slightly higher percentage of learners
found positive. The ratio remains the same, however: schools with Grade 12 are still three
times as likely to report learner cases.
5
3 Learner cases by age
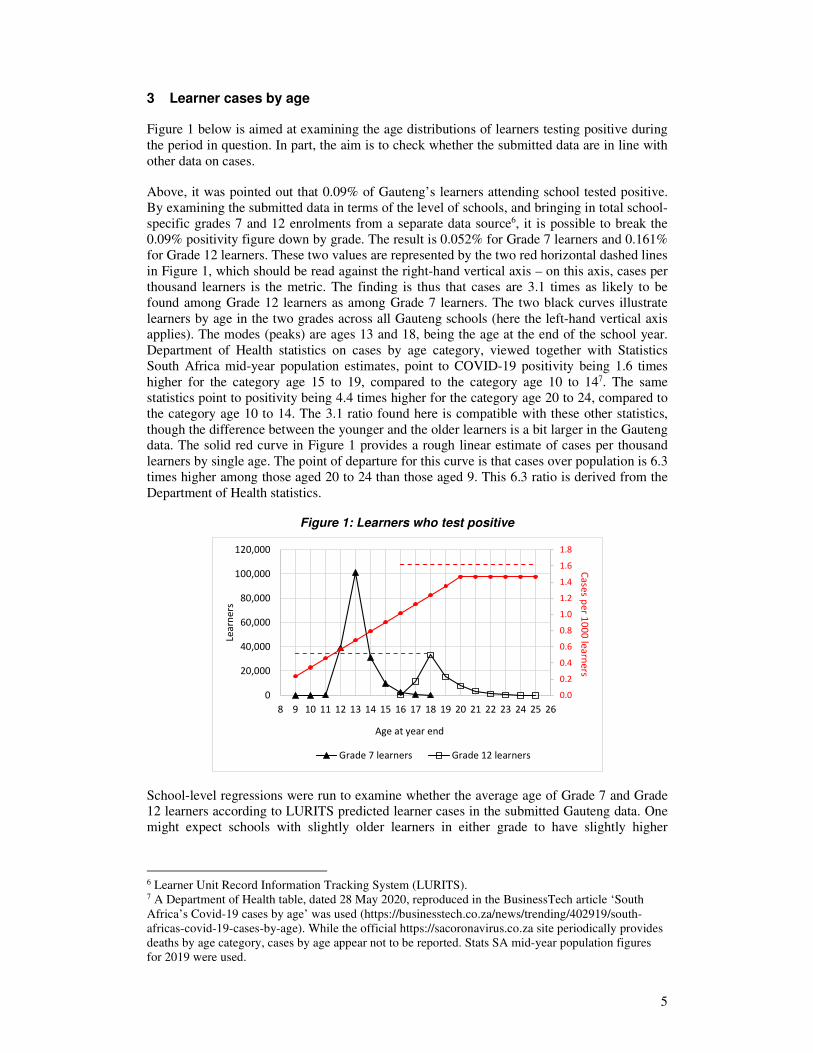
Figure 1 below is aimed at examining the age distributions of learners testing positive during
the period in question. In part, the aim is to check whether the submitted data are in line with
other data on cases.
Above, it was pointed out that 0.09% of Gauteng’s learners attending school tested positive.
By examining the submitted data in terms of the level of schools, and bringing in total school-
specific grades 7 and 12 enrolments from a separate data source6, it is possible to break the
0.09% positivity figure down by grade. The result is 0.052% for Grade 7 learners and 0.161%
for Grade 12 learners. These two values are represented by the two red horizontal dashed lines
in Figure 1, which should be read against the right-hand vertical axis – on this axis, cases per
thousand learners is the metric. The finding is thus that cases are 3.1 times as likely to be
found among Grade 12 learners as among Grade 7 learners. The two black curves illustrate
learners by age in the two grades across all Gauteng schools (here the left-hand vertical axis applies). The modes (peaks) are ages 13 and 18, being the age at the end of the school year.
Department of Health statistics on cases by age category, viewed together with Statistics
South Africa mid-year population estimates, point to COVID-19 positivity being 1.6 times
higher for the category age 15 to 19, compared to the category age 10 to 147. The same
statistics point to positivity being 4.4 times higher for the category age 20 to 24, compared to
the category age 10 to 14. The 3.1 ratio found here is compatible with these other statistics,
though the difference between the younger and the older learners is a bit larger in the Gauteng data. The solid red curve in Figure 1 provides a rough linear estimate of cases per thousand
learners by single age. The point of departure for this curve is that cases over population is 6.3
times higher among those aged 20 to 24 than those aged 9. This 6.3 ratio is derived from the
Department of Health statistics.
Figure 1: Learners who test positive
0.0
0.2
0.4
0.6
0.8
1.0
1.2
1.4
1.6
1.8
0
20,000
40,000
60,000
80,000
100,000
120,000
8 9 10 11 12 13 14 15 16 17 18 19 20 21 22 23 24 25 26
Ca
ses p
er 1
00
0 le
arn
ers
Lea
rne
rs
Age at year end
Grade 7 learners Grade 12 learners
School-level regressions were run to examine whether the average age of Grade 7 and Grade 12 learners according to LURITS predicted learner cases in the submitted Gauteng data. One
might expect schools with slightly older learners in either grade to have slightly higher
6 Learner Unit Record Information Tracking System (LURITS). 7 A Department of Health table, dated 28 May 2020, reproduced in the BusinessTech article ‘South
Africa’s Covid-19 cases by age’ was used (https://businesstech.co.za/news/trending/402919/south-
africas-covid-19-cases-by-age). While the official https://sacoronavirus.co.za site periodically provides
deaths by age category, cases by age appear not to be reported. Stats SA mid-year population figures
for 2019 were used.

6
percentages of positive learners. However, no statistically significant findings emerged. Given
the low number of schools with learner cases, this is not surprising.
4 Reported infections among educators compared to the population
Data completely separate from the Gauteng submitted data were used to estimate the number
of COVID-19 cases among teachers for the period 25 May to 8 July, in order to assess
whether the actual value seen in the submitted data, of 753 infected educators, was
substantially higher or lower than what one might expect.
The method employed for this is explained in Appendix 1. Essentially this involved estimating the percentage of the Gauteng population, by age category and gender, found to be
positive by 28 May, using national Department of Health percentages (from the table
discussed above). Values were then inflated so that the Gauteng overall total reflected the
actual rise in the total number of cases in the province between 25 May and 8 July. These
inflated figures were then applied to educator counts, which were also broken down by age
category and gender. For the educator counts, 2019 payroll data were used to obtain figures
for publicly employed educators. These figures were inflated to produce a total corresponding
to the Gauteng total, including privately employed educators. It was thus assumed that
publicly and privately paid educators display the same age and gender characteristics. It
should be kept in mind that apart from privately paid educators in independent schools,
Gauteng has around 6,500 privately paid educators working in public schools8.
The result was an estimated value of 685 positive cases among Gauteng’s educators. The
actual reported value of 753 is 10% higher than this. There are data issues which could reduce
the comparability of the two figures. Official mid-year population estimates are estimates, not actual census counts, meaning they are sensitive to assumptions used in Stats SA’s modelling.
The fact that independent schools submitted fewer reports of cases to the Gauteng Department
of Education than public schools could be due to under-reporting, though there may in fact be
proportionally fewer positive cases among educators in these schools. Even for public
schools, there could be under-reporting. Unlike reporting to the authorities by laboratories
testing for COVID-19, reporting by schools is not subject to stringent legal requirements.
Even school principals who seek to report all cases, may not know about all of them. To deal
with the independent school issue, the estimation was done for only public ordinary schools.
The result was an estimated 554 positive educators. The data submitted by just by public
ordinary schools reflected 663 positive educators. The difference here is 20%.
Differences such as 10% and 20% are perhaps to be expected. Occupation does clearly play a
role in determining the risk of infection. The higher risks experienced by health workers has
received widespread attention. A recent study of data from the United Kingdom, at the pre-
print stage, by Mutambudzi et al (2020), finds that healthcare workers face a risk of COVID-
19 infection seven times greater than that of non-essential workers, meaning they faced a risk that is 600% higher. The same study found that education workers faced a risk that was
around 55% higher than for non-essential workers, with figures for a few other occupations
being around 80% for the police, around 200% for social care workers, and 100% for
transport workers. These percentages are from an analysis that controls for basic demographic
factors such as age and gender9. Moreover, these percentages compare specific occupations to
what are considered non-essential workers, so they are different from the 10% and 20%
figures referred to earlier, which are the result of a comparison to the general population, with
controls for demographic factors. Moreover, the South African context would differ from that
of the United Kingdom in several important respects. Despite these limitations, the figures
suggest that infections among Gauteng’s educators are not higher than would be expected.
8 Department of Basic Education, 2018. 9 Model 1 results of Mutambudzi et al (2020) used.

7
5 Increases in cases over time
As can be seen from Figure 2, the daily count of new educator cases has clearly increased
over the period, as one might expect. The rate of increase is about comparable to the general
increase in Gauteng over this period. In Gauteng as a whole, new cases per day increased
from a moving average10 of 992 on 14 June to 3,911 on 4 July, in other words by a factor of 3.9. The trendline in Figure 2 points to an increase of 14 cases to 37 cases over this period,
giving a factor of 2.6. The rise in teacher cases does not seem steeper than the increases seen
in the Gauteng population as a whole.
Figure 2: New educator cases per day
0
10
20
30
40
50
60
70
25-May-20 04-Jun-20 14-Jun-20 24-Jun-20 04-Jul-20
Ne
w e
du
cato
r ca
ses
in a
da
y
Note: The trendline is quadratic.
Figure 3 illustrates the new learner cases per day for primary and secondary schools separately, where this means schools with Grade 7 but not Grade 12, and schools with Grade
12 but not Grade 7, respectively. As one might expect, the increase seen for older learners is
steeper – this is shown by the red dotted line.
Figure 3: New learner cases per day
0
2
4
6
8
10
12
14
25-May-20 04-Jun-20 14-Jun-20 24-Jun-20 04-Jul-20
Ne
w l
ea
rne
r ca
ses
in a
da
y
Grade 7 Grade 12
10 Over five days, so 992 is the daily average for 10 June to 14 June.

8
6 Factors associated and not associated with teacher infections
The following two tables present regression outputs, essentially models which point to
conditional correlations between, on the one hand, educator cases, and on the other hand, four
school factors: whether the school offers Grade 12; the presence of learner cases; the size of
the school as reflected by the number of educators; and whether the school is in quintiles 1 to 3, which would normally mean the school is a no fee school. Only public ordinary schools are
analysed, as it was for these schools that data for the explanatory variables was easily
available.
Table 2 analyses all the public ordinary schools in the province, and examines whether the
explanatory variables predict the school’s having any educator cases. The first column
indicates an important point, namely that offering Grade 12 is not associated with having
educator cases, when one controls for other factors. Educators at the primary and secondary
levels are essentially equally likely to be positive.
For schools offering Grade 12 (third column), having learner cases is a predictor of having at
least one educator case. Specifically, having learner cases increases the probability by 0.09 for
a school offering Grade 12. To illustrate, this might increase the probability from 10% to
19%. This does not necessarily mean learners are infecting educators. It simply means that
where one finds learner cases, one is somewhat likely to also find educator cases. Yet this
should be seen in the context of what was discussed above: of 561 schools with educator
cases, only 56 also had learner cases. The correlation seen in Table 2 could be due to high
levels of infection in the community around the school. The model is simply indicating that
the correlation exists, not how transmission occurs. Importantly, the correlation is not found
for schools not offering Grade 12 (middle column) or when all schools are examined (first
column). However, it should be noted that there are only 45 public ordinary schools with both
learner and educator cases, of which 30 are schools offering Grade 12. As more data are
collected, correlations not seen currently may emerge, or correlations seen here may
disappear.
Turning to the last two explanatory variables, a large school, specifically one with over 33
educators employed, is more likely to have at least one educator who is positive. This should
not come as a surprise, and the difference is small. Roughly, the probability of having an
educator case rises by 7 percentage points for a large school. Lastly, whether a school is in
quintiles 1 to 3 does not appear to make a difference to the presence of educator cases.
Table 2: Regression of having educator cases on school explanatory variables
All
Without Grade 12
With Grade 12
Has Grade 12 - Has learner cases - - .09* Is large school .07*** .06*** .08** Is no fee - - -
N 2062 1451 611 Pseudo R squared .010 .006 .012 Note: Dependent variable is 0-1 for whether a school had at least one educator case. Values such as ‘.07’ are the gains in the probability of having any educator cases associated with a positive in the explanatory variable. For instance, being a large school increases the school’s probability of having at least one educator case by 0.07 (under ‘All’)). *** is highly significant, at the 1% level, ** at the 5% level and * at the 10% level. A dash ‘-‘ refers to an explanatory variable entered in the regression whose coefficient is not statistically significant. Results were obtained using Stata’s logit and margins commands.

9
The next table analyses only those schools with educator cases, and examines predictors of
the ratio of educator cases to total educators per school. The number of learner cases does not
predict this ratio for either of the two school levels. Here a larger school predicts a lower ratio.
This is largely because so many schools have only reported one educator case, which would
result in a higher ratio in a small school. For schools without Grade 12, poorer quintiles 1 to 3
schools are less likely to have more than one educator case.
Table 3: Regression of number of educator cases on school explanatory variables
Without Grade 12
With Grade 12
Learner cases - - School size (educators) -.002*** -.001*** Is no fee -.01* -
N 284 148 R squared .215 .149
Note: Dependent variable is the number of educator cases in the school divided by the total number of educators. Only schools with at least one educator case analysed.
If one re-runs the Table 3 regressions with only ‘Learner cases’ as the explanatory variable, the finding does not change. Learner cases still do not predict the ratio of educators who
tested positive.
7 Geographical distributions
The maps below do not demonstrate any visible clustering of schools, at either the primary or
secondary levels. The maps should be read together with Table 1 above. Despite the higher
numbers of primary schools with educator cases, the percentage of primary schools with
educator cases is slightly lower than for the secondary level.

10
Figure 4: Distribution of cases
The percentage of all schools with cases, of any type, per education district does point to a
particularly high value for Sedibeng East (marked in the first map above). In this district, 41%
of schools reported having cases, against a provincial mean of 22% and a second-highest
value of 27% for Ekurhuleni.
Primary (with Gr 7, not Gr 12)
Secondary (with Gr 12, not Gr 7)
Sedibeng East

11
Examining each school’s distance to the closest school with an infection serves as a useful test
of whether there is geographical clustering of cases. If there was clustering, one would expect
schools with cases to be exceptionally close to other schools with cases. As can be seen in
Figure 5, this is not what is found. Schools with and without cases are about as far from the
nearest school which reported at least one case. On average, schools without cases were 1.5
km from the closest school with someone, either a learner or staff member, who was tested
positive. The figure for schools with cases was almost the same, at 1.6 km.
Figure 5: Distance to closest school with cases
0
5
10
15
20
25
30
0.0 0.5 1.0 1.5 2.0 2.5 3.0
Pe
rce
nta
ge
of
sch
oo
ls
Distance in km to nearest school WITH cases
Schools without cases Schools with cases
Means:
1.5 km without cases
1.6 km with cases
Note: Distance, which is straight line distance, has been rounded to the closest 0.5 km. Means are calculated using schools with any distance value.
References
Department of Basic Education (2018). Per learner spending inequities in 2016. Pretoria.
Mutambudzi, M, Niedzwiedz, C.L., Macdonald, E.B., Leyland, A.H. et al (2020). Occupation and risk of COVID-19: prospective cohort study of 120,621 UK Biobank participants.
medRxiv.
World Health Organization (2020a). Considerations for school-related public health
measures in the context of COVID-19. Geneva.
World Health Organization (2020b). Calibrating long-term non-pharmaceutical interventions
for COVID-19. Geneva.

12
Appendix 1: Method for independent estimation of positive educators
Table 4 below illustrates the method used for arriving at an independent estimate of the
number of educators found to be positive between 25 May and 8 July. The focus here is on
the demographic category females aged 45 to 49, for which the estimate is 110 positive
educators – see the bottom line. The same approach was then applied across all age categories and both genders, giving an overall total of 685 educators estimated to be positive in the
period in question.
Table 4: Method for estimating positive educators
1,449 A: South African females aged 45 to 49 found positive to date on 28 May by Department of Health.
1,590,334 B: South African females aged 45 to 49 in the South African population in 2019 according to Stats SA mid-year population estimates.
0.09 C = A / B × 100: Percentage positive in this group. 412,888 D: Gauteng females aged 45 to 49 in the South African population in 2019 according to
Stats SA mid-year population estimates. 376 E = D × C / 100: Estimate positive for Gauteng females aged 45 to 49 using national
prevalence on 28 May. 2,993 F: Gauteng's cases to date on 25 May according to sacoronavirus.co.za.
75,015 G: Gauteng's cases to date on 8 July according to sacoronavirus.co.za. 72,022 H = G - F: New Gauteng cases for the period 25 May to 8 July.
9.49 I: Inflation factor needed to raise E total across for all ages and both genders to Gauteng total of 72,022.
9,386 J: Number of publicly paid female educators aged 45 to 49 in Gauteng according to payroll data.
67,734 K: Number of publicly paid educators of any age and gender in Gauteng according to payroll data.
91,702 L: Number of educators in Gauteng in 2019, both publicly and privately paid, in any school (but not pre-schools)11.
12,707 M = J × K / L: Estimate of Gauteng female educators aged 45 to 49 in Gauteng, both publicly and privately paid.
3,572 N: E × I: Estimated positive cases found in Gauteng among females aged 45 to 49 between 25 May and 8 July.
110 O = N / D × M: Estimated number of female Gauteng educators aged 45 to 49 found to be positive between 25 May and 8 July.
If the above method is used to estimate the number of educators based just in public ordinary schools, whether they are employed by the province or the school governing body, the result
is 554 educators (all ages and both genders).
11 Department of Basic Education publication 2019 School Realities used, with number of special
school educators taken from the 2016 Education Statistics in South Africa publication.

13
Appendix 2: Details by education district
Table 5: Details by district
District
Sub-missions
made
Schools sub-
mitting LearnersEduc-ators
Admin-istrative
staff
General assist-
antsYouth
brigadesSchools
closed
Ekurhuleni North 65 54 21 52 7 6 0 23Ekurhuleni South 74 60 13 64 4 0 0 5Gauteng East 79 52 16 62 8 4 0 2Gauteng North 26 17 16 13 0 0 0 0Gauteng West 44 39 10 37 3 3 0 9Johannesburg Central 73 63 15 60 6 0 2 3Johannesburg East 87 62 20 73 7 3 0 1Johannesburg North 87 60 31 73 6 4 0 0Johannesburg South 56 46 12 47 6 4 0 8Johannesburg West 65 40 10 59 7 2 0 3Sedibeng East 69 43 17 54 4 1 0 10Sedibeng West 27 25 7 28 0 0 0 2Tshwane North 55 39 15 43 1 3 0 13Tshwane South 101 78 70 44 6 2 1 21Tshwane West 57 31 21 44 11 1 0 5
Total 965 709 294 753 76 33 3 105