patterns in electronic journal usage: challenging the composition
TRANSCRIPT

484 College & Research Libraries November 2002
484
Patterns in Electronic Journal Usage:Challenging the Composition ofGeographic Consortia
Philip M. Davis
Philip M. Davis is Life Sciences Bibliographer in the Albert R. Mann Library at Cornell University; e-mail: [email protected]. The author would like to thank Karen Steele at Academic Press, now ElsevierScience, for providing the IDEAL usage data and his colleagues at Cornell and elsewhere who have con-tributed feedback and provided support for this project.
Annual electronic journal usage data for the NorthEast Research Library(NERL) consortium was analyzed for 2000 and 2001 for the Academic PressIDEAL aggregate package. Patterns indicated a high degree of skew in useof the journal collection: a small number of journals formed the majority oftotal use. Each institution illustrated a unique usage pattern, with someinstitutions using (proportionally) more or less of the collection. No institu-tion used every title, and some titles were used very infrequently by theconsortium as a whole. Title ranking showed high congruence between2000 and 2001. Titles not subscribed in print received about ten times lessuse than locally subscribed titles. Cluster analysis revealed three distinctgroups of institutions based on use of the journal package: large researchinstitutions, medical institutions, and smaller liberal arts colleges and poly-technic institutes. Student enrollment is a good predictor of total usage, withmedical institutions being an exception. It is recommended that institutionsconsider their consortial membership and organize themselves into groupsof homogenous institutions with similar missions.
ibrary consortia are almost asold as the library institution it-self. Much of the growth of con-sortia during the last century
took place in the 1960s and 1970s for thepurpose of cooperative cataloging, and re-source sharing.1 During the 1990s, libraryconsortia gained in significance, particu-larly in the realm of collection develop-ment. The development of “buying clubs”took advantage of their economy of scaleso that their members could realize signifi-cant price savings.2 The proliferation ofnetworked electronic resources in the late1990s and early in this century became a
major focus of consortia, particularly state-wide consortia, and much of their rise inthe past five years may be attributed di-rectly to the rise in cost and quantity ofelectronic journals and other products.3–6
Working with consortia may be the onlyoption for many libraries considering thepurchase of electronic products. A surveyof the fourteen institutions that make upthe Boston Library Consortium reportedthat 71 percent of the members felt thatconsortial purchase was the only way theycould afford the large commercial pub-lisher packages of e-journals. Most of themanticipated having to cancel other sub-

Patterns in Electronic Journal Usage 485
scriptions in the future in order to main-tain access, and a quarter of them had toshift money away from monographicfunds in order to afford these packages.7
Referring to all-or-nothing journal pack-ages as the “Big Deal,” Kenneth Frazierargued that these agreements “bundle thestrongest with the weakest publisher titles,the essential with the non-essential.” Whena library has agreed to the Big Deal, Frazierhas argued, it cannot continue to receivethe titles it most needs unless it maintainsits subscription to the full package.8
Although there have been someconsortial-use analysis studies on databasesand e-journals, they have either focused ontemporal peak-usage patterns (per day, permonth) or merely provided summary dataand averages for entire packages.9–11 Little isknown about title-level patterns and relation-ships that institutions share in their use ofthe e-journal packages. This knowledge isabsolutely critical as consortia return to ne-gotiate with large commercial publishers forthe next generation of Big Deals.
This article provides an in-depth analy-sis of the Academic IDEAL e-journal pack-age for the NorthEast Research Library(NERL) consortium over a two-year pe-riod. Based on the similarity of these re-sults to other studies in electronic and pa-per collections, it is strongly believed thatthis study can be generalized to the otherpublisher packages and other consortia.
NERL ConsortiumThe NorthEast Research Library (NERL)consortium is composed of twenty-oneacademic research libraries plus affiliatesfor the purpose of licensing expensive elec-tronic resources for its members.12 Lists ofmembers and affiliates can be found at theNERL public Web site.13 Unlike many con-sortia, NERL members and affiliates arenot obliged to subscribe to each resourcelicensed by the consortium. In 2000, therewere twenty-four separate NERL institu-tions and affiliates participating in theAcademic IDEAL package; in 2001, therewere twenty-nine. These institutions arelisted in figure 1. Medical colleges affili-ated with research institutions were in-cluded in the parent institution’s usagedata, with two exceptions: the CornellUniversity Medical College and the Uni-versity of Massachusetts Medical College.
FIGURE 1Total IDEAL Downloads for 2001
0
10,000
20,000
30,000
40,000
50,000
Among librarians who work withpublisher data, there is a generalskepticism of the accuracy of e-journal use data.
Full-t
ext Do
wnloa
ds

486 College & Research Libraries November 2002
The Data SetThe Academic IDEAL e-journal packageis a collection of more than two hundredtitles in the sciences and social sciences.14
In 2000, this package included 203 titlesand 206 in 2001. A list of IDEAL titles canbe located on the Academic Press Webpage.15 Thirty of these titles are discon-tinued (i.e., no longer being published,but still available as back files). The dataset did not include the Harcourt HealthSciences (HHS) collection because notevery subscriber of the IDEAL packagealso subscribed to the HHS collection.
The unit of measurement in this studywas a single full-text download. Each cellin the data set listed the cumulative num-ber of downloads for an entire year foreach journal title. No patron informationwas included in the data set.
An institution’s results may be higheror lower than expected for a number ofreasons. For example, one of the institu-tions joined partway through 2001. Otherreasons may include how e-journals arecataloged and presented to the user,whether they have been advertised totheir community, and other institution-specific details.
Why Use of Electronic Cannot BeCompared with Use of PrintAlthough it is tempting to compare e-jour-nal use with use of its print counterparts,the results can be very difficult to inter-pret based on the way “use” is counted.16,17
In general, the use of printed journals isvastly underestimated, some studies re-porting only 20 to 25 percent of uses beingrecorded. Readers often reshelve a journalafter browsing it, leaving no record of itsuse. Readers also often browse multiplearticles per journal and multiple issues perbound library copy.18 In the online world,all of these browses would be counted as“hits.”
Blackwell Scientific logs each request foran article, but not actual articles delivered.In a recent newsletter, Blackwell listed anarray of factors affecting the overcountingof e-journal data, including double-click-ing on an HTML link rather than single
clicking, using a Web browser’s refresh/reload button, or using the back and thenforward buttons.19 In addition, somebrowsers (especially Internet Explorer)make multiple requests for the same fileeven if the user clicks only once. A whitepaper prepared by Marthyn G. M.Borghuis for Elsevier’s Science Direct rec-ommended that multiple requests for thesame page should not be counted if theyoccur within a ten-second interval and thatthis time interval should be extended tosixty-five seconds for pdf files.20
Among librarians who work with pub-lisher data, there is a general skepticismof the accuracy of e-journal use data. Inan apology to customers last year, Elsevierreported that abstracts were included asfull-text downloads when reporting us-age statistics prior to July 2001.
Deborah Blecic, Joan B. Fiscella, andStephen E. Wiberly Jr. have argued that itis impossible to be certain that an articledownloaded to a patron’s computermeans that it is read and have speculatedthat the type of reading done from com-puter monitors is more like browsing thanreading.21
Skew of Scientific LiteratureResearchers in the field of information sci-ence have long recognized that publica-tion and citation patterns in the scientificliterature are highly skewed. In 1948,Samuel C. Bradford dedicated a chapterin his book Documentation to his principleof “journal scatter,” identifying a nucleusof core journals most devoted to a par-ticular subject with radiating zones ofjournals contributing fewer and fewerarticles to that subject.22 Based on an ex-tensive analysis of ISI citation data, Eu-gene Garfield provided quantifiable evi-dence to support the general scientificbelief that a “surprisingly small numberof journals generate the majority of bothwhat is cited and what is published.”23 Inthe study that is the subject of this article,the top journals were used tens of thou-sands of times by NERL subscribers, com-pared to a handful of times for the least-used titles (figure 2). As an example of

Patterns in Electronic Journal Usage 487
0
10,000
20,000
30,000
40,000
50,000
1 206
Ranked IDEAL Titles
what this skew can do to grossly inflatethe average use of a journal, the averageuse per title was calculated to be 1,681downloads. In comparison, the median useper title (a better descriptor of central ten-dency when using skewed data) was 511downloads. With heavily skewed data, itmakes little sense to talk about the “aver-age use of a journal.”
Because of this skew, the data neededto be normalized. Many statistical testsrequire normality in the data (i.e., that thedistribution follows a bell-shaped curve),and bibliometric data almost never ex-hibit a normal distribution. Failure tonormalize the data can yield results thatare artifactual in nature. Log (base 10)transformation is commonly used to nor-malize bibliometric data and was usedseveral times in this study.24
Patterns in the DataThe e-journal data have two dimensions:scale, or how many times an institutionuses the collection as a whole; and com-position, or the patterns of individual e-journal use within the package.
Based on the patterns in the data, it ispossible to make the following prelimi-nary statements:
• Each institution has a unique pat-tern of collection use.
• Some institutions use (proportion-ally) more or less of the collection.
• No institution uses every title.
• Some titles are used very infre-quently by the entire consortium.
Total Use by InstitutionIndividual institutions showed a greatdeal of variation in their total use of thesystem (figure 1); the largest institutionsused the collection thousands of timesmore than the smallest. As with averagetitle use, it is not meaningful to talk aboutaverage institutional use.
Skew in Title UseThe variation in title use is heavilyskewed, as illustrated in figure 3. Whenordered by cumulative use:
• The top 10 journals (4.9% of the col-lection) satisfied 44 percent downloads.
• The top 14 journals (6.8% of the col-lection) satisfied 50 percent downloads.
• The top 50 journals (24.3% of the col-lection) satisfied 80 percent downloads.
• The top 83 journals (40.3% of the col-lection) satisfied 90 percent downloads.
• The last 123 titles (59.7% of the col-lection) represented only 10 percent of theuse of the collection.
These results are consistent with morethan thirty years of research on print col-lections. In 1969, Richard L. Trueswell il-lustrated the same skewed distributionwith library circulation data and foundthat approximately 80 percent of the totalnumber of circulation transactions ac-counted for only 20 percent of the collec-
FIGURE 2Total NERL Downloads per Title 2001
Full-t
ext Do
wnloa
ds

488 College & Research Libraries November 2002
tion.25 Trueswell and others have used thistheory to posit a core library collection.Many empirical studies have been doneto verify the 80/20 rule, reporting slightvariations of the ratio.26–30
Because of usage variation amongtwenty-nine unique institutions, it is moremeaningful to talk about institutional use.The effect of aggregating all of these in-stitutional uses into a global NERL usecurve is to report more use of the collec-tion as a whole than what is representedby the sum of individual institutions (fig-ure 4).
Rather than showing all twenty-nine in-dividual usage curves, this study classifiedparticipating institutions into three groups:large research, medical, and other. A descrip-tion of the method used to classify institu-tions based on usage is presented in thisarticle in the section on cluster analysis.
Medical institutions demonstrated avery high use of a small number of jour-nals. Forty-one titles (20% of the collec-tion) represented well over 90 percent of
the use for this group, with one institu-tion exhibiting 96 percent use.
For the large research institutions, nearly80 percent of the use was satisfied with 20percent of the collection. For the other in-stitutions, 20 percent of the collection satis-fied 83 percent full-text downloads. TheNERL ratio for all twenty-nine institutionscombined is 20 percent/75 percent, a ratiofar lower than expected by looking at eachgroup of institutions independently.
Nonsubscribed versus Subscribed TitlesIn 2000, several serial vendors providedsubscription information to AcademicPress listing subscribed and nonsubscribedtitles for each institution. Because of errorson the serial vendor’s part, several high-use, “nonsubscribed” titles were found toindeed have print subscriptions at CornellUniversity. Thus, the following resultsshould be considered biased, inflating theuse of nonsubscribed titles.
Despite this bias, nonsubscribed titlesreceived about one-tenth of the use as sub-scribed titles (figure 5). Medical institutionsexhibited extreme bias in their use of thecollection, favoring subscribed titles overnonsubscribed titles. For example, the av-erage number of downloads per subscribedtitle for the University of Massachusetts
FIGURE 3NERL Cumulative Use 2001
For both current and archival titles,the usage patterns are similar: asmall number of titles represent themajority of total use.
Cumu
lative
Use (F
ull-tex
tDo
wnloa
ds)
0%
10%
20%
30%
40%
50%
60%
70%
80%
90%
100%
0% 20% 40% 60% 80% 100%
Cumulative journal titles

Patterns in Electronic Journal Usage 489
Medical School was 117.3, compared to 3.7downloads per nonsubscribed title. For thelarge multidisciplinary institutions, the dif-ference in use also was great, but not quiteas drastic. At Yale, the ratio was 196.2 to 47.7.
Even for the smaller colleges, there was stilla difference. Subscribing to only fourteenAcademic Press titles, Bridgewater Stateexhibited 14.1 downloads per subscribedtitle, compared to 3.2 downloads per
FIGURE 4Patterns of IDEAL Use by Institution Type Displaying Top 50 Titles
0%
10%
20%
30%
40%
50%
60%
70%
80%
90%
100%
0 5 10 15 20 25 30 35 40 45 50
Cumulative No. Journals
NERL TotalLarge ResearchMedicalOther
0
50
100
150
200
250
U P
enn
Yal
e
Col
umbi
a
MIT
Cor
nell
NY
U
U R
oche
ster
Mt.
Sin
ai
U M
ass-
Am
hers
t
Cor
nell
Med
Not
re D
ame
Dar
tmou
th
Prin
ceto
n
U M
ass
Med RP
I
NY
S D
ept.
Hea
lth
WP
I
U M
ass-
Low
ell
Vas
sar
RIT
Will
iam
s
Brid
gew
ater
Sto
nehi
ll
Ski
dmor
e
NE
RL
Uses per subscribed title Uses per non-subscribed title
FIGURE 5Ratio of Use by Print Subscription Status 2000
% Cum
ulative
Use (F
ull-tex
t Dow
nloads
)

490 College & Research Libraries November 2002
1
10
100
1000
10000
Current Archival
Tota
l Dow
nloa
ds
25th
5th
Median
95th
75th
Percentiles
nonsubscribed title. For NERL as a whole,subscribed titles received an average of 114downloads per title, compared to 14 fornonsubscribed titles. In sum, there was nota single instance of an institution gettingsimilar or more use of nonsubscribed oversubscribed titles.
Archival versus Current TitlesIn 2000, there were 173 currently publishedtitles and 30 discontinued titles; Academicrefers to the latter as “archival” titles. Fig-ure 6 illustrates the difference in title useby current or archival status. The box-plotgraph provides a visual distribution of thedata. The “box” indicates the interquartilerange – the range that contains 50% of thedata, and includes the median. Because ofstatistical outliers, the “whiskers” on eachend represent the 5th and 95th percentiles.While the whiskers indicate many excep-tions, it is clear that current titles get farmore use (per title) than archival ones. Themedian use for current titles was 457downloads/title compared to 104 down-loads for archival titles.
Patterns of Unused TitlesIn 2001, every title was used sometime,somewhere, among thirty consortial sub-scribers. However, an examination of howindividual institutions use the collectionof journals revealed that the results werequite varied (figure 7). Nonuse of titles was
inversely proportional to totaluse of the system. Expressedin the positive, higher-use in-stitutions used more of thetitles. Although this statementsounds obvious, some inter-esting differences were discov-ered based on the type of in-stitution. For comparison, theauthor of this study created afictitious smaller institutioncalled Random U. Random-ized journal usage for this in-stitution was generated foreach title (between 0 and 21hits/title and total use equaled2170 hits/year).
For the large research insti-tutions, less than 20 percent of the titleswent unused during the year, with manyof these institutions leaving under 10 per-cent of the titles unused. These low fig-ures illustrate near-comprehensive use ofthe collection.
Medical institutions represent outliers inthis graph. In general, they were high us-ers of the collection as a whole but focusedtheir use on a small number of journals.
For the other institutions in the consor-tium, a relatively larger proportion of thejournals was left unused during the year,reaching as much as 70 percent of the col-lection. When compared to Random U., itis interesting to note that the smaller insti-tutions show less-comprehensive use ofthe collection than what would be pre-dicted if their access to the collection werecompletely random. In other words, thesefindings support the bias of use towardlocally held print subscriptions. (See thesection on nonsubscribed versus sub-scribed titles.)
There is no way to measure who usedthe title (researcher, student, librarian)and for what purpose (known item search,browse, a cataloger verifying if the titleworks). For this reason, it is unwise to talkabout what value each statistic represents.
Similarities among InstitutionsThis section explores two methods forunderstanding the patterns of e-journal
FIGURE 6Box-plot of Academic IDEAL Use:
Current Versus Archival Titles

Patterns in Electronic Journal Usage 491
use among institutions: correlation analy-sis and cluster analysis
Correlation AnalysisCorrelation analysis looks at the similari-ties among institutions based on their rela-tive use of each title. It is insensitive to scale,which means that institutions showing dif-ferent levels of total use can be compared.Correlation analysis requires data normal-ity, so raw usage data were converted tolog usage before analysis. The correlationcoefficient, in the case of this study, is ameasure of the degree of similarity betweentwo institutions. The coefficient ranges from-1 to +1, with -1 illustrating complete dis-similarity, 0 representing no relationship,and +1 representing an identical (or perfect)relationship. Because there is no such thingas negative use of a journal, the correlationfigures arising from this analysis range from0 to +1.
Judging the strength of a correlation co-efficient is partially subjective in nature.
In general, coefficients above 0.7 aredeemed to be strong correlations, withcoefficients above 0.9 deemed very strong.Correlations below 0.3 are considered tobe weak at best.
In general, there was a great deal ofsimilarity among the large research insti-tutions, with coefficients all above 0.7. Theindividual institutions in this group alsocorrelated very highly with NERL as awhole, which is not surprising becausethis group generated the majority of theNERL total statistics.
Medical institutions correlated veryhighly with each other, their coefficientranging from just below 0.8 to above 0.9.This group showed lower (but still strong)correlations with NERL as a whole, withcoefficients ranging from 0.6 to 0.7.
The smaller colleges and polytechnicinstitutes showed a great deal of varia-tion in how they used the collection. Thisgroup showed weak-to-very-weak corre-lation among themselves (0.1 to 0.5) and
FIGURE 7Patterns of Unused Journals

492 College & Research Libraries November 2002
weak-to-moderate correlation to the restof NERL (0.3 to 0.6).
Cluster AnalysisCluster analysis is a collection of statisticalmethods that groups similar objects (in thecase of this study, institutions) into homo-geneous groups (or clusters). The principaloutput of this analysis is a hierarchical treediagram called a dendrogram (figure 8).This method is a type of data classificationand has the effect of reducing the dimen-sionality of the data.31,32 In the example ofthis study, each institution’s use of 206 jour-nals is reduced to a single dimension. Wil-liam E. McGrath used cluster analysis to
group academic disciplines based on librarycirculation data.33 Cluster analysis, likemany of the other techniques discussed inthis article, requires the data to be normal.As such, the log usage was used.
In figure 8, subheading “Usage Rank”is the rank of each institution based onits total usage over the year. The measureof dissimilarity provides a linear scale forcomparing the dissimilarity between in-stitutions and clusters. For example, thedissimilarity between Cornell MedicalCollege and the University of Massachu-setts Medical School (about one unit ofdistance) is smaller than the dissimilar-ity between Massachusetts Institute of
FIGURE 8Dendrogram of Institutions from Hierarchical Cluster Analysis
Patterns in Electronic Journal Usage 493
Technology (MIT) and Cornell University(about seven units).
This analysis produced three principalclusters. The first cluster was composedof thirteen of the largest multidisciplinaryresearch universities, the second wascomposed of the four medical institutions,and the third was composed of twelvesmaller universities, liberal arts colleges,and polytechnic institutes. For classifica-tion purposes, cluster one will be referredto as Large Research, cluster two as Medi-cal, and cluster three as Other.34
Interestingly, the large research univer-sities identified in the Large Researchcluster, which included a medical school,also tended to form two subclusters: NewYork University, University of Rochester,Brown University, Tufts University, andDartmouth College formed the firstsubcluster; and University of Pennsylva-nia, Yale University, and Columbia Uni-versity formed the second. In the dataprovided by Academic Press, Cornell Uni-versity was broken down into its maincampus in Ithaca, New York, and its medi-cal school in New York City. Because ofthis split, Cornell showed more similar-ity to MIT than the other larger researchuniversities that included medical schooluse in their counts.
Compared to the control, the smallestusers of the package were more relatedto Random U. than any of the othergroups, although this is not a strong rela-tionship.
Title Stability from 2000 to 2001Looking at multiyear data is important inunderstanding the reliability of the data.Are the patterns generalizable from yearto year, or are the data so variable thatmeaningful statements can be made onlyabout the current year?
Looking at title stability is one way toverify the reliability of the data, andSpearman rank correlation was used inthis part of the analysis. The benefit ofusing Spearman rank correlation is thatit uses journal rank (i.e., 1, 2, 3, etc.) in-stead of the skewed raw usage data.
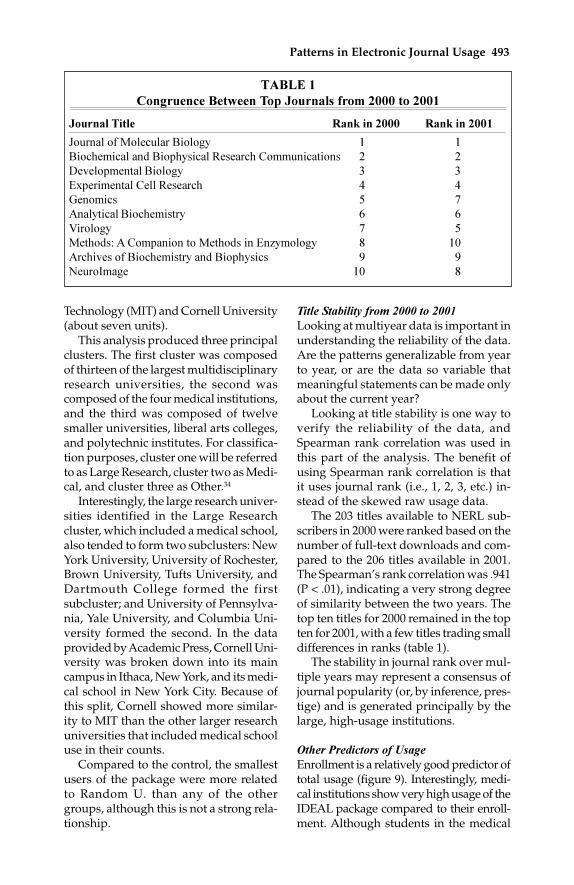
The 203 titles available to NERL sub-scribers in 2000 were ranked based on thenumber of full-text downloads and com-pared to the 206 titles available in 2001.The Spearman’s rank correlation was .941(P < .01), indicating a very strong degreeof similarity between the two years. Thetop ten titles for 2000 remained in the topten for 2001, with a few titles trading smalldifferences in ranks (table 1).
The stability in journal rank over mul-tiple years may represent a consensus ofjournal popularity (or, by inference, pres-tige) and is generated principally by thelarge, high-usage institutions.
Other Predictors of UsageEnrollment is a relatively good predictor oftotal usage (figure 9). Interestingly, medi-cal institutions show very high usage of theIDEAL package compared to their enroll-ment. Although students in the medical
TABLE 1Congruence Between Top Journals from 2000 to 2001
Journal Title Rank in 2000 Rank in 2001Journal of Molecular Biology 1 1Biochemical and Biophysical Research Communications 2 2Developmental Biology 3 3Experimental Cell Research 4 4Genomics 5 7Analytical Biochemistry 6 6Virology 7 5Methods: A Companion to Methods in Enzymology 8 10Archives of Biochemistry and Biophysics 9 9NeuroImage 10 8

494 College & Research Libraries November 2002
institutions may not be the largest users ofthe package, they are an indication of thesize of the institution as a whole (includingresearchers, post-docs, lab technicians, etc.).Previous research on the communication
behavior of scientists indicates that medi-cal researchers read more and publish morethan any other group of scientific research-ers. Studies reported by Carol Tenopir andDonald King claim that cancer researchers,as an example, spend approximately 288hours per year reading journal articles, com-pared to the median of 140 hours per yearfor other scientists. Engineers spend theleast time reading at approximately 26hours per year.35 Survey research at the Ohio
State University confirms that researchersin the biological and medical sciences re-port more use of e-journals and databasesthan any other group of researchers.36
DiscussionChallenging the Composition ofGeographical ConsortiaThe results of this analysis indicate pat-terns in the way that similar institutionsuse e-journal packages. Based on the dataalone, large multidisciplinary research in-stitutions, medical institutions, and lib-eral arts colleges might be better off ne-gotiating with similar institutions.
Medical institutions, which exhibitedan intense use of a small number of jour-nals, may negotiate for a better financialdeal involving a core collection of bio-medical journals and rely on interlibraryloan for the small percentage of requestsfor titles outside this group. Larger,multidisciplinary research institutionsmay decide to continue their purchase of
FIGURE 9Enrollment Versus Total Use
In comparison, principally under-graduate institutions show weak (ifany) relationships to each other or tothe consensus of the other institu-tional subscribers and cluster alongwith the random control.

Patterns in Electronic Journal Usage 495
entire packages if their collection goal isto purchase as comprehensively as pos-sible and if the economic model for pur-chasing the entire collection makes moresense than purchasing individual titles.Some smaller liberal arts colleges maydecide that, based on their low and vari-able usage, they may not require a pack-age of specialized research journals.
Although it is impossible to ascertainthe meaning of a single full-text downloadin this study, the patterns in the use of thejournal package confirm preaccepted be-liefs of user behavior. The severe skew to-ward a small number of high-use journalsin the IDEAL package indicates a generalagreement among users at research andmedical institutions of the most prestigious(or at least, the most popular) titles in theset. Congruence from 2000 to 2001 on thetop titles reinforces that this is not a statis-tical artifact.
In comparison, principally under-graduate institutions show weak (if any)relationships to each other or to the con-sensus of the other institutional subscrib-ers and cluster along with the randomcontrol. Because of the much smaller scaleof these institutions, the data observedmay be a product of individual class as-signments and specialized curricula.
User behavior of undergraduates alsomay provide a logical explanation. Over thepast few years, there has been considerableanecdotal evidence from both librarians andprofessors that students prefer electronicresources and lack the ability or willingnessto distinguish credible academic sourcesfrom popular materials on the Internet.37–42
Burton and Chadwick have written of the“apparently random selection of use” ofelectronic resources by undergraduates.“Some students,” they have claimed, “ap-pear to grab the first 10 reasonably relevantitems they encounter … regardless of theauthority or appropriateness of thesources.”43 Undergraduate use behaviormay be the most plausible explanation for
the patterns observed in this study, al-though this conclusion cannot be derivedfrom the data and is merely speculationbased on qualitative and anecdotal studies.
There was still a tendency for all institu-tions (even the smaller ones) to use sub-scribed titles far more often than nonsub-scribed titles when patrons have full accessto a publisher’s collection. These resultsconfirm that selectors have reasonably tai-lored their journal collections to meet theneeds of their local constituents. Local fac-tors, such as the timely cataloging and pro-motion of new journal titles, also may par-tially explain the results.
This study is merely an analysis of usedata and does not involve other importantinformation that may go into purchasinga journal package. It is not intended to pre-scribe what institutions do with their col-lection dollars but, rather, to providemuch-needed data that institutions can useto make informed decisions.
The results of the analysis challenge thecomposition of geographic-based consor-tia and argue in favor of consortia basedon homogeneous membership. Consortiabased on geographical definitions can bevery eclectic; some contain public, aca-demic, school, and special libraries. Eachof these types of libraries has a differentmission statement and institutional goals.Bernie Sloan has argued that a “one-size-fits-all approach won’t work” and that in-stitutions should be grouped based onhomogeneity rather than diversity.44
Peters, director of the Center for Li-brary Initiatives, Committee on Institu-tional Cooperation, expects a lot morechange in the composition and missionof consortia. Reflecting on consortia fo-cused entirely on collection development,he predicted: “the heady ‘buying club’days probably will not return soon. Onechallenge for academic library consortiais to shift gears and engage in more de-liberate strategic planning with an eye topositive long-term outcomes.”45
Notes
1. William Gray Potter, “Studies of Collection Overlap: A Literature Review,” Library Re-

496 College & Research Libraries November 2002
search 4 (spring 1982): 3–21.2. Sharon L. Bostick, “The History and Development of Academic Library Consortia in the
United States: An Overview,” Journal of Academic Librarianship 27 (Mar. 2001): 128–30.3. Thomas A. Peters, “Agile Innovation Clubs,” Journal of Academic Librarianship 27 (Mar.
2001): 149–51.4. Potter, “Recent Trends in Statewide Academic Library Consortia,” Library Trends 45 (win-
ter 1997): 416–34.5. Sue O. Medina, “The Evolution of Cooperative Collection Development in Alabama Aca-
demic Libraries,” College & Research Libraries 53 (Jan. 1992): 7–19.6. Norman Oder, “Consortia Hit Critical Mass,” Library Journal 125 (Feb. 1, 2000): 48–51.7. Jonathan Nabe, “E-journal Building and Its Impact on Academic Libraries: Some Early
Results,” Issues in Science and Technology Librarianship (spring 2001).8. Kenneth Frazier, “The Librarians’ Dilemma: Contemplating the Costs of the ‘Big Deal,’”
D-Lib Magazine 7 (Mar. 2001).9. Carol Tenopir and Eleanor Read, “Patterns of Database Use in Academic Libraries,” Col-
lege & Research Libraries 61 (May 2000): 234–46.10. Deborah D. Blecic, Joan B. Fiscella, and Stephen E. Wiberly Jr., “The Measurement of Use
of Web-based Information Resources: An Early Look at Vendor-supplied Data,” College & Re-search Libraries 62 (May 2001): 434–53.
11. Thomas J. Sanville, “Use of Electronic Journals in Ohiolink’s Electronic Journal Center,”paper presented at the 67th IFLA Council and General Conference, Boston 2001.
12. Despite its name, the consortium is not closed to institutions outside the Northeast. In thefall of 2001, Stanford University joined NERL.
13. NERL, Northeast Research Library Consortium, Dec 5, 2001 [cited July 10]. Available fromhttp://www.library.yale.edu/NERLpublic/.
14. Elsevier acquired Academic Press in 2001. In 2002, IDEAL titles were being integrated intothe Science Direct package.
15. Academic Press, Journal Home Pages [cited July 10, 2002]. Available online from http://www.academicpress.com/www/journal/.
16. David H. Morse, and William A. Clintworth, “Comparing Patterns of Print and ElectronicJournal Use in an Academic Health Science Library,” Issues in Science and Technology Librarianship(fall 2000).
17. David Goodman, “A Year without Print at Princeton, and What We Plan Next,” LearnedPublishing 15 (Jan. 2002): 43–50.
18. Deborah D. Blecic, “Measurement of Journal Use: An Analysis of the Correlations be-tween Three Methods,” Bulletin of the Medical Library Association 87 (Jan. 1999): 20–25.
19. Anonymous, “News,” Blackwell Publishing News (Nov. 2001): 1–5.20. Marthyn G. M. Borghuis, What to Count & What Not? A White Paper on the Filters to Be
Applied to a Web-server Log File before Usage-Analysis and Reporting Can Start (Amsterdam: ElsevierScience Direct, 2000).
21. Blecic, Fiscella, and Wiberly, “The Measurement of Use of Web-based Information Resources.”22. Samuel C. Bradford, “The Documentary Chaos,” in Documentation (London: Lockwood,
1948), 144–59.23. Eugene Garfield, “The Significant Scientific Literature Appears in a Small Core of Jour-
nals,” Scientist 10 (Sept. 1996): 13.24. Log (base 10) is a numerical series whose intervals represent a jump by ten times. For
example, 10 is represented as 1, 100 is represented as 2, 1,000 as 3, etc.25. Richard L. Trueswell, “Some Behavioral Patterns of Library Users: The 80/20 Rule,” Wil-
son Library Bulletin 43 (Jan. 1969): 458–61.26. Blecic, Fiscella, and Wiberly, “The Measurement of Use of Web-based Information Resources.”27. L. Egghe, “Exact Probabilistic and Mathematical Proofs of the Relation between the Mean
Number of Items per Source in the Bibliography and the Generalized 80/20-Rule,” Journal of theAmerican Society for Information Science 44 (Aug. 1993): 369–75.
28. Quentin L. Burrell, “The 80/20 Rule: Library Lore or Statistical Law?” Journal of Documen-tation 41 (Mar. 1985): 24–39.
29. Tina E. Chrzastowski and Brian M. Olesko, “Chemistry Journal Use and Cost: Results of aLongitudinal Study,” Library Resources and Technical Services 41 (Apr. 1997): 101–11.
30. Philip M. Davis, “Where to Spend Our E-Journal Money? Defining a University Library’sCore Collection through Citation Analysis,” Portal: Libraries and the Academy 2 (Jan. 2002): 155–66.
31. Mark S. Aldenderfer and Roger K. Blashfield, Cluster Analysis, Quantitative Applications inthe Social Sciences, No. 07-044 (Beverly Hills, Calif.: Sage, 1984).
32. Alan H. Fielding, Cluster Analysis: What Is It? Department of Biological Sciences, ManchesterMetropolitan University, 2002 [cited 25 Feb. 2002]. Available from http://

Patterns in Electronic Journal Usage 497
obelia.jde.aca.mmu.ac.uk/multivar/ca.htm.33. William E. McGrath, “Circulation Clusters: An Empirical Approach to Decentralization of
Academic Libraries,” Journal of Academic Librarianship 12 (Sept. 1986): 221–26.34. Other, for lack of a more precise label, is a very diverse group. It is composed of institu-
tions of different sizes, missions, and locations. The only similarity that defines this group is thetotal use of the IDEAL package. Readers are encouraged to explain the similarities within thisgroup based on other defining variables.
35. Carol Tenopir and Donald King, “Readership of Scientific Scholarly Journals,” in TowardElectronic Journals: Realities for Scientists, Librarians, and Publishers (Washington, D.C.: Special Li-braries Association, 2000).
36. Sally A. Rogers, “Electronic Journal Usage at Ohio State University,” College & ResearchLibraries 62 (Jan. 2001): 25–34.
37. Davis, “The Effect of the Web on Undergraduate Citation Behavior: A 2000 Update,” Col-lege & Research Libraries 63 (Jan. 2002): 53–60.
38. Philip M. Davis and Suzanne A. Cohen, “The Effect of the Web on Undergraduate Cita-tion Behavior, 1996–1999,” Journal of the American Society for Information Science and Technology 52(Feb. 2001): 309–14.
39. Joann E. D’Esposito and Rachel M. Gardner, “University Students’ Perceptions of theInternet: An Exploratory Study,” Journal of Academic Librarianship 25 (Nov. 1999): 456–61.
40. Susan Davis Herring, “Faculty Acceptance of the World Wide Web for Student Research,”College & Research Libraries 62 (May 2001): 251–58.
41. Deborah J. Grimes and Carl H. Boening, “Worries with the Web: A Look at Student Use ofWeb Resources,” College & Research Libraries 62 (Jan. 2001): 11–23.
42. Kari Boyd McBride and Ruth Dickstein, “The Web Demands Critical Reading by Stu-dents,” Chronicle of Higher Education 44 (Mar. 20, 1998): B6.
43. Vicki Tolar Burton and Scott A. Chadwick, “Investigating the Practices of Student Re-searchers: Patterns of Use and Criteria for Use of Internet and Library Sources,” Computers andComposition 17 (2000): 309–28.
44. Bernie Sloan, “Understanding the Consortia Better: What Vendors Can Learn,” LibraryJournal 125 (Mar. 15, 2000): 57–58.
45. Peters, “Agile Innovation Clubs.”