patrick-fournier.compatrick-fournier.com/d/cours3d-6607.pdf · culture and conformity 119 table 2...
TRANSCRIPT


Psychological Bulletin ~ t 1996 by the American Psychological Association, Inc. 1996. Vol. 119, No. I, 111-137 0033-2909/96/$3.00
Culture and Conformity: A Meta-Analysis of Studies Using Asch's ( 1952b, 1956) Line Judgment Task
R o d B o n d a n d Pe t e r B. S m i t h University of Sussex
A meta-analysis of conformity studies using an Asch-type line judgment task (1952b, 1956) was conducted to investigate whether the level of conformity has changed over time and whether it is related crogs-culturally to individualism-collectivism. The fiterature search produced 133 studies drawn from 17 countries. An analysis of U.S. studies found that conformity has declined since the 1950s. Results from 3 surveys were used to assess a country's individualism-collectivism, and for each survey the measures were found to be significantly related to conformity. Collectivist countries tended to show higher levels of conformity than individualist countries. Conformity research must attend more to cultural variables and to their role in the processes involved in social influence.
The view has long been held that conformity is to some extent a product of cultural conditions, and it is a stable feature of popular stereotypes that some national groups are conforming and submissive, whereas others are independent and self-asser- tive (e.g., Peabody, 1985 ). Likewise, the extent to which dissi- dence is tolerated in a society will vary at different points in its history, and several commentators have suggested that the relatively high levels of conformity found in experiments con- ducted in the early 1950s (notably Asch, 1952b, 1956) was in part a product of the McCarthy era (e.g., Larsen, 1974; Mann, 1980; Perrin & Spencer, 1981 ).
Although Asch's ( 1952b, 1956) seminal research is often in- terpreted as demonstrating that conformity is fundamental to group processes (Friend, Rafferty, & Bramel, 1990), Asch was as much concerned with those factors that enabled individuals to resist group pressure, factors which he saw as rooted in a society's values and socialization practices.
That we have found the tendency to conformity in our society so strong that reasonably intelligent and well-meaning young people are willing to call White Black is a matter of concern. It raises ques- tions about our ways of education and about the values that guide our conduct. (Asch, 1955, p. 34)
He felt that conformity can "pollute" the social process and that it is important for a society to foster values of independence in its citizens.
The cultural conditions underpinning conformity have, then, been a long-standing concern and are important for theories of social influence. Yet, as Moscovici (1985) noted, cultural as-
Rod Bond and Peter B. Smith, School of Social Sciences, University of Sussex, East Sussex, England.
We thank Shalom Schwartz for helpful comments on this article. Correspondence concerning this article should be addressed to Rod
Bond, School of Social Sciences, Arts Building, University of Sussex, Falmer, Brighton, East Sussex, BNI 9QN England. Electronic mail may be sent via Internet to [email protected].
pects of conformity have been relatively neglected, and only two previous reviews (Fumham, 1984; Mann, 1988 ) have been spe- cifically devoted to them. These issues have been addressed from two perspectives: cross-cultural and historical. Cross-cul- tural studies are typically cross-national comparisons, although studies that have compared different cultural groups within a society can also be included in this category. The historical per- spective is represented by the literature concerned with whether conformity has changed over time in the West, particmarly in the United States. This article shows that consistent findings have not emerged from these two bodies of literature but that the methodological basis of most studies is seriously flawed and that little attention has been paid to the cultural variables that mediate conformity. We see the construct of individualism-col- lectivism (Triandis, 1990) as potentially of value in this regard, and" we see meta-analysis as a way of overcoming many of the methodological problems. The body of this article is devoted to a meta-analysis of Asch-type conformity studies where the relationship between conformity and measures of individual- ism-collectivism is explored. We conclude by discussing the de- grce to which studies using the Asch ( 1952b, 1956) paradigm can encompass the meaning of conformity within different cultures.
Review o f Studies on Cul ture and Confo rmi ty
Comparisons Across Cultures Cross-cultural studies of conformity can be divided into three
types: (a) comparisons of subsistence economies, (b) compari- sons of developed economies, and (c) comparisons of cultural groups within a society. Comparisons of subsistence economies are almost entirely due to Berry (1967, 1974, 1979; Berry & Annis, 1974), who has proposed a link between the mode of subsistence and a society's values and social behavior. He builds on work by Barry, Child, and Bacon (1959), who found that the socialization practices of high food-accumulating societies (pastoral or agricultural peoples) emphasized obedience and responsibility, whereas those of low food-accumulating societies
111
112 BOND AND SMITH
(hunting and fishing peoples) emphasized independence, self- reliance, and individual achievement. They argued that this difference resulted from the different needs of these two types of economy: High food-accumulating societies need individuals who are conscientious and compliant, whereas low food-accu- mulating societies need individuals who are individualistic and assertive. Berry (1967) argued that these differences should also be reflected in conformity behavior and, consistent with this hypothesis, he found higher rates of conformity among the Temne of Sierra Leone, a high food-accumulating society with strict disciplinarian socialization practices, compared with the Eskimo of Baflin Island, a low food-accumulating society whose socialization practices are lenient and encourage individualism. His subsequent research in Australia and New Guinea (Berry, 1974) and among North American Indians (Berry & Annis, 1974) obtained weaker support for the theory (see also Berry, 1979), although additional support comes from Munroe, Munroe, and Daniels (1973) who compared three Kenyan samples.
Whereas Berry's ( 1967, 1974, 1979) theory suggests a link between cultural values and conformity, its scope is limited to subsistence economies whose culture is relatively free from out- side influence. When he compared "traditional" samples with samples having greater exposure to Western society (i.e., with experience of European education, urbanization, and wage employment), there were indications that exposure tl~ Western values leads to a weakening of traditional norms and to less cross-cultural variation in conformity (Berry, 1979).
Among developed economies, several studies report cross- cultural differences that had been anticipated from the relative value attached to conformity in the societies concerned. Mil- gram ( 1961 ) found that Norwegian students conformed more than French students; replications of the Asch ( 1952b, 1956) experiment in Zimbabwe (Whittaker & Meade, 1967), in Ghana (McKissack, 1971 ), and in Fiji (Chandra, 1973) found higher levels of conformity compared with Asch; a replication in Germany (Timaeus, 1968) found a lower level of conformity. There is evidence for greater conformity among the Chinese (Huang & Harris, 1973; Meade & Barnard, 1973)and among Brazilians (Sistrunk & Clement, 1970; Sistrunk, Clement, & Guenther, 1971 ) when compared with Americans.
Anticipated differences, however, have not always emerged. Whittaker and Meade ( 1967 ) found that the level of conformity among samples from Brazil, Lebanon, and Hong Kong Chinese were all comparable with Asch (1952b). Claeys (1967) found that conformity among a sample of students in Zaire was no higher than a comparable U.S. study, despite the high value placed on conformity to group norms in that society. Some au- thors have remarked on the replicability and cross-cultural sta- bility of the Asch ( 1952b, 1956) experiment: For example, rep- lications in Kuwait (Amir, 1984), Brazil (Rodrigues, 1982), France (Askevis-Leherpeux & Zaleska, 1975; Avramov-Kiwetz & Gaffl~, 1974), and Portugal (Neto, 1995) have all produced results similar to Asch.
Studies conducted in Japan have been inconclusive. Frager (1970) replicated Deutsch and Gerard's ( 1955 ) study with Jap- anese students and found a lower level of conformity compared with the U.S. results and some evidence for anticonformity.
This may have been because the majority were strangers--- Wil- liams and Sogon (1984) found a much higher level of confor- mity when the majority were friends than when they were strangers. Matsuda (1985), however, did not find expected differences in conformity when three types of relation between the individual and majority were compared.
Few studies have compared cultural groups within a society. There is a small and inconsistent literature concerning differ- ences between Blacks and Whites in the United States. Iscoe, Williams, and Harvey (1964) found less conformity among Black women compared with White women, there being little difference among men, and yet both Sistrunk ( 1971 ) and Long (1970) found that Blacks conformed more than Whites. Schneider (1970) found no overall difference, although Whites were more influenced by a White majority than a Black major- ity, whereas the ethnic composition of the majority had little effect for Blacks.
There remain a few isolated findings. Boldt (1976) compared two North American Anabaptist groups: one group practices communal living and the other does not. He had expected the former to show higher conformity, but no significant difference was found. An earlier American study (Becker & Carroll, 1962 ) found that Puerto Rican boys conformed more than Whites. In Britain, Perrin and Spencer ( 1981 ) found much higher confor- mity among unemployed West Indians compared with White students. Chandra (1973) found Fijian Indians conformed more than native Fijians.
Comparisons Within a Culture at Different Periods in Its History
A second line of evidence for the cultural roots of conformity comes from the observation that replications of conformity ex- periments within a society produce different results at different points in time. Larsen has conducted three replications of the Asch (1956) experiment (Larsen, 1974, 1990; Larsen, Triplett, Brant, & Langenberg, 1979) and has interpreted the fluctuating levels of conformity as reflecting sociopolitical changes in American society. Thus, the lower level found in 1974 (among men) compared with Asch was attributed to the more question- ing attitude of students of the Vietnam era, whereas the higher level found in 1979 reflected the decline in student activism and a stronger career orientation (see also Larsen, 1982). In 1988, conformity had declined again somewhat, and this was seen as possibly reflecting the increase in protest activities.
In a similar vein, Perrin and Spencer ( 1981 ) argued that there was a greater emphasis on individuality and questioning the sta- tus quo in unive~ities in the 1980s compared with when Asch conducted his research in the 1950s, and this change explained why they were not able to replicate the Asch (1956) experiment using British students. They felt that Asch's study was a "child of its time" (Perrin & Spencer, 1980, p. 405) and not a "rock- bottom" (p. 406 ) replicable phenomenon. Nicholson, Cole, and Rocklin (1985) also replicated Asch's experiment with British students.and found some evidence for conformity, albeit at a low level, and explained the difference between their results and those of Perrin and Spencer as possibly because of increased cohesiveness in Britain arising from the Falklands war. They
CULTURE AND CONFORMITY 113
found a somewhat higher level of conformity in a U.S. sample, although the difference was not statistically significant. More recently, Lalancette and Standing (1990) did not obtain any conformity in a variant of the Asch paradigm with Canadian students.
In contrast to these studies, other recent studies of university students conducted in Britain (Abrams, Wetherell, Cochrane, Hogg, & Turne~ 1990; Vine, 1981 ), in Belgium (Doms & van Avermaet, 1981, 1985), in Holland (Vlaander & van Rooijen, 1985 ), and in Portugal (Nero, 1995 ) have all found reasonably high levels of conformity, comparable to Asch ( 1952b, 1956),
Finally, Lamb and Alsifaki (1980) argued that levels of con- formity have been steadily on the increase, drawing on Ries- man, Glazer, and Denney's (1950) hypothesis that modem in- dustrial societies are characterized by increasing numbers of "other-directed" types more easily influenced by peer pressure. They found a higher level of conformity than Asch ( 1952b, 1956) and Larsen (1974).
Summary and Implications On the face of it, then, the research literature does not pro-
vide clear evidence of a systematic relationship between cul- tural conditions and conformity. Authors have variously re- ported relationships across cultures in the expected direction, in the opposite direction to what has been expected, or have remarked on the consistency of the effect across cultures. Like- wi~¢, some have found that the level of conformitY varies across time, whereas others have been impressed by its stability.
There are several likely reasons for this inconsistency. Some investigators have researched cross-cultural differences by con- ducting studies themselves in different cultures and have thereby exercised control over the procedure and sampling to eliminate as far as possible potential sources of confounding (Berry, 1979; Whittaker & Meade, 1967). Typically, however, investigators have compared their results with one of the classic studies to draw conclusions concerning cross-cultural differ- ences. Such comparisons are always hazardous, and in some cases investigators have overlooked potentially important differences: for example, the use of a Crutchfield (1955) appa- ratus rather than confederates in a face-to-face situation (Frage~ 1970), differences in the size of the majority (Larsen et al., 1979; Williams & Sogon, 1984), differences in the stimuli (Claeys, 1967; Matsuda, 1985), differences in the response made by the majority (Claeys, 1967; Matsuda, 1985), differ- ences in the gender of the participant (Larsen et al., 1979; Mat- suda, 1985), and differences in the relationship of the majority to the participant (Chandra, 1973).
There is frequently little appreciation of sampling variability, and statistical tests are often not performed or are inappropriate (e.g., Chandra, 1973; Whittaker & Meade, 1967), despite the fact that most investigators, including Asch (1952b, 1956), have remarked on significant individual differences. For exam- ple, the width of the 95% confidence interval (CI) for the error in Asch (1952b) is +10% so it would not be surprising to find that degree of variability in the results of an exact replication.
The focus on classic studies for comparison ignores other rel- evant evidence. Asch's ( 1952b, 1956) experiments have been
frequently replicated in the United States (as the reported liter- ature search reveals), and these findings should be taken into consideration.
Perhaps the most important criticism of much of this re- search is that explanations for cross-cultural differences are fre- quently post hoc, and there is no direct assessment of any in- tervening variables that are presumed to mediate the level of conformity. So, for example, it is largely a matter of speculation whether differences in conformity are due to an increase in the number of other-directed types (Lamb & Alsifaki, 1980), social values giving priority to group preferences (Chandra, 1973), reaction against conformity pressures of society (Frager, 1970), an ethos encouraging questioning of the status quo and rea- soned individuality (Perrin & Spencer, 1981 ), or increased co- hesiveness (Nicholson, Cole, & Rocklin, 1985 ). There is in gen- eral within this literature a lack of theoretical analysis of the process underlying conformity behavior and the relevance of cultural conditions to that process.
A meta-analysis of conformity studies can address many of these problems. First, the level of conformity within a culture can be estimated from all relevant studies. Second, the impact of various potential moderator variables (e.g., size of the major- ity and nature of the stimuli) can be assessed and controlled. Third, the use of appropriate statistical methods (Hedges & O1- kin, 1985) permits estimation of the relevant population pa- rameters. Fourth, an important goal of this study has been to relate levels of conformity to measures of cultural values which theory suggests might also mediate responses to group pressure.
Individualism-Collectivism
Moscovici (1980) has argued that when majorities exert so- cial influence, they produce compliance. That is, individuals will publicly accept the majority view while privately retaining their initial view, motivated by a desire not to appear deviant or to risk possible negative sanctions from the majority, such as ostracism or ridicule (cf. the process of normative influence de- scribed by Deutsch & Gerard, 1955). There is a good dead of support for this view (e.g., Turner, 1991 ), at least as an account of the process in Asch-type studies, where group pressure is ex- erted on judgments of otherwise relatively unambiguous stim- uli. If we look for cross-cultural variations in conformity behav- ior in this type of situation, then we should look to the value placed in different societies on the group as compared with the individual. This seems to be best reflected in the concept of in- dividualism-collectivism, which numerous authors have found useful in describing cultural differences (Kagitcibasi & Berry, 1989; Kim, Triandis, Kagitcibasi, Choi, & Yoon, 1994; Tri- andis, 1990). Triandis has summarized what he sees as the es- sence of the concept of individualism-collectivism:
In individualist cultures, most people's social behavior is largely determined by personal goals that overlap only slightly with the goals of collectives such as the family, the work group, the tribe, political allies, co-religionists, fellow countrymen and the state. When a conflict arises between personal and group goals, it is con- sidered acceptable for the individual to place personal goals ahead of collective goals. By contrast, in collectivist cultures social behav- ior is determined largely by goals shared with some collective, and
114 BOND AND SMITH
if there is a conflict between personal and collective goals, it is con- sidered socially desirable to place collective goals ahead of personal goals (Triandis, 1990, p. 42).
Individuals from collectivist cultures, then, should be more likely to yield to the majority, given the higher value placed on harmony in person-to-group relations.
In recent years, three multinational surveys have sought to elucidate the significant value dimensions on which cultures vary (Hofstede, 1980, 1983, 1991; Schwartz, 1992, 1994; Trompenaars, 1993); each has identified a dimension closely related to individualism-collectivism, and these provide quan- titative indices that can be related to conformity behavior.
Hofstede (1980) analyzed data from attitude surveys con- ducted in the subsidiaries of a large multinational U.S. corpora- tion. Employees were surveyed twice, first in 1967-1969 and again in 1971-1973, resulting in a data bank of 117,000 ques- tionnaires from 88,000 respondents in 67 countries. In more recent analyses of the dimensions of culture, Hofstede ( 1991 ) used data from 50 countries and three regions within which there were a sufficient number of respondents from a range of occupational categories.
Hofstede (1980) identified four dimensions of national cul- ture of which Individualism-Collectivism is the one relevant to our concern with conformity. Hofstede concluded that in indi- vidualistic cultures, the self is conceived as separate from soci- ety and identity is determined by individual achievement; whereas in collectivist cultures, self and identity are conceived in terms of group membership and the position of the group in society. In collectivist cultures, there is a belief in group deci- sions rather than individual decisions and an emotional depen- dence on organizations and institutions.
Schwartz ( 1992, 1994) surveyed values in 86 samples drawn from 41 cultural groups in 38 countries. In most countries, two occupational groups were sampled: teachers and students. Re- spondents were asked to indicate the importance of 56 values selected to represent 11 potentially universal types. Schwartz conducted both individual-level analyses, in which the data from each country arc analyzed separately (Schwartz, 1992) and, in the same way as Hofstede (1980), culture-level analyses on country means (Schwartz, 1994).
Several of the dimensions emerging from Schwartz's (1994) analysis are conceptually close to the concepts of individualism and collectivism. Conservatism includes values primarily con- cerned with conformity, security, and tradition. Those who strongly endorse this dimension emphasize the maintenance of the status quo, propriety, and the avoidance of actions that might disturb the traditional order. Opposed to conservatism were individualistic value types, which were found to cluster into two subtypes: Affective Autonomy, which emphasizes he- donism and stimulation (e.g., exciting life and pleasure), and Intellectual Autonomy, which emphasizes self-direction (e.g., creativity and curiosity).
Schwartz (1994) was able to compare his dimensions with those obtained by Hofstede (1980) through an analysis of the 23 countries common to both samples. As expected, Hofstede's dimension of individualism was correlated positively with
Affective Autonomy and with Intellectual Autonomy, and it was correlated negatively with conservatism.
A third questionnaire survey had been conducted by Trom- penaars (1993) whose interest, like that of Hofstede (1980), is in business organizations and whose sample was obtained from employees of 30 multinational corporations spanning 50 coun- tries. His sample size numbers some 15,000, of whom 75% were managers and 25% general administrative staff (such as typists and secretaries). Scales measuring five dimensions of national culture were constructed and one of these, consisting of six items, was Individualism-Collectivism, which contrasted indi- vidual freedom and individual development with caring for oth- ers. Another six-item scale, also used in the present analysis, was Achievement-Ascription, which assessed whether the indi- vidual believed that status should be accorded on the basis of individual achievement or ascribed on the basis of existing hierarchies.
Moderator Variables
Our initial review of the literature indicated that the over- whelming proportion of relevant studies conducted outside the United States, and especially in non-Western countries, were based on Asch's ( 1952b, 1956) classic studies. For this reason, we decided to restrict the meta-analysis to "Asch-type" studies, thereby limiting the number of potential moderator variables to a much greater extent than is usually possible in meta-analytic reviews. We included only studies which used Asch's line judg- ment task, in which participants are asked to name which of three comparison lines is the same length as a standard. We also restricted the sample to group pressure experiments in which the participant responds as a member of a group who are all physically present and receives feedback supposedly of the re- sponses of the other group members. We excluded "fictitious group norm" studies (e.g., Berry, 1967; Mugny, 1984, 1985), in which participants are given information supposedly of other group members who had previously completed the task but are not now present. Given these restrictions (additional criteria for the inclusion of a study are described in Method), the following potential moderator variables were examined, in addition to the measures of individualism-collectivism and the date of publication.
Type of Group Pressure Paradigm Of group pressure experiments, we included both those using
an Asch (1952b, 1956) paradigm, where participants are in face-to-face interaction with a majority who are confederates of the experimenter, and those using a Crutchfield (1955) para- digm, where groups of participants are placed in individual booths and are given false feedback of the responses ofthe other group members. There is evidence that the level of conformity is higher in face-to-face than in simulated groups (Dcutsch & Gerard, 1955; Levy, 1960).
Size of Majority Asch ( 1951 ) found that there was very tittle conformity when
the majority consisted of one or two individuals, but there was
CULTURE AND CONFORMITY 115
a dramatic increase when the majority numbered three. Further increases in majority size above three did not result in increas- ing amounts of conformity. Asch believed that it was the per- ception of group consensus that results in conformity and that a majority of three is sufficient for this perception to arise; any increase in majority size above three would not be expected to have an impact. This conclusion, however, has been challenged by Latan~ and Wolf (1981) and Tanford and Penrod (1984). Latan~ and Wolf found that the data from Gerard, Wilhelmy, and Conolley (1968) conformed to a negatively accelerating power function based on Latan6's ( 1981 ) social impact theory. Tanford and Penrod, in a meta-analysis of a sample of confor- mity studies, analyzed the relationship between majority size and conformity by comparing a simple linear model, Latan6 and Wolf's social impact function, and an S-shaped growth function derived from their social influence model (SIM). They found that the SIM function provided the best fit to the data and was also preferred to the social impact model on theoretical grounds. For these reasons, we have used the SIM function to model the effect of majority size in our meta-analysis.
Relation of the Participant to the Majority
Allen (1965) argued that the greater the similarity between the individual and the majority, the more likely the majority will be perceived as an appropriate reference group and hence, the greater the level of conformity. Similarly, Turner ( 1991 ) has argued that conformity will be higher when the majority is cat- egorized as an in-group rather than an out-group, and several studies support these predictions (e.g., Abrams et al., 1990; Ge- rard, 1953; Linde & Patterson, 1964). The vast majority of group pressure studies use students as both participants and majority group members, and therefore a high degree of sim- ilarity is typically present (Allen & Wilder, 1977 ). However, in some studies the majority are strangers, in others they are ac- quaintances and friends, and in a few they are explicitly identi- fied as either in-group or out-group members; these variations. may be expected to have an effect on the level of conformity.
Anonymity of Response
In some of the studies that we included (Abrams et al., 1990; Gerard et al., 1968; Schulman, 1967) participants believed their responses would be known only to the experimenter. Be- cause conformity in Asch-type experiments is mainly compli- ance (Turner, 1991 ), we would expect the level of conformity to be higher when the participant believes that his or her response will be available to the majority (Allen, 1965 ).
Stimulus Materials
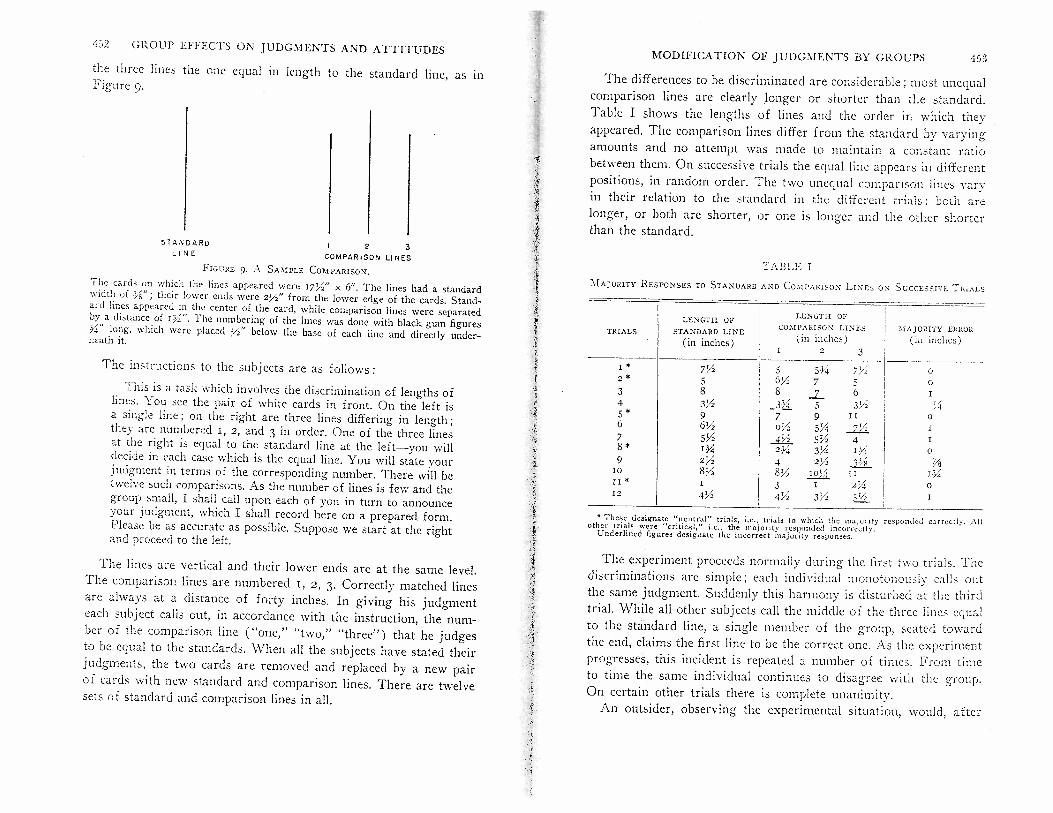
There were two phases to Asch's research on conformity. The first phase was reported in his Social Psychology (Asch, 1952b) textbook and, for all the studies reported there, the line judg- ment task involved 12 trials, each having a different length of standard line (ranging from 1 in. [ 2.54 cm] to 9 in. [ 22.86 cm] ) and a different set of comparison lines. On 5 of the 12 trials, the majority gave the correct response; the remaining 7 were the
critical trials on which the majority gave the incorrect answer. The magnitude of the error made by the majority ranged from 0.25 in. (0.64 cm) to 1.75 in. (4.45 cm).
In the second phase of his research, initial results of which were published in Asch (1951) and the full program in his monograph (Asch, 1956), Asch changed the stimulus materi- als. The new set consisted of nine stimuli shown twice, to enable comparison between the first and second half of the series, and systematic variation of extreme and moderate errors. The re- suiting materials consisted of 18 trials, of which 12 were critical. The length of the standard ranged from 2 in. (5.08 cm) to 10 in. (25.40 cm), the magnitude of error from 0.75 in. ( 1.91 cm) to 1.75 in. (4.45 cm).
Whereas most replications of Asch have used the 1956 mate- rials, a significant number have used the 1952b materials. Moreover, we have included some studies that have made minor modifications to Asch's stimuli and some that have used their own stimulus materials.
Two characteristics of these stimulus materials have been coded as potential moderator variables. The first is the ratio of the number of critical trials to the total number of trials, re- flecting the consistency of the majority response. Tanford and Penrod (1984), following Moscovici ( 1976, 1980), found some evidence that the higher the proportion of deviant responses by the majority, the higher the level of conformity, and they in- cluded this variable in their meta-analysis. The second variable is the magnitude of the error made on average by the majority, reflecting the ambiguity of the stimulus. Asch (1956) found that the greater the magnitude of the error, the less conformity.
Gender of Participants The question of gender differences in influenceability has
been extensively researched and subjected to a number of re- views (Cooper, 1979; Eagly, 1978; Eagly & Carli, 1981 ). As far as conformity in group pressure experiments is concerned, the conclusion from these reviews has been that women show some- what higher levels of conformity than men. Consequently, we have included the proportion of women as a moderator variable.
The purpose of the present investigation, then, is to conduct a meta-analysis of conformity studies to determine whether lev- els of conformity are related to these dimensions of cultural values that are related to individualism-collectivism, after con- trolling for relevant moderator variables.
Method
Literature Search We conducted computer searches using the keywords conformity and
group influence of the PsycLIT database to cover the period January 1974-March 1994, of the PsyclNFO database to cover the period 1967- 1973, and of Dissertation Abstracts Online to cover January 1952- March 1994 (but restricted to either psychology or sociology dissertations). We consulted Psychological Abstracts using the same
' The function used was I = exp(--4exp[--NlTS]), where I is the level of conformity and N is the majority size (Tanford & Penrod, 1984, p. 198).
1 16 BOND AND SMITH
keywords to cover the period 1952-1966. In addition, we consulted the reference lists of major reviews of the conformity literature (Allen, 1965, 1975; Furnham, 1984; Mann, 1980; Moscovici, 1985; Weisenthal et al., 1978), of previous meta-analyses (Cooper, 1979; Eagly & Carli, 1981; Tanford & Penrod, 1984), and of all studies located.
We sought replications of the Asch (1952b, 1956) experiment but included experiments that had used a Crutehfield (1955) apparatus. Accordingly, the criteria for inclusion were that (a) the task involved judging which of three comparison lines was the same length as a stan- dard, (b) the experiment used a group pressure paradigm in which the participant is confronted with the erroneous responses of a majority who are also present, (c) the participant is alone against a unanimous majority, (d) the majority consists of at least two individuals, (e) the participants are adults (i.e., at least 17 years of age), and (f) the partic- ipants are not suffering any form of psychopathology or severe learning disability. We included studies, and different experimental conditions of studies, that varied in terms of the moderator variables of interest: that is, majority size, relation of the participant to the majority group, whether a participant's response would be known to the majority, the gender of the participant, and stimulus materials that varied in terms of the consistency of the deviant response by the majority and in terms of the average magnitude of error. We, however, excluded studies (or experimental conditions of studies) that introduced other potential moderator variables: for example, asking the participant to first write down his or her answer (Deutsch & Gerard, 1955 ), offering a reward to the group that is most accurate (Deutsch & Gerard, 1955; Frager, 1970; Gorfein, Kindrick, Leland, McAvoy, & Barrows, 1960; Hornik, 1974), removing the stimuli before eliciting the responses (Deutsch & Gerard, 1955), showing either a violent or peaceful film before the judgment task (Hatcher, 1982), or varying the instructions and using a different task first (Wagner & Shaw, 1973). We included two of Asch's (1956) experiments that introduced minor changes to the standard procedure which he found had no significant effect: changing the thickness of the stimulus lines (Asch, 1956, Experiment 3 ) and adding a warning that the correct lines would be identified at the end of the series (Asch, 1956, Experiment 9). In some studies, overall results were taken across con- ditions where there were negligible differences (Cohen & Lee, 1975; Conger, 1973; Critchlow, Herrup, & Dabbs, 1968; Frager, 1970; Gerard & Rotter, 1961; Long, 1967; Schuman, 1970; Toder & Marcia, 1973).2 We included the studies by Berkhouse (1965) and Long ( 1967, 1970, 1972) where control data was obtained by first getting participants to complete the line judgment task in the absence of group pressure. Where participants were divided on the basis of an individual difference variable, the combined result across groups was used (Avramov-Kiwetz & Gaflit, 1974; Brassard, 1986; Costanzo, 1970; Moeller & Applezweig, 1957; Nikols, 1965; Ryan, 1983; Stamps & Teevan, 1974; Toder & Mar- cia, 1973). Details of two studies by Sako (as cited in Matsuda, 1985, and Williams & Sngon, 1984, respectively) were obtained from second- ary sources because the primary sources could not be obtained. Nine studies that met the criteria for inclusion could not be used because necessary details of the results were not reported (Green, 1967; Gruen, 1961; Hunt, Goldberg, Meadow, & Cohen, 1958; R. W. Johnson & Mac- Donnell, 1974; Maloff & Lott, 1962; Mertesdorf, Lueck, & Timaeus, 1969; Phelps & Meyer, 1966; Shames, 1981; Whitman, 1961 ).
Where a study had manipulated a variable that is used here as a mod- erator variable, the different experimental conditions were entered sep- arately, so its effects could be estimated and controlled for. This oc- curred for manipulations of(a) majority size (three studies, e.g., Ge- rard et al., 1968), (b) group pressure paradigm (Deutsch & Gerard, 1955 ), ( e ) relation o f the participant to the majority ( six studies, e.g., Linde & Patterson, 1964), and (d) availability of response to the major- ity (two studies, e.g., Sehulman, 1967). Likewise, results for men were represented separately than results for women where possible: If the
study used both men and women but the report did not allow the results to be disaggregated, the percentage of women was recorded to be used as a moderator variable. Several authors reported replications for different samples, either from the same country (Aseh, 1952b, 1956; Chandra, 1973; Donas & van Avermaet, 1985; Perrin & SpenceI; 1981; Rodrigues, 1982) or from different countries (Nicholson et al., 1985; Whittaker & Meade, 1967). For these studies, each sample was entered separately in Our analyses.
The inclusion of several results for a ~ingle study, eithcx reflecting different expel-neural conditions or different samples, would have created noninde- pendence in the data to varying degree~ Whexeas indepentmce is assumed in the analysis (Hedges & Olkin, 1985 ), the use of several ~set~tions from the same study could not be avoided if the effect of m ~ variables was to be estimated and systematic cross-cultural variation was to be assessed. Hedges (1986) has argued that multiple effect sizes do not markedly affect the precision of the analysis, and Dindia and Allen ( 1992 ) argaed tbat non- independence need not necessarily be avoided.
In total, 68 reports concerning 133 separate experiments and a total of 4,627 participants were used in this ~ For ease of exposition, we refer to these as studies in the ren~md~ of this article. ARhongh 97 of these ~ere conducted in the United States, altogether studies drawn from 17 different countries were found.
Coding o f Variables For each experiment, the following information was coded: (a) the
country in which the experiment was conducted; (b) the year in which the study was conducted (where this was not given, it was taken as 2 years before the publication date in the case of articles and I year before the date of submission in the case of doctoral dissertations); (c) the type of experimental paradigm (Asch-type, i.e., face-to-face using confeder- ates; or Crutchfield-type, i.e., individual booths with false feedback of other group members' responses); (d) majority size; 3 (e) the relation
2 Gerard and Rotter ( 1961 ) used a 2 ! 2 design manipulating whether the participant believed that he or she would complete a further task with the group in the future and whether that task would be of the same or different type. Long (1967) varied whether the confederates were of superior or subordinate rank with one group of participants and whether they were peers or of superior rank with another group. Schu- man (1970) represented the confederates as either patients, technicians, or physicians to participants who were either patients or technicians. Critclilow, Herrup, and Dabbs (1968) varied the style of dress of the experimenter. Conger (1973) compared three conformity paradigms in a within-subjects design in a counterbalanced order. Frager (1970) var- ied the distance between the standard and comparison lines. Toder and Marcia (1973) varied whether the confederates wexe dressed as "hippy" or "straight." Cohen and Lee (1975) gave false feedback on a prior task, so the participant either succeeded or failed and the confederates either succeeded or failed.
3 In some of Asch's experiments, it is apparent that the size of the majority varied from trial to trial, and his reporting is at times inconsis- tent. For example, Asch ( 1951 ) described the group as consisting of 8 individuals, one of whom is the unknowing participant, yet later in the article he tabulates the results under a majority size of 8. Asch ( 1952b, 1955 ) described the groups as consisting of between 7 and 9 individuals, including the unknowing participant. Asch (1956) described the ma- jority as consisting of between 7 and 9 individuals, although "in a few instances the majority had only five or six members" (p. 5). We have taken the majority size in his basic experiments to be 8. Asch ( 1951 ) reported results for varying sizes of majority, the largest being 16. How- ever, when this article was reprinted in a book of readings (Asch, 1952a), Asch changed the relevant table and made appropriate changes in the text, so the largest majority size was 10-15 rather than 16.
CULTURE AND CONFORMITY 117
of the majority to the participant (acquaintances, strangers, out-group members, and both in-group and out-group members ); (f) whether the participant's response was available to the majority; (g) the stimulus materials (Asch, 1952b, with or without minor modification; Aseh, 1956, with or without minor modification; or unique ones); (h) the total number of trials; (i) consistency, the ratio of critical trials to the total; (j) stimulus ambiguity, the average error in inches (centimeters); (k) the percentage of female respondents; and (1) the participant population.
Studies were coded by the two authors independently. Because the task involved only correctly recording details of the studies, rather than judgment, the few disagreements were errors resolved by checking the original source.
Computation and Analysis of Effect Sizes Hedges and Olkin (1985) have advocated the use of g, the difference
between the means of the experimental and control groups divided by the pooled within-group standard deviation (SD), as a measure of effect size. Such a measure assumes homogeneity of error variance (i.e., the population variance for the experimental group equals that of the con- trol group), and this justifies the use of a pooled within-group SD. In Aseh-type conformity experiments, the assumption of homogeneity of error variance is not justified. It is a characteristic of the paradigm that the line judgment task is unambiguous, and this is demonstrated by controls making virtually no errors. Hence the results fo r control groups typically have near zero means and variances. However, there are typi- cally significant individual differences in response in the experimental group, resulting in nonzero variance. For this reason, our measure of effect size used the SD of the experimental group as the divisor. 4 The numerator was the difference between the experimental and control group means. Even though the control group mean was typically near zero, it was appreciably higher in two studies (Claeys, 1967; Seaborne, 1962), and therefore it was desirable to take it into account. 5 For one study (Timaeus, 1968), the estimate of effect size was derived from the p value associated with a nonparametric test ( Holmes, 1984).
Because our measure of effect size used only the SD from the experi- mental'group, rather than a pooled estimate, some modifications were needed to the formulas recommended by Hedges and Olkin ( 1985 ) for fitting general linear models to effect sizes. Effect sizes are treated as noncentral t variates based on f degrees of freedom (df), and for our measure the df is ne - 1 rather than n. + n~ - 2 assumed in Hedges and Olkin's treatment (where r~ equals the number in the experimental group and n, equals the number in the control group). This required modification to two of the formulas recommended by Hedges and Ol- kin; the modifications were readily derived from the general properties of the noneentral t distribution (N. L. Johnson & Welch, 1940; Owen, 1968). First, the expected value of an effect size is a biased estimate of the relevant population parameter, and this bias can be significant especially when df are small. We have followed Hedges and Olkin in converting the effect size (g) into an unbiased estimate (d), but we have ensured that the formula used for correcting the bias is based on the appropriate df. 6 Second, the evaluation of the effect of moderator vari- ables on effect sizes was accomplished by deriving weighted least squares estimates of regression coefficients, where each effect size is weighted by
Presumably, it had proved impossible to assemble 16 confederates, al- though that was the number originally intended, and the number that could be assembled varied from trial to trial. We took the number as 13. Some subsequent reports and secondary analyses of Asch's data have not noticed this change (e.g., Latan6 & Wolf, 1981; Tanford & Penrod, 1984).
the reciprocal of its variance (Hedges & Olkin, 1985, pp. 173-174). We ensured that the formula for the variance of the effect size was based on the appropriate number of dr.7
The sum of squares error statistic from the weighted least squares regression, Q~, has an approximate chi-square distribution with k - p - 1 df, where k is the number of effect sizes and p is the number of predictor variables, and provides a test of model specification. If the hypothesis of correct model specification is rejected (i.e., Q, exceeds its critical value), then the results must be treated with caution.
Where homogeneity was not obtained, we identified outliers from standardized residuals and then sequentially eliminated outliers until homogeneity was obtained. The proportion of studies that need to be removed to attain homogeneity is an indication of the extent to which heterogeneity is a result of the presence of a few aberrant values (Eagly, Makhijani, & Klonsky, 1992; Hedges, 1987). Also, studies thus identi- fied as outliers can be inspected for any peculiar characteristics.
R e s u l t s
Study Character&tics
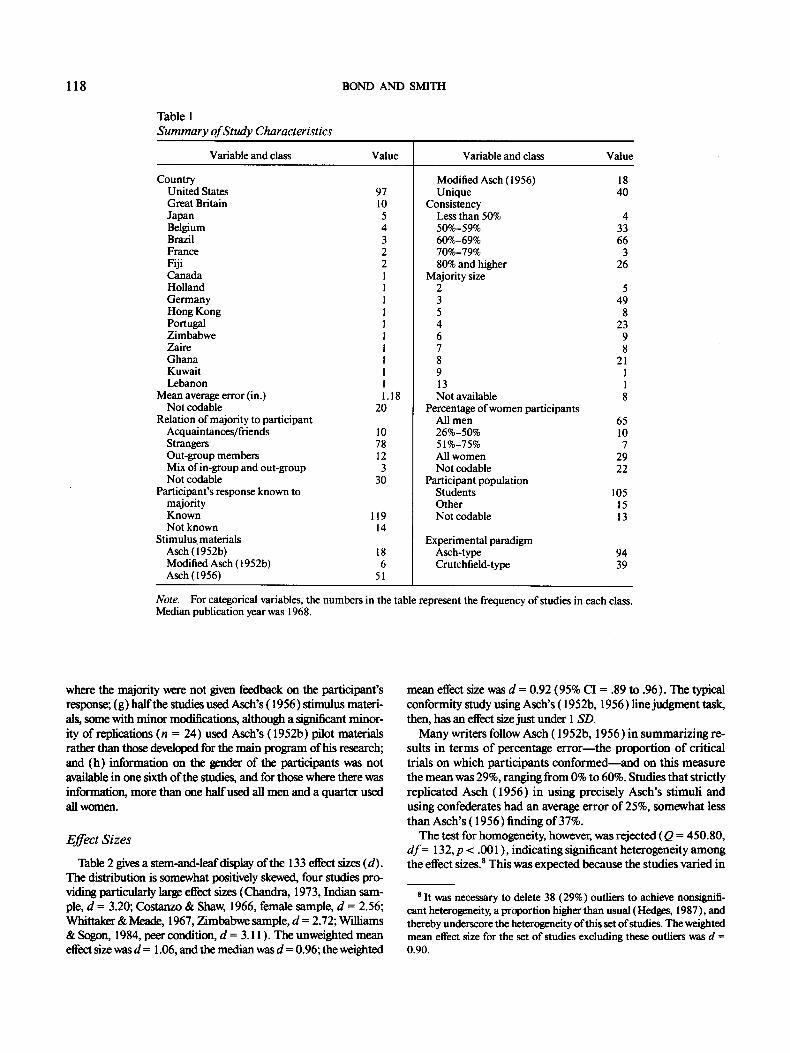
A table of the studies, their effect sizes, and principal features is given in Appendix A; the characteristics of this sample are sum- marized in Table 1. The main features were (a) the large majority, o f studies used students as participants, only 15 having nonstudent samples; (b) the studies were drawn from 17 countries, although more than two thirds were conducted in the United States; (c) more than two thirds used an Asch-type paradigm using confed- erates in face-to-face interaction, and the remainder used a Crutchtield-type paradigm; (d) the distribution of majority size was bimodal: Just over one third used a majority o f three, reflect- ing Asch's (1955) belief that this number was sutficient, and one sixth used a majority o f eight, this being the number used in Asch's main studies; (e) the majority consisted of strangers (but probably student peers ), for the large majority of studies where information was available; ( f ) a minority of studies (n = 14) used a procedure
4 Asch (1956) chose to summarize his results by expressing the total number of errors made by all participants as a proportion of the total number of trials. Although this statistic is often misinterpreted (Harris, 1985), nevertheless it has often been used in replications, and authors frequently do not report SD. In 33 studies, it was not possible to deter- mine the SD. However, from the 41 studies where the SD was available, we found that the SD was highly correlated with the number of critical trials (r = 0.86), and therefore for studies where the SD was not avail- able, we used the rogresslon equation to provide an estimate.
5 Of the 75 studies, data were available from a total of 24 separate control groups. In several studies, a single control group was deemed sufficient for several experiments (e.g~, Asch, 1956), and in these cases the control group mean was used to adjust the relevant experimental group means. Thirty-seven studies did not use a control group, but they all used either the Asch (1952b) orthe Asch (1956) stimulus materials. We decided to use the data from the relevant Asch control group to adjust the experimental group means for these studies (m = .074 for Asch, 1952b; m = .005 for Asch, 1956).
6 The correction factor is c(m) = l - [3/(4n, - 5)], where r~ equals the number in the experimental group (Owen, 1968).
7The reciprocal of the variance was given by W i = [2n~(n~ - 1 ) ] / [ 2 ( n [ - 1 ) + n[d~ ], where n~ equals the number in the experi- mental group for the ith study and di equals the corrected effect size for the ith study.
1 18 BOND AND SMITH
Table 1 Summary of Study Characteristics
Variable and class Value Variable and class Value
Country United States 97 Great Britain 10 Japan 5 Belgium 4 Brazil 3 France 2 Fiji 2 Canada 1 Holland 1 Germany 1 Hong Kong 1 Portugal 1 Zimbabwe 1 Zaire 1 Ghana 1 Kuwait 1 Lebanon 1
Mean average error (in.) 1.18 Not codable 20
Relation of majority to participant Acquaintances/friends 10 Strangers 78 Out-group members 12 Mix of in-group and out-group 3 Not codable 30
Participant's response known to majority Known 119 Not known 14
Stimulus. materials Asch (1952b) 18 Modified Asch (1952b) 6 Asch (1956) 51
Modified Asch (1956) 18 Unique 40
Consistency Less than 50% 4 50%-59% 33 60%-69% 66 70%-79% 3 80% and higher 26
Majority size 2 5 3 49 5 8 4 23 6 9 7 8 8 21 9 1 13 1 Not available 8
Percentage of women participants All men 65 26%-50% 10 51%-75% 7 All women 29 Not codable 22
Participant population Students 105 Other 15 Not codable i 3
Experimental paradigm Asch-type 94 Crutchfield-type 39
Note. For categorical variables, the numbers in the table represent the frequency of studies in each class. Median publication year was 1968.
where the majority were not given feedback on the participant's response; (g) half the studies used Asch's (1956) stimulus materi- als, some with minor modifications, although a significant minor- ity of replications (n = 24) used Asch's ( 1952b ) pilot materials rather than those developed for the main program of his research; and (h) information on the gender of the participants was not a ~ i a b l e in one sixth of the studies, and for those where there was information, more than one half used all men and a quarter used all women.
Effect Sizes
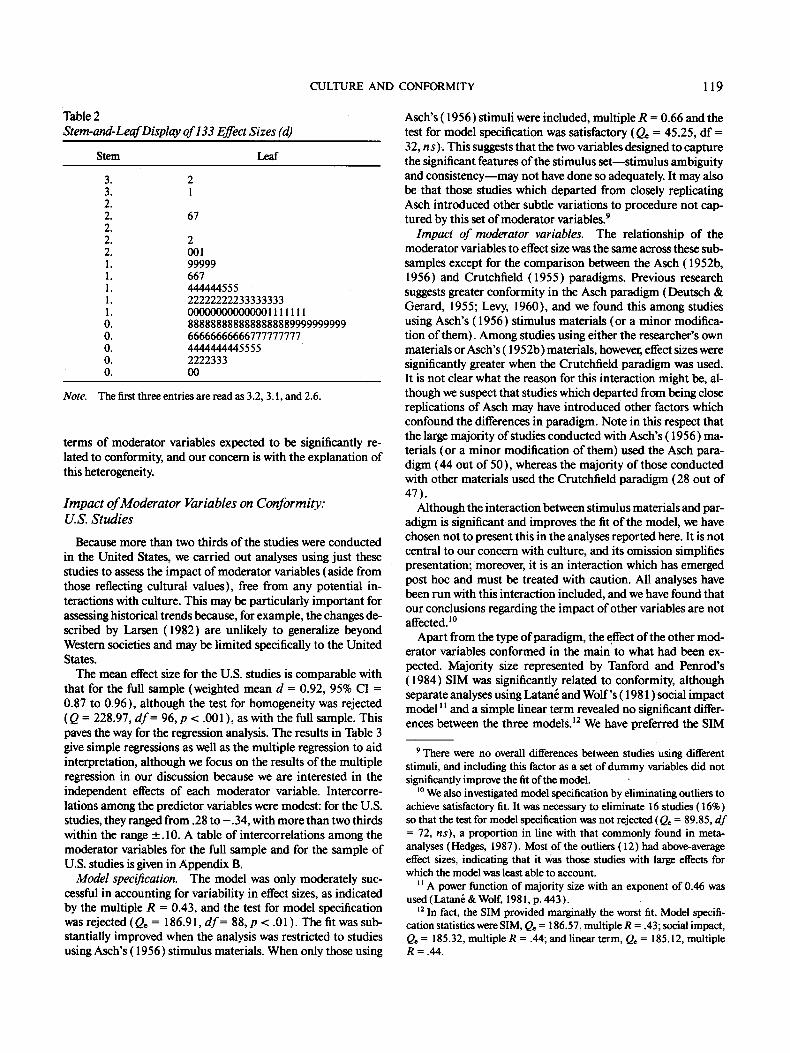
Table 2 gives a stem-and-leaf display of the 133 effect sizes (d) . The distribution is somewhat positively skewed, four studies pro- viding particularly large effect sizes (Chandra, 1973, Indian sam- ple, d = 3.20; Costanzo & Shaw, 1966, female sample, d = 2.56; Whittaker &Meade, 1967, Zimbabwe sarnple, d = 2.72; Williams & Sogon, 1984, peer condition, d = 3.11 ). The unweighted mean effect size was d -- 1.06, and the median was d = 0.96; the weighted
mean effect size was d = 0.92 (95% CI = .89 to .96). The typical conformity study using Asch's ( 1952b, 1956) line judgment task, then, has an effect size just under 1 SD.
Many writers follow Asch ( 1952b, 1956) in summarizing re- sults in terms of percentage e r ror - - the proportion of critical trials on which participants con fo rmedmand on this measure the mean was 29%, ranging from 0% to 60%. Studies that strictly replicated Asch (1956) in using precisely Asch's stimuli and using confederates had an average error of 25%, somewhat less than Asch's (1956) finding of 37%.
The test for homogeneity, however, was rejected (Q = 450.80, d f = 132, p < .001 ), indicating significant heterogeneity among
s the effect sizes. This was expected because the studies varied in
s It was necessary to delete 38 (29%) outliers to achieve nonsignifi- cant heterogeneity, a proportion higher than usual (Hedges, 1987), and thereby underscore the heterogeneity of this set of studies. The weighted mean effect size for the set of studies excluding these outliers was d = 0.90.
CULTURE AND CONFORMITY 119
Table 2 Stem-and-Leaf Display of 133 Effect Sizes (d)
Stem Leaf
3. 2 3. 1 2. 2. 67 2. 2. 2 2. 001 1. 99999 1. 667 1. 444444555 1. 22222222233333333 1. ~ l l l l i l l 0. 8888888888888888889999999999 0. 66666666666777777777 0. 4444444445555 0. 2222333 0. 00
Note. The first three entries are read as 3.2, 3.1, and 2.6.
terms of moderator variables expected to be significantly re- lated to conformity, and our concern is with the explanation of this heterogeneity.
Impact of Moderator Variables on Conformity: U.S. Studies
Because more than two thirds of the studies were conducted in the United States, we carried out analyses using just these studies to assess the impact of moderator variables (aside from those reflecting cultural values), free from any potential in- teractions with culture. This may be particularly important for assessing historical trends because, for example, the changes de- scribed by Larsen (1982) are unlikely to generalize beyond Western societies and may be limited specifically to the United States.
The mean effect size for the U.S. studies is comparable with that for the full sample (weighted mean d = 0.92, 95% CI = 0.87 to 0.96), although the test for homogeneity was rejected (Q = 228.97, df= 96, p < .001 ), as with the full sample. This paves the way for the regression analysis. The results in Table 3 give simple regressions as well as the multiple regression to aid interpretation, although we focus on the results of the multiple regression in our discussion because we are interested in the independent effects of each moderator variable. Intercorre- lations among the predictor variables were modest: for the U.S. studies, they ranged from .28 to - .34 , with more than two thirds within the range _+. 10. A table of intercorrelations among the moderator variables for the full sample and for the sample of U.S. studies is given in Appendix B.
Model specification. The model was only moderately suc- cessful in accounting for variability in effect sizes, as indicated by the multiple R = 0.43, and the test for model specification was rejected (Q~ = 186.91, df= 88, p < .01 ). The fit was sub- stantially improved when the analysis was restricted to studies using Asch's (1956) stimulus materials. When only those using
Asch's (1956) stimuli were included, multiple R = 0.66 and the test for model specification was satisfactory (Q~ = 45.25, df = 32, ns). This suggests that the two variables designed to capture the significant features of the stimulus set--st imulus ambiguity and consistency--may not have clone so adequately. It may also be that those studies which departed from closely replicating Asch introduced other subtle variations to procedure not cap- tured by this set of moderator variables. 9
Impact of moderator variables. The relationship of the moderator variables to effect size was the same across these sub- samples except for the comparison between the Asch ( 1952b, 1956) and Crutchfield (1955) paradigms. Previous research suggests greater conformity in the Asch paradigm (Deutsch & Gerard, 1955; Levy, 1960), and we found this among studies using Asch's (1956) stimulus materials (or a minor modifica- tion of them). Among studies using either the researcher's own materials or Asch's (1952b) materials, however, effect sizes were significantly greater when the Crutchfield paradigm was used. It is not clear what the reason for this interaction might be, al- though we suspect that studies which departed from being close replications of Asch may have introduced other factors which confound the differences in paradigm. Note in this respect that the large majority of studies conducted with Asch's (1956) ma- terials (or a minor modification of them) used the Asch para- digm (44 out of 50), whereas the majority of those conducted with other materials used the Crutchfield paradigm (28 out of 47).
Although the interaction between stimulus materials and par- adigm is significant and improves the fit of the model, we have chosen not to present this in the analyses reported here. It is not central to our concern with culture, and its omission simplifies presentation; moreover, it is an interaction which has emerged post hoc and must be treated with caution. All analyses have been run with this interaction included, and we have found that our conclusions regarding the impact of other variables are not affected.l°
Apart from the type of paradigm, the effect of the other mod- erator variables conformed in the main to what had been ex- pected. Majority size represented by Tanford and Penrod's (1984) SIM was significantly related to conformity, although separate analyses using Latan~ and Wolf 's ( 1981 ) social impact model im and a simple linear term revealed no significant differ- ences between the three models, i2 We have preferred the SIM
9 There were no overall differences between studies using different stimuli, and including this factor as a set of dummy variables did not significantly improve the fit of the model.
l0 We also investigated model specification by eliminating outliers to achieve satisfactory fit. It was necessary to eliminate 16 studies (16%) so that the test for model specification was not rejected (Q~ = 89.85, df = 72, ns), a proportion in line with that commonly found in meta- analyses (Hedges, 1987 ). Most of the outliers (12) had above-average effect sizes, indicating that it was those studies with large effects for which the model was least able to account.
lm A power function of majority size with an exponent of 0.46 was used (Latan~ & Wolf, 1981, p. 443).
12 In fact, the SIM provided marginally the worst fit. Model specifi- cation statistics were SIM, O~ = 186.57, multiple R = .43; social impact,
= 185.32, multiple R = .44; and linear term, Q_~ = 185.12, multiple R = .44.

120 BOND AND SMITH
Table 3 Continuous Model on Conformity Effect Sizes for U.S. Studies Only
Simple regressions Multiple regression
Variable fl b fl b
Type of paradigm • 0.20 0.134"* 0.14 0.094 Majority size (SIM) b 0.13 2.370 0.17 3.160" Response known to
majority ~ 0.01 0.012 -0.01 -0.009 Stimulus ambiguity d -0.10 -0.099 -0.17 -0.168* Consistency of
majority ~ -0.06 -0.126 0.07 0.167 Majority out-group
or not f -0.20 -0.247** -0.17 -0.210" Percentage of female
respondents 0.24 0.002*** 0.29 0.002*** Date of study -0.11 -0.004 -0.19 -0.008** Constant 13.143 Multiple R 0.430 Q s, df= 88 186.570"*
Note. Models are weighted least-squares estimators of regression co- efficients obtained by weighting each effect size by the reciprocal of its estimated variance (Hedges & Olkin, 1985, p. 174). In the multiple re- gression model, the predictors were entered simultaneously, b = unstan- dardized regression coefficient; fl = standardized regression coefficient; df= degrees of freedom; Q, = test of model specification. • Coded: 1 = Asch (1956) paradigm, 2 = Crutchfield (1955) paradigm.
Tanford and Penrod's (1984) social influence model (SIM). c Coded: 1 = participant's response available to majority, 2 = not available. a Discrepancy between correct line and line chosen by majority in inches. "Ratio of number of critical trials to total number of trials. fCoded 0 = majority not an out-group, 1 = majority an out-group. s When ~ is significant, the hypothesis of adequate model specification is rejected. *p<.05. **p<.01. ***p<.001.
in subsequent analyses in view of Tanford and Penrod's more comprehensive evaluation and their arguments for preferring SIM on theoretical grounds.
Of the variables reflecting the type of stimulus materials, sig- nificantly greater conformity was found when the stimulus was ambiguous (i.e., when the average error was smaller), consistent with the findings of Asch (1956) and Cohen (1958)) 3 Consis- tency (i.e., the proportion of critical trials), however, had no significant effect, although the trend was in the expected direc- tion of greater conformity associated with greater consistency.
A set of dummy variables was used to represent the relation of the majority to the participant (acquaintances, strangers, or out-group members), one of which was significantly related to conformity: Consistent with previous research (Abrams et al., 1990; Turner, 1991 ), conformity was significantly lower when the majority consisted of out-group members. The inclusion of the remaining dummy variables resulted in little improvement to the fit of the model, m4 to simplify presentation, analyses using only the variable reflecting an out-group majority are presented in this article.
The finding that the greater the percentage of female respon- dents, the higher the level of conformity was also consistent with the conclusion from earlier reviews (e.g., Eagly & Carli, 1981 ),
although it is striking that it had the largest impact of all the moderator variables included in this analysis. We investigated this further, first by comparing just those studies where the par- ticipants were all men with those where participants were all women. Most of the U.S. studies comprise single gender groups, 59 men and 26 women, and in only 5 studies could the results for men and women not be disaggregated. For the remaining 7 U.S. studies, the gender composition of the participants was not specified. For studies using men, the weighted mean effect size was d = 0.85 (95% CI = 0.79 to 0.90); whereas for studies using women, it was d = 1.04 (95% CI = 0.96 to 1.13). We fit a cate- gorical model to these data and the between-classes goodness- of-fit statistic indicated significant heterogeneity between the two groups (Qs = 13.99, p < .001 ). Among these studies were results from 17 experiments that had used both men and women, and we performed a further analysis on these because they afforded a "within-experiment" analysis of gender differ- ences which would not be confounded by possible differences between experiments (cf. Eagly & Wood, 1994; Wood, Lund- gren, Ouellette, Busceme, & Blackstone, 1994). The results were comparable with those obtained on the larger set of stud- ies; the weighted mean effect size for men was d = 0.89 (95% CI = 0.77 to 1.00) and for women it was d = 1.11 (95% CI = 1.10 to 1.11 ), and the difference between the two groups was signifi- cant (Qe = 6.57, p < .05). These additional analyses indicate that the gender difference found overall is robust and does not appear to be spuriously inflated through confounding with other factors.
We also investigated whether there were interactions between gender and the other moderator variables. For example, we may have expected that gender differences may have narrowed over time, and therefore that there would be an interaction between gender and date of publication, that women would be more sen- sitive to the presence of others, and that there would be a greater difference for women between the Asch (1952b, 1956) and Crutchfield (1955) paradigms, or between whether their re- sponse was available to the other group members. There was no evidence, however, for these interactions: Inclusion of the interaction between percentage of female respondents and date of study led to virtually no improvement in model specification (for the model with the interaction term, Q~ = 186.14 com- pared with Q~ = 186.57 for the model without the interaction term). Likewise, there was no improvement in fit when the in- teraction between type of paradigm and percentage of female
m3 We also measured stimulus ambiguity by coding proportionate er- ror, that is, the difference in length between the chosen line and the standard, divided by the length of the standard. However, this proved not as good a predictor as absolute error (B = -0.12 ).
t4 The model specification statistic when only the variable reflecting an out-group majority was included was ~ = 186.57, df= 88 (multiple R = 0.43); when all dummy variables were included Q, = 184.96, df= 86 (multiple R = 0.44). There was, then, tittle difference between stud- ies where the majority were friends or acquaintances and studies where the majority were strangers. Asch (1956) had also found little differ- ence, and it is likely that in the typical study the majority are perceived to be fellow students, hence in-group members, even though they are strangers.
CULTURE AND CONFORMITY
Table 4 Continuous Model on Conformity Effect Sizes Including Hofstede's (1983) Measure of Cultural Values
Simple regressions Multiple regression
Variable /3 b /3 b
Moderator Type of paradigm* 0.11 0.086* 0.20 0.162*** Majority size (SIM) b 0.12 1.459" 0.17 2.093** Response known to majority ~ 0.01 0.018 0.01 0.016 Stimulus ambiguity a -0.04 -0.046 -0.07 -0.090 Consistency of majority ~ -0.09 -0.262 0.04 0.126 Majority out-grouD or not t -0.16 -0.244** -0.08 -0.122 Percentage of female respondents 0.17 0.002"** 0.16 0.002** Date of study -0.09 -0.004 -0.24 -0.009***
Hofstede ( 1983) Individualism -0.20 -0.004*** -0.35 -0.007***
Constant 17.785 Multiple R 0.420 Q S, df= 120 354.450**
Note. Models are weighted least-squares estimators of regression coefficients obtained by weighting each effect size by the reciprocal of its estimated variance (Hedges & Olkin, 1985, p. 174). In the multiple re- gression model, the predictors were entered simultaneously, b = unstandardized regression coefficient;/3 = standardized regression coefficient; df= degrees of freedom; Q~ = test of model specification. "Coded: 1 = Asch (1956) paradigm, 2 = Crutehfield (1955) paradigm, b Tanford and Penrod's (1984) social influence model (SIM). c Coded: 1 = participant's response available to majority, 2 = not available. d Discrepancy between correct fine and fine chosen by majority in inches. • Ratio of number of critical trials to total number of trials, fcoded 0 = majority not an out-group, 1 = majority an out-group. s When Q~ is significant, the hypothesis of adequate model sI~ecification is rejected. • p<.05. **p<.01. ***p<.001.
121
respondents was included (Qe = 186.29). Similarly, either little or no improvement in fit was found when we included the in- teraction with stimulus ambiguity (Qe = 185.29), with whether the out-group was a majority (Q~ = 186.43 ), with whether the response was available to the majority (Q~ = 181.03), or with consistency (Q~ = 181.28).
Whether the participant 's response was made known to the majority was not significant, however, although we had ex- pected conformity to be lower when the response was not known because this should minimize normative influence (Allen, 1965). We also found no difference for type of popula- tion (coded as comparing student populations with the remainder ), and this variable has not been included in the sub- sequent analyses reported here.
We shall see in Tables 4, 5, and 6 that the effect of these mod- erator variables was substantially the same for the analyses using all studies and including cultural variables as additional predic- tors. The exceptions were that neither the measure of stimulus ambiguity nor the variable reflecting whether the majority was an out-group were significant.
Changes over time. One aspect of our focus on the impact of culture concerns changes over time, and we can see from Table 3 that the date of study was significantly negatively related to effect size, indicating that there has been a decline in the level of conformity. (This effect was found also in the analyses using all the studies reported in Table 4.) Larsen ( 1974, 1982; Larsen et al., 1979) hypothesized a curvilinear trend, whereby confor- mity declined in the late 1960s and early 1970s and then rose in
the latter part of the 1970s. Accordingly, we performed a regres- sion analysis including a quadratic term for the date of publica- tion, but this proved to be nonsignificant. Is The trend appears best described as linear, and we have only included the linear term in our subsequent analyses. The fact that this trend is neg- ative is opposite to the prediction of Lamb and Alsifaki (1980), who argued that conformity would increase because of an in- creasing number of other-directed types of individual.
Cultural Values and Conformity
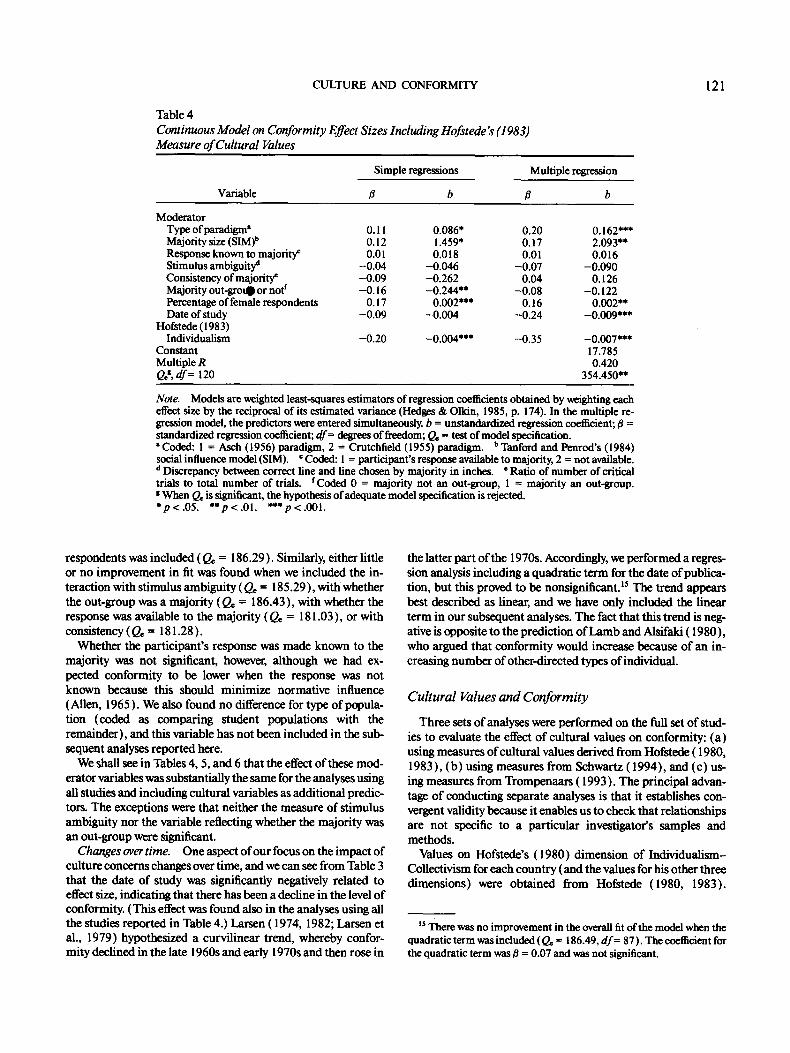
Three sets of analyses were performed on the full set of stud- ies to evaluate the effect of cultural values on conformity: (a) using measures of cultural values derived from Hofstede ( 1980, 1983), (b) using measures from Schwartz (1994), and (c) us- ing measures from Trompenaars (1993). The principal advan- tage of conducting separate analyses is that it establishes con- vergent validity because it enables us to check that relationships are not specific to a particular investigator's samples and methods.
Values on Hofstede's (1980) dimension of Individualism- Collectivism for each country (and the values for his other three dimensions) were obtained from Hofstede (1980, 1983).
is There was no improvement in the overall fit of the model when the quadratic term was included (Q~ = 186.49, dr= 87 ). The coefficient for the quadratic term was/3 = 0.07 and was not significant.
122 BOND AND SMITH
Table 5 Continuous Model on Conformity Effect Sizes Including Schwartz "s (1994) Measures of Cultural Values
Simple regressions Multiple regression
Variable ~ b /~ b
Moderator Type of paradigm" 0.12 0.094* 0.12 Majority size (SIM) ~ 0.12 1.409" 0.20 Response known to majority ~ 0.02 0.023 0.02 Stimulus ambiguity a -0.04 -0.047 -0.09 Consistency of majority e -0.09 -0.253 -0.01 Majority out-group or not f -0.13 -0.240*** -0.GIll Percentage of female respondents 0.17 0.002*** 0.14 Date of study -0.10 -0.004" -0.14
Schwartz (1994) Intellectual autonomy -0.14 -0.147** -0.28 Affective autonomy -0.38 -0.988*** -0.44 Conservatism 0.16 0.311"** -0.32
Constant Multiple R Q~,df= ll7
0.094* 2.384** 0.033
-0.118 -0.019 -0.117
0 . 0 0 1 " * -0.006*
-0.290* - 1 . 1 6 4 * * * -0.607** 17.970 0.490
326.030**
Note. Models are weighted least-squares estimators of regression coefficients obtained by weighting each effect size by the reciprocal of its estimated variance (Hedges & Olkin, 1985, p. 174). In the multiple re- gression model, the predictors were entered simultaneously, b = unstandardized regression coefficient; ~ = standardized regression coefficient; df= degrees of freedom; Qe = test of model specification. J Coded: 1 = Asch (1956) paradigm, 2 = Crutchfield (1955) paradigm, bTanford and Penrod's (1984) social influence model (SIM). c Coded: 1 = participant's response available to majority, 2 = not available. d Discrepancy between correct line and line chosen by majority in inches • Ratio of number of critical trials to total number of trials, fCoded 0 = majority not an out-group, 1 = majority an out-group. ' When Qe is significant, the hypothesis of adequate model specification is rejected. • p< .05 . **p<.01. ***p<.001.
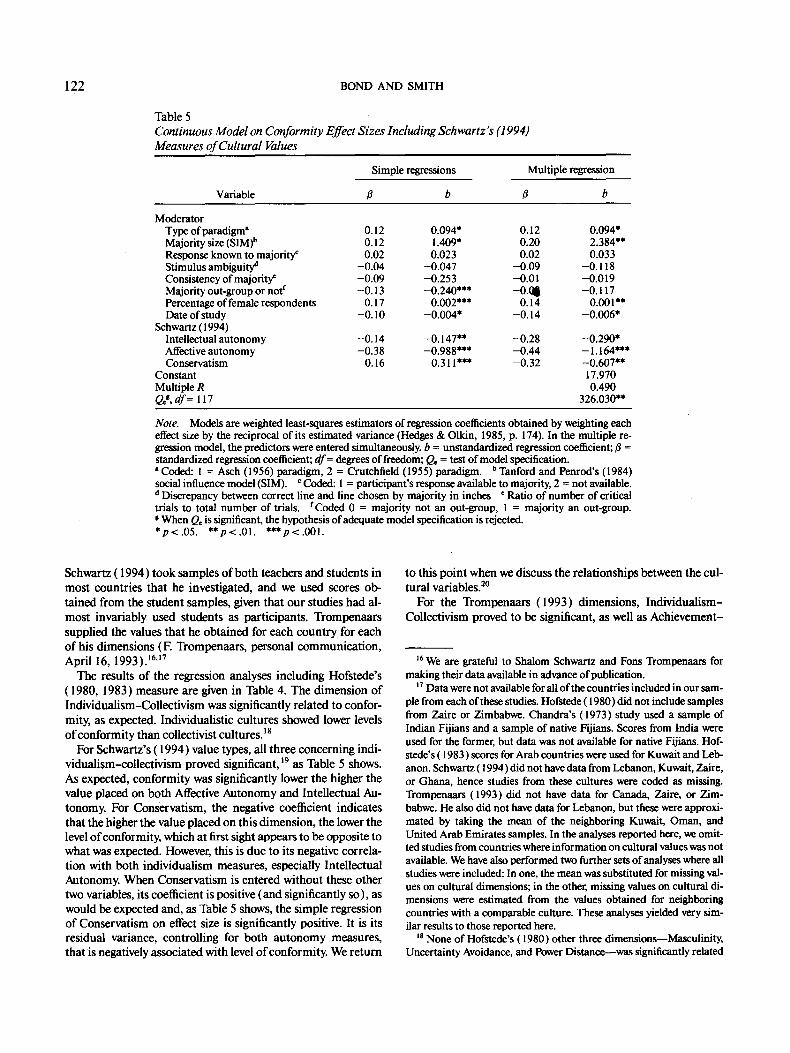
Schwartz (1994) took samples o f both teachers and students in most countries that he investigated, and we used scores ob- tained from the student samples, given that our studies had al- most invariably used students as participants. Trompenaars supplied the values that he obtained for each country for each o f his dimensions ( E Trompenaars, personal communicat ion, April 16, 1993). 16'17
The results o f the regression analyses including Hofstede's ( 1980, 1983) measure are given in Table 4. The dimension o f Individualism-Collectivism was significantly related to confor- mity, as expected. Individualistic cultures showed lower levels of conformity than collectivist cultures. 18
For Schwartz's (1994) value types, all three concerning indi- vidualism-collectivism proved significant, ~9 as Table 5 shows. As expected, conformity was significantly lower the higher the value placed on both Affective Autonomy and Intellectual Au- tonomy. For Conservatism, the negative coefficient indicates that the higher the value placed on this dimension, the lower the level o f conformity, which at first sight appears to be opposite to what was expected. However, this is due to its negative correla- tion with both individualism measures, especially Intellectual Autonomy. When Conservatism is entered without these other two variables, its coefficient is positive (and significantly so), as would be expected and, as Table 5 shows, the simple regression of Conservatism on effect size is significantly positive. It is its residual variance, controlling for both au tonomy measures, that is negatively associated with level o f conformity. We return
to this point when we discuss the relationships between the cul- tural variables. 2°
For the Trompenaars (1993) dimensions, Individual ism- Collectivism proved to be significant, as well as Achievement-
16 We are grateful to Shalom Schwartz and Fons Trompenaars for making their data available in advance of publication.
17 Data were not available for all of the countries included in our sam- ple from each of these studies. Hofstede (1980) did not include samples from Zaire or Zimbabwe. Chandra's (1973) study used a sample of Indian Fijians and a sample of native Fijians. Scores from India were used for the former, but data was not available for native Fijians. Hof- stede's (1983) scores for Arab countries were used for Kuwait and Leb- anon. Schwartz ( 1994 ) did not have data from Lebanon, Kuwait, Zaire, or Ghana, hence studies from these cultures were coded as missing. Trompenaars (1993) did not have data for Canada, Zaire, or Zim- babwe. He also did not have data for Lebanon, but these were approxi- mated by taking the mean of the neighboring Kuwait, Oman, and United Arab Emirates samples. In the analyses reported here, we omit- ted studies from countries where information on cultural values was not available. We have also performed two further sets of analyses where all studies were included: In one, the mean was substituted for missing val- ues on cultural dimensions; in the other, missing values on cultural di- mensions were estimated from the values obtained for neighboring countries with a comparable culture. These analyses yielded very sim- ilar results to those reported here.
~s None of Hofstede's (1980) other three dimensions---Masculinity, Uncertainty Avoidance, and Power Distance--was significantly related
CULTURE AND CONFORMITY 123
Ascription. The results are given in Table 6. As expected, a higher level of conformity was associated with collectivist cul- tures and those that saw status as ascribed rather than achieved.2
For all three multiple regression analyses, the model specifi- cation statistic, Q~, was significant, and therefore in each case the hypothesis of adequate model specification was rejected. The best fit was obtained with the Schwartz (1994) cultural variables and the worst with Trompenaars 's (1993) variables. As we found with the analysis of just the U.S. studies, a much better fit was found when only studies using Asch's (1956) stim- ulus materials were included. For example, the model using the Schwartz cultural variables gave a multiple R = 0.67 (Q~ = 82.91, df= 40, p < .05 ) when only studies using Asch's (1956) materials were included; although the test for model specifica- tion was still rejected, the e l iminat ion of just four outliers gave an acceptable fit. 22 Note, however, that the relationships be- tween effect size and the predictor variables were not signifi- cantly altered for these analyses.
We should also note that in each case the measures of cultural values had larger standardized regression coefficients than any of the other moderator variables that are more usually identified as the significant sources of variance in conformity in the Asch ( 1952b, 1956) paradigm.
Relations Between Measures of Cultural Values
Although we have conducted separate analyses for the differ- ent measures of cultural values, the dimensions that we have focused on, and that have proved significant in our analyses, are all conceptually related to individualism--collectivism; if their effects are to be similarly interpreted, we should find that for this sample of countries they are reasonably highly correlated. Table 7 presents the correlations between the measures of cul- tural values. 23
The correlations are very much as we had expected. For the Schwartz (1994) dimensions, Affective Autonomy and Intellec-
to conformity, and they were not expected to be so; thus, they are not included in the model. The regression equation with all four cultural dimensions did not provide an appreciably better fit (Qc = 334.31, df = 117, multiple R = 0.47). The correlations between individualism- collectivism and the other predictor variables were modest. The corre- lation with date of study was largest, r = -.47, the remainder ranged from -.21 to .25, and the median absolute value r = . 13.
J9 None of Schwartz's (1994) remaining culture-level value types-- hierarchy, harmony, mastery, and egalitarian commitment--was sig- nificant, and they were not expected to be so. Their inclusion did not appreciably improve the fit of the model (Qc = 295.35, df= 113, multiple R = 0.56), and hence they were excluded. The correlations between each measure of cultural values and the remaining predictor variables was typically modest: For Affective Autonomy, the corre- lations ranged between -.30 and .53, the median absolute value, r, was .13; for Intellectual Autonomy, the range was -.13 to .15, the median absolute value, r, was .07; and for Conservatism, the range was - .54 to .45, the median absolute value, r, was. 11. For both Intellectual Auton- omy and Conservatism, the largest correlations were with date of study (r = .53 and r = - .54 respectively).
tual Autonomy are positively correlated and are both strongly negatively correlated with Conservatism, similar to the cor- relations reported by Schwartz (1994). The Trompenaars (1993) measures-- Individual ism-Col lect iv ism and Achieve- mer i t -Ascr ip t ion--are moderately positively intercorrelated. Hofstede's (1980) Individualism-Collectivism correlates posi- tively with Schwartz's Affective Autonomy and Intellectual Au- tonomy (albeit more strongly with the former) and negatively with Conservatism. It also correlates positively with Trompen- aars's measures of Individualism-Collectivism and Achieve- ment-Ascr ipt ion. Likewise, the Schwartz measures of Affective Autonomy and Intellectual Autonomy are positively correlated with, and Conservatism is negatively correlated with, Trompen- aars's measures of Individualism-Collectivism and Achieve- ment-Ascr ipt ion. On the whole, then, the pattern ofintercorre- lations is consistent with the view that all three investigations are tapping some common dimension of cultural values, bu t the correlations are not so large as to indicate that they are merely duplicating each other. Of course, we would expect the corre- lations to be lower because of the different questionnaire mea- sures, samples, and times at which the surveys were carried out.
However, it may also be that they tap conceptually somewhat distinct dimensions. We therefore performed a regression anal- ysis where all three sets of cultural variables were included to see whether this would provide a better fit. However, it did not.
2o Combining these three measures into a single dimension, either by taking scores on the first principal component or by constructing a summed score, did not produce as good a fit as entering each value separately.
2, The remaining Trompenaars's (1993) dimensions--Specific-- Diffuse, Neutral-Emotional, and Universalism-Particularism--were not significant. Smith, Dugan, and Trompenaars (in press) have re- cently reanalyzed Trompenaars's data and have developed a measure of individualism which is preferred over Trompanaars's original individu- alism-collectivism measure. Substituting the new measure gave multiple R = 0.36 (Q¢ = 379.95, df= 119, p < .01 ) and individualism was significantly related to effect size 05 = -0.25, p < .01 ), indicating lower effect sizes for countries high in individualism. The correlations between each measure of cultural values and the remaining predictor variables were modest, ranging from -.09 to .45; the median absolute value was r = . 10. For both Individualism-Collectivism and Achieve- ment-Ascription, the largest correlations were with the date of study (r = .25 and r = .45, respectively).
22 For this model where the four outliers were excluded, multiple R = 0.81 (Q~ = 49.06, df = 36, ns). All predictors were significant a tp < .01 with the following standardized coeificients: paradigm,/~ = -0.25; majority size (SIM),/~ = 0.19; response known,/$ = -0.17; majority out-group or not, B = -0.25; percentage women, B = 0.21; date of study, /~ = -0.44; Conservatism, # = -0.50; Affeetive Autonomy, # = -0.71; and Intellectual Autonomy,/~ = -0.45. The variables average error and consistency were not appropriate given that all studies used the same stimulus materials.
23 It is customary to explore cultural dimensions of values at the cul- ture level where the country is treated as the unit of analysis, and we have chosen to follow that practice here, so our results are comparable with this other work (e.g., Hofstede, 1980; Schwartz, 1994). If each study is taken as the unit of analysis, somewhat different correlations are obtained because values are duplicated when there is more than one study from a particular country.

124 BOND AND SMITH
Table 6 Continuous Model on Conformity Effect Sizes Including Trompenaars's (1993) Measures of Cultural Values
Simple regressions Multiple regression
Variable O b /~ b
Moderator Type of paradigm" 0.11 0.085* 0.17 0.138** Majority size (SIM) b 0.12 1.472* 0.20 2.386"** Response known to majority ~ 0.01 0.012 0.01 0.013 Stimulus ambiguity a -0.04 -0.048 -0.05 -0.061 Consistency of majority ~ -0.09 -0.269* 0.02 0.049 Majority out-group or not f -0.16 -0.245*** -0.09 -0.144 Percentage of female respondents 0.17 0.002*** 0.17 0.002"** Date of study -0.09 -0.003 -0.22 -0.008***
Trompenaars (1993) Individualism--coUectivism 0.30 0.041"** 0.22 0.030*** Achievement-ascription 0.23 0.012*** 0.22 0.012**
Constant 17.560 Multiple R 0.470 Q,S, df= 119 339.790**
Note. Models are weighted least-squares estimators of regression coefficients obtained by weighting each effect size by the reciprocal of its estimated variance (Hedges & Olkin, 1985, p. 174). In the multiple re- gression model, the predictors were entered simultaneously, b = unstandardized regression coefficient; ~ = standardized regression coefficient; df= degrees of freedom; Q., = test of model specification. "Coded: I = Aseh (1956) paradigm, 2 = Crutchfield (1955) paradigm, b Tanford and Penrod's (1984) social influence model (SIM). c Coded: 1 = participant's response available to majority, 2 = not available. a Discrepancy between correct line and line chosen by majority in inches, e Ratio of number of critical trials to total number of trials, fCoded 0 = majority not an out-group, 1 = majority an out-group. g When Q., is significant, the hypothesis of adequate model specification is rejected. *p<.05. **p<.01. ***p<.001.
There was virtually no improvement over the Schwartz (1994) model alone (the model specification statistic was Qe = 327.35, df= 115, and multiple R = 0.50 compared with Q.¢ = 326.03, df= 117, and multiple R = 0.49 for the Schwartz model). Nei- ther the Trompenaars ( 1993 ) or the Hofstede (1980) measures appear to carry information that predicts level of conformity that is not contained within the Schwartz measures.
Discuss ion
Summary of Findings The results of this review can be summarized in three
parts. First, we investigated the impact of a number of poten- tial moderator variables, focusing just on those studies con- ducted in the United States where we were able to investigate their relationship with conformity, free of any potential in- teractions with cultural variables. Consistent with previous research, conformity was significantly higher, (a) the larger the size of the majority, (b) the greater the proport ion of fe- male respondents, (c) when the majori ty did not consist of out-group members, and (d ) the more ambiguous the stimu- lus. There was a nonsignificant tendency for conformity to be higher, the more consistent the majority. There was also an unexpected interaction effect: Conformity was higher in the Asch ( 1952b, 1956) paradigm (as was expected), but only for studies using Asch's (1956) stimulus materials; where other stimulus materials were used (but where the task was
also judging which of the three comparison lines was equal to a s tandard) , conformity was higher in the Crutchfield ( 1955 ) paradigm. Finally, although we had expected conformity to be lower when the par t ic ipant ' s response was not made avail- able to the majority, this variable did not have a significant effect.
The second area of interest was on changes in the level of conformity over time. Again the main focus was on the anal- ysis just using studies conducted in the United States because it is the changing cultural cl imate of Western societies which has been thought by some to relate to changes in conformity. We found a negative relationship. Levels of conformity in general had steadily declined since Asch's studies in the early 1950s. We did not find any evidence for a curvil inear t rend (as, e.g., Larsen, 1982, had hypothesized), and the direction was opposite to that predicted by Lamb and Alsifaki (1980).
The third and major area of interest was in the impact of cultural values on conformity, and specifically differences in individualism-collectivism. Analyses using measures of cul- tural values derived from Hofstede (1980, 1983), Schwartz (1994), and Trompenaars (1993) revealed significant rela- tionships confirming the general hypothesis that conformity would be higher in collectivist cultures than in individualist cultures. That all three sets of measures gave similar results, despite the differences in the samples and instruments used, provides strong support for the hypothesis. Moreover, the im- pact of the cultural variables was greater than any other, in-
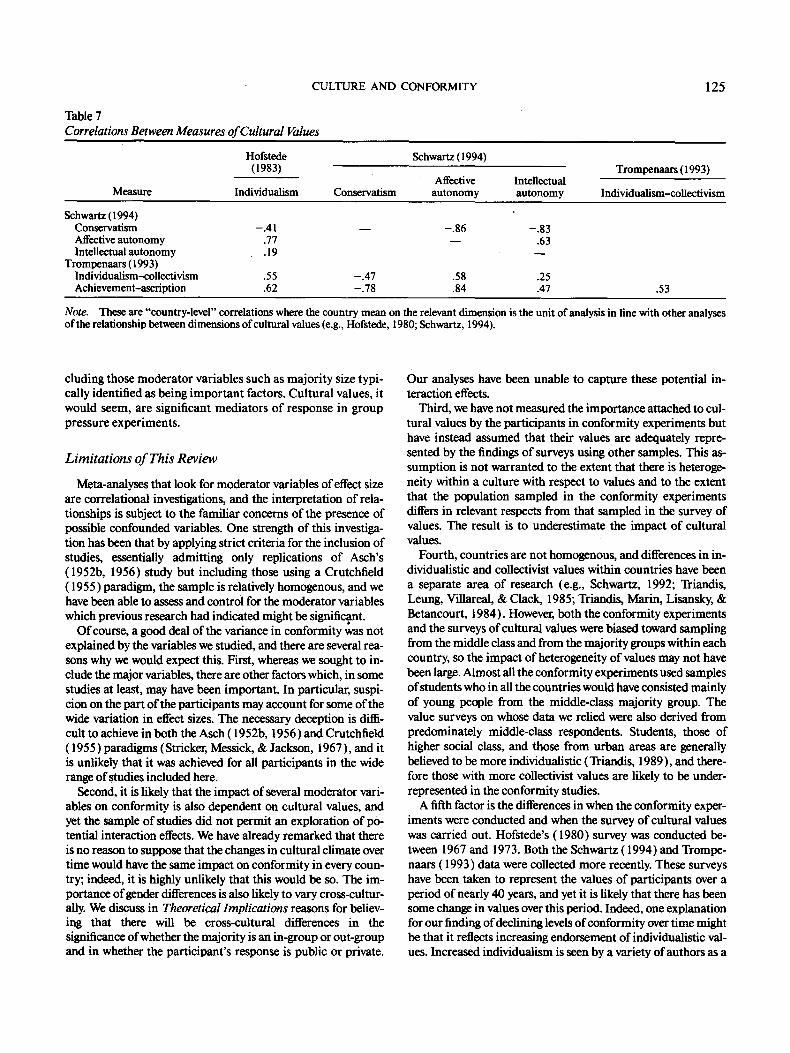
CULTURE AND CONFORMITY
Table 7 Correlations Between Measures of Cultural Values
125
Hofstede Schwartz (1994) (1983)
Affective Intellectual Measure Individualism Conservatism autonomy autonomy
Trompeuaa~(1993)
Individualism-collectivism
Schwartz (1994) Conservatism -.41 Affective autonomy .77 Intellectual autonomy .19
Trompenaars (1993) Individualism-collectivism .55 Achievement-ascription .62
-.86 -.83 - - .63
-.47 .58 .25 -.78 .84 .47 .53
Note. These are "country-level" correlations where the country mean on the relevant dimension is the unit of analysis in line with other analyses of the relationship between dimensions of cultural values (e.g., Hofstede, 1980; Schwartz, 1994).
cluding those moderator variables such as majority size typi- cally identified as being important factors. Cultural values, it would seem, are significant mediators of response in group pressure experiments.
Limitations of This Review
Meta-analyses that look for moderator variables of effect size are correlational investigations, and the interpretation of rela- tionships is subject to the familiar concerns of the presence of possible confounded variables. One strength of this investiga- tion has been that by applying strict criteria for the inclusion of studies, essentially admitting only replications of Asch's ( 1952b, 1956) study but including those using a Crutchfield ( 1955 ) paradigm, the sample is relatively homogenous, and we have been able to assess and control for the moderator variables which previous research had indicated might be signifi ,cant.
Of course, a good deal of the variance in conformity was not explained by the variables we studied, and there are several rea- sons why we would expect this. First, whereas we sought to in- clude the major variables, there are other factors which, in some studies at least, may have been important. In particular, suspi- cion on the part of the participants may account for some of the wide variation in effect sizes. The necessary deception is diffi- cult to achieve in both the Asch ( 1952b, 1956) and Crutchfield (1955) paradigms (Stricker, Messick, & Jackson, 1967), and it is unlikely that it was achieved for all participants in the wide range of studies included here.
Second, it is likely that the impact of several moderator vari- ables on conformity is also dependent on cultural values, and yet the sample of studies did not permit an exploration of po- tential interaction effects. We have already remarked that there is no reason to suppose that the changes in cultural climate over time would have the same impact on conformity in every coun- try; indeed, it is highly unlikely that this would be so. The im- portance of gender differences is also likely to vary cross-cultur- ally. We discuss in Theoretical Implications reasons for believ- ing that there will be cross-cultural differences in the significance of whether the majority is an in-group or out-group and in whether the participant's response is public or private.
Our analyses have been unable to capture these potential in- teraction effects.
Third, we have not measured the importance attached to cul- tural values by the participants in conformity experiments but have instead assumed that their values are adequately repre- sented by the findings of surveys using other samples. This as- sumption is not warranted to the extent that there is heteroge- neity within a culture with respect to values and to the extent that the population sampled in the conformity experiments differs in relevant respects from that sampled in the survey of values. The result is to underestimate the impact of cultural values.
Fourth, countries are not homogenous, and differences in in- dividualistic and collectivist values within countries have been a separate area of research (e.g., Schwartz, 1992; Triandis, Leung, ViUarcal, & Clack, 1985; Triandis, Matin, Lisansky, & Betancourt, 1984). Howeve~ both the conformity experiments and the surveys of cultural values were biased toward sampling from the middle class and from the majority groups within each country, so the impact of heterogeneity of values may not have been large. Almost all the conformity experiments used samples of students who in all the countries would have consisted mainly of young people from the middle-class majority group. The value surveys on whose data we relied were also derived from predominately middle-class respondents. Students, those of higher social class, and those from urban areas are generally believed to be more individualistic (Triandis, 1989), and there- fore those with more collectivist values are likely to be under- represented in the conformity studies.
A fifth factor is the differences in when the conformity exper- iments were conducted and when the survey of cultural values was carried out. Hofstede's (1980) survey was conducted be- tween 1967 and 1973. Both the Schwartz (1994) and Trompe- naars (1993) data were collected more recently. These surveys have been taken to represent the values of participants over a period of nearly 40 years, and yet it is likely that there has been some change in values over this period. Indeed, one explanation for our finding of declining levels of conformity over time might be that it reflects increasing endorsement of individualistic val- ues. Increased individualism is seen by a variety of authors as a
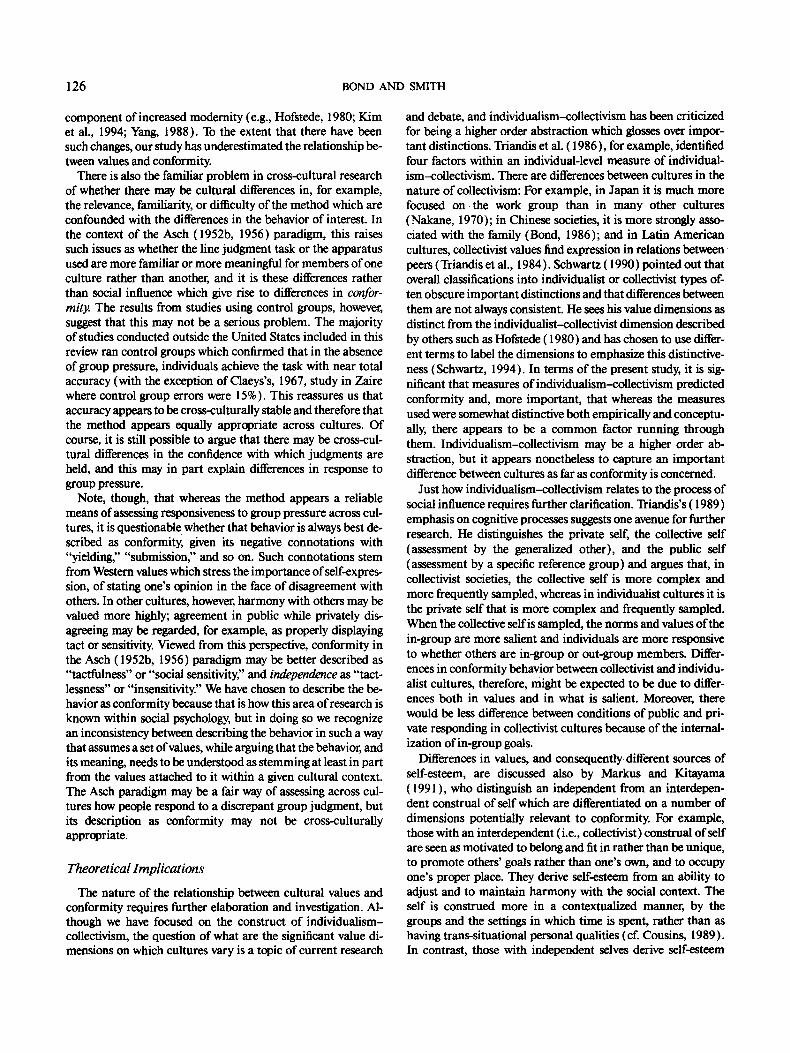
126 BOND AND SMITH
component of increased modernity (e.g., Hofstede, 1980; Kim et al., 1994; Yang, 1988). To the extent that there have been such changes, our study has underestimated the relationship be- tween values and conformity.
There is also the familiar problem in cross-cultural research of whether there may be cultural differences in, for example, the relevance, familiarity, or difficulty of the method which are confounded with the differences in the behavior of interest. In the context of the Asch (1952b, 1956) paradigm, this raises such issues as whether the line judgment task or the apparatus used are more familiar or more meaningful for members of one culture rather than another, and it is these differences rather than social influence which give rise to differences in confor- mity The results from studies using control groups, however, suggest that this may not be a serious problem. The majority of studies conducted outside the United States included in this review ran control groups which confirmed that in the absence of group pressure, individuals achieve the task with near total accuracy (with the exception of Claeys's, 1967, study in Zaire where control group errors were 15%). This reassures us that accuracy appears to be cross-culturally stable and therefore that the method appears equally appropriate across cultures. Of course, it is still possible to argue that there may be cross-cul- tural differences in the confidence with which judgments are held, and this may in part explain differences in response to group pressure.
Note, though, that whereas the method appears a reliable means of assessing responsiveness to group pressure across cul- tures, it is questionable whether that behavior is always best de- scribed as conformity, given its negative connotations with "yielding," "submission," and so on. Such connotations stem from Western values which stress the importance of self-expres- sion, of stating one's opinion in the face of disagreement with others. In other cultures, however, harmony with others may be valued more highly; agreement in public while privately dis- agreeing may be regarded, for example, as properly displaying tact or sensitivity. Viewed from this perspective, conformity in the Asch ( 1952b, 1956) paradigm may be better described as "tactfulness" or "social sensitivity" and independence as "tact- lessness" or "insensitivity." We have chosen to describe the be- havior as conformity because that is how this area of research is known within social psychology, but in doing so we recognize an inconsistency between describing the behavior in such a way that assumes a set of values, while arguing that the behavior, and its meaning, needs to be understood as stemming at least in part from the values attached to it within a given cultural context. The Asch paradigm may be a fair way of assessing across cul- tures how people respond to a discrepant group judgment, but its description as conformity may not be cross-culturally appropriate.
Theoretical Implications
The nature of the relationship between cultural values and conformity requires further elaboration and investigation. Al- though we have focused on the construct of individualism- collectivism, the question of what are the significant value di- mensions on which cultures vary is a topic of current research
and debate, and individualism-collectivism has been criticized for being a higher order abstraction which flosses over impor- tant distinctions. Triandis et al. (1986), for example, identified four factors within an individual-level measure of individual- ism-collectivism. There are differences between cultures in the nature of collectivism: For example, in Japan it is much more focused o n the work group than in many other cultures (Nakane, 1970); in Chinese societies, it is more strongly asso- ciated with the family (Bond, 1986); and in Latin American cultures, collectivist values find expression in relations between peers (Triandis et al., 1984). Schwartz (1990) pointed out that overall classifications into individualist or collectivist types of- ten obscure important distinctions and that differences between them are not always consistent. He sees his value dimensions as distinct from the individualist-collectivist dimension described by others such as Hofstede (1980) and has chosen to use differ- ent terms to label the dimensions to emphasize this distinctive- ness (Schwartz, 1994). In terms of the present study, it is sig- nificant that measures of individualism-collectivism predicted conformity and, more important, that whereas the measures used were somewhat distinctive both empirically and conceptu- ally, there appears to be a common factor running through them. Individualism-collectivism may be a higher order ab- straction, but it appears nonetheless to capture an important difference between cultures as far as conformity is concerned.
Just how individualism-collectivism relates to the process of social influence requires further clarification. Triandis's (1989) emphasis on cognitive processes suggests one avenue for further research. He distinguishes the private self, the collective self (assessment by the generalized other), and the public self (assessment by a specific reference group) and argues that, in collectivist societies, the collective self is more complex and more frequently sampled, whereas in individualist cultures it is the private self that is more complex and frequently sampled. When the collective self is sampled, the norms and values of the in-group are more salient and individuals are more responsive to whether others are in-group or out-group members. Differ- ences in conformity behavior between collectivist and individu- alist cultures, therefore, might be expected to be due to differ- ences both in values and in what is salient. Moreover, there would be less difference between conditions of public and pri- vate responding in collectivist cultures because of the internal- ization of in-group goals.
Differences in values, and consequently different sources of self-esteem, are discussed also by Markus and Kitayama ( 1991 ), who distinguish an independent from an interdepen- dent construal of self which are differentiated on a number of dimensions potentially relevant to conformity. For example, those with an interdependent (i.e., collectivist ) construal of self are seen as motivated to belong and fit in rather than be unique, to promote others' goals rather than one's own, and to occupy one's proper place. They derive self-esteem from an ability to adjust and to maintain harmony with the social context. The self is construed more in a contextualized manner, by the groups and the settings in which time is spent, rather than as having trans-situational personal qualities (cf. Cousins, 1989). In contrast, those with independent selves derive self-esteem
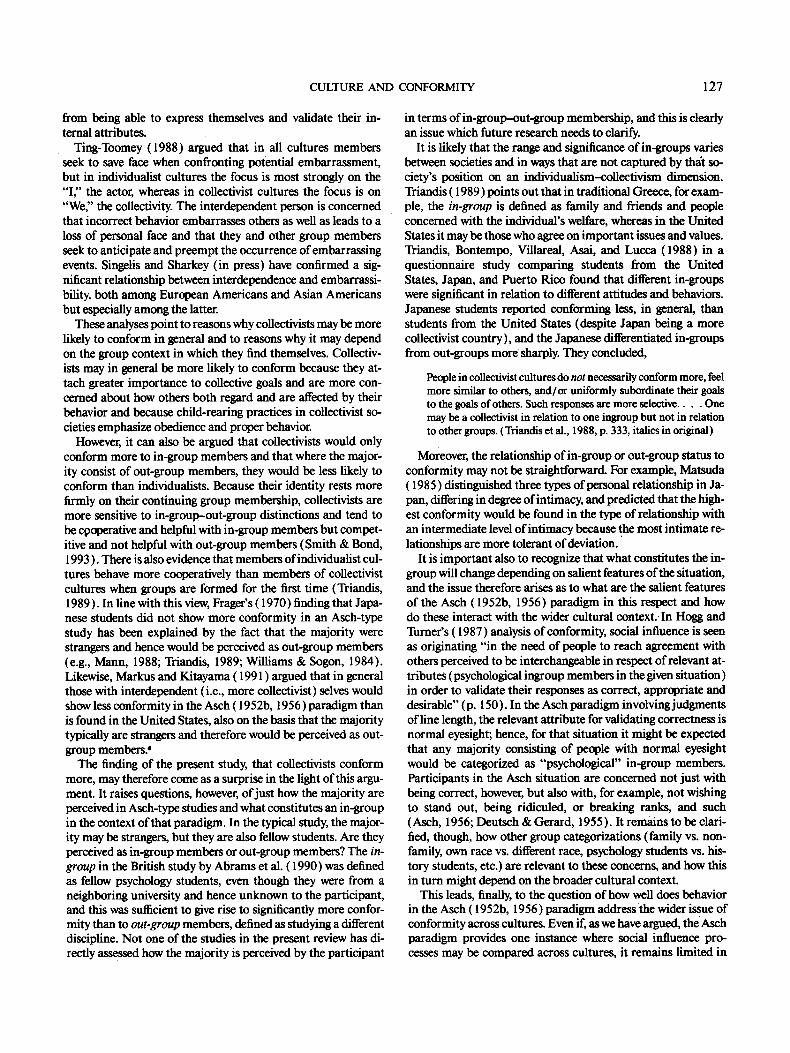
CULTURE AND CONFORMITY 127
from being able to express themselves and validate their in- ternal attributes.
Ting-Toomey (1988) argued that in all cultures members seek to save face when confronting potential embarrassment, but in individualist cultures the focus is most strongly on the " I " the actor, whereas in collectivist cultures the focus is on "We;' the collectivity. The interdependent person is concerned that incorrect behavior embarrasses others as well as leads to a loss of personal face and that they and other group members seek to anticipate and preempt the occurrence of embarrassing events. Singelis and Sharkey (in press) have confirmed a sig- uificant relationship between interdependence and embarrassi- bility, both among European Americans and Asian Americans but especially among the latter.
These analyses point to reasons why collectivists may be more likely to conform in general and to reasons why it may depend on the group context in which they find themselves. Collectiv- ists may in general be more likely to conform because they at- tach greater importance to collective goals and are more con- cerned about how others both regard and are affected by their behavior and because child-rearing practices in collectivist so- cieties emphasize obedience and proper behavior.
However, it can also be argued that collectivists would only conform more to in-group members and that where the major- ity consist of out-group members, they would be less likely to conform than individualists. Because their identity rests more firmly on their continuing group membership, collectivists are more sensitive to in-group-out-group distinctions and tend to be cpoperative and helpful with in-gr0up members but compet- itive and not helpful with out-group members (Smith & Bond, 1993). There is also evidence that members of individualist cul- tures behave more cooperatively than members of collectivist cultures when groups are formed for the first time (Triandis, 1989). In line with this view, Frager's (1970) finding that Japa- nese students did not show more conformity in an Asch-type study has been explained by the fact that the majority were strangers and hence would be perceived as out-group members (e.g., Mann, 1988; Triandis, 1989; Williams & Sogon, 1984). Likewise, Markus and Kitayama ( 1991 ) argued that in general those with interdependent (i.e., more collectivist) selves would show less conformity in the Asch ( 1952b, 1956) paradigm than is found in the United States, also on the basis that the majority typically are strangers and therefore would be perceived as out- group members.'
The finding of the present study, that collectivists conform more, may therefore come as a surprise in the light of this argu- ment. It raises questions, however, of just how the majority are perceived in Asch-type studies and what constitutes an in-group in the context of that paradigm. In the typical study, the major- ity may be strangers, but they are also fellow students. Are they perceived as in-group members or out-gr0uP members? The in- group in the British study by Abrams ct al. (1990) was defined as fellow psychology students, even though they were from a neighboring university and hence unknown to the participant, and this was sufficient to give rise to significantly more confor- mity than to out-group members, defined as studying a different discipline. Not one of the studies in the present review has di- rectly assessed how the majority is perceived by the participant
in terms of in-group-out-group membership, and this is clearly an issue which future research needs to clarify.
It is likely that the range and significance of in-groups varies between societies and in ways that are not captured by thdt so- ciety's position on an individualism-collectivism dimension. Triandis (1989) points out that in traditional Greece, for exam- ple, the in-group is defined as family and friends and people concerned with the individual's welfare, whereas in the United States it may be those who agree on important issues and values. Triandis, Bontempo, Villareal, Asai, and Lucca (1988) in a questionnaire study comparing students from the United States, Japan, and Puerto Rico found that different in-groups were significant in relation to different attitudes and behaviors. Japanese students reported conforming less, in general, than students from the United States (despite Japan being a more collectivist country), and the Japanese differentiated in-groups from out-groups more sharply. They concluded,
People in collectivist cultures do not necessarily conform more, feel more similar to others, and/or uniformly subordinate their goals to the goals of others. Such responses are more selective . . . . One may be a collectivist in relation to one ingroup but not in relation to other groups. (Triandis et al., 1988, p. 333~ italics in original)
Moreover, the relationship of in-group or out-group status to conformity may not be straightforward. For example, Matsuda (1985) distinguished three types of personal relationship in Ja- pan, differing in degree of intimacy, and predicted that the high- est conformity would be found in the type of relationship with an intermediate level of intimacy because the most intimate re- lationships are more tolerant of deviation.
It is important also to recognize that what constitutes the in- group will change depending on salient features of the situation, and the issue therefore arises as to what are the salient features of the Asch ( 1952b, 1956) paradigm in this respect and how do these interact with the wider cultural context. In Hogg and Turner's (1987) analysis of conformity, social influence is seen as originating "in the need of people to reach agreement with others perceived to be interchangeable in respect of relevant at- tributes (psychological ingronp members in the given situation) in order to validate their responses as correct, appropriate and desirable" (p. 150). In the Asch paradigm involving judgments of line length, the relevant attribute for validating correctness is normal eyesight; hence, for that situation it might be expected that any majority consisting of people with normal eyesight would be categorized as "psychological" in-group members. Participants in the Asch situation are concerned not just with being correct, however, but also with, for example, not wishing to stand out, being ridiculed, or breaking ranks, and such (Asch, 1956; Deutsch & Gerard, 1955). It remains to be clari- fied, though, how other group categorizations (family vs. non- family, own race vs. different race, psychology students vs. his- tory students, etc.) are relevant to these concerns, and how this in turn might depend on the broader cultural context.
This leads, finally, to the question of how well does behavior in the Asch ( 1952b, 1956) paradigm address the wider issue of conformity across cultures. Even if, as we have argued, the Asch paradigm provides one instance where social influence pro- cesses may be compared across cultures, it remains limited in
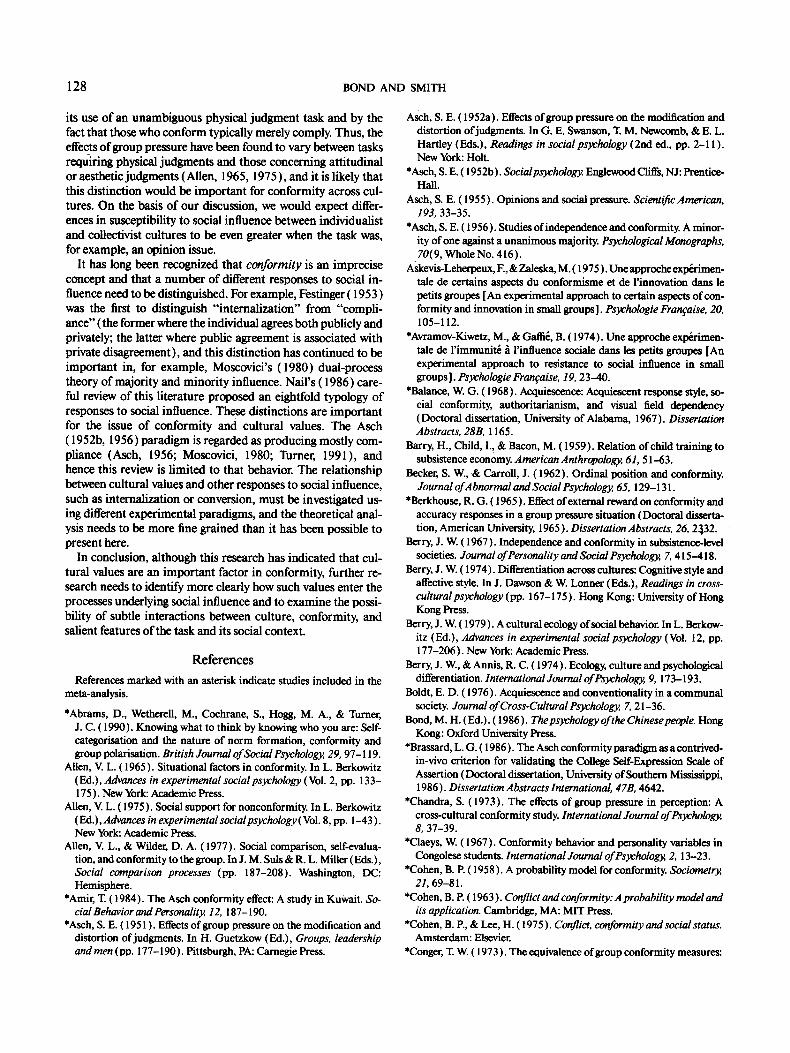
128 BOND AND SMITH
its use of an unambiguous physical judgment task and by the fact that those who conform typically merely comply. Thus, the effects of group pressure have been found to vary between tasks requiring physical judgments and those concerning attitudinal or aesthetic judgments (Allen, 1965, 1975 ), and it is likely that this distinction would be important for conformity across cul- tures. On the basis of our discussion, we would expect differ- ences in susceptibility to social influence between individualist and collectivist cultures to be even greater when the task was, for example, an opinion issue.
It has long been recognized that conformity is an imprecise concept and that a number of different responses to social in- fluence need to be distinguished. For example, Festinger (1953) was the first to distinguish "internalization" from "compli- ance" (the former where the individual agrees both publicly and privately; the latter where public agreement is associated with private disagreement), and this distinction has continued to be important in, for example, Moscovici's (1980) dual-process theory of majority and minority influence. Nail 's (1986) care- ful review of this literature proposed an eighffold typology of responses to social influence. These distinctions are important for the issue of conformity and cultural values. The Asch ( 1952b, 1956) paradigm is regarded as producing mostly com- pliance (Asch, 1956; Moscovici, 1980; Turner, 1991), and hence this review is limited to that behavior. The relationship between cultural values and other responses to social influence, such as internalization or conversion, must be investigated us- ing different experimental paradigms, and the theoretical anal- ysis needs to be more fine grained than it has been possible to present here.
In conclusion, although this research has indicated that cul- tural values are an important factor in conformity, further re- search needs to identify more clearly how such values enter the processes underlying social influence and to examine the possi- bility of subtle interactions between culture, conformity, and salient features of the task and its social context.
References
References marked with an asterisk indicate studies included in the meta-analysis.
*Abrams, D., Wetherell, M., Cochrane, S., Hogg, M. A., & Turner, J. C. (1990). Knowing what to think by knowing who you are: Self- categorisation and the nature of norm formation, conformity and group polarisation. British Journal of Social Psychology,, 29, 97-119.
Allen, V. L. (1965). Situational factors in conformity. In L. Berkowitz (Ed.), Advances in experimental social psychology (Vol. 2, pp. 133- 175 ). New York: Academic Press.
Allen, V. L. ( 1975 ). Social support for nonconformity. In L. Berkowitz (Ed.),Advances in experimental social psychology ( Vol. 8, pp. 1-43 ). New York: Academic Press.
Allen, V. L., & Wilder, D. A. (1977). Social comparison, self-evalua- tion, and conformity to the group. In J. M. Suls & R. L. Miller (Eds.), Social comparison processes (pp. 187-208). Washington, DC: Hemisphere.
*Amir, T. (1984). The Asch conformity effect: A study in Kuwait. So- cial Behavior and Personality, 12, 187-190.
*Asch, S. E. ( 1951 ). Effects of group pressure on the modification and distortion of judgments. In H. Guetzkow (Ed.), Groups, leadership andmen (pp. 177-190). Pittsburgh, PA: Carnegie Press.
Asch, S. E. (1952a). Effects of group pressure on the modification and distortion of judgments. In G. E. Swanson, T. M. Ncwcomb, & E. L. Hartley (Eds.), Readings in social psychology (2nd ed., pp. 2-11 ). New York: Holt.
*Asch, S. E. (1952b). Socialpsychology Englewood Cliffs, NJ: Prentice- Hall.
Asch, S. E. (1955). Opinions and social pressure. Scientific American, 193, 33-35.
*Asch, S. E. ( 1956 ). Studies of independence and conformity. A minor- ity of one against a unanimous majority. Psychological Monographs, 70(9, Whole No. 416).
Askevis-Leherpeux, E, & Zaleska, M. ( 1975 ). Une approche exp~rimen- tale de certains aspects du conformisme et de l'innovation dans le petits groupes [An experimental approach to certain aspects of con- formity and innovation in small groups]. Psychologie Fran~aise, 20, 105-112.
*Avramov-KJwetz, M., & GarliC, B. (1974). Une approche exp~men- tale de l'immunit~ ~ l'influence sociale clans les petits groupes [An experimental approach to resistance to social influence in small groups]. Psychologie Franfaise, 19, 23--40.
*Balance, W. G. (1968). Acquiescence: Acquiescent response style, so- cial conformity, authoritarianism, and visual field dependency (Doctoral dissertation, University of Alabama, 1967 ). Dissertation Abstracts, 28B, 1165.
Barry, H., Child, I., & Bacon, M. (1959). Relation of child training to subsistence economy. American Anthropology, 61, 51-63.
Becket, S. W., & Carroll, J. (1962). Ordinal position and conformity. Journal of Abnormal and SociaI Psychology,, 65, 129-131.
*Berkhonse, R. G. (1965). Effect of external reward on conformity and accuracy responses in a group pressure situation (Doctoral disserta- tion, American University, 1965). Dissertation Abstracts, 26, 2332.
Berry, J. W. (1967). Independence and conformity in subsistence-level societies. Journal of Personality and SociaI Psychology,, 7, 415--418.
Berry, J. W. (1974). Differentiation across cultures: Cognitive style and affective style. In J. Dawson & W. Lonner (Eds.), Readings in cross- culturalpsychology (pp. 167-175). Hong Kong: University of Hong Kong Press.
Berry, J. W. (1979). A cultural ecology of social behavior. In L. Berkow- itz (Ed.), Advances in experimental social psychology (Vol. 12, pp. 177-206). New York: Academic Press.
Berry, J. W., & Annis, R. C. (1974). Ecology, culture and psychological differentiation. International Journal of Psychology,, 9, 173-193.
Boldt, E. D. (1976). Acquiescence and conventionality in a communal society. Journal of Cross-Cultural Psychology,, 7, 21-36.
Bond, M. H. (Ed.). ( 1986 ). The psychology of the Chinese people. Hong Kong: Oxford University Press.
*Brassard, L. G. (1986). The Asch conformity paradigm as a contrived- in-vivo criterion for validating the College Serf-Expression Scale of Assertion (Doctoral dissertation, University of Southern Mississippi, 1986 ). Dissertation Abstracts International, 47B, 4642.
*Chandra, S. (1973). The effects of group pressure in perception: A cross-cultural conformity study. International Journal of Psychology,, 8, 37-39.
*Claeys, W. (1967). Conformity behavior and personality variables in Congolese students. International Journal of Psychology,, 2, 13-23.
*Cohen, B. E ( 1958 ). A probability model for conformity. Sociometry, 21, 69-81.
*Cohen, B. E (1963). Conflict and conformity: A probability model and its application. Cambridge, MA: MIT Press.
*Cohen, B. P., & Lee, H. ( 1975 ). Conflict, conformity and social status. Amsterdam: Elsevier.
*Conger, T. W. ( 1973 ). The equivalence of group conformity measures:

CULTURE AND CONFORMITY 129
Fact or fiction (Doctoral dissertation, Florida State University, 1972). Dissertation Abstracts International, 33B, 2789.
Cooper, H. M. (1979). Statistically combining independent studies: A meta-analysis of sex differences in conformity research. Journal of Personality and Social Psycholo~, 37, 131-146.
*Costanzo, P. R. ( 1970 ). Conformity development as a function of self- blame. Journal of Personality and Social Psychology, 14, 366-374.
*Costanzo, P. R., & Shaw, M. E. (1966). Conformity as a function of age level. Child Development, 37, 967-975.
Cousins, S. D. (1989). Culture and self-perception in Japan and the United States. Journal of Personality and Social Psychology, 56, 124- 131.
*Critehlow, K. E, Herrup, R., & Dabbs, J. M. (1968). Experimenter influence in a conformity situation: Psychological Reports, 23, 408- 410.
Crutehfield, R. S. (1955). Conformity and character. American Psy- chologist, 10, 191-198.
*Cull, J. (1971). Conformity behavior in schizophrenics. Journal of Social Psychology,, 84, 45-49.
*Cull, J. G., & Parker, L. E. ( 1973). Mental retardation and conformity behavior. Training School Bulletin, 69, 168-173.
*Dentseh, M., & Gerard, H. B. ( t 955 ). A study of normative and infor- mational influences upon individual judgment. Journal of Abnormal and Social Psychology, 51, 629-636.
Dindia, IC, & Allen, M. (1992). Sex differences in self-disclosure: A recta-analysis. Ps~/chological Bulletin; 112, 106-124.
*Donas, M., & van Avermaet, E. ( 1981 ). The conformity effect: A time- less phenomenon. Bulletin of the British Psychological Society, 34, 383-385.
*Doms, M., & van Avermaet, E. (1985). Social support and minority influence: The "innovation effect reconsidered. In S. Moscoviei, G. Mugny, & E. van Avermaet (Eds.), Perspectives on minority influence (pp. 53-74). Cambridge, England: Cambridge University Press.
Eagly, A. H. (1978). Sex differences in influenceability. Psychological Bulletin, 85, 86-116.
Eagly, A. H., & Carli, L. L. ( 1981 ). Sex of researchers and sex-typed communications as determinants of sex differences in influenceabil- ity: A meta-analysis of social influence studies. Psychological Bulle- tin, 90, 1-20.
Engly, A. H., Makhijani, M. G., & Klonsky, B. G. (1992). Gender and the evaluation of leader~ A meta-an~ysis. Psychological Bulletin, I lL 3-22.
Eagly, A. H., & Wood, W. (1994). Using research synthesis for future research. In H. Cooper & L. V. Hedges (Eds.), Handbook of research synthesis (pp. 485-500 ). New York: Russell Sage Foundation.
*Feldman, M. J., & Goldfried, M. R. (1962). Validity of group judg- ment as a factor affecting independent and conformity behavior. Journal of Social Psychology,, 58, 289-294.
Festinger, L. (1953). An analysis of compliant behavior. In M. Sherif & M. O. Wilson (Eds.), Group relations at the crossroads (pp. 232- 256). New York: Harper.
*Frager, R. (1970). Conformity and anti-conformity in Japan. Journal of Personality and Social Psychology,, 15, 203-210.
Friend, R., Rafferty, Y., & Bramel, D. (1990). A puzzling misinter- pretation of the Asch conformity study. European Journal of Social Psychology,, 20, 29--44.
Fumham, A. ( 1984 ). Studies of cross-cultural conformity: A brief and critical review. Psychologia, 27, 65-72.
Gerard, H. B. (1953). The effect of different dimensions of dis- agreement on the communication process in small groups. Human Relations, 6, 249-271.
*Gerard, H. B., & Rotter, G. S. ( 1961 ). Time perspective, consistency
of attitude, and social influence. Journal of Abnormal Social Psychol. og~, 62, 565-572.
*Gerard, H. B., Wilhelmy, R. A., & Conolley, E. S. (1968). Conformity and group size. Journal of Personality and Social Psycholo~, 8, 79- 82.
*Gorfein, D. ( 1961 ). Conformity behavior and the "authoritarian per- sonality:' Journal of Social Psychology, 53, 121-125.
*qorfein, D., Kindrick, T., Leland, Q., MeAvoy, M. E., & Barrows, J. (1960). Cognitive dissonance and yielding behavior. Journal of Psy~ cholo~, 50, 205-208.
*Gould, L. J. (1969). Conformity and marginality: Two faces of alien- ation. Journal of Social Issues, 25, 39--63.
Green, B. A. (1967). Concern about emotional alienation: A motive for conformity (Doctoral dissertation, University of Michigan, 1966). Dissertation Abstracts, 27B, 3671.
Gruen, W. ( 1961 ). Internal and external conformity and some common American attitudes. Psychological Reports, 8, 368.
Harris, P. R. (1985). Asch's data and the 'Asch effect': A critical note. British Journal of Social Psychology, 24, 229-230.
*Hatcher, J. (1982). Arousal and conformity. In H. Braudstatter, J. H . Davis, & G. Stocker-Kreiehgauer (Eds.), Group decision-making ( pp. 453-472). London: Academic Press.
Hedges, L. V. (1986). Issues in meta-analysis. In E. Rothkopf (Ed.), Review of research in education (Vol. t3, pp. 353-398). Washington, DC: American Research Association.
Hedges, L. V. (1987). How hard is hard science, how soft is soft science? The empirical cumulativeness of research. American Psychologist, 42, 443-455.
Hedges, L. V,, & Olkin, I. (1985). Statistical methods for meta-analysis. San Diego, CA: Academic Press.
Hofstede, G. (1980). Cultures consequences: International differences in work-related values. Beverly Hills, CA: Sage.
Hofstede, G. (1983). Dimensions of national cultures in fifty countries and three regions. In J. Deregowski, S. Dzuirawiec, & R. Annis (Eds.), Explications in cross-cultural psychology (pp. 335-355). Lisse, The Netherlands: Swets & Zeitlinger.
Hofstede, G. ( 1991 ). Cultures and organisations: Software of the mind. London: McGraw-HiU.
Hngg, M. A., & Turner, J. C. (1987). Social identity and conformity: A theory of referent informational influence. In W. Doise & S. Mosco- viei ( Eds.), Current issues in European social psychology ( Vol. 2, pp. 139-182). Cambridge, England: Cambridge University Press.
Holmes, C. T (1984). Effect size estimation in meta-analysis. Journal of Experimental Education, 52, 106-109.
*Hornik, J. A. (1974). Conformity, consistency and commitment: An investigation of a formal theoretical model of decision-making pro- eesses in social situations (Doctoral dissertation, University of Illi- nois, 1971 ). Dissertation Abstracts Imernational, 34B, 854.
*Horowitz, I. A., & Rothschild, B. H. ( 1970 ). Conformity as a function of deception and role playing. Journal of Personality and Social Psy- chology, 14, 224-226.
Huang, L. C., & Harris, M. B. (1973). Conformity in Chinese and Americans: A field experiment. Journal of Cross-Cultural Psychol- ogy, 4, 427-434.
Hunt, R. G., Goldberg, S., Meadow, A., & Cohen, W. (1958). Some demographic factors in conforming behavior. Sociology and Social Research, 42, 196-198.
Iscoe, I., Williams, M., & Harvey, J. (1964). Age, intelligence, and sex as variables in the conformity behavior of Negro and White children. Child Development, 35, 451-460.
Johnson, N. L., & Welch, B. L. (1940). Applications of the noneentral t-distribution. B iometrika, 31, 362-389.
Johnson, R. W., & MaeDonnell, J. (1974). The relationship between
130 BOND AND SMITH
conformity and male and female attitudes toward women. Journal of Social Psychology, 94, 155-156.
*Kagan, J., & Mussen, P. H. (1956). Dependency themes on the TAT and group conformity. Journal of Consulting Psychology,, 20, 29-32.
Kagitcibasi, C., & Berry, J. W. (1989). Cross-cultural psychology: Cur- rent research and trends. AnnualReview of Psychology,, 40, 493-531.
*Kidd, A. H., & Karpan, M. M. (1967). Responses of prisoners to so- cial pressure. PsychologicalReports, 20, 47--49.
Kim, U., Triandis, H. C., Kngiteibasi, C., Choi, S. C., & Yoon, G. (Eds.). (1994). Individualism and collectivism: Theory, method and applica- tions. Thousand Oaks, CA: Sage.
Lalancette, M., & Standing, L. (1990). Asch fails again. Social Behavior and Personality, 18, 7-12.
*Lamb, T. A., & Alsifaki, M. (1980). Conformity in the Asch experi- ment: Inner-other directedness and the defiant subject. SociaIBehav- ior and Personality, 8, 13-16.
*Larsen, K. S. (1974). Conformity in the Asch experiment. Journal of Social Psychology,, 94, 303-304.
Larsen, K. S. (1982). Cultural conditions and conformity: The Asch effect. Bulletin of the British Psychological Society, 35, 347.
*Larsen, K. S. (1990). The Asch conformity experiment: Replication and transhistorical comparisons. Social Behavior and Personality, 5, 163-168.
*Larsen, K. S., Triplet't, J. S., Brant, W. D., & Langenberg, D. (1979). Collaborator status, subject characteristics and conformity in the Asch paradigm. Journal of Social Psychology,, 108, 259-263.
Latant, B. ( 1981 ). Psychology of social impact. American Psychologist, 36, 343-356.
Latant, B., & Wolf, S. ( 1981 ). The social impact of majorities and mi- norities. Psychological Review, 88, 438--453.
*Levy, L. (1960). Studies in conformity. Journal of Psychology, 50, 39- 41.
*Liberman, D., & Meyerhoff, M. K. (1986). Differential conformity rates to perceptual and logical tasksl Journal of Social Psycholog3¢, 126, 273-275.
*Linde, T. E, & Patterson, C. H. (1964). Influence of orthopedic dis- ability on conformity behavior. Journal of Abnormal and Social Psy- chology 68, 115-118.
*Long, H. B. (1967). Relationships between conforming judgment and employee rank and between conforming judgment and dogmatism in an employee group (Doctoral dissertation, Florida State University, 1966 ). Dissertation Abstracts, 27A, 2616.
*Long, H. B. (1970). Relationships of selected personal and social vari- ables in conforming judgment. Journal of Social Psychology,, 81, 177-182.
*Long, H. B. (1972). Differences between content conformity and vi- sual conformity. Adult Education, 22, 282-290.
Maloff, M., & Lott, A. J. (1962). Ethnocentrism and the acceptance of Negro support in a group pressure situation. Journal of Abnormal and Social Psychology,, 65, 254-258.
Mann, L. (1980). Cross-cultural studies of small groups. In H. C. Tri- andis & R. Brislin (Eds.), Handbook of cross-cultural psychology (Vol. 5, pp. 155-209). Boston, MA: Allyn & Bacon.
Mann, L. (1988). Culture and conformity. In M. H. Bond (Ed.), The cross-cultural challenge to social psychology (pp. 184-187). New- bury Park, CA: Sage.
Markus, H., & Kitayama, S. ( 1991 ). Culture and the self: Implications for cognition, emotion, and motivation. Psychological Review,, 98, 224-253.
*Marsella, A. J. (1969). Conformity and psychopathology (Doctoral dissertation, Pennsylvania State University, 1968). Dissertation Ab- stracts, 29B, 3917.
Matsuda, N. ( 1985 ). Strong, quasi- and weak conformity among Japa-
nese in the modified Asch procedure. Journal of Cross-Cultural Psy- chology, 16, 83-97.
*McKissack, I. J. ( 1971 ). Conformity in Ghana. British Journal of So- cial and Clinical Psychology,, 10, 87.
Meade, R. D., & Barnard, W. (1973). Conformity and anticonformity among Americans and Chinese. Journal of Social Psychology, 89, 15- 25.
Mertesdorf, E, Lueck, H. E., & Timaeus, E. (1969). Heartrate in an Asch-type conformity situation. Perceptual and Motor Skills, 29, 565-566.
Milgram, S. (1961 ). Nationality and conformity. Scientific American, 205, 45-51.
*Moeller, G., & Applezweig, M. H. (1957). A motivational factor in conformity. Journal of Abnormal and Social Psychology,, 55, 114- 120.
Moscovici, S. (1976). Social influence and social change. London: Aca- demic Press.
Moscovici, S. (1980). Towards a theory of conversion behavior. In L. Berkowitz (Ed.), Advances in experimental social psychology ( Vol. 13, pp. 209-239). New York: Academic Press.
Moscovici, S. (1985). Social influence and conformity. In G. Lindzey & E. Aronson (Eds.), The handbook of social psychology ( Vol. 2, 3rd ed., pp. 347-412). New York: Random House.
Mugny, G. (1984). Compliance, conversion and the Aseh paradigm. European Journal of Social Psychology,, 14, 353-368.
Mugny, G. (1985). Direct and indirect influence in the Asch paradigm: Effects of'valid' or 'denied' information. Europetm Journal of Social Psychology, 15, 457-461.
Munroe, R. L., Munroe, R. H., & Daniels, R. E. (1973). Relation of subsistence economy to conformity in three East African societies. Journal of Social Psychology,, 89, 149-150.
Nail, P. R. (1986). Toward an integration of some models and theories of social response. Psychological Bulletin, 100, 190-206.
Nakane, C. (1970). Japanese society London: Weidenfeld and Nicholson.
*Neto, E (1995). Conformity and independence revisited. Social Be- havior and Personality, 23, 217-222.
*Nicholson, N., Cole, S. G., & Rocklin, T. (1985). Conformity in the Asch situation: A comparison between contemporary British and US university students. British Journal of Social Psychology, 24, 59-63.
*Nikols, S. A. (1965). A study of the additivity of variables influencing conformity ( Doctoral dissertation, University of Florida, 1964). Dis- sertation Abstracts, 25, 6095.
Owen, D. B. (1968). A survey of properties and applications of the noncentral t-distribution. Technometrics, 10, 445--478.
Peabody, D. (1985). National characteristics. Cambridge, England: Cambridge University Press.
Perrin, S., & Spencer, C. P. (1980). The Aseh effect--A child of its time? Bulletin of the British Psychological Society, 32, 405-406.
*Perrin, S., & Spencer, C. P. ( 1981 ). Independence or conformity in the Asch experiment as a reflection of cultural and situational factors. British Journal of Social Psychology, 20, 205-210.
Phelps, R. E., & Meyer, M. E. (1966). Personality and conformity, and sex differences. Psychological Reports, 18, 730.
*Pollis, N. P., & Cammalleri, J. A. (1968). Social conditions and differ- ential resistance to majority pressure. Journal of Psychology, 70, 69- 76.
*Reitan, H. T., & Shaw, M. E. (1964). Group membership, sex-compo- sition of the group, and conformity behavior. Journal of Social Psy- chology, 64, 45-51.
Riesman, D., Glazer, N., & Denney, R. (1950). The lonely crowd: A study of the changing American character. New Haven, CT: Yale Uni- versity Press.
CULTURE AND CONFORMITY 131
*Rodrigues, A. (1982). Replication: A neglected type of research in social psychology. Revista InterAmericana de Psicologia, 16, 91-109.
*Rotter, G. S. (1967). An experimental evaluation of group attractive- ness as a determinant of conformity. Human Relations, 20, 273-281.
*Ryan, J. H. (1983). The relationship between ego identity status, con- formity behavior, and personality in college students (Doctoral dis- sertation, Utah State University, 1982). Dissertation Abstracts In- ternational, 44B, 3541.
Schneide~ E W. (1970). Conforming behavior of Black and White chil- dren. Journal of Personality and Social Psychology,, 16, 466-471.
*Schulman, G. I. (1967). Asch conformity studies: Conformity to the experimenter and/or to the group? Sociometry, 30, 26--40.
*Schuman, H. M. (1970). Social conformity and relative prestige (Doctoral dissertation, Claremont Graduate School and University Center, 1968 ). Dissertation Abstracts International, 3011, 374.
Schwartz, S. H. (1990). Individualism-collectivism: Critique and pro- posed refinements. Journal of Cross-Cultural Psychology,, 21, 139- 157.
Schwartz, S. H. (1992). The universal content and structure of values: Theoretical advances and empirical tests in 20 countries. In M. Zanna (Ed.), Advances in experimental social psychology ( Vol. 25, pp. 1-65). New York: Academic Press.
Schwartz, S. H. (1994). Cultural dimensions of values: Towards an un- derstanding of national differences. In U. Kim, H. C. Triandis, C. Kagitcibasi, S. C. Choi, & G. Yoon (Eds.), Individualism and collec- tivism: Theory, method and applications (pp. 85-119). Thousand Oaks, CA: Sage.
*Seaborne, A. E. M. (1962). Group influence on the perception of am- biguous stimuli. British Journal of Social Psychology,, 53, 287-298.
Shames, M. L. ( 1981 ). Hypnotic susceptibility and conformity: On the mediational mechanisms of suggestibility. PsychologicaIReports, 49, 563-566.
Singelis, T M., & Sharkey, W. F. (in press). Culture, self-construal and embarrassability. Journal of Cross-Cultural Psychology.
Sistrunk, F. (1971). Negro-White comparisons in social conformity. Journal of Social Psychology,, 85, 77-85.
Sistrunk, E, & Clement, D. E. (1970). Cross-cultural comparisons of the conforming behavior of college students. Journal of Social Psy- chology, 82, 273-274.
Sistrunk, E, Clement, D. E., & Guenther, Z. C. ( 1971 ). Developmental comparisons of conformity across two cultures. Child Development, 42, 1175-1185.
Smith, P. B., & Bond, M. H. (1993). Socialpsychology across cultures: Analysis and perspectives. New York: Harvester Wheatsheaf.
Smith, P. B., Dngan, S., & Trompenaars, E (in press). National culture and the values of organisational employees: A dimensional analysis across 43 nations. Journal of Cross-Cultural Psychology.
*Stamps, L. W., & Teevan, R. C. (1974). Fear of failure and conformity in the Asch and Crutchfield situations. Psychological Reports, 34, 1327-1330.
Stricker, L. J., Messick, S., & Jackson, D. N. (1967). Suspicion of de- ception: Implications for conformity research. JournalofPersonality and Social Psychology,, 5, 379-389.
Tanford, S., & Penrod, S. (1984). Social influence model: A formal integration of research on majority and minority influence processes. Psychological Bulletin, 95, 189-225.
*Timaeus, E. (1968). Untersuchungen zum sngennanten konformen verhalten [Studies on conformity behavior]. Zeitschriftfiir Experim- entelle und Angewandte Psychologie, 15, 176-194.
Ting-Toomey, S. (1988). A face negotiation theory. In Y. Y. Kim & W. B. Gudykunst (Eds.), Theories in intercultural communication (pp. 213-238). Newbury Park, CA: Sage.
*Toder, N. L., & Marcia, J. E. (1973). Ego identity status and response to conformity pressure in college women. Journal of Personality and Social Psychology, 26, 287-294.
Triandis, H. C. (1989). The self and social behavior in different cultural contexts. Psychological Review, 96, 506-520.
Triandis, H. C. (1990). Cross-cultural studies of individualism and col- lectivism. In J. J. Berman (Ed.), Nebraska Symposium on Motivation 1989, 37, 41-133.
Triandis, H. C., Bontempo, R., Betancourt, H., Bond, M., Leung, IC, Brenes, A., Georgas, J., Hui, C. H., Matin, G., Setiadi, B., SJnha; J. P. B., Verman, J., Spangenberg, J., Touzard, H., & de Montmoflin, G. (1986). The measurement of the eric aspects of individualism and collectivism across cultures. Australian Journal of Psychology,, 38, 257-267.
Triandis, H. C., Bontempo, R., Villareal, M., Asai, M., & Lucca, N. (1988). Individualism-collectivism: Cross-cultural perspectives on self-in-group relationships. Journal of Personality and Social Psy- chology, 54, 323-338.
Triandis, H. C., Leung, K., Villareal, M. J., & Clack, E L. (1985). AI- locentric and idioeentric tendencies: Convergent and discrimiuant validation. Journal of Research in Personality, 19, 395--415.
Triandis, H. C., Marin, G., Lisansky, J., & Betancourt, H. (1984). Sim- patla as a cultural script of Hispanics. Journal of Personality and Social Psychology,, 47, 1363-1375.
Trompenaars, E (1993). Riding the waves of culture. London: Econo- mist Books.
Turner, J. C. ( 1991 ). Social influence. Milton Keynes, England: Open • University Press.
*Vine, I. ( 1981 ). [Letter to the editor]. Bulletin of the British Psycho- logical Society, 34, 145.
*Vlaander, G., & van Rooijen, L. ( 1985 ). Independence and conformity in Holland: Asch's experiment in Holland three decades later. Ge- drag, 13, 49-55.
*Wagner, P. J., & Shaw, M. E. (1973). Effects of the subject's awareness of the nature of the experiment upon conformity behavior. Bulletin of the Psychonomic Society, 1, 235-237.
Whitman, J. R. ( 1961 ). Responsiveness to social pressure in schizo- phrenia. Psychological Reports, 8, 238.
*Whittaker, J. O., & Meade, R. D. (1967). Social pressure in the modi- fication and distortion of judgment: A cross-cultural study. Interna- tional Journal of Psychology,, 2, 109-113.
*Whittaker, J. O., Rosenan, C. D., Farnsworth, H., & Grosz, R. (1957). A repetition of Asch's effects of group pressure on modification and distortion ofjudgrnents. Perceptual and Motor Skills, 7, 245.
Wiesenthal, D. L., Koza, P., Edwards, J., Walton, A., Endlet; N. S., & Enimott, S. (1978). Trends in conformity research. Canadian Psy- chologicalRevie~, 19, 41-58.
*Williams, T P., & Sogon, S. (1984). Group composition and conform- ing behavior in Japanese students. Japanese PsychologicalResearch, 26, 231-234.
Wood, W., Lundgren, S., Ouellette, J. A., Busceme, S., & Blackstone, T (1994). Minority influence: A recta-analytic review of social influ- ence processes. Psychological Bulletin, 115, 323-345.
Yang, K. S. (1988). Will societal modernisation eventually eliminate cross-cultural psychological differences? In M. H. Bond (Ed.), The cross-cultural challenge to social psychology (pp. 67-85). Newbury Park, CA: Sage.
(Appendix A follows on next page)
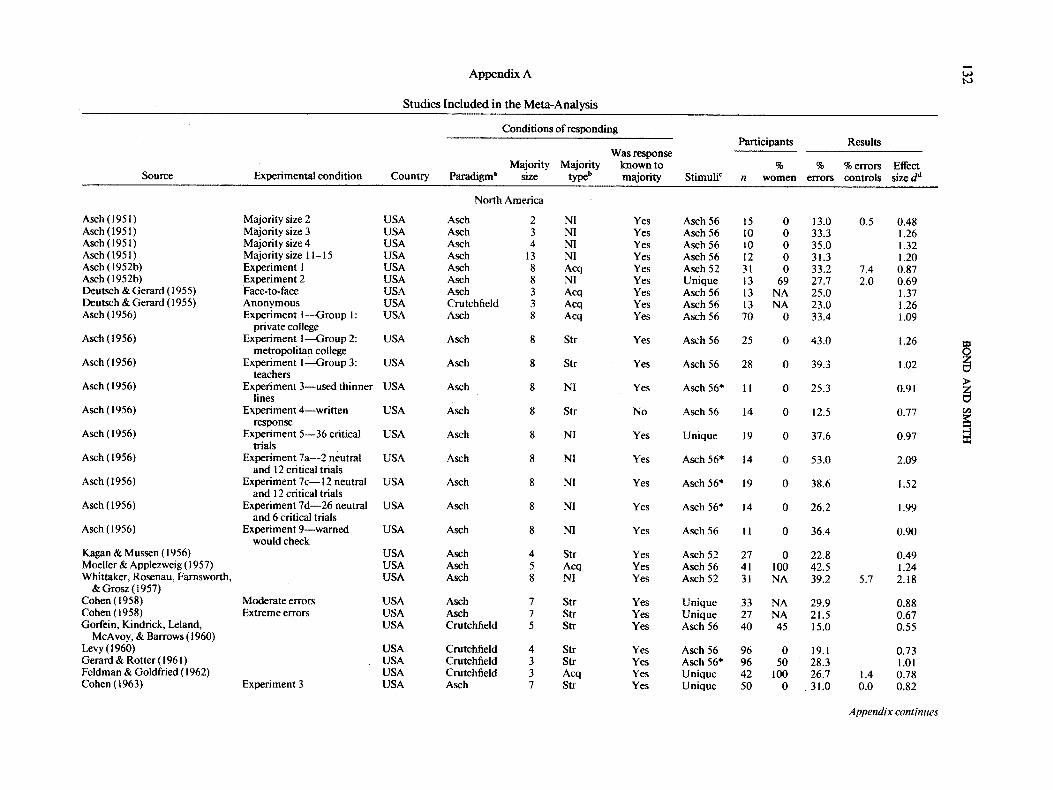
132 B
ON
D A
ND
SMITH
<
=
f~ ¸
~8 =1
~. =.g N
0
"0
o
'1::
0
~-
~~
-~
~
~ ~
~ ~
~- ~
~ ~
~ N
~ ~
~-~
• <<<
<<
<
<
< <
< <
< <
< <
<<
<
~<
<
<~
Z Z
Z Z
Z ~
~ ~
~<
~
E < o
<<
<<
<<
<~
<
< <
<<
<
< <
< <
<<
<
<<
~
~<
~<<~<<~~ ~
~ ~<
~< ~<
~< ~<
~< ~<
~< ~
~ ~<<<<
0 0
~- 0
" "~
o
~ ~
~"
m
........ ~,~-
~,~ ~
~ ~
,., ~ ~
~. ~ ~L. = -
~. ~ ~.
<<
<<
<<
~<
<
< <
< <
< <
< <
~ .-~ ~ ,,.~ .=
~
¢~-.~ =
~,. ;:~ ..~. oo oo
="~
0
',.J o'~
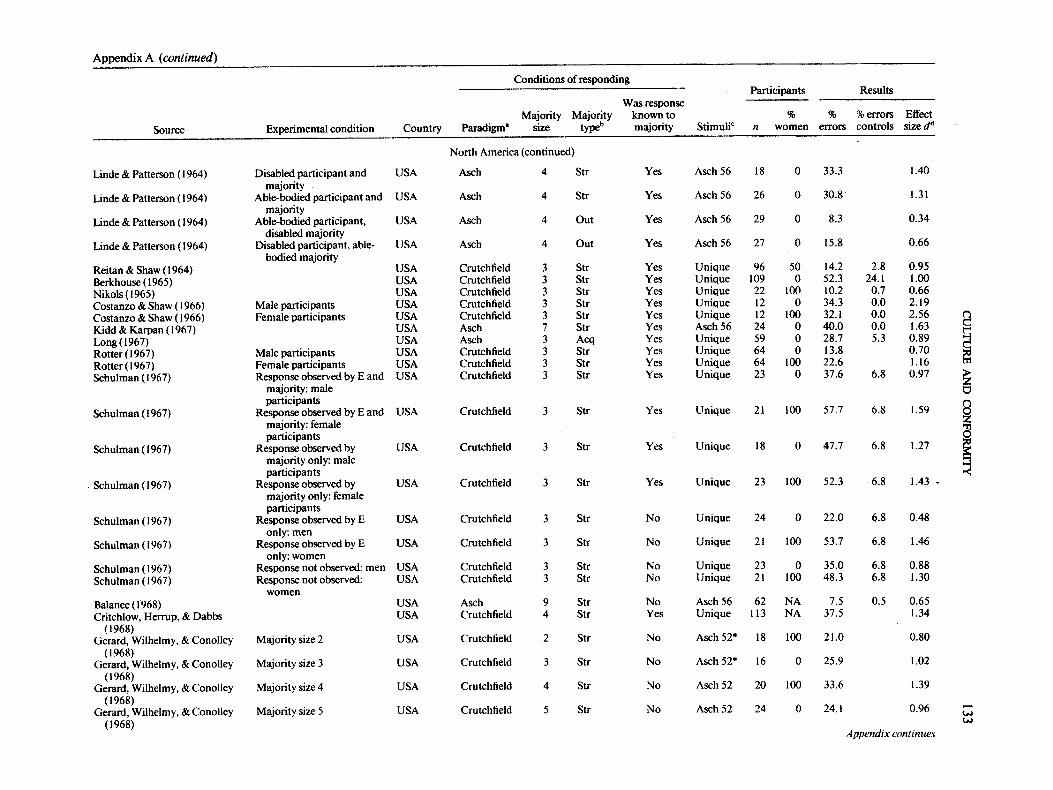
CU
LT
UR
E
AN
D
CO
NFO
RM
ITY
133
< <
N
N .~o N
u 0
~0 0 o
U~
0
• ~
..
..
..
..
~
. .
c~ c~
,,,"~ oo r-.. r..-
up; c~
.,¢
N N
~ ~
'N'N
'N'E
'E
N'N
'E'E
'E
"= "E
< <
< <
~~
<~
~
o _~
°~_ ~
_~ o
~ o
;= .o-
0 0
0 ~
0 ~
0 0
0 0
Z Z
ZZ Z>~
Z Z
Z Z
0 v Z
r./3
"0
2 u
-o -~
-,o_~ "o
~ "~
",o _
< (/3 <
~ ~
<<
<
~ <
<
== • ~
g ~
~ ~
~ ~
~ .,~..
~ >,'~
>. "~
• - .~'-E..~
=,~ =,.~
o =.~
o =.~
=.~ E
o o
o oX
o ~
o.
_
c~ ~ ~
" o.~
~ o. ~-
= o
,~- "
o,- ~ =
~.-" ¢=
~=
~
¢= "~
'~'"r'~
' ,
~J.%
'~
~ ~
~ ~
~o ~
0 ~
O O
~0~ ~
~ o~
r"
~= E
E E
*'~
2 2
2 2

134 BO
ND
AN
D SM
ITH
< <
i"
~.~
.o 8 ua
.o 0 r~
• .
:.: .
..
..
..
~
~~
°~
:~
~
~ ~
g~
e~
0 o
0 < <
~-
-~
-~
~
- ~
~ ~
~-
~
~ -
~
z
o ~
ZZ
~- ~
~
<<
<~
<
<<
<<
<<
<<
<0
0<
<~
<<
<<
<
< <
~<
<
< ~
<<<<<<<<<<<<~<<<<<<<<<<<<<<<< <
< <
<<<<
o2
• ,- .'~' "~ '~" ~
E
~.1~ ~. >
,~
~.~
.~'~
' E
~ ~.
"~ ~.
• •
• o~ 'o~
'~-~-~ '
~~
~
-~'~ ~
~ '~a'~
'~''~''~ ~"
~" ~E-~,~±
,C ,,~ .r-, ~
.r', ~ .C
~ '~
'~ oo oo
~: ~:
~o
',
~o
~
~-
-~
"-
-
~"~
.
..
..
..
-
~ ~
. ~
o~
o~
o~
- r'- o~ .....
~-
-~
-~
" ~
" ~"
~5~" ~5 ~ ~
'°~
_ ,.o
o
~4~
_ 0
0 0
0 0
0 0
0 O
0
~0
~
~
0
O0
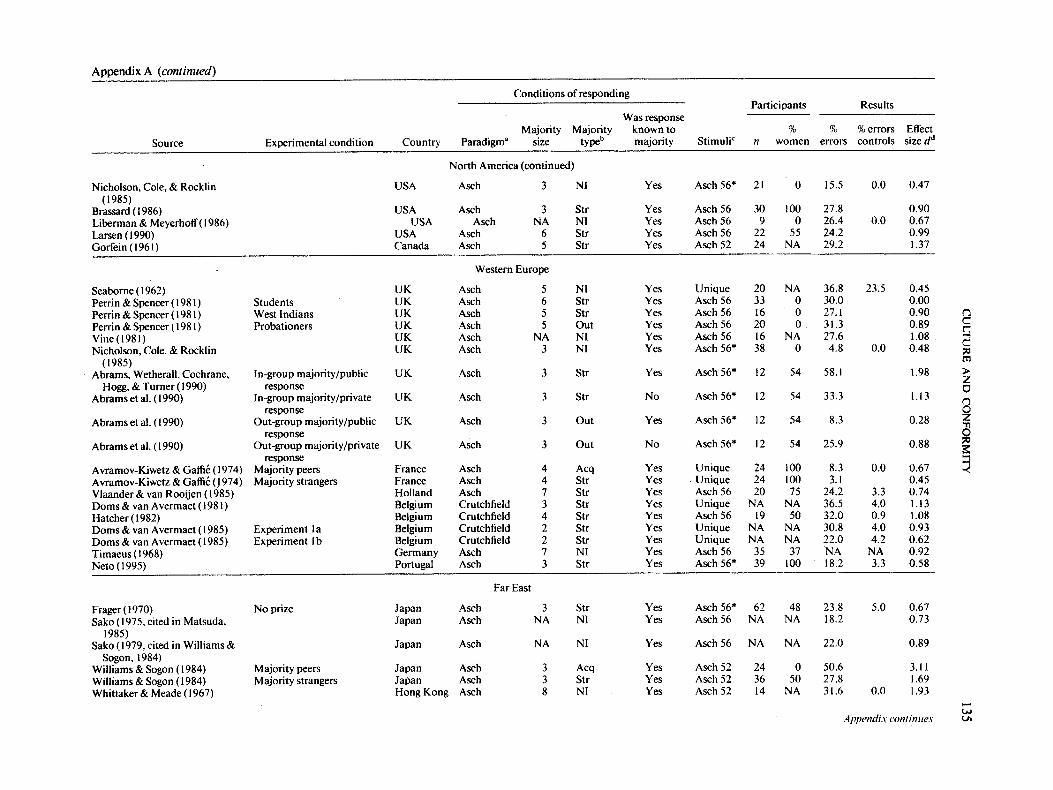
CULTURE A
ND CONFORMITY
135
v
o"~
~8 E
• 0
~
~- o'~
~e
N
"i~ aa
0 N
-~, -~
O.
0 o c- O
0 c;
0
.a
Z
oo
o-
< <<<<
~Z~
Z
< <
<<
<~
o0
v
o o
~o
~'
~
~
z z
"E~
~
~ ~
~
~~
~
z ~
Z
~o
~
~ ~
0 0
Z
<<<<<< <
< <
<
N N
0 0
d
~O
~Z
~
'~'~
'~'~
'~
--
.~ -r,
~EN
~Z Z
~Z
<< <
<<<
Z Z
0
e~ o
o o
'~' '~' Z
~
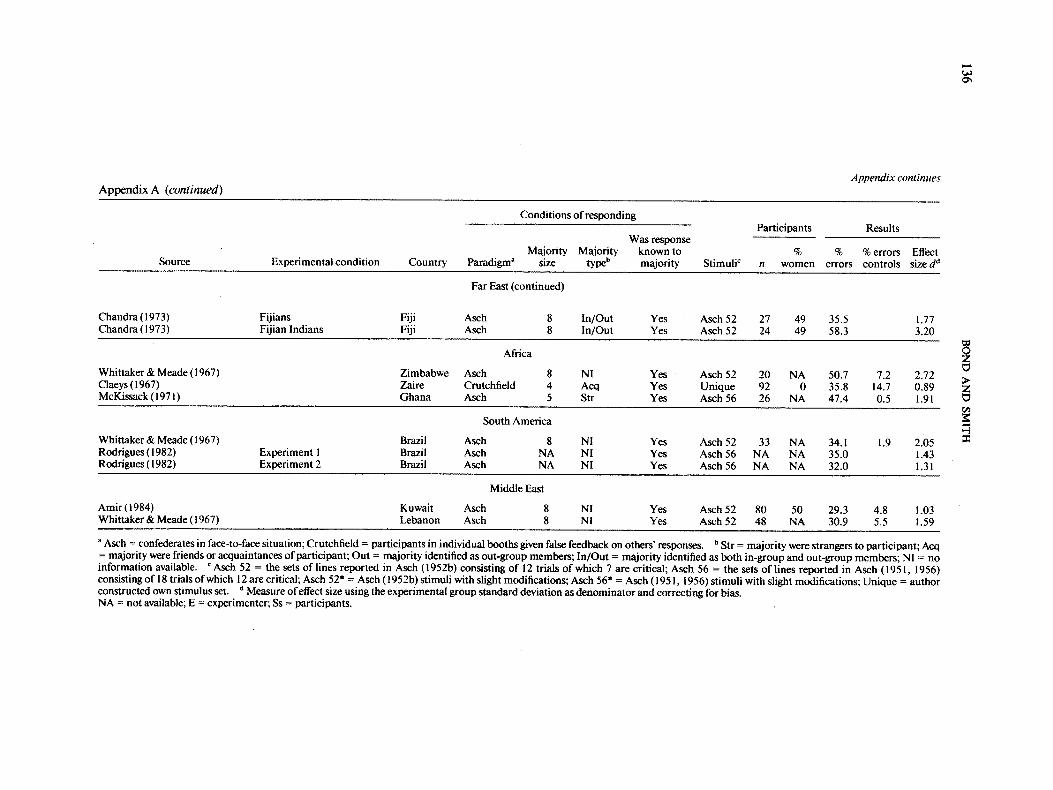
136 B
ON
D A
ND
SMITH
...!
ETa., N
~g r~
0
;8 0 c;
0
m m
t",l ¢',1
C'q ¢'.1 e.
e.
<<
o.o
gg,
e.. ,...
~ ,,4 t--
t¢'l e.~ ,~1-
Z Z
.~'{
o~
ca
e,i -d -.:
',~1" u"~ cq
<<< Z
ZZ
~<< Z
Z
<<
<
~<< .<~
ZZ
<<< rn~ .ii
~Z- ~ ,
~.=_ g
0,-
~ 0
c; ~
~~ ,~ ~ I1
N~X
E~
.~ ~'~'~ ~
"~0 ~,?,~
.- ~ ~
~
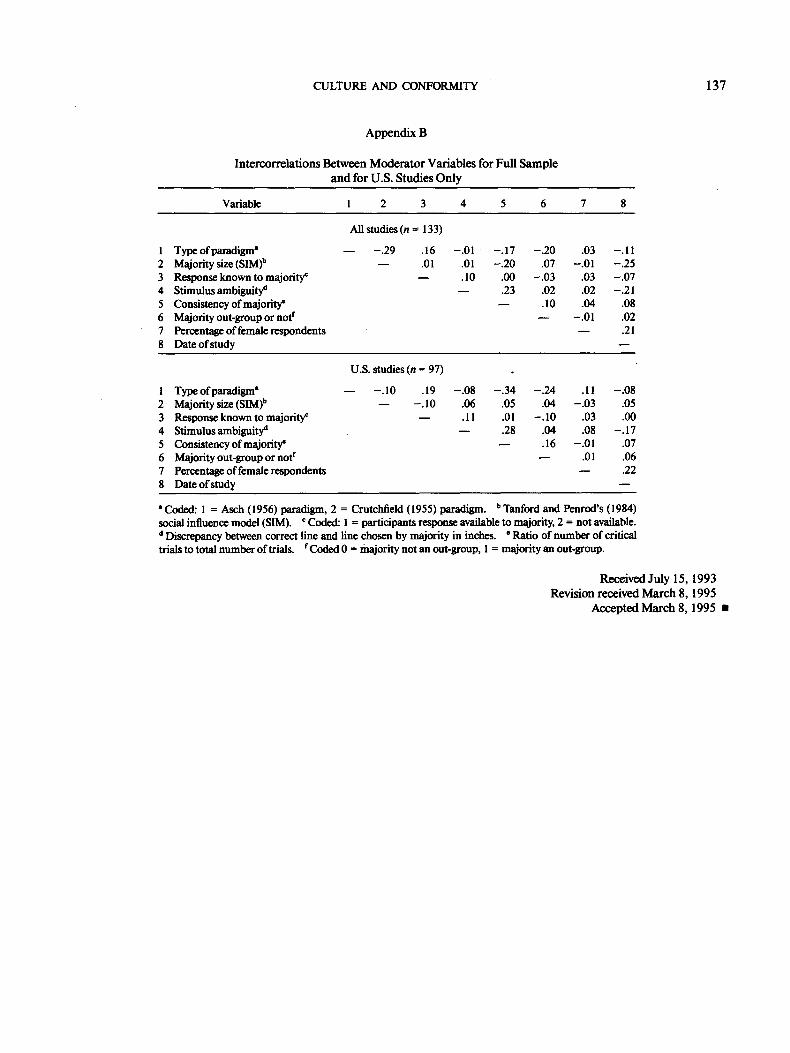
CULTURE AND CONFORMITY 137
Appendix B
I n t e r c o r r e l a t i o n s B e t w e e n M o d e r a t o r Var iab les for Ful l S a m p l e a n d for U.S . S tud ies O n l y
Variable 1 2 3 4 5 6 7 8
All studies (n = 133)
1 Type o f paradigm j - - - . 2 9 .16 - .01 - . 1 7 - . 2 0 .03 - .11 2 Majority size (SIM) b - - .01 .01 - . 2 0 .07 - .01 - . 25 3 Response known to majority ~ - - .10 .00 - . 0 3 .03 - . 0 7 4 Stimulns ambiguity d - - .23 .02 .02 - .21 5 Consistency of majority ~ - - .10 .04 .08 6 Majority out-group or not f m - .01 .02 7 Percentage of female respondents ~ .21 8 Date o f study
U.S. studies (n = 97)
1 Type o f paradigm a - - - . 1 0 .19 - . 0 8 - . 3 4 - . 2 4 .11 - . 0 8 2 Majority size (SIM) b - - - . 10 .06 .05 .04 - . 0 3 .05 3 Response known to majority" - - .11 .01 - . 1 0 .03 .00 4 Stimulns ambiguity a m .28 .04 .08 - . 1 7 5 Consistency of majority ~ m .16 - .01 .07 6 Majority out-group or not f ~ .01 .06 7 Percentage o f female respondents ~ .22 8 Date o f study
"Coded: 1 = Aseh (1956) paradigm, 2 = Crutehfield (1955) paradigm, b Tanford and Penrod's (1984) social influence model (SIM). c Coded: 1 = participants response available to majority, 2 = not available. d Discrepancy between correct line and line chosen by majority in inches. , Ratio of number o f critical trials to total number of trials, fCoded 0 = majority not an out-group, 1 = majority an out-group.
Rece ived Ju ly 15, 1993 Rev i s ion rece ived M a r c h 8, 1995
A c c e p t e d M a r c h 8, 1995 •
International Journal of Public Opinion Research Vol. 28 No. 1 2016! The Author 2015. Published by Oxford University Press on behalf of The World Associationfor Public Opinion Research. All rights reserved.doi:10.1093/ijpor/edu041 Advance Access publication 19 February 2015
Off the Fence, Onto the Bandwagon? A Large-Scale
Survey Experiment on Effect of Real-Life Poll
Outcomes on Subsequent Vote Intentions
Tom W. G. van der Meer, Armen Hakhverdian and
Loes AalderingDepartment of Political Science, University of Amsterdam
Abstract
Despite decades of scholarly inquiry, the debate on the existence of a bandwagoneffect in politics remains undecided. This article aims to overcome the limitations ofprevious experimental and survey research. We test to what extent success in real-lifepolling outcomes of the previous weeks influences subsequent vote intentions. To thisend, we designed a large-scale survey experiment among a diverse cross-section of theDutch electorate (N¼ 23,421). We find that simple polling outcomes by themselvesdo not affect subsequent vote intentions. We do find evidence for a subtle but relevantbandwagon effect: An emphasis on growth in the opinion polls stimulates subsequentsupport. However, there is no evidence that the bandwagon effect is more apparentamong people who were on the fence.
Is there such a thing as a bandwagon vote? Do ‘‘pre-election polls tend tohandicap the losing side by influencing doubtful voters to vote for the winningcandidate’’ (Gallup & Rae, 1940, p. 244)? As early as 1940, George Gallup andSaul Forbes Rae argued that there are two main problems in the way thebandwagon effect had been tested comprehensively. First, experimental studiesfrequently study college students in nonrealistic situations with nonexistingcandidates. Second, because the determinants of public opinion shifts arecomplex and interdependent, the causal mechanisms are hard to pull apart(Gallup & Rae, 1940, pp. 248–249). A more convincing test of the bandwagon
All correspondence regarding this article should be addressed to Tom van der Meer, Department ofPolitical Science, University of Amsterdam, Nieuwe Achtergracht 166, BC10.09, Amsterdam, theNetherlands. E-mail: [email protected]
Downloaded from https://academic.oup.com/ijpor/article-abstract/28/1/46/2357273by Universite de Montreal useron 25 August 2018

vote and its intricacies therefore requires an assessment of the effect of actualpoll results on real voters.
To date, the problems sketched by Gallup and Rae have not been solved.Even though the topic has received ample scholarly attention, the existence ofa bandwagon vote remains hotly debated (see Irwin & Van Holsteyn, 2000).Gallup, for one, was highly sceptical: ‘‘No amount of factual evidence seemsto kill the bandwagon myth . . . . After thirty years, the volume of evidenceagainst the bandwagon theory has reached staggering proportions, and yetmany writers continue to allude to this theory as an accepted fact’’ (Gallup,1965, p. 546).
Yet, the current body of scholarship on the existence of a bandwagon vote isfar more mixed than Gallup’s early assessment implies (Donsbach, 2001;Hardmeier, 2008). Survey-based research has led to paradoxical outcomes.Most people, when asked directly, are convinced that polls have the potentialto induce bandwagon effects, but deny that they themselves are sensitive to suchinfluences (Lang & Lang, 1984; McAllister & Studler, 1991; Sonck &Loosveldt, 2010). Subjective perceptions of electoral success influence partychoice (Meffert, Huber, Gschwend, & Pappi, 2011). Generally, though, surveysare not well equipped to assess whether actual success in the opinion pollscauses a bandwagon vote to occur, as the mechanisms underlying the bandwagoneffect can be emotional and subconscious in nature, rather than cognitive andconscious (see Marsh, 1985; Mutz, 1992, 1998; Meffert et al., 2011).
To address these concerns, many studies on the bandwagon vote haveapplied an experimental design (e.g., Hardmeier, 2008). There have beenvarious attempts at natural experiments, for instance, by comparing earlyvoters with late voters—the latter being more likely to have been exposedto exit polls—by comparing people who watched television broadcasts showingthe likely election outcome at midday with those who did not, or by compar-ing voters who were interviewed before successful polls were presentedwith those who were interviewed afterward (e.g., Blais, Gidengil, & Nevitte,2006; Fuchs, 1966; Mendelsohn, 1966; Tuchman & Coffin, 1971). Thesestudies generally found no evidence for bandwagon effects, but were unableto achieve genuine randomization of the bandwagon treatment. Experimentalresearch in controlled environments with randomized groups was usedto isolate bandwagon effects more abstractly, by using fake candidates and/or fake polls, generally among a small and selective population such as stu-dents (e.g., Cotter & Stoval, 1994; Daschmann 2000; Fleitas, 1971; Goidel &Shields, 1994; Mehrabian, 1998; Morwitz & Pluzinski, 1996; Navazio, 1977).However, these experiments do not tell us to what extent bandwagon effectstake place in nonartificial settings as a consequence of actual poll results.Many of these experimental studies require quite a leap of faith from experi-ment to reality.
O F F T H E F E N C E , O N T O T H E B A N D W A G O N ? 47
Downloaded from https://academic.oup.com/ijpor/article-abstract/28/1/46/2357273by Universite de Montreal useron 25 August 2018
Moreover, the bandwagon effect need not be indiscriminate (see Traugott,1992). Success in the polls is most likely to attract voters who were already‘‘on the fence’’ (Gallup & Rae, 1940), that is, voters who support candidateswith similar characteristics rather than ideological opposites and voters whopreviously considered voting for that candidate at least once. Moreover, pol-itically sophisticated voters are less likely to change party preference becausethey do not easily yield to additional cues (Lazarsfeld, Berelson, & Gaudet,1948; Meffert et al., 2011; Van der Meer, Van Elsas, Lubbe, & Van der Brug,2015).
For all these reasons, it is no surprise that previous studies reached con-flicting results and that the existence and nature of the bandwagon voteremains hotly contested. Experimental tests have generally been strong oninternal validity, but less so in generalizing their findings to real-life settingsand the general electorate. Survey-based studies, by contrast, have been strongin external validity, but unable to tap into the potentially unconscious natureof the bandwagon mechanism.
This study discusses the nature of the bandwagon vote, proposes a re-search strategy to overcome the main limitations of previous studies, and thentests to what extent there is evidence for the existence of a bandwagon vote.We employed a large-scale panel survey experiment, where 23,421 respondentswere randomly assigned to 10 different groups and confronted with the sameoutcomes of the most recently published nation-wide opinion poll—yet, cru-cially, framed in different ways—before we asked their current vote intention.Because our experiment does not use fabricated poll outcomes, the treatmentsare less likely to be perceived as outlandish, if only to those who already hada general idea of the relative party share in the polls. Survey experiments haveproven their exceptional merit in studying a myriad of political science topics(see Gaines, Kuklinski, & Quirk, 2007 for an overview) and could potentiallybridge the experimental and survey traditions in the bandwagon literature.Moreover, we explore the conditionality of the bandwagon mechanism onthe framing of party success in the polls and voter attributes such as volatilityand political sophistication.
In sum, our design enables us to test to what extent the bandwagonmechanism occurs among actual voters when they are confronted withactual opinion poll outcomes.
Our survey experiment is situated in the Netherlands, early in the run-uptoward the parliamentary elections of September 12, 2012. The Dutch case hassome advantages that allow us to study various aspects of the bandwagon vote.First, the Netherlands has a proportional electoral system and a multipartysystem in which no party comes close to reaching an absolute majority. Thisallows us to analyze one specific source of the bandwagon mechanism
I N T E R N A T I O N A L J O U R N A L O F P U B L I C O P I N I O N R E S E A R C H48
Downloaded from https://academic.oup.com/ijpor/article-abstract/28/1/46/2357273by Universite de Montreal useron 25 August 2018
(momentum rather than static support). In fact, our experiment containsvignettes with different reference points in time, so almost any party in thissystem can be framed as a winner or loser (Irwin & Van Holsteyn, 2000).Second, the Dutch electorate has become increasingly volatile (Mair, 2008),although this volatility remains largely bounded within one of two party blocks(Van der Meer, Lubbe, Van Elsas, Elff, & Van der Brug, 2012). Some degreeof volatility is a necessary precondition for bandwagon effects to occur.However, any bandwagon effect in this system is likely to be subtle, asthere is rarely a single clear winner.
Theory
The bandwagon mechanism has a solid foundation in various microeconomicsubfields in the form of functional externalities owing to increased preferencesby other consumers (e.g., Becker, 1991; Brown & Link, 2008). In politicalscience, it refers to a tendency among voters to vote for parties that areperceived to be successful (‘‘winners’’) in preelection polls of vote intentions.This is conceptually distinct from strategic voting, where voters aim to facili-tate or prevent a coalition outcome by voting for parties of lower preferencebased on expected election outcomes (Blais et al., 2006; Hardmeier, 2008;Irwin & Van Holsteyn, 2002).
Political bandwagon effects have been difficult to define, identify, and test.The definition of success in the opinion polls is a point of discussion by itself,especially in a multiparty context (Irwin & Van Holsteyn, 2000). The label‘‘winner’’ might refer to having support from a majority of the electorate, tohaving the most support (from a plurality, i.e., being larger than any of theother parties), or to having momentum (i.e., gaining support the fastest). Thedefinition of momentum depends, in turn, on the reference point: A candidatemay have lost support over several months, but (re-) gained it more recentlyover several weeks. Both size and momentum, however, need to be separatedfrom general media effects, that is, gains in vote shares owing to articles andbroadcasts that set parties or candidates in a positive light.
In our empirical test, we focus exclusively on the bandwagon vote relatedto momentum. In the media cycle leading up to elections, the image ofa winner generally relates to this momentum rather than to static size, aschanges carry more news value. Nevertheless, the cues on which party orcandidate is winning are not necessarily given by the poll outcomes them-selves. Rather, they are contained in the message that is conveyed to thegeneral public (Cotter & Stovall, 1994; Daschmann, 2000). Without informa-tion as to which party is gaining momentum, polling results are thus unlikelyto produce bandwagon effects (see Fleitas, 1971; Navazio, 1977).
O F F T H E F E N C E , O N T O T H E B A N D W A G O N ? 49
Downloaded from https://academic.oup.com/ijpor/article-abstract/28/1/46/2357273by Universite de Montreal useron 25 August 2018
The very same poll outcome can result in vastly different narratives. Twoaspects seem to be especially relevant: (1) the point of reference, and (2) theframe. The point of reference determines the size and direction of the changein support, especially in the face of a volatile electorate. Yet, there is no single,self-evident reference point to interpret polling outcomes. Journalists havetremendous leeway in assigning winner/loser status to parties. Onemay consider the vote/seat share at the last elections, the last poll outcome,or the historic high point or low point (probably under the current leader-ship). Emphasis on growth might bring about bandwagon effects(Kleinnijenhuis, van Hoof, Oegema, & de Ridder, 2007), while emphasis ondecline might lead to a so-called ‘‘Titanic effect’’ (a flight away from thelosing party).
Similarly, the same poll outcome can be framed positively and negatively,regardless of the point of reference. Imagine, for instance, a party for whichthe support in the polls remained stable after an earlier period of growth. Thisoutcome can be framed positively (‘‘retained growth’’) or negatively(‘‘stagnated’’). Such choices affect the degree to which a party is framed asa winner.
Besides the dry polling results, the point of reference (growth vs. decline)and the frame (positive vs. negative) therefore function as input to the treat-ments we deliver in our survey experiment.
Four Mechanisms to Explain the Bandwagon Effect
The nature of the supposed bandwagon is unclear, but we can distinguishvarious potential mechanisms to explain why people would tend to vote forcandidates that do well in the polls (e.g., Bartels, 1988, 1996; Hardmeier,2008; Mutz, 1992). First, some use polls as ‘‘a crude indicator of othervoters’ judgments about the candidates’ strengths and weaknesses’’(Ansolabehere & Iyengar, 1994) to reassess reasons to vote for winning can-didates (Mutz, 1992). Second, voters might use polls of the preferences of thecollective as a useful heuristic cue, especially if other political knowledge islacking (Meffert et al., 2011; Mutz, 1998). Third, voters may be inherentlyattracted to being on the side of a winning candidate (Abramowitz, 1987,p. 50; Bartels, 1988), for instance, to raise their self-esteem (Mutz, 1992).Finally, the bandwagon vote may be caused by an even more basic, affective,and unaware herd instinct (Hardmeier, 2008).
These mechanisms differ in the extent that voters make cognitive use ofinformation and the extent to which they appeal to emotional responses (Irwin& Van Holsteyn, 2000). Voters may, but need not, be aware of their motiv-ation to vote for the winning candidate. Consequently, self-reportedmotivations for electoral behavior and within-person comparisons of different
I N T E R N A T I O N A L J O U R N A L O F P U B L I C O P I N I O N R E S E A R C H50
Downloaded from https://academic.oup.com/ijpor/article-abstract/28/1/46/2357273by Universite de Montreal useron 25 August 2018
treatments tend with underestimate bandwagon effects, as they emphasize anawareness of cognitive processes.
No Indiscriminate Effects
More cognitive mechanisms imply that some groups of voters are more likelyto give in to the bandwagon mechanism than others (Mehrabian, 1998;Traugott, 1992). A first group that is apparently likely to be attracted tosuccess in the polls is made up by voters who were ‘‘on the fence’’ anyways(Gallup & Rae, 1940), that is, voters who already contemplated voting for thesuccessful party (Bartels, 1987). Similarly, voters who more easily changeparty preferences between elections (i.e., volatile voters) should be morelikely to jump on the bandwagon. Finally, there is some evidence that band-wagon effects are more likely to occur on undecided voters (Ceci & Kain,1982; Mutz, 1992).1 Hence, we would expect the bandwagon vote to occurparticularly among voters who had contemplated voting for that party beforeand among more volatile voters.
A second group of voters who are likely to give in to bandwagon effectsare those with low levels of political sophistication. Politically sophisticatedvoters are more resistant to the influence of opinion polls (Meffert et al. 2011;Popkin, 1991). Their political opinions are less susceptible to new cues(Lazarsfeld et al., 1948), given equal levels of exposure to such cues(Albright, 2009). As political sophistication and education are positivelyrelated, we would expect that higher educated citizens are less likely toexperience bandwagon effects.2
Hypotheses
Based on the foregoing literature, we formulate the following hypotheses:
H1: Reading dry poll outcomes (without reference point or frame) do not affectsubsequent vote intentions compared with reading no poll outcomes.H2: Poll outcomes that emphasize growth of a single party in the polls comparedwith an earlier point of reference stimulate voters to subsequently report intentionto vote for that party.H3: Poll outcomes that contain the frame that a single party is doing well in thepolls stimulate voters to subsequently report intention to vote for that party.
1Bandwagon effects might be self-reinforcing: Success in the polls breeds more subsequent success. Yet,even self-reinforcing bandwagon effects are likely to top off, as the news of the party’s increasing supportgrows stale or as the party reaches its electoral potential (Bartels, 1985).
2Navazio (1977) and Schmitt-Beck (1996) suggest that the level of political sophistication influenceswhich polling effect occurs. They argue that lower educated are more likely to vote for the underdogs,whereas the higher educated are more likely to jump on the bandwagon of a winner.
O F F T H E F E N C E , O N T O T H E B A N D W A G O N ? 51
Downloaded from https://academic.oup.com/ijpor/article-abstract/28/1/46/2357273by Universite de Montreal useron 25 August 2018
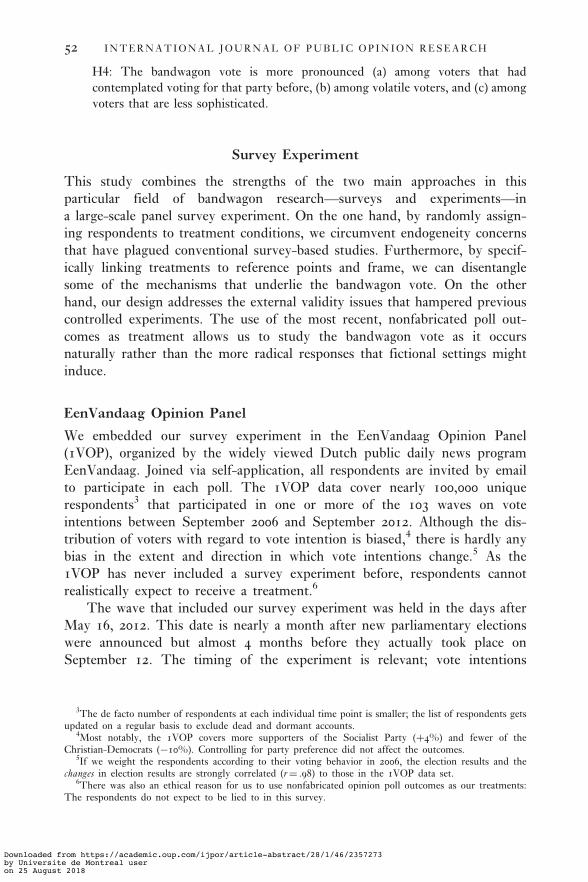
H4: The bandwagon vote is more pronounced (a) among voters that hadcontemplated voting for that party before, (b) among volatile voters, and (c) amongvoters that are less sophisticated.
Survey Experiment
This study combines the strengths of the two main approaches in thisparticular field of bandwagon research—surveys and experiments—ina large-scale panel survey experiment. On the one hand, by randomly assign-ing respondents to treatment conditions, we circumvent endogeneity concernsthat have plagued conventional survey-based studies. Furthermore, by specif-ically linking treatments to reference points and frame, we can disentanglesome of the mechanisms that underlie the bandwagon vote. On the otherhand, our design addresses the external validity issues that hampered previouscontrolled experiments. The use of the most recent, nonfabricated poll out-comes as treatment allows us to study the bandwagon vote as it occursnaturally rather than the more radical responses that fictional settings mightinduce.
EenVandaag Opinion Panel
We embedded our survey experiment in the EenVandaag Opinion Panel(1VOP), organized by the widely viewed Dutch public daily news programEenVandaag. Joined via self-application, all respondents are invited by emailto participate in each poll. The 1VOP data cover nearly 100,000 uniquerespondents3 that participated in one or more of the 103 waves on voteintentions between September 2006 and September 2012. Although the dis-tribution of voters with regard to vote intention is biased,4 there is hardly anybias in the extent and direction in which vote intentions change.5 As the1VOP has never included a survey experiment before, respondents cannotrealistically expect to receive a treatment.6
The wave that included our survey experiment was held in the days afterMay 16, 2012. This date is nearly a month after new parliamentary electionswere announced but almost 4 months before they actually took place onSeptember 12. The timing of the experiment is relevant; vote intentions
3The de facto number of respondents at each individual time point is smaller; the list of respondents getsupdated on a regular basis to exclude dead and dormant accounts.
4Most notably, the 1VOP covers more supporters of the Socialist Party (þ4%) and fewer of theChristian-Democrats (#10%). Controlling for party preference did not affect the outcomes.
5If we weight the respondents according to their voting behavior in 2006, the election results and thechanges in election results are strongly correlated (r¼ .98) to those in the 1VOP data set.
6There was also an ethical reason for us to use nonfabricated opinion poll outcomes as our treatments:The respondents do not expect to be lied to in this survey.
I N T E R N A T I O N A L J O U R N A L O F P U B L I C O P I N I O N R E S E A R C H52
Downloaded from https://academic.oup.com/ijpor/article-abstract/28/1/46/2357273by Universite de Montreal useron 25 August 2018
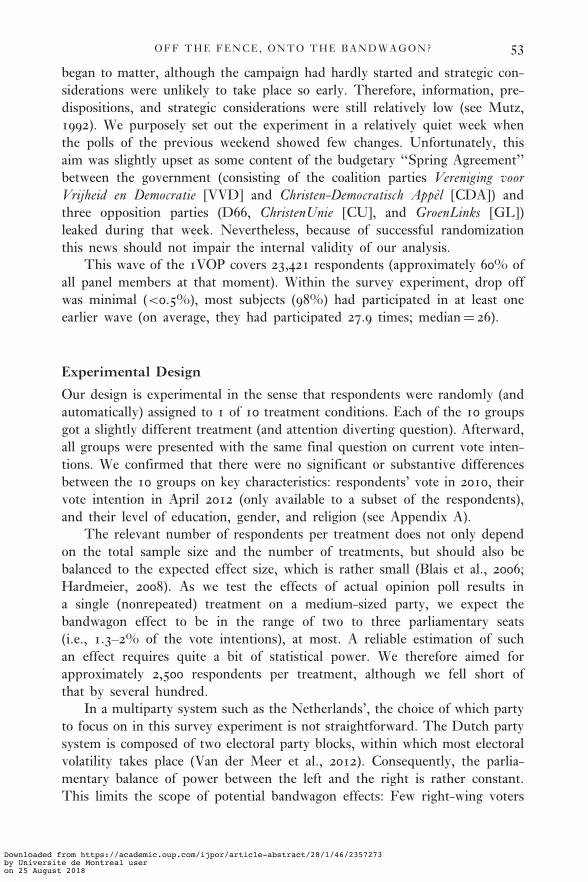
began to matter, although the campaign had hardly started and strategic con-siderations were unlikely to take place so early. Therefore, information, pre-dispositions, and strategic considerations were still relatively low (see Mutz,1992). We purposely set out the experiment in a relatively quiet week whenthe polls of the previous weekend showed few changes. Unfortunately, thisaim was slightly upset as some content of the budgetary ‘‘Spring Agreement’’between the government (consisting of the coalition parties Vereniging voorVrijheid en Democratie [VVD] and Christen-Democratisch Appel [CDA]) andthree opposition parties (D66, ChristenUnie [CU], and GroenLinks [GL])leaked during that week. Nevertheless, because of successful randomizationthis news should not impair the internal validity of our analysis.
This wave of the 1VOP covers 23,421 respondents (approximately 60% ofall panel members at that moment). Within the survey experiment, drop offwas minimal (<0.5%), most subjects (98%) had participated in at least oneearlier wave (on average, they had participated 27.9 times; median¼ 26).
Experimental Design
Our design is experimental in the sense that respondents were randomly (andautomatically) assigned to 1 of 10 treatment conditions. Each of the 10 groupsgot a slightly different treatment (and attention diverting question). Afterward,all groups were presented with the same final question on current vote inten-tions. We confirmed that there were no significant or substantive differencesbetween the 10 groups on key characteristics: respondents’ vote in 2010, theirvote intention in April 2012 (only available to a subset of the respondents),and their level of education, gender, and religion (see Appendix A).
The relevant number of respondents per treatment does not only dependon the total sample size and the number of treatments, but should also bebalanced to the expected effect size, which is rather small (Blais et al., 2006;Hardmeier, 2008). As we test the effects of actual opinion poll results ina single (nonrepeated) treatment on a medium-sized party, we expect thebandwagon effect to be in the range of two to three parliamentary seats(i.e., 1.3–2% of the vote intentions), at most. A reliable estimation of suchan effect requires quite a bit of statistical power. We therefore aimed forapproximately 2,500 respondents per treatment, although we fell short ofthat by several hundred.
In a multiparty system such as the Netherlands’, the choice of which partyto focus on in this survey experiment is not straightforward. The Dutch partysystem is composed of two electoral party blocks, within which most electoralvolatility takes place (Van der Meer et al., 2012). Consequently, the parlia-mentary balance of power between the left and the right is rather constant.This limits the scope of potential bandwagon effects: Few right-wing voters
O F F T H E F E N C E , O N T O T H E B A N D W A G O N ? 53
Downloaded from https://academic.oup.com/ijpor/article-abstract/28/1/46/2357273by Universite de Montreal useron 25 August 2018
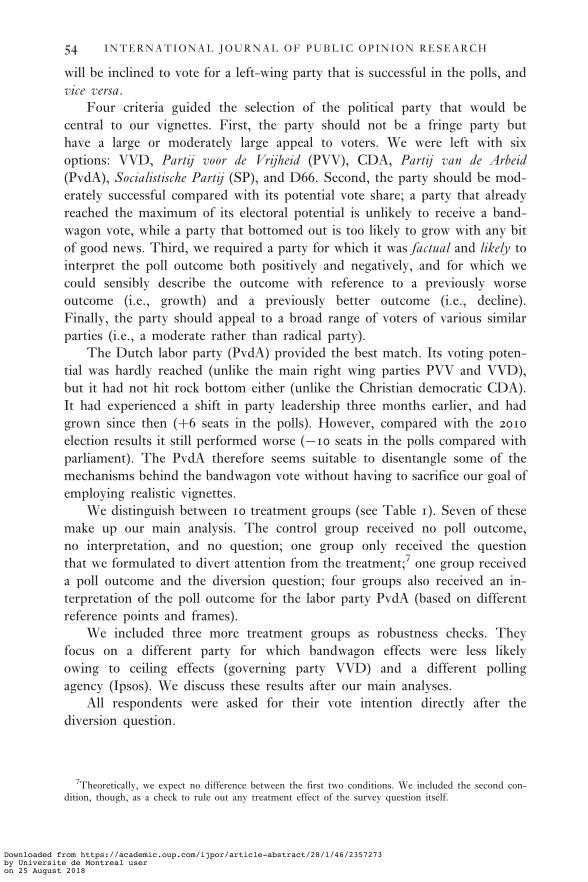
will be inclined to vote for a left-wing party that is successful in the polls, andvice versa.
Four criteria guided the selection of the political party that would becentral to our vignettes. First, the party should not be a fringe party buthave a large or moderately large appeal to voters. We were left with sixoptions: VVD, Partij voor de Vrijheid (PVV), CDA, Partij van de Arbeid(PvdA), Socialistische Partij (SP), and D66. Second, the party should be mod-erately successful compared with its potential vote share; a party that alreadyreached the maximum of its electoral potential is unlikely to receive a band-wagon vote, while a party that bottomed out is too likely to grow with any bitof good news. Third, we required a party for which it was factual and likely tointerpret the poll outcome both positively and negatively, and for which wecould sensibly describe the outcome with reference to a previously worseoutcome (i.e., growth) and a previously better outcome (i.e., decline).Finally, the party should appeal to a broad range of voters of various similarparties (i.e., a moderate rather than radical party).
The Dutch labor party (PvdA) provided the best match. Its voting poten-tial was hardly reached (unlike the main right wing parties PVV and VVD),but it had not hit rock bottom either (unlike the Christian democratic CDA).It had experienced a shift in party leadership three months earlier, and hadgrown since then (þ6 seats in the polls). However, compared with the 2010election results it still performed worse (#10 seats in the polls compared withparliament). The PvdA therefore seems suitable to disentangle some of themechanisms behind the bandwagon vote without having to sacrifice our goal ofemploying realistic vignettes.
We distinguish between 10 treatment groups (see Table 1). Seven of thesemake up our main analysis. The control group received no poll outcome,no interpretation, and no question; one group only received the questionthat we formulated to divert attention from the treatment;7 one group receiveda poll outcome and the diversion question; four groups also received an in-terpretation of the poll outcome for the labor party PvdA (based on differentreference points and frames).
We included three more treatment groups as robustness checks. Theyfocus on a different party for which bandwagon effects were less likelyowing to ceiling effects (governing party VVD) and a different pollingagency (Ipsos). We discuss these results after our main analyses.
All respondents were asked for their vote intention directly after thediversion question.
7Theoretically, we expect no difference between the first two conditions. We included the second con-dition, though, as a check to rule out any treatment effect of the survey question itself.
I N T E R N A T I O N A L J O U R N A L O F P U B L I C O P I N I O N R E S E A R C H54
Downloaded from https://academic.oup.com/ijpor/article-abstract/28/1/46/2357273by Universite de Montreal useron 25 August 2018
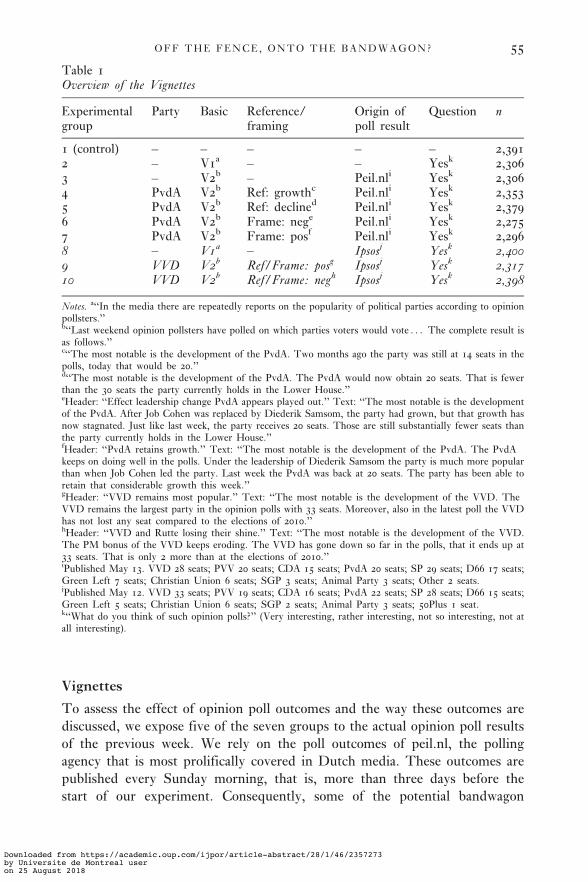
Vignettes
To assess the effect of opinion poll outcomes and the way these outcomes arediscussed, we expose five of the seven groups to the actual opinion poll resultsof the previous week. We rely on the poll outcomes of peil.nl, the pollingagency that is most prolifically covered in Dutch media. These outcomes arepublished every Sunday morning, that is, more than three days before thestart of our experiment. Consequently, some of the potential bandwagon
Table 1Overview of the Vignettes
Experimentalgroup
Party Basic Reference/framing
Origin ofpoll result
Question n
1 (control) – – – – – 2,3912 – V1a – – Yesk 2,3063 – V2b – Peil.nli Yesk 2,3064 PvdA V2b Ref: growthc Peil.nli Yesk 2,3535 PvdA V2b Ref: declined Peil.nli Yesk 2,3796 PvdA V2b Frame: nege Peil.nli Yesk 2,2757 PvdA V2b Frame: posf Peil.nli Yesk 2,2968 – V1a – Ipsosj Yesk 2,4009 VVD V2b Ref/Frame: posg Ipsosj Yesk 2,31710 VVD V2b Ref/Frame: negh Ipsosj Yesk 2,398
Notes. a‘‘In the media there are repeatedly reports on the popularity of political parties according to opinionpollsters.’’b‘‘Last weekend opinion pollsters have polled on which parties voters would vote . . . The complete result isas follows.’’c‘‘The most notable is the development of the PvdA. Two months ago the party was still at 14 seats in thepolls, today that would be 20.’’d‘‘The most notable is the development of the PvdA. The PvdA would now obtain 20 seats. That is fewerthan the 30 seats the party currently holds in the Lower House.’’eHeader: ‘‘Effect leadership change PvdA appears played out.’’ Text: ‘‘The most notable is the developmentof the PvdA. After Job Cohen was replaced by Diederik Samsom, the party had grown, but that growth hasnow stagnated. Just like last week, the party receives 20 seats. Those are still substantially fewer seats thanthe party currently holds in the Lower House.’’fHeader: ‘‘PvdA retains growth.’’ Text: ‘‘The most notable is the development of the PvdA. The PvdAkeeps on doing well in the polls. Under the leadership of Diederik Samsom the party is much more popularthan when Job Cohen led the party. Last week the PvdA was back at 20 seats. The party has been able toretain that considerable growth this week.’’gHeader: ‘‘VVD remains most popular.’’ Text: ‘‘The most notable is the development of the VVD. TheVVD remains the largest party in the opinion polls with 33 seats. Moreover, also in the latest poll the VVDhas not lost any seat compared to the elections of 2010.’’hHeader: ‘‘VVD and Rutte losing their shine.’’ Text: ‘‘The most notable is the development of the VVD.The PM bonus of the VVD keeps eroding. The VVD has gone down so far in the polls, that it ends up at33 seats. That is only 2 more than at the elections of 2010.’’iPublished May 13. VVD 28 seats; PVV 20 seats; CDA 15 seats; PvdA 20 seats; SP 29 seats; D66 17 seats;Green Left 7 seats; Christian Union 6 seats; SGP 3 seats; Animal Party 3 seats; Other 2 seats.jPublished May 12. VVD 33 seats; PVV 19 seats; CDA 16 seats; PvdA 22 seats; SP 28 seats; D66 15 seats;Green Left 5 seats; Christian Union 6 seats; SGP 2 seats; Animal Party 3 seats; 50Plus 1 seat.k‘‘What do you think of such opinion polls?’’ (Very interesting, rather interesting, not so interesting, not atall interesting).
O F F T H E F E N C E , O N T O T H E B A N D W A G O N ? 55
Downloaded from https://academic.oup.com/ijpor/article-abstract/28/1/46/2357273by Universite de Montreal useron 25 August 2018
effects may already be accounted for in the preferences of all respondents. Wedid not mention the name of the polling agency or the pollster himself in oursurvey experiment to keep the setting as neutral as possible. Parties wereordered by government status and size, so that the score of the PvdA wasmentioned as fourth in a list of 11 parties.
Of the five groups that were exposed to the opinion poll results of peil.nl,one group got to read a basic introduction line: ‘‘Last weekend opinion poll-sters have polled on which parties voters would vote.’’ The other four groupsgot an additional brief passage, emphasizing the role of the PvdA (‘‘The mostnotable is the development of the PvdA’’). The first vignette was designed tosignal growth compared with an earlier point of reference: It emphasized inneutral terms that the PvdA had grown (þ6 seats compared with 3 monthsbefore). The second vignette signals a decline compared with an earlier ref-erence point (#10 seats compared with current distribution in parliament).8
These allow us to test H2. The third vignette had an extensive, positive frame,that is, a bias in favor of the PvdA (keeps on doing well in the polls). Thefourth vignette had an extensive, negative frame, that is, a bias againstthe PvdA (stagnated). These allow us to test H3. We ended each of the sixtreatment groups (not the control group) with a question to divert attentionfrom the specific nature of our treatment (the precise poll outcome/interpret-ation) and reduce potential priming effects: ‘‘What do you think of suchopinion polls?’’ Finally, all respondents received the same question on theircurrent vote intention: ‘‘Which party would you vote for if parliamentaryelections were held today?’’ This exact question is commonly asked at theend of surveys in the 1VOP. This vote intention question forms our depend-ent variable.
Table 1 presents a systematic overview of the similarities and distinctionsbetween these comparisons including the three treatment groups we includedfor robustness checks, as well as the literal translations of the survey questions.Theoretically, we are interested in two sets of comparisons: (1) an assessmentwhether the mere act of viewing opinion poll outcomes in Vignette 3 affectsvote intentions (compared with not viewing these outcomes in Vignettes 1 and2); and (2) an assessment whether the reference point and framing of opinionpoll outcomes in Vignettes 4–7 affect vote intentions (compared with theneutral outcomes in Vignette 3).
Conservative Test
Our survey experiment is a conservative test for the existence of bandwagoneffects. First, the use of actual poll results itself will have a dampening effect,
8Note that the treatments were not symmetrical; given our emphasis on realism, we cannot formulatesimilar losses and gains reported in the exact time span.
I N T E R N A T I O N A L J O U R N A L O F P U B L I C O P I N I O N R E S E A R C H56
Downloaded from https://academic.oup.com/ijpor/article-abstract/28/1/46/2357273by Universite de Montreal useron 25 August 2018

as changes in these polls were rather modest in the period we study. To someextent, the poll results will already be accounted for in the attitudes and voteintentions of all our respondents, as they had been published in the mediathree days before the start of our experiment. Second, the treatments weoffered were rather subtle. They were embedded at the tail end of a lengthyquestionnaire. Consequently, the respondents may have been less likely to readthe vignettes intensively, the more so because the survey was not conductedusing an interviewer. Third, we offered a single trigger. Vignette 3 andVignettes 4 and 5 only differ with regard to a single sentence. These triggersare not repeated across various media outlets, as conventionally happens in theDutch case, or by the same outlet at different stages of the news cycle. Hence,there is no cumulative effect that may occur as time goes by, making ourexperiment a one-shot game. Fourth, there may be panelization effects;respondents in panel surveys tend to become more stable in the vote intentionthey report (Warren & Halpern-Manners, 2012).
Nevertheless, the position of the treatment in the questionnaire mightundermine the conservatism of our test; the vote intention question is poseddirectly after the treatment and the diversionary question.
Finally, the timing of the survey experiment—after the announcement ofelections but before the intensified campaign—can both stimulate and hinderthe bandwagon vote. Respondents might be more susceptible to the band-wagon mechanism, as their political predispositions may not have been toostructured yet. However, winning and losing in the polls might have matteredless to respondents so far ahead of the actual elections, thus hampering thebandwagon mechanism. Ultimately, this is an empirical question we cannotanswer in this study.
Setup
We present our analyses as follows. After showing the descriptive results, weestimate logistic regression models to test to what extent the intention to votefor the PvdA differs across each treatment compared with the relevant controlgroup. In line with our directional hypotheses, we performed one-tailed tests.In these multivariate analyses, we eliminated those respondents who refused toanswer and those who were not allowed to vote. Unfortunately, 1VOP doesnot allow us to distinguish between those who refuse to answer (and are codedas ‘‘missing’’) and those who simply do not know at the moment, as bothgroups fall in the same category in the survey. We therefore had to excludethis category.9 Respondents with other nonsubstantial preferences (nonvoters,
9Inclusion of this group of respondents leads, as expected, to substantially the same effects but withmarginally larger confidence intervals. The significance of the effect of the growth vignette in Table 2 woulddrop below .05 in Model 1 (from p¼ .045 to p¼ .071), but not in the bivariate analysis.
O F F T H E F E N C E , O N T O T H E B A N D W A G O N ? 57
Downloaded from https://academic.oup.com/ijpor/article-abstract/28/1/46/2357273by Universite de Montreal useron 25 August 2018
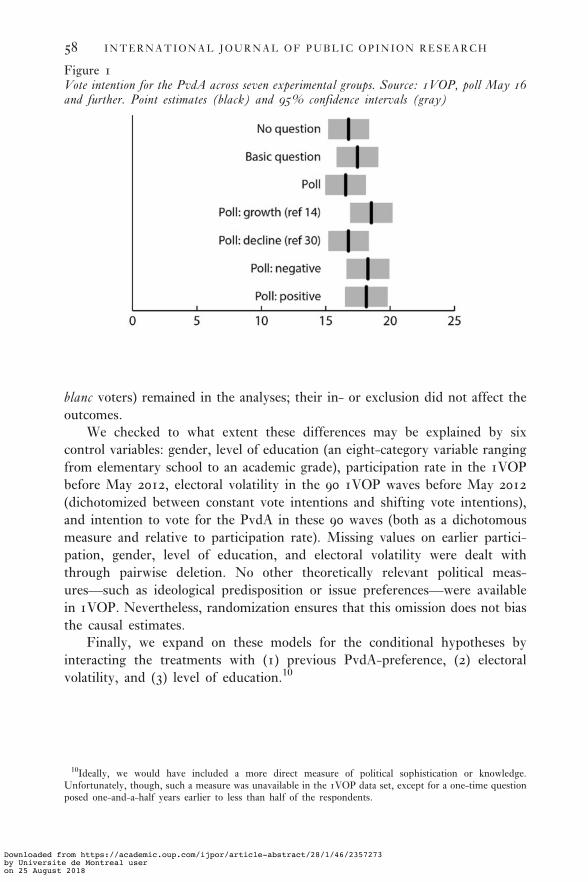
blanc voters) remained in the analyses; their in- or exclusion did not affect theoutcomes.
We checked to what extent these differences may be explained by sixcontrol variables: gender, level of education (an eight-category variable rangingfrom elementary school to an academic grade), participation rate in the 1VOPbefore May 2012, electoral volatility in the 90 1VOP waves before May 2012(dichotomized between constant vote intentions and shifting vote intentions),and intention to vote for the PvdA in these 90 waves (both as a dichotomousmeasure and relative to participation rate). Missing values on earlier partici-pation, gender, level of education, and electoral volatility were dealt withthrough pairwise deletion. No other theoretically relevant political meas-ures—such as ideological predisposition or issue preferences—were availablein 1VOP. Nevertheless, randomization ensures that this omission does not biasthe causal estimates.
Finally, we expand on these models for the conditional hypotheses byinteracting the treatments with (1) previous PvdA-preference, (2) electoralvolatility, and (3) level of education.10
Figure 1Vote intention for the PvdA across seven experimental groups. Source: 1VOP, poll May 16and further. Point estimates (black) and 95% confidence intervals (gray)
10Ideally, we would have included a more direct measure of political sophistication or knowledge.Unfortunately, though, such a measure was unavailable in the 1VOP data set, except for a one-time questionposed one-and-a-half years earlier to less than half of the respondents.
I N T E R N A T I O N A L J O U R N A L O F P U B L I C O P I N I O N R E S E A R C H58
Downloaded from https://academic.oup.com/ijpor/article-abstract/28/1/46/2357273by Universite de Montreal useron 25 August 2018
Results
Descriptive Analysis
Figure 1 shows the share of vote intentions in favor of the PvdA for each ofthe seven main groups. The dark lines represent the point estimates, the grayareas the 95% confidence interval. Support ranges from 16.5% in the controlgroups to 18.5% in the group that was triggered to consider that the PvdAhad grown in the polls. Being exposed to dry poll results did not affectintention to vote PvdA compared with having no information about thepolls at all (difference in point estimate¼ 0.1%). This holds up in multivariateanalyses.11
The vignette that emphasized growth (18.5%) had a significant positiveeffect on subsequent vote intention for PvdA. However, an emphasis ondeclining support did not have an inverse effect on party choice;PvdA-support in that group is 16.8%, statistically indistinguishable from thecontrol group. The simple fact that the PvdA got attention in the triggermight have boosted the intention to vote PvdA, regardless of whether itwas positive or negative. Yet, it cannot explain why only the growth vignettehad a significant effect. The other two treatments groups—who receivedvignettes that framed the poll outcomes negatively (stalled growth) and posi-tively (consolidated growth) without emphasizing momentum—score some-where in between (18.2%), though not significantly different from thecontrol groups.
This result implies, as we had expected, that the effects are small. Theexistence of the bandwagon vote only receives empirical support with thegrowth vignette that was designed to capture (positive) momentum. Hence,we should not overemphasize bandwagon effects caused by a single poll out-come in a multiparty system; regular polls in the Netherlands hardly evershow party shifts of more than one or two seats on a weekly basis. Yet,even such small differences could be consequential in societal terms; a 2%difference in support equals three seats in the 150 seats Dutch Lower Houseand could easily be the difference between the largest party and therunner-up.
Multivariate Tests: Direct Bandwagon Effects
In Table 2, we perform logistic regression analyses to explain the intentionto vote for the PvdA. After including additional controls (Model 1), the posi-tive effect of a growth trigger is even stronger. The vignette with the positive
11We cannot statistically conclude either that the dry poll is equivalent to the reference group; an add-itional test of equivalence (Wellek, 2010) within a predefined interval of 0.3% provides no definite conclu-sion. We therefore find no evidence that poll results without a ‘‘qualitative stimulus’’ affect vote intentions(see Fleitas, 1971; Navazio, 1977), but no evidence either that they do not. A more powerful test is required.
O F F T H E F E N C E , O N T O T H E B A N D W A G O N ? 59
Downloaded from https://academic.oup.com/ijpor/article-abstract/28/1/46/2357273by Universite de Montreal useron 25 August 2018
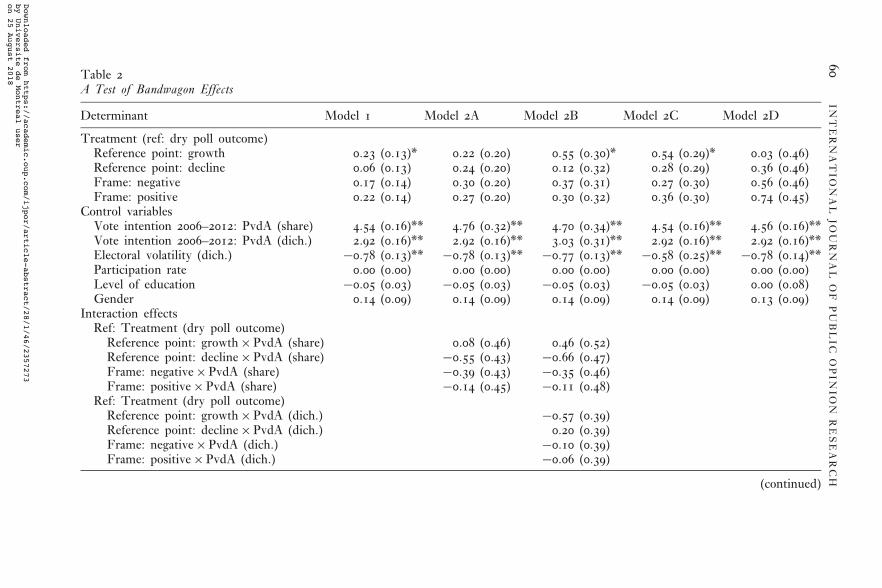
Table 2A Test of Bandwagon Effects
Determinant Model 1 Model 2A Model 2B Model 2C Model 2D
Treatment (ref: dry poll outcome)Reference point: growth 0.23 (0.13)* 0.22 (0.20) 0.55 (0.30)* 0.54 (0.29)* 0.03 (0.46)Reference point: decline 0.06 (0.13) 0.24 (0.20) 0.12 (0.32) 0.28 (0.29) 0.36 (0.46)Frame: negative 0.17 (0.14) 0.30 (0.20) 0.37 (0.31) 0.27 (0.30) 0.56 (0.46)Frame: positive 0.22 (0.14) 0.27 (0.20) 0.30 (0.32) 0.36 (0.30) 0.74 (0.45)
Control variablesVote intention 2006–2012: PvdA (share) 4.54 (0.16)** 4.76 (0.32)** 4.70 (0.34)** 4.54 (0.16)** 4.56 (0.16)**Vote intention 2006–2012: PvdA (dich.) 2.92 (0.16)** 2.92 (0.16)** 3.03 (0.31)** 2.92 (0.16)** 2.92 (0.16)**Electoral volatility (dich.) #0.78 (0.13)** #0.78 (0.13)** #0.77 (0.13)** #0.58 (0.25)** #0.78 (0.14)**Participation rate 0.00 (0.00) 0.00 (0.00) 0.00 (0.00) 0.00 (0.00) 0.00 (0.00)Level of education #0.05 (0.03) #0.05 (0.03) #0.05 (0.03) #0.05 (0.03) 0.00 (0.08)Gender 0.14 (0.09) 0.14 (0.09) 0.14 (0.09) 0.14 (0.09) 0.13 (0.09)
Interaction effectsRef: Treatment (dry poll outcome)
Reference point: growth$PvdA (share) 0.08 (0.46) 0.46 (0.52)Reference point: decline$PvdA (share) #0.55 (0.43) #0.66 (0.47)Frame: negative$PvdA (share) #0.39 (0.43) #0.35 (0.46)Frame: positive$PvdA (share) #0.14 (0.45) #0.11 (0.48)
Ref: Treatment (dry poll outcome)Reference point: growth$PvdA (dich.) #0.57 (0.39)Reference point: decline$PvdA (dich.) 0.20 (0.39)Frame: negative$PvdA (dich.) #0.10 (0.39)Frame: positive$PvdA (dich.) #0.06 (0.39)
(continued)
IN
TE
RN
AT
IO
NA
LJ
OU
RN
AL
OF
PU
BL
IC
OP
IN
IO
NR
ES
EA
RC
H60
Downloaded from https://academic.oup.com/ijpor/article-abstract/28/1/46/2357273by Universite de Montreal useron 25 August 2018
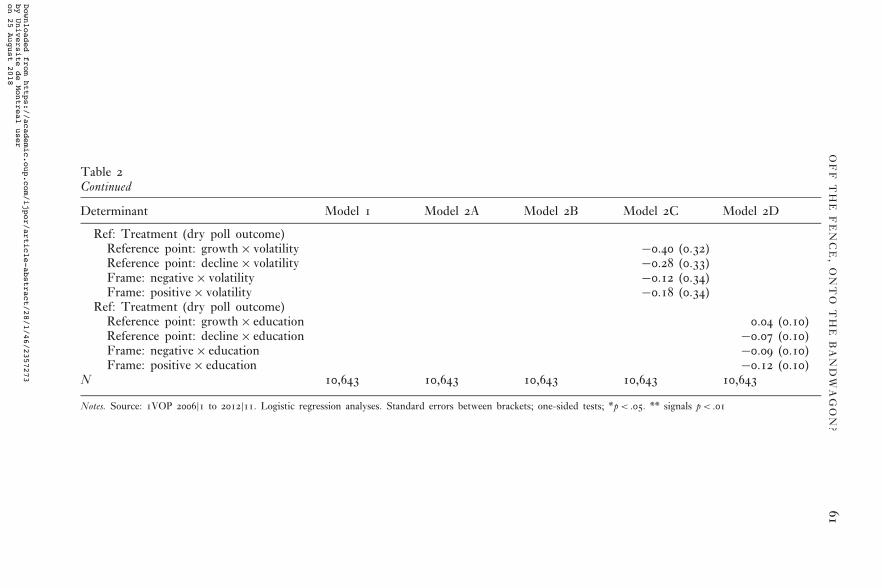
Table 2Continued
Determinant Model 1 Model 2A Model 2B Model 2C Model 2D
Ref: Treatment (dry poll outcome)Reference point: growth$ volatility #0.40 (0.32)Reference point: decline$ volatility #0.28 (0.33)Frame: negative$ volatility #0.12 (0.34)Frame: positive$ volatility #0.18 (0.34)
Ref: Treatment (dry poll outcome)Reference point: growth$ education 0.04 (0.10)Reference point: decline$ education #0.07 (0.10)Frame: negative$ education #0.09 (0.10)Frame: positive$ education #0.12 (0.10)
N 10,643 10,643 10,643 10,643 10,643
Notes. Source: 1VOP 2006j1 to 2012j11. Logistic regression analyses. Standard errors between brackets; one-sided tests; *p< .05. ** signals p< .01
OF
FT
HE
FE
NC
E,
ON
TO
TH
EB
AN
DW
AG
ON
?61
Downloaded from https://academic.oup.com/ijpor/article-abstract/28/1/46/2357273by Universite de Montreal useron 25 August 2018
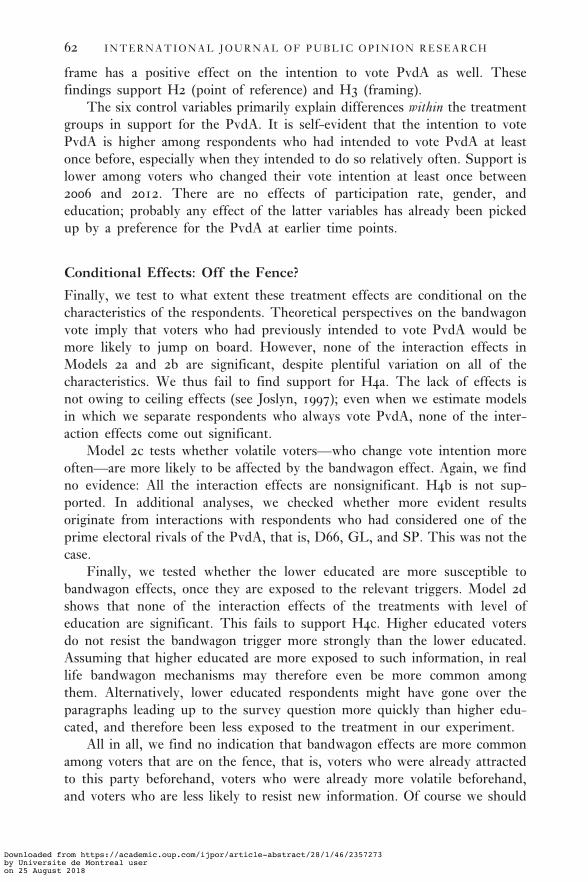
frame has a positive effect on the intention to vote PvdA as well. Thesefindings support H2 (point of reference) and H3 (framing).
The six control variables primarily explain differences within the treatmentgroups in support for the PvdA. It is self-evident that the intention to votePvdA is higher among respondents who had intended to vote PvdA at leastonce before, especially when they intended to do so relatively often. Support islower among voters who changed their vote intention at least once between2006 and 2012. There are no effects of participation rate, gender, andeducation; probably any effect of the latter variables has already been pickedup by a preference for the PvdA at earlier time points.
Conditional Effects: Off the Fence?
Finally, we test to what extent these treatment effects are conditional on thecharacteristics of the respondents. Theoretical perspectives on the bandwagonvote imply that voters who had previously intended to vote PvdA would bemore likely to jump on board. However, none of the interaction effects inModels 2a and 2b are significant, despite plentiful variation on all of thecharacteristics. We thus fail to find support for H4a. The lack of effects isnot owing to ceiling effects (see Joslyn, 1997); even when we estimate modelsin which we separate respondents who always vote PvdA, none of the inter-action effects come out significant.
Model 2c tests whether volatile voters—who change vote intention moreoften—are more likely to be affected by the bandwagon effect. Again, we findno evidence: All the interaction effects are nonsignificant. H4b is not sup-ported. In additional analyses, we checked whether more evident resultsoriginate from interactions with respondents who had considered one of theprime electoral rivals of the PvdA, that is, D66, GL, and SP. This was not thecase.
Finally, we tested whether the lower educated are more susceptible tobandwagon effects, once they are exposed to the relevant triggers. Model 2dshows that none of the interaction effects of the treatments with level ofeducation are significant. This fails to support H4c. Higher educated votersdo not resist the bandwagon trigger more strongly than the lower educated.Assuming that higher educated are more exposed to such information, in reallife bandwagon mechanisms may therefore even be more common amongthem. Alternatively, lower educated respondents might have gone over theparagraphs leading up to the survey question more quickly than higher edu-cated, and therefore been less exposed to the treatment in our experiment.
All in all, we find no indication that bandwagon effects are more commonamong voters that are on the fence, that is, voters who were already attractedto this party beforehand, voters who were already more volatile beforehand,and voters who are less likely to resist new information. Of course we should
I N T E R N A T I O N A L J O U R N A L O F P U B L I C O P I N I O N R E S E A R C H62
Downloaded from https://academic.oup.com/ijpor/article-abstract/28/1/46/2357273by Universite de Montreal useron 25 August 2018

allow for the possibility that the statistical power of our test is insufficient todemonstrate the conditionality of the bandwagon effect.
Robustness I: Alternate Measures for the PvdA
We performed several robustness checks. To improve statistical power, wereran our models after combining the two treatments that were favorable toPvdA (i.e., growth and positive frame) and the two that were not (i.e., declineand negative frame). This did not affect any of the conditional effects sub-stantively. In a second check, we included people’s voting behavior in 2010 asa control variable to Model 2b. This did not affect any of the other effectssubstantively.12 Finally, with regards to the measurement of electoral volatilityand the share of past vote intentions for the PvdA, the use of a measure that iscontinuous or consists of three (instead of two) categories did not affect ourconclusions.
Robustness II: VVD
Finally, our survey experiment included three treatments based on recent, butalready two-week-old, outcomes of the second most prolific Dutch pollingagency (see Table 1). Two of these treatments are accompanied by a headerand text that focuses attention on the VVD (either positively or negatively).We should emphasize that the VVD was in a vastly different electoral positionthan the PvdA. It was the largest governing party and the party of the PrimeMinister. Despite the breakdown of the government coalition, the VVD re-mained the largest party in the polls at the level of the successful 2010 elec-tions, which was a height it had not obtained since 2002. Hence, the positivevignette mentions consolidated growth, and the negative vignette mentionsstalled growth. Given the historical high of the VVD and consequent ceilingeffects, a bandwagon effect based on momentum is far less likely than it wasfor the PvdA at the same time.
Table 3 displays the results of the analyses for the VVD. Model 1 finds nosupport for an unconditional bandwagon effect. The effects of the controlvariables are similar to those found for the intention to vote PvdA, with theaddition that more common participants in the 1VOP are more likely to voteVVD. Yet, we do find evidence for conditional bandwagon effects. Model 2asignals ceiling effects. Reading a vignette that emphasizes the success of theVVD does stimulate the intention to vote VVD, but only among two extremegroups: voters who already tended to vote VVD very often and voters who
12We left this effect out of the multivariate analyses in Table 2, as the voting behavior question was askedonly retrospectively for the most recent 1VOP participants concurrent with their current vote intention;inclusion could invoke endogeneity issues (Van Elsas, Lubbe, Van der Meer, & Van der Brug, 2014).
O F F T H E F E N C E , O N T O T H E B A N D W A G O N ? 63
Downloaded from https://academic.oup.com/ijpor/article-abstract/28/1/46/2357273by Universite de Montreal useron 25 August 2018

Table 3A Test of Bandwagon Effects on a Least Likely Case
Determinant Model 1 Model 2A Model 2B Model 2C Model 2D
Treatment (ref: dry poll outcome of Ipsos)Reference point: success 0.19 (0.15) 1.20 (0.58)* 0.95 (0.52)* 0.29 (0.36) #0.49 (0.55)Reference point: failure 0.16 (0.15) 0.07 (0.71) 0.53 (0.45) #0.18 (0.33) 0.52 (0.53)
Control variablesVote intention 2006–2012: VVD (share) 5.22 (0.26)** 4.58 (0.36)** – 5.22 (0.26)** 5.22 (0.26)**Vote intention 2006–2012: VVD (dich.) 3.46 (0.28)** 4.20 (0.55)** – 3.47 (0.28)** 3.47 (0.28)**
Share of support for VVD in previous polls(ref: Often [>90%–100%])
Never (0%) – – #8.54 (0.57)** – –Rarely (>0–25%) – – #3.90 (0.35)** – –Regularly (>25–90%) – – #1.63 (0.33)** – –
Electoral volatility (dich.) #0.58 (0.19)** #0.60 (0.19)** #0.70 (0.20)** #0.72 (0.29)** #0.58 (0.19)**Participation rate 0.02 (0.00)** 0.02 (0.00)** 0.02 (0.00)** 0.02 (0.00)** #0.00 (0.09)Level of education 0.02 (0.05) 0.02 (0.05) 0.03 (0.05) 0.01 (0.05) 0.02 (0.05)Gender 0.06 (0.15) 0.07 (0.15) 0.04 (0.15) 0.07 (0.15) 0.05 (0.15)Interaction effects
Ref: Treatment (dry poll outcome)Treatment: success$VVD (share) 1.19 (0.52)*Treatment: failure$VVD (share) 0.85 (0.50)
Ref: Treatment (dry poll outcome)Treatment: success$VVD (dich.) #1.58 (0.64)**treatment: failure$VVD #0.20 (0.75)
(continued)
Downloaded from https://academic.oup.com/ijpor/article-abstract/28/1/46/2357273by Universite de Montreal useron 25 August 2018
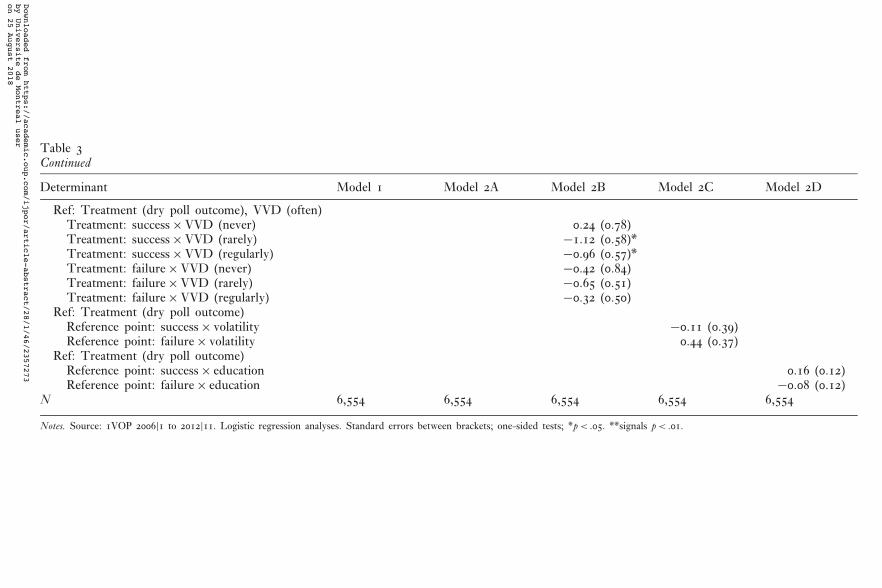
Table 3Continued
Determinant Model 1 Model 2A Model 2B Model 2C Model 2D
Ref: Treatment (dry poll outcome), VVD (often)Treatment: success$VVD (never) 0.24 (0.78)Treatment: success$VVD (rarely) #1.12 (0.58)*Treatment: success$VVD (regularly) #0.96 (0.57)*Treatment: failure$VVD (never) #0.42 (0.84)Treatment: failure$VVD (rarely) #0.65 (0.51)Treatment: failure$VVD (regularly) #0.32 (0.50)
Ref: Treatment (dry poll outcome)Reference point: success$ volatility #0.11 (0.39)Reference point: failure$ volatility 0.44 (0.37)
Ref: Treatment (dry poll outcome)Reference point: success$ education 0.16 (0.12)Reference point: failure$ education #0.08 (0.12)
N 6,554 6,554 6,554 6,554 6,554
Notes. Source: 1VOP 2006j1 to 2012j11. Logistic regression analyses. Standard errors between brackets; one-sided tests; *p< .05. **signals p< .01.
Downloaded from https://academic.oup.com/ijpor/article-abstract/28/1/46/2357273by Universite de Montreal useron 25 August 2018
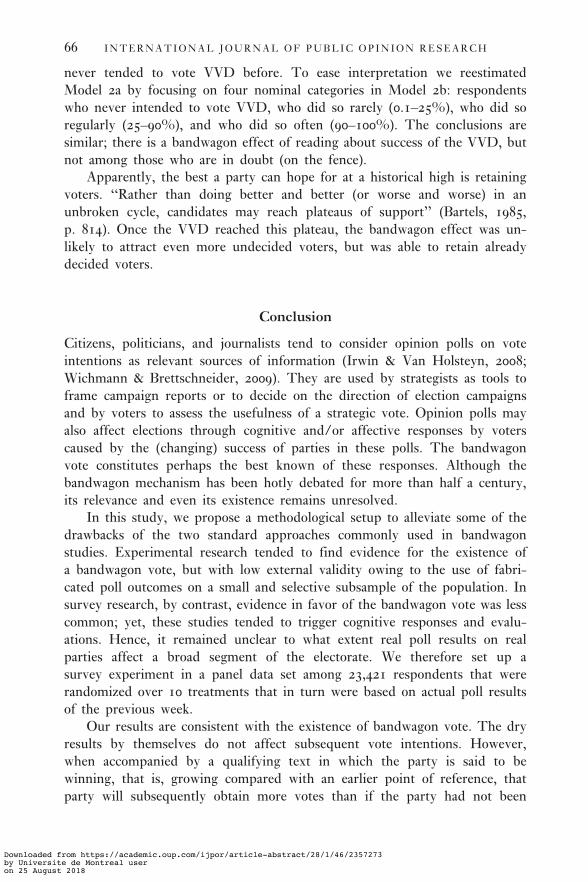
never tended to vote VVD before. To ease interpretation we reestimatedModel 2a by focusing on four nominal categories in Model 2b: respondentswho never intended to vote VVD, who did so rarely (0.1–25%), who did soregularly (25–90%), and who did so often (90–100%). The conclusions aresimilar; there is a bandwagon effect of reading about success of the VVD, butnot among those who are in doubt (on the fence).
Apparently, the best a party can hope for at a historical high is retainingvoters. ‘‘Rather than doing better and better (or worse and worse) in anunbroken cycle, candidates may reach plateaus of support’’ (Bartels, 1985,p. 814). Once the VVD reached this plateau, the bandwagon effect was un-likely to attract even more undecided voters, but was able to retain alreadydecided voters.
Conclusion
Citizens, politicians, and journalists tend to consider opinion polls on voteintentions as relevant sources of information (Irwin & Van Holsteyn, 2008;Wichmann & Brettschneider, 2009). They are used by strategists as tools toframe campaign reports or to decide on the direction of election campaignsand by voters to assess the usefulness of a strategic vote. Opinion polls mayalso affect elections through cognitive and/or affective responses by voterscaused by the (changing) success of parties in these polls. The bandwagonvote constitutes perhaps the best known of these responses. Although thebandwagon mechanism has been hotly debated for more than half a century,its relevance and even its existence remains unresolved.
In this study, we propose a methodological setup to alleviate some of thedrawbacks of the two standard approaches commonly used in bandwagonstudies. Experimental research tended to find evidence for the existence ofa bandwagon vote, but with low external validity owing to the use of fabri-cated poll outcomes on a small and selective subsample of the population. Insurvey research, by contrast, evidence in favor of the bandwagon vote was lesscommon; yet, these studies tended to trigger cognitive responses and evalu-ations. Hence, it remained unclear to what extent real poll results on realparties affect a broad segment of the electorate. We therefore set up asurvey experiment in a panel data set among 23,421 respondents that wererandomized over 10 treatments that in turn were based on actual poll resultsof the previous week.
Our results are consistent with the existence of bandwagon vote. The dryresults by themselves do not affect subsequent vote intentions. However,when accompanied by a qualifying text in which the party is said to bewinning, that is, growing compared with an earlier point of reference, thatparty will subsequently obtain more votes than if the party had not been
I N T E R N A T I O N A L J O U R N A L O F P U B L I C O P I N I O N R E S E A R C H66
Downloaded from https://academic.oup.com/ijpor/article-abstract/28/1/46/2357273by Universite de Montreal useron 25 August 2018
framed as a winner. This effect is consistently significant under varioustests. Being explicitly framed as a winner in rather positively biased termswithout a point of reference to suggest growth may also stimulate subsequentsupport, but that effect is less reliable. We find no evidence that framingof parties as electoral losers or as parties in decline led voters to flee thatparty. Ultimately, it is not the poll outcome itself that matters but theemphasis on who is winning. Bandwagon effects are less likely when aparty reaches a historical high in electoral support. Hence, we found uncon-ditional bandwagon effects for the then less successful PvdA and conditionalbandwagon effects for the then historically successful VVD. All in all, thesebandwagon effects are subtle (as they require specific circumstances and lotof statistical power), but societally substantive (see Hardmeier, 2008); ourone-shot treatment leads to two to three additional seats in the 150-seatDutch parliament.
Still, support for the bandwagon mechanism is certainly not overwhelm-ing. All bandwagon effects are borderline significant at the p< .05 level. Onereason is a lack of statistical power, despite the large number of respondentsper treatment. Given the small effect size that could be expected from a singletreatment based on actual polling outcomes, and owing to our focus on onemiddle-sized party that generally does not attract right-wing voters, theeffective number of respondents was rather small. Power analyses suggestedthat our study required more than the 23,421 respondents we had. This isobviously important for future research that follows our empirical strategy ofusing realistic stimuli to actual voters. Moreover, these conclusions hold understatistical controls, under various model estimations and despite the conserva-tive setup of our test.
Yet, we did not find the conditional effects that we had expected.Theoretically, voters who are on the fence and voters who are less knowledge-able should be more likely to be affected by the bandwagon mechanism.However, none of the cross-level interaction effects in our main analyseswere significant. We found significant cross-level interaction effects in ourrobustness check (on the VVD), but they point to ceiling effects instead.The lack of theoretically interpretable conditional effects seriously challengesthe validity of the bandwagon mechanism. At the very least, the lack of dif-ferentiation does not make sense if bandwagon effects would be owing to thecognitive mechanism (Ansolabehere & Iyengar, 1994) or the cue taking mech-anism (Mutz, 1998), leaving us with the gratification mechanism and/orcontagion mechanisms: an indiscriminate herd instinct.
Although we failed to reject the null hypothesis, we cannot conclude thatthere are no conditional effects either. Ideally, one would assess the effects ofactual polls by following respondents over a longer period. That would riskdiffusion, though. Alternatively, we could aim for stronger treatments in more
O F F T H E F E N C E , O N T O T H E B A N D W A G O N ? 67
Downloaded from https://academic.oup.com/ijpor/article-abstract/28/1/46/2357273by Universite de Montreal useron 25 August 2018
controlled settings. Yet, that would come at a high cost: a sacrifice of theecological validity that our study attempted to bolster.
Discussion
Ultimately, the question is to what extent the effects we found in this surveyexperiment point to actual bandwagon effects of real-life polling outcomes. Weare confident that they do.
That does not mean that there are no threats to our design. The firstconcerns the inflation of the Type I error rate as a result from the seventreatment groups we discern. However, this cannot explain our results.Theoretically, we deduced three main hypotheses (expecting two significanteffects, and one insignificant one), and found evidence in favor of preciselythose three hypotheses. Even when we combined different treatment groups,we obtain the same results.
Second, the press leak of the content of the Spring Agreement (betweencoalition parties and three minor opposition parties) in the week of the ex-periment was an unforeseen interference. Yet, because respondents were ran-domized over treatments, any effect of the event would have affected alltreatment groups and at best obscured any treatment effect owing to increasedsupport for the PvdA.
Finally, priming effects could not have caused our findings, that is, themere attention specific parties get in the vignette. Although priming mightexplain why we find no negative effects of decline or failure, it cannot explainwhy we only find significant positive effects of growth and success. If atten-tion for a party in the vignette is the main driver of our findings, the vignetteswith the most extensive frames (positive and negative) should have created tothe strongest positive effects. That is neither the case in our study of thePvdA, nor in our study of the VVD.
The subtle but significant bandwagon effects of actual polling outcomesare relevant. The emphasis of growth in reports on the polls matters. Even aone-shot treatment led to a 2% increase in vote share. The subjective choicefor a point of reference by journalists has consequences. Less accurate mediareports on polling outcomes in which margins of error are ignored are causefor concern (Lavrakas & Traugott, 2000; Sonck & Loosveld, 2010; but seeKirchgassner & Wolters, 1987); nonsignificant growth reported in the mediamight lead to a self-fulfilling prophecy. In the short run, there is a risk ofcumulative effects, especially when signals in different media are not mixed.
References
Abramowitz, A. (1987). Candidate choice before the convention: The Democrats in1984. Political Behavior, 9(1), 49–61.
I N T E R N A T I O N A L J O U R N A L O F P U B L I C O P I N I O N R E S E A R C H68
Downloaded from https://academic.oup.com/ijpor/article-abstract/28/1/46/2357273by Universite de Montreal useron 25 August 2018
Albright, J. (2009). Does political knowledge erode party attachments? A review of thecognitive mobilization thesis. Electoral Studies, 28(2), 248–260.
Ansolabehere, S., & Iyengar, S. (1994). Of horseshoes and horse races: Experimentalstudies of the impact of poll results on electoral behavior. Political Communication,11(4), 413–430.
Bartels, L. (1985). Expectations and preferences in presidential nominating campaigns.The American Political Science Review, 79(3), 804–815.
Bartels, L. (1987). Candidate choice and the dynamics of the presidential nominatingprocess. American Journal of Political Science, 31(1), 1–30.
Bartels, L. (1988). Presidential primaries and the dynamics of public choice. Princeton,NJ: Princeton University Press.
Bartels, L. (1996). Uninformed votes: Information effects in presidential elections.American Journal of Political Science, 40(1), 194–230.
Becker, G. S. (1991). A note on restaurant pricing and other examples of socialinfluences on price. Journal of Political Economy, 99(5), 1109–1116.
Blais, A., Gidengil, E., & Nevitte, N. (2006). Do polls influence the vote. In H.E. Brady & R. Johnston (Eds.), Capturing campaign effects (pp. 263–279). AnnArbor, MI: University of Michigan Press.
Brown, D., & Link, C. (2008). Population and bandwagon effects on local teamrevenues in Major League Baseball. Journal of Sports Economics, 9(5), 470–487.
Ceci, C., & Kahn, J. (1982). Jumping on the bandwagon with the underdog: Theimpact of attitude polls on polling behavior. Public Opinion Quarterly, 46(2),228–242.
Cotter, P., & Stovall, J. (1994). Is one as good as another? The relative influence ofpre-election surveys on voter behavior. Newspaper Research Journal, 15(4), 13–19.
Daschmann, G. (2000). Vox pop and polls: The impact of poll results and voterstatements in the media on the perception of a climate of opinion. InternationalJournal of Public Opinion Research, 12(2), 160–181.
Donsbach, W. (2001). Who’s afraid of election polls?: Normative and empirical argumentsfor the freedom of pre-election surveys Paper presented at the ESOMAR conference,Amsterdam.
Fleitas, D. (1971). Bandwagon and underdog effects in minimal-information elections.American Political Science Review, 65(2), 434–438.
Fuchs, D. (1966). Election-day radio-television and western voting. The Public OpinionQuarterly, 30(2), 226–236.
Gaines, B., Kuklinski, J., & Quirk, P. (2007). The logic of the survey experimentreexamined. Political Analysis, 15(1), 1–20.
Gallup, G. (1965). Polls and the political process: Past, present and future. PublicOpinion Quarterly, 29(4), 544–549.
Gallup, G., & Rae, S. (1940). Is there a bandwagon vote? Public Opinion Quarterly,4(2), 244–249.
Goidel, R., & Shields, T. (1994). The vanishing marginals, the mass media, and thebandwagon. Journal of Politics, 56(3), 802–810.
Hardmeier, S. (2008). The effects of published polls on citizens. In W. Donsbach &M. Traugott (Eds.), The SAGE handbook of public opinion research (pp. 504–513).London: Sage.
O F F T H E F E N C E , O N T O T H E B A N D W A G O N ? 69
Downloaded from https://academic.oup.com/ijpor/article-abstract/28/1/46/2357273by Universite de Montreal useron 25 August 2018
Irwin, G., & Van Holsteyn, J. (2000, August 1–5). Bandwagons, underdogs, theTitanic, and the Red Cross: The influence of public opinion polls on voters. Paperpresented at the 18th Congress of the International Political Science Association,Quebec.
Irwin, G., & Van Holsteyn, J. (2002). According to the polls: The influence ofopinion polls on expectations. The Public Opinion Quarterly, 66(1), 92–104.
Irwin, G., & Van Holsteyn, J. (2008). What are they waiting for? Strategic informa-tion for late deciding voters. International Journal of Public Opinion Research, 20(4),483–293.
Joslyn, M. (1997). The public nature of personal opinion: The impact of collectivesentiment on individual appraisal. Political Behavior, 19(4), 337–363.
Kirchgassner, G., & Wolters, J. (1987). The influence of poll results on electionoutcomes. Mathematical Social Sciences, 13(2), 165–175.
Kleinnijenhuis, J., van Hoof, A. M. J., Oegema, D., & de Ridder, J. A. (2007). A testof rivaling approaches to explain news effects: News on issue positions of parties,real world developments, support and criticism, and success and failure. Journal ofCommunication, 57(2), 366–384.
Lang, K., & Lang, G. (1984). The impact of polls on public opinion. The Annals ofthe American Academy of Political and Social Science, 472(1), 129–142.
Lavrakas, P., & Traugott, M. (2000). Election polls, the news media, and democracy.New York: Chatham House Publishers.
Lazarsfeld, P., Berelson, B., & Gaudet, H. (1948). The people’s choice. New York:Duell Sloan and Pearce.
Mair, P. (2008). Electoral volatility and the Dutch party system: A comparative per-spective. Acta Politica, 43(2), 235–253.
Marsh, C. (1985). Back on the bandwagon: The effect of opinion polls on publicopinion. British Journal of Political Science, 15(1), 51–74.
McAllister, I., & Studlar, D. (1991). Bandwagon, underdog or projection? Opinionpolls and electoral choice in Britain, 1979-1987. Journal of Politics, 53(3), 720–741.
Meffert, M., Huber, S., Gschwend, T., & Pappi, F. (2011). More than wishfulthinking: Causes and consequences of voters’ electoral expectations about partiesand coalitions. Electoral Studies, 30(4), 804–815.
Mehrabian, L. (1998). Effects of poll reports on voter preferences. Journal of AppliedSocial Psychology, 28(23), 2119–2130.
Mendelsohn, H. (1966). Western voting and broadcasts of results on presidentialelection day. Public Opinion Quarterly, 30(2), 212–225.
Morwitz, V., & Pluzinski, C. (1996). Do polls reflect opinions or do opinions reflectpolls? The impact of political polling on voters’ expectations, preferences and be-havior. Journal of Consumer Research, 23(1), 53–67.
Mutz, D. (1992). Impersonal influence: Effects of representation of public opinion onpolitical attitudes. Political Behavior, 14(2), 89–122.
Mutz, D. (1998). Impersonal influence: How perceptions of mass collectives affect politicalattitudes. Cambridge: Cambridge University Press.
Navazio, R. (1977). An experimental approach to bandwagon research. Public OpinionQuarterly, 41(2), 217–225.
I N T E R N A T I O N A L J O U R N A L O F P U B L I C O P I N I O N R E S E A R C H70
Downloaded from https://academic.oup.com/ijpor/article-abstract/28/1/46/2357273by Universite de Montreal useron 25 August 2018
Popkin, S. (1991). The reasoning voter: Communication and persuasion in presidentialcampaigns. Chicago: University of Chicago Press.
Schmitt-Beck, R. (1996). Mass media, the electorate, and the bandwagon. A study ofcommunication effects on vote choice in Germany. International Journal of PublicOpinion Research, 8(3), 266–291.
Sonck, N., & Van Loosveldt, G. (2010). Impact of poll results on personal opinionsand perceptions of collective opinion. International Journal of Public OpinionResearch, 22(2), 230–255.
Traugott, M. (1992). The impact of media polls on the public. In T. Mann &G. Orren (Eds.), Media polls in American politics (pp. 125–149). Washington, DC:Brookings Institution.
Tuchman, S., & Coffin, T. (1971). The influence of election night television broad-casts in a close election. Public Opinion Quarterly, 35(3), 315–326.
Van der Meer, T. W. G., Lubbe, R., Van Elsas, E., Elff, M., & Van der Brug, W.(2012). Bounded volatility in the Dutch electoral battlefield: A panel study on thestructure of changing vote intentions in the Netherlands during 2006-2010. ActaPolitica, 47(4), 333–355.
Van der Meer, T. W. G., Van Elsas, E., Lubbe, R., & Van der Brug, W. (2015). Arevolatile voters erratic, whimsical or seriously picky? A panel study of 58 waves intothe nature of electoral volatility (the Netherlands 2006-2010). Party Politics, 21(1),100–114.
Van Elsas, E., Lubbe, R., Van der Meer, T., & Van der Brug, W. (2014). Vote recall:A panel study on the mechanisms that explain vote recall inconsistency.International Journal of Public Opinion Research, 26(1), 18–40. Advance onlineaccess. doi: 10.1093/ijpor/edt031.
Warren, J. R., & Halpern-Manners, A. (2012). Panel conditioning in longitudinalsocial science surveys. Sociological Methods & Research, 41(4), 491–534.
Wellek, S. (2010). Testing statistical hypotheses of equivalence and noninferiority. BocaRaton, FL: Chapman & Hall.
Wichmann, W., & Brettschneider, F. (2009). American and German elite journalists’attitudes toward election polls. International Journal of Public Opinion Research,21(4), 506–524.
Biographical Notes
Tom van der Meer is Associate Professor at the Department of Political Science ofthe University of Amsterdam. His research interests encompass electoral volatility,political trust, citizen participation, and ethnic diversity. He has published on thesetopics in various journals such as the American Sociological Review, the Annual Reviewof Sociology, Comparative Political Studies, the European Journal of Political Research,the European Sociological Review, Party Politics, and European Union Politics.
Armen Hakhverdian is Assistant Professor at the Department of Political Science ofthe University of Amsterdam. He studies political representation, public opinion, andpolitical trust. He has published on these topics in various journals such as the Journal
O F F T H E F E N C E , O N T O T H E B A N D W A G O N ? 71
Downloaded from https://academic.oup.com/ijpor/article-abstract/28/1/46/2357273by Universite de Montreal useron 25 August 2018

of Politics and European Union Politics, West European Politics, and the British Journalof Political Science.
Loes Aaldering is PhD student at the Department of Political Science of theUniversity of Amsterdam. She studies the impact of media reports on electoralvolatility.
I N T E R N A T I O N A L J O U R N A L O F P U B L I C O P I N I O N R E S E A R C H72
Downloaded from https://academic.oup.com/ijpor/article-abstract/28/1/46/2357273by Universite de Montreal useron 25 August 2018