patricia m. danzon and michael f. furukawa incentives to prefer cheaper products. branded generics,...
TRANSCRIPT

NBER WORKING PAPER SERIES
CROSS-NATIONAL EVIDENCE ON GENERIC PHARMACEUTICALS:PHARMACY VS. PHYSICIAN-DRIVEN MARKETS
Patricia M. DanzonMichael F. Furukawa
Working Paper 17226http://www.nber.org/papers/w17226
NATIONAL BUREAU OF ECONOMIC RESEARCH1050 Massachusetts Avenue
Cambridge, MA 02138July 2011
Earlier versions of this paper were presented at the 2010 American Society of Health Economics meetingsand the 2009 Harvard Law School conference on Legal and Regulatory Issues in Pharmaceutical Researchand Development. This research was supported in part by the Merck Foundation Program on PharmaceuticalPolicy Issues to the University of Pennsylvania. The analysis is based on data obtained under licensefrom the IMS Health Incorporated MIDAS™ database. We would like to thank IMS Health and PfizerInc. for making the data available. The opinions expressed are those of the authors and do not necessarilyreflect the opinions of the research sponsors, IMS Health or the National Bureau of Economic Research.We are responsible for all conclusions and any errors.
NBER working papers are circulated for discussion and comment purposes. They have not been peer-reviewed or been subject to the review by the NBER Board of Directors that accompanies officialNBER publications.
© 2011 by Patricia M. Danzon and Michael F. Furukawa. All rights reserved. Short sections of text,not to exceed two paragraphs, may be quoted without explicit permission provided that full credit,including © notice, is given to the source.

Cross-National Evidence on Generic Pharmaceuticals: Pharmacy vs. Physician-Driven MarketsPatricia M. Danzon and Michael F. FurukawaNBER Working Paper No. 17226July 2011JEL No. I11,I18,K2,L5,L65
ABSTRACT
This paper examines the role of regulation and competition in generic markets. Generics offer largepotential savings to payers and consumers of pharmaceuticals. Whether the potential savings are realizeddepends on the extent of generic entry and uptake and the level of generic prices. In the U.S., the regulatory,legal and incentive structures encourage prompt entry, aggressive price competition and patient switchingto generics. Key features are that pharmacists are authorized and incentivized to switch patients tocheap generics. By contrast, in many other high and middle income countries, generics traditionallycompeted on brand rather than price because physicians rather than pharmacies are the decision-makers.Physician-driven generic markets tend to have higher generic prices and may have lower generic uptake,depending on regulations and incentives.
Using IMS data to analyze generic markets in the U.S., Canada, France, Germany, U.K., Italy, Spain,Japan, Australia, Mexico, Chile, Brazil over the period 1998-2009, we estimate a three-equation modelfor number of generic entrants, generic prices and generic volume shares. We find little effect of originatordefense strategies, significant differences between unbranded and unbranded generics, variation acrosscountries in volume response to prices. Policy changes adopted to stimulate generic uptake and reducegeneric prices have been successful in some E.U. countries.
Patricia M. DanzonHealth Care Management DepartmentThe Wharton SchoolUniversity of Pennsylvania3641 Locust WalkPhiladelphia, PA 19104and [email protected]
Michael F. FurukawaDepartment of Information SystemsW.P. Carey School of BusinessArizona State UniversityPO Box 874606Tempe, AZ [email protected]

3
I. Introduction
Pharmaceutical markets in the U.S. are characterized by relatively high prices while
drugs are on patent, followed by rapid generic entry and low generic prices once patents expire.
In 2009, generics accounted for 74.5 percent of prescriptions (Berndt and Aitken, 2010) but only
about 20 percent of sales, because generic erosion is rapid and generic prices are low, relative to
originator prices in the U.S. By contrast, generic penetration is slower and generic prices are
higher, both absolutely and relative to originator prices, in many other countries, implying only
modest savings from generics for payers and patients. These modest generic savings are prima
facie surprising. Post-patent entry should in theory be profitable for generic producers and
appealing for customers, because generics can largely free-ride on the R&D and informational
investments made by originator firms, thereby realizing much lower cost structures. Expiry of
patent barriers to entry also makes generic markets potentially more competitive than originator
markets.
This paper argues that these cross-national differences in generic shares and prices reflect
differences in regulatory and reimbursement policies that drive countries to have either
pharmacy-driven or physician-driven generic markets. The U.S. is a prototypical pharmacy-
driven generic market. Pharmacists are the key decision-maker for generics, because they are
legally authorized to substitute any substitutable (AB-rated) generic unless the physician
explicitly requires the brand, which is rare. U.S. pharmacies have financial incentives to prefer
cheaper generics and brand is irrelevant for substitutable generics that by regulation are certified
to be bioequivalent to the originator. Generics are therefore unbranded and compete on price for
the business of highly-price conscious pharmacies. Centralized purchasing by large chain
pharmacies has intensified generic competition in the U.S. Tiered co-payment structures have
encouraged patients to accept generics. However, pharmacies decide which generic to dispense
and patients, payers/PBMs and physicians usually play no role in choosing one generic
manufacturer over another (except for drugs dispensed through the mail, for which the PBMs
operate their own pharmacies). The U.K. and Canada resemble the U.S. pharmacy-driven generic
model in some respects, but with important differences, notably in Canada which regulates
generic prices rather than relying on competition.
By contrast, the regulation/reimbursement structure for generics in many other countries
has traditionally given less authority and fewer or even perverse incentives to pharmacies. In

4
particular, substitution was only permitted if the physician prescribed by chemical name (which
is uncommon except in the U.K.), and pharmacy dispensing fees that increased with the price of
the drug discouraged substitution of cheaper products, even if permitted. In markets where
pharmacists are either not authorized or incentivized to substitute, physicians prescribe generics
and originators by brand name and have little incentive to be price-sensitive (unless they are
personally at risk for drug costs). Generic companies therefore market “branded generics” that
compete on brand rather than price. Among major E.U. markets, France, Spain, Italy and
Germany were traditionally physician-driven, branded generic markets. Latin America also has
physician-driven, branded generic markets, with the added feature that many of these branded
generics are “similar” (have not met bioequivalence standards to the originator) and are therefore
of uncertain quality. Our basic hypothesis is that branded generics in physician-driven generic
markets will tend to be higher priced and have lower market shares than unbranded generics in
pharmacy-driven generic markets.
During the 2000’s, all the major E.U. countries adopted policy changes to reduce prices
and/or increase generic uptake and thereby realize generic savings. In 1989, Germany adopted
generic reference pricing to encourage competition in off-patent products and expanded the
system to include on-patent products in 2005. France, Italy and Spain adopted variants of generic
reference pricing in the early 2000’s.1 Although such RP systems usually induce originators to
cut prices to the RP, whether they create strong incentives for generic competition below the
initial RP depends critically on rules and incentives for pharmacy substitution. Most of these
countries have also expanded authorization for pharmacy substitution and modified dispensing
fees to incentivize generic use. Since 2007, German sickness funds have contracted directly with
generic companies, using competitive bidding to drive price competition and capture the
resulting savings for payers.
Latin American markets were also traditionally physician-driven, branded generic
markets, but with many “similares” or copy products that were launched prior to originator
patent expiry and were not required to meet bioequivalence standards. Brazil and Mexico have
established regulatory frameworks to authorize true, bioequivalent generics, but many similares
remain on the market. Pharmacy substitution is usually not legally authorized in countries where
1 Under generic reference pricing, the payer sets a single reference price (RP) as a maximum reimbursement for all generically equivalent products, leaving the patient to pay any excess of the manufacturer’s price over the RP.

5
generics are not required to be bioequivalent. In practice, patients often purchase drugs without a
prescription, in which case pharmacists may advise on substitution. Because generic quality is
uncertain, brand plays an important role in generic choice. Thus although patients generally pay
out-of-pocket for outpatient drugs and are presumably price sensitive, quality uncertainty leads
to competition on brand and undermines competition on price.
In Japan, physicians and hospitals traditionally dispensed the drugs that they prescribed
and captured any margin between a drug’s reimbursement price and its market price (or
acquisition cost). Branded generics were the norm. Their incentive was to maintain the
reimbursement price as high as possible, to enable discounting of the market price below the
reimbursement price, to increase the margin realized by the dispensing providers. Savings
accrued to payers only with a lag, as reimbursement prices were adjusted based on market prices
every two years. Unbranded generics had little presence in Japan until recent reforms.
This paper examines the performance of generic markets in 10 countries (the U.S., the
U.K., Germany, France and Spain, Italy, Japan, Canada, Brazil and Mexico) over the period
1998-2009. Our analysis draws on data from IMS Health Inc. on the universe of drug sales in
these countries. Our data permit both between-country comparison of branded vs. unbranded
generic markets and within-country comparison over time, to estimate effects of the policy
changes. We estimate a model for three dimensions of generic markets: any entry and number of
generic manufacturers; generic prices, relative to baseline originator prices; and generic volume
share. We examine how each of these dimensions of generic markets changed over time in
response to policy changes.
We also examine the effects on generic markets of originator defense strategies,
specifically, launch of new licensed brand products (co-branding) or new formulations prior to
patent expiry. Theory and prior evidence suggest that co-branding may be effective in physician-
driven, branded generic markets (for Italy, see Pammoli et al. 2002; for Germany, see Appelt,
2009); however, such strategies are less likely to be effective in pharmacy-driven, unbranded
generics market. Launching new formulations prior to patent expiry on older formulations may
be a rational strategy in both market types, depending on reimbursement rules. Originator
strategies to deter generic entry have been the focus of the E.U. Generics Inquiry.
Our empirical evidence confirms that generic price competition is greater in pharmacy-
driven markets than in physician-driven markets, provided that pharmacies face financial

6
incentives to prefer cheaper products. Branded generics, which predominate in physician-driven
markets, are less price competitive than unbranded generics that predominate in pharmacy-driven
markets, as predicted. Our results confirm previous evidence that generic entry is related to
market size; however, differences across countries in number of generic competitors is not
explained by overall market size, plausibly because the extent of price competition, cost
structures and profit margins also differ. We find little evidence that originator defense strategies
are successful on average, except that launch of delayed release formulations does deter generic
penetration in the U.S. Recent changes in generic regimes in four previously physician-driven,
branded generic markets of the E.U. (Spain, France, Italy and Germany) have had significant
effects, with unbranded generics gaining share. However, these countries still lag the U.S. and
U.K. in speed and extent of generic penetration.
II. Generic Regulation and Reimbursement
Generic entry is constrained in all countries that are members of the World Trade
Organization (WTO) by patents and regulatory protections of innovator products. Although all
WTO countries must recognize a 20-year product patent term, effective patent life for
pharmaceuticals is typically shorter but differs across countries (Grabowski and Kyle, 2007).
Most countries provide for some patent term restoration to compensate for time lost during
R&D, and a data exclusivity period during which generics may not reference the originator data
for regulatory approval. Patents may also be challenged prior to expiry, and this is increasingly
common in the U.S. The originator’s effective patent life post launch is the net result of all these
factors.
Patents may be challenged in any country, but the U.S. is unique in rewarding successful
challenges, by granting 180-day market exclusivity to the first generic to successfully challenge
the originator patents (a paragraph IV certification).2 During this 180 days, the originator may
market an authorized generic (licensed under the originator’s NDA), but no other ANDA-
approved generics can enter. These paragraph IV and associated 180-day exclusivities have
reportedly become increasingly common since the late 1990’s, which is expected to result in
2 The 1984 Waxman-Hatch Act’s Abbreviated New Drug Application (ANDA) process permits generic approval with evidence of bioequivalence, once the originator’s patents and other exclusivities have expired or been successfully challenged.

7
higher generic prices during the first two quarters post launch in the U.S. Greater use of
paragraph IV may also result in earlier generic entry over time in the U.S., unless it is offset by
increased originator use of mechanisms for patent and exclusivity extensions.
In addition to patent and data exclusivity provisions, the incentives for generic entry and
generic price competition depend on regulatory rules affecting generic competition and
reimbursement, including rules government pharmacists’ authority to substitute generics;
reimbursement incentives for substitution; whether generic prices are regulated or competitively
set; and patients’ incentives to accept generics, through co-payment structures. The tiered co-
payment structure in the US offers patients a larger financial incentive to accept generics than in
any other country.
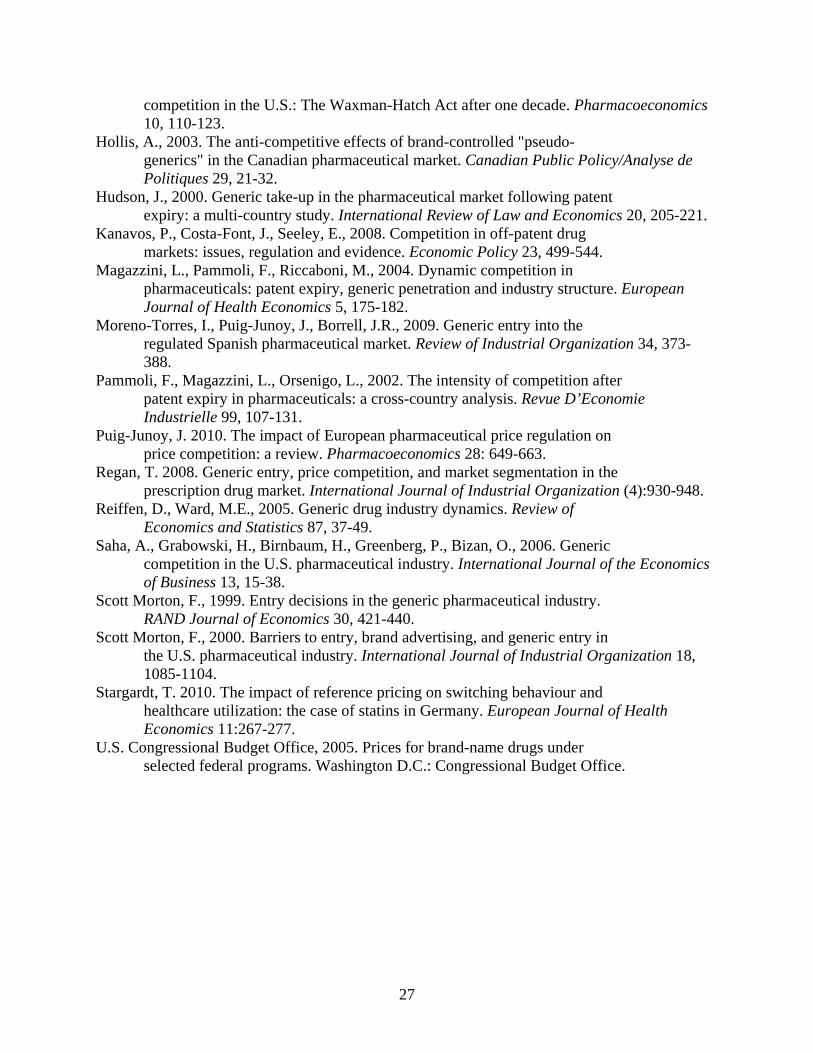
Table 1 summarizes regulatory and reimbursement characteristics of our sample
countries. This is an oversimplification of the complex regimes and changes over time in each
country.3 As a rough characterization, we assume that the U.S., the U.K., and Canada are
primarily pharmacy-driven generics markets, and physician-driven markets include France,
Germany, Italy, and Spain at the start of our period, plus Japan, Brazil, and Mexico.
Most countries implemented changes in the 2000’s. France, Germany, Italy, and Spain
implemented multiple policy changes to stimulate generic uptake and/or reduce prices. The U.K.
changed its rules for setting generic reimbursement in 2005. Brazil and Mexico encouraged
bioequivalence testing and the growth of unbranded generics. The U.S. experienced some growth
in paragraph IV challenges, and the 2003 Medicare Modernization Act reduced the incentives for
originators to list late patents by permitting only one 30-month stay per molecule.4 Some
Canadian provinces reduced the regulated prices on generics, and other changes were adopted in
2010, after our observation period. Our empirical analysis tests for effects of these changes in
each country.
III. Previous Literature
Early studies of generic entry and price competition focused on the U.S. Models of
number of entrants have consistently found that generic entry is related to market size (for
example, Scott Morton, 1999; Saha et al., 2006) and that generic prices are inversely related to
3 More detail is reported in an Appendix available upon request from the corresponding author. 4 When a generic company challenges an originator patent, the originator may obtain an injunction for up to 30 months or the resolution of the litigation, whichever occurs first.

8
number of generic competitors in the U.S. (Grabowski and Vernon, 1992; Saha et al., 2006).
Most previous studies do not address the role of pharmacies as key decision-makers in U.S.
generic markets and the effects of pharmacy-driven markets on the nature of competition.
Several papers (for example, Scott Morton, 2000) hypothesize that originator firms may use
promotion to deter generic penetration but find no effects. This is unsurprising in the context
where pharmacy substitution is the norm, such that detailing to persuade physicians to choose a
particular brand does not assure that the originator product is dispensed. In such markets,
originator advertising generally declines and ultimately ceases as patent expiration approaches.5
Reiffen and Ward (2005) estimate a structural model of generic entry and prices using data from
the early 1990s.
Several recent papers have examined generic uptake in other countries. Hollis (2003)
reports on anti-competitive effects of strategic licensing of brand-controlled “pseudo-generics” in
Canada, which are found to deter generic entry. Magazzini et al. (2004) examine generic entry in
the U.S., the U.K., Germany and France using sales data from July 1987-December 1998 on
major molecules with patent expiry 1986-1996. Using a Tobit estimator applied to pooled panel
data for the four countries, they conclude that market share of licensed products (defined as
products launched within 3 years of patent expiry) is negatively related to unbranded generic
market share whereas number of different brand names has a positive effect. Possible reasons for
these apparently contradictory findings are not explored.6 Appelt (2009) provides evidence of
originator licensing strategies prior to patent expiry and branded generics’ use of trade marks to
enhance brand competition in Germany’s branded generic market. Hudson (2000) examines
generic entry and erosion of brand shares in four markets (U.S., U.K., Germany and Japan) using
data from the early 1990’s which predates the more recent growth in generic erosion in the U.S.
and pro-generic policy changes in other countries. Moreno-Torres et al. (2009) provide detailed
evidence on generic entry in Spain. Ghislandi et al. (2005) and Garattini and Ghislandi (2006)
discuss recent changes in Italy. Kanavos et al. (2008) and Puig-Junoy (2010) discuss European
price regulation and its impact on generic competition. 5 Ellison and Ellison (2011) find weak evidence for pre-patent expiry use of promotion to deter generic entry by medium-sized incumbents, using data from 1986-1992, which predate the growth of payer strategies to encourage pharmacy substitution and generic uptake by patients. 6 They regress market share of unbranded drugs on lagged market share of licensed products in an uncensored Tobit model that includes markets with no generics. The negative coefficient on licensed products may be dominated by the observations with zero generic share (for which the relationship is necessarily negative), and it is unclear whether it would hold in the subset of market with generic entry.

9
Our paper adds to these previous studies by providing a consistent analysis and
comparison across 10 different countries and over a more recent time period that includes
experience after the recent reforms in several countries. Our approach is also the first to focus on
the importance of pharmacy substitution and pharmacy incentives in creating pharmacy-driven
rather than physician-driven generic markets, and the resulting distinction between competition
focused on price vs. brand.
IV. Data
The data for this study are from the IMS MIDAS database of quarterly sales of all drugs
over the period 1998-2009 in 10 countries, including the major E.U. markets, two major Latin
American markets, the U.S., Canada and Japan. Within this universe of products, we define the
sample of molecules potentially subject to generic entry as molecules with global age (years
since first global launch of the molecule) between 8 and 20 years. This age window was selected
based on the assumption that product patents are filed at roughly the same date in all countries,
that R&D (discovery, preclinical and clinical trials, and regulatory review) typically absorbs at
least 8 of the 20 year patent term, and that most countries offer patent extensions or
supplementary protection certificates for up to 5 years to compensate for this loss.7 This age
range encompasses the ages with greatest generic entry, although entry in most countries spans a
longer age range. We define the lag in generic entry of product i in country j as months from first
originator launch of that product in country j, recognizing that this lag may reflect legal barriers
as well as economic factors.8
Our analysis focuses on single molecule prescription drugs in the retail pharmacy
channel. We exclude combination products, for which global age and hence generic eligibility
are ambiguous. We exclude biologics because they are ineligible for the standard abbreviated
generic approval procedures in the U.S. and most other countries.9 We also excluded
miscellaneous therapeutic categories (hospital solutions, diagnostic agents, various) and unusual
forms (non-human use, use unknown). IMS assigns each product into one of five license 7 Defining products eligible for generic entry by expiry date of all listed patents is not appropriate, even if we had the data, because generic companies increasingly challenge listed patents prior to their expiry. 8 Major differences across countries in regulatory and reimbursement barriers to generic entry are described in an Appendix, which is available upon request from the corresponding author. 9 Abbreviated approval procedures for biosimilars have been outlined in the E.U. and U.S. in the late 2000’s. Although a few biosimilars have been launched, their higher regulatory costs and lower substitutability make them very different from chemical generics analyzed here.

10
categories: originator brand, licensee, branded generic, unbranded generic, or “Patent not
assigned”.10 Our analysis is at the level of the presentation (molecule-form-strength) because
pharmacy substitution is authorized only within presentation. All price and sales data are
adjusted to 2009 values using country-specific general producer price indexes (PPIs) as the best
available measure of input costs. Most analysis is in local currency units, but where prices are
converted to U.S. dollars we use 2009 exchange rates.
Although this IMS database is more comprehensive and more detailed than the data used
in previous studies, certain limitations must be noted. First, the IMS categorization of generics as
branded or unbranded is the best available but may nevertheless be an imperfect indicator for
whether products compete primarily on brand or price. Second, the products designated as
generics in some countries, notably Brazil and Mexico, include copy products (similares), some
of which entered early in the originator life, due to lack -- or weak enforcement -- of product
patent regimes, and are not necessarily bioequivalent to the originator drug.11 Third, the IMS
data do not designate which generics have met bioequivalence tests and hence are more likely to
be considered substitutes by physicians, pharmacists and patients than those that lack a
bioequivalence certification. Fourth, when a merger occurs between two firms, IMS consolidates
their separate data retroactively. Our data may therefore potentially undercount the number of
generic competitors, particularly in the earlier years.
V. Empirical Framework and Methods
Our descriptive and regression analyses focus on the main determinants of overall generic
savings to payers: whether and when generic entry occurs; number of branded and unbranded
generic competitors; generic and originator prices; and generic volume shares. The analysis is at
the level of the presentation-country-quarter, defined by molecule, four-digit anatomical
therapeutic class, formulation and strength, because pharmacy substitution of generics is
authorized only between presentations with the same molecule, formulation and strength. We
10 We used the corporation and molecule age to reassign products with Patent Not Assigned into branded generic or unbranded generic status. 11 We excluded from these calculations the small number of generic launches that reportedly occurred within 5 years of the originator launch, except in countries where such early launch dates are plausible due to late adoption of patent regimes (Brazil, Mexico, Italy, and Spain). For other countries, we reassigned the license status of these implausibly early generics from branded generic to licensed brand and included them as licensees in all other analysis. We also exclude generics for which no originator is present in any year of our data.

11
estimate a four equation model for: any generic entry for the ith presentation in country j in year
t; number of generic firms, conditional on entry; generic or originator price (relative to baseline
originator price); and generic volume share:
Gijt = f1 (Rijt-2; Dijt-2; Fij; Mij; Zt; u1ijt) (1)
Nijt = f2 (Rijt-2; Dijt-2; Fij; Mij; Zt; u2ijt) (2)
Pijt = g (Nijtb; Nijt
u; Fij; Mij; Zt; u3ijt) (3)
Sijt = h (Pijt; Nijtb; Nijt
u; Fij; Mij; Zt; u4ijt) (4)
where Gijt is an indicator for Any Generic entrant in the presentation-country-year, Nijt is number
of generic manufacturers (branded and unbranded), conditional on entry, Pijt is normalized price
(generic or originator, defined below), Sijt is generic volume share; Rijt-2 is molecule sales in the
presentation-country lagged 2 quarters; Dijt-2 is a vector of (lagged) originator defense strategies;
Fij is a vector of indicators for non-oral forms; and Mij is molecule-specific characteristics. Zt is a
vector of indicators for two time periods, 2002-05 and 2006-09, that test for changes in the
dependent variable, relative to the referent period, 1998-2001.
We estimate separate regressions for each country, to permit all coefficients to vary by
country. Other details of the estimation approach are reported in Section VI.B., with reporting of
regression results. We now discuss the rationale for included variables and their measurement:
1. Any Generic (G) and Number of Generics (N)
Sales (R): We postulate the same model for entry of Any Generic and Number of Generics,
conditional on entry, but allow parameter estimates to differ. Following Bresnahan and Reiss
(1991), Scott Morton (1999, 2000) and others, equations (1) and (2) hypothesize that any generic
entry and number of generic competitors in a presentation-market depend on the market size (R,
gross sales), assuming certain fixed entry cost per firm, due to regulatory and other entry
requirements that may differ across countries. Market size is measured by annual sales at
manufacturer prices in the retail and hospital channels combined, lagged two quarters.12 Costs of
entry differ by formulation (F), with higher manufacturing and regulatory costs for intravenous,
topical, and other complex forms compared to simple oral solids (tablets and capsules).
12 The appropriate lag for the Originator sales variable depends on when generic firms make entry decisions. If potential entrants accurately project market sales at the time they are likely to enter, our two quarter lagged revenue measure should reasonably characterize the expected relative market size that was relevant to generic decisions to undertake entry.

12
Originator Defense Strategies (D): We test for effects of three potential originator
defense strategies: Number of Licensees, Number of New Originator Formulations launched just
prior to patent expiry, and OTC share, all lagged two quarters. Originators may have incentives
to launch co-branded licensees to steel share and pre-empt generic competitors in physician-
driven generic markets with brand competition. Such incentives are not expected in price-
competitive, pharmacy-driven markets such as the U.S., except for authorized generics launched
during the Paragraph IV exclusivity period.13 Incentives to launch improved formulations, such
as extended release forms, may exist in both pharmacy and physician-driven markets, because
generic substitution is only permitted within a formulation. The originator’s incentive to launch
new formulations close to patent expiry of older forms is increased if the new forms receive
some additional patent or regulatory exclusivity and can be reimbursed at prices above the price
of generic versions of the older formulations. Such conditions exist in the U.S., where aggressive
marketing can successfully switch physicians/patients to the new, protected forms and away
from the patent-expiring form which faces generic entry. However, launching new formulations
is less likely to be profitable in countries where reference pricing or similar reimbursement rules
limit reimbursement for all formulations of a molecule to the lowest price per daily dose for that
molecule, which is likely to be a generic once the patent expires on any formulation in the
molecule. Finally, for molecules that meet regulatory requirements for patient self-medication,
originators may launch an over-the-counter (OTC) formulation to preempt generic competition
in the Rx formulation after patent expiry.
Molecule Global Age, Launch Lag and Diffusion (M) and Form (F): Molecule Global
Age (months since first launch of the molecule in any of our sample countries, hereafter “global
launch”) is included as a proxy for unobserved patent term. The greater Molecule Global Age,
the more likely that unobserved patents and other exclusivity barriers to entry have expired.
Country-specific Molecule Launch Lag (months from global launch to first launch in country j)
is a proxy for country-specific data exclusivities that usually run from the originator’s country-
specific launch. It is also expected to be positively associated with generic entry. Global
13 In the U.S., several originator firms in the early 1990’s launched their own generic products to compete with true generics; however this strategy simply accelerated the downward pressure on generic prices and was abandoned. Originator launch of generics in the U.S. is now confined to “authorized generics” launched during the 180-day exclusivity period awarded to paragraph IV challengers, when prices remain high because only one ANDA-approved generic competitor is present..

13
Diffusion, measured as the number of countries in our sample in which the molecule is launched,
is an indicator for availability of foreign supply sources and possible economies of scale for
generic suppliers; it is expected to be positively associated with entry. A vector of Formulation
indicators (F) controls for formulations (extended release, intravenous, topical, other complex
forms) that have higher manufacturing and/or regulatory costs than the referent oral solid forms,
and are therefore expected to attract less generic entry.
Regulatory Changes (Z): Entry incentives depend on regulatory and reimbursement
provisions, which differ by country and over time within country. Because regulatory and
reimbursement policies affecting generics differ significantly across countries and several
countries changed multiple policies over our time period, we use two indicator variables for
years 2002-2005 and 2006-2009 to measure the combined effects of country-specific policy
changes. The referent period is 1998-2001.
2. Normalized Generic Price
Our measure of generic price PijtG for presentation i in country j in period t is the volume-
weighted average generic price for all generic versions of presentation ijt, normalized (divided)
by the earliest originator price for presentation i in country j in our dataset. This normalization
yields a unit-free measure of price that permits comparison of trends over time and across
molecules and countries, for products with very different absolute price levels. It is independent
of exchange rates and country-specific changes in the originator price.14
Number of Generic Competitors (N): Under standard models of competition, normalized
generic price is expected to be inversely related to number of generic competitors, with a greater
effect for unbranded generic competitors (Nu) than for branded generic competitors (Nb). The
effect of generic competitors on price is expected to be greater in countries with pharmacy-
driven vs. physician-driven markets.15
Regulatory Changes (Z), Formulation (F), and Molecule Characteristics (M): Time
period indicators are included to capture effects of regulatory and reimbursement changes that
affected generic prices directly, such as the change in reimbursement rules in the U.K., reference
14 Several previous papers use the contemporaneous generic/brand price ratio, which may confound changes in generic prices in the denominator with changes in originator prices in the numerator. 15 N can be treated as predetermined in the price equation due to the regulatory lag in getting market authorization. In the U.S., this takes at least a couple of years.

14
pricing in France, or sickness fund contracting in Germany. Formulation indicators and Global
Diffusion control for cost differences.
3. Normalized Originator Price
We estimate a similar model of normalized originator price PijtO, also normalized to the
earliest originator price for the same presentation in the dataset. Frank and Salkever (1992, 1997)
and Regan (2008) have argued that originators pursue a segmentation strategy that leads to
increased originator price in response to generic competition. Although this may have been an
optimal strategy in the 1990’s in the U.S., this may no longer be true in the 2000’s, given the
growth of insurance plans that require patients to pay the difference between the generic co-pay
and the originator price or third-tier co-payment.. In most countries other than the US, including
the U.K., price regulatory systems disallow post-launch originator price increases and, more
generally, may make segmentation pricing strategies infeasible and/or non-optimal. In countries
with generic reference pricing, such as Germany and France, although pricing above the
reference price is permitted in theory, in practice originators usually cut price to the reference
price because patient demand is very elastic above the reference price (see Stargardt, 2010, for
recent evidence from Germany). Thus normalized originator prices are expected to be flat or
declining after generic entry in most countries. It is an empirical question whether increasing
price in response to generic entry remains an optimal strategy in the US and possibly Mexico,
where price regulation is weakly enforced.
4. Generic Volume Share
Generic volume share is expected to be inversely related to generic price in pharmacy-
driven markets. In physician-driven markets, price sensitivity is expected to be weaker,
especially for branded generics and before reforms to stimulate price sensitivity. Simultaneous
determination of price and volume is expected in countries where generic prices are
competitively determined (U.S., U.K.). We therefore estimate eq. (4) with both OLS and two-
stage least squares (2SLS), in which generic price is treated as endogenous using the hospital
price and an indicator for chronic medications as instruments. For other countries where generic
prices are set by regulation or constrained through RP reimbursement, generic prices may be less
responsive to market conditions, in which case OLS estimation may be appropriate. The Generic

15
Volume Share equations also include as control variables: number of branded and unbranded
competitors (treated as predetermined), generic age (months since first generic launch of
presentation i in country j), formulation and molecule effects, as well as time dummies to capture
regulatory changes.
VI. Results A. Descriptive Analysis
We first characterize the cross-national differences in generic markets using graphic
analysis to compare generic entry, generics prices and shares across countries. For some
variables, we compare starting (1998-2001) and ending (2006-2009) values, hereafter referred to
as 2001 and 2009. For other variables, we show average values over the entire period to conserve
space, but note that this masks the changes over time, which are discussed later. Descriptive
statistics are reported in Appendix Table 1.
1. Any Generic and Number of Generics
Almost all countries experienced an increase in the percent of molecules in the 8-20 year
cohort with generic entry over the 2000’s decade (Figure 1). France had the largest percentage
increase from 7 to 25 percent. Brazil has the highest generic presence, with 41 percent of
molecules age 8-20 years having a generic, plausibly reflecting similares that entered before
patent protection.
Figure 2 shows the effective patent life or mean age of the originator at first generic entry
for the molecule (Generic launch lag).16 The low initial values in 2001 for Spain (8.1 years) and
Italy (8.7 years) may reflect originator-initiated (“authorized”) generics that do not represent a
true generic challenge to effective patent life. Over time, generic launch lags decline in some
countries, including France, Germany and the U.K., reflecting more rapid entry possibly in
response to pro-generic policies. Generic launch lags increased in Italy, Spain, Brazil and
Mexico, possibly reflecting fewer copy products as enforcement of IP improved. In the U.S. the
mean generic lag increased minimally, from 11.2 in 2001 to 11.4 in 2009. This suggests that any
16 A small number of generic launches reportedly occurred within 5 years of the originator launch. We treated such early launch dates as implausible and excluded them from these calculations in all countries except Brazil, Chile, Mexico, Italy, and Spain, which had late or weak patent enforcement.

16
increase in Paragraph IV patent challenges was on average offset by increased use of exclusivity
extensions, such as for pediatric trials. Effective patent life is almost two years longer in the US
(11.3 years) than in Canada (9.4 years).
Once generic entry occurs, in most countries the number of generic manufacturers
increases initially and reaches a plateau roughly two years from first generic entry (Figure 3).
Germany has the most generic manufacturers per presentation, averaging 9 by quarter 5,
followed by France and Japan at 5-6, all traditionally branded generic markets. By contrast, the
U.S. averages 4-5 generic manufacturers per presentation. Although Brazil and Mexico have a
high proportion of molecules with generic presence, they have relatively few (1-2) generics per
presentation.
This evidence of more generics per presentation in countries other than the U.S. is prima
facie surprising because the U.S. has much larger sales, by value or volume, than other countries
(Table 2-3). Country-specific studies (e.g. Scott Morton, 1999) have consistently found a strong
relationship between number of generic entrants and sales, consistent with standard entry models
with fixed costs (Bresnahan and Reiss, 1991). This cross-national evidence of more
manufacturers per presentation in much smaller markets than the US implies that the gross sales
value necessary to attract generic entry is lower in other countries, plausibly due to higher
expected generic prices and less price-competitive generic markets in other countries.
To provide evidence on this, Table 3 shows median annual sales per generic
manufacturer and price per dose at 2 years since generic entry, overall and by number of generics
per presentation. All other countries (except Japan) have lower overall average gross sales per
generic manufacturer and higher average price per dose than the U.S., followed by the U.K.17
Price per dose is relatively high ($0.88) in the U.S. for presentations with only one generic,
which would primarily reflect paragraph IV exclusive markets. However, for the typical
presentation with at least 4 generics, the U.S. average price ($0.23) is lower than all other
countries except the U.K. ($0.22). Conversely, Canada has the highest generic prices and lowest
sales per manufacturer, plausibly due to regulatory barriers to price competition. The decline in
average generic price with number of manufacturers is greater in the U.S. and the U.K. than in
other countries – indeed, the relationship is positive or flat in Canada, Italy, Japan and Mexico.
17 Japanese price are lower on a per dose basis because average grams of active ingredient per dose are consistently lower in Japan than in most other countries (Danzon and Furukawa, 2008).

17
This evidence is consistent with the branded and/or price-regulated generic markets being less
price competitive than the U.S. and U.K., enabling generics firms to survive on lower gross sales
per presentation than is feasible in the more price competitive U.S. or U.K. markets.18
Figure 4 shows the life-cycle of normalized generic prices by quarter since first generic
entry.19 In the U.S., generic prices are initially 75 percent of baseline originator price, consistent
with limited competition during the paragraph IV exclusivity period. Thereafter, generic prices
drop rapidly to 36 percent of baseline originator price after two years. The U.K., Germany and
Mexico also have declining generic prices after generic entry but at higher levels – declining
after two years to 60 percent of the originator price in the U.K., 50 percent in Germany and 72
percent in Mexico. In all other countries, generic prices are relatively flat over time, at 50-70
percent of baseline originator prices, despite entry of more competitors shown in Figure 3. This
evidence of relatively high normalized price levels that are flat over time despite competitive
entry is consistent with the hypothesis of weak price competition in physician-driven, branded
generic markets, despite multiple generic competitors per presentation.
Figure 5 shows that normalized originator prices are generally stable in response to
generic entry, but at different levels reflecting different regulatory regimes. In the U.S., the mean
normalized originator price is 1.24 at generic entry, reflecting the increase in real originator
prices over time prior to patent expiration that is common in the U.S.20 However, whereas some
earlier studies found that originator prices increase in response to generic entry (Frank and
Salkever, 1997; Regan, 2008), our results show a modest decline in originator prices after
generic entry in the U.S. from 1.24 to 1.13, possibly reflecting the smaller size of the brand loyal
market in recent years compared to the time of these earlier studies. In Germany and France,
originator prices decline by 21 and 12 percent, respectively, in the 2 years post generic entry,
plausibly reflecting the incentive of originators to cut prices to the reference price in these
countries. In most other countries originator prices are stable over the two years following
18 These IMS prices may be upward biased for true transactions prices in countries where off-invoice discounts to pharmacies are common. These discounts average over 30 percent in the U.S. (CBO, 2005). The fact that gross sales per generic are smaller in other countries than in the U.S. makes it unlikely that any unobserved discounts are greater in other countries than the U.S. 19 Recall that normalization is to the earliest originator price available in our dataset (“baseline originator price”), which is invariant over time for each presentation. Although these baseline originator prices are observed at different originator ages, including some that occur after generic entry, given the stability of originator prices (see Figure 5) this should not matter. Moreover the normalization is invariant over time for a given presentation, so measures of generic price change over time are unaffected by differences across molecules in the baseline originator age. 20 Recall that we deflate all nominal prices by the country-specific general Producer Price Index.

18
generic entry, between 70-90 percent of baseline prices (except 60 percent for Italy), consistent
with regulatory constraints on price increases and possibly some mandatory cuts. .
Conditional on generic entry, generic penetration is most rapid and reaches the highest
peak in the U.S. (89 percent of unit volume in two years), followed by Canada (74 percent)
(Figure 6). High generic penetration in Canada, despite its high regulated generic prices, is
consistent with the hypothesis of extensive off-invoice discounting to pharmacies that is not
captured by payers or in the IMS data. Ontario has recently taken steps to change this system.21
The U.K. also has relatively rapid generic adoption due to strong pharmacy substitution
incentives. In Germany the rapid generic adoption presumably reflect both drug budgets for
physicians and requirements for generic substitution adopted during the 2000s. Japan and Italy
have the lowest generic shares (under 40 percent).
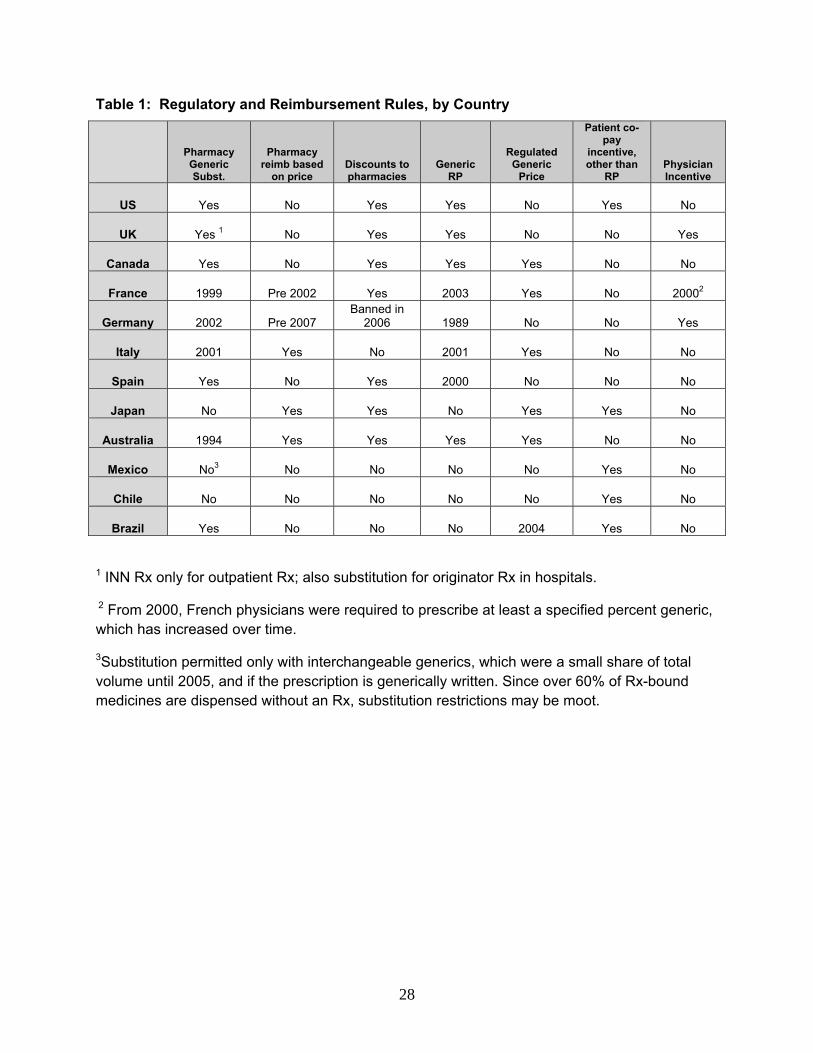
Over the 2000’s, most countries experienced growth in generic uptake, primarily due to
growth in unbranded generics (Figure 7). Of the four E.U. countries that adopted significant pro-
generic policy changes (France, Germany, Italy and Spain) all started with relatively high
branded generic shares in 2000 but achieved growth in unbranded and total generic penetration
over time, except Italy, where growth in unbranded share is more than offset by decline in
branded generic share. Although at the start of the period only the U.S., Canada and the U.K. had
predominantly unbranded generics, by the end this was also true for France, Germany, and
Spain. By contrast, Brazil and Mexico remain predominantly branded, and Japan is roughly
evenly split, but with a very low generic share.
B. Multivariate Regressions
Appendix Tables 2-5 report the full regression analysis of determinants of generic entry,
generic and originator prices and generic market shares, for branded and unbranded generics
combined, to conserve space. Summary Tables 4-7 report key coefficients, including coefficients
with branded and unbranded generics measured separately. We estimate separate equations for
each country, to permit all coefficients to vary across countries. The unit of observation is the
country-quarter-presentation (molecule-formulation-strength). We report marginal effects with
robust standard errors and clustering by molecule to address unobserved molecule-specific
effects. Some explanatory variables that are treated as pre-determined are lagged two quarters.
21 See http://www.mercer.ca/referencecontent.htm?idContent=1377645&siteLanguage=1007, accessed 6/24/2011.

19
We report probit estimates for the Any Generic equation and use a negative binomial estimator
for the Number of Generics equation. Results are robust to alternative estimation methods, including OLS
and zero-inflated negative binomial models. 22 To address the potential endogeneity of price in the
volume share equations for countries where generic prices are determined by market competition
(especially the U.S. and U.K.), we estimated both OLS and two-stage least squares (2SLS) via
generalized method of moments (GMM). Instrumental variables are generic price in the hospital
channel and an indicator for therapeutic classes that treat chronic conditions. These results are
reported below the OLS estimates in Table 4.
1. Any Generic and Number of Generics
The probability of Any Generic and Number of Generic manufacturers conditional on
entry are both positively related to lagged log sales in almost all countries (Table 4), consistent
with standard theories of entry in markets with fixed costs and evidence from previous studies.
The exception is that Any Generic is not significantly related to sales in the U.S., suggesting that
even small markets attract generic entry. In the traditionally physician-driven, branded generic
markets of France, Germany, Spain and Italy, the responsiveness of entry to sales is higher for
unbranded generics than for branded generics, as expected if unbranded generics are typically
lower priced and therefore need larger sales volume to break even.
The evidence in Appendix Tables 2-3 suggests that proliferation of licensee brands by the
originator does deter entry of any generic in Italy, consistent with Magazzini et al. (2004), but
not in other countries.23 There is no support for the hypothesis that licensees reduce the Number
of Generics, conditional on entry, in any country. Thus, this more recent evidence conflicts with
earlier findings for Canada (Hollis, 2003) and Germany (Appelt, 2009), possibly because a brand
saturation strategy becomes ineffective as a generic entry deterrent as generic markets become
more unbranded and pharmacy-driven, as competition shifts to price rather than brand.24
22 We do not estimate a hazard model for generic launch because defining the starting point is conceptually and empirically problematic, given that patents can be challenged, and we lack data on expected expiry dates for patents and data exclusivities. 23 The marginally significant negative coefficient on licensees in the Any Generic equation for the U.S. is probably spurious. Licensee proliferation is irrational in a market dominated by pharmacy substitution, and co-branding is extremely rare in the US. The mean number of licensees in the U.S. (0.42) compared to Italy (0.76) and Germany (0.86) is consistent with the hypothesis that licensing co-branded pseudo-competitors is a less common strategy for originators in the U.S. than in physician-driven, branded generic markets. 24 The significantly positive licensee coefficients for Number of Generics in Spain and Brazil may reflect coding error, because licensees in these countries may be local branded generics manufacturers.

20
The originator defense strategy of launching alternative formulations shortly prior to
patent expiry does deter any generic entry in the U.S. and also reduces number of generic
entrants in the U.S. and Canada, but not in other countries. This evidence that launching new
formulations is uniquely effective in the U.S. (and partially effective in Canada) is consistent
with the hypothesis that U.S. reimbursement systems facilitate both switching patients and
maintaining high prices for these new forms, compared to price-regulated markets which often
reimburse new formulations at the same price as older versions of the same molecule under
reference pricing.
Extended release, intravenous, topical and other complex formulations are much less
likely to attract generic entry than oral solids in multiple countries, plausibly due to higher
manufacturing and possibly regulatory costs. OTC market share of the presentation does not
deter Any Generic entry but does reduce number of generic entrants in the U.S., plausibly
because OTC prices are relatively cheap in the U.S. and hence offer consumers a popular
alternative to generic Rx versions, although the OTC forms are not covered by insurance. OTC
effects are also negative for France. Hospital share of sales is negatively related to Any Generic
and Number of Generics in most countries.25 This suggests that hospitals markets are less
attractive to generics than retail pharmacy sales, possibly because originators give large price
discounts to hospitals in most countries, including in countries that regulate retail prices.26
Molecule Global Age is positively related to Any Generic and Number of Generics,
confirming that this variable is a rough proxy for unobserved patent terms. Delay in originator
launch is negatively related to Any Generic and Number of Generics in the U.S., with less
consistent effects in other countries, suggesting that data exclusivities that run from country-
specific molecule launch are a more binding barrier to generic entry in the U.S. Global Diffusion
of a molecule is positively associated with Number of Generics in Canada, Germany, Spain,
Brazil and Mexico, suggesting that availability of foreign supplies of active ingredients and/or
finished product facilitates generic entry in these countries, because local generic firms rely on
foreign suppliers.
25 The IMS data do not report hospital sales for the Latin American countries. 26 Scott-Morton (1999) found a positive relation between hospital share and generic entry. Magazzini et al. (2004) found a negative relation between hospital share and unbranded generic share in a regression that pooled 4 countries, including the U.S.

21
2. Prices
Normalized Generic Prices: Previous studies of U.S. generic markets have consistently shown
that generic prices decline with number of generic competitors. Whether price competition works
as effectively for physician-driven, branded generics markets and how this has changed over
time are important empirical questions addressed in Appendix Table 4, summarized in Table 5.
Normalized generic prices are negatively related to number of unbranded generics in
most countries, and unbranded generics are more effective at reducing prices than branded
generics in Germany, Italy, Spain, Brazil and Mexico, as predicted. Prices are unrelated to
number of competitors in France, suggesting that the reference price system and other
regulations may have blunted price competition. In Japan, generic prices are negatively related
only to branded generics, possibly because unbranded generics are still uncommon. Unbranded
and branded generics have similar and large negative effects on price (0.076 and 0.097 percent,
respectively) in the U.K., where aggressive pharmacy substitution plausibly forces both branded
and unbranded generics to compete on price. In Canada an additional branded or unbranded
generic reduces generic price by only 0.01 percent, plausibly due to regulation of generic prices
that applies to both unbranded and branded generics. In Mexico generic prices are positively
related to number of branded suppliers.
Normalized Originator Prices: Consistent with our graphical analysis, multivariate
regression analysis shows no evidence that originator prices increase with number of generics in
the U.S. (Table 5), contrary to segmentation theory and previous evidence (Frank and Salkever,
1997; Regan 2008). The measured effect for number of unbranded generics is negative but very
small (0.006) and only marginally significant in the U.S. By contrast, originator prices are
negatively related to the number of unbranded generics but number of branded generics has no
effect in France, Italy and Spain. This suggests that the reference pricing systems in these
countries have brought down originator prices and, together with other measures, have
encouraged the entry of unbranded generics that compete on price.
3. Generic Volume Shares
Table 6 reports effects of generic prices on generic volume shares for OLS and 2SLS-
GMM estimators. Endogeneity of generic prices is plausible in the U.S. and the U.K., where
generic prices are unregulated and generics compete on price to gain market share. The 2SLS

22
estimates pass tests for instrument validity and overidentification in all countries. For other
countries where generic prices are either regulated or constrained by reference pricing, and
competition focused on brand rather than price at least initially, prices are less endogenous to
share, and OLS results may be plausible. For most countries the OLS and 2SLS results are
similar, with 2SLS showing slightly more negative share elasticities than OLS, especially in
Canada.27
Generic volume shares are significantly negatively related to generic prices in the U.S.,
the U.K. and Canada, the three countries with pharmacy-driven generic markets throughout the
period, and also in France and Germany, which adopted measures to stimulate switching to
cheaper generics over the 2000’s. The estimated elasticity of volume with respect to price for
Canada is much more negative using 2SLS (-1.114) than OLS (-0.382), which suggests that the
hospital generic price we use as an instrument is a more accurate indicator of the true ex-
manufacturer price to pharmacists, net of unobserved discounts, than the official retail price
reported in the IMS retail data.
Generic price has no significant effect on generic share in Italy, Spain and Japan. The
lack of price sensitivity is unsurprising in Japan, because physicians’ absolute dispensing
margins tend to increase with drug price. Lack of price sensitivity in Italy and Spain may reflect
reference price reimbursement systems that encourage originators to drop their price to the
reference price (Garratini and Ghislandi, 2006), thereby eliminating financial incentive for
physicians/patients/pharmacists to prefer generics. The estimated OLS effect of generic price on
share is positive in Mexico, despite its predominantly self-pay market. This is consistent with the
hypothesis that consumers purchase on brand rather than price when quality is uncertain due to
lack bioequivalence requirements (Danzon, Mulcahy and Towse, 2011).
Generic shares are also positively related to Generic Age (years since generic entry),
consistent with standard diffusion models. Controlling for price, generic shares are positively
related to number of generic manufacturers in most countries; however, we treat this primarily as
a control variable due to the possibility of endogeneity.
27 For Brazil and Mexico, 2SLS cannot be estimated due to lack of data on hospital price which is used as an instrument.

23
4. Effects of Policy Changes
To provide a rough measure of the effects on generic entry, prices and shares due to
policy changes and other factors over our time period, the regressions include two indicator
variables, for years 2002-2005 and years 2006-2009, with the initial period 1998-2001 as the
referent. Table 7 reports the coefficients on the 2006-2009 indicators, with tests for significance
of change relative to the initial period.
The probability of Any Generic has increased significantly in the U.S.,28 the U.K., France
and Germany, all of which have adopted measures to promote generic entry. Number of generic
manufacturers per presentation, conditional on entry, has increased significantly in France,
Germany, Italy and Brazil, with positive but less significant effects in Spain and Mexico.
Interestingly, the number of branded generic manufacturers has declined significantly in the
U.K., Germany, Italy, Spain and Japan, while the number of unbranded generic manufacturers
has increased significantly in all countries except the U.S., U.K. and Canada, which had strong
unbranded generic presence and pharmacy-driven markets initially, and Mexico. Thus, the policy
changes have clearly had some success in promoting entry of unbranded generics.
Normalized generic prices have declined in all countries except in the U.S., which
already had very low generic prices. The large decline in U.K. generic prices plausibly reflects
the changes in generic reimbursement adopted in 2005. Normalized originator prices declined in
all countries except the U.S. and Mexico, where they increased, and Canada with no change.
Generic share of volume, conditional on generic presence, has increased significantly in
the U.S., U.K., France, (Japan) and Brazil. With the exception of Brazil, this generic share
growth is due almost entirely to unbranded generics, which have also had very modest share
growth in Japan. Thus, the policy changes in the E.U. countries appear to have increased the
number of generics and their market share, with greatest growth (18.8 percent) in France. The
U.S. and the U.K. have also seen 18.2 and 15.5 percent, respectively, increase in generic market
shares. The largest decline in generic prices was in the U.K. (33 percent), followed by France,
Italy, Spain and Brazil (25-29 percent).
28 The U.S. 2003 MMA limited originator incentives to use patent proliferation to deter generic entry, by permitting only one 30 month stay per product.

24
VII. Savings from Generics
Payer savings from generics depends on the generic-originator price difference and on the
share of prescriptions that are dispensed generically.29 We calculate the percent savings from
generic price, generic unit volume and generic savings as a percent of total drug spending in
1998-2001 and 2006-2009, calculated as follows (where Q denotes units, P denotes price,
superscripts O and G denote originator and generic, respectively): Percent savings in price, [(PO –
PG)*QG] / (PG*QG), measures the counterfactual percent increase in cost if all generically-
dispensed units were sold as originators; Percent savings in volume, (PG*QG) / (PG*QG +
PO*QO), is the generic share of unit volume for molecules in our 8-20 year cohort, weighted by
their respective prices; Total percent savings for the 8-20 age cohort , [(PO – PG)*QG] / (PO*QG +
PO*QO), measures how much higher expenditure would be if there were no generics for drugs in
the 8-20 year cohort. An alternative Total savings measure calculates the generic savings for the
8-20 year cohort as a percent of total expenditure on all drugs. The estimates for each time period
and country are in Table 8, which also reports the change in savings between the early and later
periods.
Savings from low generic prices are far greater in the U.S. than in any other country in
2001, but by 2009 the U.K. prices yield similar savings and the U.K. therefore has the greatest
increase in price savings over the period. Of course, these estimates are sensitive to the originator
prices, which are relatively high in the U.S., but the U.S. generic prices are also absolutely low
relative to other countries (Table 3).
The savings from generic share of unit volume increased most in France, from 7 percent
in 2001 to 55 percent in 2009. As of 2009, generic shares of the 8-20 year cohort total volume
are higher in Canada, the U.K., France and Germany than in the U.S., because although the U.S.
has the highest generic penetration conditional on generic entry, Canada, France and Germany
on average have earlier generic entry, presumably due to fewer patent extensions for originators.
Thus although Paragraph IV challenges have shortened expected patent life for some drugs,
29 Our savings calculations ignore any change in total (originator plus generics) unit volume of the molecule following generic entry. In theory lower generic prices might induce increased utilization of molecules with generics, including therapeutic substitution away from similar, on-patent molecules. In practice, U.S. evidence generally indicates no increase in utilization at the molecule level following generic entry, plausibly because any positive response to lower prices is offset by the decline in originator promotion that occurs in markets with pharmacy substitution, unless payers aggressively encourage therapeutic substitution, as some payers did when generic simvastatin became available in the statin class.

25
originators in the U.S. on average lose less volume share to generics than originators in these
other countries in the 8-20 year phase of originator life. Relatively high originator prices in the
denominator also reduce our measure of volume savings for the U.S.
The total generic savings on the 8-20 year cohort are highest in the U.K. and the U.S.,
which would have spent 272 percent and 238 percent more, respectively, on these drugs, in the
absence of generics. Canada, France and Germany would have spent 43-55 percent more, in the
absence of generics. Among the E.U. countries which made major changes, only France has
significant increase in savings (39.3 percentage points) from 1998-2009. In Germany savings on
price and total savings appear to have declined, even though volume share increased; however,
price savings in Germany may be understated if the discounts granted directly to sickness funds
are not reflect in IMS price data. Spain has modest declines in price and volume savings from
generics, possibly because reference pricing has reduced prices but increased volume share for
originators. And such savings, due to the effect of generics on originator prices, are not reflected
in our estimates of savings due to generics.
Generic savings as a share of total drug spending is under 10 percent in all countries
except the U.S. and U.K. However, this measure is heavily influenced by on-patent originator
prices in the denominator, which reflect policies to encourage R&D and other factors. This Total
savings measure is therefore less relevant as a measure of savings achieved by policies to
encourage generics than the measures which report savings relative to total sales for the 8-20
year cohort.
VIII. Conclusions
Cross-national differences in policies towards generics have resulted in major differences
in generic entry, generic prices and generic market shares, and in whether generic markets are
pharmacy-driven with unbranded generics, as in the U.S. and U.K., or physician driven with
branded generics, as has traditionally been the norm in most other countries. Over the last
decade, policies adopted in France, Spain, Italy and Germany to increase generic uptake and
price-competitiveness have resulted in some growth in the share of unbranded generics in these
countries. Reference pricing policies may have stunted the growth of generic shares and price
competition, although to the extent that they also reduce originator prices, they yield savings
without generic adoption. As of 2009, the policy changes appear to have been most effective in

26
France, which experienced a large increase in generic penetration and some reduction in generic
prices, whereas incremental savings were at most modest in Italy, Spain and Germany. The
U.K.’s policies to reduce generic reimbursement prices have also achieved very significant price
savings and increased generic penetration. Although the data do not permit precise measurement
of individual policy effects, these results are consistent with the hypothesis that policies to shift
generic markets from physician-driven, branded generics towards pharmacy driven, unbranded
generics, can potentially yield significant savings to payers, provided that these policies are
appropriately designed such that payers rather than pharmacies capture most of the savings.
References Appelt, S. 2009. Early entry and trademark protection – an empirical examination
of barriers to generic entry. Paper presented at the Summer Conference 2009, Copenhagen Business School.
Berndt, E.R., Aitken, M.L. 2010. Brand loyalty, generic entry and price competition in pharmaceuticals in the quarter century after the 1984 Waxman-Hatch Legislation. NBER Working Paper No. 16431.
Bresnahan, T.F., Reiss, P.C., 1991. Entry and competition in concentrated markets. Journal of Political Economy 99, 977-1009.
Danzon, P.M., Furukawa, M.F., 2008. International prices and availability of pharmaceuticals in 2005. Health Affairs 27, 221-233.
Danzon, P.M., Mulcahy, A.and Towse, A.2011. Pharmaceutical pricing in emerging markets: effects of income, competition and procurement. NBER Working Paper.
Ellison, G., Ellison, S.F., 2011. Strategic entry deterrence and the behavior of pharmaceutical incumbents prior to patent expiration. American Economic Journal: Microeconomics 3, 1-36.
Frank, R.G., Salkever, D.S., 1992. Pricing, patent loss and the market for pharmaceuticals. Southern Economic Journal 59, 165-179.
Frank, R.G., Salkever, D.S., 1997. Generic entry and the pricing of pharmaceuticals. Journal of Economics & Management Strategy 6, 75-90.
Garattini, L., Ghislandi, S., 2006. Off-patent drugs in Italy: a short-sighted view? European Journal of Health Economics 7, 79-83.
Ghislandi S, Krulichova I, Garattini L. Pharmaceutical policy in Italy: Towards a structural change? Health Policy 2005; 72: 53-63.
Grabowski, H., Kyle, M., 2007. Generic competition and market exclusivity periods in pharmaceuticals. Managerial and Decision Economics 28, 491- 502.
Grabowski, H., Vernon, J.M., 1992. Brand loyalty, entry, and price competition in pharmaceuticals after the 1984 Drug Act. Journal of Law & Economics 35, 331-350.
Grabowski, H., Vernon, J., 1996. Longer Patents for increased generic
27
competition in the U.S.: The Waxman-Hatch Act after one decade. Pharmacoeconomics 10, 110-123.
Hollis, A., 2003. The anti-competitive effects of brand-controlled "pseudo- generics" in the Canadian pharmaceutical market. Canadian Public Policy/Analyse de Politiques 29, 21-32.
Hudson, J., 2000. Generic take-up in the pharmaceutical market following patent expiry: a multi-country study. International Review of Law and Economics 20, 205-221.
Kanavos, P., Costa-Font, J., Seeley, E., 2008. Competition in off-patent drug markets: issues, regulation and evidence. Economic Policy 23, 499-544.
Magazzini, L., Pammoli, F., Riccaboni, M., 2004. Dynamic competition in pharmaceuticals: patent expiry, generic penetration and industry structure. European Journal of Health Economics 5, 175-182.
Moreno-Torres, I., Puig-Junoy, J., Borrell, J.R., 2009. Generic entry into the regulated Spanish pharmaceutical market. Review of Industrial Organization 34, 373-388.
Pammoli, F., Magazzini, L., Orsenigo, L., 2002. The intensity of competition after patent expiry in pharmaceuticals: a cross-country analysis. Revue D’Economie Industrielle 99, 107-131.
Puig-Junoy, J. 2010. The impact of European pharmaceutical price regulation on price competition: a review. Pharmacoeconomics 28: 649-663.
Regan, T. 2008. Generic entry, price competition, and market segmentation in the prescription drug market. International Journal of Industrial Organization (4):930-948.
Reiffen, D., Ward, M.E., 2005. Generic drug industry dynamics. Review of Economics and Statistics 87, 37-49.
Saha, A., Grabowski, H., Birnbaum, H., Greenberg, P., Bizan, O., 2006. Generic competition in the U.S. pharmaceutical industry. International Journal of the Economics of Business 13, 15-38.
Scott Morton, F., 1999. Entry decisions in the generic pharmaceutical industry. RAND Journal of Economics 30, 421-440.
Scott Morton, F., 2000. Barriers to entry, brand advertising, and generic entry in the U.S. pharmaceutical industry. International Journal of Industrial Organization 18, 1085-1104.
Stargardt, T. 2010. The impact of reference pricing on switching behaviour and healthcare utilization: the case of statins in Germany. European Journal of Health Economics 11:267-277.
U.S. Congressional Budget Office, 2005. Prices for brand-name drugs under selected federal programs. Washington D.C.: Congressional Budget Office.
28
Table 1: Regulatory and Reimbursement Rules, by Country
Pharmacy Generic Subst.
Pharmacy reimb based
on price Discounts to pharmacies
Generic RP
Regulated Generic
Price
Patient co-pay
incentive, other than
RP Physician Incentive
US Yes No Yes Yes No Yes No
UK Yes 1 No Yes Yes No No Yes
Canada Yes No Yes Yes Yes No No
France 1999 Pre 2002 Yes 2003 Yes No 20002
Germany 2002 Pre 2007 Banned in
2006 1989 No No Yes
Italy 2001 Yes No 2001 Yes No No
Spain Yes No Yes 2000 No No No
Japan No Yes Yes No Yes Yes No
Australia 1994 Yes Yes Yes Yes No No
Mexico No3 No No No No Yes No
Chile No No No No No Yes No
Brazil Yes No No No 2004 Yes No
1 INN Rx only for outpatient Rx; also substitution for originator Rx in hospitals.
2 From 2000, French physicians were required to prescribe at least a specified percent generic, which has increased over time.
3Substitution permitted only with interchangeable generics, which were a small share of total volume until 2005, and if the prescription is generically written. Since over 60% of Rx-bound medicines are dispensed without an Rx, substitution restrictions may be moot.

29
0.22[192]
0.18[182]
0.29[150]
0.07[174]
0.21[227]
0.25[212]
0.36[187]
0.30[309]
0.38[169]
0.22[184]
0.34[250]
0.29[222]
0.35[196]
0.25[207]
0.33[244]
0.28[209]
0.34[213]
0.36[302]
0.41[182]
0.31[216]
0.00
0.05
0.10
0.15
0.20
0.25
0.30
0.35
0.40
0.45
U.S. U.K. Canada France Germany Italy Spain Japan Brazil Mexico
Perc
ent o
f Mol
ecul
es w
ith A
ny G
enei
rc
Note: Sample includes molecules with global age 8‐20 years
No.of molecules in sample reported in brackets
Figure 1: Percent of Molecules with Any Generic
Years 1998-2001 Years 2006-2009
11.2
12.0
10.5
12.5
11.3
8.7
8.1
11.9
5.9
9.4
11.3 11.4
9.4
10.8
10.1
11.0
9.9
12.1
8.3
9.7
4.0
5.0
6.0
7.0
8.0
9.0
10.0
11.0
12.0
13.0
U.S. U.K. Canada France Germany Italy Spain Japan Brazil Mexico
Orig
inat
or A
ge a
t Firs
t Gen
eric
Lau
nch
Note: Sample includes molecules with global age 8‐20 years
Figure 2: Mean Molecule Age at Generic Entry (Generic Launch Lag)
Years 1998-2001 Years 2006-2009

30
2.4
3.13.7 3.9
4.44.7 4.6
5.0 5.0
0.0
2.0
4.0
6.0
8.0
10.0
0 1 2 3 4 5 6 7 8
Num
ber o
f Gen
eric
Man
ufac
ture
rs
Quarters Since First Generic EntryNote: Sample includes molecules with global age 8-20 years
Figure 3: Generic Manufacturers, By Time Since First Generic Entry
U.S. U.K. Canada France Germany Italy Spain Japan Brazil Mexico
0.75
0.67
0.57
0.50
0.44 0.430.40
0.36 0.36
0.20
0.30
0.40
0.50
0.60
0.70
0.80
0.90
1.00
0 1 2 3 4 5 6 7 8
Rat
io o
f Gen
eric
Pric
e by
Ear
liest
Orig
inat
or P
rice
Quarters Since First Generic EntryNote: Sample includes molecules with global age 8-20 years
Figure 4: Normalized Generic Price, By Time Since First Generic Entry
U.S. U.K. Canada France Germany Italy Spain Japan Brazil Mexico

31
1.241.21
1.16 1.171.13 1.14 1.12 1.14 1.13
0.40
0.60
0.80
1.00
1.20
1.40
0 1 2 3 4 5 6 7 8
Rat
io o
f Orig
inat
or P
rice
by E
arlie
st O
rigin
ator
Pric
e
Quarters Since First Generic EntryNote: Sample includes molecules with global age 8-20 years
Figure 5: Normalized Originator Price, By Time Since First Generic Entry
U.S. U.K. Canada France Germany Italy Spain Japan Brazil Mexico
0.24
0.61
0.750.78 0.81
0.86 0.850.89 0.89
0.00
0.10
0.20
0.30
0.40
0.50
0.60
0.70
0.80
0.90
1.00
0 1 2 3 4 5 6 7 8
Perc
ent S
hare
of V
olum
e
Quarters Since First Generic EntryNote: Sample includes molecules with global age 8-20 years
Figure 6: Generic Share of Volume, By Time Since First Generic Entry
U.S. U.K. Canada France Germany Italy Spain Japan Brazil Mexico
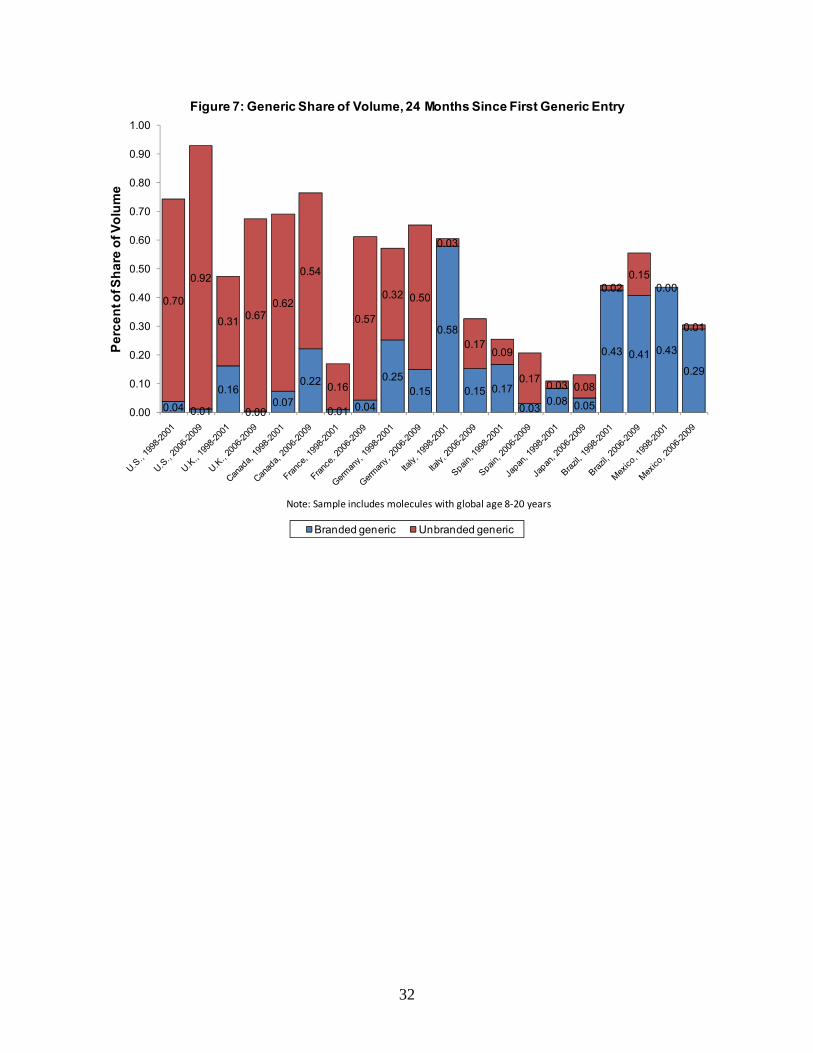
32
0.04 0.01
0.16
0.000.07
0.22
0.01 0.04
0.250.15
0.58
0.15 0.17
0.03 0.08 0.05
0.43 0.41 0.43
0.29
0.70
0.92
0.31 0.670.62
0.54
0.16
0.57
0.32 0.50
0.03
0.170.09
0.17 0.03 0.08
0.020.15
0.00
0.01
0.00
0.10
0.20
0.30
0.40
0.50
0.60
0.70
0.80
0.90
1.00Pe
rcen
t of S
hare
of V
olum
e
Note: Sample includes molecules with global age 8‐20 years
Figure 7: Generic Share of Volume, 24 Months Since First Generic Entry
Branded generic Unbranded generic

33
Table 2: Pharmaceutical Sales and Unit VolumeU.S. U.K. Canada France Germany Italy Spain Japan Brazil Mexico
SalesTotal market $326,438 $24,001 $21,564 $51,742 $52,615 $31,731 $26,375 $111,732 $21,731 $13,992Retail market1 160,840 12,165 11,701 16,672 16,218 10,135 13,410 38,239 5,877 4,260
Generic market 40,459 4,662 5,307 4,228 6,845 2,875 3,734 9,510 3,562 1,843Sample cohort2 83,333 3,852 3,966 5,101 4,515 2,841 3,219 14,923 797 763
Generic market 6,324 615 953 654 1,126 264 414 354 354 88
Unit volumeTotal market 505,325 114,274 79,097 147,957 158,167 66,998 71,519 339,007 124,123 62,118Retail market1 170,899 45,738 31,764 39,630 39,317 28,335 35,026 135,878 20,394 7,649
Generic market 128,555 31,540 25,500 19,264 30,357 13,125 17,246 76,733 14,424 4,627Sample cohort2 41,574 9,107 5,234 9,219 9,898 7,461 7,689 28,563 2,258 750
Generic market 18,215 5,150 1,991 2,260 6,313 1,212 2,223 1,545 1,331 178
Generic % salesRetail market1 25.2 38.3 45.4 25.4 42.2 28.4 27.8 24.9 60.6 43.3Sample cohort2 7.6 16.0 24.0 12.8 24.9 9.3 12.9 2.4 44.4 11.6
Generic % volumeRetail market1 75.2 69.0 80.3 48.6 77.2 46.3 49.2 56.5 70.7 60.5Sample cohort2 43.8 56.5 38.0 24.5 63.8 16.2 28.9 5.4 58.9 23.8
Sales ($USD) and unit volume are reported in millions for the 12 months ending June 2009. 1Retail market excludes combination products, biologics, OTC, and hospital channel. 2Sample cohort includes molecules with global age 8-20 years.
Table 3: Market Size and Generic EntryMedian annual sales ($USD, M, 2009 exchange rates) and mean generic price per dose ($USD) at 24-27 months since generic entry
U.S. U.K. Canada France Germany Italy Spain Japan Brazil MexicoPer generic manufacturerAnnual sales 3.99 2.88 1.11 2.00 1.02 2.66 1.96 4.03 1.87 1.16Price per dose 0.36 0.37 0.57 0.39 0.38 0.49 0.43 0.30 0.49 1.00
1 generic manufacturerAnnual sales 2.41 2.06 1.58 2.50 5.40 5.49 3.67 1.59 2.30 1.09Price per dose 0.88 0.44 0.51 0.67 0.93 0.56 0.60 0.27 0.49 0.92
2 or 3 generic manufacturersAnnual sales 11.02 5.22 3.25 3.94 1.76 2.24 5.72 8.27 8.39 3.01Price per dose 0.47 0.47 0.59 0.30 0.40 0.24 0.44 0.31 0.47 1.32
4+ generic manufacturersAnnual sales 34.0 18.0 6.11 20.4 11.37 13.4 16.66 50.3 5.30 6.88Price per dose 0.23 0.22 0.57 0.40 0.32 0.52 0.37 0.32 0.45 1.03n/a, no cases in sample. Sample includes oral-solid presentations only.

34
Table 4: Effects of Market Size on Any Generic Entry and No. of Generic ManufacturersDependent variable: Any generic entry
U.S. U.K. Canada France Germany Italy Spain Japan Brazil MexicolnSales 0.003 0.028*** 0.024*** 0.020*** 0.043*** 0.033*** 0.036*** 0.039*** 0.055*** 0.008
Dependent variable: No. of generic manufacturers, conditional on generic entryU.S. U.K. Canada France Germany Italy Spain Japan Brazil Mexico
lnSales 0.715*** 0.340*** 0.566*** 1.588*** 2.581*** 0.663*** 0.981*** 1.825*** 1.115*** 0.421***
Dependent variable: No. of branded generic manufacturers, conditional on generic entryU.S. U.K. Canada France Germany Italy Spain Japan Brazil Mexico
lnSales 0.003 0.017 0.211*** 0.223** 0.904*** 0.279*** 0.210** 1.392*** 0.937*** 0.397***
Dependent variable: No. of unbranded generic manufacturers, conditional on generic entryU.S. U.K. Canada France Germany Italy Spain Japan Brazil Mexico
lnSales 0.712*** 0.312*** 0.352*** 1.437*** 1.804*** 1.124** 1.196*** 0.501*** 0.338*** 0.083**
Marginal effects from Probit and Negative-Binomial regressions, clustered by molecule; robust standard errors in brackets, significant at ***p<0.01, **p<0.05, *p<0.10
Table 5: Effects of No. of Generic Manufacturers on Normalized Generic and Originator Price
U.S. U.K. Canada France Germany Italy Spain Japan Brazil MexicoGenMfrBrand 0.029 -0.097*** -0.014** -0.014 -0.009** 0.002 -0.006 -0.010*** -0.006** 0.038*
GenMfrUnbr -0.043*** -0.076*** -0.011** -0.006 -0.015*** -0.043*** -0.013*** 0.001 -0.012** -0.080**
U.S. U.K. Canada France Germany Italy Spain Japan Brazil MexicoGenMfrBrand 0.107 -0.024 -0.020** -0.001 -0.017* 0.000 -0.002 -0.004*** -0.010*** 0.005
GenMfrUnbr -0.006* -0.004 -0.001 -0.013*** -0.006 -0.031*** -0.017*** -0.003*** -0.010* -0.010
Marginal effects from OLS regressions, clustered by molecule; robust standard errors in brackets, significant at ***p<0.01, **p<0.05,
Dependent variable: Normalized generic price
Dependent variable: Normalized originator price
Dependent variable: Generic share of volumeU.S. U.K. Canada France Germany Italy Spain Japan Brazil Mexico
GenPrice1 -0.144*** -0.228*** -0.382*** -0.262* -0.202** 0.039 -0.068 0.050 -0.346*** 0.140**
GenPrice2 -0.207*** -0.224*** -1.111*** -0.425** -0.371*** 0.002 -0.019 0.038 n/a n/a
Table 6: Effects of Normalized Generic Price on Generic Share of Volume
Marginal effects from 1OLS and 22SLS-GMM regressions, clustered by molecule; robust standard errors in brackets, significant at ***p<0.01, **p<0.05, *p<0.10. n/a, instrumental variables not available.

35
Dependent variable: Any generic entryU.S. U.K. Canada France Germany Italy Spain Japan Brazil Mexico
Years 2006-2009 0.147*** 0.091*** -0.008 0.097*** 0.071** -0.046 -0.133*** 0.046 -0.043 -0.012
Dependent variable: No. of generic manufacturers, conditional on generic entryU.S. U.K. Canada France Germany Italy Spain Japan Brazil Mexico
Years 2006-2009 0.385 -0.199 0.497 3.803*** 2.612** 1.867** 1.739* -0.347 1.479*** 0.570*
Dependent variable: No. of branded generic manufacturers, conditional on generic entryU.S. U.K. Canada France Germany Italy Spain Japan Brazil Mexico
Years 2006-2009 0.039 -0.237*** 0.652* -0.497 -1.125** -0.785*** -1.448*** -2.325*** 0.034 0.601*
Dependent variable: No. of unbranded generic manufacturers, conditional on generic entryU.S. U.K. Canada France Germany Italy Spain Japan Brazil Mexico
Years 2006-2009 0.352 0.183 -0.023 4.472*** 3.855*** 8.680*** 7.618*** 2.738*** 4.434*** 0.057
Dependent variable: Normalized generic priceU.S. U.K. Canada France Germany Italy Spain Japan Brazil Mexico
Years 2006-2009 0.011 -0.331*** -0.092*** -0.250*** -0.151*** -0.298*** -0.277*** -0.128*** -0.273*** -0.129**
Dependent variable: Normalized originator priceU.S. U.K. Canada France Germany Italy Spain Japan Brazil Mexico
Years 2006-2009 0.044** -0.139*** -0.007 -0.149*** -0.156*** -0.279*** -0.221*** -0.169*** -0.176*** 0.047**
Dependent variable: Generic share of volumeU.S. U.K. Canada France Germany Italy Spain Japan Brazil Mexico
Years 2006-2009 0.182*** 0.155*** 0.010 0.188*** 0.001 -0.046 -0.021 0.033* 0.181*** 0.070
Dependent variable: Branded generic share of volumeU.S. U.K. Canada France Germany Italy Spain Japan Brazil Mexico
Years 2006-2009 0.008 0.014 0.046 0.036** -0.018 -0.033 0.049 0.014 0.090* 0.032
Dependent variable: Unbranded generic share of volumeU.S. U.K. Canada France Germany Italy Spain Japan Brazil Mexico
Years 2006-2009 0.174*** 0.141** -0.035 0.152*** 0.019 -0.014 -0.070** 0.019*** 0.090** 0.038***Period dummies for years 1998-2001 (omitted), 2002-2006, 2007-2009. Significant at ***p<0.01, **p<0.05, *p<0.10
Table 7: Summary Effects of Policy Changes for Years 2007-2009, Relative to Years 1998-2001

36
Table 8: Savings from Generics
U.S. U.K. Canada France Germany Italy Spain Japan Brazil MexicoP1: Years 1998-2001 4.439 0.556 1.358 0.578 1.109 0.085 0.375 0.750 0.490 0.222P2: Years 2002-2005 3.051 0.798 0.718 0.648 0.710 0.135 0.326 0.658 0.927 0.355P3: Years 2006-2009 4.554 4.091 0.796 0.790 0.807 0.148 0.192 0.664 1.353 1.194% diff. P3-P1 0.115 3.535 -0.562 0.212 -0.302 0.063 -0.183 -0.085 0.863 0.973
U.S. U.K. Canada France Germany Italy Spain Japan Brazil MexicoP1: Years 1998-2001 0.372 0.430 0.463 0.070 0.562 0.234 0.440 0.033 0.364 0.254P2: Years 2002-2005 0.542 0.635 0.659 0.302 0.662 0.231 0.408 0.044 0.608 0.291P3: Years 2006-2009 0.521 0.664 0.691 0.549 0.621 0.240 0.393 0.064 0.719 0.285% diff. P3-P1 0.150 0.234 0.228 0.479 0.059 0.007 -0.047 0.031 0.355 0.031
U.S. U.K. Canada France Germany Italy Spain Japan Brazil MexicoP1: Years 1998-2001 1.651 0.239 0.629 0.041 0.623 0.020 0.165 0.025 0.178 0.056P2: Years 2002-2005 1.655 0.507 0.473 0.196 0.470 0.031 0.133 0.029 0.564 0.103P3: Years 2006-2009 2.375 2.715 0.550 0.433 0.501 0.036 0.076 0.043 0.972 0.340% diff. P3-P1 0.724 2.476 -0.079 0.393 -0.122 0.016 -0.090 0.018 0.794 0.284
U.S. U.K. Canada France Germany Italy Spain Japan Brazil MexicoP1: Years 1998-2001 0.025 0.008 0.048 0.001 0.052 0.002 0.032 0.002 0.028 0.004P2: Years 2002-2005 0.065 0.061 0.035 0.010 0.062 0.003 0.018 0.003 0.079 0.007P3: Years 2006-2009 0.201 0.235 0.053 0.029 0.049 0.003 0.007 0.005 0.063 0.020% diff. P3-P1 0.176 0.227 0.005 0.028 -0.003 0.001 -0.026 0.003 0.035 0.016
Percent savings in prices
Percent share of unit volume
Total percent savings from generics, for the 8-20 year cohort
Total percent savings from generics, relative to total market

37
Appendix Table 1: Descriptive StatisticsU.S. N Mean STD Min MaxGenMfr 24,595 1.05 2.67 0 23GenMfrBrand 24,595 0.02 0.13 0 1GenMfrUnbr. 24,595 1.04 2.65 0 23GenPrice 354 0.77 0.43 0.08 1.88OrigPrice 4,751 1.14 0.34 0.02 2.47GenShare 5,665 0.84 0.24 0.0000003 1.00Sales 24,595 137,524,067 359,636,059 128 5,301,822,792Licensees 24,595 0.42 0.50 0 2OrigForms 24,595 0.58 0.85 0 4OTC share 24,595 0.80 8.85 0 100.00Hosp. share 24,595 22.37 32.57 0 99.98Ext. release 24,595 0.06 0.24 0 1IV form 24,595 0.20 0.40 0 1Topical form 24,595 0.04 0.19 0 1Other form 24,595 0.15 0.36 0 1Global age 24,595 163.82 41.41 96 240Molecule lag 24,572 24.72 32.18 0 204GenAge 5,665 39.93 31.47 0 169Global avail. 24,595 0.45 0.50 0 1
U.K. N Mean STD Min MaxGenMfr 19,554 0.40 1.00 0 7GenMfrBrand 19,554 0.04 0.24 0 3GenMfrUnbr. 19,554 0.36 0.89 0 6GenPrice 661 0.54 0.32 0.01 1.00OrigPrice 3,207 0.84 0.15 0.16 1.18GenShare 3,580 0.62 0.32 0.000004 1.00Sales 19,554 11,488,867 28,129,153 5 383,365,491Licensees 19,554 0.29 0.48 0 2OrigForms 19,554 0.86 1.03 0 4OTC share 19,554 0.80 8.44 0 100.00Hosp. share 19,554 26.40 36.91 0 100.00Ext. release 19,554 0.04 0.20 0 1IV form 19,554 0.12 0.33 0 1Topical form 19,554 0.04 0.19 0 1Other form 19,554 0.16 0.37 0 1Global age 19,554 163.65 40.64 96 240Molecule lag 19,554 19.23 31.78 0 213GenAge 3,579 36.38 26.82 0 152Global avail. 19,554 0.52 0.50 0 1

38
Appendix Table 1: Descriptive Statistics (Continued)Canada N Mean STD Min MaxGenMfr 15,723 0.97 2.16 0 12GenMfrBrand 15,723 0.33 0.99 0 6GenMfrUnbr. 15,723 0.65 1.53 0 9GenPrice 2,227 0.58 0.13 0.18 1.19OrigPrice 3,524 0.91 0.15 0.03 2.10GenShare 4,137 0.71 0.30 0.000007 1.00Sales 15,723 11,220,881 29,250,230 13 360,446,191Licensees 15,723 0.28 0.46 0 2OrigForms 15,723 0.43 0.76 0 4OTC share 15,723 0.06 2.52 0 100.00Hosp. share 15,723 16.94 29.19 0 100.00Ext. release 15,723 0.06 0.23 0 1IV form 15,723 0.10 0.30 0 1Topical form 15,723 0.05 0.21 0 1Other form 15,723 0.17 0.37 0 1Global age 15,723 162.85 40.80 96 240Molecule lag 15,723 31.79 30.56 0 224GenAge 3,997 52.37 37.43 0 158Global avail. 15,723 0.56 0.50 0 1
France N Mean STD Min MaxGenMfr 14,510 0.66 2.40 0 16GenMfrBrand 14,510 0.07 0.38 0 4GenMfrUnbr. 14,510 0.59 2.22 0 16GenPrice 506 0.65 0.34 0.18 2.37OrigPrice 1,460 0.78 0.16 0.35 1.05GenShare 1,590 0.41 0.33 0.0000004 1.00Sales 13,296 20,115,626 48,705,099 33 726,745,404Licensees 14,510 0.42 0.56 0 2OrigForms 14,510 0.38 0.72 0 3OTC share 14,510 0.48 6.74 0 100.00Hosp. share 14,510 10.55 21.19 0 100.00Ext. release 14,510 0.04 0.19 0 1IV form 14,510 0.04 0.19 0 1Topical form 14,510 0.06 0.23 0 1Other form 14,510 0.18 0.38 0 1Global age 14,510 167.34 40.79 96 240Molecule lag 14,510 32.39 36.29 0 210GenAge 1,574 25.42 17.85 0 101Global avail. 14,510 0.47 0.50 0 1

39
Appendix Table 1: Descriptive Statistics (Continued)Germany N Mean STD Min MaxGenMfr 24,390 2.02 5.52 0 41GenMfrBrand 24,390 0.70 2.21 0 30GenMfrUnbr. 24,390 1.34 3.82 0 34GenPrice 4,092 0.54 0.29 0.01 1.25OrigPrice 4,379 0.78 0.28 0.07 1.82GenShare 5,203 0.65 0.32 0.000003 1.00Sales 24,390 11,731,786 27,256,808 10 534,265,566Licensees 24,390 0.86 1.67 0 13OrigForms 24,390 0.92 1.05 0 5OTC share 24,390 1.90 13.55 0 100.00Hosp. share 24,390 17.19 30.46 0 99.99Ext. release 24,390 0.04 0.20 0 1IV form 24,390 0.18 0.38 0 1Topical form 24,390 0.05 0.22 0 1Other form 24,390 0.16 0.37 0 1Global age 24,390 166.55 41.33 96 240Molecule lag 24,390 22.87 29.40 0 225GenAge 4,994 45.41 34.06 0 169Global avail. 24,390 0.41 0.49 0 1
Italy N Mean STD Min MaxGenMfr 19,881 0.55 2.58 0 41GenMfrBrand 19,881 0.29 1.48 0 32GenMfrUnbr. 19,881 0.26 1.49 0 17GenPrice 2,552 0.83 0.27 0.13 1.60OrigPrice 2,722 0.80 0.27 0.13 1.44GenShare 3,290 0.41 0.35 0.000002 1.00Sales 19,881 11,712,076 25,519,945 6 244,190,237Licensees 19,881 0.76 0.87 0 4OrigForms 19,881 0.40 0.72 0 3OTC share 19,881 3.07 16.86 0 100.00Hosp. share 19,881 8.15 19.51 0 99.99Ext. release 19,881 0.04 0.19 0 1IV form 19,881 0.08 0.27 0 1Topical form 19,881 0.06 0.24 0 1Other form 19,881 0.24 0.43 0 1Global age 19,881 170.00 40.61 96 240Molecule lag 19,881 31.31 33.07 0 179GenAge 3,290 110.32 63.35 0 239Global avail. 19,881 0.41 0.49 0 1

40
Appendix Table 1: Descriptive Statistics (Continued)Spain N Mean STD Min MaxGenMfr 19,481 1.50 4.50 0 52GenMfrBrand 19,481 0.56 1.81 0 19GenMfrUnbr. 19,481 0.97 3.41 0 38GenPrice 4,319 0.72 0.23 0.05 1.12OrigPrice 4,988 0.75 0.21 0.06 1.05GenShare 5,775 0.45 0.34 0.000005 1.00Sales 19,481 9,847,623 20,464,211 5 286,687,223Licensees 19,481 0.66 0.78 0 4OrigForms 19,481 0.43 0.75 0 3OTC share 19,481 0.35 5.56 0 100.00Hosp. share 19,481 9.62 25.04 0 100.00Ext. release 19,481 0.04 0.19 0 1IV form 19,481 0.08 0.26 0 1Topical form 19,481 0.07 0.26 0 1Other form 19,481 0.21 0.41 0 1Global age 19,481 166.81 40.66 96 240Molecule lag 19,481 37.69 34.16 0 202GenAge 5,775 108.80 59.05 0 239Global avail. 19,481 0.48 0.50 0 1
Japan N Mean STD Min MaxGenMfr 24,692 1.31 3.71 0 36GenMfrBrand 24,692 1.00 2.92 0 28GenMfrUnbr. 24,692 0.33 1.70 0 36GenPrice 5,061 0.56 0.19 0.08 1.05OrigPrice 5,526 0.91 0.11 0.60 1.12GenShare 5,963 0.15 0.26 0.000004 1.00Sales 24,690 36,489,426 89,855,117 34 1,429,952,122Licensees 24,692 0.55 0.69 0 6OrigForms 24,692 0.45 0.83 0 5OTC share 24,692 0.63 7.34 0 100.00Hosp. share 24,692 41.77 29.06 0 99.96Ext. release 24,692 0.03 0.16 0 1IV form 24,692 0.20 0.40 0 1Topical form 24,692 0.05 0.23 0 1Other form 24,692 0.09 0.28 0 1Global age 24,692 171.69 40.91 96 240Molecule lag 24,692 24.13 37.52 0 211GenAge 5,666 52.09 37.40 0 177Global avail. 24,692 0.27 0.44 0 1

41
Appendix Table 1: Descriptive Statistics (Continued)Brazil N Mean STD Min MaxGenMfr 15,826 1.47 3.53 0 38GenMfrBrand 15,826 1.10 2.80 0 33GenMfrUnbr. 15,826 0.47 1.46 0 15GenPrice 4,076 0.48 0.23 0.03 1.15OrigPrice 4,239 0.68 0.19 0.14 1.23GenShare 6,115 0.67 0.35 0.0003 1.00Sales 15,826 3,518,583 7,132,281 409 78,588,090Licensees 15,826 0.29 0.50 0 2OrigForms 15,826 0.24 0.51 0 3OTC share 15,826 0.42 6.21 0 100.00Hosp. share n/a n/a n/a n/a n/aExt. release 15,826 0.05 0.21 0 1IV form 15,826 0.15 0.36 0 1Topical form 15,826 0.05 0.21 0 1Other form 15,826 0.17 0.38 0 1Global age 15,826 165.97 40.70 96 240Molecule lag 15,804 46.04 37.10 0 189GenAge 6,115 89.02 47.69 0 214Global avail. 15,826 0.49 0.50 0 1
Mexico N Mean STD Min MaxGenMfr 16,437 0.66 1.98 0 28GenMfrBrand 16,437 0.60 1.76 0 23GenMfrUnbr. 16,437 0.10 0.53 0 10GenPrice 2,738 0.82 0.36 0.11 3.70OrigPrice 2,568 1.07 0.27 0.32 1.96GenShare 3,726 0.50 0.40 0.000009 1.00Sales 16,437 2,392,473 4,593,691 3 43,338,891Licensees 16,437 0.32 0.51 0 4OrigForms 16,437 0.40 0.78 0 4OTC share 16,437 0.55 6.87 0 100.00Hosp. share n/a n/a n/a n/a n/aExt. release 16,437 0.03 0.18 0 1IV form 16,437 0.14 0.35 0 1Topical form 16,437 0.06 0.24 0 1Other form 16,437 0.20 0.40 0 1Global age 16,437 166.74 40.82 96 240Molecule lag 16,437 39.69 39.63 0 231GenAge 3,726 89.26 56.57 0 222Global avail. 16,437 0.44 0.50 0 1

42
Appendix Table 2: Regressions of Probability of Any Generic Entry on Market Size and ControlsU.S. U.K. Canada France Germany Italy Spain Japan Brazil Mexico
lnSales 0.003 0.028*** 0.024*** 0.020*** 0.043*** 0.033*** 0.036*** 0.039*** 0.055*** 0.008[0.005] [0.005] [0.008] [0.004] [0.005] [0.008] [0.007] [0.005] [0.009] [0.007]
Licensees -0.061* -0.004 -0.017 -0.031 0.002 -0.040** 0.032 0.022 0.020 0.022[0.031] [0.027] [0.041] [0.019] [0.006] [0.018] [0.031] [0.019] [0.040] [0.037]
Orig. forms -0.036** 0.010 -0.011 0.027** 0.029** -0.015 0.029 0.071*** 0.000 0.019[0.018] [0.013] [0.032] [0.013] [0.014] [0.023] [0.033] [0.017] [0.036] [0.019]
OTC share 0.001** 0.001** 0.001 0.000 0.000 0.000 -0.002** 0.001 0.003***[0.000] [0.000] [0.001] [0.001] [0.002] [0.001] [0.001] [0.001] [0.001]
Hosp. share -0.001 -0.002*** -0.004*** -0.001* -0.001 -0.003*** -0.003** -0.001*[0.001] [0.000] [0.001] [0.001] [0.001] [0.001] [0.001] [0.001]
Ext. release -0.149*** -0.123*** -0.219*** -0.088*** -0.134*** -0.102* -0.146** -0.053 -0.183** -0.177***[0.029] [0.032] [0.035] [0.024] [0.039] [0.052] [0.065] [0.073] [0.076] [0.040]
IV form -0.031 -0.001 0.203* -0.025 -0.035 0.078 0.075 -0.112*** 0.230*** 0.000[0.070] [0.051] [0.120] [0.046] [0.061] [0.091] [0.113] [0.038] [0.058] [0.052]
Topical form -0.183*** -0.180*** -0.259*** -0.085** -0.197*** -0.037 -0.133* -0.011 -0.215*** -0.144***[0.029] [0.018] [0.027] [0.035] [0.022] [0.080] [0.070] [0.078] [0.058] [0.042]
Other form -0.161*** -0.178*** -0.183*** -0.113*** -0.139*** -0.014 -0.036 -0.083** 0.017 -0.044[0.028] [0.021] [0.036] [0.021] [0.029] [0.031] [0.051] [0.033] [0.069] [0.037]
lnGlobalAge 0.813*** 0.640*** 0.624*** 0.443*** 0.604*** 0.362*** 0.540*** 0.617*** 0.612*** 0.434***[0.054] [0.044] [0.071] [0.061] [0.050] [0.061] [0.069] [0.057] [0.089] [0.064]
lnMolLag -0.034*** -0.002 -0.023 0.002 -0.003 -0.006 -0.041* -0.015* -0.066** -0.053***[0.010] [0.008] [0.021] [0.007] [0.010] [0.012] [0.022] [0.009] [0.028] [0.018]
Global avail. -0.002 0.017 -0.034 0.034 0.050 0.016 0.147*** -0.121*** 0.141*** 0.163***[0.035] [0.029] [0.048] [0.028] [0.037] [0.037] [0.049] [0.035] [0.053] [0.036]
Years 2002-2005 0.114*** 0.059** -0.017 0.029 0.050** -0.056*** -0.062*** 0.014 0.045 -0.010[0.031] [0.025] [0.028] [0.025] [0.022] [0.020] [0.023] [0.023] [0.033] [0.024]
Years 2006-2009 0.147*** 0.091*** -0.008 0.097*** 0.071** -0.046 -0.133*** 0.046 -0.043 -0.012[0.038] [0.032] [0.040] [0.033] [0.030] [0.030] [0.034] [0.028] [0.047] [0.035]
N 24,572 19,554 15,713 13,296 24,390 19,881 19,481 24,690 15,804 16,437Pseudo R2 0.28 0.38 0.22 0.30 0.28 0.11 0.17 0.25 0.15 0.18Marginal effects from Probit regressions, clustered by molecule; robust standard errors in brackets, significant at ***p<0.01, **p<0.05, *p<0.10

43
Appendix Table 3: Regressions of No. of Generic Manufacturers on Market Size and ControlsU.S. U.K. Canada France Germany Italy Spain Japan Brazil Mexico
lnSales 0.715*** 0.340*** 0.566*** 1.588*** 2.581*** 0.663*** 0.981*** 1.825*** 1.115*** 0.421***[0.086] [0.043] [0.100] [0.188] [0.263] [0.196] [0.189] [0.181] [0.156] [0.079]
Licensees 0.468 -0.192 -0.246 -0.600 0.059 0.267 1.321** -0.148 0.903* 0.217[0.503] [0.135] [0.368] [0.503] [0.163] [0.487] [0.593] [0.403] [0.486] [0.287]
Orig. forms -0.548*** 0.148 -0.583*** 0.636 0.663 0.778 0.784 0.164 0.412 0.343*[0.205] [0.115] [0.221] [0.414] [0.420] [0.495] [0.657] [0.359] [0.411] [0.196]
OTC share -0.013* -0.001 -0.025** 0.026*** -0.002 0.040*** 0.012 0.023 0.009[0.008] [0.002] [0.010] [0.007] [0.013] [0.010] [0.022] [0.016] [0.012]
Hosp. share -0.016* -0.008** -0.045*** -0.054 -0.150*** -0.031 -0.027 -0.042**[0.009] [0.004] [0.013] [0.036] [0.038] [0.020] [0.028] [0.017]
Ext. release -3.291*** -0.188 -1.761*** -0.704 -1.009 2.432** -2.710*** -0.640 -2.354*** -1.317***[0.289] [0.365] [0.396] [1.329] [1.484] [1.142] [0.865] [2.306] [0.316] [0.185]
IV form -2.145*** -0.637** -0.123 -3.149* 1.365 2.586 -1.151 -0.540 1.076 0.015[0.556] [0.248] [0.961] [1.623] [2.830] [1.729] [1.467] [1.539] [0.980] [0.522]
Topical form -2.269*** -0.559*** -1.606*** 1.647 -8.072*** -0.966** -2.417*** -1.964** -1.010 -1.360***[0.655] [0.149] [0.293] [2.218] [0.481] [0.464] [0.900] [0.998] [1.086] [0.338]
Other form -1.420*** -0.324 -1.630*** -2.122** -5.745*** -0.723 -2.143** -1.530** -0.643 -1.264***[0.474] [0.262] [0.418] [0.991] [0.702] [0.455] [0.967] [0.616] [0.691] [0.243]
lnGlobalAge 4.695*** 1.582** 3.218*** 5.587 11.097*** 4.587*** 7.204*** 2.382* 2.721*** 2.459***[0.999] [0.615] [0.887] [3.711] [2.913] [1.395] [1.757] [1.395] [1.048] [0.822]
lnMolLag -0.327** 0.036 -0.759*** -0.359 -0.207 -0.357 -1.221* 0.031 -0.965*** -0.489***[0.149] [0.058] [0.215] [0.222] [0.336] [0.273] [0.687] [0.226] [0.317] [0.159]
Global avail. 0.759 0.180 0.885** 0.903 2.594*** -0.427 2.177** 0.184 1.168*** 1.064***[0.546] [0.270] [0.391] [0.801] [0.957] [0.716] [0.917] [0.769] [0.426] [0.319]
Years 2002-2005 -0.622 -0.175 0.493 1.138 0.825 -0.172 0.355 -1.082*** 1.332*** 0.375*[0.524] [0.345] [0.371] [1.782] [0.977] [0.354] [0.542] [0.358] [0.313] [0.223]
Years 2006-2009 0.385 -0.199 0.497 3.803*** 2.612** 1.867** 1.739* -0.347 1.479*** 0.570*[0.528] [0.389] [0.468] [1.295] [1.292] [0.826] [0.925] [0.528] [0.500] [0.318]
N 5,665 3,580 4,137 1,544 5,203 3,290 5,775 5,962 6,115 3,726Marginal effects from Negative-Binomial regressions, clustered by molecule; robust standard errors in brackets, significant at ***p<0.01, **p<0.05, *p<0.10
Appendix Table 4: Regressions of Normalized Generic Prices on No. of Generic Manufacturers and ControlsU.S. U.K. Canada France Germany Italy Spain Japan Brazil Mexico
GenMfrBrand 0.029 -0.097*** -0.014** -0.014 -0.009** 0.002 -0.006 -0.010*** -0.006** 0.038*[0.043] [0.033] [0.005] [0.009] [0.004] [0.004] [0.004] [0.002] [0.002] [0.020]
GenMfrUnbr. -0.043*** -0.076*** -0.011** -0.006 -0.015*** -0.043*** -0.013*** 0.001 -0.012** -0.080**[0.005] [0.014] [0.005] [0.004] [0.003] [0.006] [0.002] [0.002] [0.005] [0.037]
Ext. release 0.084 0.224*** 0.074** -0.019 0.031 0.036 0.142*** -0.047 0.041 0.383***[0.067] [0.074] [0.029] [0.020] [0.033] [0.043] [0.033] [0.034] [0.051] [0.087]
IV form -0.099 0.140*** 0.027 -0.138** 0.240*** -0.074 -0.028 0.126*** 0.052* -0.094*[0.070] [0.048] [0.042] [0.057] [0.043] [0.073] [0.040] [0.033] [0.029] [0.055]
Topical form 0.200** 0.278*** 0.016 0.343*** 0.115** -0.069 0.069*** 0.112** 0.222** 0.061[0.089] [0.040] [0.038] [0.039] [0.050] [0.051] [0.025] [0.049] [0.094] [0.086]
Other form 0.076 0.178** -0.060 -0.061** 0.198*** 0.063* 0.058 0.165*** 0.071** 0.070[0.072] [0.068] [0.040] [0.027] [0.075] [0.034] [0.035] [0.034] [0.030] [0.079]
lnGlobalAge -0.156 -0.542*** 0.060 0.026 -0.385*** -0.003 -0.200*** -0.353*** -0.059 -0.215*[0.109] [0.115] [0.057] [0.046] [0.066] [0.074] [0.052] [0.064] [0.050] [0.117]
lnMolLag 0.013 0.029* -0.013 -0.002 0.021 -0.014 0.016 0.001 0.016 -0.028[0.015] [0.015] [0.011] [0.008] [0.013] [0.014] [0.012] [0.006] [0.014] [0.026]
Global avail. 0.015 -0.079 0.033 0.000 0.005 0.009 -0.056*** 0.068*** -0.084*** -0.016[0.042] [0.048] [0.028] [0.033] [0.040] [0.044] [0.021] [0.024] [0.025] [0.055]
Years 2002-2005 0.011 -0.097*** -0.055** -0.040* -0.026 -0.126*** -0.114*** -0.049*** -0.246*** -0.058[0.036] [0.031] [0.027] [0.023] [0.029] [0.023] [0.018] [0.017] [0.017] [0.041]
Years 2006-2009 0.011 -0.331*** -0.092*** -0.250*** -0.151*** -0.298*** -0.277*** -0.128*** -0.273*** -0.129**[0.043] [0.045] [0.031] [0.034] [0.042] [0.032] [0.023] [0.023] [0.027] [0.056]
N 5,097 3,369 3,820 1,522 4,768 2,922 5,236 5,672 4,671 2,814R-squared 0.32 0.44 0.10 0.55 0.54 0.62 0.67 0.35 0.54 0.15Marginal effects from OLS regressions, clustered by molecule; robust standard errors in brackets, significant at ***p<0.01, **p<0.05, *p<0.10

44
U.S. U.K. Canada France Germany Italy Spain Japan Brazil MexicoGenPrice -0.144*** -0.228*** -0.382*** -0.262* -0.202** 0.039 -0.068 0.050 -0.346*** 0.140**
[0.039] [0.053] [0.115] [0.135] [0.083] [0.165] [0.124] [0.093] [0.102] [0.068]GenMfrBrand 0.022 0.063* 0.031*** 0.017 0.010* -0.004 0.030*** 0.005** 0.011*** 0.026***
[0.023] [0.033] [0.010] [0.016] [0.006] [0.009] [0.007] [0.002] [0.004] [0.009]GenMfrUnbr. 0.009*** 0.095*** 0.036*** 0.035*** 0.019*** 0.021 0.007** 0.003* 0.023*** 0.008
[0.003] [0.020] [0.010] [0.007] [0.003] [0.014] [0.003] [0.002] [0.007] [0.020]Ext. release -0.087* -0.070 0.109* 0.052 -0.043 0.183 -0.086 0.131 -0.093 -0.051
[0.044] [0.069] [0.061] [0.047] [0.092] [0.136] [0.115] [0.138] [0.099] [0.066]IV form -0.174*** -0.279*** 0.040 -0.161 0.079 0.153 0.001 0.148*** -0.086 -0.048
[0.034] [0.105] [0.068] [0.169] [0.084] [0.100] [0.097] [0.040] [0.056] [0.078]Topical form 0.017 -0.156*** 0.023 -0.151*** 0.091 -0.003 0.019 -0.211*** 0.068
[0.032] [0.041] [0.076] [0.046] [0.084] [0.218] [0.022] [0.057] [0.083]Other form -0.046 -0.239*** 0.056 -0.187*** 0.075 0.088 0.001 0.131*** -0.048 -0.006
[0.037] [0.041] [0.055] [0.062] [0.057] [0.077] [0.060] [0.048] [0.063] [0.070]lnGlobalAge 0.056 0.142 0.099 0.040 -0.076 0.137 -0.006 -0.149 -0.237** 0.116
[0.060] [0.114] [0.069] [0.102] [0.101] [0.152] [0.110] [0.104] [0.100] [0.110]lnMolLag 0.012* -0.014 -0.024 -0.003 0.021* 0.012 -0.011 0.000 0.099** 0.010
[0.007] [0.015] [0.015] [0.018] [0.011] [0.023] [0.034] [0.005] [0.038] [0.026]lnGenAge 0.091*** 0.092*** 0.077*** 0.102*** 0.115*** 0.041 0.099*** 0.042*** 0.140*** 0.090***
[0.011] [0.016] [0.020] [0.013] [0.015] [0.030] [0.016] [0.014] [0.021] [0.024]Global avail. -0.037* 0.000 0.047 -0.039 0.018 -0.101 -0.040 0.038 0.015 -0.004
[0.021] [0.048] [0.044] [0.033] [0.032] [0.064] [0.048] [0.027] [0.049] [0.060]Years 2002-2005 0.136*** 0.177*** 0.032 0.039 0.036 0.030 0.002 0.028* 0.065* 0.051
[0.027] [0.056] [0.031] [0.041] [0.033] [0.056] [0.035] [0.015] [0.036] [0.038]Years 2006-2009 0.182*** 0.155*** 0.010 0.188*** 0.001 -0.046 -0.021 0.033* 0.181*** 0.070
[0.027] [0.059] [0.033] [0.044] [0.049] [0.078] [0.050] [0.019] [0.052] [0.050]N 5,097 3,369 3,680 1,514 4,566 2,922 5,236 5,385 4,671 2,814R-squared 0.47 0.57 0.35 0.68 0.52 0.15 0.31 0.13 0.45 0.25
Appendix Table 5: Regressions of Generic Share of Volume on Normalized Generic Price, No. of Generic Manufacturers and Controls
Marginal effects from OLS regressions, clustered by molecule; robust standard errors in brackets, significant at ***p<0.01, **p<0.05, *p<0.10