patria investments (nasdaq:pax) investor presentation
TRANSCRIPT

Patria Investments (Nasdaq:PAX)Investor PresentationSEPTEMBER 2021

2
Disclaimer
This presentation may contain forward-looking statements within the meaning of Section 27A of the Securities Act of 1933, as amended, and Section 21E of theSecurities Exchange Act of 1934, as amended. You can identify these forward-looking statements by the use of words such as “outlook,” “indicator,” “believes,”“expects,” “potential,” “continues,” “may,” “will,” “could,” “should,” “seeks,” “approximately,” “predicts,” “intends,” “plans,” “estimates,” “anticipates” or the negativeversion of these words or other comparable words, among others. Forward-looking statements appear in a number of places in this presentation and include, but arenot limited to, statements regarding our intent, belief or current expectations. Forward-looking statements are based on our management’s beliefs and assumptionsand on information currently available to our management. Forward-looking statements speak only as of the date they are made, and we do not undertake anyobligation to update them in light of new information or future developments or to release publicly any revisions to these statements in order to reflect later events orcircumstances or to reflect the occurrence of unanticipated events. Such forward-looking statements are subject to various risks and uncertainties. Accordingly, thereare or will be important factors that could cause actual outcomes or results to differ materially from those indicated in these statements. Further information on theseand other factors that could affect our financial results is included in filings we have made and will make with the U.S. Securities and Exchange Commission from timeto time, including but not limited to those described under the section entitled “Risk Factors” in our most recent Form F-1 and 424(b) prospectus, as such factors maybe updated from time to time in our periodic filings with the United States Securities and Exchange Commission (“SEC”), which are accessible on the SEC’s website atwww.sec.gov. These factors should not be construed as exhaustive and should be read in conjunction with the other cautionary statements that are included in ourperiodic filings.
This presentation does not constitute an offer of any Patria Fund. We prepared this presentation solely for informational purposes. The information in thispresentation does not constitute or form part of, and should not be construed as, an offer or invitation to subscribe for, underwrite or otherwise acquire, any of oursecurities or securities of our subsidiaries or affiliates, nor should it or any part of it form the basis of, or be relied on in connection with any contract to purchase orsubscribe for any of our securities or any of our subsidiaries or affiliates nor shall it or any part of it form the basis of or be relied on in connection with any contract orcommitment whatsoever.
We have included in this presentation our Fee Related Earnings (“FRE”) and Distributable Earnings (“DE”), which are non-GAAP financial measures, together with theirreconciliations, for the periods indicated. We understand that, although FRE and DE are used by investors and securities analysts in their evaluation of companies,these measures have limitations as analytical tools, and you should not consider them in isolation or as substitutes for analysis of our results of operations as reportedunder IFRS. Additionally, our calculations of FRE and DE may be different from the calculation used by other companies, including our competitors in the financialservices industry, and therefore, our measures may not be comparable to those of other companies.

3
9.7
5.0
1.1
Total AUM
Q2 2021
$15.8Bn
Intro to Patria | History & Investment PlatformUSD 15.8 BN IN AUM BUILT OVER 30+ YEARS OF HISTORY
Foundation and partnership with Salomon Brothers50%/50%
First Private Equity Fund raised
Partnership with
Launch of Country-specific strategies
1997
2010
2014
2006Launch of Infrastructureproducts
IPO: PAX at
Real Estate
Credit
Listed Equities(CEF)
Infrastructure Core
Country-specific
strategies
Private Equity
Infrastructure
2021
1988
YE 2009
$2.4 BnTotal AUM
Data as of June 30, 2021
CAGR 18%

4
Cash Weighted1 6% 18%
Equal Weighted2 12% 25%
Intro to Patria | ReturnsFLAGSHIP FUNDS - ROBUST PERFORMANCE AT ATTRACTIVE PREMIUM TO LATAM & EMERGING MARKETS PUBLIC EQUITIES
Cash Weighted1 16% 22%
Equal Weighted2 30% 31%
Pooled Net Returns
Data as of June 30, 20211) Cash Weighted returns: consolidate funds original cash flows. Comparison to public market equities considers index returns since first relevant Patria fund cash flow date2) Equal Weighted returns: consolidate funds cash flows at original dates but considering equalized contributions and distributions at the fund levelNote: Funds considered in each scenario: Flagship Funds (PE I; PE II; PE III; PE IV; PE V; PE VI Infra II; Infra III); Infra Co-Investments (LAP; HBSA; ARGO; Entrevias): Master fund’s cash flows, Cash flows were converted from USD to BRL at a daily exchange rate; PE Co-Inv (Alliar; Smartfit 1; Smartfit 2; Smartfit 3; LCAM)
Patria Infrastructure
PME MSCILatAm
PME MSCIEM
6.1%
-6.0%
3.4%+12.1 p.p. +2.7 p.p.
Private Equity(USD Cash-weighted net IRR1 vs public markets)
Infrastructure (USD Cash-weighted net IRR1 vs public markets)
Private Equity
InfrastructurePatria
Private Equity
PME MSCILatAm
9.9%
PME MSCIEM
16.0%
6.6%
+9.4 p.p. +6.1 p.p.

5
Intro to Patria | Flagship ProductsOUR PERFORMANCE HAS ALLOWED US TO SCALE OUR FLAGSHIP PRODUCTS… AND WE BELIEVE THIS CAN CONTINUE
PE III (2007)
PE IV (2011)PE V (2015)
PE VI (2019)
USD
0.6 BnUSD
1.3 BnUSD
1.8 BnUSD
2.7 Bn
Infra II (2010)Infra III (2014)
Infra IV (2019)
USD
1.2 BnUSD
1.7 BnUSD
1.9 Bn
Infra I (2006)
USD
0.5 Bn
• Patria has demonstrated the ability to raise capital in many different environments
• Fund scaling generates organic revenue growth with high operational leverage
• Sophisticated global LP base of 300+ investors supported by experienced in-house distribution team

6
Intro to Patria | Country-Specific StrategiesFINANCIAL DEEPENING IN LATIN AMERICA DRIVES INCREASING DEMAND FOR YIELD
Data as of June 30, 2021
Listed Equities
(CEF)
AUM BRL 1.3 Bn (USD 0.3 Bn)
▪44% BRL 5-year net compounded annualized return as of 2Q21
▪ Ability to leverage PE expertise in listed equities
Real Estate
AUM BRL 2.8 Bn (USD 0.5 Bn)
▪24% BRL net IRR in realized RE development investments
▪2 successful REITs launched
▪Development projects as source for REITs
Credit
AUM BRL 1.3 Bn (USD 0.2 Bn)
▪Ability to leverage on sectors and portcos expertise
▪Experience with mid-sized, high yield borrowers
▪Strong existing LP base
Infra Core
AUM BRL 0.8 Bn (USD 0.1 Bn)
▪First fund raised in 1Q 2021
▪Publicly traded evergreen vehiclefocused on power generation and transmission assets in Brazil

7
Intro to Patria | Proven Investment ApproachWE HAVE DEVELOPED A REPLICABLE “INVESTMENT TECHNOLOGY” USED ACROSS ALL OUR PRODUCTS
Ability to develop long-term relationships and partnerships with strategic players, founders and key industry executives
Majority of deals sourced independently and outside open bidding
Staged capital deployment to allocate more capital to our best performing investments over time
Increased probability of "home-runs" for undisputed market leaders with mitigated risk profile throughout vintages
Rigorous & efficient framework for investingSector Strategy –Specialized in resilient industries Top-down approach, driven by secular trends
Associative partnership approach
Control-oriented investment approach
Private Equity: ~60% of estimated value generated directly through operational levers
50+% Partners & MDs with port co executive experience2
1) Since inception to June 20212) As of December 2020. Includes professionals seconded to portfolio companies
Focus on operational leverage& value creation
Gradual and disciplined portfolio construction
Healthcare
Logistics & Transportation
Education
Power & Energy
Food & Beverage
Data Infrastructure
Agribusiness
Infrastructure:
Focus on Development
22 platforms with ~70% created by Patria1
Private Equity:
Focus on Consolidation
45 platforms with 240+ transactions1

8
Intro to Patria | Focus on Growing & Resilient Sectors
Note: As of June 30, 2021. Source: Capital IQ. Benchmarks: (1) Healthcare: MSCI ACWI/Health Care (Sector) Index (MXWD0HC); MSCI EM/Health Care (Sector) Index (MXEF0HC); RUSSELL 3000 Health Care Sector; (2) MSCIACWI Agriculture & Food Chain Index ; MSCI EM
Agriculture & Food Chain Index; RUSSELL 3000 Agriculture Fishing & Ranching Industry; (3) F&B MSCI ACWI/Food Bev & Tobacco (Industry Group) Index, MSCI EM/Food Bev & Tobacco (Industry Group) Index and RUSSELL 3000 Foods Industry, (4) MSCI ACWI IMI/Air
Frght&Logistics (Sub-Industry) Index; MSCI EM IMI/Air Frght&Logistics (Industry); RUSSELL 3000 Transportation Miscellaneous Industry; (5) Energy: MSCI EM/Energy (Sector) Index (MXEF0EN) - Index Value; MSCI ACWI/Energy (Sector) Index (MXWD0EN) - Index Value;
Russell 3000 Index (^RUA) - Index Value.
26.8%
12.4% 12.2% 9.9%
MSCI EM MSCI ACWI Russell 3000
18.5%3.7% 4.3% 6.1%
26.3%
3.9% 6.3% 6.1%
16.9%
2.6%
14.2%7.8%
Healthcare
Food & Beverage
Agribusiness
Logistics
Energy
Patria vs. Average Benchmarks
+2,080 bps
+870 bps
+1,530 bps
+1,380 bps
11.3%-3.8% -8.5% 2.5% +1,460 bps

9
OUR SOLID, DIVERSIFIED AND SOPHISTICATED GLOBAL CLIENT BASE IS A KEY DRIVER OF OUR GROWTH PLAN
300+LPs
610
1020
610
World’s largest sovereign wealth funds¹
World’s largest pension funds
US’s largest pension funds
Large, Influential & Sophisticated Clients supporting us through vintages and across business units
13%NAWest Coast
33%NA
East Coast
Los Angeles
New York
16%
LatAm
São Paulo
Cayman
Bogota
Santiago
London
Hong Kong
13%Europe
14%Asia Pacific
Middle East11%
Dubai
Montevideo
of capital raised comes from LPs who invested in more than 1 product or vintage
~60%
~80%
Top 20 LPs
~USD 4.7 Tn
in Total Assets under Management
Intro to Patria | Long-lasting Relationships with Investors
33%
26%
14%
11%
9%
6%
0%
Third party
Pension fund
Governmentinstitution
Financialinstitution
Private wealth
Corporate
Foundations/endowments
Commitment Distribution by Region
of our current LPs have been investing with us for over 10 years
Patria’s Offices
Source: Patria analysis. As of December 2020. Geographic allocation does not include Patria GP commitments 1) Includes indirect investors through funds of funds or advisors

10
Intro to Patria | Strong Financial Profile Based on Key Industry MetricsFAST GROWING & STICKY FEE EARNING AUM, ATTRACTIVE MARGIN & SUBSTANTIAL PERFORMANCE FEE CAPACITY
19% FRE growth 2Q21 vs. 2Q20 with an
FRE margin among the best in the peer group
83% of Total AUM is eligible to
performance fees
75+% of FEAUM
has over 5 years of remaining contractual duration or is perpetual
Data as of June 30, 2021
Fee Earning AUM Fee Related Earnings & Margin Net Accrued Performance Fees
(USD Mn) 2Q20 2Q21YTD
2Q20YTD
2Q21
Fee Revenue 24.6 32.2 50.1 62.8
Fee Related Earnings (FRE)
14.9 17.6 30.1 34.9
FRE Margin 60% 55% 60% 56%
2Q211Q21
325
253
(US$ in billions) (US$ in millions) (US$ in millions)
1Q211Q20
(US$/BRL 5.70)
2.9 3.8
3.53.3
0.7 1.2 7.1
8.3
2Q212Q20
Private Equity
Country-specific Strategies
InfrastructurePending FEAUM
+17%
~1.5
3Q21Expected FEAUM
~9.4-9.6
Pending FEAUM
2.8
2Q21 BeforeRealization
PE III RealizedPerf. Fee
382 56
(US$/BRL 5.00)

11
Intro to Patria | Growth StrategyOUR PLATFORM IS WELL-POSITIONED TO CONTINUE GROWING THROUGH ORGANIC AND INORGANIC OPPORTUNITIES
Continue to consistently
scale our Private Equity
and Infrastructure funds
Scale flagship funds
Organic growth in Country-specific Strategies
▪ Platforms
▪ Portfolios
▪ Distribution Channels
✓ Combination with Moneda is a compelling first step
Strategic M&A
Expand our products, geographical presence and distribution capabilities
2. 3.
▪ Listed Equities (CEF)
▪ Real Estate – REITs & RE Development
▪ Credit
▪ Core (Infra and PE)
1.
12
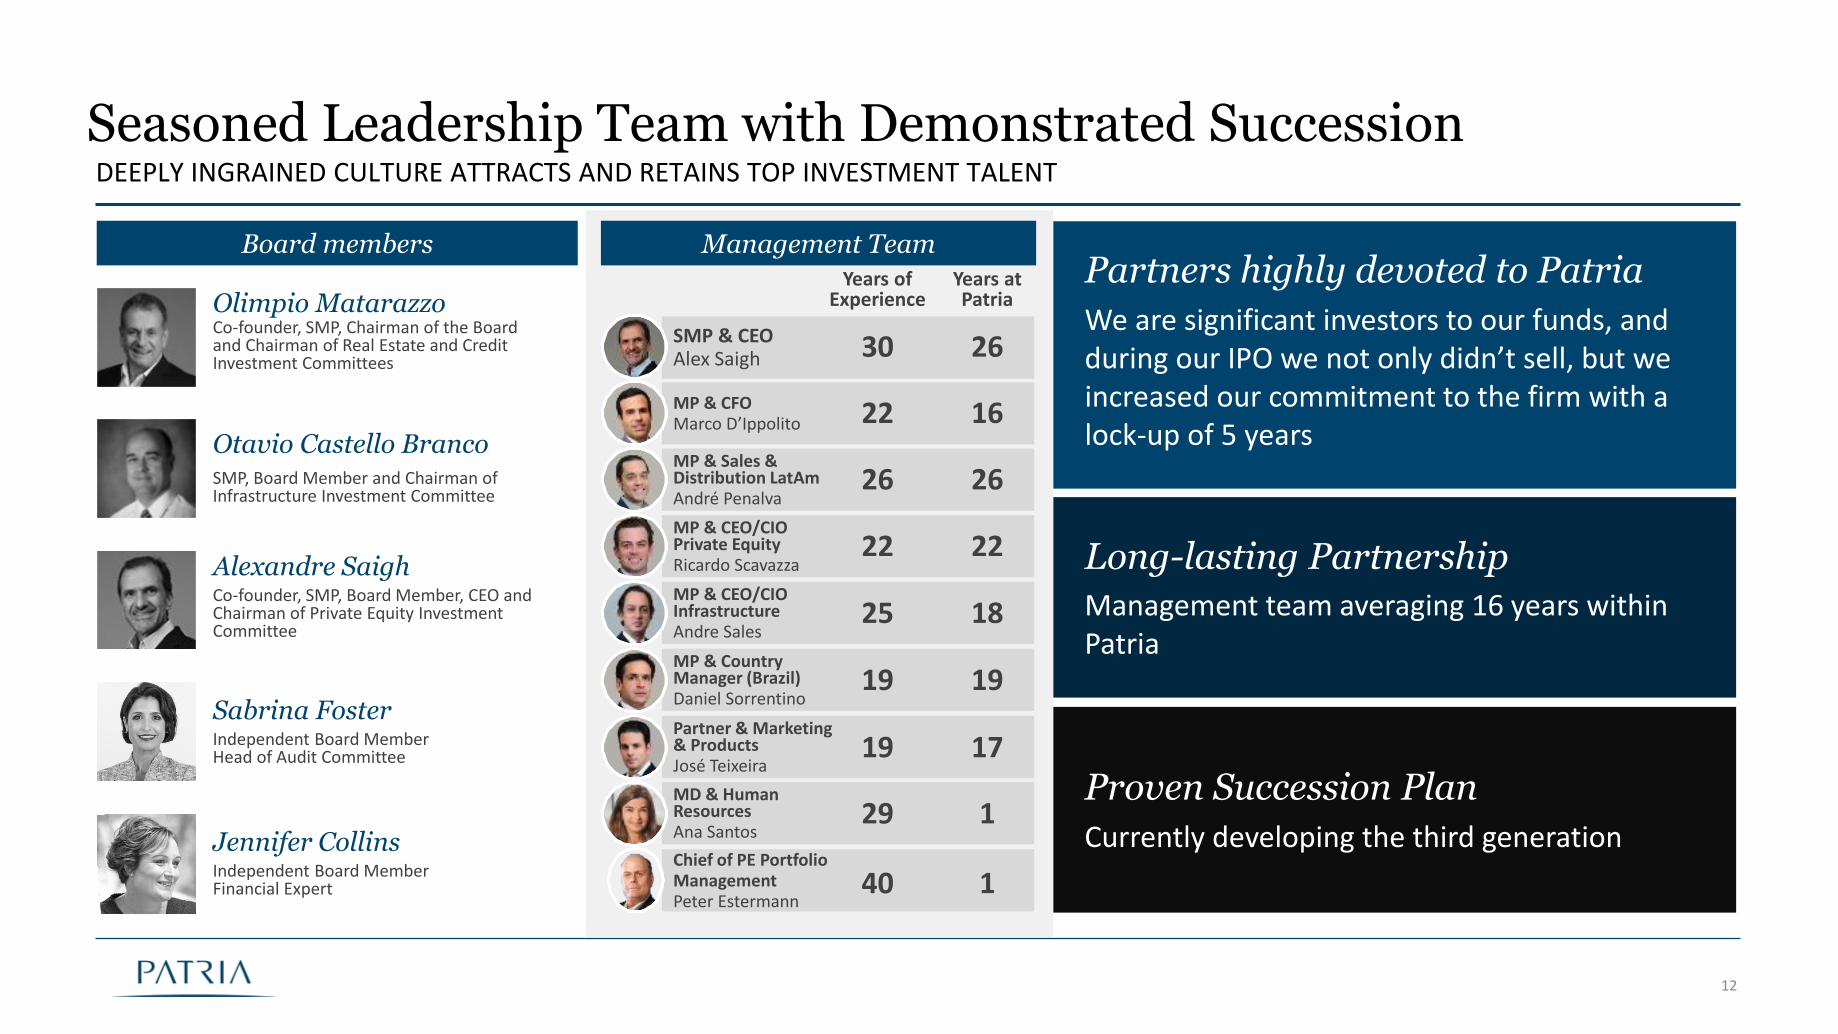
Seasoned Leadership Team with Demonstrated Succession DEEPLY INGRAINED CULTURE ATTRACTS AND RETAINS TOP INVESTMENT TALENT
Olimpio MatarazzoCo-founder, SMP, Chairman of the Board and Chairman of Real Estate and Credit Investment Committees
Otavio Castello BrancoSMP, Board Member and Chairman of Infrastructure Investment Committee
Board members
Alexandre SaighCo-founder, SMP, Board Member, CEO and Chairman of Private Equity Investment Committee
Years of Experience
Years at Patria
Management Team
SMP & CEOAlex Saigh 30 26
Partner & Marketing& ProductsJosé Teixeira
19 17
MP & Sales & Distribution LatAm André Penalva
26 26
MP & CFOMarco D’Ippolito 22 16
MD & Human ResourcesAna Santos
29 1
MP & CEO/CIOPrivate EquityRicardo Scavazza
22 22
MP & CEO/CIO InfrastructureAndre Sales
25 18
MP & Country Manager (Brazil)Daniel Sorrentino
19 19Sabrina FosterIndependent Board MemberHead of Audit Committee
Jennifer CollinsIndependent Board MemberFinancial Expert
Proven Succession Plan
Currently developing the third generation
Long-lasting Partnership
Management team averaging 16 years within Patria
Partners highly devoted to Patria
We are significant investors to our funds, and during our IPO we not only didn’t sell, but we increased our commitment to the firm with a lock-up of 5 years
Chief of PE Portfolio ManagementPeter Estermann
40 1

13
Q2 2021 Results & Outlook

14
2Q21 | Second Quarter 2021 HighlightsPATRIA IS EXECUTING IN ALL AREAS OF THE BUSINESS, AND MARCHING FORWARD ON ALL OF ITS KEY DRIVERS FOR GROWTH
19%
$325 mnNet Accrued
Performance Feesup 29% from $253 million in 1Q21, after
accounting for $56 million realized in 2Q21
Outstanding Investment Performance$1.2 bn
Total Deploymentfrom closed end funds in 2Q21
totaling $1.8 bn for 1H21
31%Fee Revenue
Growth 2Q21 vs 2Q20
36% PE V (2015)
Net IRR in USD
$56 mnPerformance Related
Earningsin 2Q21
Top decile on a global basis, as the fund enters its harvesting period
FRE Growth2Q21 vs 2Q20
55% FRE Marginin 2Q20
Please refer to appendix for definitions

15
7.7
2.4 US$ 11.0 bn
▪ Total AUM of $15.8 billion as of June 30, 2021, up approximately $3 billion or 24% compared to $12.8 billion one year ago
▪ $2.2 billion of year-over-year AUM increase was driven by the appreciation of underlying portfolio investments before accounting for the improvement in the Latin American currencies
▪ 83% of Total AUM is eligible to earn performance revenue
▪ Total AUM is comprised of Fair Value of Investments of $11.0 billion and Uncalled Capital of $4.8 billion as of June 30, 2021
2Q21 | Total Assets Under Management
7.1 9.7
4.7
5.0 0.9
1.1
2Q21
12.8
2Q20
(US$ in billions)
15.8
Private Equity
Country-specific Strategies
Infrastructure
2.1
2.6
24%
US$ 4.8 bn
Fair Value of Investments
Uncalled Capital
1.0
0.2
% Eligible for Performance Revenue
87% 83%
+
See notes and definitions at end of document

16
2Q21 | Fee Related Earnings (“FRE”)
See notes and definitions at end of document(1) Percentages apply to management fees only
60%
$14.9million
$17.6million
+19%
2Q20 2Q21
55%FRE Margin
Country-specific
Infrastructure
57%35%
$32.2million
8%
2Q21 Fee Revenues 1
70%
26%$14.5
million
4%
2Q21 Operating Expenses
Private Equity
Placement Fees Amortization & Rebates
Administrative
Personnel
▪ 2Q21 FRE of $17.6 million was up $2.8 million or 19% compared to 2Q20
o Total Fee Revenue of $32.2 million was up $7.6 million or 31% compared to 2Q20
o Management Fees were up $7.7 million or 30% driven by deployment in our latest vintage Private Equity and Infrastructure funds
o Personnel Expenses were up by $4.1 million or 67% driven by the post IPO change in compensation structure

17
2Q21 | Fundraising & Portfolio Activity
Fundraising ($mn)Total Platform 2Q21 YTD 2Q21 LTM 2Q21
Total 2 149 395
Private Equity - - -
Infrastructure - - 102
Country-specific 2 149 293
▪ $1.2 billion of Total Deployment in 2Q21, driven by Private Equity commitments in the areas of cybersecurity, grocery retail and cold logistics, and Infrastructure commitments to toll road projects in Colombia
▪ $1.8 billion Total Deployment YTD, well exceeding our historical pace
▪ Strong deployment pace is driving an acceleration of the fundraising cycle, and we expect to commence fundraising for our next generation Private Equity fund in 2H 2021
▪ 2Q21 Realizations primarily driven by the first exit in Private Equity Fund V
Private Equity
Fund VI(2019)
Infra Fund IV
(2019)
Reserved3Invested/Called2
Realizations ($mn)Closed-end Funds 2Q21 YTD 2Q21 LTM 2Q21
Total 110 110 487
Private Equity 98 98 108
Infrastructure - - 293
Country-specific 12 12 86
Deployment Progress for Latest Vintage Funds
See notes and definitions at end of document. Totals may not add due to rounding.Note: Beginning with 2Q21, we are reporting Total Deployment to represent the incremental capital invested or reserved in the period, as this reflects the most relevant activity drivingfee revenue and the fundraising cycle.
Total Deployment1 ($mn)Closed-end Funds (Invested + Reserved) 2Q21 YTD 2Q21 LTM 2Q21
Total 1,243 1,793 3,207
Private Equity 734 1,253 1,734
Infrastructure 450 450 1,305
Country-specific 59 90 168
14%
37%
67%
59%
0% 25% 50% 75% 100%
96%
80%

18
2.9 3.8
3.53.3
0.7 1.2 7.1
8.3
2Q21 | Fee Earning Assets Under Management
Fee earning AUM
2Q212Q20
Private Equity
Country-specific Strategies
Infrastructure
(US$ in billions)
▪ FEAUM of $8.3 billion, up 17% year-over-year, drove management fees of $33 million in 2Q21
• $2.8 billion of Pending FEAUM eligible to earn fees once invested/reserved
▪ FEAUM estimate for 3Q21 is ~$9.4 - 9.6 billion based on deployment and realization activity in 1H21
• ~$1.5 billion of estimated Pending FEAUM after accounting for 1H21 deployment
• Pending FEAUM will be replenished as we raise our next generation Private Equity fund
Management Fees
Private Equity
Country-specific Strategies
Infrastructure
(US$ in millions and %)
▪ Approximately 80% of management fees are denominated in US dollars for 2Q21
▪ 1.6% effective annualized management fee rate for 2Q21
Pending FEAUM
+17%
57%35%
US$ 33 mn
8%
3%
70%
6%21%
US$ 8.3bn
1-3 yrs
Perpetual
5+ yrs
3-5 yrs
Remaining Duration
~1.5
Note: Patria’s Fee Earning AUM reflects the basis that is generating management fees in the current reporting period. Since the flagship Private Equity and Infrastructure funds call formanagement fees semi-annually (in January and July), capital that is invested or reserved in Q1 and Q2 will flow into FEAUM in Q3, and likewise, capital invested or reserved in Q3 and Q4will flow in to FEAUM in Q1 of the following year. Forward-looking estimate for FEAUM is subject to variability for certain open-ended funds. See notes and definitions at end of document.
3Q21Expected FEAUM
~9.4-9.6
Pending FEAUM
2.8

19
244
31
48
2Q21 | Net Accrued Performance Fees
• Net Realized Performance Fees were $56 million for the quarter, driven by the crystallization of performance fees in Private Equity Fund III
• Net Accrued Performance Fees were $325 million at June 30, 2021, after accounting for the 2Q21 realization, a 29% increase compared to $253 million as of March 31, 2021
• $244 million or 75% of the current accrual generated by Private Equity Fund V, which is entering its harvesting period
Net Accrued Performance Fees (US$ in millions)
US$ 325 mn
PE VI
2
PE V
IS III
Other1
See notes and definitions at end of document. 2Q21 recognition of Realized Performance Fees is driven by the full return of capital and hurdle to the limited partners in Private Equity FundIII, leaving the remaining fair value in the fund equivalent to Patria’s performance fees earned at June 30, as the fund transitions to a liquidation status. Future amounts received uponmonetization of remaining assets may vary from the amount being recognized this quarter, with any difference being recognized through Distributable Earnings at that point in time.
2Q21 Composition by Fund
1Q21 2Q21
253 12
EoP FXUS$/BRL 5.70
PE III(2007)
PE V(2015)
PE VI(2019)
IS III(2014)
EoP FXUS$/BRL 5.00
3251639
62
Other¹
Period Change in Balance by Fund (Vintage)
0 382 56
BeforeRealization
PE IIIRealized Perf. Fee

20
2Q21 | Second Quarter 2021 Earnings
DE per Share shown for 2Q20 and YTD 2020 for illustrative purposes only, using Patria’s post-IPO share count of 136,147,500 shares
See notes and definitions at end of document
▪ Distributable Earnings (“DE”) of US$74.2 million for 2Q21, up from US$14.5 million in 2Q20, driven by higher Fee Related Earnings and the impact of Performance Related Earnings (“PRE”) in the current period
(US$ in millions) 2Q20 2Q21 2Q21 vs. 2Q20 YTD 2Q20 YTD 2Q21YTD
2Q21 vs. 2Q20
Management Fees 25.4 33.0 7.7 49.2 64.4 15.2
(+) Incentive Fees 0.1 - (0.1) 0.1 - (0.1)
(+) Advisory Fees and Other Revenues (0.1) - 0.1 2.4 - (2.4)
(–) Taxes on Revenues (1) (0.8) (0.8) (0.0) (1.6) (1.6) 0.0
Total Fee Revenues 24.6 32.2 7.6 50.1 62.8 12.7
(–) Personnel Expenses (6.1) (10.1) (4.1) (13.1) (20.5) (7.4)
(–) Administrative Expenses (3.1) (3.8) (0.7) (5.9) (6.2) (0.4)
(–) Placement Fees Amortization and Rebates (2) (0.6) (0.6) (0.0) (1.1) (1.2) (0.1)
Fee Related Earnings (FRE) 14.9 17.6 2.8 30.1 34.9 4.8
FRE Margin (%) 60% 55% 60% 56%
Realized Performance Fees (After-Tax) - 86.8 86.8 - 86.8 86.8
(–) Realized Performance Fee Compensation (3) - (30.4) (30.4) - (30.4) (30.4)
Performance Related Earnings (PRE) - 56.4 56.4 - 56.4 56.4
(+) Realized Net Investment Income (4) (0.1) 0.1 0.3 0.5 (0.1) (0.6)
Pre-Tax Distributable Earnings 14.7 74.2 59.5 30.6 91.2 60.6
(–) Current Income Tax (5) (0.2) - 0.2 (0.5) - 0.5
Distributable Earnings (DE) 14.5 74.2 59.7 30.1 91.2 61.1
DE per Share 0.107 0.545 0.221 0.670

21
2021 Outlook
Note: Reflects management’s expectations as of September 15, 2021. Please see “Disclaimer” slide for information about the use of and reliance on projections.
We feel confident that Fee Related Earnings will exceed $75 million for the full year 2021 with a margin in the mid-50% range
The expected Fee Related Earnings combined with the Performance Related Earnings generated in Q2 would result in Distributable Earnings near $1.00 per share
Our current generation flagship Private Equity Fund is almost fully committed, and we expect to begin fundraising for the next generation Private Equity fund in the second half of 2021
We are excited to announce plans to launch a new dedicated Renewable Energy fund with fundraising also beginning in the second half of 2021
We announced a combination with Moneda Asset Management, which is expected to close by the end of the year, with timing determining the incremental impact to 2021 financial results

22
Patria & Moneda Transaction Overview

23
#1 Infrastructure &
Patria & Moneda | A Compelling First Step In Our M&A Strategy
Patria announces a combination with Moneda Asset Management, a leading diversified asset manager with over $10bn
in AUM across credit & equities, and a 25+ year track record of growth, profitability and performance for a total
upfront consideration of $315 million comprising 40% cash and 60% stock
1.1
Patria Today (AUM in US$ bn)
Patria + Moneda (AUM in US$ bn)
#1 Private Equity
Data as of June 30, 2021. Totals may not sum due to rounding.1) Pro forma FY 2021 accretion reflects the estimated accretion to Distributable Earnings based on Patria’s latest full year guidance for 2021 combined with FY 2021 estimated earnings for Moneda. The transaction
is currently expected to close prior to year end. These figures are estimates and preliminary and may differ from actual results.
9.75.0
Private Equity
- Real Estate (0.5)
- Credit (0.2)
Infrastructure
- CEF/PIPE (0.3)
9.7
5.5
5.1
3.0
2.0
US$ 25.9 bn
Total AUM
Credit PIPE/Public Equities
Infrastructure Real Estate
Advisory & Distribution
US$ 15.8 bn
- Infra Core (0.1)
1.1Country-specific:
0.5
Private Equity
#1 Credit
$0.12/shareor ~12%
Pro forma FY 2021 estimated
EPS accretion 1
3 Pillarsof our M&A strategy
✓ Enhance product offerings
✓ Expand geographic reach
✓ Improve distribution capabilities
alternative investment platform in Latin America
~70% of combined management fee
revenues exposed only to USD

24
Moneda Overview
Platform Summary
▪ Leading asset manager with a sticky US$10+bn AuM base across credit & equities (13% CAGR since 2007), and consistent FRE generation
▪ Partnership led by a like-minded, entrepreneurial team, with well-established relationships and strong culture alignment
▪ 25+ year track record of consistent strong performance and alpha generation
▪ Diversified and loyal investor base with more than 110 clients and deep relationships across LatAm
▪ Highly sophisticated institutional investors such as SWF, pension funds and HNWI, driving long-term committed capital
▪ Robust bottom-up investment strategy drives alpha generation, and is well suited to LatAm markets that highly value active management
▪ 40+ veteran investment team with 20+ years of experience and no turnover among lead PMs
1) As of June 30, 2021
AUM Overview
5.3
2.7
Public Equities Activist and value investing approach, leveraging deep expertise across LatAm
Key Attributes
▪ More than 90% of Total AUM is Fee Earning AUM
▪ Sticky AUM base with low historical turnover, and more than 70% in closed-end funds with limited gates of liquidity
▪ Strong local and global institutional investor base represents 80% of total commitments
▪ 89% of AUM cannot be replicable by an ETF
2.0
Advisory & Distribution
Complementary business (Third party feeder funds + Wealth Mgmt)
LATAM Strategies Chilean Strategies
US$ 10.0 bn1
Total AUM
High yield/ Public Credit
Distinctive bottom-up approach with low ability to replicate elsewhere in the market
Private Credit Longstanding track record especially in direct lending and distressed debt
Constructivist Equity
PE-like strategy in equities mainly through flagship Pionero fund #1
#1
#1
#1
#1

25
Historical Fee Earning AUM (FEAUM) Growth
▪ Fee Earning AUM at Moneda has grown at an attractive mid teens CAGR since the global financial crisis
▪ Net inflows to Fee Earning AUM have averaged USD ~$800 million per year for the periods since 2015
▪ Fee Earning Assets Under Management have grown at a 17% CAGR since 2015
▪ Local currency depreciation has been a headwind to NAV-based FEAUM in the most recent years, with USD-exposed FEAUM growing at a 10%CAGR since 2018, while FEAUM exposed to local LatAm currencies remained flat in USD terms 1
✓ We believe the combination with Patria unlocks significant new paths for growth through both new product development and cross-selling
1) USD FEAUM reflects the portion of Fee Earning AUM that is only exposed to US dollars (or EUR in certain limited cases), on an underlying investment basis, which accounts for approximately 50% of currentFEAUM. Non-USD FEAUM reflects the portion of Fee Earning AUM that is exposed to either CLP or a basket of local LatAm currencies through the underlying investments in the fund, which togetherrepresents approximately 50% of current FEAUM.
2008 2009 2010 2011 2012 2013 2014 2015 2016 2017 2018 2019 2020 2Q21
$9.7bn
14% CAGR
17% CAGR
5% CAGRShort term CAGR impacted by:
• Local currency deprecation over last few years
• NAV and fundraising impact during pandemic

26
Strong Track Record of Investment Performance & Excess Return
Proprietary valuation and credit analysis models
Deep knowledge in credit in both private and public markets
Actively managed strategies with proven investment approach
Deep bottom-up approach
Asset Class Fund (as June-21) Currency 1-year 5-yearSince
Inception
Credit
LATAM High Yield USD 24.3% 8.7% 11.7%
Benchmark: CEMBI Broad Div. LATAM HY 15.9% 7.2% 7.9%
LATAM Local Currency USD 21.4% 2.9% 3.5%
Benchmark: GBI Broad Div LATAM 8.2% 2.7% 2.6%
Chilean High Yield CLP 19.9% 7.5% 8.8%
Benchmark: RA Corporativo Global -4.4% 5.4% 6.9%
Equities
LATAM Large Cap USD 54.8% 10.9% 0.6%
Benchmark: MSCI TR Latam Gross 45.3% 6.2% -2.5%
Chilean Small Cap CLP -0.4% 3.3% 13.0%
Benchmark: MSCI Chile SC Net -2.2% -0.2% 7.0%
LATAM Small Cap USD 62.0% 10.1% 4.9%
Benchmark: MSCI EM LATAM SC Net 53.0% 9.2% 0.9%
Strategy AuM($USD)1
Excess Return
(since inception)
“GP of choice” in the region among local and global investors
Client recognition
3.4 bn380 bps
0.9 bn90 bps
0.4 bn190 bps
1.0 bn310 bps
0.9 bn600 bps
0.3 bn400 bps
1) Reflects Total AuM for the strategy. Returns calculated based on primary fund vehicle and exclude impact of separately managed accounts.
Leads peer group of comparable funds
Moneda’s funds have consistently outperformed benchmarks and comparable peer funds

27
▪ Enhances product offering by adding a credit vertical that starts as #1 in LatAm and consolidates as the #1 PIPE manager in the region
▪ Adds geographical exposure within Latin America through client base and product offering
▪ Opens the opportunity for cross-selling leveraging complementary investor base
Satisfies all three pillars of our M&A strategy1
▪ Moneda is the largest credit player with the longest track record in LatAm excluding Brazil
▪ Sizeable LatAm-focused private credit opportunity with market size estimated as large as US$20-30 billion by 2025
▪ Combined platform to have over US$650M exposure to private credit with top quartile returns
▪ Unmatched sourcing and technical capabilities that combine Moneda’s Pan-LatAm footprint with Patria’s robust Brazil sourcing engine
Solidifies the leading Credit business in LATAM and positions Patria to seize a compelling market opportunity2
▪ High-quality and reputable business with top-of-mind brand recognition
▪ Partnership led by a like-minded, entrepreneurial team, with well-established relationship and strong cultural alignment
▪ Earn-out structure and 5-year retention plan to partners and key people
Creates a highly aligned partnership with incentives in place for long term sustainability3
▪ Expected double digit accretion on both an FRE and DE basis in Year 1
Accretive to FRE and DE in year one4
Strategic Rationale
This presentation contains forward-looking statements, which should not be relied upon. For more information, see slide 2.

28
Growth & Synergy Opportunity
Private & Public Credit Constructivist & Public Equities strategies
Source: ANBIMA, Preqin, Central Bank of BrazilThis presentation contains forward-looking statements, which should not be relied upon. For more information, see slide 2.
26%20-year AuM
CAGR
Distribution & Advisory
Global market has
shown sustained
high growth over
the last 20 years
63%5-year AuM
CAGR
Leverage Moneda to lead the development of private credit in the
region and to explore the sizable opportunity in Public Credit
Leverage Moneda to expand Patria’s existing PIPE strategy more broadly across LatAm
Leverage the complementary client base to cross-sell
Leverage Moneda’s reputation and presence in Chile and LatAm to foster Patria’s flagship investments
Estimated potential market size in 2025 as high as
$20-30 bn(USD)
Private Credit
LatAm is outpacing
other regions in the
initial growth years
Public Credit
Outstanding value of High Yield and Investment Grade Corp Bonds in LatAm
$350 bn(USD)
Outstanding value of Local Currency Corporate Bonds in LatAm
$230 bn(USD)
Potential market size in 2025 for Constructivist Strategies in LatAm
$55-75 bn(USD)
Underlying market size of public equities in LatAm$2.2 Tn(USD)
Cross-Selling & Deal Sourcing
Leverage Moneda’s existing
distribution relationships
and wealth management
platform to create a conduit
for LatAm investor capital
to access alternatives
outside LatAm
6 of the world’s top 10 sovereign wealth funds…
…and only 1 overlaps with Moneda
Patria’s top global clients include...
10 of the world’s top 20 pension funds…
…and only 1 overlaps with Moneda

29
Combined Platform Well-Positioned for Growth
Pro-forma
$15.8bn $10.0bn $25.9bn
$8.3bn $9.7bn $18.0bn
~1.6% ~0.8% ~1.2%
75+mn 2 30+ mn 3 $105+mn 4
~55% 2 40+% 3 50+% 4
Totals may not sum due to rounding. This presentation contains forward-looking statements, which should not be relied upon. For more information, see slide 2.(1) As of June 30, 2021 (2) Reflects recent FY 2021 guidance provided on Patria’s 2Q21 earnings call (3) Reflects estimates for full year 2021 (4) Pro forma FY 2021 reflects Patria’s latest full year guidance for2021 combined with FY 2021 estimated earnings for Moneda. The transaction is expected to close during the 4th quarter of 2021. These figures are estimates, for illustrative purposes only, and may differ fromactual results.
Total AUM 1
FEAUM 1
Avg Mgmt Fee Rate 1
FRE
FRE margin (%)
In US$
Transaction expected to be accretive in Year One
Pro forma estimates for 2021 would imply Distributable Earnings per share accretion of ~12% for the full year 4

30
Transaction Details
Management
Timing
▪ Total upfront consideration of $315 million in a combination of $128 million in cash and $187 million in PAX Class B common stock
▪ Contingent additional consideration of up to $59 million payable in years 2 and 3 after closing, subject to certain retention condition metrics for Moneda’s partners
▪ Potential earn-out of $71 million payable after 2023 subject to the achievement of certain revenue and profitability targets, and in the form of either cash or PAX Class A common stock at Patria’s discretion
▪ Combination is expected to be accretive to Distributable Earnings per share in year one after closing, and on a FY 2021 pro forma basis, would be approximately 12% accretive to expected DE per share 1
▪ Transaction terms imply a low double-digit P/E multiple on expected 2021 earnings and a high single-digit P/E multiple on a forward-looking basis, presuming performance-based earnouts are maximized 2
Key Transaction
Terms
▪ Moneda executives and senior management will continue in their current roles
▪ Moneda partners to remain fully committed to the combination with a 5-year lock-up on stock consideration in place to ensure talent retention to foster the smooth combination of capabilities and execution of the growth path going forward
▪ Future compensation designed to incentivize and develop the next generation of talent and to align interests of Moneda team with Patria
Management
▪ Closing is subject to anti-trust approvals and other customary conditions
▪ Combination is currently expected to close prior to year-endTiming
This presentation contains forward-looking statements, which should not be relied upon. For more information, see slide 2.(1) Pro forma FY 2021 reflects Patria’s latest full year guidance for 2021 combined with FY 2021 estimated earnings for Moneda. These figures are estimates, for illustrative purposes only, and may differ fromactual results. (2) For illustrative purposes only. Based on current projections, which may differ from actual results.

31
Moneda Team
Pablo EcheverríaFounding Partner, Chairman and Portfolio Manager
Portfolio Manager of the Chilean Equity Strategy since 1994 and Chairman since 2007
27+ years in Moneda (32+ years of experience)
Alfonso DuvalPartner and CEO
Alfonso Duval is partner since 2011 and CEO of Moneda Asset Management since 2019
15+ years in Moneda (20+ years of experience)
Vicente BertrandPartner
Vicente Bertrand is partner since 2015 and is Co-Portfolio Manager of the Chilean Equities strategy, managing over USD 1.7 billion in assets.
14+ years in Moneda (25+ years of experience)
Esteban JadresicPartner
Esteban Jadresic is partner since 2015, Chief Economist and Global Investment Strategist at Moneda Asset Management since June 2008.
13+ years in Moneda (32+ years of experience)
Ezequiel CamusPartner
Ezequiel Camus is partner and Head of Institutional Clients ex Brazil of Moneda since June 2019. He is also responsible for the relationship with The Carlyle Group.
10+ years in Moneda (18+ years of experience)
Alfredo ReyesPartner
Partner and Head of Private Clients since 2008, the wealth management area of Moneda that manages around USD 700 million
13+ years in Moneda (35+ years of experience)
Javier MonteroPartner
Javier Montero is partner since 2015 and manages over USD 5 billion in assets
12+ years in Moneda (22+ years of experience)
Fernando TisnéPartner
Portfolio Manager of all fixed income assets at Moneda Asset Management, which currently exceed USD 5 billion, and partner since 2006
27+ years in Moneda (27+ years of experience)
Alejandro OleaPartner
Alejandro Olea is partner since 2011, Head and Portfolio Manager of Latam Equities. He manages over USD 800 million in assets
18+ years in Moneda (21+ years of experience)
Juan Luis RiveraPartner
Head of Institutional Clients Global (ex-LatAm), based in NY and leads Moneda USA, partner since 2006. Since 2018 manages ESG.
15+ years in Moneda (26+ years of experience)
32
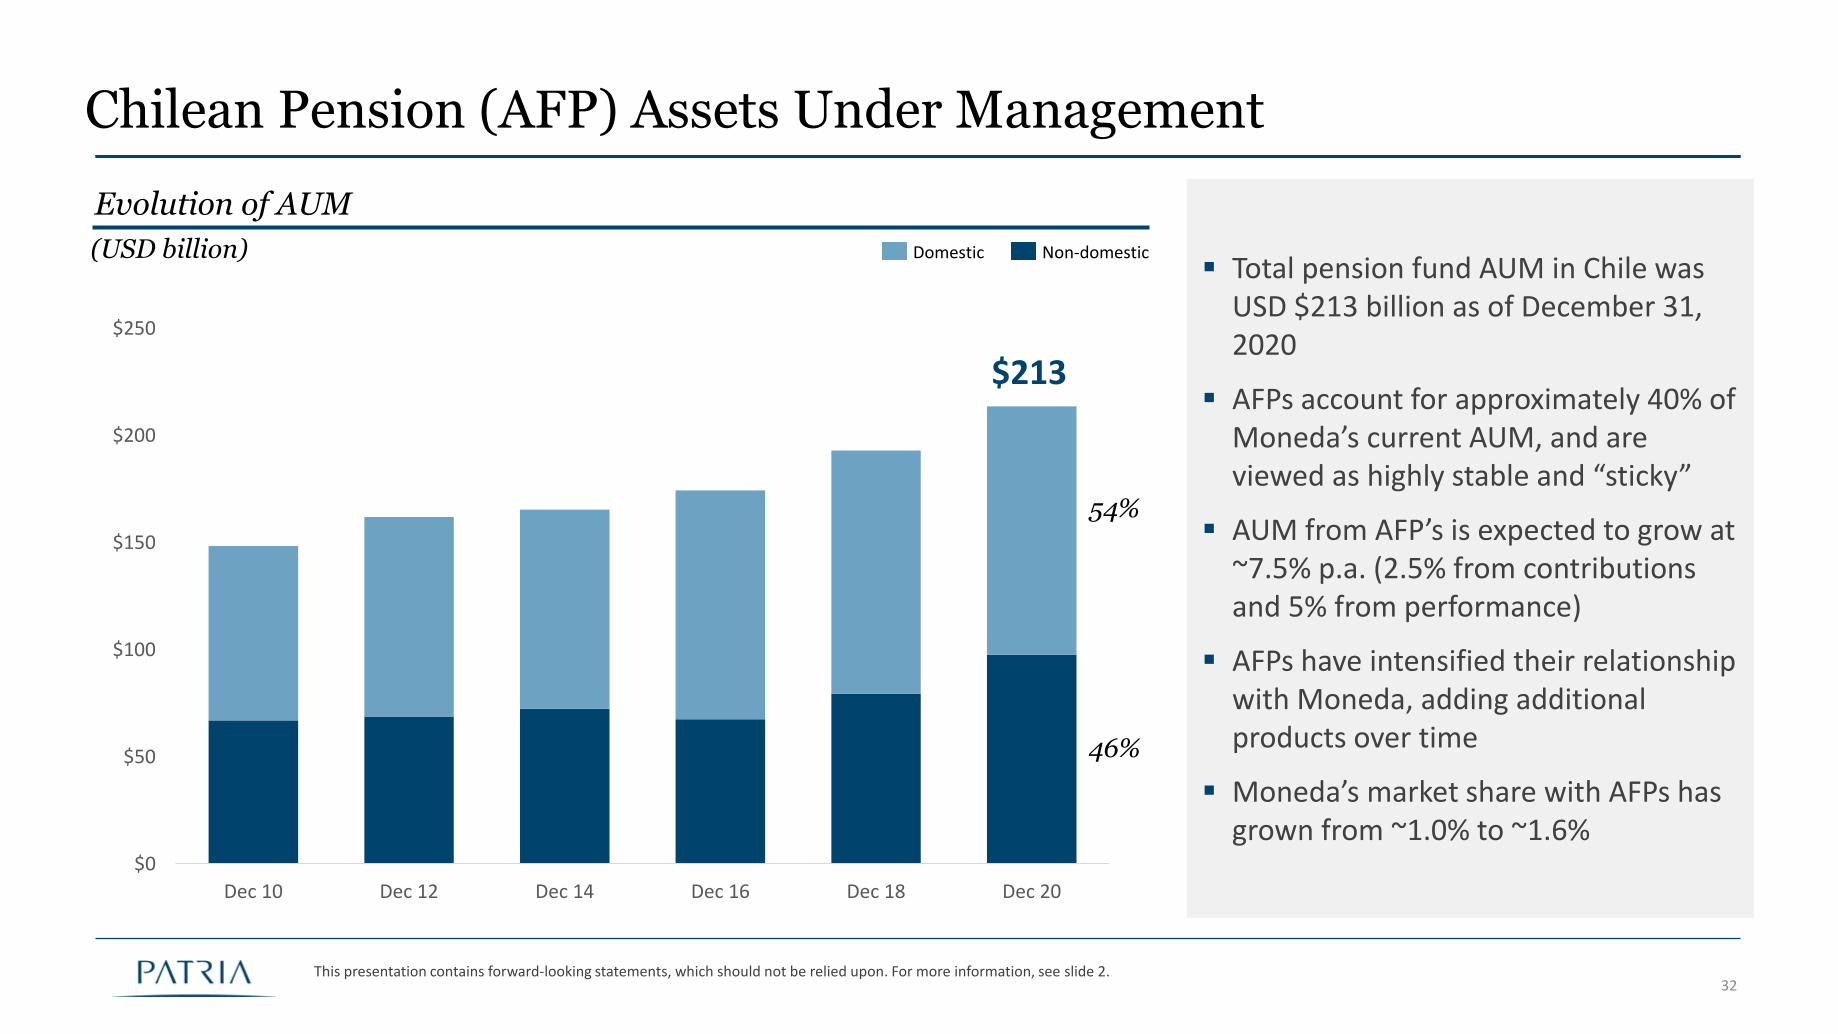
Chilean Pension (AFP) Assets Under Management
▪ Total pension fund AUM in Chile was USD $213 billion as of December 31, 2020
▪ AFPs account for approximately 40% of Moneda’s current AUM, and are viewed as highly stable and “sticky”
▪ AUM from AFP’s is expected to grow at ~7.5% p.a. (2.5% from contributions and 5% from performance)
▪ AFPs have intensified their relationship with Moneda, adding additional products over time
▪ Moneda’s market share with AFPs has grown from ~1.0% to ~1.6%
$0
$50
$100
$150
$200
$250
Dec 10 Dec 12 Dec 14 Dec 16 Dec 18 Dec 20
Evolution of AUM
(USD billion)
$213
54%
46%
Domestic Non-domestic
This presentation contains forward-looking statements, which should not be relied upon. For more information, see slide 2.

33
Insights on AFP Growth & Asset Allocation
Forward Looking Growth Stable Allocations Role of Active Management
▪ Based on analysis of economic consultants, we believe the base case growth of the total AFP AUM to be between 7-8% annually
▪ Growth in the AFP market is expected to come from contributions (2.5% p.a. as unemployment rate decreases), and from performance (5% p.a.)
➢ Under this scenario – If Moneda can maintain current market share, AUM from AFPs could grow at the expected market rate of 7.5% p.a.
▪ AFPs have similar asset allocations as they can only deviate by 200bps from the average allocation across all pension funds
▪ Asset allocations have been stable over the last 5 years, with small shifts between asset classes
▪ We expect this trend to continue as regulatory restrictions do not allow for large changes
➢ AFP’s investments with Moneda are therefore not expected to see abrupt changes
▪ Pension funds prefer actively managed funds due to market inefficiencies in the Chilean and Latin American markets…They believe there is significant alpha to be uncovered
▪ In developed markets like the U.S. and Europe, they typically use more of a mix of active and passive strategies
➢ Moneda’s active management approach is expected to continue to be valued by AFPs
This presentation contains forward-looking statements, which should not be relied upon. For more information, see slide 2.

34
Appendix

35
Closed-End Funds Investment Record as of 2Q21
Deployed
+ Reserved
Total
Invested
Unrealized
Investments
Realized
Investments
Fund (Vintage)
Total
(USD)%
Value
(USD)
Value
(USD)
Value
(USD)
Value
(USD)
Gross MOIC
(USD)
Net IRR
(USD)
Net IRR
(BRL)
Private Equity
PE I (1997) 234,000 Divested 163,812 - 278,480 278,480 1.7x 4% 7%
PE II (2003) 50,000 Divested 51,648 - 1,053,625 1,053,625 20.4x 92% 75%
PE III (2007) 571,596 124% 624,464 110,643 1,078,143 1,188,786 1.9x 8% 19%
PE IV (2011) 1,270,853 116% 1,151,422 1,643,554 196,919 1,840,473 1.6x 6% 17%
PE V (2015) 1,807,389 90% 1,403,543 3,718,345 98,118 3,816,463 2.7x 36% 48%
PE VI (2019) 2,689,666 96% 932,593 1,191,772 11,882 1,203,654 1.3x 28% 25%
Co investments 745,010 100% 745,010 937,577 - 937,577 1.3x n/m n/m
Total Private Equity 7,368,514 5,072,492 7,601,891 2,717,166 10,319,058 2.0x 16% 22%
Infrastructure
Infra II (2010) 1,154,385 102% 997,700 505,700 823,100 1,328,800 1.3x 2% 13%
Infra III (2014) 1,676,237 103% 1,120,300 1,328,900 528,300 1,857,200 1.7x 9% 21%
Infra IV (2019) 1,941,000 80% 231,000 292,200 - 292,200 1.3x 19% 12%
Co investments 793,264 74% 588,124 511,161 439,629 950,790 1.6x n/m n/m
Total Infrastructure 5,673,475 3,045,713 2,637,961 1,944,854 4,582,815 1.5x 6% 18%
Real Estate/Agribusiness (BRL) % (BRL) (BRL) (BRL) (BRL) (BRL) (USD) (BRL)
RE I (2004) 177,362 Divested 168,335 - 459,072 459,072 2.7x 24%
RE II (2009) 996,340 87% 1,009,473 195,376 1,053,634 1,249,010 1.2x 1%
RE III (2013) 1,310,465 86% 1,171,712 725,887 138,079 863,966 0.7x -12%
Farmland (2018) 149,043 40% 61,019 34,200 66,675 100,875 1.7x 8%
Co investments 1,107,668 100% 1,035,431 79,111 - 79,111 0.1x -44%
Total Real Estate/Agri 3,740,879 3,445,970 1,034,574 1,717,460 2,752,034 0.8x -12%
Committed
Capital
Total
ValueNet Returns

36
Total AUM & FEAUM Roll Forward (Unaudited)
See notes and definitions at end of document
Total Assets Under Management (“AUM”) (US$ in millions)
Three Months Ended June 30, 2021 Twelve Months Ended June 30, 2021
Total Fee Earning AUM (“FEAUM”) (US$ in millions)
Three Months Ended June 30, 2021 Twelve Months Ended June 30, 2021
(US$ in millions)PE Infra
Country-Specific
ProductsTotal
AUM 2Q20 7,143 4,693 949 12,784
Funds Raised - 102 293 395
Divestments (108) (293) (86) (487)
Valuation Impact 2,006 320 (41) 2,286
FX 666 113 94 873
Funds Capital Variation 34 21 (66) (11)
AUM 2Q21 9,742 4,955 1,143 15,840
(US$ in millions)PE Infra
Country-Specific
ProductsTotal
AUM 1Q21 8,453 4,585 1,078 14,116
Funds Raised - - 2 2
Divestments (98) - (12) (110)
Valuation Impact 399 160 17 575
FX 939 184 131 1,254
Funds Capital Variation 49 27 (73) 3
AUM 2Q21 9,741 4,955 1,143 15,840
(US$ in millions)PE Infra
Country-Specific
ProductsTotal
FEAUM 2Q20 2,928 3,499 663 7,089
Inflows 898 139 395 1,432
Outflows (2) (305) (82) (389)
Valuation Impact (0) (5) 138 133
FX and Other 8 (37) 77 48
FEAUM 2Q21 3,831 3,291 1,191 8,313
(US$ in millions)PE Infra
Country-Specific
ProductsTotal
FEAUM 1Q21 3,809 3,211 1,013 8,033
Inflows 13 16 60 89
Outflows - - (12) (12)
Valuation Impact (0) (2) 17 15
FX and Other 10 65 113 188
FEAUM 2Q21 3,831 3,291 1,191 8,313

37
Patria’s Second Quarter 2021 IFRS Results
▪ GAAP Net Income was US$73.4 million for 2Q21 and US$86.5 million year-to-date (“YTD”)
Throughout this presentation all current period amounts are preliminary and unaudited. Totals may not add due to rounding.
See notes and definitions at end of document.
(US$ in millions) 2Q20 2Q21 YTD 2Q20 YTD 2Q21 LTM 2Q20 LTM 2Q21
Revenue from management fees 25.4 33.0 49.2 64.4 102.4 128.0
Revenue from incentive fees 0.1 - 0.1 0.0 5.1 3.3
Revenue from performance fees (1) - 86.8 - 86.8 4.9 86.8
Revenue from M&A and monitoring fees - - 2.5 - 3.0 0.0
Taxes on revenue (2) (0.9) (0.8) (1.7) (1.6) (4.3) (3.6)
Revenue from services 24.6 119.0 50.1 149.6 111.1 214.5
Personnel expenses (3) (6.2) (11.3) (13.1) (21.7) (31.5) (35.8)
Amortization of intagible assets (1.5) (1.5) (2.9) (3.0) (6.0) (6.0)
Carried Interest Allocation - (30.4) - (30.4) - (30.4)
Cost of services rendered (7.6) (43.1) (16.1) (55.1) (37.5) (72.2)
Gross profit 17.0 75.8 34.0 94.5 73.6 142.3
Administrative expenses (3.1) (3.8) (5.9) (6.2) (14.4) (15.0)
Other income/(expenses) (4) - - 0.1 (2.4) (0.6) (4.5)
Operating income and expenses 13.9 72.0 28.3 85.9 58.7 122.8
Operating income before net financial income/(expense) 13.9 72.0 28.3 85.9 58.7 122.8
Net financial income/(expense) (0.1) 0.2 0.4 (0.1) 0.3 (0.7)
Income before income tax 13.7 72.2 28.7 85.8 59.0 122.1
Income tax (5) (0.5) 1.2 (3.1) 0.7 (3.2) 0.6
Net income for the period 13.2 73.4 25.6 86.5 55.8 122.8

38
Reconciliation of IFRS to Non-GAAP Measures
See notes and definitions at end of document
(US$ in millions) 2Q20 2Q21 YTD 2Q20 YTD 2Q21 LTM 2Q20 LTM 2Q21
Management Fees 25.4 33.0 49.2 64.4 102.4 128.0
(+) Incentive Fees 0.1 - 0.1 - 5.1 3.3
(+) Advisory Fees and Other Revenues (0.1) - 2.4 - 2.9 0.1
(–) Taxes on Revenues (0.8) (0.8) (1.6) (1.6) (3.6) (3.7)
Total Fee Revenues 24.6 32.2 50.1 62.8 106.8 127.7
(–) Personnel Expenses (6.1) (10.1) (13.1) (20.5) (32.2) (34.2)
(–) Administrative Expenses (3.1) (3.8) (5.9) (6.2) (14.4) (15.0)
(–) Placement Fees Amortization and Rebates (0.6) (0.6) (1.1) (1.2) (2.3) (2.4)
Fee Related Earnings (FRE) 14.9 17.6 30.1 34.9 58.0 76.1
Realized Performance Fees (After-Tax) - 86.8 - 86.8 4.3 86.8
(–) Realized Performance Fee Compensation - (30.4) - (30.4) - (30.4)
Performance Related Earnings (PRE) - 56.4 - 56.4 4.3 56.4
(+) Realized Net Investment Income (0.1) 0.1 0.5 (0.1) (0.3) (0.7)
Pre-Tax Distributable Earnings 14.7 74.2 30.6 91.2 62.1 131.8
(–) Current Income Tax (0.2) - (0.5) - (2.0) (0.4)
Distributable Earnings (DE) 14.5 74.2 30.1 91.2 60.1 131.4
(-) Deferred Taxes (1) (0.3) 1.2 (2.7) 0.7 (1.2) 1.1
(-) Amortization of contractual rights (2) (0.9) (0.9) (1.8) (1.8) (3.7) (3.6)
(-) Tracking shares - Officers' fund (3) (0.1) (0.5) (0.1) (0.7) 0.7 (1.0)
(-) Performance Share Plan (4) - (0.6) - (0.6) - (0.6)
(-) IPO Expenses (5) - 0.0 - (2.3) - (4.5)
Net income for the period 13.2 73.4 25.6 86.5 55.8 122.8

39
IFRS Balance Sheet Results
See notes and definitions at end of document
(US$ in millions) 12/31/2020 6/30/2021 (US$ in millions) 12/31/2020 6/30/2021
Assets Liabilities and Equity
Cash and cash equivalents 14.1 25.2 Personnel and related taxes (4) 12.8 15.4
Short term investments (1) 9.9 286.3 Taxes payable 1.1 0.4
Accounts receivable (2) 24.0 111.0 Dividends payable 23.2 -
Project advances 1.3 1.9 Other liabilities 6.9 6.1
Other assets 3.7 3.0 Carried interest allocation (5) - 30.4
Recoverable taxes 0.7 0.9
Current liabilities 44.0 52.3
Current Assets 53.7 428.3
Personnel liabilities 1.5 1.8
Accounts receivable 22.0 22.0 Deferred tax liabilities 0.2 0.2
Deferred tax assets 2.3 3.1 Other liabilities 2.4 2.1
Project advances 0.5 0.6
Other assets 0.5 0.6 Non-current liabilities 4.1 4.1
Long term investments (3) 2.0 8.6
Property and equipment 3.8 4.0 Capital 0.0 0.0
Intangible assets 22.4 19.3 Additional paid-in capital 1.6 300.4
Performance Share Plan (6) - 0.6
Non-current assets 53.5 58.2 Retained earnings 62.0 135.3
Cumulative translation adjustment (6.3) (6.2)
Equity attributable to the owners of the parent57.3 430.1
Non-controlling interests (7) 1.8 -
Equity 59.1 430.1
Total Assets 107.2 486.5 Total Liabilities and Equity 107.2 486.5

40
Understanding Patria’s P&LFEE RELATED EARNINGS & DISTRIBUTABLE EARNINGS ARE KEY PROFITABILITY MEASURES FOR THE INDUSTRY
2Q21
Management Fees 33.0 Primary operating revenue stream – Contractual recurring fees based on Fee Earning AUM
Incentive Fees - Earned on certain perpetual capital vehicles – Measured on a recurring basis without realization requirement
Advisory Fees & Other Revenues - Includes portfolio advisory fees net of rebates to fund investors, as well as other miscellaneous revenue
Taxes on Revenues (0.8) Tax expense directly related to revenues earned in certain tax jurisdictions
Total Fee Revenues 32.2 Sum of management fees, incentive fees and other operating revenues, net of related tax expense
Personnel Expenses (10.1) Includes base & bonus compensation, benefits and payroll taxes
Administrative Expenses (3.8) Includes non-compensation-related expenses including professional services, office costs, etc
Placement Fees Amortization & Rebates (0.6) Reflects the amortized cost of certain expenses related to fundraising and distribution
Fee Related Earnings (FRE) 17.6 Highly-valued industry measure of operating profitability excluding the impact of performance fees
Realized Performance Fees 86.8 Gross realized carried interest – closed-end funds based on “European waterfall” structure
Realized Performance Fee Compensation (30.4) Compensation paid to investment team employees at a rate of 35% of realized performance fees
Performance Related Earnings 56.4 Performance fees attributable to the firm & shareholders (net of related compensation expense)
Realized Net Investment Income 0.1 Generally reflects the realized gain (loss) on balance sheet investments/assets
Pre-tax Distributable Earnings 74.2 Sum of Fee Related Earnings, Performance Related Earnings & Realized Net Investment Income
Current Income Tax - Income tax expense paid at the corporate level
Distributable Earnings (DE) 74.2 Headline “cash” earnings metric for the industry – Basis for variable dividend calculation at rate of ~85%
Data as of June 30, 2021

41
Management Fee Revenue: Understanding the MechanicsMANAGEMENT FEES FOR FLAGSHIP FUNDS ARE CHARGED SEMI-ANNUALLY & RECOGNIZED OVER NEXT TWO QUARTERS
($mm)
Inflows to FEAUM (Capital Deployed or Reserved)
$500 $500 $500 $500
Outflows to FEAUM (Divestments) $(250) $(250) $(250) $(250)
Fee Earning AUM $1,000 $1,000 $1,000 $1,500 $1,500 $1,500 $2,000
Fee Rate 1.6%/2 1.6%/2 1.6%/2
Semi-Annual Mgmt Fees Received $8 $12 $16
Quarterly Revenue Recognition $4 $4 $6 $6
Illustrative example for a fund with management fees charged on invested capital…
Note: For general illustrative purposes only. Fee structures may differ by vehicle.

42
Notes
Notes to page 17 – 2Q21 | Fundraising & Portfolio Activity(1) Total Deployment represents the incremental capital invested or reserved for investments in closed-end funds during the period(2) Invested/Called represents the total capital called for investments and for fees & expenses(3) Reserved includes binding/reserved capital for investments and reserved capital for fees & expenses yet to be called/deployed
Notes to page 19 – 2Q21 | Net Accrued Performance Fees(1) Other includes Private Equity funds III and IV, and Infrastructure funds II and IV
Notes to pages 20 – 2Q21 | Second Quarter 2021 Earnings(1) Taxes on revenue have been adjusted from the comparable line in our IFRS results on page 5 to remove Taxes on Realized Performance Fees which are excluded from Patria’s Fee Related
Earnings(2) Placement Fees Amortization are recorded on an accrual basis and amortized over the terms of the respective investment funds(3) Performance fee payable to carried interest vehicle have been excluded from performance related earnings(4) Realized Net Investment Income includes both Net Financial Income and Expenses and Other Income and Expenses net of non-current IPO Expenses(5) Current Income Tax represents tax expenses based on each jurisdiction’s tax regulations, excluding Deferred Tax Expenses
Notes to page 36 – Total AUM & FEAUM Roll Forward (Unaudited)(1) Inflows for FEAUM during the period reflect new fundraising for funds charging fees based on committed capital, plus deployed (or reserved) capital for funds charging fees based on
deployed capital(2) Outflows for FEAUM during the period reflect the impact of divestments as well as changes in the effective fee basis from committed to deployed capital
Notes to page 37 – Patria’s Second Quarter 2021 IFRS Results(1) The increase in revenue from performance fees is related to receivables from PBPE Fund III (Ontario), L.P.(2) Taxes on revenue represent taxes charged directly on services provided in some of the countries where Patria operates.(3) The increase is due mainly to the change in compensation structure post-IPO.(4) IPO expenses and IPO bonuses related to the Initial Public Offering concluded on January 21, 2021.(5) Income tax includes both current and deferred tax expenses for the period.

43
Notes
Notes to Page 38 – Reconciliation of IFRS to Non-GAAP Measures(1) Income Taxes have been adjusted to remove Deferred Taxes which are excluded from Patria’s Distributable Earnings. Deferred Taxes arise from taxable temporary differences mostly
derived from non-deductible employee profit sharing accruals(2) This adjustment removes Amortization of Contractual Rights which are excluded from Patria’s Distributable Earnings. This amount refers to the amortization of intangibles associated
with Patria’s acquisition of P2 Group(3) Personnel expenses have been adjusted to remove the Officers’ Fund tracking shares which are excluded from Patria’s Fee Related Earnings. This amount reflects the valuation change of
the tracking shares in the period(4) Personnel expenses have been adjusted to remove the impact from granting rights to management and employees to purchase shares in relation to the share-based incentive plan
introduced. The amount reflects the equity recognized based on expected vesting criteria being met.(5) Administrative Expenses have been adjusted to remove non-recurring expenses associated with Patria’s IPO which are excluded from Patria’s Fee Related Earnings
Notes to Page 39 – IFRS Balance Sheet Results(1) June 30, 2021 balance includes US$284 million of IPO proceeds(2) The increase in current accounts receivable reflects US$ 86.8m of performance fees receivable from PBPE Fund III (Ontario), L.P.(3) The movement in Long-term investments reflects foreign exchange rate appreciation on investments in fund Patria Infra Core FIP.(4) The movement reflects the accrual for purposes of profit sharing for six months of 2021(5) The outstanding amount reflects 35% of performance fees receivable from PBPE Fund III (Ontario), L.P. payable to carried interest vehicle(6) Other reserves reflect the newly approved share-based incentive plan on granting of rights to buy shares(7) As part of the corporate reorganization, prior period non-controlling interests in Pátria Investimentos Ltda. are now fully consolidated at 100% ownership

44
Definitions
• Distributable Earnings (DE) is used to assess our performance and capabilities to distribute dividends to shareholders. DE is calculated as FRE deducted by current income tax expense,plus net realized performance fees, net financial income/(expenses), and other income/(expenses). DE is derived from and reconciled to, but not equivalent to, its most directlycomparable GAAP measure of net income.
• Fee Related Earnings (FRE) is a performance measure used to assess our ability to generate profits from revenues that are measured and received on a recurring basis. FRE is calculatedas management, incentive and M&A and monitoring fees, net of taxes, less personnel and administrative expenses, amortization of placement agents and rebate fees, adjusted for theimpacts of equity base compensation and non-recurring expenses.
• Incentive Fees are realized performance-based fees coming from perpetual capital funds (i.e. open-ended funds) when the returns from such funds surpass the relevantbenchmark for such fund, and are included in FRE because they represent a source of revenues that are measured and received on a recurring basis and are not dependent onrealization events from the underlying investments within perpetual capital funds, although the amount of incentive fees may fluctuate based on the performance of perpetualcapital funds relative to the relevant benchmark.
• Performance Related Earnings (PRE) refer to realized performance fees (net of related taxes) less realized performance fee compensation allocated to our investment professionals. Weearn performance fees from certain of our closed-end funds, representing a specified allocation of profits generated on eligible third-party capital, and on which the general partnerreceives a special residual allocation of income from limited partners in the event that specified return hurdles are achieved by the fund.
• Net Accrued Performance Fees represent an accrued balance of performance fees, which if each eligible investment vehicle were liquidated on the reporting date at current valuations,would be recognized as Performance Related Earnings.
• Total Assets Under Management (Total AUM) refers to the total capital funds managed by us plus the investments directly made by others in the invested companies when offered by usas co-investments. In general, Total AUM equals the sum of (i) the fair value of the investments of each one of the funds and co-investments; and (ii) uncalled capital, which is thedifference between committed and called capital.
• Fee Earning Assets Under Management (FEAUM) is measured as the total capital managed by us on which we derive management fees as of the reporting date. Management fees arebased on “net asset value,” “adjusted cost of all unrealized portfolio investments,” “capital commitments,” or “invested capital” plus “reserved capital” (if applicable), each as defined inthe applicable management agreement.
• Pending FEAUM refers to committed capital that is eligible to earn management fees, but is not yet activated per the basis defined in the applicable management agreement.• Remaining Duration of FEAUM reflects the contracted life of management fees from the reporting date for our current FEAUM, based on applicable management agreements.
• Gross MOIC represents the Gross Multiple on Invested Capital, and is calculated as the total fair value of investments (realized and unrealized), divided by total invested capital.• Net IRR represents the cash-weighted internal rate of return on limited partner invested capital, based on contributions, distributions and unrealized fair value as of the reporting date,
after the impact of all management fees, expenses and performance fees, including current accruals. Net IRR is calculated based on the chronological dates of limited partner cash flows,which may differ from the timing of actual investment cash flows for the fund.