~$patopac clearance revised verision final revised august...
TRANSCRIPT

DMD #53397
1
Meeting the challenge of predicting hepatic clearance of compounds slowly metabolized by
cytochrome P450 using a novel hepatocyte model, HepatoPacTM
Tom S. Chan, Hongbin Yu, Amanda Moore, Salman Khetani and Donald Tweedie
Drug Metabolism and Pharmacokinetics, Boehringer Ingelheim Pharmaceuticals, 900 Ridgebury
Road, Ridgefield, CT, 06877 (T.C., H.Y., D.T.); Hepregen Corporation, 200 Boston Ave.,
Medford, MA, 02155 (A.M.); Mechanical and Biomedical Engineering, Colorado State
University, Fort Collins, CO, 80523 (S.K.)
DMD Fast Forward. Published on August 19, 2013 as doi:10.1124/dmd.113.053397
Copyright 2013 by the American Society for Pharmacology and Experimental Therapeutics.
This article has not been copyedited and formatted. The final version may differ from this version.DMD Fast Forward. Published on August 19, 2013 as DOI: 10.1124/dmd.113.053397
at ASPE
T Journals on February 3, 2019
dmd.aspetjournals.org
Dow
nloaded from

DMD #53397
2
Running Title: Clearance prediction using HepatoPacTM
Corresponding author: Hongbin Yu, Department of Drug Metabolism and Pharmacokinetics,
Boehringer Ingelheim Pharmaceuticals, Inc. 900 Ridgebury Road, Ridgefield, CT 06877
Telephone: 203 791 6854; FAX: 203 791 6003 E-mail: [email protected]
Tom S. Chan and Hongbin Yu contributed equally to this work.
Words in Abstract: 239
Words in Introduction: 441
Words in Discussion: 1856
Number of References: 69
Number of Figures: 5
Number of Tables: 4
Number of text pages: 19
ABBREVIATIONS: CL, clearance; CLh, predicted hepatic clearance; CLnon-renal, observed
human in vivo non-renal clearance; CLint, intrinsic clearance; C0, initial concentration; Ct,
concentration at a specified time during the incubation; DMEM, Dulbecco’s Modified Eagle
Media; fu, fraction of drug unbound to plasma protein; HCM, hepatocyte culture medium; ITS,
insulin, transferrin and selenium; kel, elimination rate constant; Rb, red blood cell partitioning;
t1/2, half-life; Q, hepatic blood flow.
This article has not been copyedited and formatted. The final version may differ from this version.DMD Fast Forward. Published on August 19, 2013 as DOI: 10.1124/dmd.113.053397
at ASPE
T Journals on February 3, 2019
dmd.aspetjournals.org
Dow
nloaded from

DMD #53397
3
Abstract
Generating accurate in vitro intrinsic clearance data is an important aspect of predicting in vivo
human clearance. Primary hepatocytes in suspension are routinely used to predict in vivo
clearance; however, incubation times have typically been limited to 4 to 6 hours, which is not
long enough to accurately evaluate the metabolic stability of slowly metabolized compounds.
HepatoPac is a micropatterened hepatocyte-fibroblast co-culture system which can be used for
continuous incubations up to 7 days. This study evaluated the ability of human HepatoPac to
predict the in vivo CL of 17 commercially available compounds with low to intermediate
clearance (< 12 mL/min/kg). Hepatic clearance was predicted using the well-stirred model.
Using 3 individual donors, hepatic CL was accurately predicted for 10 of 17 compounds (59%;
predicted clearance within 2-fold of observed human in vivo clearance values). The accuracy of
prediction increased to 76% (13 of 17 compounds) with an acceptance criterion defined as within
3-fold. When considering only low clearance compounds (10 of 17), the accuracy of prediction
was 60% within 2-fold and 90% within 3-fold. In addition, the turnover of 3 slowly metabolized
compounds in HepatoPac was directly compared to turnover in suspended hepatocytes. The
turnover of alprazolam and tolbutamide was approximately 2-fold greater using HepatoPac
compared to suspended hepatocytes. HepatoPac, but not suspended hepatocytes, demonstrated
significant turnover of meloxicam. These results demonstrate the utility of HepatoPac for
prediction of in vivo hepatic clearance, particularly with low clearance compounds.
This article has not been copyedited and formatted. The final version may differ from this version.DMD Fast Forward. Published on August 19, 2013 as DOI: 10.1124/dmd.113.053397
at ASPE
T Journals on February 3, 2019
dmd.aspetjournals.org
Dow
nloaded from
DMD #53397
4
Introduction
The development of drug candidates with acceptable PK parameters continues to be a
challenge (Kola and Landis, 2004). Prospectively predicting PK parameters, using in vitro
metabolism data, is a critical approach to mitigating the risk of advancing compounds with poor
PK characteristics in the clinic. Metabolism by the liver is responsible for the clearance of ~70%
of marketed drugs (Wienkers and Heath, 2005). The pharmaceutical industry has increasingly
relied on the predictive power of in vitro models, such as liver sub-cellular fractions or
hepatocyte preparations, to identify compounds with acceptable clearance characteristics, i.e.
lower clearance compounds suitable for once daily dosing (Carlile, et al., 1997; Iwatsubo, et al.,
1997; Brandon, et al., 2003; Fagerholm, 2007). Hepatocyte suspensions reflect all metabolic
pathways of the liver and this integrated metabolic capability potentially offers some clear
advantages for hepatocytes as the model of choice for predicting hepatic clearance (Lau, et al.,
2002; Brown, et al., 2007; Fagerholm, 2007). A tendency of hepatocytes to underpredict
metabolic clearance compromises this position (Hallifax, et al., 2010).
One of the key challenges in using suspended hepatocytes for predicting hepatic
clearance is the loss of activity of drug metabolizing enzymes which restricts the typical
incubation period to 4-6 hours (Elaut, et al., 2006; Stringer, et al., 2008). This limited incubation
time prohibits the accurate determination of the intrinsic clearance (CLint) of compounds that are
slowly metabolized. Consequently, an in vitro hepatocyte model that can survive (incubate)
longer would offer the possibility of overcoming this restriction (Obach, 1999; Lau, et al., 2002;
Andersson, et al., 2004; Riley, et al., 2005; Brown, et al., 2007).
This article has not been copyedited and formatted. The final version may differ from this version.DMD Fast Forward. Published on August 19, 2013 as DOI: 10.1124/dmd.113.053397
at ASPE
T Journals on February 3, 2019
dmd.aspetjournals.org
Dow
nloaded from
DMD #53397
5
HepatoPacTM is a micro-patterned co-culture of human hepatocytes, supported by mouse
embryonic 3T3 fibroblasts, that has been engineered to possess extended cell viability (typically
up to 6 weeks) with retention of in vivo-like hepatocyte functions in culture (e.g. albumin
secretion, urea synthesis and drug metabolizing activities) (Khetani and Bhatia, 2008;Wang, et
al., 2010). This in vitro hepatocyte culture system was shown to replicate in vivo metabolite
profiles following incubations for 7 days, without a change in medium, which allowed ample
time for the accumulation of detectable levels of metabolites that are slowly formed or derived
from sequential metabolic pathways (Wang, et al., 2010). In the current study, HepatoPac was
used to experimentally determine the metabolic turnover of 17 commercially available drugs that
are low to moderately cleared in vivo (mainly by the liver). Hepatic clearances (CLh) were then
calculated using the well-stirred model and compared to published human in vivo CLnon-renal
values to determine the accuracy of predictions. Additionally, the depletion of 3 slowly
metabolized compounds was followed in suspended hepatocytes and compared to HepatoPac
cultures.
Materials and Methods
Materials
Human HepatoPac cultures were acquired from Hepregen Corporation (Medford, MA)
and prepared from 3 lots (unpooled) of cryoplateable hepatocytes (Donor designations: RTM, 1
and 3). Alprazolam, atazanavir, atomoxetine, diazepam, diclofenac sodium salt, flecainide,
glimepiride, lidocaine, meloxicam, midazolam, prednisolone, riluzole, risperidone, theophylline,
tolbutamide, tomoxetine, Trypan Blue, voriconazole, (+/-) warfarin and William’s E media were
purchased from Sigma Aldrich Inc. (St. Louis, MO). A solution of Penicillin (10,000 units/mL)
This article has not been copyedited and formatted. The final version may differ from this version.DMD Fast Forward. Published on August 19, 2013 as DOI: 10.1124/dmd.113.053397
at ASPE
T Journals on February 3, 2019
dmd.aspetjournals.org
Dow
nloaded from

DMD #53397
6
and streptomycin (10 mg/mL), and GlutaMax (100X) were purchased from Gibco/Life
Technologies (Grand Island, NY). A 20-donor customized pool of cryopreserved hepatocytes
(LOT 000) was obtained from Celsis IVT (Baltimore MD). ITS+ premix cell culture supplement
was acquired from BD Gentest (Franklin Lakes, NJ).
Cell Culture
HepatoPac
Plateable cryopreserved primary human hepatocytes were purchased from commercial
vendors permitted to sell products derived from human organs procured in the United States by
federally designated Organ Procurement Organizations. The donors consisted of 3 female,
Caucasian donors (Donor 1, Donor RTM and Donor 3) aged 19, 61 and 54 years of age,
respectively. Cryopreserved hepatocytes were thawed at 37 °C for 90-120 seconds followed by
dilution with 50 mL of pre-warmed Hepregen-customized and proprietary hepatocyte culture
medium (HCM). The cell suspension was spun at 50×g for 5 minutes. The supernatant was
discarded, cells were resuspended in HCM, and viability was assessed using Trypan blue dye
exclusion (viability was at least 85%). Liver-derived nonparenchymal cells, as judged by their
size (~10 μm in diameter) and morphology (nonpolygonal), were consistently found to be
less than 1% in these preparations.
To create micropatterned co-cultures in 96-well plates, an hepatocyte pattern was
produced by seeding hepatocytes on collagen-patterned substrates (500 μm island diameter, 1200
μm center-to-center island spacing) that mediate selective cell adhesion (Khetani and Bhatia,
2008). The cells were washed with medium 4-6 hours later to remove unattached cells, leaving
~5,000 attached hepatocytes on 14 collagen-coated islands per well and incubated in HCM. The
This article has not been copyedited and formatted. The final version may differ from this version.DMD Fast Forward. Published on August 19, 2013 as DOI: 10.1124/dmd.113.053397
at ASPE
T Journals on February 3, 2019
dmd.aspetjournals.org
Dow
nloaded from

DMD #53397
7
cell count per well was determined by microscopically counting cells on one island and
multiplying this number by 14 islands in the well. Mouse embryonic fibroblasts (3T3-J2) were
seeded 12–24 h later to create co-cultures. For cell maintenance, culture medium was replaced
every 2 days (64 μL per well).
HepatoPac cultures were maintained in HCM with 10% serum for 7 days prior to
treatment. Culture medium was changed every other day. HepatoPac cultures were washed with
100 µL of serum-free Dulbecco's Modified Eagle Media (DMEM) immediately prior to the
addition of test substances. Incubations with the test compounds were conducted in protein-free
DMEM media specially formulated for HepatoPac cultures (Hepregen Corporation, MA). Test
compounds were added to duplicate wells at a final concentration of 0.1 µM except for
atomoxetine (0.5 µM). At various time points (up to 168 hrs), 192 µL of quench solution was
added to terminate reactions. Quench solution contained acetonitrile/water (60:40, v:v), with
0.1% acetic acid and 0.1 µM of the internal standard (nevirapine or 1-naphthyl--D-
glucuronide). The well surface was scraped with the end of a pipette tip and the mixture of cell
debris and solution was triturated 3 times before depositing into corresponding wells on a
separate 750 µL, 96-well plate. Incubations containing only mouse fibroblast cells served as
controls.
Suspended Hepatocytes
The 20-donor pool of cryopreserved human hepatocytes was purchased from Celsis In
vitro Technologies (Baltimore, MD). The pool consisted of hepatocytes from 11 males and 9
females. The average age of the donors was 48 years and the ethnic constitution was 5 Hispanics
This article has not been copyedited and formatted. The final version may differ from this version.DMD Fast Forward. Published on August 19, 2013 as DOI: 10.1124/dmd.113.053397
at ASPE
T Journals on February 3, 2019
dmd.aspetjournals.org
Dow
nloaded from

DMD #53397
8
and 15 Caucasians. Cryopreserved hepatocytes were reconstituted in warm William’s E media
containing 10% fetal bovine serum, 100 nM dexamethasone, 100 units of penicillin, 0.1 mg
streptomycin and 1% ITS+ premix solution from BD Gentest. Viability of hepatocytes
following reconstitution was 95%. Incubations in suspensions were carried out for 6 hours in
William’s E complete medium containing 100 nM dexamethasone, 100 units of penicillin, 0.1
mg streptomycin and 1% ITS premix solution in an atmosphere of 5% CO2 and air, at 37°C.
Test compounds were incubated with 50,000 hepatocytes in a 50 µl volume. Control incubations
were carried out in culture medium only.
LC/MS Analysis
The amount of parent compound was measured using multiple reaction monitoring
(MRM) on an ABSciex Qtrap 4000 mass spectrometer (Foster City, CA). The mass
spectrometer was coupled to Agilent 1200 serial binary pumps (Santa Clara, CA). The aqueous
and organic mobile phase consisted of 95:5 (v:v) water/acetonitrile and 95:5 (v:v)
acetonitrile/water, respectively. The mobile phase contained 0.1% acetic acid. Samples were
eluted through a Phenomenex Kinetex C18 column (2.6 µm, 100 Å, 50 × 2.1 mm), a Phenomenex
Synergi Polar-RP column (4 μm, 80 Å, 150 x 2.0 mm) or a Waters Atlantis dC18 column (5 μm,
100 Å, 100 x 2.1 mm). The major CYP450 isoforms responsible for the metabolism of test
compounds and the MRM transitions used for detection of each compound are listed in Table 1.
Data analysis and clearance calculations
The percent remaining of the test compound during the incubation was calculated by
dividing the MS peak area ratio at a certain incubation time to that at time zero. The elimination
This article has not been copyedited and formatted. The final version may differ from this version.DMD Fast Forward. Published on August 19, 2013 as DOI: 10.1124/dmd.113.053397
at ASPE
T Journals on February 3, 2019
dmd.aspetjournals.org
Dow
nloaded from
DMD #53397
9
rate constant (kel) was calculated from the absolute value of the slope derived from the natural
logarithm of the percent of drug remaining plotted against time. The depletion half life of the
test compound was calculated as in equation 1.
/.
equ. 1
Statistical significance in turnover of the parent compound was determined by comparing the
slope of the linear regression line from the samples to that of the controls (compound incubated
with medium (suspended hepatocytes) or fibroblasts (HepatoPac)) using an F-Test (Graphpad
Prism version 5.02). The in vitro half-lives were used to calculate the intrinsic clearance (CLint)
using scaling factors (equation 2). The parameters used for scaling are shown in Table 2 (Davies
and Morris, 1993;Obach, et al., 1997).
/
/ .
equ. 2
The hepatic clearance (CLh) was calculated from CLint using the well-stirred model (equation 3).
CLh was calculated for each compound with or without correcting for plasma protein binding (fu)
values that were obtained from the literature (fu =1 when plasma protein binding was not
considered). To compare in vivo CLint values with in vitro CLint values, the in vivo CLint was
calculated by rearranging equation 3 into equation 4.
equ. 3
uh
h
fCLQ
CLQCL
int equ. 4
This article has not been copyedited and formatted. The final version may differ from this version.DMD Fast Forward. Published on August 19, 2013 as DOI: 10.1124/dmd.113.053397
at ASPE
T Journals on February 3, 2019
dmd.aspetjournals.org
Dow
nloaded from

DMD #53397
10
In vivo human non-renal blood clearance values (CLnon-renal) for the 17 studied compounds were
calculated by taking into account the total plasma clearance values (CL), blood to plasma
partition ratio (Rb), and renal excretion of each compound (equation 5), where CL is the total
plasma clearance and Frenal is the fraction of drug excreted by renal elimination. The plasma and
blood clearance values for these compounds are summarized in Table 3. In this manuscript,
CLnon-renal was assumed equal to CLh
1 equ. 5
The overall percentage turnover of alprazolam, tolbutamide and meloxicam in HepatoPac and
suspended hepatocytes was calculated from the in vitro-derived kel value using a one phase
elimination model (equation 6) instead of the percent remaining at the final timepoint. This
strategy ideally uses data from all of the timepoints to interpolate the value.
equ. 6
Monte Carlo Simulation (MCS)
Monte Carlo Simulations (MCS) were conducted to model the relationship between percent
turnover and accuracy of CLint prediction. Graphpad Prism version 5.02 was used to conduct the
simulations. Simulations were performed for 1, 5, 15, 30, 45 and 60% depletion of parent
compound using a one phase elimination model with the plateau constrained to zero. The
percentage depletion values were converted to elimination rate constants using equation 1. The
elimination rate constants were subsequently used for the simulations. Gaussian relative
variability was defined with a standard deviation of 15%. For each turnover value, 1000
simulations were conducted and the resulting half-lives were converted to CLint using equation 2
This article has not been copyedited and formatted. The final version may differ from this version.DMD Fast Forward. Published on August 19, 2013 as DOI: 10.1124/dmd.113.053397
at ASPE
T Journals on February 3, 2019
dmd.aspetjournals.org
Dow
nloaded from

DMD #53397
11
and the parameters from Table 3. The percentage of CLint values from each simulation that were
within 2-fold of the true CLint value were plotted against the percentage of drug turnover. A
hyperbolic equation (equation 7) was fitted to the data in order to obtain the percent turnover
value which was required to predict the corresponding CLint within 2- or 3-fold in 95% of cases.
In equation 7, “A” is the percent of experiments predicting within 2- or 3-fold of the actual CLint,
D is the percent depletion of compound and KD is the percent depletion of the compound when
50% of the experiments predict within 2-or 3-fold of the actual CLint (the values of slope factor h
were 1.07 and 1.04 for within 2-fold and within 3-fold, respectively).
equ. 7
Results
Accuracy of clearance prediction using HepatoPac
The predicted CLh of 10 compounds with low in vivo CLnon-renal in humans (<5
mL/min/kg) and 7 compounds with intermediate in vivo CLnon-renal (>5 and <15 mL/min/kg) are
shown in Table 4. CLh values were calculated based on the parent depletion profiles in
HepatoPac and were compared to the observed in vivo CLnon-renal values for the 17 compounds
(Table 4). The comparison of mean predicted CLh values are plotted against the observed CLnon-
renal values (Figure 1). Using the mean CLh values for all 3 human donors and including
correction for plasma protein binding, HepatoPac cultures predicted within 2-fold of the in vivo
CLnon-renal for 10 out of 17 compounds (59% accuracy; 6 out of 10 compounds with low clearance
(60%) and 4 out of 7 compounds with intermediate clearance (57%)). Using 3-fold as the
hhD
h
DK
DA
100
This article has not been copyedited and formatted. The final version may differ from this version.DMD Fast Forward. Published on August 19, 2013 as DOI: 10.1124/dmd.113.053397
at ASPE
T Journals on February 3, 2019
dmd.aspetjournals.org
Dow
nloaded from

DMD #53397
12
criterion for accuracy of prediction, 13 out of 17 compounds were predicted (76%; 9 out of 10
low clearance compounds (90%) and 4 out of 7 intermediate clearance compounds (57%)).
When plasma protein binding was not included in the well-stirred model, the accuracy of
prediction was much lower. Only 1 out of 17 (6%) compounds were predicted within 2-fold of
in vivo CLnon-renal (0 of 10 compounds with low clearance and 1 of 7 (14%) compounds with
intermediate clearance), and 8 out of 17 (47%) compounds were predicted within 3-fold of in
vivo CLnon-renal (1 of 10 (10%) compounds with low clearance and 7 of 7 (100%) compounds with
intermediate clearance).
The accuracy of the prediction of CLh was similar between donors with only donor RTM
showing higher accuracy at 3-fold (82%) compared to the other two donors at 53% and 65%
(Table 4). None of the compounds showed greater than 10% turnover in fibroblast-only control
plates (data not shown). Representative parent compound depletion graphs for compounds with
varying in vitro CLint values (diazepam, theophylline and atazanavir) are shown in Figure 2
together with the fibroblast-only controls showing no turnover for up to 7 days.
Comparison of metabolic turnover of alprazolam, meloxicam and tolbutamide using HepatoPac
and suspended hepatocytes
Incubations of HepatoPac cultures and suspended hepatocytes were compared for levels
of turnover and clearance prediction. As expected, based on the larger number of hepatocytes
with suspended cultures compared to HepatoPac, suspended hepatocytes generated significantly
greater percentage of turnover (not corrected for cell numbers) for alprazolam and tolbutamide.
However suspended hepatocytes did not show any turnover of meloxicam. Comparing the
elimination rate constants corrected for cell number and using the full incubation times of 168
This article has not been copyedited and formatted. The final version may differ from this version.DMD Fast Forward. Published on August 19, 2013 as DOI: 10.1124/dmd.113.053397
at ASPE
T Journals on February 3, 2019
dmd.aspetjournals.org
Dow
nloaded from

DMD #53397
13
hours for HepatoPac and 6 hours for suspended hepatocytes, HepatoPac was found to provide
1.62- and 2.08-fold greater turnover (based on the average kel from each donor) for alprazolam
and tolbutamide, respectively, in comparison to suspended hepatocytes (Figure 3). These
differences will be donor dependent and a better comparison would be provided by using the
same donor in both systems.
Appropriate scaling parameters were applied to determine intrinsic clearance and the
well-stirred model was used to calculate the in vivo CLh for each compound. After averaging the
values from each donor, HepatoPac predicted alprazolam and tolbutamide CLh to within 2-fold
of the in vivo CLnon-renal. The suspended hepatocyte incubations predicted CLh of alprazolam to
within 2-fold and tolbutamide to within 3-fold of CLnon-renal. Although metabolic turnover of
meloxicam was observed in HepatoPac, CLh was underpredicted by more than 3-fold. Since no
turnover was observed for meloxicam with hepatocyte suspensions, CLh is expected to be under
predicted by greater than 3-fold in suspended hepatocytes (Figure 4).
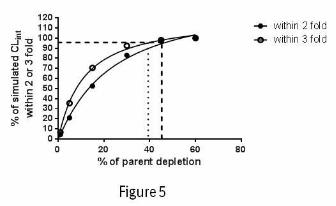
Monte Carlo simulations were conducted with the goal of determining the minimum
clearance value (CLint) that both HepatoPac and suspended hepatocytes could predict. The
simulation assumed bioanalytical variability of 15% of standard deviation (i.e. to be able to
distinguish an extent of turnover from differences due to normal analytical variability). To
achieve a success rate of 95% accurate prediction within 2-fold or 3-fold, the minimum percent
of parent depletion are 46.2% and 39.3%, respectively (Figure 4). Using these values and the
typical incubation conditions for HepatoPac and suspended hepatocytes as described in methods,
the longest half life that a compound can be considered to exhibit this extent of depletion is 191
or 233 h in HepatoPac and 6.80 or 8.33 h in suspended hepatocytes (within 2- and 3-fold of
actual CLint, respectively). These half life values correspond to CLint of 1.96 and 2.44 mL/min/kg
This article has not been copyedited and formatted. The final version may differ from this version.DMD Fast Forward. Published on August 19, 2013 as DOI: 10.1124/dmd.113.053397
at ASPE
T Journals on February 3, 2019
dmd.aspetjournals.org
Dow
nloaded from

DMD #53397
14
in HepatoPac and 4.28 and 5.33 mL/min/kg in suspended hepatocytes (within 3- and 2-fold of
actual CLint, respectively), indicating a 2.18-fold greater sensitivity for HepatoPac.
Discussion
The ability to experimentally demonstrate turnover of slowly metabolized compounds in
in vitro systems is dependent on enzyme concentration and incubation time. The lower limit of
quantitation of CLh can vary depending on the analytical system being used. An alternative
strategy that has been applied is to ‘bin’ the CL prediction into categories of low, medium or
high clearance which circumvents the challenges of accurately assessing the in vitro metabolic
rates for low CL compounds (Wilkinson and Shand, 1975;Lave, et al., 1997). While this strategy
provides broad categories for clearance values, there are some limitations, particularly for
compounds that are slowly metabolized. During lead optimization and identification, for
chemical series exhibiting slow metabolism, it is still necessary to be able to differentiate
compounds based on their predicted clearance. In addition, therapeutic dose predictions, based
on clearance and target therapeutic concentrations, are valuable in aniticipating drug supply and
possible formulation needs for higher dose, less soluble compounds, and in setting starting doses
and dose escalation schemes for first time in man studies.
In hepatocyte and microsomal incubations, CLint can be calculated from the formation of
drug metabolites or disappearance of the drug. In order to calculate CLint from drug metabolite
formation, authentic metabolite standards and well-defined CL pathways are required. These
requirements may not be practical in Drug Discovery where the major enzymes responsible for
drug CL may not have been elucidated or the authentic metabolites are not available to allow
accurate quantitation of enzyme activity. Furthermore, compound-specific limitations, such as
This article has not been copyedited and formatted. The final version may differ from this version.DMD Fast Forward. Published on August 19, 2013 as DOI: 10.1124/dmd.113.053397
at ASPE
T Journals on February 3, 2019
dmd.aspetjournals.org
Dow
nloaded from

DMD #53397
15
solubility, may not permit the determination of the required kinetic parameters, Vmax and Km. In
early preclinical development, measuring the half-life of parent compound depletion is the
easiest approach to determine in vitro metabolic CLint. Additionally, by adopting multiple
substrate concentrations, the requirement that substrate concentrations are well below their Km
values, to be able to accurately determine CLint values, can be assessed (Obach, 2001). Both
strategies can benefit from higher protein or cell concentrations to increase the metabolic rates of
slowly metabolized drugs. However, higher protein concentrations can result in higher non-
specific binding that can affect substrate availability to drug metabolizing enzymes, ultimately
leading to an underestimation of CLh (Obach, 2001). To circumvent the limited incubation time
of microsomes, a relay method has shown promising results in which hepatocytes are replenished
on multiple occasions to extend the overall incubation time (Di, et al., 2012).
The loss of drug metabolizing enzyme function, which occurs following hepatocyte
isolation and plating, reduces compound turnover and questions the ability of conventional long-
term hepatocyte cultures to reflect in vivo metabolic capacity (Cross and Bayliss, 2000;
Rodriguez-Antona, et al., 2002). In the HepatoPac model, the heterotypic and homotypic
interactions between human hepatocytes and mouse fibroblasts have been optimized through
micropatterning in a multi-well plate format. This co-culture has been shown to promote human
hepatocyte morphology and phenotype, resulting in the maintenance of both viability and hepatic
drug metabolizing enzymes for an extended period with daily culture medium replenishment
(Khetani and Bhatia, 2008). In our hands, CYP450 enzyme activity has been maintained
consistently with human HepatoPac cultures, from different donors, typically for 2.5 weeks (in-
house unpublished data). Furthermore, continuous drug incubations for up to 1 week in
HepatoPac, without medium change, have been used to generate more complete, in vivo–like,
This article has not been copyedited and formatted. The final version may differ from this version.DMD Fast Forward. Published on August 19, 2013 as DOI: 10.1124/dmd.113.053397
at ASPE
T Journals on February 3, 2019
dmd.aspetjournals.org
Dow
nloaded from

DMD #53397
16
metabolic profiles in comparison to conventional microsomal and hepatocyte incubations (Wang,
et al., 2010).
Using 3 low clearance drugs, alprazolam, meloxicam and tolbutamide, a direct
comparison of HepatoPac with human hepatocyte suspensions was conducted. From a
theoretical perspective, focusing on the key differences between suspended hepatocytes and
HepatoPac, in a 96 well format, there is a lower cell number per well for HepatoPac (5,000
hepatocytes/well versus 50,000 hepatocytes/well in hepatocyte suspensions). These differences
correspond to a 10-fold lower source of drug metabolizing enzymes for HepatoPac. HepatoPac
offers a longer incubation period (7 days for HepatoPac versus 6 hours for suspended
hepatocytes) which translates to a 28-fold greater metabolic capacity. These comparisons
obviously assume that all other factors between the two models are equivalent. It is important to
note that a direct comparison of suspended hepatocytes and HepatoPac from the same human
donor was not conducted due to the lack of availability of suspended hepatocytes from the same
HepatoPac donors. Inter-donor variability in drug metabolizing enzyme activity could also
contribute to observed differences (see discussion below). Additionally, the role of transporters
in the clearance of drugs is becoming increasingly apparent (Shitara, et al., 2012) and drug
transporter expression and proper localization on hepatic membranes have been shown to differ
between hepatocyte cultures and hepatocyte suspensions. For example, efflux transporters are
internalized in suspensions (Bow, et al., 2008) and uptake transporters have been reported to be
preferentially depleted in sandwich cultured hepatocytes (Tchaparian, et al., 2011).
With the aforementioned caveats and assumptions in mind, considering only the
differences in cell number and the incubation period, HepatoPac is expected to have 2.2-fold
higher metabolic capacity than suspended hepatocytes. Based on Monte Carlo simulations, the
This article has not been copyedited and formatted. The final version may differ from this version.DMD Fast Forward. Published on August 19, 2013 as DOI: 10.1124/dmd.113.053397
at ASPE
T Journals on February 3, 2019
dmd.aspetjournals.org
Dow
nloaded from

DMD #53397
17
lowest scaled CLint that could be accurately determined with HepatoPac is 1.96 mL/min/kg and
4.28 mL/min/kg for suspended hepatocytes. This difference in metabolic activity (2.18-fold)
between HepatoPac and hepatocyte suspensions is roughly in line with the observed 1.62- and
2.08-fold higher turnover observed with alprazolam and tolbutamide using HepatoPac compared
to suspended hepatocytes (based on the average turnover using hepatocytes from 3 donors for
HepatoPac; Figure 3). In addition, meloxicam, which exhibited the slowest rate of depletion in
HepatoPac, showed no perceptible depletion using suspended hepatocytes. Interestingly, the
calculated CLnon-renal of meloxicam (0.089 mL/min/kg) is lower than that of alprazolam (0.61
mL/min/kg) or tolbutamide (0.31 mL/min/kg), but the calculated CLint for meloxicam (15.6
mL/min/kg) was faster than alprazolam (2.21 mL/min/kg) and tolbutamide (9.45 mL/min/kg).
This discrepancy is rooted in the well-stirred model (equation 2), which predicts that the high
plasma protein binding of meloxicam is a major factor determining its CLnon-renal. As such,
accurate CLint should be obtained in in vitro incubations that do not contain plasma proteins.
However, the underprediction of CLint was still observed for meloxicam. The slow turnover of
meloxicam in in vitro hepatocyte cultures such as hepatocyte suspensions or HepatoPac may also
be limited by drug binding in the incubation. Drug binding to incubation components such as
culture ware, fibroblasts or hepatocytes was not evaluated in this study. Clearly, possible
differences in specific CYP450 content between donors could also contribute to these
differences. In comparison, Stringer et al. (2008) noted that perceptible turnover could only be
observed with 3 out of 24 reference drugs (13%) with low to intermediate in vivo CLint (ranging
from 1 to 10 mL/min/kg) including alprazolam, flecainide, glimipiride, tolbutamide and
warfarin.
This article has not been copyedited and formatted. The final version may differ from this version.DMD Fast Forward. Published on August 19, 2013 as DOI: 10.1124/dmd.113.053397
at ASPE
T Journals on February 3, 2019
dmd.aspetjournals.org
Dow
nloaded from

DMD #53397
18
The accuracy of prediction for low clearance compounds (10 drugs evaluated), when
including correction for plasma protein binding, was 90% within 3-fold of in vivo CLnon-renal and
60% within 2-fold. While this is a limited data set, the results are encouraging in that HepatoPac
allows for sufficient turnover of compounds for measurement of intrinsic clearance. In contrast,
the effect of plasma protein binding on the accuracy of CLnon-renal prediction for the
intermediately cleared drugs was less clear as the effects on the accuracy of predictions were less
extreme. A decrease in the percentage of compounds predicting CLnon-renal to within 2-fold (57%
to 14%) was observed when ignoring plasma protein binding (i.e. setting the fraction of drug
unbound to plasma protein to 1). However, when considering accuracy to within 3-fold, there
was a marked improvement in accuracy from 57% to 100%.
The effect of plasma protein binding on the predictivity for intermediate clearance
compounds requires a more extensive analysis, which is in progress. That said, a tendency to
under predict the clearance of intermediate to high clearance compounds when incorporating
plasma protein binding, agrees with previous studies using conventional hepatocyte suspensions.
A recently published PhRMA study based their recommendation to set fu=1 when using
hepatocytes in a study conducted using a majority of compounds (6 out of 9) that were
intermediate to high clearance (Ring, et al., 2011). In a retrospective analysis of in vitro studies
using hepatocytes to predict the in vivo CL of 89 compounds, a bias to more greatly under
predict the intrinsic clearance of rapidly metabolized compounds was described using suspended
hepatocytes (Hallifax, et al., 2010). In addition, the authors found that the accuracy of prediction
was affected by drug binding in the blood (including plasma proteins) such that accuracy
improved when blood binding was low. The trend is conserved in this study as CLh of more
compounds could be predicted to within 2-fold of the CLnon-renal when the percentage drug bound
This article has not been copyedited and formatted. The final version may differ from this version.DMD Fast Forward. Published on August 19, 2013 as DOI: 10.1124/dmd.113.053397
at ASPE
T Journals on February 3, 2019
dmd.aspetjournals.org
Dow
nloaded from

DMD #53397
19
to plasma protein was less than 98% (8 out of 9 compounds or 89%). In contrast, the CLnon-renal
of only 43% (3 out of 7) compounds were predicted within 2-fold if percentage drug bound to
plasma protein exceeded or equaled 98%. Several recent mathematical models that incorporate
factors such as plasma albumin to liver albumin ratio and drug ionization may improve the
ability to predict hepatocyte incubations, including HepatoPac, by reducing average prediction
bias, but may not entirely eliminate it (Berezhkovskiy, 2011;Hallifax and Houston, 2012;Poulin,
et al., 2012).
The variability in calculated clearance values between hepatocytes from different donors
indicates that donor-dependent variation in drug metabolizing activity (Shimada, et al., 1994) is
retained in plated or suspended hepatocytes (Ponsoda, et al., 2001). Differences in predicted
clearance values were observed for the 3 donors in this study which reiterates one of the
challenges with using hepatocytes for prediction of human clearance, that of inter-individual
variability in drug metabolizing enzymes. To mitigate these differences, suspended hepatocytes
can be pooled, with the goal of generating an ‘average’ human, similar to combining human liver
microsomes from different donors. However, differences in plating efficiencies add a
complexity to this process for HepatoPac and other plated hepatocyte cultures. An obvious
contributor to inter-individual variability is the polymorphic expression of CYP450s, for
example with drugs metabolized by CYP2C9, CYP2C19 and/or CYP2D6. In this study, there
was a trend for donor RTM to clear CYP2C9 substrates, diclofenac, glimipiride and meloxicam,
faster than donor 1 or donor 3. Clearance predictions using hepatocytes should characterize
human donors and select, where possible, hepatocyte lots reflecting average enzyme activity for
the major CYP450 isoforms or, when the contributing drug metabolizing enzyme(s) are known,
correct CL for differences in enzyme activity which can potentially be done by RAF (relative
This article has not been copyedited and formatted. The final version may differ from this version.DMD Fast Forward. Published on August 19, 2013 as DOI: 10.1124/dmd.113.053397
at ASPE
T Journals on February 3, 2019
dmd.aspetjournals.org
Dow
nloaded from

DMD #53397
20
activity factors) (Venkatakrishnan, et al., 2000). Drug metabolizing enzyme polymorphisms or
donor-dependent differences in response to culture conditions (Waring, et al., 2003;Chen, et al.,
2011), have not been evaluated in this analysis but are being considered in future studies.
In summary, the extended drug incubation period with HepatoPac allowed for detectable
metabolic turnover of low CL drugs. As a result, a high accuracy of prediction was achieved
with low CL drugs. The ability of HepatoPac to accurately predict intermediate and high CL
drugs is being investigated. The extended functionality of hepatocytes in HepatoPac suggests
that additional important factors such as drug transporters, which can play a crucial role in drug
clearance (Shitara, et al., 2006), may also be appropriately represented in vitro. This is also a
topic of further investigation.
This article has not been copyedited and formatted. The final version may differ from this version.DMD Fast Forward. Published on August 19, 2013 as DOI: 10.1124/dmd.113.053397
at ASPE
T Journals on February 3, 2019
dmd.aspetjournals.org
Dow
nloaded from

DMD #53397
21
Authorship contribution:
Participated in research design: Yu, Chan, Tweedie, Moore, Khetani.
Conducted experiments: Chan, Yu, Moore.
Contributed to new reagents or analytic tools: Chan, Yu, Moore.
Performed data analysis: Chan and Yu.
Wrote or contributed to the writing of the manuscript: Chan, Yu, Tweedie, Khetani.
This article has not been copyedited and formatted. The final version may differ from this version.DMD Fast Forward. Published on August 19, 2013 as DOI: 10.1124/dmd.113.053397
at ASPE
T Journals on February 3, 2019
dmd.aspetjournals.org
Dow
nloaded from

DMD #53397
22
References
Agabeyoglu IT, Bergstrom RF, Gillespie WR, Wagner JG and Kay DR (1979) Plasma protein binding of prednisolone in normal volunteers and arthritic patients. Eur J Clin Pharmacol 16:399-404.
Al-Habet S and Rogers HJ (1980) Pharmacokinetics of intravenous and oral prednisolone. Br J Clin Pharmacol 10:503-508.
al-Habet SM and Rogers HJ (1989) Urinary excretion of prednisolone following intravenous administration in humans. J Clin Pharmacol 29:922-927.
Andersson T, Miners JO, Veronese ME and Birkett DJ (1994) Diazepam metabolism by human liver microsomes is mediated by both S-mephenytoin hydroxylase and CYP3A isoforms. Br J Clin Pharmacol 38:131-137.
Andersson TB, Bredberg E, Ericsson H and Sjoberg H (2004) An evaluation of the in vitro metabolism data for predicting the clearance and drug-drug interaction potential of CYP2C9 substrates. Drug Metab Dispos 32:715-721.
Berezhkovskiy LM (2011) The corrected traditional equations for calculation of hepatic clearance that account for the difference in drug ionization in extracellular and intracellular tissue water and the corresponding corrected PBPK equation. J Pharm Sci 100:1167-1183.
Bow DA, Perry JL, Miller DS, Pritchard JB and Brouwer KL (2008) Localization of P-gp (Abcb1) and Mrp2 (Abcc2) in freshly isolated rat hepatocytes. Drug Metab Dispos 36:198-202.
Brandon EF, Raap CD, Meijerman I, Beijnen JH and Schellens JH (2003) An update on in vitro test methods in human hepatic drug biotransformation research: pros and cons. Toxicol Appl Pharmacol 189:233-246.
Brown HS, Griffin M and Houston JB (2007) Evaluation of cryopreserved human hepatocytes as an alternative in vitro system to microsomes for the prediction of metabolic clearance. Drug Metab Dispos 35:293-301.
Carlile DJ, Hakooz N, Bayliss MK and Houston JB (1999) Microsomal prediction of in vivo clearance of CYP2C9 substrates in humans. Br J Clin Pharmacol 47:625-635.
Carlile DJ, Zomorodi K and Houston JB (1997) Scaling factors to relate drug metabolic clearance in hepatic microsomes, isolated hepatocytes, and the intact liver: studies with induced livers involving diazepam. Drug Metab Dispos 25:903-911.
Chen Q, Zhang T, Wang JF and Wei DQ (2011) Advances in human cytochrome P450 and personalized medicine. Curr Drug Metab 12:436-444.
This article has not been copyedited and formatted. The final version may differ from this version.DMD Fast Forward. Published on August 19, 2013 as DOI: 10.1124/dmd.113.053397
at ASPE
T Journals on February 3, 2019
dmd.aspetjournals.org
Dow
nloaded from

DMD #53397
23
Chesne C, Guyomard C, Guillouzo A, Schmid J, Ludwig E and Sauter T (1998) Metabolism of Meloxicam in human liver involves cytochromes P4502C9 and 3A4. Xenobiotica 28:1-13.
Cross DM and Bayliss MK (2000) A commentary on the use of hepatocytes in drug metabolism studies during drug discovery and development. Drug Metab Rev 32:219-240.
Davies B and Morris T (1993) Physiological parameters in laboratory animals and humans. Pharm Res 10:1093-1095.
Di L, Trapa P, Obach RS, Atkinson K, Bi YA, Wolford AC, Tan B, McDonald TS, Lai Y and Tremaine LM (2012) A novel relay method for determining low-clearance values. Drug Metab Dispos 40:1860-1865.
Ebden P, Banks J, Peel T, Buss DC, Routledge PA and Spragg BP (1986) The disposition of theophylline in blood in chronic obstructive lung disease. Ther Drug Monit 8:424-426.
Elaut G, Papeleu P, Vinken M, Henkens T, Snykers S, Vanhaecke T and Rogiers V (2006) Hepatocytes in suspension. Methods Mol Biol 320:255-263.
Fagerholm U (2007) Prediction of human pharmacokinetics--evaluation of methods for prediction of hepatic metabolic clearance. J Pharm Pharmacol 59:803-828.
Gorski JC, Jones DR, Hamman MA, Wrighton SA and Hall SD (1999) Biotransformation of alprazolam by members of the human cytochrome P4503A subfamily. Xenobiotica 29:931-944.
Hallifax D, Foster JA and Houston JB (2010) Prediction of human metabolic clearance from in vitro systems: retrospective analysis and prospective view. Pharm Res 27:2150-2161.
Hallifax D and Houston JB (2012) Evaluation of hepatic clearance prediction using in vitro data: emphasis on fraction unbound in plasma and drug ionisation using a database of 107 drugs. J Pharm Sci 101:2645-2652.
Heizmann P, Eckert M and Ziegler WH (1983) Pharmacokinetics and bioavailability of midazolam in man. Br J Clin Pharmacol 16 Suppl 1:43S-49S.
Hyland R, Jones BC and Smith DA (2003) Identification of the cytochrome P450 enzymes involved in the N-oxidation of voriconazole. Drug Metab Dispos 31:540-547.
Iwatsubo T, Hirota N, Ooie T, Suzuki H, Shimada N, Chiba K, Ishizaki T, Green CE, Tyson CA and Sugiyama Y (1997) Prediction of in vivo drug metabolism in the human liver from in vitro metabolism data. Pharmacol Ther 73:147-171.
Khetani SR and Bhatia SN (2008) Microscale culture of human liver cells for drug development. Nat Biotechnol 26:120-126.
Kola I and Landis J (2004) Can the pharmaceutical industry reduce attrition rates? Nat Rev Drug Discov 3:711-715.
This article has not been copyedited and formatted. The final version may differ from this version.DMD Fast Forward. Published on August 19, 2013 as DOI: 10.1124/dmd.113.053397
at ASPE
T Journals on February 3, 2019
dmd.aspetjournals.org
Dow
nloaded from

DMD #53397
24
Koysooko R, Ellis EF and Levy G (1974) Relationship between theophylline concentration in plasma and saliva of man. Clin Pharmacol Ther 15:454-460.
Lau YY, Sapidou E, Cui X, White RE and Cheng KC (2002) Development of a novel in vitro model to predict hepatic clearance using fresh, cryopreserved, and sandwich-cultured hepatocytes. Drug Metab Dispos 30:1446-1454.
Lave T, Dupin S, Schmitt C, Valles B, Ubeaud G, Chou RC, Jaeck D and Coassolo P (1997) The use of human hepatocytes to select compounds based on their expected hepatic extraction ratios in humans. Pharm Res 14:152-155.
Maekawa K, Harakawa N, Sugiyama E, Tohkin M, Kim SR, Kaniwa N, Katori N, Hasegawa R, Yasuda K, Kamide K, Miyata T, Saito Y and Sawada J (2009) Substrate-dependent functional alterations of seven CYP2C9 variants found in Japanese subjects. Drug Metab Dispos 37:1895-1903.
Maguire KP, Burrows GD, Norman TR and Scoggins BA (1980) Blood/plasma distribution ratios of psychotropic drugs. Clin Chem 26:1624-1625.
McQuinn RL, Pentikainen PJ, Chang SF and Conard GJ (1988) Pharmacokinetics of flecainide in patients with cirrhosis of the liver. Clin Pharmacol Ther 44:566-572.
Mitenko PA and Ogilvie RI (1973) Pharmacokinetics of intravenous theophylline. Clin Pharmacol Ther 14:509-513.
Ngui JS, Chen Q, Shou M, Wang RW, Stearns RA, Baillie TA and Tang W (2001) In vitro stimulation of warfarin metabolism by quinidine: increases in the formation of 4'- and 10-hydroxywarfarin. Drug Metab Dispos 29:877-886.
Obach RS (1999) Prediction of human clearance of twenty-nine drugs from hepatic microsomal intrinsic clearance data: An examination of in vitro half-life approach and nonspecific binding to microsomes. Drug Metab Dispos 27:1350-1359.
Obach RS (2001) The prediction of human clearance from hepatic microsomal metabolism data. Curr Opin Drug Discov Devel 4:36-44.
Obach RS, Baxter JG, Liston TE, Silber BM, Jones BC, MacIntyre F, Rance DJ and Wastall P (1997) The prediction of human pharmacokinetic parameters from preclinical and in vitro metabolism data. J Pharmacol Exp Ther 283:46-58.
Ogilvie RI (1978) Clinical pharmacokinetics of theophylline. Clin Pharmacokinet 3:267-293.
Paixao P, Gouveia LF and Morais JA (2010) Prediction of the in vitro intrinsic clearance determined in suspensions of human hepatocytes by using artificial neural networks. Eur J Pharm Sci 39:310-321.
Piliero PJ (2004) Atazanavir: A novel once-daily protease inhibitor. Drugs Today (Barc ) 40:901-912.
This article has not been copyedited and formatted. The final version may differ from this version.DMD Fast Forward. Published on August 19, 2013 as DOI: 10.1124/dmd.113.053397
at ASPE
T Journals on February 3, 2019
dmd.aspetjournals.org
Dow
nloaded from

DMD #53397
25
Ponsoda X, Pareja E, Gomez-Lechon MJ, Fabra R, Carrasco E, Trullenque R and Castell JV (2001) Drug biotransformation by human hepatocytes. In vitro/in vivo metabolism by cells from the same donor. J Hepatol 34:19-25.
Poulin P, Kenny JR, Hop CE and Haddad S (2012) In vitro-in vivo extrapolation of clearance: modeling hepatic metabolic clearance of highly bound drugs and comparative assessment with existing calculation methods. J Pharm Sci 101:838-851.
Riley RJ, McGinnity DF and Austin RP (2005) A unified model for predicting human hepatic, metabolic clearance from in vitro intrinsic clearance data in hepatocytes and microsomes. Drug Metab Dispos 33:1304-1311.
Ring BJ, Chien JY, Adkison KK, Jones HM, Rowland M, Jones RD, Yates JW, Ku MS, Gibson CR, He H, Vuppugalla R, Marathe P, Fischer V, Dutta S, Sinha VK, Bjornsson T, Lave T and Poulin P (2011) PhRMA CPCDC initiative on predictive models of human pharmacokinetics, part 3: Comparative assessement of prediction methods of human clearance. J Pharm Sci 100:4090-4110.
Ring BJ, Gillespie JS, Eckstein JA and Wrighton SA (2002) Identification of the human cytochromes P450 responsible for atomoxetine metabolism. Drug Metab Dispos 30:319-323.
Rodriguez-Antona C, Donato MT, Boobis A, Edwards RJ, Watts PS, Castell JV and Gomez-Lechon MJ (2002) Cytochrome P450 expression in human hepatocytes and hepatoma cell lines: molecular mechanisms that determine lower expression in cultured cells. Xenobiotica 32:505-520.
Sanderink GJ, Bournique B, Stevens J, Petry M and Martinet M (1997) Involvement of human CYP1A isoenzymes in the metabolism and drug interactions of riluzole in vitro. J Pharmacol Exp Ther 282:1465-1472.
Sarkar M, Polk RE, Guzelian PS, Hunt C and Karnes HT (1990) In vitro effect of fluoroquinolones on theophylline metabolism in human liver microsomes. Antimicrob Agents Chemother 34:594-599.
Sauer JM, Ponsler GD, Mattiuz EL, Long AJ, Witcher JW, Thomasson HR and Desante KA (2003) Disposition and metabolic fate of atomoxetine hydrochloride: the role of CYP2D6 in human disposition and metabolism. Drug Metab Dispos 31:98-107.
Sauer JM, Ring BJ and Witcher JW (2005) Clinical pharmacokinetics of atomoxetine. Clin Pharmacokinet 44:571-590.
Shimada T, Yamazaki H, Mimura M, Inui Y and Guengerich FP (1994) Interindividual variations in human liver cytochrome P-450 enzymes involved in the oxidation of drugs, carcinogens and toxic chemicals: studies with liver microsomes of 30 Japanese and 30 Caucasians. J Pharmacol Exp Ther 270:414-423.
Shitara Y, Horie T and Sugiyama Y (2006) Transporters as a determinant of drug clearance and tissue distribution. Eur J Pharm Sci 27:425-446.
This article has not been copyedited and formatted. The final version may differ from this version.DMD Fast Forward. Published on August 19, 2013 as DOI: 10.1124/dmd.113.053397
at ASPE
T Journals on February 3, 2019
dmd.aspetjournals.org
Dow
nloaded from

DMD #53397
26
Shitara Y, Maeda K, Ikejiri K, Yoshida K, Horie T and Sugiyama Y (2012) Clinical significance of organic anion transporting polypeptides (OATPs) in drug disposition: their roles in the hepatic clearance and intestinal absorption. Biopharm Drug Dispos.
Smith RB, Kroboth PD, Vanderlugt JT, Phillips JP and Juhl RP (1984) Pharmacokinetics and pharmacodynamics of alprazolam after oral and IV administration. Psychopharmacology (Berl ) 84:452-456.
Stringer R, Nicklin PL and Houston JB (2008) Reliability of human cryopreserved hepatocytes and liver microsomes as in vitro systems to predict metabolic clearance. Xenobiotica 38:1313-1329.
Tchaparian EH, Houghton JS, Uyeda C, Grillo MP and Jin L (2011) Effect of culture time on the basal expression levels of drug transporters in sandwich-cultured primary rat hepatocytes. Drug Metab Dispos 39:2387-2394.
Thiessen JJ, Sellers EM, Denbeigh P and Dolman L (1976) Plasma protein binding of diazepam and tolbutamide in chronic alcoholics. J Clin Pharmacol 16:345-351.
Thummel KE, Shen DD and Isoherranen N (2011) Goodman and Gilman's Pharmacological Basis of Therapeutics. The McGraw Hill Companies, New York.
Venkatakrishnan K, von Moltke LL, Court MH, Harmatz JS, Crespi CL and Greenblatt DJ (2000) Comparison between cytochrome P450 (CYP) content and relative activity approaches to scaling from cDNA-expressed CYPs to human liver microsomes: ratios of accessory proteins as sources of discrepancies between the approaches. Drug Metab Dispos 28:1493-1504.
Wang JS, Backman JT, Wen X, Taavitsainen P, Neuvonen PJ and Kivisto KT (1999a) Fluvoxamine is a more potent inhibitor of lidocaine metabolism than ketoconazole and erythromycin in vitro. Pharmacol Toxicol 85:201-205.
Wang JS, Wen X, Backman JT, Taavitsainen P, Neuvonen PJ and Kivisto KT (1999b) Midazolam alpha-hydroxylation by human liver microsomes in vitro: inhibition by calcium channel blockers, itraconazole and ketoconazole. Pharmacol Toxicol 85:157-161.
Wang WW, Khetani SR, Krzyzewski S, Duignan DB and Obach RS (2010) Assessment of a micropatterned hepatocyte coculture system to generate major human excretory and circulating drug metabolites. Drug Metab Dispos 38:1900-1905.
Waring JF, Ciurlionis R, Jolly RA, Heindel M, Gagne G, Fagerland JA and Ulrich RG (2003) Isolated human hepatocytes in culture display markedly different gene expression patterns depending on attachment status. Toxicol In Vitro 17:693-701.
Wienkers LC and Heath TG (2005) Predicting in vivo drug interactions from in vitro drug discovery data. Nat Rev Drug Discov 4:825-833.
Wilkinson GR and Shand DG (1975) Commentary: a physiological approach to hepatic drug clearance. Clin Pharmacol Ther 18:377-390.
This article has not been copyedited and formatted. The final version may differ from this version.DMD Fast Forward. Published on August 19, 2013 as DOI: 10.1124/dmd.113.053397
at ASPE
T Journals on February 3, 2019
dmd.aspetjournals.org
Dow
nloaded from

DMD #53397
27
Willis JV, Kendall MJ, Flinn RM, Thornhill DP and Welling PG (1979) The pharmacokinetics of diclofenac sodium following intravenous and oral administration. Eur J Clin Pharmacol 16:405-410.
Wilner KD and Gardner MJ (1995) Tenidap sodium does not alter the clearance or plasma protein binding of tolbutamide in healthy male volunteers. Br J Clin Pharmacol 39 Suppl 1:39S-42S.
Yasui-Furukori N, Hidestrand M, Spina E, Facciola G, Scordo MG and Tybring G (2001) Different enantioselective 9-hydroxylation of risperidone by the two human CYP2D6 and CYP3A4 enzymes. Drug Metab Dispos 29:1263-1268.
This article has not been copyedited and formatted. The final version may differ from this version.DMD Fast Forward. Published on August 19, 2013 as DOI: 10.1124/dmd.113.053397
at ASPE
T Journals on February 3, 2019
dmd.aspetjournals.org
Dow
nloaded from

DMD #53397
28
Footnote
S.K. is an equity holder in Hepregen Corporation.
This article has not been copyedited and formatted. The final version may differ from this version.DMD Fast Forward. Published on August 19, 2013 as DOI: 10.1124/dmd.113.053397
at ASPE
T Journals on February 3, 2019
dmd.aspetjournals.org
Dow
nloaded from

DMD #53397
29
Figure Legends
Figure 1: Correlation between in vitro predicted CLh from HepatoPac and observed in vivo CLnon-renal for 17 compounds with low and intermediate clearance. The dashed line represents a perfect correlation. The dotted lines represent boundaries between a 2- fold underprediction and a 2- fold overprediction. The solid line marks the boundary between low and intermediate CLnon-
renal values.
Figure 2: Representative plots of parent compound depletion for (●) theophylline, (▲) diazepam and (■) atazanavir (each point represents the average of two replicates). The corresponding open symbols represent fibroblast only controls (2 replicates per experiment). Figure 3: Comparison of the percent parent compound remaining at the end of the incubation period in HepatoPac versus suspended hepatocyte incubations (alprazolam, meloxicam, tolbutamide). Figure 4: Comparison of the accuracy of prediction of CLnon-renal between HepatoPac and suspended hepatocytes. Figure 5: Universal relationship describing the percentage turnover of parent required to achieve an accurate prediction of CLint. The CLint values from 1000 simulations were obtained using the one phase decay model and a 15% of standard deviation to represent bioanalytical or biological variability. Turnover required to achieve results from 95% of experiments within 2- fold of the actual CLint are represented by a dashed line; within 3 fold is represented by a dotted line.
This article has not been copyedited and formatted. The final version may differ from this version.DMD Fast Forward. Published on August 19, 2013 as DOI: 10.1124/dmd.113.053397
at ASPE
T Journals on February 3, 2019
dmd.aspetjournals.org
Dow
nloaded from

DMD #53397
30
Table 1: MRM transitions and major CYP450 isoforms responsible for metabolism of the 17 test compounds.
Compound MRM
Transition (+/- mode)
CYP450 Isoform HLM Km (M)
References for Km values
Riluzole 235-166(+) CYP1A2 30 (Sanderink, et al., 1997) Theophylline 181-124(+) 4.5 (Sarkar, et al., 1990) Lidocaine 235-86 (+) 1500 (Wang, et al., 1999a) Diclofenac 298-252(+) CYP2C9 22 (Carlile, et al., 1999) Glimepiride 489-364 (-) 0.56 (Maekawa, et al., 2009) Meloxicam 352-184(+) 14 (Chesne, et al., 1998) Tolbutamide 273-155(+) 14 (Carlile, et al., 1999) Warfarin 307-250(-) 0.29 (Ngui, et al., 2001) Voriconazole 350-281(+) CYP2C19 8.1 (Hyland, et al., 2003) Diazepam 285-193(+) 180 (Andersson, et al., 1994) Flecainide 415-301(+) CYP2D6 unknown Not available Risperidone 411-191(+) 0.26 (Yasui-Furukori, et al., 2001) Atomoxetine 256-148(+) 2.2 (Ring, et al., 2002) Alprazolam 309-281(+) CYP3A4 340 (Gorski, et al., 1999) Atazanavir 705-335(+) unknown Not available Midazolam 326-291(+) 7.5 (Wang, et al., 1999b) Prednisolone 361-343(+) unknown Not available
This article has not been copyedited and formatted. The final version may differ from this version.DMD Fast Forward. Published on August 19, 2013 as DOI: 10.1124/dmd.113.053397
at ASPE
T Journals on February 3, 2019
dmd.aspetjournals.org
Dow
nloaded from

DMD #53397
31
Table 2: Scaling parameters to calculate CLint or CLh.
Model HepatoPac Suspended Hepatocytes Maximum Incubation Time (h (min))
168 (10,080) 6 (360)
Hepatocytes per well 5,000 50,000 Incubation volume (µL) 64 50 In vivo [Hepatocyte], (#/g liver) 120,000,000 Liver weight (g) 1,800 Average body weight (kg) 70 Liver blood flow (mL/min/kg) 21
This article has not been copyedited and formatted. The final version may differ from this version.DMD Fast Forward. Published on August 19, 2013 as DOI: 10.1124/dmd.113.053397
at ASPE
T Journals on February 3, 2019
dmd.aspetjournals.org
Dow
nloaded from

DMD #53397
32
Table 3. Human in vivo plasma and blood clearance values.
PK parameters from literature Non-renal clearance
Compound fu Frenal Rb CL
(mL/min/kg)
Plasma Clearance
(CLp, mL/min/kg)
Blood Clearance
(CLb, mL/min/kg)
Alprazolam 0.29a 0.20a 0.78b 0.59c 0.47 0.61 Atazanavir 0.14a 0.07a unknown* 8.74d 8.13 8.13
**Atomoxetine 0.013a 0.01a 0.55e 3.92f 3.88 7.05 Diazepam 0.015g <0.01a 0.71h 0.38a 0.38 0.53 Diclofenac 0.005a <0.01a 0.55b 4.22i 4.22 7.67 Flecainide 0.39a 0.43a 0.89j 9.1k 5.19 5.82
Glimepiride 0.005a <0.005a 0.55j 0.62i 0.62 1.12 Lidocaine 0.3j 0.02j 0.84j 9.2j 9.02 10.7
Meloxicam 0.006j 0.01j 1.22j 0.15j 0.15 0.12 Midazolam 0.02a 0.01a 0.69b 4.6l 4.55 8.59
Riluzole 0.02a <0.01a 1.7j 3.52a 3.48 2.05 Risperidone 0.11a 0.03a 0.67j 3.56a 3.46 5.16 Prednisolone 0.28m 0.17n unknown* 1.73o 1.44 1.44 Theophylline 0.41p 0.1q 0.85r 1.07s 0.96 1.13 Tolbutamide 0.058t <0.01b 0.55b 0.17t 0.2 0.31 Voriconazole 0.42a <0.02a unknown* 3.80a 3.80 3.80
Warfarin 0.01a <0.02a 0.55b 0.045a 0.045 0.081 a(Thummel, et al., 2011),b(Obach, 1999),c(Smith, et al., 1984),d(Piliero, 2004),e(Sauer, et al., 2003),f(Sauer, et al., 2005),g(Thiessen, et al., 1976),h(Maguire, et al., 1980), i(Willis, et al., 1979), j(Paixao, et al., 2010),k(McQuinn, et al., 1988),l (Heizmann, et al., 1983), m(Agabeyoglu, et al., 1979), n(al-Habet and Rogers, 1989), o(Al-Habet and Rogers, 1980), p(Koysooko, et al., 1974), q(Ogilvie, 1978), r(Ebden, et al., 1986), s(Mitenko and Ogilvie, 1973), t(Wilner and Gardner, 1995) *Blood to plasma ratio data was not available and therefore assumed to be 1. **Clearance value representative for extensive metabolizers fu = fraction of drug unbound to plasma protein Frenal = fraction of drug that is excreted renally Rb = blood to plasma partition ratio CLp = plasma clearance CLb = blood clearance
This article has not been copyedited and formatted. The final version may differ from this version.DMD Fast Forward. Published on August 19, 2013 as DOI: 10.1124/dmd.113.053397
at ASPE
T Journals on February 3, 2019
dmd.aspetjournals.org
Dow
nloaded from

DMD #53397
33
Table 4: Summary of CLh predictions for 17 compounds using HepatoPac incubations from 3 donors.
Compound In vivo
CLnon-renal
In vitro predicted CLh from 3 donors (mL/min/kg) RTM 1 3 Mean±SD
fu w/o fu fu w/o fu fu w/o fu fu w/o fu Low Clearance (CLnon-renal <5 mL/min/kg)
Warfarin 0.081 0.042 3.49 0.026 2.29 0.040 3.36 0.036±0.009 3.05±0.66 Meloxicam 0.12 0.049 5.64 0.019 2.70 0.012 1.84 0.027±0.020 3.80±2.34
Tolbutamide 0.31 0.39 5.12 0.23 2.55 0.25 3.60 0.29±0.09 3.76±1.29 Diazepam 0.53 0.21 8.54 0.19 7.98 0.15 6.66 0.18±0.031 7.73±0.97
Alprazolam 0.61 1.43 4.19 0.784 2.47 1.09 3.33 1.10±0.32 3.33±0.86 Glimipiride 1.12 0.590 17.9 0.36 16.3 0.24 14.6 0.40±0.18 16.27±1.65
Theophylline 1.13 1.13 2.48 1.15 2.59 1.48 3.29 1.25±0.20 2.79±0.44 Prednisolone 1.44 1.80 5.39 1.26 4.02 2.00 5.88 1.69±0.38 5.10±0.96
Riluzole 2.05 3.13 18.8 3.09 18.8 0.81 14.1 2.35±1.33 17.23±2.71
Voriconazole 3.80 5.92 9.92 7.99 12.5 7.57 12.03 7.16±1.1 11.48±1.37
% within 2- fold 70 0 50 0 60 0 60 0 % within 3- fold 100 20 70 20 70 10 90 10
Intermediate Clearance (5 mL/min/kg<CLnon-renal <15 mL/min/kg)
Risperidone 5.16 4.25 14.6 5.15 15.7 1.56 8.81 3.65±1.87 13.0±3.7
Flecainide 5.82 1.31 2.99 0.950 2.27 0.621 1.52 0.96±0.34 2.26±0.74
Atomoxetinea 7.05 2.00 18.6 1.49 17.9 0.37 12.1 1.29±0.83 16.2±3.6
Diclofenac 7.67 1.99 20.0 1.16 19.3 1.05 19.2 1.40±0.51 19.6±0.44
Atazanavir 8.13 12.3 19.1 10.4 18.4 8.85 17.6 10.5±1.7 18.3±0.6 Midazolam 8.59 N.D. N.D. 4.52 19.6 4.52 19.3 4.52 19.3 Lidocaine 10.7 7.27 13.3 6.27 12.3 5.10 10.9 6.21±1.09 12.2±1.21
% within 2 fold 50 33 57 14 43 43 57 14 % within 3 fold 50 100 57 86 43 71 57 100
a: The in vivo clearance value reported for extensive metabolizers was used since the incidence of phenotype is highest in the population. N.D. – Not determined; Predicted CLh values for both corrected (CLh,w/fu) and not corrected (CLh, w/o/fu) for plasma protein binding were derived from the average of at least 2 replicates. Categorization of fold prediction was defined as follows for +/- 2 fold, 0.45value2.1; +/- 3 fold, 0.325value3.1.
This article has not been copyedited and formatted. The final version may differ from this version.DMD Fast Forward. Published on August 19, 2013 as DOI: 10.1124/dmd.113.053397
at ASPE
T Journals on February 3, 2019
dmd.aspetjournals.org
Dow
nloaded from

This article has not been copyedited and formatted. The final version may differ from this version.DMD Fast Forward. Published on August 19, 2013 as DOI: 10.1124/dmd.113.053397
at ASPE
T Journals on February 3, 2019
dmd.aspetjournals.org
Dow
nloaded from

This article has not been copyedited and formatted. The final version may differ from this version.DMD Fast Forward. Published on August 19, 2013 as DOI: 10.1124/dmd.113.053397
at ASPE
T Journals on February 3, 2019
dmd.aspetjournals.org
Dow
nloaded from

This article has not been copyedited and formatted. The final version may differ from this version.DMD Fast Forward. Published on August 19, 2013 as DOI: 10.1124/dmd.113.053397
at ASPE
T Journals on February 3, 2019
dmd.aspetjournals.org
Dow
nloaded from

This article has not been copyedited and formatted. The final version may differ from this version.DMD Fast Forward. Published on August 19, 2013 as DOI: 10.1124/dmd.113.053397
at ASPE
T Journals on February 3, 2019
dmd.aspetjournals.org
Dow
nloaded from
This article has not been copyedited and formatted. The final version may differ from this version.DMD Fast Forward. Published on August 19, 2013 as DOI: 10.1124/dmd.113.053397
at ASPE
T Journals on February 3, 2019
dmd.aspetjournals.org
Dow
nloaded from