patient-reported outcomes katherine regan sterba, phd, mph medical university of south carolina...
TRANSCRIPT

Patient-Reported Outcomes
Katherine Regan Sterba, PhD, MPHMedical University of South Carolina
Tuesday February 10, 2015

Objectives To describe the growing movement of
patient-reported outcomes measurement in cancer research.
To highlight the specialized nature of patient-reported outcomes in head and neck cancer.
To use examples of head and neck cancer survivorship research projects to highlight challenges, lessons learned and opportunities in assessing patient-reported outcomes.

PROMs
?PROs?
What is a Patient-
Reported Outcome?
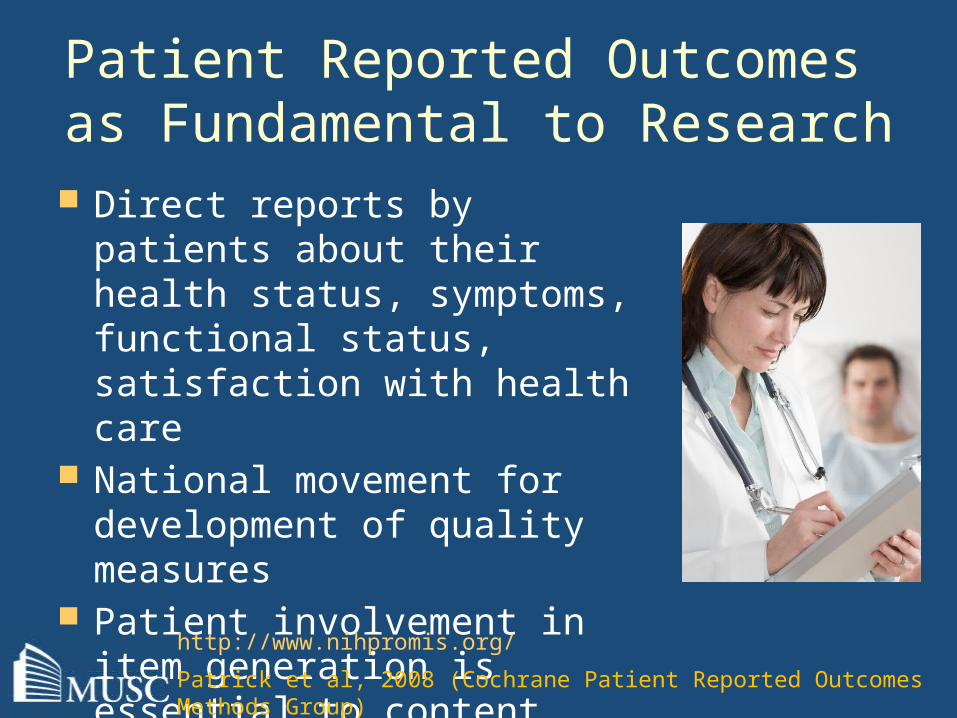
Patient Reported Outcomes as Fundamental to Research
Direct reports by patients about their health status, symptoms, functional status, satisfaction with health care
National movement for development of quality measures
Patient involvement in item generation is essential to content validity
http://www.nihpromis.org/
Patrick et al, 2008 (Cochrane Patient Reported Outcomes Methods Group)

Measurement Challenges
• When a research field uses varied instruments, it is difficult to make conclusions across studies!
• Must consider both the psychometric properties of instruments and burden to respondents.

National Focus on PROs:US Food & Drug Administration
Why use PROs as endpoints in clinical trials:– Some treatment effects known only to the
patient– Formal assessment more reliable than
informal FDA Statement (2006):
– “During the planning of clinical development programs, the FDA encourages sponsors to specify what claims they seek, determine what concepts underlie those claims, and then determine whether an adequate PRO instrument exists to assess and measure those concepts. If it doesn’t, a new PRO instrument can be developed.”
http://www.fda.gov/downloads/Drugs/GuidanceComplianceRegulatoryInformation/Guidances/UCM193282.pdf (2009)

National Focus on PROs: NIH
http://www.nihpromis.org/
Part of the NIH “roadmap for medical research in the 21st century” to accelerate medical research by pooling national resources
Multi-center cooperative group initiative – 2002 Patient-Reported Outcomes Measurement Information System (PROMIS)
Focus on pain, fatigue, emotional distress, physical functioning, and social-role participation
Model methods for measure development

NIH PROMIS Background To push for consensus and shared use
of high-quality instruments in our research
To adequately assess the concept of quality of life, a critical outcome not accounted for in clinical measures
To quantify how people feel and function, assess burden of disease in research and facilitate clinical practice and patient management

NIH PROMIS: 3 Components 1. Develop measure development
standards. 2. Disseminate libraries of PRO
measures of health in multiple languages, for adults and children (with a variety of health statuses).
3. Provide access to PRO measures through the "Assessment Center".
https://www.assessmentcenter.net/https://www.assessmentcenter.net/documents/InstrumentLibrary.pdf

Domain Framework
http://www.nihpromis.org/measures/domainframework1#com

Characterize
challenges facing
head and neck
cancer survivors
Develop intervention
s to promote optimal
health and well-being
Understand factors
that influence outcomes & identify high-risk groups
Intervention Research Continuum: Focus on Head & Neck Cancer
Evaluate, refine &
disseminate
intervention
MEASUREMENT
Clinical/Psychosocial Factors
Implementation/Process Factors
Short/Long-Term
Outcomes
Content Validity
Construct Validity
Predictive Validity

Pinpointing Patient-Reported Outcomes for Study
Carefully define constructs of interest (what you want to measure).
Consider theory. Think about unique patient
characteristics/timeline of illness. Use of qualitative methods is critical
to confirm meaning of items used.
PROMIS.org

Guiding Conceptual Framework
Physical Well-Being
• Physical Functioning• Symptoms• Clinical Factors• Activities of Daily Living
Social Well-Being
• Finances/Work• Support• Communication• Roles• Relationships (health care
providers and family/friends)
Psychological Well-Being
• Emotions• Control / Uncertainty• Hope / Optimism• Expectations
Spiritual Well-Being
• Meaning of Illness• Faith-based Coping
Strategies• Global Guidance• Inner Strength
Quality of Life
*adapted from the 2005 IOM report on Cancer Survivorship (Hewitt, et al)

Special considerations for patient-reported outcomes in head and neck
cancer Symptoms (speech, nutrition, dental,
swallowing) Intensive follow-up care schedule with
multiple specialists Smoking/tobacco use Self image and appearance Relationships and social functioning Employment concerns End of life preparation
Rogers et al., 2007; Murphy et al., 2007; Pusic et al., 2007

Selecting Measures1. Systematic search of published instruments
to examine available tools and evaluate fit 2. Examine properties of existing scales
(validity and reliability)3. Evaluate suitability of existing measures;
contact other researchers if necessary4. If existing instruments do not meet needs,
consider adapting items (must test the properties of the adapted instrument to assure suitability)
5. Lastly, develop a new instrument (this is very resource-intensive!)
DeVellis, 2006

Funded By:• Hollings Cancer Center seed funding, Medical University of South Carolina• American Cancer Society Mentored Research Scholar Grant MRSG-12-
221-01-CPPB
Develop interventions to promote
optimal health and well-being
Understand factors that influence
outcomes & identify high-risk groups
Evaluate, refine &
disseminateintervention
Characterize challenges facing head
and neck cancer
survivors

Study Methods Study Design
– Ongoing pilot study at Hollings Cancer Center
Study Sample– Newly diagnosed head and neck cancer
patients– Nominated primary caregivers
Data Collection– Participants completed interviews within
1 month of definitive diagnosis and follow-up surveys every 6 months for 2 years
– Clinical data collected from medical chart

Measure Selection: Broad Examination of Patient-Caregiver
Experiences Health-related quality of life,
depression, fear of recurrence Social support Illness beliefs Patient symptoms Caregiver burden Satisfaction with treatment decisions Clinical factors (chart review)

Participant CharacteristicsPatients (n=84) Caregivers (n=86)
Age (M, range) 60 years (32-81) M=57 years (29-80)
Gender 73% Male 23% Male
Race 83% Caucasian 83% Caucasian
Education HS or less
Some collegeCollege grad/more
38%28%34%
36%30%34%
Diagnosis Oral cavity
PharynxLarynxOther
39%24%14%23%
n/a
Stage I-III
IV
47%53%
n/a
Smoking StatusNever
FormerCurrent/recent
25%24%51%
46%28%25%
Relationship Type PartnerSibling
ChildParent
51%14%15%8%

Creative Data Collection Strategies May Be Needed for Head & Neck
Cancer
Base-line
6 Months
12 Months
18 Months
24 Months
0
10
20
30
40
50
60
70
80
90
100
PatientCaregiver%
Tele
ph
on
e

Concerns 6 Months Post-Diagnosis (N=65)
> 50% report significant problems with:– Dry mouth, sticky saliva, use of pain killers– Worry about finances and burden on family
> 30% report:– Use of a feeding tube, recent weight loss– Pain/soreness in mouth/jaw, trouble swallowing – Being bothered by appearance– Worry about dying
Daily Behaviors:– 41% report routine drinking (and 37% of these
report binge drinking)– 24% of patients report current daily smoking
(Bjordal et al, 1999 (EORTC); BRFSS 2010)

Patient and Caregiver Unmet Needs at 6 Months (N=65
dyads)
0
10
20
30
40
50
60
70
PatientsCare-givers
% En-dorsing
As UnmetNeed
(CaSUN and CaSPUN instruments, Hodgkinson et al., 2007)

“Is There Anything About Your Treatment You Wish You Had Known
Before?”
I didn't have an understanding
of side effects. I didn't
understand things that they
said were 'normal’…
How uncomfortable
the muscle flap in my mouth would
be…
That I would lose my taste
buds!!
Everything…I am so uncomfortable
and sick…
I wish I was told more about radiation. I was
laying there and thought it would hurt. It didn’t
hurt.

Health Care Organization
Interpersonal
Intrapersonal
Given these complex clinical experiences…how do we ask questions that adequately tap
these experiences?
distinct symptoms, physical/emotional
concerns and health behaviors
unique caregiving tasks in head and neck cancer
multi-specialist care and communication challenges
(Rogers et al., 2007; Pusic et al., 2007; Murphy et al., 2007)

Exploring Causal Attributions in Head and Neck Cancer
Patients and Their Caregivers

Background Individuals use their causal attributions
to find meaning in or gain control over their cancer.
Self-blaming attributions can be maladaptive and especially important in head and neck cancer.
Illness self-blame is associated with worse physical/social functioning in head and neck cancer.
Caregivers’ causal attributions may be important to support provision and coping. (Scharloo et al.,
2010)

Specific Aims
1. To describe and compare causal attributions in head and neck cancer patients and their primary caregivers.
2. To explore relationships between degree of patient blame and psychosocial and support factors in patients and caregivers.

Measurement Challenges: Assessing Causal Beliefs
Illness Perception Questionnaire-Revised:
We are interested in your beliefs about what caused your cancer. Please read the list below and check the boxes to indicate whether you believe each was a cause of your cancer…
--heredity --aging--stress or worry --alcohol drinking--a germ or virus --smoking--diet or eating habits --poor medical care
(Moss-Morris et al., 2002)

Another Way to Assess Causal Beliefs
We asked participants (patients and caregivers) to describe in their own words, up to 3 factors they believed caused the patients’ cancer.
Factors were coded by 2 independent reviewers by type and degree of blame.

Causal Beliefs Reported Expected Responses
– “Smoking” and “Years of drinking” Not-So-Expected Responses
– “Too many pork rinds cutting side of mouth”
– “Siphoning out water from my swimming pool with a garden hose by mouth”
– “Too much singing”– “Family problems with my children”– “Mold and fungus caused me to have
acid reflux erosion”

Causal Attribution CodingType (categorized reported beliefs using
known/hypothesized risk factors and additional categories to capture other reported causes)
Degree of Patient Blame 1 = No Blame (factors external to patient
control)
2 = Partial Blame (at least one factor within patient control and one factor external to patient control)
3 = Full Blame (lifestyle/behavioral/modifiable factors)
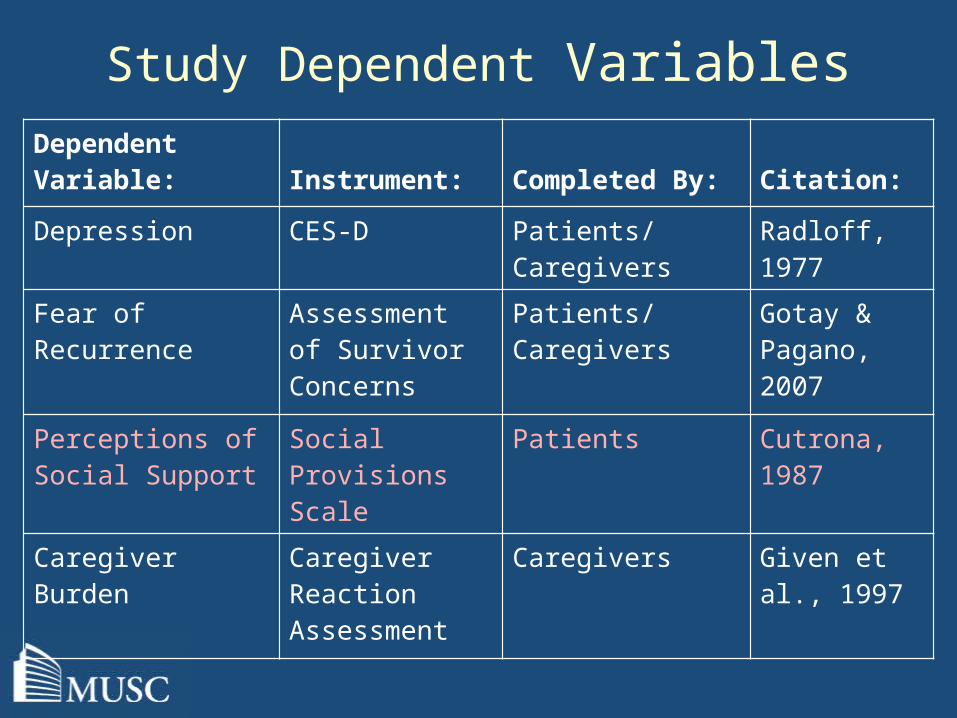
Study Dependent VariablesDependent Variable: Instrument: Completed By: Citation:
Depression CES-D Patients/Caregivers
Radloff, 1977
Fear of Recurrence
Assessment of Survivor Concerns
Patients/Caregivers
Gotay & Pagano, 2007
Perceptions of Social Support
Social Provisions Scale
Patients Cutrona, 1987
Caregiver Burden Caregiver Reaction Assessment
Caregivers Given et al., 1997

Measurement Challenges: Social Support
Cutrona’s Social Provision Scale (1987)– Instrument assessing support in 5 areas:
guidance, attachment, nurturance, reliable alliance, and social integration
– Demonstrated poor functioning in our patient-caregiver dyads Several subscales had Cronbach’s
alphas <0.60 Oh no!! What do we do now? Why did
this happen?

Unique/Specialized Support Behaviors in Head & Neck Cancer
“I love my brother but he is an alcoholic so it is difficult to support him…”
“I use the food processor to break up his food…”
“She helps me financially…” “I care for his wound…” “He helps me a lot and tells me to pray
and read the Bible…”

Data Analysis Descriptive statistics Examined relationships among
causal attributions and psychosocial and support factors using linear regression– Controlled for clinical (cancer site and
stage) and sociodemographic (race, age, gender, relationship type/length variables) factors

Participant CharacteristicsPatients (n=47) Caregivers
(n=43)Age (M, range) 59 years (32-88) M=58 years (29-80)
Gender 77% male 80% femaleRace 82% Caucasian 85% CaucasianEducation
HS or lessSome college
College grad/more
36%31%33%
31%26%43%
Diagnosis Oral cavity
PharynxLarynxOther
34%23%19%23%
n/a
Stage I-IIIIV
47%53%
n/a
Relationship Type 51% Partnered

Patient and Caregiver
Causal Attribution
s
HPV
Radiation
Lack of Preventive Care
Stress
Diet
Genetics
Sun
Cancer History
Industrial Exposures
Unknown
Other
Alcohol
Tobacco
0 10 20 30 40 50 60
Caregiver Patient
Percent Reporting
Number of attributions:M = 1.7 for
patientsM = 1.5 for
caregivers(range 1-3)

Degree of Blame in Causal Attributions for Patients and
Caregivers
05
101520253035404550
Percent
NoBlame
PartialBlame
FullBlame
Patients
Caregivers

Degree of Blame and Patient and Caregiver Psychosocial and Support
Factors
Dependent Variable Model B SE p R2 Model
Fear of Recurrence
Patient .38 .14 .01 .45
Caregiver -.004
.11 .96 .35
Depression Patient 1.48 1.51 .33 .15
Caregiver 1.36 1.21 .27 .09
Patient Perceptions of Support (attachment)
Caregiver -.10 .13 .43 .20
Caregiver Burden Caregiver .52 .24 .04 .39Note: All models controlled for cancer stage, and patient and caregiver depression (except in depression models), age, and gender.

Causal Attribution Concordance in Patient-Caregiver Dyads (N=40)
0
10
20
30
40
50
Causal Belief Concordance inDyads
FullyConcordant
PartiallyConcordant
Discordant
Percent

Conclusions Patients and caregivers had similar beliefs
about head and neck cancer causes:– A wide variety of causes (~12) were
reported. – Tobacco was most commonly cited but only
~half of participants endorsed this cause and other known risk factors were not cited.
Within dyads, ~half of patients and caregivers shared at least one causal belief.
Blaming the patient was associated with higher recurrence fears in patients and higher burden in caregivers.

Study Considerations & Future Directions
This study was exploratory– Cross-sectional study design/small sample
size– Future studies should examine causal
attributions in clinical context and take advantage of more sophisticated dyadic data analysis techniques
Measurement implications – Unique causal attributions in head and neck – Consider developing new instruments to
assess support behaviors in head and neck cancer
– Beneficial to use a mixed methods approach in this exploratory research

Health Behaviors & Quality of Life Study
Funded by: Hollings Cancer Center and Wake Forest University Comprehensive Cancer Center

Background Growing evidence demonstrates that
tobacco use after a head and neck cancer diagnosis is associated with poor outcomes
– decreased survival/increased recurrence risk
– interference with treatment– diminished quality of life
A cancer diagnosis offers a “teachable moment” for smokers
More research needed to design patient-centered smoking cessation interventions
http://www.cancer.gov/cancertopics/pdq/supportivecare/smokingcessationGritz et al., 1993; Duffy et al., 2006; Schnoll et al., 2005

Health Behaviors & Quality of Life Study
Study Aims• To describe smoking status in surgical
head and neck cancer patients.• To examine relationships between
smoking status and sociodemographic factors and symptoms at clinic presentation.
• To characterize motivation, barriers to quitting and intervention preferences in surgical patients who use tobacco.

MethodsStudy Sample• Individuals scheduled for a major
surgery with new or recurrent squamous cell carcinoma of the upper aerodigestive tract (N=104) were recruited at the Hollings and Wake Forest Cancer Centers.
Data Collection• Participants completed questionnaires
before surgery.
• Urine samples were collected the morning of surgery to assess cotinine level.

Measures Health Behaviors
• Smoking status (self report and cotinine level)
• Diet, alcohol use, physical activity
Symptoms• Depressive symptoms (CES-D)
• Head and neck cancer-specific symptoms (EORTC)
Quit intentions, barriers, preferences
Sociodemographic and clinical factors

Measurement Challenges: Health Behaviors
Smoking status and quit attempts– How many quit attempts have you made
since you were diagnosed with cancer? “None, but I can’t smoke because I have a
trach…”
Fruit and vegetable intake– How many servings of fruits and/or
vegetables do you eat in a typical week? “I am on a liquid diet but sometimes have the
fruit flavors…”

Measurement Challenges: Symptoms
During the past week, have you had problems with your teeth?– “I do not have teeth…”
During the past week, have you had problems with your sense of taste? – “Um, not really but I am on a liquid
diet…” During the past week, have you had
problems swallowing solid food?– “I have a feeding tube…”EORTC: Aaronson et al.,
1993 Bjordal et al, 1999

Data Analysis• Participants categorized as:
• Never smokers
• Former smokers (quit >6 months prior)
• Current/recent smokers (quit <6 months prior)
• Differences by smoking status group examined using ANOVA/Fisher’s exact tests.
• Linear regression models used to examine relationships between smoking status and symptoms.
• Descriptive statistics used to characterize intervention preferences.

Participant Characteristics (N = 104)
Age M=59 years (24-84)
Gender 27.9% female
Race 84% Caucasian
EducationHigh school or less
Some college College graduate/more
49%19%32%
Diagnosis Oral cavity
Pharynx Larynx
Other
42%29%23%6%
Diagnosis type 45% recurrent
Stage 23% I-II19% III
49% IVA6% IVB3% IVC

Tobacco Use Characteristics
Characteristic N=28 current smokers
Years Smoked M = 41.5 years (SD = 8.6)
Number of Daily Cigarettes M = 14 (SD = 12)
Use of other tobacco products 19%
Quit Attempt in Past Year (% yes) 46%
Another Smoker in Household (% yes)
64%
Smoking status at diagnosis– Never smokers = 23 (22%)– Former smokers = 39 (38%)– Current/recent smokers = 42 (40%)
Smoking status the morning of surgery– 25.9% positive for tobacco use when assessed by
self-report– 41.1% positive for tobacco use when assessed by
cotinine

Smoking StatusRecent/ Current n=42
Former n=39
Never n=23
p value
*
Age (mean) 57.9 61.8 57.4 .17
Race (% non-White) 26.2 10.3 13.0 .16
Gender (% female) 33.3 20.5 30.4 .46
Education (% <high school) 53.7 51.3 36.4 .42
Marital status (% partnered) 54.8 79.5 73.9 .048
Health insurance (% private) 38.1 64.1 73.9 .02
Adequate finances to meet monthly expenses (% No) 47.5 10.8 21.7 .001
Smoking Status & Sociodemographic Characteristics
* ANOVA or Fisher’s Exact

Symptoms by Smoking Status
Feel
ing
ill
Swal
lowin
g pr
oble
ms
Spee
ch p
robl
ems
Social
con
tact
con
c...
Teet
h pr
oble
ms
Cough
Dry m
outh
Pain
Sticky
sal
iva
0
10
20
30
40
50
60Current/RecentFormerNever
* *
*
*
* p < .05

Adjusted Regression Models: Smoking Status and Symptoms
All models controlled for age, race, education and cancer stage.

Intervention Preferences (N=28)
• 80.8% reported interest in participating in a smoking cessation program
• 32% used NRT during last quit attempt, 18% used counseling
• Smokers had high intentions to quit in next month (70.4% very definitely yes)

Conclusions•Self-report failed to identify a
significant number of smokers the morning of surgery.
•Current/recent smoking head and neck cancer patients: Had the highest symptom burden
compared to former and never smokers at clinic presentation.
Had more financial and social challenges.
•Smokers endorsed multiple barriers to quitting but were interested in in-person cessation interventions.

Study Considerations & Future Directions
Strengths and Limitations• Diverse sample / validated instruments
• Cross-sectional design / limited sample size
Measurement Implications• Assessment of health behaviors &
symptoms must account for functional challenges
• Accurate measurement of tobacco use
• Coding and training issues are critical
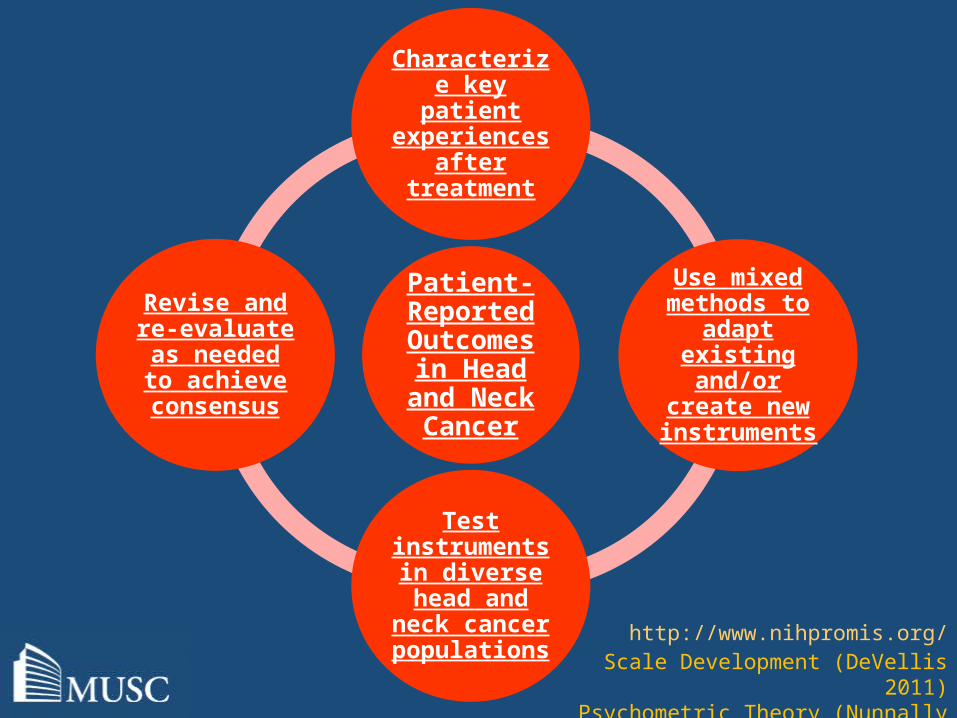
Patient-Reported Outcomes in Head and Neck Cancer
Characterize key
patient experiences
after treatment
Use mixed methods to
adapt existing and/or
create new instruments
Test instruments in diverse head and
neck cancer populations
Revise and re-evaluate as needed to achieve consensus
http://www.nihpromis.org/Scale Development (DeVellis 2011)
Psychometric Theory (Nunnally 1994)

Acknowledgements MUSC Co-Investigators
– Jane Zapka, ScD– Terry Day, MD– Anthony Alberg, PhD, MPH– Matthew Carpenter, PhD– Elizabeth Garrett-Mayer, PhD– Keisuke Shirai, MD– Kent Armeson, MS
Wake Forest Co-Investigators– Kathryn Weaver, PhD– Christopher Sullivan, MD– Jeanne Hatcher, MD– Janet Tooze, PhD
Funding– Hollings Cancer
Center– American Cancer
Society Mentored Research Scholar Grant MRSG-12-221-01-CPPB
Database Support – REDCap SCTR
Biomedical Informatics Services NIH/NCATS UL1TR000062