patient and physician satisfaction surveys as a lever of
TRANSCRIPT

1
Patient and Physician Satisfaction Surveys as a Lever of
Quality Improvement in the Laboratory
Hannah Poczter, AVP and Ed Giugliano, PhD
November 2, 2010
2
North Shore LIJ Health System
• The Nation’s Largest Non‐Profit, Non‐Secular Health Care System ‐ $5. 5 billion Operating Costs
• 16 Hospitals Including 3 Tertiary facilities, Children’s Hospital, 2 Long Term Care and Research Institute
• Long Island’s Largest Employer ‐ 45,000 Employees
• More than 8,000 Physicians

3
4
2010 System Laboratories
• Central “Core” Laboratory
• 12 Integrated Hospital Based Labs
• $260 Million Annual Operating Budget
• 1400 FTEs/ 50 Pathologists Total
• 17 Million Billable Tests
• 180,000 Surgical Specimens
• 20 Patient Service Centers

5
CoreLab
Huntington
Forest Hills
Franklin
Glen Cove
Southside
Syosset
Plainview
Manhasset
Lenox Hill
LIJ
Staten Island
Physician’sOffices
NursingHomes
Clinical TrialsBARC
Non-SystemHospital
ReferenceTesting
Outreach
Hospital Lab RRL
Reference Testing
Consolidated Laboratory Network NS-LIJ HS
6
NS‐LIJ Consolidated Laboratory Network
• Strategically Located 70,000 sqft Core Laboratory Utilizing Total Laboratory Automation (Roche) and 30,000 sqft off‐site
• Rapid Response Laboratories (RRL) in Each Hospital
• Standardized LIS ( Cerner )
• Standardized Laboratory Instrumentation
• Standardized Policy and Procedures

7
Core Laboratory
8
Core Laboratory Scope of Services
• All routine Hospital work– 50% Total Volume
• Large Outreach program• Clinical Trials• Highly automated• Specialized Testing
– Microbiology, Virology, Molecular, Special Coagulation
• Logistics– 25,000 specimen pick‐ups/month
• Phlebotomy– 2,000 patient draws/day

9
Core Lab Business Lines
Business Line $$ Volume (billables)
Hospital $24 M 2.4 M
Reference $ 5 M 120 K
Physician Office $60 M 4.2M
Nursing Home $ 3 M 300 K
Clinical Trials $ 2 M 200 K
TOTAL 2010 $94 M 7.2M
10
NSLIJHS Laboratories Quality Goals
• Quality Goals– Create a culture of patient and employee safety
– Create a culture of exceptional services levels
– Improve physician and patient satisfaction with laboratory services
• Patient First, Safety Always!– This is our Mantra

11
Surveys Used by the NSLIJHS Labs
• Patient Satisfaction Survey• Physician Satisfaction Survey• Employee Satisfaction Survey
• Our presentation will focus on– Patient Satisfaction Surveys– Physician Satisfaction Surveys– “Home Brew” versus independent outside firm
12
Patient and Physician Satisfaction SurveysKey Objectives
• Ongoing review of Patient and Physician Satisfaction as a tool for improving processes and quality
• Utilization of the “Voice of the Customer” in building a loyal customer base
• Developing partnerships instrumental in enhancing the laboratory’s reputation and assuring future growth
• Deployment of a rapid response to maximize the value of services rendered
• Extract long term trends in clients’ perceptions of quality

Patient SatisfactionSurvey
14
Patient Service Center Growth
• Currently, there are 13 sites in NYC and Long Island
• And also 7 PSCs in various Faculty Practices throughout the Health System
• The number of Outpatient PSCs has grown significantly since the inception of the Core Laboratory in 1998
• Based on the NSLIJHS Laboratories Strategic Plan

15
PSC Patient Satisfaction Survey
16
The Survey Process
• Began surveying our patients 3 years ago
• Three Survey Options Given
• Survey Announcement Conspicuously Posted
• Complimentary NSLIJHS Pen!
• Locked Survey Collection Box
• Couriers pick up the surveys along with specimens

17
PSC Survey
WELCOME TO NORTH SHORE-LIJ HEALTH SYSTEM
LABORATORIES
WHERE WE VALUE YOUR OPINION!
PLEASE COMPLETE OUR PATIENT SERVICE CENTER AND FREE PEN.
THANK YOU
FOR YOUR CONTINUED SUPPORT!
COMPLIMENTARY PEN
18
The Survey Process Continued
• Review of Survey Outcomes Weekly by Phlebotomy Management
• Negative Scores and/or Comments Immediately Addressed– Calls made to patient when contact info present
– PSC contacted with negative information– Appropriate CAPA measures taken across all PSCs

19
Phlebotomy Metrics
• As the NSLIJHS is a Six Sigma organization our mission critical processes are oftentimes driven by metrics– Quality Metric
• “Likelihood to Recommend” our service to a friend or relative.
– Performance Metric• “Waiting Time” greater than 10 minutes.
20
PSC Patient Satisfaction SurveyLikelihood to Recommend
Jan - June 2010
98.6%
99.8% 100.0% 100.0%
98.2%
95.5%95.0%
100.0% 100.0% 100.0% 100.0% 100.0% 100.0%
99.1%
92%93%94%95%96%97%98%99%
100%
2008Ave
2009Ave
10N 2800 BSR BPG BSD GLC GRN FH 1991 GAC SMT 2010YTD
PSC Location
Perc
ent
Threshold
Annual
Stretch

21
PSC Patient Satisfaction Survey
Average Percent Waiting Time > 10 min
26.3
6.7 5.9
14.3
28.6
14.3
5.62.9 3.1
05
101520253035
2008Ave
2009Ave
Jan Feb Mar Apr May Jun YTD2010
Month
Perc
ent
> 10
min
ThresholdandAnnual = 7St ret ch= 6
22
Issues Identified
• Long Waiting Times
• Dingy Dirty Spaces
• Patient Confidentiality Issues
• Patients Boredom
• Difficulty Locating PSC
• Availability of Parking

23
Performance Improvements
• Decreased Waiting Times• Spruced Up PSCs and Redesigned for Privacy• Increased HIPPA Compliance by Changing Sign‐In Sheets with Removable Labels
• Installed Flat Screen TVs for Patients• Relocated PSC to More Accessible Location• More Conspicuous Signage• Future Improvements
– Adverse weather notifications– Automated phone system
24
Other PSC PI Programs
• Secret Shopper– Actual Patient Requiring Testing– Friend and Family Feedback
• Established Adopt‐A‐PSC Program– Monthly PSC Rounding– Laboratory Management Participation
• Developed Customer Service Training Course– Response to Courtesy of Phlebotomist Question– Required Training by All New Hires– Evolved to Exceptional Customer Service Training

25
Challenges
• Poor Response Rate– Currently only approx 5% of patients respond– 99% of Surveys Returned Without Comments– Goal is 10% of patients– Consider scripting and active staff interaction to encourage more responses
• Survey Fatigue– Surveys will be issued to new patients and random patients
• Staff Compliance– Creating Incentives– Publicly Recognizing Employee Efforts
Physician SatisfactionSurvey
27
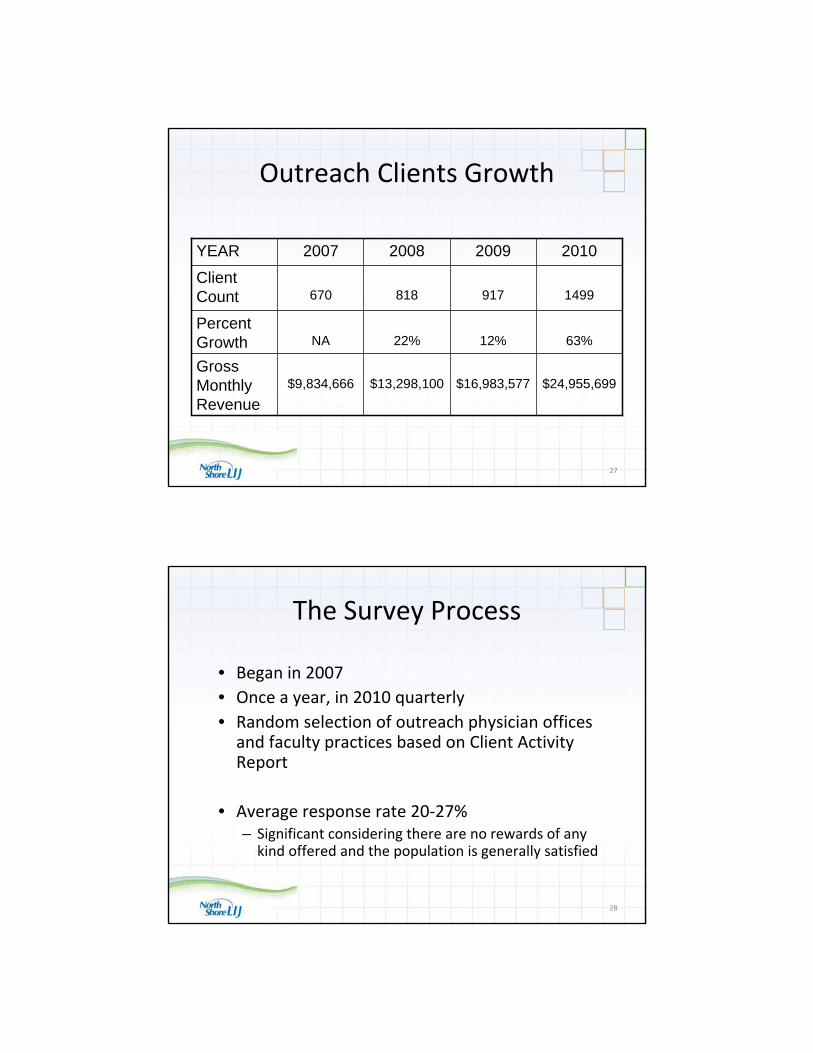
Outreach Clients Growth
$24,955,699$16,983,577$13,298,100$9,834,666Gross Monthly Revenue
63%12%22%NAPercent Growth
1499917818670Client Count
2010200920082007YEAR
28
The Survey Process
• Began in 2007 • Once a year, in 2010 quarterly • Random selection of outreach physician offices and faculty practices based on Client Activity Report
• Average response rate 20‐27%– Significant considering there are no rewards of any kind offered and the population is generally satisfied

29
The Survey Process Continued
• All responses are reviewed by the Assistant Vice President
• Below average and/or negative comments ‐ immediately distributed to Sales Representatives for follow up
• All issues are analyzed in a cause effect fashion
• All complaints are resolved and corrective and/or preventive actions (CAPA) are documented electronically
• Summary of the survey outcomes is presented at various forums:– Quality– Operations – Leadership
30
Physician Satisfaction Metrics
• As the NSLIJHS is a Six Sigma organization our mission critical processes are oftentimes driven by metrics– 2010 Business Unit Physician Survey Metric
• Would You Recommend Our Services to Your Colleagues?
• 2010 Targets– Threshold = 95.8%– Annual Goal = 96.2%– Stretch Goal = 97.0%

31
Likelihood To Recommend
Physician Satisfaction Survey Results
90.2%
89.0%
95.8%
97.3%96.6%
88.0%
89.0%
90.0%
91.0%
92.0%
93.0%94.0%
95.0%
96.0%
97.0%
98.0%
2007 2008 2009 Q1 2010 Q2 2010
Year
% L
ikel
ihoo
d to
Rec
omm
end
Threshold-95.8%Annual - 96.2%
Stretch - 97.0%
32
Physician Satisfaction Survey
Physician Customer Satisfaction Survey of Clinical Laboratory Services - 2010
North Shore-LIJ Laboratories is participating in a quality improvement study concerning physician satisfaction. Please take a few moments to complete this survey so that we can evaluate your opinion and identify areas for improving services to you and your patients. Thank you for your cooperation. Your opinion is greatly appreciated.
Please mail or fax completed survey to: Hannah Poczter
Assistant Vice President Laboratories Fax: 516-719-1062
Please rate our services: Poor Below Average Above Excellent Not Average Average Applicable 1. Quality/ Accuracy of Results 1 2 3 4 5 n/a 2. STAT Test Turnaround Time 1 2 3 4 5 n/a 3. Laboratory Reports 1 2 3 4 5 n/a Timely delivery and readability 4. Anatomic Pathology and Cytology Results 1 2 3 4 5 n/a Quality and timeliness 5. Medical and Scientific Support 1 2 3 4 5 n/a 6. Customer Service: Promptness and knowledge 1 2 3 4 5 n/a 7. Courier Services: 1 2 3 4 5 n/a Timely specimen pick-up 8. Billing: Patient Sensitive and Responsive 1 2 3 4 5 n/a 9. Adequacy of Insurance Participation 1 2 3 4 5 n/a 10. Computer Services: 1 2 3 4 5 n/a Product and Responsiveness
Of the services listed above, rank the top 4 most important to you. Would You Recommend Our Services to Your Colleagues? Yes No
How can we help you to provide better patient care? ______________________________________________________________________________ ______________________________________________________________________________ ______________________________________________________________________________ ______________________________________________________________________________ ______________________________________________________________________________ ______________________________________________________________________________ Please provide suggestions for improvements: ______________________________________________________________________________ ______________________________________________________________________________ ______________________________________________________________________________ ______________________________________________________________________________ ______________________________________________________________________________ ______________________________________________________________________________
Form completed by: Physician’s Assistant Office Staff Physician
I would like to have a Lab Representative call me: Name ____________ ____________________
Phone ____________ ____________________
For more information, call 516-719-1100
or visit us online at www.northshorelij.com/labs.
33
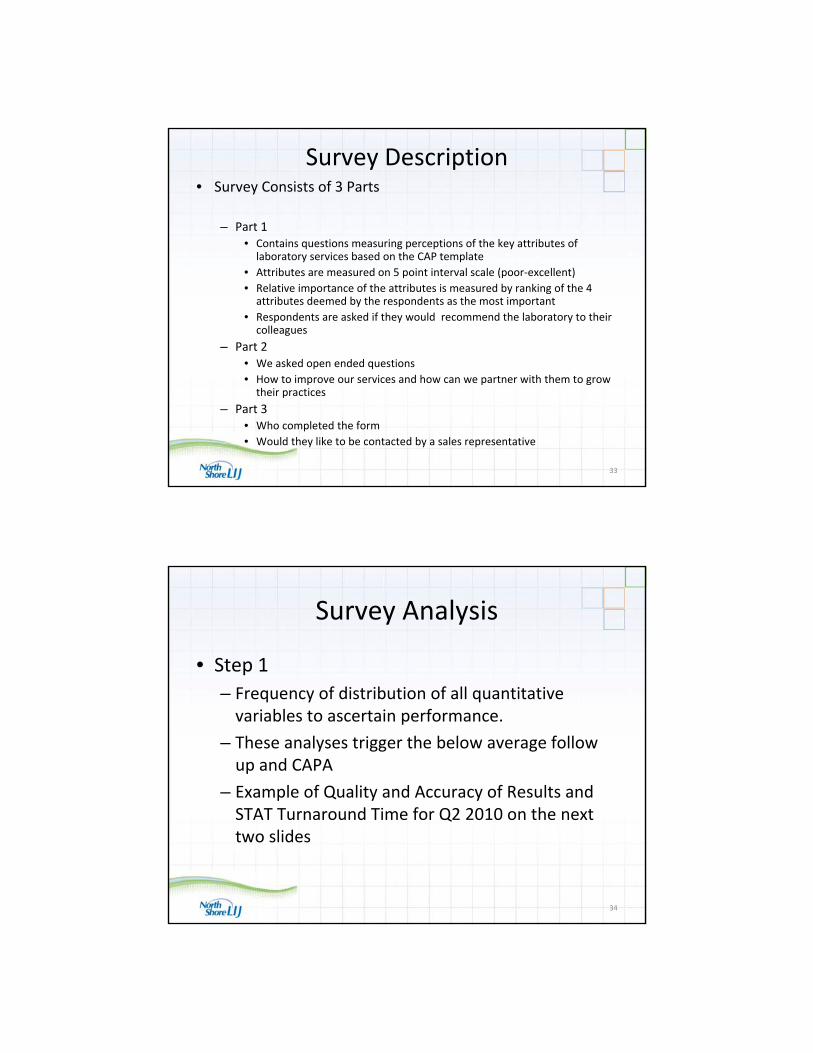
Survey Description• Survey Consists of 3 Parts
– Part 1• Contains questions measuring perceptions of the key attributes of laboratory services based on the CAP template
• Attributes are measured on 5 point interval scale (poor‐excellent)• Relative importance of the attributes is measured by ranking of the 4 attributes deemed by the respondents as the most important
• Respondents are asked if they would recommend the laboratory to their colleagues
– Part 2• We asked open ended questions• How to improve our services and how can we partner with them to grow their practices
– Part 3• Who completed the form• Would they like to be contacted by a sales representative
34
Survey Analysis
• Step 1 – Frequency of distribution of all quantitative variables to ascertain performance.
– These analyses trigger the below average follow up and CAPA
– Example of Quality and Accuracy of Results and STAT Turnaround Time for Q2 2010 on the next two slides

35
36

37
Survey Analysis
• Step 2– Calculate the percent in “top two boxes”, that is, groupings of “Good and Excellent” categories of each attribute
• Above 80% ‐ good to excellent
• Between 70%‐ 80% ‐ warning; attribute needs improvement
• Below 70% ‐ it’s a red light for immediate action plan for improvements
38
Q1 vs. Q2 – Evaluation of AttributesAnd Recommendation to Colleagues
Great96.9Would you recommend us97.3 Great
Warning76.7Computer Services68.8 BAD
Warning77.4Adequacy of Insurance Participation76.3 Warning
Warning78.3Billing: Patient Sensitive/Responsive71.9 Warning
Good83.3Courier Services92.5 Great
Warning75.0Customer Service67.5 BAD
Warning76.7Consultative and Technical Support75.1 Warning
Warning70.4Anatomic Pathology Services75.1 Warning
Warning71.9Readability of Laboratory Reports76.9 Warning
Warning75.0STAT Test Turnaround Time84.6 Good
Great90.3Quality/Accuracy of results89.7 Great
Signal
% Good or ExcellentQ2Q1 Attributes Q2
% Good or ExcellentQ1

39
Survey Analysis
• Step 3– Contrast importance (% ranking) and performance on key attributes to make sure that are no “red lights” on important attributes
– Example on a next slide
40
71.9(needs Improvement)58.8Readability
of Laboratory Reports
75.0(Needs Improvement)49.6STAT Turnaround Time
90.396.2Quality and Accuracyof Results
Percent Judgingas Good or Excellent
Importance(% Ranking in Top Three)Attribute
Contrasting Importanceand Performance on Key Attributes

41
Quality Improvement Action Plans
• Customer Service – Hired technologists to triage technical questions– Additional staff to reduce the telephone wait time and
abandoned calls– Focus on customer service representative phone etiquette– Mini Lean project for prompt delivery of supplies to clients
• call to delivery in 24hrs
• Computer Services – Dedicated LIS Team to outreach clients issues – Hired an LIS Help Desk manager to lead a team for immediate
triage of all incoming calls– New web‐based computer product for physician offices
42
Quality Improvement Action Plans
• STAT Turnaround Time – 3hr TAT!
– Mini Lean to improve process• STAT racks on each bench
• Client Service Representative monitors “real time” TAT• Upon delivery, accessioner will scan STAT specimens into the department (TBD)
– Staff engagement• Patient Safety Rounds
• Posted departmental metrics

43
Quality Improvement Action Plans
• Anatomic Pathology– Set up a Division of Anatomic Pathology and Cytopathology– Consolidated all Anatomic Pathology Services
• 40 pathologists under “one roof”.
– Histology Laboratory under construction in the Central Laboratory
• Courier Services– More routes created with additional drivers– Additional cars purchased– A new courier “hub” for Manhattan offices– Departmental re‐engineering in progress
44
Issues with Physician Satisfaction Survey• Survey fatigue
– Avoid approaching the same doctor’s office with a high frequency
• Physician Client Base has been divided into 4 heterogeneous clusters
• Mailings are quarterly
• Identification issue– Coding respondents for intervention– Cross checking the level of satisfaction with the complaints
documented in Frontline – In Progress– Statistical analysis of satisfaction across groups based on
specialty, size, type of specimens, etc. – Future
• Response rate– Call back non‐respondents?
45
Employee Motivation: Survey Results
• Staff Acknowledged by Respondents on Surveys– Instant Rewards– Nominate for Employee of the Month– Nominated for President’s Award– Dinner with the VP
• Establishing Pleasant and Clean PSC Working Environments• Other Motivating Initiatives
– Post Survey Outcomes in the Laboratory and PSCs– Pay for Performance for Management– Acknowledgement in the Lab Newsletter
• Future
46
Administrative Kudos
• What We Do Well– Highly values early warning and recovery system
– Uses the high level of satisfaction achieved as a promotional tool to attract new clients
– Appreciates the motivational aspect of employee engagement and recognition in the survey process

47
Administration Critique
• What We Can Do Better– Streamline the survey processes
– Improve the response rate in the Patient Service Centers
– Improve Physician Satisfaction Scores
– Expand the Surveys to Include Nursing Homes, Home Draw Clients and Health Fair Participants
– Look for Trends Across Surveys• Including Comments
48
Building a House Of Quality• Patient and Physician Surveys are Essential
• Voice of the Customer Determines Key Attributes and Relative Importance of Laboratory Services
• Benchmark Against Past Performance and Industry Standards
• Balancing Statistical Sample Size with Available Marketing Representatives to Achieve Timely Resolution of Issues
• Consider and Independent Outside Firm in Addition to Our “Home Brew” Surveys

49
Ensuring Patient and Physician SatisfactionAn uphill battle!!!
THANK YOU!