pathways to sustainability - washington · sustainable pathways project report ... it uses existing...
TRANSCRIPT

Pathways to Sustainability A Comprehensive Strategic Planning Model for Achieving Environmental Sustainability Developed at the Washington State Department of Ecology for Use in Public and Private Organizations
Tools for Green Planning
Publication No. 02-01-008 (Second Edition: Revised May, 2003)

A Comprehensive Strategic Planning Model for Achieving Environmental Sustainability Developed at the Washington State Department of Ecology for Use in Public and Private Organizations
Sustainable Pathways Project Report Second Edition Publication No. 02-01-008 (Revised May, 2003) Washington State Department of Ecology Lacey, Washington Version Date: May 2, 2003
Project manager: John Erickson, Department of Ecology
Consulting team: Larry Chalfan, Zero Waste Alliance
Logan Cravens, SERA Architects PC Christopher Juniper, Rocky Mountain Institute
Consulting team leader: Jeff Morris, Sound Resource Management Joshua Skov, Good Company
If you require this publication in an alternate format, please contact John Erickson at 360- 407-7042, or TTY (for the speech or hearing impaired) 711 or 800-833-6388.
Pathways to
Sustainability:

Pathways to Sustainability i Washington State Department of Ecology
Contents Acknowledgements ................................................................................................................... ii Introduction ................................................................................................................................. 1 How To Find What You Want In This Document ............................................................... 3 I. Assessing Ecology's Impacts ............................................................................................. 5
Introduction and Overview of Methodologies............................................................................ 5 Consistency and Differences in Impact Measurements .............................................................. 9 Discussion of Weighting Schemes............................................................................................ 11
II. Selecting a Sustainability Lens ....................................................................................... 16
Overview................................................................................................................................... 16 Preliminary Analysis................................................................................................................. 16 Overview of Selected Frameworks........................................................................................... 17
III. Sustainability Goals and Backcasting .......................................................................... 19
Functional Pathway: Information and Communications ......................................................... 20 Functional Pathway: Mobility.................................................................................................. 25 Functional Pathway: Facility Operations................................................................................. 30 Functional Pathway: Site & Landscape ................................................................................... 39 Functional Pathway: Food ....................................................................................................... 44
IV. Implementation Preview and Payback Analysis Tools............................................ 49
Model 1 – Payback Analysis for Fuel-Efficient or Alternatively-Powered Vehicles............... 50 Model 2 – Payback Analysis for Flat Panel Computer Monitors ............................................. 51 Model 3 – Payback Analysis for On Site Solar Panels............................................................. 52
Appendix A. Life Cycle Thinking, Major Impacts, and Setting Priorities ................................... 54 Appendix B. Sets of Principles and Ranking of Frameworks ...................................................... 63
Ranking Process........................................................................................................................ 77 Results of Ranking Process....................................................................................................... 77 Summary ................................................................................................................................... 79 Framework Analysis Decision Support Matrix Summary........................................................ 80
Appendix C. Goals-setting, Backcasting, and Goal Matrices....................................................... 81 Goal-setting and Backcasting Process ...................................................................................... 81 Goal Matrices for Natural Resource Impacts and Functional Pathways .................................. 82
Appendix D. User Data Entry Spreadsheet.................................................................................. 88 Vehicle Payback Model – User Inputs...................................................................................... 89 Vehicle Payback Model – Money Payback Results ................................................................. 90 Vehicle Payback Model – Financial and Environmental Payback ........................................... 91
Appendix E. Consultant and Organization Profiles...................................................................... 92

Pathways to Sustainability ii Washington State Department of Ecology
Acknowledgements Sustainability is by definition a successful adaptation. Since the Brundtland Commission Report in 1987, the principle of sustainability has become increasingly well defined and understood. For example, the “Ecological Footprint” (Mathis Wackernagel et al) has come into widespread use in the past few years as an easy-to-understand measure of the un-sustainability of an individual’s current levels of consumption. Understanding how to get to sustainability has been a tougher proposition. The work by Karl-Henrik Robèrt and others on The Natural Step has become a leading sustainability framework for setting specific sustainability goals. It also suggests a “backcasting” methodology for planning the transition to sustainability. Some of the theoretical work and practical examples used in The Natural Step and in Natural Capitalism – Creating The Next Industrial Revolution (1999, Paul Hawken, Amory Lovins, Hunter Lovins) show that future costs can be avoided by anticipating and moving away from increasingly expensive, natural capital-dependent technologies and practices toward more sustainable alternatives. In theory, changing to more sustainable technologies and practices can actually save money: the cost of making a change toward sustainability can be more than offset by subsequent reductions in operating costs and other costs. As we investigated different “green planning” efforts aimed at increasing sustainability, we found many examples of cost reduction coupled with reductions in environmental impact. However, we did not find the kind of easy-to-understand, highly adaptable comprehensive planning model we were looking for. We wanted a model that would:
• Use the clear and compelling Natural Step framework as a conceptual guide to the process;
• Use straightforward, science-based, proven analytical tools to quantify environmental impacts from a sustainability perspective;
• Model how to group impacts for planning purposes, and model how sustainability goals can be set;
• Provide a guide to the “back-casting” process for planning changes in technology and practice;
• Help illustrate the results, so we could clearly visualize our pathways to sustainability;
• Show how to identify and calculate major cost-avoidance and payback opportunities as inherent incentives to change.
Having failed to find such an integrated model, we have developed one. A group of outstanding environmental consultants recognized and responded to this challenge. In order to get a finished product, a number of perplexing issues had to be resolved, without the benefit of precedent. This group met those challenges diligently and in good spirit. Many hours on this project, especially

Pathways to Sustainability iii Washington State Department of Ecology
those spent thinking through some of the tough questions, did not show up on the billing to Ecology. This second edition of Pathways to Sustainability incorporates food services and landscape impact pathways, in addition to the transportation, facility, and information and communication pathways in the first edition. We have also expanded the section explaining the life cycle analysis techniques we used. The Department of Ecology is the test ground for this project, as we move toward our own sustainability. By drawing on the wealth of experience and insight in environmental and organizational change here at Ecology, we have begun to prove this model, and to see how it can best be refined. In this process, we have seen the importance of re-engaging the visioning process used in the model, to develop a real shared vision. In this way we are transforming the model into our own living plan. We have already discovered, for example, that it is much more productive to work with one pathway at a time, especially when introducing Pathways to staff. As time and funding allow, we will undoubtedly refine some of the specifics presented in this report, and update the payback estimation tools. Since the first edition, for example, the LEED rating system for facility design and re-design has become a workable standard. In designing this model, it was our intention to make it adaptable to other public agencies, households, and different kinds of businesses. It is our explicit hope that some of our friends and partners on the funding side of this equation can help support these adaptations. We would also like to identify a clearinghouse for some of this technical information. As others use this model, we would like you to contribute to a shared pool of information about specific technologies and practices. Knowing what innovative technologies you intend to employ, and when, helps the private sector deliver. Two of the great potential benefits of this model for the business community (and others) are the long planning horizon and the ability to incorporate updates. This is a fairly comprehensive framework. Once it is established, we can each add detail where we need it, without losing the benefits of the overall framework. This project owes its start to two excellent examples of innovation in government. The initial funding for this project has been provided by the Savings Incentive Program developed by the State of Washington. Through this program, a portion of unspent funds – savings – can be set aside at the end of an appropriation cycle to help develop future cost-saving innovations. It is fitting that the money for this project has come from smart decisions and good management during the prior biennium. The second example of excellent innovation is the Sustainability Team here at the Department of Ecology. This cross-program team is an incubator within our agency for clear thinking about sustainability. This project was sponsored by the Sustainability Team, and is in many ways a result of that team effort. (Check out our web site at www.ecy.wa.gov/sustainability.)
John Erickson ([email protected]) Olympia, Washington May 2, 2003

Pathways to Sustainability 1 Washington State Department of Ecology
Introduction This project has created and demonstrated the use of a framework for understanding and implementing an organization’s sustainability vision and strategy. This study was based on the operations and facilities of the Washington State Department of Ecology in Lacey, Washington. Its approach has been consciously designed to be applicable to a wide range of other organizations, both public and private. This project was conducted in several steps. The purpose, process used, and results of each step are documented in this report. Taken together, this series of project components form a method for understanding the challenge of sustainability and creating a plan to achieve it. The result is a set of steps – or pathways – to sustainability. This report is organized according to the model process followed to conduct the project, in these sections:
Quantifying the current “footprint” Creating a “sustainability lens” to analyze impacts from a sustainability perspective Defining twenty-five year sustainability goals "Backcasting” the pathways to sustainability for the major impact categories Analyzing the payback schedules for several key investments
Each of the components presented its own conceptual and logistical challenges. These are summarized briefly within each section. Several technical appendices provide detailed analysis, payback schedules, and relevant background information. This project breaks new ground in its holistic approach, long timeframe, and emphasis on concrete pathways toward sustainability. The resulting outline of actions for the coming decades is intended to show a viable path to sustainability. It is intended to build on the cognitive understanding The Natural Step “funnel” provides: the need to change to avert an unhappy clash of supply and demand for natural capital. The pathways are intended to provide the cognitive understanding that it is possible to achieve sustainability by undertaking a series of practical steps. Stakeholders can turn these steps into concrete proposals. As stakeholders become involved and refine this vision of a sustainable future, they will be able to “own” and give life to their set of proposed changes in technologies and practices, and achieve sustainability. This framework and these pathways are presented for your consideration. They offer the Department of Ecology – or any other willing entity -- a springboard for understanding and action. There are multiple underlying incentives to use this framework:
It uses existing financial management and reporting tools to quantify most impacts. It ranks which environmental impacts are greatest. This helps sort out which areas
require most attention. It is based on reasonable assumptions about what kinds of technology will be
available when over the next 25 years (and what kinds of changes in practice will feel

Pathways to Sustainability 2 Washington State Department of Ecology
appropriate). As better information becomes available, these assumptions can be adjusted. As a result, portions of the framework and pathways can be refined, without invalidating the rest of it (although whole-system links should be examined).
It defines pathways to sustainability – changes in technology and practice – that lead, step by step, to sustainability. The goals are clear. They can be refined as better information becomes available, but the direction will not change significantly.
Investing in sustainable technologies helps move the marketplace toward sustainability, and long-range planning helps support the investments required to generate sustainable products when they are needed.
The initial steps outlined in this report (and refined through its implementation) will be scaled with an understanding of how much work needs to be done, and effort will not be wasted implementing symbolic measures that do not move the organization toward sustainability.
Making smart decisions about moving to lower-energy and sustainable energy technologies and practices will save real money as energy costs rise, and avoid real disruptions as non-sustainable energy sources “hit the wall.”
Here in the Pacific Northwest, Washington and Oregon have been ranked by the Resource Renewal Institute as among the top five states in the nation in preparing to move toward sustainability. Governor Kitzhaber issued Oregon’s Executive Order for Sustainability of state government operations in 2000. In 2003, Governor Locke issued a similar Executive Order for Washington, to achieve sustainability within a generation. State agencies in Oregon and Washington, by working on their own sustainability, are positioning themselves to provide leadership and support to the broader community, and are reinforcing efforts already underway in the private sector and non-profit sector. The cities of Portland, Seattle and Olympia have forward-looking sustainability programs in place. Washington’s Paladino Consulting and Design group leads the nation in its work on the LEED standard for energy efficient building design. Portland has a well-deserved reputation for design expertise in energy efficient structures. Many diverse entities are involved, including universities, architectural and construction firms, manufacturers, and non-profits. These reflect a regional environmental ethic moving toward sustainability. There are other public and private efforts too numerous to list here (see LINKS on Ecology’s Sustainability web page http://www.ecy.wa.gov/sustainability ). We invite you to critique and collaborate on refining and broadening this methodology. project manager: John Erickson, Department of Ecology, Lacey, Washington
consulting team: Larry Chalfan, Zero Waste Alliance, Portland, Oregon
Logan Cravens, SERA Architects PC, Portland, Oregon Christopher Juniper, Rocky Mountain Institute, Snowmass, Colorado
consulting team leader Jeff Morris, Sound Resource Management, Bellingham, Washington Joshua Skov, Good Company, Eugene, Oregon
sustainability team advisors: Lori Crews, Ecology Spill Response and Prevention Program
Patricia Jatczak, Ecology Hazardous Waste and Toxics Reduction Program Nancy Mears, Ecology Hazardous Waste and Toxics Reduction Program Jerry Parker, Ecology Hazardous Waste and Toxics Reduction Program
Pathways to Sustainability 3 Washington State Department of Ecology
How To Find What You Want In This Document An Overview of Pathways to Sustainability:
The Pathways report consists of four main chapters which describe a process of planning a course to sustainability: (1) assessing impacts, (2) selecting a sustainability framework, (3) setting long-range goals and creating pathways to get to the goals, and (4) implementing (with tools to choose among options). Several appendices provide a wealth of supporting information on alternate sustainability frameworks, and more detailed descriptions of related material. Main Chapters: I. Assessing Impacts:
A quantitative and qualitative assessment of Ecology’s main environmental impacts, using several technical methodologies.
II. Selecting A Sustainability Lens
Description of the framework decided upon by the Team, with brief description of the framework process selection.
III. Sustainability Goals & Backcasting
The roadmap for action: five “functional pathways” to follow in order to achieve sustainability by 2025. The pathways include: information & communication, mobility, facility operations, site and landscape, and food.
IV. Implementation Preview & Payback Analysis Tools
Description of payback analysis tools useful for choosing among investment options required for making progress toward sustainability.
Appendices A. Introduction to Life Cycle Thinking
Additional background to make Chapter I more accessible to readers who have not previously encountered Life Cycle Assessment.
B. Sets of Principles & Ranking of Frameworks
Detail on what frameworks were considered and how they were rated and ranked.

Pathways to Sustainability 4 Washington State Department of Ecology
C. Goal-Setting, Backcasting, & Goal Matrices Detail on how goals were set, first by environmental impact, then by function.
D. User Data Entry Sheets:
Examples of the spreadsheets (for payback analysis) described in Chapter IV. E. Consulting Organizations
Background on the consultants who worked on the project and their affiliations. A Template for Action The Department of Ecology encourages other groups to use this process as a way to understand sustainability - and to map out their own pathways to a sustainable future. This approach offers several benefits:
• It sorts out priorities: What issues are most important? Which strategies make sense now, and which will make more sense later? • It helps focus on opportunities to save money and avoid disruptions in operations. • It positions the State well from the public’s perspective. It shows we are thinking ahead; contributing to solutions instead of just passing high energy and environmental costs along to taxpayers; and keeping overhead costs under control, to support public services and service providers. • It provides a map of practical steps to achieve sustainability, so staff and managers can believe they can succeed.
We would like to hear from you if you can use this approach, or if you have suggestions about what would make it more useful. Please contact the project manager: John Erickson at [email protected] .
Pathways to Sustainability 5 Washington State Department of Ecology
I. Assessing Ecology's Impacts Measuring Impacts of Resource and Product Use Introduction and Overview of Methodologies One of the major tasks assigned to the Sustainable Pathways Project Team was to apply a “sustainability lens” and straightforward, science-based analytical tools to quantify and rank Ecology’s environmental impacts. This section of our report quantifies the “ecological footprint” of operations during 2000 in and from the Washington State Department of Ecology’s Lacey headquarters facility. This section also reports the results of the project team’s search for and use of available sustainability tools to rank the environmental and ecological impacts caused by and associated with Ecology’s current footprint. Overview of Methodologies The footprint assessment and impacts rankings detailed in this section are based on three somewhat different methodologies for measuring environmental and ecological impacts from using resources, products and services. Sustainability concepts inform the three different methodologies used to assess and rank impacts because all three look beyond just immediate environmental impacts, to take both upstream and downstream impacts into account. The three methodologies (to varying extents) not only examine the here and now impacts of, for example, driving Ecology’s fleet vehicles or using natural gas to heat the headquarters facility. They also examine the upstream impacts associated with extracting material and energy resources to provide fuel for the fleet vehicles and natural gas for heating, ventilation and cooling (HVAC) systems. All three also to varying extents account for downstream impacts of activities, such as the impact on ecosystems from building roads that are used by Ecology’s fleet vehicles. In addition, all three methodologies use some or all aspects of life cycle analysis (LCA) to assess environmental impacts embodied in the products and services used by Ecology in carrying out is activities at and from the Lacey facility. The LCA aspect of the methodologies is discussed further in the next section. (An introduction to LCA theory and application is provided in Appendix A.) Please note: Some aspects of sustainability are more difficult to quantify, and are not currently reflected in these or any other available quantitative tools. The users of these tools will need to recognize these caveats:
• The more difficult to measure ecological aspects of sustainability such as biodiversity and ecosystems productivity are not factored into the assessment and rankings. This is one area where future work on these quantitative tools may yield improvement. Our working assumption is that the mainly human-health-based indicators of environmental impact used by three methodologies provide a reasonable basis for decision-making most of the time, since human health is one indicator (among many) of ecosystem health. However,

Pathways to Sustainability 6 Washington State Department of Ecology
the user will have to exercise good judgment if Ecology activities ranked low by the three methodologies appear in fact to have high impacts on biodiversity or ecosystem productivity (e.g. on wild salmon).
• Social aspects of sustainability, such as accessibility for all beings to the means to lead productive and fulfilling lives, are virtually ignored in the available tools, and therefore do not weigh in the relative ranking of impacts. Available science-based analytical tools provide little guidance on how to measure and factor in social impacts, and offer no widely accepted methods for comparing more success on one social indicator against less success on another in order to rank impacts. Again, the user will have to utilize good judgment if activities ranked low by these tools appear to have high impacts on social aspects of sustainability.
Measurement Methodologies Used The three methodologies used in this project to measure environmental impacts are described below, and for simplicity are referred to throughout this report as Method 1, Method 2, and Method 3. To better account for environmental impacts and the economic costs of these impacts, each method uses quantitative models that have come into mainstream use in economics over the past half-century. Some of these quantitative models – such as input-output models used to sum up releases of pollutants into the environment as a result of the inter-industry flow of material and energy resources through the economy in order to produce a particular good or service for final consumption – are based on older and widely accepted economic models. Others – such as models for estimating the economic cost of environmental releases – are of more recent origin and are not as widely accepted because different models, or the same model estimated over different sets of empirical data, at times yield widely divergent results. Each of the three methods also makes use of one or more of the three steps involved in a complete Life Cycle Assessment (LCA) – life cycle inventory (LCI), environmental impacts assessment (EIA), and economic valuation (EV) of environmental impacts. The LCI step of an LCA attempts to measures all releases of pollutants to air, water and land, as well as disturbances to ecological systems, which result from:
o resource extraction and production of goods and services. o actual use of the product or service. o management of wastes generated after the product or service is used up.
The EIA step provides an analysis of the environmental/ecological impacts caused by the pollutant releases that have been catalogued and measured in the LCI step. The EV step attempts to impute a dollar figure for the environmental/ecological cost of each impact. All three steps – LCI, EIA and EV – are necessary if one wishes to quantitatively compare the monetary value of reduced emissions against the cost of some up front investment that yields those reduced emissions.
Pathways to Sustainability 7 Washington State Department of Ecology
Method 1 (Limited LCA) – The use of life cycle inventory (LCI) data in combination with environmental impact assessment (EIA) and economic valuation (EV) for a limited number of pollutant releases. The project team investigated impacts from eleven groups of products and services used at Lacey headquarters.1 LCI data were available to measure emissions of ten air pollutants, seventeen water pollutants, and generation of industrial solid wastes from four of these product/service groupings (1) resource extraction and generation of electricity, (2) resource extraction and production of gasoline and its consumption in driving (although no LCI data were available for waterborne emissions generated during driving), (3) resource extraction and production of natural gas and its combustion2, and (4) resource extraction and production of paper. LCI data were not available for (5) office supplies other than paper; (6) commercial printing; production or use of (7) computers and (8) computer printers; production of (9) furniture, partitions and other furnishings; (10) water consumption and sewerage; or (11) building and grounds maintenance. EV estimates for emissions impacts were available from the literature on life cycle analyses. Both low and high estimates found in that literature are used to provide lower and upper bound estimates for the economic cost of pollutant releases. The economic valuation of releases of industrial wastes did to some extent take into account impacts of those releases on land-based ecosystems. However, for the most part, economic costs cited in the life cycle analysis literature and used in Method 1 to measure costs associated with pollutant releases to air and water are derived from estimates of the impact of pollutants on human health or from estimates of the economic cost of technologies used to attain regulatory limits on pollutant emissions.3
• Method 2 (UCS) – The use of calculations published in the study for the Union of
Concerned Scientists (UCS) by Michael Brower and Warren Leon, The Consumer’s Guide to Effective Environmental Choices, that yield seven indicators of environmental impact:
o (1) Releases of greenhouses gases. o Releases of (2) common and (3) toxic pollutants to air. o Releases of (4) common and (5) toxic pollutants to water. o (6) Habitat alteration from water use.
1 The measurement and ranking of impacts from Ecology’s activities did not include food purchase, preparation, and consumption. However, the project team did provide a pathway to sustainability for food during a follow-up phase of the project. The measurement and ranking of food impacts, however, was not attempted in either phase of the project. 2 Emissions data were available for combustion of natural gas in the generation of electricity. Data for on-site combustion to generate heating and cooling were not available, so the emissions from using natural gas to generate electricity were used instead. As a result, these emissions data likely underestimate actual emissions from combusting natural gas on site at Lacey headquarters due to absence of acid gas scrubbers, bag houses, and other equipment often used at power plants to control pollution. 3 The reader should understand that the releases measured by LCI data are the pollutant releases that occur after the emitter has complied with regulations. Thus, these releases are “allowed” because the total release is below the emitter’s regulatory limit for releases of a particular pollutant.

Pathways to Sustainability 8 Washington State Department of Ecology
o (7) Habitat alteration from land use. In addition to impacts from resource extraction and manufacturing of goods and services, the UCS method also attempts to include impacts from product and service use, except in cases such as hot water use where the impacts from energy to heat water are counted only in the energy utility service categories, and not the water category, to avoid double counting. Thus, the UCS method is in principle more comprehensive than the limited LCI/EIA data that were available for Method 1. Data were available from the UCS study to measure all but commercial printing among the eleven product and service groupings used to characterize the pollutant releases from, and impacts of, resource and product use by Ecology’s Lacey headquarters facility.
• Method 3 (EIO-LCA) – The use of calculations available online (www.eiolca.net) from
Carnegie Mellon’s Green Design Initiative “Economic Input-Output Life Cycle Assessment model” that yield six indicators of environmental impact: o (1) Releases of greenhouse gases. o Releases of (2) common and (3) toxic pollutants to air. o Releases of (4) toxic pollutants to water. o (5) Untreated discharges of water used for extraction and production. o (6) External costs of estimated damages resulting from air emissions of conventional
pollutants and greenhouse gases. The Carnegie Mellon EIO-LCA method only assesses resource extraction and manufacturing impacts for a product or service. It does not assess impacts from actual use of the product or service. Method 3 data were available to measure resource extraction and production impacts for all eleven product and service groupings.
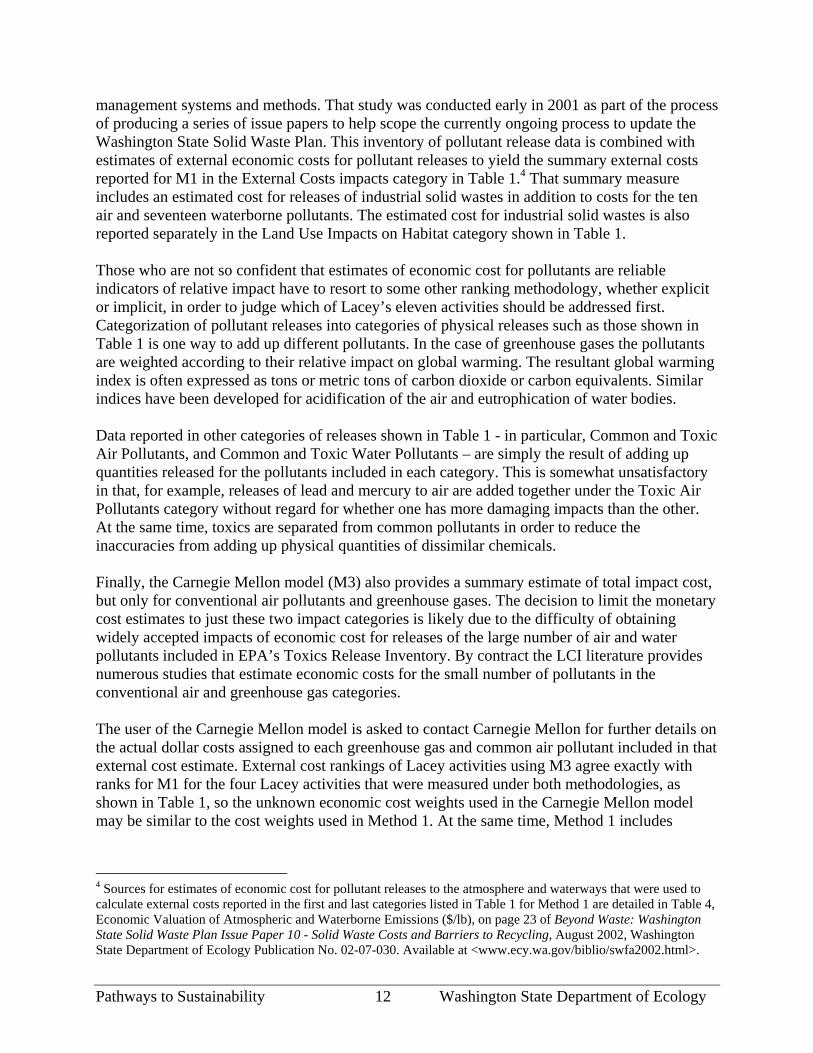
Impacts Assessment and Ranking Table 1, Lacey Facility & Operations Environmental Impacts Measured by LIMITED LCA (M1), UCS (M2), and EIO-LCA (M3) Methodologies, summarizes and compares measurements by these three methodologies. Each row of the table reports impacts that result from Ecology’s use and consumption of product and services in one of the eleven product and service groupings -- electricity, natural gas, paper, office supplies other than paper, commercial printing services, computer printers, computers, office furnishings, water and sewerage, building and grounds maintenance, and driving passenger cars and light trucks in order to carry out Ecology’s missions. Numerical estimates of impact magnitude for eight different categories for measuring environmental impacts are reported in the rows of Table 1. The three methodologies do not all provide a measure for each category, as indicated by the absence of an M1, M2 or M3 in the rows under four of the eight categories. Nor do all three methodologies provide a measure for each of the eleven product and service groupings, as indicated by the “no data” entry in some columns of Table 1. Nevertheless, it is instructive to note and comment on rankings and magnitudes for those cells that do contain data in Table 1.

Pathways to Sustainability 9 Washington State Department of Ecology
Electricity consumption is the highest impact product/service at Lacey in twelve of the twenty possible “impact category – measurement methodology” combinations shown in the rows of Table 1 for each product/service category listed in the columns of Table 1. Electricity ranks second in another two of the twenty. Furthermore, for those categories in which electricity ranks number 1 its impact is between 1.1 and 9.6 times greater than the impact of the second ranking product/ service grouping. Computer purchases and fuel consumption from driving come in as somewhat distant seconds. Computers rank first in five of the twenty category-measurement combinations, while driving ranks first in three. Computers garners five second place rankings, while driving garners seven seconds. Print Shop Printing and Paper consumption in combination get our seconds. Building and grounds maintenance gathers two seconds, due to its impacts on water and water-based habitat. Natural gas, office supplies other than paper, computer printers, office furnishings, and water & sewerage fall far below the above leaders in all categories, except for water use, which has substantial impacts on water-based habitat and in emissions of common water pollutants. These rankings exhibited in Table 1 indicate clearly that electricity use, consumption of fossil fuels and lubricants in driving, computers, and paper printing and use are the high impacts activities, with building & grounds maintenance activities and water use/sewerage discharges also providing serious impacts on water quality and water habitat. These are the areas that need to be addressed first to reach sustainability within twenty-five years. As a caveat it also should be noted with respect to building and grounds maintenance that Ecology’s reported emphasis on use of non-toxic and biodegradable cleaning agents and pest controls may already mean that actual impacts are substantially less than those portrayed by the estimates in Table 1 for year 2000 activities. That is because all three measurement methodologies are based on emissions and impacts for the average user of cleaning agents and pest controls. To the extent that Ecology is below or well below average in use of toxics and non-biodegradable agents, the impacts data listed in Table 1 would significantly and substantially overestimate actual impacts at Lacey headquarters. Furthermore, the UCS and EIO-LCA methodologies are based on data that is at least six years old, and even the average as measured by the UCS and Carnegie Mellon models has probably decreased in terms of intensity of use of toxic and non-biodegradable agents. Consistency and Differences in Impact Measurements Table 1 reveals a rather surprising consistency of ranking among the three models. The minor inconsistencies exhibited in Table 1 are in some cases due to differences in what portion of a product/service’s life cycle is covered by the methodology. For example, in the UCS model (M2) impairment of land habitat from driving includes use of land space for roads, as well as impacts from extraction, refining and consumption of petroleum products, whereas the LIMITED LCA (M1) model captures the latter while ignoring habitat/biodiversity impacts of roadways and parking lots.
Pathways to Sustainability 10 Washington State Department of Ecology
Some of the differences between numerical magnitudes reported for impacts under the three methodologies are also due to selection of which particular pollutants to include in each impact category. The particular pollutants and other impacts measured by each method in each category are, as follows:
1. External Costs – Used in M1 to summarize impacts of releases to the atmosphere of ten air pollutants (total particulates, NOx, non-CH4 hydrocarbons, SOx, CO, CO2, NH3, Pb, CH4, and HCL), releases to waterways of seventeen water pollutants (dissolved solids, suspended solids, BOD, COD, oil, H2SO4, Fe, NH3, Cu, Cd, As, Hg, phosphate, Se, Cr, Pb, and Zn), and releases to land of industrial solid wastes. Used in M3 to summarize impacts of releases to the atmosphere of greenhouse gases (CO2, CH4, N2O and CFCs) and conventional air pollutants (PM10, SO2, CO, NO2, VOCs, and Pb). M2 did not attempt to use estimates of dollar costs to weight impacts across its seven categories.
2. Greenhouse Gases – M1 includes just CO2 and CH4, although M1 weights CH4 by 21
instead of the 11 multiplier used in M3. M3 includes N2O and CFCs in addition to CO2 and CH4.
3. Common Air Pollutants – M1 includes total particulates, NOx, SO2, and non-CH4
hydrocarbons. M2 includes PM2.5, NOx, SO2 and VOCs. M3 includes PM10, SO2, CO, NO2, VOCs, and Pb.
4. Toxic Air Pollutants – M1 includes non-CH4 hydrocarbons, lead and hydrochloric acid.
M2 includes 188 toxics listed in the 1990 Clean Air Act Amendments. M3 includes air pollutants called out in EPA’s Toxics Release Inventory.
5. Toxic Water Pollutants – M1 includes heavy metals, H2SO4 and NH3. M2 includes
water pollutants called out in EPA’s Toxics Release Inventory, as well as pesticides. M3 includes water pollutants in EPA’s Toxics Release Inventory.
6. Common Water Pollutants – M1 includes dissolved solids, suspended solids, and BOD.
M2 includes nutrients, suspended solids, sediments, and BOD. M3 does not have a common water pollutant category.
7. Water Habitat – M1 does not include a measure for water habitat impairment. M2 uses
water consumption (as opposed to water withdrawals) as a rough measure of threat to aquatic habitat. For purposes of Table 1 we used the M3 model’s estimates for discharges of untreated water as a measure of water habitat threat.
8. Land Habitat – M1 uses an economic cost estimate for the impacts of industrial solid
wastes generated during extraction, refining and manufacturing that is released to the land. This economic cost estimate is based 95% on threats to biodiversity and ecological productivity, and 5% on mineral resource productivity loss. M2 calculates threats to land habitat based on US Forest Service data that associates number of endangered plant and animal species with various land use activities, combined with data on number of acres of

Pathways to Sustainability 11 Washington State Department of Ecology
land devoted to each use. M3 does not have an output series that is easily associated with threats to land habitat, although one might consider that model’s estimates of fuels, ores and fertilizer use as an approximate indicator of threats to land habitat.
Discussion of Weighting Schemes The UCS study (M2) measured environmental impacts in seven different categories using input-output tables to measure resource extraction and production impacts, and life cycle studies to account for impacts from actual use of various products and services by households. In order to deal with the fact that different products and services ranked differently in these seven different categories, the UCS study reviewed two comprehensive risk assessments – one reported in a 1990 EPA document Reducing Risk: Setting Priorities and Strategies for Environmental Protection, Report of the Science Advisory Board to William K. Reilly, Administrator; and the other in a California Comparative Risk Project document Toward the 21st Century: Planning for the Protection of California’s Environment, Summary report, Submitted to the California Environmental Protection Agency. Based on these two documents, the UCS study ranked the leading consumption-related environmental problems in descending order of import as air pollution, global warming, habitat alteration and water pollution. However, the UCS study did not take the final step of providing a quantitative index for adding up impacts across the seven different categories. Instead, The UCS study provides a table that highlights for each product or service grouping of household expenditures whether a particular product or service grouping has more than twice the average impact in a category or more than five times the average impact. That means the study’s reader is left with the task of deciding whether a product ranking high in, say, toxic air pollution is more or less of a problem than a product ranking high in, say, common air pollution. By contrast the LIMITED LCA model (M1) does provide a summary index of total impact for the pollutants included in the LCI. The Carnegie Mellon model (M3) provides a summary impact index, but just for releases of greenhouse gases and conventional air pollutants. Both M1 and M3 use estimates of the economic cost from impacts caused by releases of each pollutant to weight the quantity of each pollutant released. In the case of model M1 these estimates of impact cost for each of the ten atmospheric pollutants, seventeen waterborne pollutants, and industrial solid waste are added together to yield the estimates of external cost shown in the first row of Table 1 for each of the eleven Lacey activities. If one is confident that estimates of economic cost are accurate indicators of relative impact for each pollutant, then these estimates of total cost for impacts provide a very convenient index, both for comparing impacts among the eleven activities and for deciding how much should be spent to reduce impacts from any one or all eleven activities. The LCI measurements for M1 reported in Table 1 in five of the physical release categories -- Greenhouse Gases, Common Air Pollutants, Toxic Air Pollutants, Toxic Water Pollutants, and Common Water Pollutants -- are based on LCI data supplied to Ecology by Research Triangle Institute and US EPA for use in Ecology’s study of internal and external costs of solid waste
Pathways to Sustainability 12 Washington State Department of Ecology
management systems and methods. That study was conducted early in 2001 as part of the process of producing a series of issue papers to help scope the currently ongoing process to update the Washington State Solid Waste Plan. This inventory of pollutant release data is combined with estimates of external economic costs for pollutant releases to yield the summary external costs reported for M1 in the External Costs impacts category in Table 1.4 That summary measure includes an estimated cost for releases of industrial solid wastes in addition to costs for the ten air and seventeen waterborne pollutants. The estimated cost for industrial solid wastes is also reported separately in the Land Use Impacts on Habitat category shown in Table 1. Those who are not so confident that estimates of economic cost for pollutants are reliable indicators of relative impact have to resort to some other ranking methodology, whether explicit or implicit, in order to judge which of Lacey’s eleven activities should be addressed first. Categorization of pollutant releases into categories of physical releases such as those shown in Table 1 is one way to add up different pollutants. In the case of greenhouse gases the pollutants are weighted according to their relative impact on global warming. The resultant global warming index is often expressed as tons or metric tons of carbon dioxide or carbon equivalents. Similar indices have been developed for acidification of the air and eutrophication of water bodies. Data reported in other categories of releases shown in Table 1 - in particular, Common and Toxic Air Pollutants, and Common and Toxic Water Pollutants – are simply the result of adding up quantities released for the pollutants included in each category. This is somewhat unsatisfactory in that, for example, releases of lead and mercury to air are added together under the Toxic Air Pollutants category without regard for whether one has more damaging impacts than the other. At the same time, toxics are separated from common pollutants in order to reduce the inaccuracies from adding up physical quantities of dissimilar chemicals. Finally, the Carnegie Mellon model (M3) also provides a summary estimate of total impact cost, but only for conventional air pollutants and greenhouse gases. The decision to limit the monetary cost estimates to just these two impact categories is likely due to the difficulty of obtaining widely accepted impacts of economic cost for releases of the large number of air and water pollutants included in EPA’s Toxics Release Inventory. By contract the LCI literature provides numerous studies that estimate economic costs for the small number of pollutants in the conventional air and greenhouse gas categories. The user of the Carnegie Mellon model is asked to contact Carnegie Mellon for further details on the actual dollar costs assigned to each greenhouse gas and common air pollutant included in that external cost estimate. External cost rankings of Lacey activities using M3 agree exactly with ranks for M1 for the four Lacey activities that were measured under both methodologies, as shown in Table 1, so the unknown economic cost weights used in the Carnegie Mellon model may be similar to the cost weights used in Method 1. At the same time, Method 1 includes
4 Sources for estimates of economic cost for pollutant releases to the atmosphere and waterways that were used to calculate external costs reported in the first and last categories listed in Table 1 for Method 1 are detailed in Table 4, Economic Valuation of Atmospheric and Waterborne Emissions ($/lb), on page 23 of Beyond Waste: Washington State Solid Waste Plan Issue Paper 10 - Solid Waste Costs and Barriers to Recycling, August 2002, Washington State Department of Ecology Publication No. 02-07-030. Available at <www.ecy.wa.gov/biblio/swfa2002.html>.

Pathways to Sustainability 13 Washington State Department of Ecology
waterborne emissions and industrial solid wastes in its calculation of external costs, while the Carnegie Mellon model does not, so the similarity in rankings may just be coincidental. This discussion also motivates a final comment on the data underlying all three methodologies. Estimates for emissions of each pollutant for each product or service produced, as well as estimates of the economic costs imposed by those emissions, are not easily developed. Different researchers often come up with quite divergent results. Developments in technology, environmental regulations, and a host of other factors constantly change emissions rates and economic burdens imposed by those emissions both over time and among different geographic locations. Thus, it is important to regard the data shown in Table 1 as indicators rather than precise estimates.

Pathways to Sustainability 15 Washington State Department of Ecology
Table 1 Lacey Facility & Operations Environmental Impacts
Measured by Limited LCA (M1), UCS (M2), and EIO-LCA (M3) Methodologies Note: The activity with the highest ranking is denoted by bold, underlined type. The second highest is denoted by italicized, underlined type.
Non-Paper BuildingOffice Print Shop Computer Water & & Grounds
Electricity Driving Natural Gas Paper Supplies Printing Printers Computers Furniture Sewerage MaintenanceExternal Costs (thousand $) M1 $404 $137 $18 $37 no data no data no data no data no data no data no data M3 $166 $36 $3 $13 $3 $27 $2 $133 $0 $1 $4.2Greenhouse Gases (thousand lbs CO2) M1 9,433 2,602 324 685 no data no data no data no data no data no data no data M2 13,161 2,369 257 538 41 no data 18 782 4 7 30 M3 8,907 1,540 193 369 132 1,151 119 6,760 2 30 227Common Air Pollutants (thousand lbs) M1 119.8 102.5 7.4 13.7 no data no data no data no data no data no data no data M2 121.9 18.2 0.5 4.4 1.6 no data 0.7 29.6 0.2 0.2 4.9 M3 74.5 33.6 1.2 8.3 2.0 16.9 1.3 76.6 0.0 0.4 3.2Toxic Air Pollutants (thousand lbs) M1 5.4 16.6 1.2 1.7 no data no data no data no data no data no data no data M2 0.3 2.7 0.0 0.2 0.1 no data 0.0 1.3 0.0 0.0 0.6 M3 0.03 0.07 0.00 0.30 0.05 0.83 0.05 2.59 0.00 0.00 0.04Toxic Water Pollutants (thousand lbs) M1 0.09 0.06 0.00 0.00 no data no data no data no data no data no data no data M2 4.4 2.2 0.1 21.0 6.6 no data 2.2 95.4 0.3 0.4 13.8 M3 0.0021 0.0052 0.0002 0.0253 0.0029 0.0441 0.0018 0.0881 0.0003 0.0002 0.0062Common Water Pollutants (thousand lbs) M1 27.2 10.8 7.0 0.4 no data no data no data no data no data no data no data M2 55.0 4.4 0.4 3.2 0.7 no data 0.4 18.0 0.2 9.9 48.9Water Use Impacts on Habitat (gallons) M2 - Habitat 11,748 120 58 864 270 no data 107 4,594 117 2,670 8,539 M3 - Untreated Discharges 112 294 15 920 153 1,712 104 6,671 2 11 264Land Use Impacts on Habitat M1 - External Costs (thousand $) $69.2 $7.2 $0.9 $3.4 no data no data no data no data no data no data no data M2 - Habitat (acres) 3.3 592.2 0.1 8.7 1.0 no data 0.5 21.2 0.4 0.2 0.9

Pathways to Sustainability 16 Washington State Department of Ecology
II. Selecting a Sustainability Lens Overview A major task for this project, as explained in Section I, was to assess the current environmental and ecological “footprint” of the Lacey facility using three different methodologies. This work identified and ranked the current impacts, but did not try to judge the sustainability of the facility. A second major task, as explained in this section, was to develop a “Sustainability Lens” that could provide an overview on current and future impacts from a sustainability perspective, and, at the same time, be suitable for measuring progress toward sustainability and evaluating the likely effect of different alternatives for achieving sustainability. In a meeting on May 18, 2001, the project team and Ecology personnel reviewed potential sustainability frameworks and concluded that The Natural Step (TNS) System Conditions were preferred for use to inform the assessment of current impacts of the Lacey headquarters facility, selection of 25-year goals, and establishment of pathways and pathway project priorities for attaining those goals. Zero Waste was seen as a desirable translation of the System Conditions into organizational long-term goals. In addition, Natural Capitalism is expected to have value as an operating framework for moving toward the goals. This chapter briefly describes the process of selecting a framework and the components that were ultimately chosen for the framework. (The other approaches that were considered, as well as a discussion of them, appear in Appendix B.) Preliminary Analysis The first step taken by the team to identify a Sustainability Lens was to catalog approaches that might provide a 25-year sustainability visioning and strategic framework for achieving sustainability of Ecology’s operations. The team then established criteria to analyze these approaches in order to select the most appropriate ones for consideration by Ecology personnel. Potential approaches initially considered were:
• The Natural Step System Conditions • Natural Capitalism • Zero Waste • The Ecological Footprint • The CERES Principles • The Bellagio Principles • The Sustainable Process Index • 2001 Environmental Sustainability Index
The team ultimately recommended two frameworks:
• TNS supported by a Zero Waste strategy • Natural Capitalism supported by a Zero Waste strategy

Pathways to Sustainability 17 Washington State Department of Ecology
Appendix A summarizes each of these approaches, provides web links for more information, and describes in detail the ranking process. Overview of Selected Frameworks The analysis of the possible frameworks began with a brief review of each as to its potential ability to provide the needed 25-year vision and strategic framework for achieving sustainability. Several were ruled out during this prescreening; the three that were selected are briefly described here. The Natural Step (TNS) is an international organization whose purpose is “to develop and share a common framework composed of easily understood, scientifically based principles that can serve as a compass to guide society toward a just and sustainable future.” The Natural Step System Conditions are four unalterable system-level conditions that form a full framework that includes environmental protection along with efficiency and social equity. The Natural Step provides a training framework that includes a background primer, a whole system view with graphics of natures cycles and societies cycles, a funnel concept of our journey into the future facing reduced resource availability, and “backcasting” as a planning tool. The training is very helpful in creating a shared goal for all people in an organization to work toward and is a good foundation for a 25-year sustainability visioning and strategic framework for sustainability. See Appendix B, section A for more information. Natural Capitalism is a set of operating principles for a business in the next industrial revolution. Natural Capitalism is a new business model that enables companies to fully take advantage of the changing patterns of scarcity. Natural Capitalism is based on the understanding that an economy needs four types of capital to function properly, human capital, financial capital, manufactured capital, and natural capital. The journey to Natural Capitalism involves four major shifts in business practices. These four strategies, called the Natural Capitalism Principles, are seen to provide a fairly comprehensive framework to support the 25-year sustainability visioning and strategic framework for sustainability. Natural Capitalism Principles are very complementary to TNS System
slide 7
Natural Capitalism:Creating the Next Industrial Revolution
• Radically increase the productivity of naturalresources.
• Shift to biologically inspired production models andmaterials.
• Move to a “service-and-flow ” business model.
• Reinvest in natural capital.
by Paul Hawken, Amory B. Lovins, and L. Hunter Lovins
slide 1
The Natural StepSystem Conditions for Sustainability
In order for a society to be sustainable, nature's functionsand diversity are not systematically...
1. ...subject to increasing concentrations of substancesextracted from the Earth's crust;
2. ...subject to increasing concentrations of substancesproduced by society;
3. ...impoverished by physical displacement, over-harvesting, or other forms of ecosystemmanipulation; and
4. resources are used fairly and efficiently in order tomeet basic human needs globally.

Pathways to Sustainability 18 Washington State Department of Ecology
Conditions in that they provide an operating framework for preserving sufficient natural capital for sustainability – which is the goal of the TNS System Conditions. See Appendix B, section B for more information. Zero Waste (ZW) is a visionary goal that expresses the need for a closed-loop industrial/societal system, where only benign, biodegradable materials, represented by the green arrows in Figure 1, are allowed to go to nature and other materials remain perpetually in the industrial or technical cycle. The release of toxic and persistent compounds (represented by the red arrow with the black “X”) to the biosphere is eliminated. The Natural Step System Conditions and Natural Capitalism work toward this same condition. These goals are achieved in practice by the application of a Zero Waste strategy that includes five elements. A zero waste strategy is a clear goal that all employees of an organization can understand and work toward. Since waste is something the organization has paid for and usually must pay to discard, a Zero Waste strategy is a short cut to economic savings that also helps the environment. The use of an endpoint goal of "zero" will lead to rapid innovative improvements. While a zero waste strategy supports all of the TNS System Conditions, it is not sufficient as a single tool to achieve full sustainability. For an organization to effectively work toward full sustainability using a Zero Waste strategy, it should also include elements that more strongly support meeting the basic needs of people and the wise use and restoration of the natural environment. For this reason, the team did not see Zero Waste alone as an adequate framework. See Appendix B, section C for more information. See Appendix B for more detailed descriptions of the frameworks that were considered but not selected for the sustainability lens.
Figure 1. Natural and Industrial Cycles seen
slide 3
Zero Waste - Principles
1. Zero Waste of Resources - Energy- Materials- Human
2. Zero Emissions - Air- Soil- Water- Solid Waste- Hazardous Waste
3. Zero Waste in Activities - Administration- Production
4. Zero Waste in Product Life - Transportation- Use- End-of-Life
5. Zero Use of Toxics - Processes and Products

Pathways to Sustainability 19 Washington State Department of Ecology
III. Sustainability Goals and Backcasting This section uses the “sustainability lens” – the framework created by the team and described in the previous section – to lay out the project’s “sustainable pathways.” With the framework in hand, the team crafted twenty-five-year sustainability goals for several impact areas, along with milestones at five-year increments to demarcate a pathway to each of the goals. We present here five individual functional pathways: information and communications; mobility; facility operations (including shelter infrastructure; employee comfort, health and safety; and furnishings and interiors); site & landscape; and food. These principle pathways capture the vast bulk of Ecology’s impacts. The process of goal-setting and backcasting was more elaborate than what is exhibited in the description of a sustainability pathway for each of the five functions. First, goals were articulated for each kind of natural resource affected (energy, air, water, land, and materials). Next, goals were articulated for each of the functional pathways that appear here. These functional pathways were defined broadly in order to help us think creatively about solutions. A more detailed description of the goal-setting and backcasting appears in the appendix. The sections for each of the five individual pathways have the following format:
background vision strategies context assumptions and backcasted milestones, in five-year increments suggestions for actions now
The background for the five pathways describes in detail the composition of the categories and refers to their respective impacts (as described in detail in section I). In some cases, the focus on function over form led us to create categories that may not appear intuitive to the reader. Thus, the background sections attempt to describe the coherence of the categories. The modus operandi of the goal setting was difficult but straightforward: articulate a vision that describes sustainability. To be clear: for each area of impact and activity, these visions only describe – they do not prescribe. The team also provided some prescriptions in the form of strategies – guidance for high-level or nitty-gritty approaches to carving out a pathway over the long haul. The process of backcasting from a long-run vision consisted of two parts. First, we attempted to state clearly our assumptions of the technological and economic context at the five-year intervals. Second, we articulated specific performance milestones, to the extent possible. Farther out, the milestones are more high-concept, and in fact the 25-year assumptions say little about the specific form of leading technologies for certain needs. Nonetheless, the descriptions and assumptions inspire us to lay out a pathway to the fullest extent possible at present, with the understanding that distant milestones and pathways will be revisited as appropriate. Finally, we laid out the first steps along the pathways, the suggestions for action now.
Pathways to Sustainability 20 Washington State Department of Ecology
Functional Pathway: Information and Communications Background Information and communications is considered as a single pathway, to help foster innovative thinking about changes in technology and practice. This pathway includes computer systems, communications systems such as telephone systems, cellular phones, internet connectivity and bandwidth and office equipment such as copy and fax machines. It also includes desktop items such as paper, filing systems, pencils and pens. The impacts and opportunities for improvement in Information and Communications are significant. We also expect Information and communications to support changes in practices to reduce impacts from transportation and facility energy requirements. The primary driver of changes in information and communications technology will be semiconductor industry improvements. Advances in semiconductor functionality, integration level, compactness, speed, power and cost per function will continue along similar trend lines as they have for the last thirty-plus years. This is often expressed as “Moore’s Law” which states that functionality per chip (bits, transistors) doubles every 1.5 to 2 years. In addition, microprocessor performance [clock frequency (MHz)] also doubles every 1.5 to 2 years. These advancements allowed semiconductor cost per function to simultaneously decrease at an average rate of about 25–30%/year/function. Power per chip function will also decrease rapidly. This will result in 10 to 20 times increase in functionality and reduction of power which will allow unimagined improvements in the capabilities of products that will be available by the year 2025. Communications data rates will become many times higher. Scientists have demonstrated the ability to push 3.28 terabits per second of data over a single stretch of fiber-optic cable. A terabit, a trillion bits, is roughly equal to all of the daily traffic on the Internet for the entire world. This fiber could transmit three times the daily global Internet traffic every second. It is likely that future fiber-optic cables will transmit data at a rate of tens of thousands of terabits per second. At these speeds, the entire written works of mankind could be beamed across the globe at the speed of light in just a few seconds. As of today, more than 215 million kilometers of optical fiber has been laid across the globe, more than enough to stretch to the moon and back nearly 280 times. For example, lower cost, energy efficient equipment and high-speed communications will make teleconferencing commonplace. Though expensive and of limited availability in the past, it is becoming a very effective, feature rich, tool that will soon be available at low cost in most offices. The office or small conference room of the near future will likely have dual screens to show meeting participants and documents simultaneously. Larger teleconference facilities will support a common virtual environment, to allow participants to see all meeting participants and multiple documents simultaneously. (The State of Washington has had this teleconferencing software and equipment available in its teleconferencing facilities in recent years.) This technology will also enable telecommunications systems that make distance almost irrelevant. Similarly, telecommuting is expected to become much more effective as smaller, simpler, but still effective systems become available. Environmental impacts from this new technology will be greatly reduced from today’s level. The prospects for a green supply chain are good. The high-tech industry, while not as “clean”
Pathways to Sustainability 21 Washington State Department of Ecology
as once thought, has made significant advances in the reduction of its environmental impacts. This trend will continue with water use being greatly decreased, power consumption and toxics use being greatly reduced, but most likely still very significant for many years. (One concern is the availability of financial resources to develop the new technologies and build the new factories. Users who want cleaner technologies can help foster investment through long range planning.) The average office worker uses 10,000 sheets of copy paper each year. Paper products produced without chlorine bleach will become universally available, recycling processes are expected to produce less damage to paper fibers, allowing more recycling cycles. Plastics or their replacements will be produced from renewable materials, will be recyclable or even up-cyclable and will be biodegradable within acceptable time limits and therefore cause reasonably limited environmental impact. Better desktop computer display technology also reduces paper use. Flicker-free flat panel monitors are easier to read from than CRT monitors, and use less than one-third the energy of today’s “energy efficient” CRT monitors. Vision for Sustainability in 2025 Advanced equipment will be available that will enable virtual meetings and electronic monitoring to greatly reduce the need for travel, and make time spent in travel much more productive. Equipment and office supplies will be produced with only reusable or recyclable materials and no toxic substances will be released during manufacture or during product life. This equipment will be used at the highest possible levels of efficiency and will be powered by clean renewable energy. All equipment and office supplies will be 100% reused or recycled at the end-of-life. Strategies for Achievement of Vision
• The Ecology computer-purchasing group carries a large portion of the burden to achieve these goals, by researching and steering purchases toward these preferred products. (The Department of Ecology has little or no ability to design or create the advances indicated by the above goals. However, multi-agency purchasing and software support contracts can have great leverage).
o Move toward life-cycle driven decisions, drive vendors to supply LCAs o Purchase contracts will include take-back or other end-of-life clauses
• Invest in and maintain (every four years?) up-to-date telecommunications systems (reduces travel, improves effectiveness of the individual).
• Demonstrate the importance of sustainability to the Department of Ecology by creating a position of “zero waste” or “sustainability” manager to drive efficiency improvements in all activities statewide - make it systemic.
For the year 2005 Assumptions
• Product life-cycle information will be available from a few leading companies. • Teleconferencing equipment will become available by 2005 that is effective, user-
friendly and reasonably priced.

Pathways to Sustainability 22 Washington State Department of Ecology
• Low energy flat panel monitors will be available at competitive prices. • It will be possible to purchase 100% recycled-content paper that will function well in
copiers and printers during this period. • Recycling will be improved so that all paper types will be recyclable. • Scanning data storage systems are available, fueled by high processing capabilities
and low storage media costs that will enable practical electronic storage and retrieval of documents. Paper documents will be scanned into graphic images for storage with imported graphic documents while pattern recognition (OCR) will glean the contents for retrieval searches. Filing software will facilitate indexing and retrieval of any person’s document, regardless of its original form.
Changes in Technology and Practice
• Use life cycle driven purchasing procedures when possible to ensure minimum impacts and eliminate false claims or “greenwash”. (apply to as many products and services as possible)
• Invest in teleconferencing technology to reduce transportation • Invest in low energy monitors to reduce energy use and paper use • Implement scanning data storage systems to replace paper storage • Reduce paper use by 20% • Purchase 100% chlorine free recycled paper • Ensure copying or printing process (wax) will not contaminate and impact recycling • Recycle 100% of paper used • Purchase at least 25% of power from renewable sources
For the year 2010 Assumptions
• Product life-cycle information will be readily available from 25 to 50% of companies. • Teleconferencing technology will improve constantly with changes in the underlying
technologies, necessitating upgrades to achieve improved performance and compatibility with other organizations.
• Technology will also enhance copying and printing equipment - possibly to the point of stripping off previous copied images so that paper may be reused instead of recycled, saving much energy and water in the paper recycling process.
• All general office supplies will be available from renewable and reused or recycled materials that contain no toxics.
Changes in Technology and Practice
• Use life-cycle driven purchasing procedures for 25% of purchases to ensure minimum impacts (apply to all products and services procured)
• Purchase 100% recycled and recyclable paper produced chlorine free • Reinvest in teleconferencing technology to reduce transportation • Implement scanning data storage systems to replace paper storage • Use ink/toner-stripping copy machines for paper reuse (assuming availability) • Purchase only general office supplies made from renewable and reused or recycled
materials that contain no toxics.

Pathways to Sustainability 23 Washington State Department of Ecology
• Purchase at least 40% of power from renewable sources For the year 2015 Assumptions
• Product life-cycle information will be readily available from 50-75% of companies. • Teleconferencing technology will continue to improve, necessitating upgrades to
achieve improved performance and compatibility with other organizations. • Improved display technology and advances in low power semiconductors will enable
practical “electronic tablets” capable of storing millions of pages of text and images. It is assumed that they will result in lower life-cycle impacts at about this time.
Changes in Technology and Practice
• Use life-cycle driven purchasing procedures for 75% of purchases to ensure minimum impacts (apply to all products and services procured)
• Reinvest in teleconferencing technology to reduce transportation. • Invest in technology to replace the majority of paper use. • At least 60% of power will be purchased from renewable sources
For the year 2020 Assumptions
• Life-cycle information will be available from manufacturers for nearly all products and services and will be the norm for purchasing decisions.
• Teleconferencing technology will continue to improve, necessitating upgrades to achieve improved performance and compatibility with other organizations.
• Electronic tablet technology will greatly reduce the need for copy machines. Changes in Technology and Practice
• Use life cycle driven decision procedures for 90% of purchases of products and services to ensure minimum impacts.
• Reinvest in teleconferencing technology to reduce transportation. • At least 90% of power will be purchased from renewable sources
Sustainability Goals for 2025 Assumptions
• Use life-cycle driven decision procedures for all purchases of products and services to ensure minimum impacts
• Teleconferencing technology will continue to improve, necessitating upgrades to achieve improved performance and compatibility with other organizations.
Changes in Technology and Practice
• Equipment will use 100% renewable energy • Equipment contains only reusable or recyclable materials and zero toxics
Pathways to Sustainability 24 Washington State Department of Ecology
• Equipment will produce zero polluting releases to the environment • Energy used by the equipment will produce no harmful releases to the environment • Equipment will allow zero waste of energy or materials • Equipment will be used efficiently • Equipment will be reused or recycled at the end-of-life • All personnel will have their needs met for information and communications • Paper (if used) is from renewable materials, and reused or recycled • Paper (if used) is from chlorine free processes • Paper (if used) production releases no chlorine or other pollutants • Paper (if used) is used with zero waste • Paper (if used) is 100% reused or recycled at end of life • General office supplies are made from renewable and reused or recycled materials • General office supplies contain zero toxic materials • General office production creates zero pollution • General office supplies are used with zero waste • General office supplies are reused or recycled at the end of life
Suggestions for action now
• Demonstrate the importance of sustainability to the Department of Ecology by creating a position of “zero waste” or “sustainability” manager to drive efficiency improvements in all activities statewide - make it systemic. This person would develop training for all employees, help define and coordinate projects, be a central collection point for data on improvements from the projects, prepare reports on progress and be a spokesperson for the initiative, both inside and outside Ecology.
• Establish a holistic, transparent goal to engage employees • Begin training all employees about sustainability. • Train all purchasing people in The Natural Step and in environmentally preferable
purchasing (EPP) procedures • Implement an Environmentally Preferable Purchasing (EPP) program • Demonstrate top management’s strong support for the “new way of doing business”
(not initiative or project) • Buy at least 75% recycled content paper • Mandate printing on both sides of paper • Mandate 100% paper recycling • Ensure purchasing requirements for information and communications (I and C)
include energy considerations and are at least Energy Star compliant • Identify the power consumption of all I and C equipment for use in replacement
planning for energy conservation. • Collect data to use in reporting.

Pathways to Sustainability 25 Washington State Department of Ecology
Functional Pathway: Mobility Background The category of mobility includes all work-related, non-commute travel by Ecology employees. This analysis is extended to employee use of Personally Owned Vehicles (POVs) for non-commute business travel, but does not include the impacts of the commute. In focusing on function rather than form, the team selected “mobility” as the essential need, explicitly leaving open the possibility of inventive strategies to meet future travel needs. Some of the strategies for achieving sustainability conceptually fall under the heading of communication technology, as such technologies can reduce the need for mobility. Transportation-related activities represent one of the largest single impact categories in the analysis. Driving is the organization’s leading contributor to greenhouse gas emissions, a major source of common and toxic air pollutants, and the major source of habitat alteration via land use impacts of roads. Vehicle consumables (tires, etc.), maintenance, life cycle product impacts, and cleaning also have impacts that are often overlooked. At the societal level, transportation represents a principal way in which we pollute our air, change our atmosphere and climate, and destroy and fragment habitat and wetlands. Achieving sustainable ways of meeting mobility needs is one of the most effective and cost-effective ways of achieving overall sustainability. In the short run, Ecology must pursue high-efficiency conventional vehicles and transition technologies, such as hybrid electric vehicles (HEVs). High-efficiency conventional strategies include recent developments in and implementations of diesel and gasoline engines. HEVs also provide high efficiency and much lower emissions. However, meeting mobility needs sustainably demands medium- and long-term planning as well. The shift from our current fossil-fuel based transportation system will require broad categories of action that happen only over a decade or longer: changing the composition of vehicle fleet; planning and building the on-site infrastructure and expertise to support new fleet composition; Purchasing provides opportunities for advancing sustainability goals directly through markets. Ecology’s buying power – perhaps in conjunction with other state agencies – can pool purchasing and directly encourage production to move in promising directions. This kind of coordinated action can also lower unit prices and encourage the development of complementary infrastructure that makes alternative vehicles possible. Expected advances in video teleconferencing and telecommunications result in some secondary benefits. For example, employees are apt to be more comfortable spending a night in a hotel away from home when they have easy access to their families away from home. The environmental impact of hotel use (laundry, energy, etc.) is expected to improve as well in the coming years because the hospitality industry’s costs are very sensitive to environmental costs. So we can expect employees on an overnight inspection trip to be more comfortable. Combine that with video documentation for increased efficiency.

Pathways to Sustainability 26 Washington State Department of Ecology
Such bold, long-run action necessarily involves uncertain and unknown technologies. It is not clear which of the promising alternative technologies, if any, will be the best option in 2020 or 2025. Public policy will need to change in order to promote progress toward sustainability, and Ecology will have a role in identifying those changes and making them happen. Two examples are clear at present: at the state level, the limit on single-meter inputs to the electric grid; and at the federal level, the rules governing reimbursement of POV miles for business purposes. Currently, a single meter may not send more than 29,000 kWh per year back into the electric grid. Given that the Ecology facility hopes to generate a significant amount of electricity on-site with photovoltaic technology, so elimination of this policy will be necessary. By leading this charge, Ecology will also pave the way for other entities, public and private, to follow suit with on-site power generation. In the short run, Ecology can easily increase the use of HEVs in its fleet. This can be as simple as improving convenience and pursuing education to promote HEV use. But longer term, Ecology can influence the direct incentives determined by federal policy for work-related POV travel reimbursement. By pushing for change in reimbursement practices, Ecology can shape incentives to shift miles traveled from POVs for business use to use of fleet vehicles. Since Ecology continues to have higher-efficiency vehicles than all but the best POVs, this will reduce total work-related transportation impact. In other words, true-cost reimbursement of work-related POV use will increase the use of relatively lower-impact POVs, and shift miles traveled from POVs to more efficient fleet vehicles. Public policy can create powerful incentives at the agency level as well. It is worth noting that funding for this project initially came from the Washington State Savings Incentive Program, which allows a portion of the money that an agency saves through efficiency to be spent on additional projects with cost savings. In transition, there can be complex trade-offs between developing internal infrastructure and lowering environmental impacts. For example, totally electric vehicles are available today, but electricity from the grid is not green. Still, encouraging infrastructure development early on can speed the implementation of alternative technologies. Thus, for example, it may make sense to acquire electric vehicles before the availability of 100% renewable electricity or Vision for Sustainable Mobility in 2025 The equipment and infrastructure of transportation will use energy efficiently, using only energy from 100% renewable sources. Sources of energy will create zero pollution – specifically, resulting in no net carbon released into the atmosphere, and no release of toxic manmade pollutants. Energy sources and their transmission infrastructures will be non-polluting and non-toxic to living systems. Vehicles will be produced from 100% non-toxic components that are biodegradable or reclaimable/recyclable. Materials for tires, batteries, brake pads, and other replaceable items will be non-toxic and biodegradable or recyclable.
Pathways to Sustainability 27 Washington State Department of Ecology
The spatial demands of vehicle use and infrastructure will be met with no net destruction of habitat or watersheds. These are the direct technological improvements that will lower the impact of meeting mobility needs. Additionally, the overall need for transport will fall as a result of entirely new technologies and techniques that reduce the underlying demand for mobility. Trip logistical efficiency will minimize the necessary fleet size and maximize co-travel. Teleconferencing and telecommuting technology will obviate a significant percentage of trips. The most commonly used vehicle will be the lowest-impact vehicle (solar, biodiesel, hydrogen, or some other unknown technology). This will depend on changes in technology. Mobility systems integrate broad concerns about impacts on energy, materials, air and water expressed in greater detail elsewhere in this report. Strategies for Achievement of Vision
• Acquire high-efficiency and non-polluting fleet vehicles (depending on availability and stage of technical development)
• Encourage employees to use high-efficiency fleet cars over POVs through convenience, education and incentives
• Promote the use of non-automotive modes (e.g., public transport, bicycles) • Invest in teleconferencing technology • Apply zero waste goals, zero non-biodegradable waste emitted • Reduce the need for driving with co-travel planning • Reduce the need for driving with remote monitoring • Cleaning of vehicles reduces use of water and cleaning chemicals
For the year 2005 Assumptions
• Continued popularity of HEV for short-range driving • Initial availability of mid-sized and mini-van HEVs • Substantial availability of improved video teleconferencing • No change in federal POV use reimbursement policy
Changes in Technology and Practice
• Sustainable cleaning operations for vehicles • Lift 29,000-kWh limit on single-meter grid input • 15% substitution of HEV fleet use for non-HEV POV use through increased
convenience and education to users For the year 2010 Assumptions
• Widespread availability of mid-sized and mini-van HEVs

Pathways to Sustainability 28 Washington State Department of Ecology
• Substantial availability of off-road and specialty HEVs • Ready availability of renewable energy • Widespread availability of video teleconferencing • Changes in federal POV use reimbursement policy allows for differential
reimbursement based on environmental impacts Changes in Technology and Practice
• 30% decrease in mobility needs for meetings due to teleconferencing • 20% decrease in mobility needs for on-site inspection due to remote monitoring
technology • 30% substitution of HEV fleet use for non-HEV POV use through increased
convenience, education and incentives to users For the year 2015 Assumptions
• Widespread availability of renewable energy at competitive prices • Video recording and remote monitoring increases efficiency of visits, reducing the
unit mobility requirements for inspections • Convenient, cost-effective and low-impact regional transit infrastructure
Changes in Technology and Practice
• 30% decrease in meeting frequency due to efficiency from digital audiovideo capture • 50% substitution of HEV fleet use for non-HEV POV use through increased
convenience, education and incentives to users For the year 2020 Assumptions
• Availability of cost-effective next-generation zero-impact technology • Widespread availability of renewable energy at lower prices than conventional
sources Changes in Technology and Practice
• Sustainable cleaning operations for vehicles • All new fleet acquisitions use next-generation zero-impact technology • 75% substitution of HEV fleet use for non-HEV POV use
For the year 2025 Assumptions
• Federal policy will allow effective restrictions on POV reimbursements for older-model polluting vehicles
• Next-generation zero-impact technology is widespread, economically viable, and supported by necessary infrastructure
Pathways to Sustainability 29 Washington State Department of Ecology
Changes in Technology and Practice • Entire fleet use is next-generation technology
Suggestions for action now
• Increase HEV use over POV use through convenience and • Continue HEV fleet expansion • Begin work to lift 29,000 kWh single-meter grid input limitation • Reduce cleaning impacts by reducing use of water and cleaning chemicals

Pathways to Sustainability 30 Washington State Department of Ecology
Functional Pathway: Facility Operations Background Facilities are considered to be the building, site and systems that provide services in three major categories:
• Shelter and Infrastructure • Comfort-Health-Safety • Interiors and Furnishings
Shelter and Infrastructure includes the basic building structure, the building envelope, and the required infrastructure that allows it to function. The second category addresses the Comfort, Health and Safety (C-H-S) of the occupants, including those systems that provide thermal comfort, sanitation, clean air and water, security. The third category refers to non-structural interior construction and renovation, including finish materials and moveable furnishings that are bought by Ecology in large quantities. Each of these categories affects the operation of the facility as an integrated whole, each having an influence over different time frames. That is, the shelter provided should be expected to last at least 75 years depending upon seismic activity or unforeseen catastrophes. The technical systems that provide comfort are more dynamic, lasting anywhere from 10 – 35 years on average depending on such variables as warranty, use and maintenance. Interior partitions and finishes change every 1-10 years as the requirements of the occupants change over time. Furniture may change within months or a few years. All of the facility, therefore, contributes to resources and environmental impacts that will affect the 25-year sustainability goals. System Efficiencies When the Lacey Facility was completed it exceeded Washington State energy code by approximately 30%. Codes have been updated but the building still performs above average. This report seeks to define pathways that will allow Ecology to work with the facility as designed and transform it into a completely sustainable operation in 25 years. Initial analysis reveals opportunities that focus primarily on energy efficiency and related environmental impacts. During the original building design, Puget Power, the local utility prepared a report that identified the end-uses of electricity and natural gas. see Chart 1. Since nearly 75% of energy use is due to heating, lights and equipment, it follows that the greatest improvements will be found in these areas. Moore’s Law applies to these technologies just as it applies to the electronics industry. Total office lighting density is designed for 2.4 watts / square foot. It will be a fair assumption that in 10 years the average density will be 1.2 watts/sf and in 25 years, would approach less than .7 watts/sf. Most of
ENERGY CONSUMPTION BY END USEAssumed Design
(from Puget Power Report June 1992)
Lights28%
Elevator2%
Space Heat27%
Equipment19%
Space Cool7%
Hot Water4%
HVAC Aux.13%Chart Fac-1
Lacey Facility Energy Use
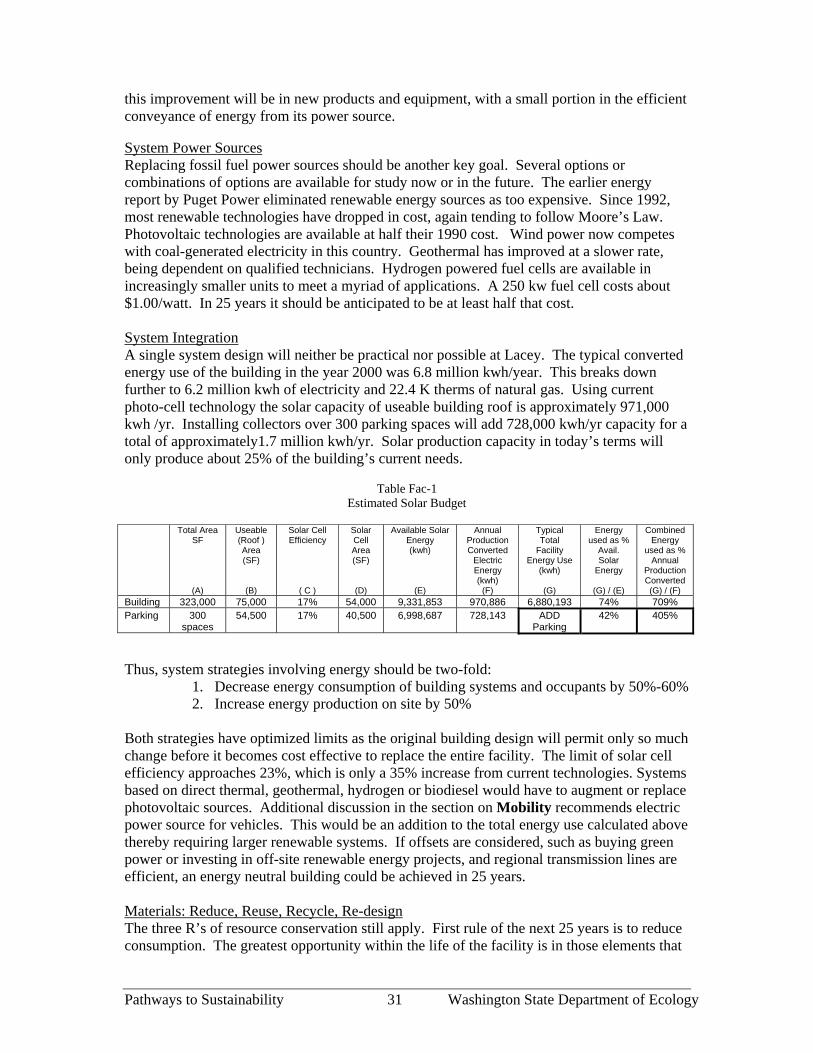
Pathways to Sustainability 31 Washington State Department of Ecology
this improvement will be in new products and equipment, with a small portion in the efficient conveyance of energy from its power source. System Power Sources Replacing fossil fuel power sources should be another key goal. Several options or combinations of options are available for study now or in the future. The earlier energy report by Puget Power eliminated renewable energy sources as too expensive. Since 1992, most renewable technologies have dropped in cost, again tending to follow Moore’s Law. Photovoltaic technologies are available at half their 1990 cost. Wind power now competes with coal-generated electricity in this country. Geothermal has improved at a slower rate, being dependent on qualified technicians. Hydrogen powered fuel cells are available in increasingly smaller units to meet a myriad of applications. A 250 kw fuel cell costs about $1.00/watt. In 25 years it should be anticipated to be at least half that cost. System Integration A single system design will neither be practical nor possible at Lacey. The typical converted energy use of the building in the year 2000 was 6.8 million kwh/year. This breaks down further to 6.2 million kwh of electricity and 22.4 K therms of natural gas. Using current photo-cell technology the solar capacity of useable building roof is approximately 971,000 kwh /yr. Installing collectors over 300 parking spaces will add 728,000 kwh/yr capacity for a total of approximately1.7 million kwh/yr. Solar production capacity in today’s terms will only produce about 25% of the building’s current needs.
Table Fac-1 Estimated Solar Budget
Total Area
SF
(A)
Useable (Roof ) Area (SF)
(B)
Solar Cell Efficiency
( C )
Solar Cell Area (SF)
(D)
Available Solar Energy (kwh)
(E)
Annual Production Converted
Electric Energy (kwh)
(F)
Typical Total
Facility Energy Use
(kwh)
(G)
Energy used as %
Avail. Solar
Energy
(G) / (E)
Combined Energy
used as % Annual
Production Converted (G) / (F)
Building 323,000 75,000 17% 54,000 9,331,853 970,886 6,880,193 74% 709% Parking 300
spaces 54,500 17% 40,500 6,998,687 728,143 ADD
Parking 42% 405%
Thus, system strategies involving energy should be two-fold:
1. Decrease energy consumption of building systems and occupants by 50%-60% 2. Increase energy production on site by 50%
Both strategies have optimized limits as the original building design will permit only so much change before it becomes cost effective to replace the entire facility. The limit of solar cell efficiency approaches 23%, which is only a 35% increase from current technologies. Systems based on direct thermal, geothermal, hydrogen or biodiesel would have to augment or replace photovoltaic sources. Additional discussion in the section on Mobility recommends electric power source for vehicles. This would be an addition to the total energy use calculated above thereby requiring larger renewable systems. If offsets are considered, such as buying green power or investing in off-site renewable energy projects, and regional transmission lines are efficient, an energy neutral building could be achieved in 25 years. Materials: Reduce, Reuse, Recycle, Re-design The three R’s of resource conservation still apply. First rule of the next 25 years is to reduce consumption. The greatest opportunity within the life of the facility is in those elements that

Pathways to Sustainability 32 Washington State Department of Ecology
change the most often, such as partitions, finishes, furniture, and supplies. These also have the most opportunity to be redesigned based on available technology and sources for new materials. Permanent partitions and fixtures should be assembled in such a fashion that they are easily disassembled for reuse or recycling. Finishes should be minimal, natural and non-toxic. Today there are adequate sources of paints, adhesives and sealants that are virtually free of Volatile Organic Compounds (VOC’s). Advanced materials will approach biological counterparts, serving more than one function at a time. For example, glass that allows views to the exterior while it shades and collects solar energy; walls that “breath” outside air yet are impermeable to water; and structural members that tell a computer if stresses have reached their limit. Recycled content will be the only ingredient in 95% of all replacement materials on the site. Water Budget For the facility to be sustainable, the water use for the building and site should not exceed the budget afforded by its “footprint” share of the watershed. This respects the balance of natural systems. Borrowing water from another site or watershed violates this balance. Olympia, Washington receives on average 51.4” precipitation annually. Based on an effective building roof of 92,000s.f. and a parking roof of 81,000s.f. the water budget is approximately 5,536,000 gallons per year. This is adequate water for all building processes. On site water treatment using Living Machine™* technologies can provide drinking water if needed. Systems to store, treat and distribute water will be required. Seasonal rainfall and future capacity requirements should be taken into account to size the system. All water will eventually return to the watershed as clean or cleaner than it arrived. Comfort – Health – Safety Human occupant requirements probably will not have changed a great deal in 25 years. What will change is the ability of the occupant to control those qualities in the facility. Smart controls will be able to “learn” individual requirements and adjust the local climate to their needs, within the parameters of the overall system. Self-analyzing systems will monitor the building structure before, during and after seismic events. Other monitors will be able to sense levels of air pollutants and adjust ventilation before they become hazardous. The ultimate outcome is to improve the ability of the individual to perform the task at hand. Implementation and Education The process and procedures followed to achieve the 25-year Facility goals will allow the Department of Ecology to assess many new construction and building operations methods. These systems and practices will be applicable not only to Ecology’s future facilities but to buildings of similar use in the entire state of Washington. Careful documentation and tracking of the results of the Facilities pathways will serve as valuable information for the next generation of designers and builders. The results will also provide an excellent source for educators and researchers studying the performance and materiality of buildings. Vision for Sustainability in 2025 Human comfort, health and performance will be the primary function of the facility. The building will produce, on site, 100% of all energy that it needs using no fossil fuels. An integrated power system will coordinate the most efficient use of energy to run every system
* Living Machine™ is a trademark of Living Machines, Inc. (http://www.livingmachines.com/htm/home.htm).
Pathways to Sustainability 33 Washington State Department of Ecology
from telecommunications to HVAC to the vehicle fleet. Waste energy will return to the system. Every product used in the facility will be healthy and non-toxic. Air and water will leave the site cleaner than it arrived. Daylight and the sounds of nature will prevail, in the interior spaces as well. Products based on biological systems will have been replaced in systems that once relied upon chemicals or excessive power to function. The building facility will support the natural habitat, and will host its share of wildlife that would have been typically displaced in the course of construction Strategies for Achievement of Vision • Reduce energy consumption by replacing active (mechanical) systems with passive
(natural) systems that achieve the same purpose • Produce energy on site using available renewable sources: wind, solar, geothermal • Reconnect to habitat corridors and restore open space to predevelopment standards. • Treat all wastewater on site to tertiary or better levels. • Recycle or reuse all materials as they are replaced in the facility. • Require materials safety and data sheets (MSDS) for all materials arriving on site. • Provide all employees with a “drivers” manual that instructs them on how the building
facilities work together. • Employ Life Cycle Assessment and Costing in all decisions. • Identify and Review Life Cycle Assessments of all major supply streams every 5 years
minimum. • Establishment of permanent Facility Review sub - committee to monitor progress of
sustainability for building and site • Facility Committee prepares action plan from 25 –Year Framework. Review every 5
years minimum. • Continued coordination with progress in Mobility, Communications, Resources and
Impacts groups For the year 2005 Assumptions • First five years uses available technologies • Local utilities accept reverse metering at fair market prices • Assume a 75-year structure in the absence of seismic activity. • Codes and standards are unchanged though performance based rulings are becoming the
norm. • Community recycling facilities are available for most common materials (80% waste
stream.) Changes in Technology and Practice Shelter
Site Landscape for reduced heat island effect, improved water quality and replacement of soils • Increase shading of paved surfaces • Install composting facility for landscape waste Exterior Lighting to reduce off-site impacts and bird migration disruption
Pathways to Sustainability 34 Washington State Department of Ecology
• Eliminate direct beam visibility of all lights off site Building Envelope (cladding, insulation, glazing, windows and doors)
• Improve thermal performance of envelope elements by 20% Power • Reduce energy demand by 5% • Install reversible metering equipment
Comfort-Health-Safety
Natural Ventilation • Replace 10% fixed glazing with operable vents or lights. Lighting/Daylighting • Replace light fixtures with a system that will accept next 10 – year technology • Adjust systems furniture heights to allow views to exterior from all occupied
spaces Water Conservation and Quality • Plan and design a Living Machine™ to accommodate building, site and
appropriate share of watershed. • Increase capacity of water storage on site to accommodate annual building water
budget. Interiors
Finishes and Materials • As spaces are remodeled, replace permanent walls and partitions with reuseable,
demountable components. • Identify and eliminate components that contain toxics.. Furnishings and Supplies • Eliminate all toxic substances in office supplies Cleaning and Maintenance • Establish and Maintain interior landscapes for air quality • Switch to biodegradable and non-toxic cleaning agents. • Install monitors for C02, CO, and particulate levels in all occupied spaces.
For the year 2010 Assumptions • Assessment and Selection of renewable power system • Utility grids are moving to parallel power technology. • Ecology Facility reduces need for parking 10%-20% through Mobility and
Communications Policies • Completion of water treatment system (Living Machine™). Local jurisdiction allows
Living Machine™ technology to replace municipal water treatment Changes in Technology and Practice Shelter
Landscape

Pathways to Sustainability 35 Washington State Department of Ecology
• Replace HPS parking lighting with color balanced HID and reduce number of fixtures for energy efficiencies
• Replace all vegetation with low water indigenous species. Building
Envelope (cladding, insulation, glazing, windows and doors) • Integrate operable windows with mechanical system to optimize system
operations • Integrate green house/Living Machine™ or double skin glazing at south façade in
design to capture passive solar energy. • Reduce building energy demand by an additional 5% • Replace and improve current roof moisture barrier anticipating solar panels • Add Eco Roof to ‘cool’ roof, reduce stormwater runoff, improve water quality Power
Comfort-Health-Safety
Passive (non mechanical) Ventilation / Cooling • Replaced fixed skylight glazing at spine of building with operable units to
increase natural ventilation capacity Lighting/Daylighting • Increase reflectivity of ceiling surfaces to 95% or better • Improve light transmissivity in vision glazing to minimum 75% • Provide views to exterior glazing from 90% of occupied spaces Water Conservation and Quality • Complete Construction of Living Machine • Begin replacement of plumbing system in building to allow non-potable water use
in toilets Digital/Telecommunications • Add digital control systems to adjust building metabolism to population and time
of day. • Add Measurement and verification software to monitor building systems
performance.
Interiors • Eliminate all toxic substances in finish materials. • Purchase 60% ( weighted average) renewable or recycled content for 80% of all
new construction materials. Furnishings and Supplies • Review office copy technology, replace equipment that does not meet or exceed
current Energy Star standards and that does not emit toxic substances • Purchase 100% renewable and recyclable materials for 60% of major office
supplies Cleaning and Maintenance • Install energy efficient central vacuum system with HEPA filtration
For the year 2015

Pathways to Sustainability 36 Washington State Department of Ecology
Assumptions • Renewable Power system fully implemented at facility • Treat all building wastewater on site. • 60% Energy demand is met by on-site sources Changes in Technology and Practice Shelter
Landscape • Replace impervious surfaces with pervious pavers or plantings Stormwater • Disconnect stormwater system from municipal infrastructure, connect to Living
Machine™ Structure • Excess parking structure is removed and replaced by natural habitat
Power • Reduce energy demand by an additional 10% • Prepare plan for integrated photovoltaic cells in glazing systems, building
cladding and roof coverings. Comfort-Health-Safety
Passive (non mechanical) Ventilation / Cooling • Test for additional ventilation paths through dynamic flow analysis. • Link natural ventilation to operation of Heating and Cooling systems. Heating and Cooling Systems • Replace fossil fuel powered systems with non-polluting, renewable sources. • Reduce and resize active (mechanical) systems. • Interlock operable windows with mechanical systems • Supplement air and water heating from mechanical process heat recovery, solar
collectors or fuel cell waste heat
Water • Direct all facility waste water to Living Machine™
Interiors
Furnishings and Supplies • Purchase 80% renewable and recyclable content materials for 90% of major office
supplies •
Cleaning and Maintenance • Maintain scheduled changes for all filters.
For the year 2020 Assumptions • Regional power grid has switched to renewable sources and delivery methods

Pathways to Sustainability 37 Washington State Department of Ecology
• Municipal water system allows design basis with natural watershed • 80% Energy demand is met by on-site sources Changes in Technology and Practice Shelter
Habitat • Restore regional links to wilderness and natural habitat Envelope • Replace building cladding and glazing with hybrid systems that provide multiple
services including: • Vision • Energy • Insulation • Ventilation
Power • Switch to non-polluting, renewable power source either on site or tying into off-
site sources. • Include power requirements for vehicles • Augment heating/cooling with geothermal (1 ½ Tons cooling = (1) 300 ft.
deep well. Comfort-Health-Safety
Heat and Cooling Systems • Integrate green house or double skin glazing at south façade to augment solar
energy gain. Digital/Telecommunications • Replace current networks with wireless systems to reduce material requirements.
Interiors
Furnishings and Supplies • Purchase 100% renewable and recyclable materials for 80% of major office
supplies For the year 2025 Assumptions • Power switch complete to combination of solar, geothermal, hydrogen • Regional power delivery grid accepts all facility power • Water leaving the site is as clean or cleaner than it arrived • Recycling is base operating mode of 90% business in U.S. • Energy demand is less than energy produced by facility • Prepare new Action Plan for next 25 years
Changes in Technology and Practice Shelter

Pathways to Sustainability 38 Washington State Department of Ecology
Structure • Integrate stress monitor system with structure Power • All facility power supply generated on site • Upgrade system-monitoring methods with controls, monitor points and software. • Track climate change impacts vs. building performance • Energy demand is reduced an additional 5%
Comfort-Health-Safety • Building environment is fully balanced with passive heating and cooling systems • Ventilation and daylighting are optimized with lighting and HVAC systems. • Facility is 100% flexible to individual/group comfort needs • Clean water from Living Machine™ supplies all building processes
Interiors Finishes are self cleaning or require only non-toxic, biodegradable cleaning products to maintain.

Pathways to Sustainability 39 Washington State Department of Ecology
Functional Pathway: Site & Landscape Background The site and landscape responsibilities and concerns of Ecology are defined here as all operations and maintenance of the landscape, as well as site selection and other land uses. In the case of the Lacey facility, this includes all treatments of maintained plants, soil and water on site, as well as impacts on the small on-site areas of forest. The Department of Ecology is making important progress in several related directions: the application of Integrated Pest Management (IPM) principles, regular composting of landscape wastes, low water use for irrigation, widespread use of native plants in maintained areas, and an on-site pond/wetland to filter run-off. However, we recognize that Ecology’s work is constrained by initial site construction and use, available technologies, and the practices of society as a whole. Accessibility, safety, and aesthetics Sustainability may not yet be definable in all of its details, but we know that Ecology’s buildings must continue to serve human needs of accessibility and safety. The building will still require roads and pathways, although they will certainly have to be adapted as described above. Safe lighting will still be present, but it should be provided in ways that do not create light pollution that interferes with nighttime habitat needs. These and other changes will create a building that looks different from what we see today; this shift will require changes in aesthetic norms and user expectations, certainly another gradual transformation. Our entrenched and often unconscious views of what a landscape is supposed to look like are a hurdle. Landscape plantings and appearance maintenance often have negative impacts because they attempt to serve and conform to inappropriate aesthetic norms. Above all, the conventional picture of a manicured landscape of groomed turf and fragile annuals may be a barrier to achieving sustainability goals. Such a landscape often demands high use of water, chemical, fossil fuel and even labor inputs, with enormous costs. And like any change in outward appearance, the shift to a more sustainable landscape selection may require concomitant changes in mindset and behavior. System maintenance – energy and chemical use Sustainable landscape maintenance will involve several key shifts. First and foremost, energy sources viewed today as “alternative” will become standard in powering maintenance equipment such as lawnmowers and blowers. Asphalts and paving (for parking and roads), coating (for pavement and asphalt maintenance), and hardscaping (e.g., of paths), today generally based on unsustainable extraction, will be replaced by pervious, non-toxic surfaces with lower impacts in production and natural resource use. The control of pests will be achieved without persistent toxic chemicals, using instead plant selection, landscape design and the application of natural pathogens or simpler, less toxic and biodegradable agents to achieve the same end. A variety of new products, materials selection and redesign of processes will make it possible to eliminate many other subtler but still significant impacts on the immediate physical environment. Leaks from cars and maintenance equipment, leachates from building materials

Pathways to Sustainability 40 Washington State Department of Ecology
such as PVC pipes, and contaminants introduced through bark mulch and other soil amendments are all harmful elements potentially introduced through conventional landscape maintenance and operations. Site layout and maintenance - impacts on ecosystems, water and nutrient flows A sustainable site will address its impacts on the local ecosystem and its constituent species, nutrient flows, water cycle and soil. Control of landscape structure and design controls the distribution and range of species. More benign alternatives to pesticides and cleaning agents will pose reduced or negligible threats to human and environmental health. Buildings and their environs will integrate emerging and existing technologies that clean water and air; examples can include Living Machines™, green roofs, raingardens and bioswales, and indoor vegetation. In a sustainable society, land use will be considered as an integral part of existing ecosystems. A sustainable human landscape recognizes the need to operate in harmony with and as part of the local habitat, water cycle and nutrient flows of its setting. It should seek a seamless interface with these natural systems, rather than wreaking oblivious havoc. Common current avoidable disruptions include: changes of quality and quantity of ground and storm water; interference in species activity and vitality from building structures, heat and light pollution, and the use of low-biodiversity and/or invasive plantings. Fortunately, there are opportunities to reduce negative impacts on the surrounding ecosystem while simultaneously reinforcing ecosystem services, often with off-the-shelf technologies that save money. Over the long run, site selection and the agency’s integration with the community’s land use patterns are key issues. Though less expensive in the very short run, choosing a greenfield site in the midst of suburban sprawl will inevitably require more employee driving. However, site selection can be restorative, either by selection of a brownfield or through simple projects to reforest denuded areas or replant damaged riparian segments. Vision for Sustainable Site and Landscape by 2025 Sustainable sites support all functions and services required of the resident human and natural systems. A sustainable site hosts the agency’s staff and workspace(s) while providing (and not interfering with surrounding) ecosystem services. Over time, the agency recognizes that landscape and site selection are inextricably linked. This pathway recognizes that a landscape should be primarily an ecosystem, not a human construct. However, there are always trade-offs, since a site must also meet human needs of comfort, building access, safety, and functionality. Landscape-based ecosystem services are the primary source of clean air and water, so the site has a responsibility to consider these impacts. In particular, air and water leaving the site should be as clean as or cleaner than when they arrive, or as clean as a comparable natural site. Strategies for Achievement of Vision
Habitat maintenance and/or restoration Maintenance and/or restoration of hydrologic functions Natural systems are restored to fullest extent possible, and connect to and are allowed
to be integrated with surrounding bioregion
Pathways to Sustainability 41 Washington State Department of Ecology
Planted areas approximate natural biodiversity for the site Native and/or well-adapted plantings are seen as preferable to the current form of
lawns and monoplantings Energy and water budgets regulated by (or set in consideration of) what flows through
or falls onto the site Opportunities for non-intrusive harvesting energy and water that flow through or fall
on the site are optimized Storm water is regulated and largely absorbed on site Graywater (separate from sewage/blackwater) is processed on site Sewage/blackwater is partially or fully processed on site (depending on feasibility,
and on the ability of surrounding human and natural landscapes to take it on) Employees and other site users have the opportunity to learn about and appreciate the
site’s harmony with the surrounding ecosystem Consider all of these issues in both new site selection and expansion (there are
adjoining parcels slated for future development) Zero use of toxic and persistent chemicals Hardscape materials with low embodied impacts in terms of energy, chemical outputs,
and other LCA categories Integrated water elements(?) and water management result in “transparent”
contributions of clean water to the watershed, mimicking pre-development conditions. Landscape design includes habitat shelter for a diverse population of non-dangerous
species In any new development, ecosystem services mimic pre-development conditions. Night lighting that eliminates or significantly reduces light pollution to surrounding
ecosystem Zoning and land use laws and guidelines that do not promote or allow for the
“overdevelopment” of a site, i.e., the site optimizes among competing needs for human uses and non-human ecosystem needs
(The site also has a capacity to contribute to food production. This potential use of the landscape is linked to food pathway that follows, so discussion is deferred to the next section.) For the year 2005: Assumptions:
Alternative pipe materials will be available at similar costs. Alternatives to virtually all pesticides, herbicides and fungicides that contain (or
degrade into) persistent bioaccumulative toxins will be available at similar costs. Living Machine™ prototypes are available to begin conceptualization process First five years uses available technologies Codes and standards are unchanged though performance based rulings are becoming
the norm. Changes in Technology and Practice:
In renovations and new construction, replace PVC pipe with HDPE or alternative materials that are non-toxic (in both manufacture and use)
Replace Round Up with natural herbicides, pesticides, Rodeo and others
Pathways to Sustainability 42 Washington State Department of Ecology
Begin long-term education and awareness-raising to build users’ appreciation for facility-ecosystem balance and understanding of the needs for future change
Increase shading of paved surfaces Install composting facility for landscape waste Eliminate direct beam visibility of all lights off site Plan and design a Living Machine™ to accommodate building, site and appropriate
share of watershed. Increase capacity of water storage on site to accommodate annual building water
budget. For the year 2010: Assumptions:
Alternative fuels and equipment are readily available at modest or negligible price premiums over conventional options
Technologies for pervious hardscaping and paving are well advanced and price-competitive
Ecology Facility reduces need for parking 10%-20% through Mobility and Communications Policies
Local jurisdiction allows Living Machine™ technology to replace municipal water treatment
Changes in Technology and Practice:
Updating, renovation and new construction of built spaces for regular use (roads, paths, parking areas, etc.) use low- or no-impact techniques that protect water quality and address storm water on site
The agency will assemble site-specific goals, indicators, and assessment processes for biological health and vitality, including such criteria as: air quality and impacts, habitat, water retention, carbon sequestration and/or total biomass, and photosynthesis and/or biological productivity
Replace HPS parking lighting with color balanced HID and reduce number of fixtures for energy efficiencies
Replace all vegetation with low water indigenous species. For the year 2015: Assumptions:
Treat all building wastewater on site. 60% Energy demand is met by on-site sources The rising price of real estate in southwest Washington will result in land use policy
and patterns that make sustainability goals more feasible to obtain: higher density, more integrated intra-regional transportation systems, and (possibly) land use laws to control urban and rural sprawl
Previous efforts to educate and inform employees will have created a high level of buy-in for updating of hardscaping, restoration projects, and other efforts that pursue sustainability goals while noticeably changing the experience for site users
Changes in Technology and Practice:
Pathways to Sustainability 43 Washington State Department of Ecology
Replace impervious surfaces with pervious pavers or plantings Disconnect stormwater system from municipal infrastructure, connect to Living
Machine™ For the year 2020: Assumptions:
Community planning has reached a certain state: neighborhood-, city- and county-level land use planning incorporates biodiversity and habitat concerns.
Municipal water system allows design basis with natural watershed Changes in Technology and Practice:
The pursuit of ecosystem support will become increasingly integrated with the efforts of surrounding municipalities, counties and other levels of community organization
For the year 2025: Assumptions:
Community land use has reached a certain state: neighborhood land use incorporate biodiversity and habitat concerns.
Water leaving the site is as clean or cleaner than it arrived Changes in Technology and Practice:
The agency meets all of its needs for additional space through landscape techniques and land use with no net negative impact on surrounding ecosystems. Additional site selection incorporates…
Land use patterns (including expansion at existing site and new-site selection) minimize the disaggregation of habitat, the disruption of vulnerable wildlife corridors, and other impacts on biodiversity.
Planted areas approximate natural biodiversity for the site
Pathways to Sustainability 44 Washington State Department of Ecology
Functional Pathway: Food Background Food operations for the Lacey facility of Department of Ecology are defined herein to include on-site food service, plus the parameters of employee behavior that affect the sustainability of the food consumed by employees during the workday. This means that Ecology takes some responsibility for the sustainability of food-related decisions by employees during the workday, including food wastes, and energy and materials used in food preparation, storage and service, and related wastes (e.g., packaging and sewage). In addition, as with other products, food has embedded sustainability impacts related to how food is produced, packaged and the transport mode and distance it requires to be shipped from where it is produced to arrive at the Lacey facility in edible condition. For example, under the present state of our knowledge about the links between food and sustainability organic food products grown locally are preferable to non-organic products from far away. In support of this fact the current food-service vendor at the Lacey facility on one occasion provided an all-organic meal at a special event that was quite well received. Over the long run, there will undoubtedly be significant changes in the US and international contexts for agriculture and food. Current agricultural production is already experiencing pockets of transition away from the use of industrial methods that consume intensive amounts of energy resources, freshwater, other renewable and non-renewable resources, and synthetic chemicals: the value of organic food is growing quickly (20-25% per year) while the total value of agricultural production is nearly stagnant; use of antibiotics in large-scale confinement production of livestock has recently been scaled back by several major producers; and farmers markets offering locally grown food products are enjoying a resurgence in many communities. Amplification of some of these trends will assist Ecology in achieving sustainability in food usage at Lacey. For example, as organic foods continue to become more price-competitive with non-organically grown foods, Ecology will switch away from non-organic foods that use fossil-fuel derived synthetic fertilizers; insecticides, herbicides and fungicides that often incorporate persistent, bioaccumulative toxics; and, in the case of confinement raising of animals, routine doses of antibiotics and hormones. In the case of persistent, bioaccumulative toxics, this switch will also support Ecology’s goal of eliminating use of these particularly threatening chemicals. In addition, however, in many cases market price signals will continue to favor less sustainable food products when choice criteria emphasize cost above other factors. Because some impacts of food production, such as soil depletion and release of toxics into the environment, are not well linked to costs incurred by food producers, and because methods for strengthening these links are often complex and always politically divisive, price signals will continue for some time to support non-sustainable food choices. For this reason, Ecology’s strategies should probably include exploration of innovative methods that attempt to recognize (“internalize”) some of the environmental and social costs that tend to be avoided by food producers. For example, encouraging substitution of organically and locally grown fruits, vegetables, and grains for meat and poultry can in many cases lead to a lower meal cost for the employee and a large step forward on the sustainability scale.

Pathways to Sustainability 45 Washington State Department of Ecology
One way to do this might be to distribute excerpts from the Union of Concerned Scientists’ study, The Consumer’s Guide to Effective Environmental Choices, in which impacts from the consumption of meat and poultry are compared against impacts from consumption of fruits, vegetables and grains, and impacts from non-organic foods are compared against impacts from organically grown foods. On the basis of this information, employees and visitors to Ecology’s Lacey facility may be encouraged to understand the benefits both to themselves and the environment of, say, providing more sustainable choices and fewer non-sustainable choices in food service offerings at the Lacey facility. Vision for Sustainability in 2025 Sustainable food provision means attractive, tasty food that contributes to the lives of healthy, happy, and sociable workers, and at the same time does not externalize food production costs onto future generations (e.g., through soil depletion and use of fossil-based energy resources), agriculture workers (e.g., through exposure to pesticides and herbicides), or the environment (e.g., through use of toxic substances and/or reliance on antibiotics and hormones to overcome natural constraints on livestock management practices). Furthermore, food options will not involve reliance on long-distance transport. To achieve this vision, externalized costs will need to be internalized – especially for transportation, crop production and livestock management. As a result, there will be a more explicit balance between the desire for consuming beyond one’s bioregion and respecting the impacts of long-distance food trade. Purchasing decisions will reflect environmental costs, but truer price signals will also produce better results from consumers. In general, food provided will be accompanied by information on standards of labor and environmental practices. In general, incentives will discourage waste and include otherwise external impacts. Methods to discourage waste will, for example, include variable portions options. In general, food will be a part of health – through both direct human diet impacts and less direct environmental impacts. In other words, people and the environment will be healthy as a result of what people are eating. Meat options will come from healthier animals, raised without antibiotics and growth hormones. Food production and agriculture will be conceived more and more in terms of ecosystems, rather than simply industrial nutrient flows, i.e., relationships rather than simply inputs and outputs. Food sustainability will also come in part from a set of relationships that link employees, institutional arrangements inside Ecology, and food vendors and producers. A stronger relationship component (as opposed to price-based market component) will naturally favor a shift to local and smaller production, and it will facilitate the provision of better options through distributors and food service contractors. Strategies for achievement of vision
Zero waste of food of in production, preparation and service. Reuse, rescue or composting of all food residuals Energy use in food production, preparation and service is from renewable sources Strategies and practices address nutrient flows, especially large net gains or losses by
the site as a food consumption location

Pathways to Sustainability 46 Washington State Department of Ecology
Seek packaging that is 100% reusable, compostable or recyclable, without downcycling (except in the case of composting); in the case of composting or recycling, life-cycle impacts are minimized
Target local and/or regional food whenever possible Use and support existing and emerging labeling and certification regimes, such as
organic, fair-trade, non-GMO, local/regional designations (e.g., Puget Sound Fresh); seek out cutting edge information and distribute to employees
Leverage existing work by sustainable food organizations (e.g., Chef’s Collaborative) Organically grown or other chemical-free food Non-GMO food (to address upstream impacts such as genetic drift) Free-range animals (fowls and fish (i.e., non-confinement animal agriculture) to
ensure meat is from animals raised in non-factory settings in order to avoid overuse of hormones and antibiotics, as well as serious point-source water, air and soil pollution.
Food purchasing that does not encourage habitat destruction through direct land-use conversion
Fair-trade food if not local, or other similar screen Cafeteria menus based on seasonal foods from local sources Use the cafeteria as a forum to get out information on food issues Partner with local producers (e.g., Community Supported Agriculture (CSA)
programs, possibly using cafeteria a CSA pick-up point) Employ life-cycle analysis and costing in all food purchasing decisions
For the year 2005: Assumptions:
Organic food more available than at present; price gap has fallen further. In general, conventionally produced food still enjoys a market price advantage. Since price signals still ignore or understate environmental costs embodied in food, it
may be necessary to subsidize or otherwise assist on-site food service to ensure better sustainability performance
Changes in Technology and Practice:
Use special occasions as an opportunity to create and promote preferred alternatives for sustainable meals and awareness of those alternatives
Optional self-imposed “eco-tax” in cafeteria used to fund more sustainable food options (including organic, fair-trade and local)
Require that the vendor provide organic alternatives (require a percentage or number of meals to meet clear criteria)
Provide helpful language for food service contractor and/or assistance in communicating demand for sustainable options to distributors and/or parent company (where applicable).
Develop and use language for RFPs and other contracts to communicate purchasing preferences regarding food and food packaging.
Start the education and awareness-raising process with “events” through the cafeteria and, when possible, involving local food producers.
Educate consumers about the eco-efficiency of different axes of food choice (imported vs. local, meat vs. non-meat protein sources, organic vs. conventional, confinement vs. free-range, fair-trade vs. sweatshop, etc.)
Pathways to Sustainability 47 Washington State Department of Ecology
Focus cafeteria information on easily understandable single-issue criteria (e.g., organic, free-range poultry, hormone and antibiotic-free meat, fair-trade, non-GMO, etc.) to build the still-weak food-environment connection in the minds of customers.
100% composting of pre-consumer food waste Begin educating consumers to compost properly
For the year 2010: Assumptions:
A wider variety of foods are available locally by using efficient information systems to communicate availability to consumers and large purchasers. (This information technology will help small local producers compensate for seasonality and smaller production/distribution scales.)
On-site food service (with better sustainability performance) may still require assistance or subsidy because of poor price signals in the economy as a whole
State agencies able to begin using joint buying power to get steady seasonal supplies for some organic and/or local offerings.
Changes in Technology and Practice:
Begin to establish detailed limits and thresholds to guide (but rarely dictate) vendor performance in cafeteria (i.e., preferred products and product classes, possibly a few banned products, e.g., only Dolphin-safe tuna)
More detailed information for cafeteria customers on which foods and options are from the local bioregion.
Begin to focus cafeteria information on ecosystem-level issues (i.e., crop production systems, supply chains, industrial organization of agriculture), rather than narrow single-issue criteria (e.g., organic, free-range, fair-trade, etc.).
100% composting of post-consumer food waste For the year 2015: Assumptions:
Virtually all food comes with some chain-of-custody information that allows selection on the basis of geography of origin, environmental performance, and/or labor practices.
Ecolabels and certification regimes will exist that credibly look “beyond organic” to deeper and broader criteria for describing agricultural impacts.
Changes in Technology and Practice:
On-site food purchases use more and more detailed screens (see assumptions above). Information technology (e.g., kiosks, wireless information, PDA-based information)
will provide more and better cafeteria and point-of-purchase information. Cafeteria will include conspicuous prompts that guide users to this information.
For the year 2020: Assumptions:
Pathways to Sustainability 48 Washington State Department of Ecology
Life-cycle inventory and assessment information on agricultural and food production will be generally available, at least for some crops in all regions and for regional agricultural production at an aggregate level.
Changes in Technology and Practice:
Continued building out of point-of-purchase information systems. For the year 2025: Assumptions:
Meals using local in and in-season will have finally been developed that are attractive and tasty.
Relative prices will be quite different because they will reflect ecological and human realities: so many local foods will be cheaper than imported foods (because of internalized transportation and energy costs) – move to 2020?
Transportation costs imbedded in food purchases reflect environmental costs of transportation and production energy, so local organic alternatives are cheaper.
Reliable supplies of organic foods are available locally, year around, through solar greenhouse technology. Many “tropical” foods are available in warmer months through local greenhouse production.
Social norms are such that people choose organic, living-wage/fair-trade/equitable/ sustainable food…
It will be illegal or prohibitively expensive to use the conventional agricultural methods of today.
There will exist a food system or regional food systems that operate in harmony with nature and that treat human beings with dignity and respect (i.e., there will be “sustainable food” available)
Changes in Technology and Practice:
Year-round local/bioregional food production will supply a share of on-site food that meets or exceeds the local/bioregional share of the local food market.
100% of food meets rigorous sustainability criteria, meeting such current standards as organic, living-wage/fair-trade, some measure of localness, etc.
All pre- and post-consumer wastes processed on site for use on site or locally (preferably for food production to meet on-site demand, i.e., closed nutrient loop)
Pathways to Sustainability 49 Washington State Department of Ecology
IV. Implementation Preview and Payback Analysis Tools
In choosing among options to advance toward sustainability along each pathway, as well as choosing among options on different pathways, Ecology will likely find it useful to use some sort of analytical tool for ranking those options. Payback and discounted present value are two techniques often used to compute a single number that represents the value of flows across time in monetary costs and benefits. Payback analysis is most easily used to analyze an option involving an up-front, lump-sum expenditure that yields a future stream of cost reductions or revenue increases. The number of months or years required for those future benefits to equal, i.e., pay back, the up-front expenditure is the payback for that option. Discounted present value (sometimes called net present value) is a more sophisticated way to compute the payback or return from an investment, because it takes into account the time value of money. Discounted present value also more easily handles investment and cost streams that include future expenditures in addition to the single up-front outlay. The cost-benefit analysis of flat panel versus cathode ray tube (CRT) monitors for computers, discussed in the Model 2 - Payback Analysis for Flat Panel Computer Monitors subsection below, provides an example of the advantage of using discounted present value rather than payback analysis. In this example the warranted lifetime for the flat panel is five years versus three years for the CRT, so that there are additional outflows of money to buy a new CRT at the end of years three, six, nine and twelve and a new flat panel at the end of years five and ten during the fifteen year time period that one needs to consider in this cost-benefit analysis. Both payback and discounted present value techniques are illustrated in the three payback models created for Ecology’s use by this Sustainability Pathways Project. But an important modification has been made to the traditional way of doing these payback and present value analyses. For purposes of ranking options along sustainability pathways it is imperative that these techniques be augmented to include environmental, ecological, and social costs and benefits that are not reflected in ordinary monetary cost-benefit flows. This is especially critical for pathway options that may involve an up-front or ongoing expenditure(s) that is not paid back or does not result in a positive net present value for ordinary market-based monetary costs versus benefits. That expenditure(s) may turn out to be justifiable on the basis of non-market environmental, ecological and social benefits that do not get reflected in the monetary revenues that measure benefits in traditional payback and present value analyses. At the same time as we recognize the critical importance of including these environmental, ecological and social costs and benefits in the payback analysis, we also must emphasize the inherent difficulties in quantifying environmental and other impacts and providing a valuation of those impacts in money terms. It is the absence of many environmental, ecological and social costs in the economic calculus that often pushes us away from sustainability when we make decisions solely on the basis of traditional monetary costs and benefits. Yet marketplace prices/costs provide a basis for characterizing costs and benefits that is universally accepted. Environmental impacts, e.g., CO2 from the tailpipes of our fossil fuel consuming cars, that are not reflected in marketplace costs and prices are much more
Pathways to Sustainability 50 Washington State Department of Ecology
difficult to express in monetary terms that are acceptable to everyone. Ecological impacts such as a decline in biodiversity or ecological system productivity, and social impacts such as decreased access to natural, wild places, are even more problematic to measure in monetary terms. Nevertheless in order to provide payback and discounted present value analyses that illustrate how one might incorporate some of those controversial estimates, the payback models created by this project for Ecology all include both traditional costs and benefits and environmental costs and benefits expressed in monetary terms for pollutant releases.
Model 1 – Payback Analysis for Fuel-Efficient or Alternatively-Powered Vehicles The first payback model created for Ecology involves comparing various options for the Departments vehicle fleet against a current baseline vehicle. The model is an Excel workbook that allows the user to enter vehicle type, cost, fuel type (gasoline, diesel, biodiesel, and electricity) and efficiency for a proposed new vehicle and the same information for the current Ecology fleet baseline vehicle, assumed for purposes of this exposition to be the Ford Taurus 4-door sedan. The user must also enter forecasts for gasoline prices over the life of the vehicles. In the current version of the model, Ecology fleet cars are assumed to last four years. The user also enters data on city and highway miles driven per year, the type of fuel that each vehicle uses, and the discount rate that reflects Ecology’s interest rate on borrowings or some other interest rate that portrays the time value of money for the agency. A printout of the user data entry spreadsheet and resultant payback and present value calculations is provided in this report (see Appendix C) for the comparison of the Toyota Prius 4-door sedan hybrid electric vehicle (HEV) against the baseline Ford Taurus. The assumptions used in the scenario shown are:
• Gas prices increasing from $1.70 in the first year to $1.85 per gallon in the fourth year, with increases in nickel increments. This time path for gasoline prices might be termed the gradually rising gas price scenario.
• 5,000 city miles and 20,000 highway miles annually, based on Ecology estimates of average use for fleet vehicles. If specific vehicles were restricted to specific uses, e.g., in-town only or highway only, then the user would modify these city versus highway mile assumptions accordingly.
• Discount rate of 3.0%. This is a low-side estimate of the long run real cost of money. Inasmuch as future prices used in all the payback model examples are expressed in today’s dollars (i.e., assuming no general price level inflation), the discount rate should be stated in real terms. One way to approximate the real interest rate is to subtract the current inflation rate from Ecology’s current borrowing cost. Other considerations might also go into the actual number used for the discount rate. For example, it might be set below Ecology’s current real borrowing cost in order to reflect a preference for investing in the future for a project in which there is no other way to reflect the monetary value of future ecological or social benefits that are projected to flow from the current investment.
Pathways to Sustainability 51 Washington State Department of Ecology
Given these assumptions the Prius has a payback of 1.9 years and a $1,605 positive present value on strictly traditional money costs terms as a result of investing an extra $1,545 to purchase the Prius versus the Taurus. The payback is the result of the Prius’ 52 city and 45 highway MPG versus the Taurus’ 18 and 27, respectively. For all-city use the Prius’ payback would be even higher due to the Prius’ extremely high in-city gas mileage. The vehicle payback model also shows the additional value realized on the investment due to the reductions in air emissions that result from the Prius’ higher fuel efficiency.5 In addition, it would be desirable to include any increase or decrease in environmental impacts from production of the Prius versus the Taurus – for example, as a result of possible lower materials use in the Prius and/or as a result of possible additional use of toxic materials for the Prius’ battery system. One would also want to account for reductions in emissions to water and land, and reductions in air pollutants other than the ten provided in the payback model, from the Prius’ greater fuel efficiency. However, current available environmental impact assessment models, e.g., Carnegie Mellon’s EIO-LCA model described earlier in this report, rely on product price to calculate environmental impacts from production. In the case of low-production-volume, alternatively- powered vehicles the car’s higher price is likely to reflect lack of attainment of mass production volumes rather than indicating higher environmental impact. Thus, that additional piece of the environmental impact puzzle is not currently included in the vehicle payback model. Finally, data on life cycle impacts from fuel use in terms of emissions to water and land, and emissions of the many other pollutants currently tracked, for example in EPA’s Toxics Release Inventory, were not readily available to the sustainability project team. As credible estimates become available on other pollutant releases related to fuel consumption they also should be included in the environmental paybacks considered by the model.
Model 2 – Payback Analysis for Flat Panel Computer Monitors The second payback model created for the sustainable pathways project compares flat panel computer monitors that have a five-year warranted lifetime against regular CRT monitors that have a three-year warranted lifetime. The model compares investment costs and electricity consumption for these two monitors over a fifteen-year period. The fifteen-year period is the shortest time over which one can compare costs and benefits for these two monitors without having to make an assumption about what the resale value of one or the other monitor type would be if it were sold prior to the expiration of its warranty. The model assumes that monitors have no resale value at the end of their warranted lifetime. The user enters monitor price and electricity consumption data, annual hours of use, projected electricity prices for fifteen, and the discount rate. On the basis of these inputs the model computes payback and present value of the energy savings associated with the lower energy intensity flat panel monitor. The model computes both ordinary and augmented payback and
5 Reductions in emissions in the payback models are valued at the midpoint between low and high estimates on environmental costs for emissions that have been published in the literature on life cycle analysis.
Pathways to Sustainability 52 Washington State Department of Ecology
present value, the latter based on estimates of atmospheric, waterborne and land pollutant emissions reductions provided by the lower energy use of the flat panel monitor. The model does not at present provide an environmental comparison of the production impacts of the two types of monitors. It also does not provide an estimate of the environmental benefit of lower hazardous materials disposal, e.g. lead, at the end of a monitor’s life that is a result of replacing a CRT with a flat panel monitor. Despite lack of information on what may be some valuable additional benefits from its use, the flat panel monitor has a payback of 3.4 years and a net present value over fifteen years of $215. These figures are not changed when pollutant releases are taken into consideration. Energy savings of about 120 kilowatts per year, while significant in terms of costs for electricity versus the additional cost for the flat panel monitor, are not significant in terms of reduced pollutant releases, at least at today’s estimates for environmental costs of these releases. The reader should also note that 3.4 years for payback is an unreliable estimate of the monetary benefit of switching to flat panel monitors. That figure arises from the additional outlay required to buy a new CRT at the beginning of year four, as well as the assumption in the payback calculation that cost and benefit flows all occur evenly over the course of each year. This is an assumption used to simplify calculation of number of years until payback, but it amplifies the distortion in the estimate of payback period in this case of two monitors that have different warranted lifetimes. The net undiscounted cash balance actually fluctuates between negative and positive forever, being negative until the outlay at the beginning of year four for a new CRT, then positive until the outlay for a new flat panel monitor at the beginning of year six, then negative again until the outlay for a new CRT at the beginning of year seven, then positive until outlay for a new flat panel at the beginning of year eleven, then negative until purchase of a new CRT at the beginning of year thirteen, and so on. There never is a definite number of years at which the decision to invest in a flat panel monitor results in a flow of costs and benefits that becomes once and for all future time positive. Hence the need to use discounted present value to evaluate this type investment.
Model 3 – Payback Analysis for On Site Solar Panels The third payback model compares on site solar panel installation and generation of electricity against continued purchases from the northwest power grid. The user enters projected costs per kilowatt of installed capacity, expected hours of panel generation, projected prices for purchased electricity, and a discount rate. The model then computes payback and net present value over a twenty-five year time period, the warranted lifetime of the typical solar panel. The model provides an estimate of some of the likely environmental benefits from reduced use of off site electricity generation, due to the lower consumption of fossil fuels in generating power. But the model does not compare the environmental impacts of producing solar panels versus producing capital equipment needed to generate electricity off site. The lack of data on life cycle impacts of capital equipment is one of the areas still in need of substantial research in the field of lifecycle analysis.

Pathways to Sustainability 53 Washington State Department of Ecology
Assuming that electricity prices rise by two cents in each of the next ten years and then remain at $0.26 per kilowatt hour, and that a $7,000 investment will install a solar panel that generates 2,200 annually, solar panels have a 16.5 year payback period and a net discounted present value of $805. The environmental benefits from reduced off site power generation add a significant amount to the savings associated with avoiding the purchase of electricity from the northwest power grid, decreasing the payback period to 13.8 years and increasing the net present value over the panel’s twenty-five year warranted lifetime to $2,761. Of course, a radical near term spike in electricity prices would increase the benefits of solar panels substantially. On the other hand, growth in electricity prices at less than two cents per kilowatt hour annually over the next ten years would reduce these benefits. For example, if electricity prices rise at two cents per year for only five years before flattening out, the payback on strictly monetary terms increases to 21.8 years and the investment has a negative present value over the twenty-five year panel warranty period.6 The investment in on site solar remains positive when credit is given for the reduction in emissions as a result of buying less electricity from the northwest power grid.
6 Differing results for the payback analysis and the present value analysis in this case illustrate the impact of taking the time value of money into account. At a zero discount rate, the net present value turns positive at the point in time of payback. At 3.0% the net present value is negative even after twenty-five years.

Pathways to Sustainability 54 Washington State Department of Ecology
Appendix A. Life Cycle Thinking, Major Impacts, and Setting Priorities (An introduction to the methods used to assess Ecology’s environmental impacts) How is it possible to understand all of the social and ecological impacts of our daily actions? At times, this task can seem overwhelming: dozens of different activities and just as many particular angles to consider, from climate change and acid rain, to deforestation and water pollution. This document is a primer for the methods used in the first chapter of the report from the Pathways Project. In particular, the goals here are: • To show how we translate information on our actions into information on our impacts • To explain how we make sense of this information on our impacts, and • To show how we use this information to set priorities
From Actions to Impacts Our first step is fairly simple: we know what we do, but we have to figure out what impact that has. The Pathways Project therefore began with a comprehensive list of the activities that Ecology is responsible for. These included: • Electricity and natural gas use • Driving (for work-related purposes) • Paper and other office supplies • Computers and printers • Furniture • Water and sewage • Building and grounds maintenance
These activity categories appear to capture the vast majority of what Ecology does on a day-to-day basis. While they all serve necessary functions, Ecology’s daily activities also cause ecological impacts of various kinds. Further, before we assessed each activity’s impacts, it was impossible to know which activities had bigger impacts than others. So, we needed ways to measure and compare impacts from each category of activities. There are two parts to the method we used: • Life cycle perspective --thinking across all stages in the cycle of life for products and
services • Impact categories classification – organizing impacts into categories that capture the
most important ecological repercussions from each of Ecology’s activities The combination of these two parts in our research methodology is very powerful. We consider each area individually. Life cycle perspective First, a life cycle perspective means considering all stages in the life of a particular product, from the raw materials and processing necessary to manufacture it, through its use and final disposal. The figure below depicts the product life cycle. From the standpoint of
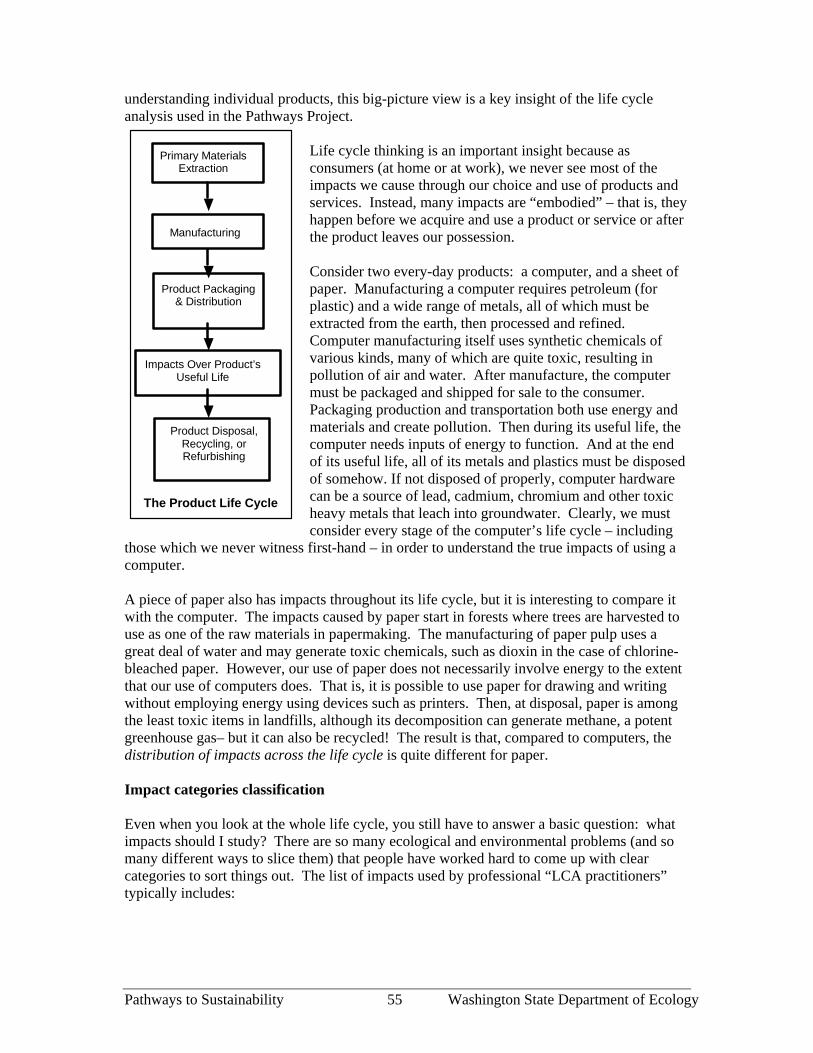
Pathways to Sustainability 55 Washington State Department of Ecology
understanding individual products, this big-picture view is a key insight of the life cycle analysis used in the Pathways Project.
Life cycle thinking is an important insight because as consumers (at home or at work), we never see most of the impacts we cause through our choice and use of products and services. Instead, many impacts are “embodied” – that is, they happen before we acquire and use a product or service or after the product leaves our possession. Consider two every-day products: a computer, and a sheet of paper. Manufacturing a computer requires petroleum (for plastic) and a wide range of metals, all of which must be extracted from the earth, then processed and refined. Computer manufacturing itself uses synthetic chemicals of various kinds, many of which are quite toxic, resulting in pollution of air and water. After manufacture, the computer must be packaged and shipped for sale to the consumer. Packaging production and transportation both use energy and materials and create pollution. Then during its useful life, the computer needs inputs of energy to function. And at the end of its useful life, all of its metals and plastics must be disposed of somehow. If not disposed of properly, computer hardware can be a source of lead, cadmium, chromium and other toxic heavy metals that leach into groundwater. Clearly, we must consider every stage of the computer’s life cycle – including
those which we never witness first-hand – in order to understand the true impacts of using a computer. A piece of paper also has impacts throughout its life cycle, but it is interesting to compare it with the computer. The impacts caused by paper start in forests where trees are harvested to use as one of the raw materials in papermaking. The manufacturing of paper pulp uses a great deal of water and may generate toxic chemicals, such as dioxin in the case of chlorine-bleached paper. However, our use of paper does not necessarily involve energy to the extent that our use of computers does. That is, it is possible to use paper for drawing and writing without employing energy using devices such as printers. Then, at disposal, paper is among the least toxic items in landfills, although its decomposition can generate methane, a potent greenhouse gas– but it can also be recycled! The result is that, compared to computers, the distribution of impacts across the life cycle is quite different for paper. Impact categories classification Even when you look at the whole life cycle, you still have to answer a basic question: what impacts should I study? There are so many ecological and environmental problems (and so many different ways to slice them) that people have worked hard to come up with clear categories to sort things out. The list of impacts used by professional “LCA practitioners” typically includes:
Primary Materials Extraction
Manufacturing
Impacts Over Product’s Useful Life
Product Disposal, Recycling, or Refurbishing
The Product Life Cycle
Product Packaging & Distribution

Pathways to Sustainability 56 Washington State Department of Ecology
• Acid rain (acidification) • Depletion of the ozone layer • Pollutants that contribute to smog • Climate change (or global warming) • Nutrient run-off from agriculture and other sources
that contribute to eutrophication • Toxicity to humans • Toxicity to the non-human environment • Destruction of natural habitat • Depletion of non-renewable natural resources • Indoor air quality
List of life cycle assessment categories often used in professional life cycle
assessments
Don’t worry: we won’t look at every single one of these right now! But the Pathways Project did consider seven categories. We list them here, and then use two of them in our discussion below. The full list: • Greenhouse gases (or climate change impacts) • Common air pollutants • Toxic air pollutants • Common water pollutants • Toxic water pollutants • Water use impacts on habitat • Land use impacts on habitat
Chapter 1 assesses impacts of Ecology’s operations in terms of all seven categories. In the section below (on the automobile), we consider two categories as we go through our examples: greenhouse gases and toxic air pollutants. Combining Life cycle Thinking with Impact Categories: The Conventional Automobile A familiar example can show us how important it is to consider all life cycle stages and multiple impact categories. Consider the graphs below, which show two impact categories (greenhouse gas emissions and toxic air pollution) for five main parts of the automobile life cycle. The life cycle stages considered are: • Manufacturing of the car • Service and insurance over the car’s life • Energy consumption during the car’s life
We also include a “stage” that actually happens throughout the life of an individual car, but which we treat separately because it is functionally separate from other stages: • The “fuel cycle” (the mining of petroleum, its refining, and its distribution to
consumers) So where do these two impacts – emissions of greenhouse gases and toxic air pollutants -- fall in the life cycle of the car? The left-hand pie chart shows the distribution of greenhouse gas emissions across the life cycle, with greenhouse gas emissions being indicated by energy usage in the various stages of a car’s life. Unsurprisingly, most of the global warming impact

Pathways to Sustainability 57 Washington State Department of Ecology
occurs during the useful life of the car – that is, in the gas that the car burns over its years in service. There is clearly some energy used in the manufacturing of the car and in the provision of fuel, but those (and the other two categories) come to less than one-fourth of the total greenhouse gas impact. Toxic air pollution, however, is a different story, as indicated by the right-hand pie chart. This category includes lots of persistent chemicals emitted in manufacturing processes that involve high temperatures and lots of materials, as well as the nastier things from burning gasoline (such as hydrocarbons and other byproducts of combustion). For these pollutants, the manufacturing stage is clearly the most important source, accounting for about two-thirds of the total. Fuel consumption during the car’s useful life is most of the rest, but far less than manufacturing. This example is helpful because it demonstrates the basic insight from using life cycle thinking and multiple impact categories: different parts of the life cycle have different impacts, so we need to look at all major life cycle stages and all major impact categories. Making Sense of Impact Information The development of categories for measuring ecological impacts substantially reduces the number of factors that one must compare when trying to judge relative ecological impacts of various products or activities. For example, gases that cause global warming include carbon dioxide (CO2), methane (CH4), nitrous oxide (N2O), perfluorocarbons (PFCs), hydrofluorocarbons (HFCs), and sulphur hexafluoride (SF6). These gases each contribute to global warming in different intensities, and these intensities can be compared through carbon dioxide (or carbon) equivalent multipliers. Using these multipliers one can then add releases of all these gases over the life cycle of a product together and compute an index number that measures that product’s global warming (climate change) potential. In this way the impacts on climate change caused by releases of many pollutants can be summarized in one index number.7 Similarly, by using weighting or indexing multipliers one can also combine releases of many pollutants into index numbers that measure those pollutants’ impacts in terms of acid rain potential (acidification), depletion of the ozone layer, smog formation, climate change (or global warming), release of nutrients to waterways and water bodies (eutrophication),
7 The International Panel on Climate Change (IPCC) carries out or reviews scientific assessments on pollutants that have the potential to cause global warming. Based on these scientific studies the IPCC has identified the list of greenhouse gases and compiled provisional best estimates of the global warming potential weights for releases of each pollutant. For example, in terms of CO2 equivalents methane has a global warming potential weight of 24 and nitrous oxide a weight of 360 compared with carbon dioxide’s weight of 1. See, for example, International Panel on Climate Change, IPCC Second Assessment – Climate Change 1995: A Report of the Intergovernmental Panel on Climate Change, 1996.
Energy Use Toxic Air Pollution
Automobile Impacts, by life cycle stage
Pathways to Sustainability 58 Washington State Department of Ecology
contribution to toxicity to humans, contribution to toxicity to the non-human environment, and indoor air quality, to mention several of the most scientifically researched indices. But development of a handful of impact categories still does not eliminate the need to compare indices for each of the basically incomparable impact categories when trying to rank products according to their ecological impacts. That is, impact categorization reduces our difficulties in comparing impacts down from hundreds or thousands of pollutant releases to a handful of impact category indices, but still leaves us needing to somehow assess which impact categories matter more, and which less. Using Dollars as a Common Denominator: Environmental Impacts as Costs It is important to understand how we might compare across impact categories. That is, how do we decide how bad, for example, a certain amount of toxic water pollution is relative to a certain amount of smog? Of course, there is no easy, absolute answer. But one common method (which is used in Chapter 1) is to translate these impacts into costs. This typically means costs in terms of direct impacts on current or near-term human health (such as increases in cancer rates or asthma) and economic activity (such as lower soil fertility in agriculture). Such numbers are hard to come up with, but even rough estimates can help us identify areas that deserve attention. Keep this method of prioritizing in mind when you read Chapter 1 of the full report. Setting Priorities One of our main goals with this analysis is to figure out where to put time and energy in order to make Ecology (or any organization) more sustainable. The process and thinking described above can be summed up as follows: • We decide what impacts matter (impact categories classification and ranking) • We look at all of the impacts of our actions and the products we buy (life cycle
thinking) Chapter 1, Assessing Ecology’s Impacts, of the Pathways Project report provides a foundation for using this information to understand which of the agency’s activities matter most. Identifying Major Challenges: Advice For Reading Table 1 of Chapter 1 As is explained in Chapter 1, the main challenges for Ecology emerge clearly. Chapter 1 explains its results in some detail, but a reader might use a few simple strategies to best absorb the results presented in Table 1 on the final page of Chapter 1. (Note that the highest score in each impact category row is bold underlined print, and the second highest score is in italicized underlined print.) • Look in columns (activities) for groups of high scores. As you glance quickly across
the rows of Table 1, you can see that a few key activities take in most of the high scores. In fact, just two – electricity and driving – account for about half of the top scores. This means that a serious sustainability effort should include these activities from the beginning, even if initial change is slow or small.
Pathways to Sustainability 59 Washington State Department of Ecology
• Look in rows for major issues. Apart from key activities, it is also important to look at key issues, such as climate change or habitat destruction. For example, climate change impacts (as measured by greenhouse gas emissions) come mainly from certain activities.
• Use the comparison numbers for a sense of scale. The numbers (which in several of the rows of Table 1 are dollar values that attempt to express the true cost of impacts, while in the remaining rows they measure pounds of pollutant emissions, sometimes summarizing emissions of different substances in terms of a common denominator such as CO2 for greenhouse gases) are a tool for figuring out which impacts are “big” and which are “small”. Of course, the numbers should not be read literally; the complicated methodologies used to calculate these impacts are not always very precise, sometimes because data are not available for a given impact from a given product or service. But when all of the methodologies agree that one impact or activity is bigger than others, we should pay attention.
• Don’t wait for “more information” to take action. The bottom line: we need to act on our information, no matter how imperfect it may be. We do not have data for all impact categories or activities, and we probably never will. Nonetheless, when we have well-informed hunches or partial data, we should use those to inform our actions.
Putting the Framework to Use: Comparing Two Similar Products Let’s compare, for example, a flat-screen LCD (liquid crystal display) monitor with a standard monitor based on the CRT (cathode ray tube) – a common set of options faced by computer hardware purchasers today. In particular, we begin our comparison by looking across the life cycle of the two products, noting differences at each stage. (For simplicity, we make combined notes for each stage, rather than breaking down each stage by impact categories such as climate change, air pollution, habitat destruction, etc.)
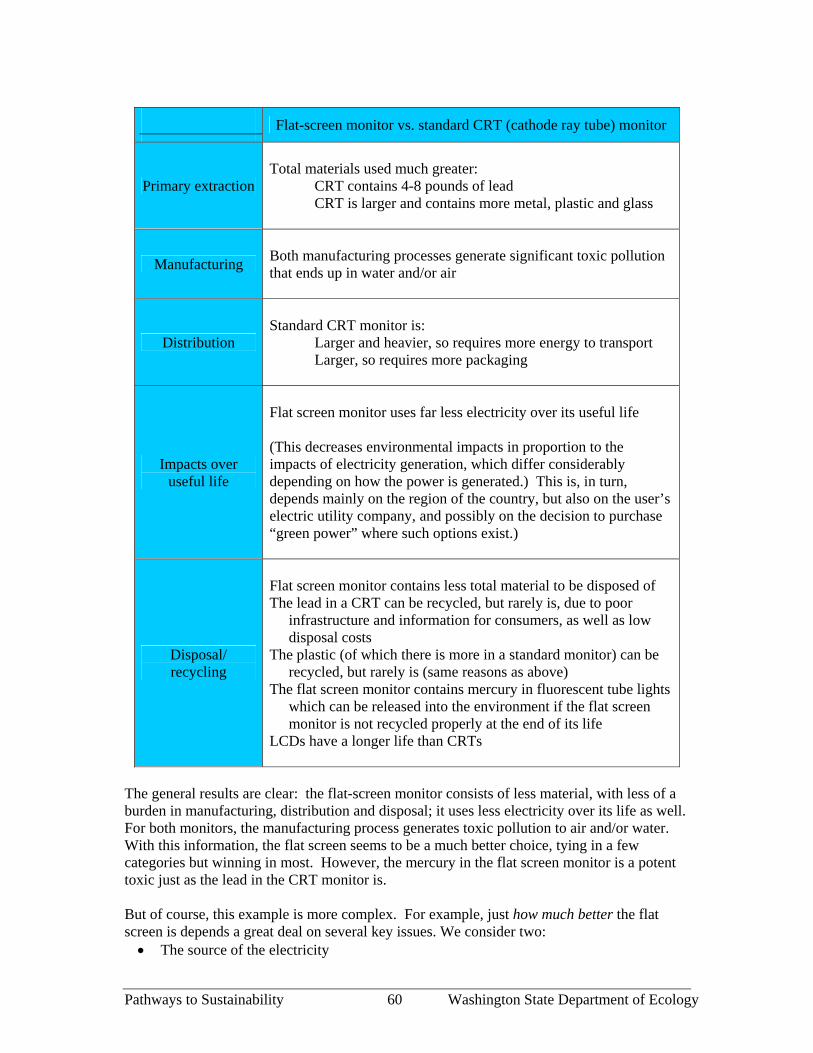
Pathways to Sustainability 60 Washington State Department of Ecology
Flat-screen monitor vs. standard CRT (cathode ray tube) monitor
Primary extraction
Total materials used much greater:
CRT contains 4-8 pounds of lead CRT is larger and contains more metal, plastic and glass
Manufacturing
Both manufacturing processes generate significant toxic pollution that ends up in water and/or air
Distribution
Standard CRT monitor is:
Larger and heavier, so requires more energy to transport Larger, so requires more packaging
Impacts over useful life
Flat screen monitor uses far less electricity over its useful life (This decreases environmental impacts in proportion to the impacts of electricity generation, which differ considerably depending on how the power is generated.) This is, in turn, depends mainly on the region of the country, but also on the user’s electric utility company, and possibly on the decision to purchase “green power” where such options exist.)
Disposal/ recycling
Flat screen monitor contains less total material to be disposed of The lead in a CRT can be recycled, but rarely is, due to poor
infrastructure and information for consumers, as well as low disposal costs
The plastic (of which there is more in a standard monitor) can be recycled, but rarely is (same reasons as above)
The flat screen monitor contains mercury in fluorescent tube lights which can be released into the environment if the flat screen monitor is not recycled properly at the end of its life
LCDs have a longer life than CRTs
The general results are clear: the flat-screen monitor consists of less material, with less of a burden in manufacturing, distribution and disposal; it uses less electricity over its life as well. For both monitors, the manufacturing process generates toxic pollution to air and/or water. With this information, the flat screen seems to be a much better choice, tying in a few categories but winning in most. However, the mercury in the flat screen monitor is a potent toxic just as the lead in the CRT monitor is. But of course, this example is more complex. For example, just how much better the flat screen is depends a great deal on several key issues. We consider two: • The source of the electricity
Pathways to Sustainability 61 Washington State Department of Ecology
• The relative impacts of disposal and/or recycling Electricity generation differs in composition from one part of the country to another; the Pacific Northwest uses a great deal of relatively clean hydroelectric power, while the northern Rocky Mountain region is rich in coal. Furthermore, it is increasingly common to have the option to purchase vastly less polluting electricity (from wind power, or certified “Salmon Safe” hydropower). Thus, the energy use advantages of the flat screen could be quite large or quite small, depending on the source of the power. And regardless of how the electricity is generated, consumers can do a lot to reduce their impacts through efficient use of the product (like not leaving your monitor on all of the time). Similarly, we have to consider the durability of the product, as well as recycling and disposal options. From a life cycle perspective, a longer lifespan directly and proportionally reduces a product’s impact: the impact is essentially spread out over more product use. Similarly, recyclable or reusable components are items that can skip the “extraction” stage next time around (and maybe part of the “manufacturing” stage as well). This may be difficult to calculate, but we can see that something with multiple uses (through either reuse or recycling) reduces its impact through longevity. The computer monitor example and the paper use example both demonstrate two important lessons. First, the impacts of a particular activity always depend to some extent on local factors (such as energy sources and disposal practices). Second, and more profound, we see that a consumer can influence life cycle costs – that is, the impacts are not set in stone. Through methods such as changing energy use, energy purchasing, recycling and reuse – to name just a few – users can have a huge effect on the ultimate impacts associated with a particular product choice. So, with all of these complications, what is the conclusion? We would sum it up as follows: the devil may be in the details, but a simple analysis goes a long way (and is certainly better than no analysis at all!). Clearly, a good comparison of monitor options requires a look at the life cycle. By looking across all life cycle stages of the monitor, we see some of the different ways in which the flat screen is superior, as well as noting the potential for mercury release if the flat screen monitor is mishandled at the end of its useful life – and we see how the consumer (or organization) can play a big role in mitigating certain key impacts. A Brief Note on Comparing Different Methods Chapter I on Ecology’s impacts provides a similar analysis to what appears in the two examples in this appendix, but in much greater and more technical detail. The analysis there allows us to see which of Ecology’s activities have the most impacts, and in which ways impacts of various activities differ. Chapter 1 also uses several distinct methods; we mention this here in order to avoid confusion. We do not prioritize one method over another for all uses. The three methods used in our analysis of Ecology’s impacts should be considered as complements, rather than substitutes. The monumental data needs for complete life cycle analysis are overwhelming and the three methods to some extent use different data, so the different methods are used side by side in our analysis as a system of checks and balances – especially since not every method includes good data for every possible impact. In short, we figure that more
Pathways to Sustainability 62 Washington State Department of Ecology
information is better, especially in this case in which the rankings of Ecology’s activities by each of the three methods can be directly compared one against another. If the rankings under all three methods tend to agree, then we have much more confidence in our results than if rankings are different under each of the methods. A Comment on Opportunity Cost and Environmental Performance The life-cycle assessment methodology and thinking summarized in this appendix are intended to be a holistic method of comparing the environmental impacts of a set of product options. When life-cycle thinking is limited to environmental impacts, the framework may not explicitly address the notion of opportunity cost. However, there are two ways in which life-cycle thinking is useful for getting at the same holistic view of an organization’s performance that “opportunity cost” thinking aims for as well. First, life-cycle thinking can and should be applied to costs. While the purchase of more energy-efficient and more expensive flat-screen monitors by Ecology might cut into its budget this year, a positive present value for the investment means that the agency will save more money in the long run. If indeed an upfront expenditure more than offsets itself through a discounted stream of savings, it is justifiable and desirable entirely on that basis. Second, there is the issue of social cost and benefit. There might appear to exist a trade-off between “environmental performance” on the one hand (represented by LCA-based decisions), and “agency efficacy” on the other (represented by the use of resources by the agency to get its job done). In the case of Ecology, this is even more complicated, since agency efficacy is itself simply a form of environmental performance. In this way, it might even seem reasonable to suggest that Ecology could do more for the environment in a broader sense by cutting corners on green expenses, and continuing to doing its core work with the additional resources. We suggest instead that environmental performance should be a society- and economy-wide goal, since it has direct and indirect benefits for the entire society. In particular, the social goal is not a certain level of performance, but rather sustainability itself.
Pathways to Sustainability 63 Washington State Department of Ecology
Appendix B. Sets of Principles and Ranking of Frameworks Detailed Descriptions of Analytical Frameworks Considered by the Team This appendix summarizes the following frameworks and sets of principles oriented toward sustainability:
A. Natural Step System Conditions B. Natural Capitalism Approach C. Zero Waste Approach D. Ecological Footprint E. CERES Principles F. Bellagio Principles G. Sustainable Process Index H. 2001 Environmental Sustainability Index
Frameworks A, B and C were used in some form, and so are described in Chapter III. Frameworks D through H are briefly summarized immediately below. All of the frameworks are described in greater detail in Sections A through H of this Appendix. Additionally, after the summary of these frameworks, there is a table presenting the results of the decision-making process that compared the final candidate frameworks. The Ecological Footprint, while useful as a tool for providing an understanding of the current level of sustainability, was ruled out as being too difficult to calculate for an organization. It is reasonably applicable to an individual or even a country with a given area and GNP, but not for an organization. For example, calculations have shown that each person may use the output from 5 acres. However, this is based on using all of the bioproductive land (i.e. leaving none for other species). Does an employee of an organization automatically give part of his or her allocation to the organization to be allowed to work there? Or, does the employee somehow pay for the footprint of the organization through the prices of the goods purchased from the organization? These and other questions caused the team to make the decision to discontinue the evaluation of the Ecological Footprint. See section D for more information. The CERES Principles are a useful set of principles to support a business on its path toward sustainability. Endorsing the CERES Principles represents a commitment for business to make continuous environmental improvement and to become publicly accountable for the environmental impact of all its activities. They showed some potential, but were seen as a good set of guiding principles and not as a total framework. See section E for more information. The Bellagio Principles are designed as guidelines for the process an organization goes through in working toward sustainable development. They provide a framework for action, but not a framework for sustainability. See section F for more information.

Pathways to Sustainability 64 Washington State Department of Ecology
The Sustainable Process Index is designed to evaluate the sustainability of manufacturing processes. It is remarkably similar to the TNS System Conditions, but does not include the human element. This was seen as a serious flaw and it was dropped from consideration. See section G for more information. 2001 Environmental Sustainability Index is a method to determine the environmental sustainability of nations. It has been applied to 122 nations with very interesting results, but it was not seen as being able to provide a 25-year sustainability visioning and strategic framework and was dropped. See section H for more information.
Pathways to Sustainability 65 Washington State Department of Ecology
A. Natural Step System Conditions The Natural Step (TNS) is a set of four system conditions for judging whether human activities are "sustainable" or not. From a beginning in Sweden, these simple guidelines have been adopted by several national governments (Sweden, Poland, Hungary, perhaps others), and a worldwide movement has sprung up promoting the four main principles of The Natural Step. (www.naturalstep.org) The system conditions are based on the four following scientific principles:
1. All mass and energy in the universe are conserved • First Law of Thermodynamics - conservation of energy • Conservation of Matter 2. Energy and matter tend to disperse spontaneously • Second Law of Thermodynamics 3. Material quality is in the concentration and structure of matter • We consume the concentration, purity and structure energy 4. Net increases in material quality on Earth are generated almost entirely by sun-driven photosynthetic processes
The Natural Step System Conditions are:
In order for a society to be sustainable, nature's functions and diversity are not systematically...
1. ...subject to increasing concentrations of substances extracted from the Earth's crust;
2. ...subject to increasing concentrations of substances produced by society;
3. ...impoverished by physical displacement, over-harvesting, or other forms of ecosystem manipulation; and
4. resources are used fairly and efficiently in order to meet basic human needs globally.

Pathways to Sustainability 66 Washington State Department of Ecology
B. Natural Capitalism Approach Natural capitalism is a new business model that enables companies to fully realize their opportunities. Natural Capitalism was created by business author Paul Hawken with Hunter and Amory Lovins of Rocky Mountain Institute, which has created a training and consulting service to support its use. Natural Capitalism is based on the understanding that an economy needs four types of capital to function properly:
• human capital, in the form of labor and intelligence, culture, and organization • financial capital, consisting of cash, investments, and monetary instruments • manufactured capital, including infrastructure, machines, tools, and factories • natural capital, made up of resources, living systems, and ecosystem services
The industrial system uses the first three forms of capital to transform natural capital into the stuff of our daily lives: cars, highways, cities, bridges, houses, food, medicine, hospitals, and schools. Natural Capitalism consists of four central strategies that are a means to enable countries, companies, and communities to operate by behaving as if all forms of capital were valued.
• Radically increase the productivity of natural resources. Through fundamental changes in both production design and technology, farsighted companies are developing ways to make natural resources—energy, minerals, water, forests—stretch 5, 10, even 100 times further than they do today. The resulting savings in operational costs, capital investment, and time can help natural capitalists implement the other three principles.
• Shift to biologically inspired production models and materials. Natural capitalism
seeks not merely to reduce waste but to eliminate the very concept of waste. In closed-loop production systems, modeled on nature’s designs, every output either is returned harmlessly to the ecosystem as a nutrient, like compost, or becomes an input for another manufacturing process. Industrial processes that emulate the benign chemistry of nature reduce dependence on nonrenewable inputs, make possible often phenomenally more efficient production, and can result in elegantly simple products that rival anything man-made.
• Move to a “service-and-flow” business model. The business model of traditional
manufacturing rests on the sale of goods. In the new model, value is instead delivered as a continuous flow of services—such as providing illumination rather than selling light bulbs. This aligns the interests of providers and customers in ways that reward them for resource productivity.
• Reinvest in natural capital. Capital begets more capital; a company that depletes its
own capital is eroding the basis

Pathways to Sustainability 67 Washington State Department of Ecology
C. Zero Waste Approach
A zero waste approach uses the Visionary Goal of zero waste to represent the endpoint of “closing-the-loop” so that all materials are returned at the end of their life as industrial nutrients, thereby avoiding any degradation of nature. Zero waste also promotes working toward a goal of 100% efficiency of use of all resources -- energy, material and human -- thereby reducing costs, lightening demands on scarce resources and providing greater availability for all. The same visionary goal of zero waste applied to products reduces impacts during manufacture, transportation, use and at end of life. The key initiatives within a zero waste strategy are listed and graphically shown below. (www.zerowaste.org) 1. Zero Waste of Resources • Energy • Materials • Human
2. Zero Emissions • Air • Soil • Water • Solid Waste • Hazardous Waste
3. Zero Waste in Activities • Administration • Production
4. Zero Waste in Product Life • Transportation • Use • End-of-Life
5. Zero Use of Toxics
Zero Waste Goals
Air
Materials
Human
Product
By-products
Administrative Activities
Production Activities
Zero Toxics Use
Waste
Water Soil
Solid
Energy
Hazardous
Resources
Emissions
Lifetime
Emissions
Waste
Waste
Waste
Waste

Pathways to Sustainability 68 Washington State Department of Ecology
D. Ecological Footprint The book Our Ecological Footprint; Reducing Human Impact on the Earth, by Mathis Wackernagel and William Rees introduced the ecological footprint as an accounting concept for ecological resources. Human consumption is translated into areas of productive land required to provide resources and assimilate waste products. The ecological footprint is a measure of how sustainable our life-styles are. In order to live, people consume what nature offers. The Ecological Footprint measures what we consume of nature. It shows how much productive land and water is needed to produce all the resources we consume and to process all the waste we make. It is estimated that the average American uses 30 acres to support his or her current lifestyle. This corresponds to the size of 30 football fields put together. Nature provides an average of 5 acres of bioproductive space for every person in the world. With a global population of 10 billion for the year 2050, the available space will be reduced to 3 acres. This should also give room for the 25 million other species. Already, humanity's footprint may be over 30 percent larger than what the world has to offer as it consumes more than what nature can provide. The Ecological Footprint model challenges us to face the earth’s limits for providing resources and processing waste, and to reduce the impact of our personal and working lives towards a more sustainable level. Without such concepts of our planetary limits, sustainability can be inappropriately less imperative.

Pathways to Sustainability 69 Washington State Department of Ecology
E. The CERES Principles The Coalition for Environmentally Responsible Economies (C.E.R.E.S.) is a coalition of investors, public pension trustees, foundations, labor unions, and environmental, religious and public interest groups, believes that globally sustainable economic activity must be environmentally responsible. CERES' (pronounced "series") mission is to encourage companies, in cooperation and collaboration with CERES, to endorse and practice the CERES Principles. Endorsing the CERES Principles represents a commitment for business to make continuous environmental improvement and to become publicly accountable for the environmental impact of all its activities. (http://www.ceres.org/about/principles.html) PRINCIPLE #1: Protection of the Biosphere -- We will reduce and make continual progress toward eliminating the release of any substance that may cause environmental damage to the air, water, or the earth or its inhabitants. We will safeguard all habitats affected by our operations and will protect open spaces and wilderness, while preserving biodiversity. PRINCIPLE #2: Sustainable Use of Natural Resources -- We will make sustainable use of renewable natural resources, such as water, soils and forests. We will conserve non-renewable natural resources through efficient use and careful planning. PRINCIPLE #3: Reduction and Disposal of Wastes -- We will reduce and where possible eliminate waste through source reduction and recycling. All waste will be handled and disposed of through safe and responsible methods. PRINCIPLE #4 Energy Conservation: We will conserve energy and improve the energy efficiency of our internal operations and of the goods and services we sell. We will make every effort to use environmentally safe and sustainable energy sources. PRINCIPLE #5: Risk Reduction -- We will strive to minimize the environmental, health and safety risks to our employees and the communities in which we operate through safe technologies, facilities and operating procedures, and by being prepared for emergencies. PRINCIPLE #6: Safe Products and Services -- We will reduce and where possible eliminate the use, manufacture or sale of products and services that cause environmental damage or health or safety hazards. We will inform our customers of the environmental impacts of our products or services and try to correct unsafe use. PRINCIPLE #7: Environmental Restoration -- We will promptly and responsibly correct conditions we have caused that endanger health, safety or the environment. To the extent feasible, we will redress injuries we have caused to persons or damage we have caused to the environment and will restore the environment. PRINCIPLE #8: Informing the Public -- We will inform in a timely manner everyone who may be affected by conditions caused by our company that might endanger health, safety or the environment. We will regularly seek advice and counsel through dialogue with persons in communities near our facilities. We will not take any action against employees for reporting dangerous incidents or conditions to management or to appropriate authorities. PRINCIPLE #9: Management Commitment -- We will implement these Principles and sustain a process that ensures that the Board of Directors and Chief Executive Officer are fully informed about pertinent environmental issues and are fully responsible for environmental policy. In selecting our Board of Directors, we will consider demonstrated environmental commitment as a factor.

Pathways to Sustainability 70 Washington State Department of Ecology
PRINCIPLE #10: Audits and Reports -- We will conduct an annual self-evaluation of our progress in implementing these Principles. We will support the timely creation of generally accepted environmental audit procedures. We will annually complete the CERES Report, which will be made available to the public.
Disclaimer These Principles establish an environmental ethic with criteria by which investors and others can assess the environmental performance of companies. Companies that endorse these Principles ledge to go voluntarily beyond the requirements of the law. The terms may and might in Principles one and eight are not meant to encompass every imaginable consequence, no matter how remote. Rather, these Principles obligate endorsers to behave as prudent persons who are not governed by conflicting interests and who possess a strong commitment to environmental excellence and to human health and safety. These Principles are not intended to create new legal liabilities, expand existing rights or obligations, waive legal defenses, or otherwise affect the legal position of any endorsing company, and are not intended to be used against an endorser in any legal proceeding for any purpose.
Pathways to Sustainability 71 Washington State Department of Ecology
F. The Bellagio Principles In November 1996, an international group of measurement practitioners and researchers from five continents came together at the Rockefeller Foundation's Study and Conference Center in Bellagio, Italy to review progress to date and to synthesize insights from practical ongoing efforts. The following principles resulted and were unanimously endorsed. (http://iisd1.iisd.ca/measure/1.htm) 1. Guiding Vision and Goals
Assessment of progress toward sustainable development should be guided by a clear vision of sustainable development and goals that define that vision
2. Holistic Perspective
Assessment of progress toward sustainable development should: • include review of the whole system as well as its parts • consider the well-being of social, ecological, and economic sub-systems, their
state as well as the direction and rate of change of that state, of their component parts, and the interaction between parts
• consider both positive and negative consequences of human activity, in a way that reflects the costs and benefits for human and ecological systems, in monetary and non-monetary terms
3. Essential Elements
Assessment of progress toward sustainable development should: • consider equity and disparity within the current population and between present
and future generations, dealing with such concerns as resource use, over-consumption and poverty, human rights, and access to services, as appropriate
• consider the ecological conditions on which life depends • consider economic development and other, non-market activities that contribute to
human/social well-being 4. Adequate Scope
Assessment of progress toward sustainable development should: • adopt a time horizon long enough to capture both human and ecosystem time
scales thus responding to needs of future generations as well as those current to short term decision-making
• define the space of study large enough to include not only local but also long distance impacts on people and ecosystems
• build on historic and current conditions to anticipate future conditions - where we want to go, where we could go
5. Practical Focus
Assessment of progress toward sustainable development should be based on:

Pathways to Sustainability 72 Washington State Department of Ecology
• an explicit set of categories or an organizing framework that links vision and goals to indicators and assessment criteria
• a limited number of key issues for analysis • a limited number of indicators or indicator combinations to provide a clearer
signal of progress • standardizing measurement wherever possible to permit comparison • comparing indicator values to targets, reference values, ranges, thresholds, or
direction of trends, as appropriate 6. Openness
Assessment of progress toward sustainable development should: • make the methods and data that are used accessible to all • make explicit all judgments, assumptions, and uncertainties in data and
interpretations 7. Effective Communication
Assessment of progress toward sustainable development should: • be designed to address the needs of the audience and set of users • draw from indicators and other tools that are stimulating and serve to engage
decision-makers • aim, from the outset, for simplicity in structure and use of clear and plain language
8. Broad Participation
Assessment of progress toward sustainable development should: • obtain broad representation of key grass-roots, professional, technical and social
groups, including youth, women, and indigenous people - to ensure recognition of diverse and changing values
• ensure the participation of decision-makers to secure a firm link to adopted policies and resulting action
9. Ongoing Assessment
Assessment of progress toward sustainable development should: • develop a capacity for repeated measurement to determine trends • be iterative, adaptive, and responsive to change and uncertainty because systems
are complex and change frequently • adjust goals, frameworks, and indicators as new insights are gained • promote development of collective learning and feedback to decision-making
10. Institutional Capacity
Continuity of assessing progress toward sustainable development should be assured by: • clearly assigning responsibility and providing ongoing support in the decision-
making process

Pathways to Sustainability 73 Washington State Department of Ecology
• providing institutional capacity for data collection, maintenance, and documentation supporting development of local assessment capacity
Pathways to Sustainability 74 Washington State Department of Ecology
G. The Sustainable Process Index The task group 'Ecologic Bioprocessing of the European Federation of Biotechnology' (Moser et al., 1993) has developed a definition for sustainability that requires the following four criteria: (http://vt.tu-graz.ac.at/spi/) (1) Anthropogenic material flows must not exceed the local assimilation capacity and
should be smaller than natural fluctuations in geogenic flows This requirement maintains the quality of the material base for ecosystems (soil, aquifers, atmosphere, etc.). It is based on the assumption that geogenic flows are subject to fluctuations, which do not jeopardise evolution and that the local assimilation capacity is a measure of the rate with which ecosystems accept input streams without losing their evolutionary potential. This capacity changes with geography and to some extent with time, too. Another assumption is that the rate of acceptance of input streams to the supporting ecosystems is clearly more restrictive than any rate of depletion of natural resources. We are facing a 'waste crunch' in contrast to a 'resource crunch', a fact that has been accepted quite widely during the last few years (Meadows et al., 1992). (2) Anthropogenic material flows must not alter the quality and the quantity of global
material cycles Most of the dominant global material cycles (like the carbon, nitrogen or water cycle) have natural buffer stocks. In some cases these stocks are exploitable deposits, in other cases there are unusable storage systems. Today the deposits are mined and exploited very fast, but the knowledge of the environmental impacts of exploitation is rather insufficient. This requirement does not totally rule out the use of materials from these natural buffer stocks (like aquifers and fossil raw material deposits) but defines the input streams for industrial systems. It links the rate of exploitation to the rate of replenishment of these natural systems. In some cases even the quality might change, e.g., like for fossil raw materials. Here the main deposition of organic matter occurs by oceanic sedimentation. In this context the most important aspect is to keep the carbon concentration in the global cycles roughly constant. At least at the first glance, the form of carbon storage seems to be less important. The importance of the quality aspect can be illustrated by existing aquifers: If we contaminate these stocks the future utilisation is endangered. (3) Renewable resources can only be extracted at a rate that does not exceed the local
fertility This requirement again defines the input streams for industrial systems. In order to fulfil this requirement a locally adapted agriculture is called for which guarantees long-term preservation of the fertility of land. Thus erosions must be stopped as well as soil contamination and salination. (4) The natural variety of species and landscapes must be sustained or improved This is a very far-reaching requirement. It calls for maintaining the important interaction between man and nature at a physical as well as a psychological level and for the use of

Pathways to Sustainability 75 Washington State Department of Ecology
nature's resources under the boundary conditions of aesthetics. Beauty is an intrinsic property of sustainability. Only if we maintain a sufficiently comfortable environment by accepting the rules of natural landscape we can ensure that man will evolve in this system. This can also be seen from a very pragmatic point of view, since land as well as species are factors of the utmost importance in a society pursuing sustainable development. Degrading these factors irreversibly will impede our own chance to improve our quality of life and it will deprive future generations of an important basis for living. From: http://vt.tu-graz.ac.at/spi/
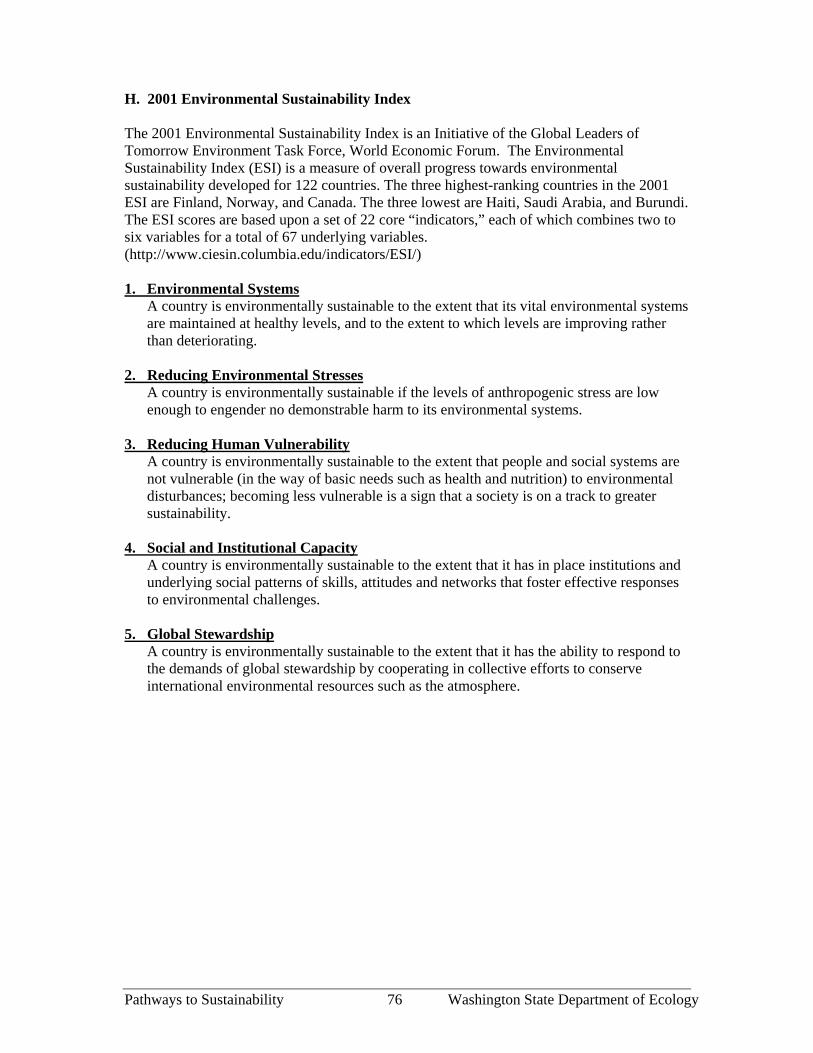
Pathways to Sustainability 76 Washington State Department of Ecology
H. 2001 Environmental Sustainability Index The 2001 Environmental Sustainability Index is an Initiative of the Global Leaders of Tomorrow Environment Task Force, World Economic Forum. The Environmental Sustainability Index (ESI) is a measure of overall progress towards environmental sustainability developed for 122 countries. The three highest-ranking countries in the 2001 ESI are Finland, Norway, and Canada. The three lowest are Haiti, Saudi Arabia, and Burundi. The ESI scores are based upon a set of 22 core “indicators,” each of which combines two to six variables for a total of 67 underlying variables. (http://www.ciesin.columbia.edu/indicators/ESI/) 1. Environmental Systems
A country is environmentally sustainable to the extent that its vital environmental systems are maintained at healthy levels, and to the extent to which levels are improving rather than deteriorating.
2. Reducing Environmental Stresses A country is environmentally sustainable if the levels of anthropogenic stress are low enough to engender no demonstrable harm to its environmental systems.
3. Reducing Human Vulnerability A country is environmentally sustainable to the extent that people and social systems are not vulnerable (in the way of basic needs such as health and nutrition) to environmental disturbances; becoming less vulnerable is a sign that a society is on a track to greater sustainability.
4. Social and Institutional Capacity A country is environmentally sustainable to the extent that it has in place institutions and underlying social patterns of skills, attitudes and networks that foster effective responses to environmental challenges.
5. Global Stewardship
A country is environmentally sustainable to the extent that it has the ability to respond to the demands of global stewardship by cooperating in collective efforts to conserve international environmental resources such as the atmosphere.

Pathways to Sustainability 77 Washington State Department of Ecology
Ranking Process After the initial preliminary analysis, the team discussed the most viable options and decided that a single framework might not be the most effective. The following frameworks and combinations were chosen for further evaluation. The Ecological Footprint was briefly considered during this process and then dropped.
1. The TNS System Conditions 2. Natural Capitalism 3. The TNS System Conditions with Natural Capitalism 4. The TNS System Conditions with Zero Waste
In order to determine the best option to provide a 25-year sustainability visioning and strategic framework for sustainability four key criteria were chosen. The criteria were selected to help identify the best framework to inspire members of the organization, to fully include the issues of sustainability and to measure progress. The criteria for ranking chosen by the team were Inspiration, Comprehensiveness, Measurability and Overall Effectiveness. These criteria were applied to each of the four framework options and the results are shown in the accompanying spreadsheet in Appendix B. Results of Ranking Process The factors used in the rankings are listed across the columns of the Framework Support Decision Support Matrix Summary table included farther on in this appendix. The discussion under each of the four framework finalists summarizes factors that led to the decision as to which potential framework to use as the sustainability guide. The Natural Step System Conditions Inspiration. Good. The TNS System Conditions were seen as appropriately radical and accurate, to inspire people to stretch toward the goal. TNS System Conditions, when taught with their scientific basis, the “funnel” demonstrating the upcoming clash between demands on and supply of natural capital, and backcasting as a strategic process, are both easy to grasp and inspirational. This is evidenced by the rate at which TNS is growing internationally. Comprehensiveness. Good. Through the system-based approach, all sustainability factors, as we understand them, are covered by the System Conditions. Efficiency of use and human and social factors are included in System Condition 4, but only vaguely, leading to difficulty in application, especially for organizations where the sphere of influence is limited. Measurability. Poor. TNS was designed to define societal sustainability and requires estimates of substance flows compared to the earth’s ability to process those flows and to handle wastes. These measurements are very difficult and in some cases, probably beyond humankind’s current knowledge. Organizations must use measurable surrogates that may not be systematic or comprehensive as indicators. Overall Effectiveness. Medium. The good inspirational and comprehensiveness ratings are tempered by the measurement difficulties, reducing the TNS System Conditions overall effectiveness when used by themselves.

Pathways to Sustainability 78 Washington State Department of Ecology
Natural Capitalism Inspiration. Good. The excellent book that accompanies and elaborates on the four central strategies (Natural Capitalism Principles) was designed to be and is inspirational. It requires study to get the points and to develop implementation plans. Comprehensiveness. Good. The whole-systems based approach is strong. The human and social element is included as “human capital” in the overall program, but not clearly in the four Natural Capitalism Principles. Measurability. Medium. The first two Natural Capitalism Principles individually can be measured by basic ratios such as energy used per unit of product, toxics used per unit of product, waste per unit of product. However, Principles three and four are more difficult to translate into easy organizational measurements because they are process based rather than performance based. The ultimate measure of the whole system – whether or not natural capital is being enhanced by the organization’s operations – is difficult. Overall Effectiveness. Medium. Natural Capitalism was not designed to be used as a full framework for sustainability. Like Zero Waste, it reaches most elements, but is not comprehensive because it doesn’t define a specific sustainability goal (aside from implying that sustainability will be achieved when natural capital is not being depleted). Neither do the Principles specifically address human capital, although subsequent iterations from Rocky Mountain Institute explicitly include human capital. The inspirational value partially compensates for these weaknesses. The TNS System Conditions with Natural Capitalism Inspiration. Good. The engaging mental models of TNS System Conditions and its training framework combined with the Natural Capitalism Principles plus the examples and information in the Natural Capitalism book are very inspirational. The combination is more effective than TNS System Conditions and training alone. Comprehensiveness. Good. Both are fairly comprehensive and support each other well since the objective of both is preservation of sufficient natural capital and consideration of human capital factors. Broad statements combined with clarifying goals provide a comprehensive, useful framework for both the organization’s operations and for supply chain management. Measurability. Medium. Just as measuring TNS System Conditions is difficult, so is measuring natural capital. Natural Capitalism Principles are more measurable, but indicators still need to be derived for each organization. Overall Effectiveness. Good. The strong inspirational element of TNS System Conditions coupled with the operational framework of Natural Capitalism principles makes a powerful, synergistic framework, but the difficulty with identifying measurements reduces its overall effectiveness.

Pathways to Sustainability 79 Washington State Department of Ecology
The TNS System Conditions with Zero Waste Inspiration. Good. The Zero Waste framework of driving our waste in resources and emissions toward zero and reducing toxics towards a goal of zero provides significant support to the vagueness of TNS System Conditions, providing an easy to understand, complementary and inspirational combination. It also works well because businesses are increasingly comfortable with the phrase “zero” as a goal, such as in zero defects, zero landfill waste, etc. Its weakness is with human capital, and restoration of natural capital. Comprehensiveness. Good. Zero Waste is an excellent supportive strategy, necessary, but not sufficient to meet the TNS System Conditions. As such, it adds to the understanding of just how comprehensive the System Conditions really are. Perhaps more importantly, Zero Waste provides clear operational goals based on the first three TNS System Conditions in a systematic and thoughtful way such that an organization doesn’t have to make up its own. To the extent that Zero Waste efforts spread around the world, an organization using this combination will have many “bretheren” to share experiences and learn from. Measurability. Medium. The addition of Zero Waste avoids the need to require measurement of substance flows compared with the earth’s ability to handle them. It makes most measurements of succeeding with the first three TNS System Conditions clear. While a goal of “zero” may not be fully attainable, it is an ideal goal for now because of its visionary nature that will motivate us to be more innovative and move more quickly. Human and social factors remain difficult. Waste of human resources can include sick time, un-meaningful work and low morale. Material flow analyses can be used to identify all inputs and outputs that then can be ranked to provide a clear path toward sustainability. The clear goal of zero is a constant reminder of our ultimate goals stopping deterioration of and restoring the environment. Overall Effectiveness. Good. The TNS System Conditions framework is broad and Zero Waste is easy to understand and supportive while bringing in a visionary stretch goal. The combination framework is easier to adopt and implement, and directs us to additional checks and indicators. Further, with sustainability goals established by TNS and Zero Waste, Natural Capitalism Principles can be used as an operational strategy if desired. Summary The application of the four criteria, (1) inspiration, (2) comprehensiveness, (3) measurability and (4) overall effectiveness allowed the four favored frameworks to be ranked to find the top contender. All frameworks were seen as providing a reasonably high level of inspiration and providing a reasonably comprehensive framework. All suffered from lacks in measurability, although The TNS System Conditions supported by a Zero Waste strategy was favored due to the inherent clarity and measurability of “zero” as a goal. The ability of each framework to provide clarity in application was also evaluated. The TNS System Conditions seem insufficient alone, but when applied with a Zero Waste strategy, it was considered to be the most appropriate. The results of the ranking process are shown in the table below.

Pathways to Sustainability 80 Washington State Department of Ecology
Framework Analysis Decision Support Matrix Summary
Sustainability Framework Evaluation
Inspiration Comprehen-siveness
Measurability Overall Effectiveness
The Natural Step
Good. Appropriately radical to inspire people to stretch toward the goal. Both easy to grasp and inspirational as evidenced by the rate at which TNS is growing internationally.
Good. System-based approach, All factors, as we understand them, are covered by the system conditions.
Poor. TNS requires estimates of substance flows compared to the earth’s ability to process those flows and to handle wastes. These are very difficult and in some cases, probably beyond humankind’s current knowledge.
Medium. Measurement difficulties reduce overall effectiveness.
Natural Capitalism
Good. The excellent book that accompanies and elaborates on the four central strategies was designed to be and is inspirational. It requires study to get the points and to develop implementation plans.
Good. The systems-based approach is strong. The human element is included in the understanding, but not clearly in the four central strategies.
Medium. The first two Natural Capitalism Principles can be measured by basic ratios such as energy used per unit of product. However, Principles three and four are more difficult to measure.
Good. Natural Capitalism was not designed to be used as a full framework for sustainability. Like Zero Waste, it reaches most elements, but is not comprehensive.
The Natural Step and Natural Capitalism
Good. The engaging mental models of TNS and its training framework combined with the examples and information in the Natural Capitalism book are very inspirational.
Good. Both are fairly comprehensive and support each other well. Broad statements combined with clarifying goals provide a comprehensive, useful framework.
Medium. The basic ratios of Natural Capitalism make the combination more measurable, but still potentially difficult.
Good. Inspiration and comprehensiveness are powerful, but the difficulty with identifying measurements reduces overall effectiveness.
The Natural Step and Zero Waste
Good. The visionary Zero Waste framework of driving our waste in resources and emissions toward zero and reducing toxics provides significant support to the vagueness of TNS system conditions, providing an easy to understand, complimentary combination.
Good. Zero waste is an excellent supportive strategy, necessary, but not sufficient to fully meet the system conditions.
Medium. Zero Waste makes measurements of most items more clear. Human and social factors remain difficult. Indicators can be developed, however. The clear goal of zero is a constant reminder of our ultimate goals.
Good. The TNS framework is broad and Zero Waste is easy to understand and supportive while bringing in a stretch goal. The combination framework is easier to adopt and implement, and directs us to additional checks and indicators.

Pathways to Sustainability 81 Washington State Department of Ecology
Appendix C. Goals-setting, Backcasting, and Goal Matrices The introduction to Section IV provides an overview of the process that led to the goals and backcasted milestones for the functional pathways. This appendix presents two additional elements: (1) a detailed description of the process of goal-setting and backcasting; and (2) the goal matrices for the natural resources and functional pathways affected by the facility and for the functional pathways.
Goal-setting and Backcasting Process Goal-setting: The overall goal for the project was to show how the Department of Ecology could become sustainable in 25 years. One of the requirements for the project was to flesh out that general goal. The Natural Step System Conditions were used as a guide to help systematically articulate the goals. First, goals were articulated for each kind of natural resource affected (energy, air, water, land, and materials – these are included in the appendices). Next, goals were articulated for each of the functional pathways: Mobility; Information and Communications; and the Facilities impacts, which were further divided into Shelter and Infrastructure; Employee Comfort, Health, and Safety; and Furnishings and Interiors. These functional pathways were defined broadly in order to help us think creatively about solutions. Again, The Natural Step System Conditions were used to help think about and articulate the goals. The final goal statements are shown in the table format in which they were developed. In addition to the four system condition columns, “Natural Capital” and “Human Capital” columns were added, to help stimulate thinking about specific goals. The goal-setting process involves trial and revision, and moves back and forth between goal statements (What are we trying to achieve?) and strategy statements (How are we going to be able to achieve that?). Gradually, the goal statements were distilled through a series of drafts and discussion. As the goal statements were refined, the draft goals for “Natural Capital” and “Human Capital” were included in the four “System Conditions” goal categories. (See the goal matrices below.) The Natural Capital and Human Capital columns remain in the report, to facilitate revisiting the goals in the future, if desired. General strategies: As a kind of reality basis or check for the development of goals, key strategies were discussed. These were returned to when defining the Last Step in each pathway, and in articulating the milestones along each path, as described below. The Last Step: The crucial step in backcasting is envisioning and defining the last step: What are the conditions that have to be met in order to reach the goal? What technologies or practices could accomplish that? How well will they need to perform? This process requires some boldness. There is some inevitable reluctance at this stage, as if we would have to be clairvoyant, to “see” what will be in place in the future. (Of course, none of us has any certainty about that.) What is necessary is to draw on the best understandings of the planning team to make reasonable judgements about what technologies and practices are likely to evolve, and what level they would need to function at to accomplish the goal. The Last Step is drawn by logical inference from the goal. (This is a target that can only be achieved through sustained effort. It is not a prediction of what will occur if we merely observe,

Pathways to Sustainability 82 Washington State Department of Ecology
passively.) The Last Step is the one that gets us through the Natural Step funnel. That is the final step to operating sustainably. Setting Milestones and Conditions on the Time Line: Once the Last Step is defined, it must be placed at the end of the time line. If the goal is to be reached in 25 years, the last step must be in place within 25 years. (This 25-year planning horizon is long enough to allow for a substantial amount of refinement as implementation unfolds, if necessary.) It is then necessary to make a series of judgments about the pace at which the technologies and practices would likely improve over the 25-year time frame. In some cases (as with computer technology) there has been active and widely published forecasting about the pace of technological change. In other cases, the pace of development will depend heavily on the degree of interest and investment that builds in the years ahead. The milestones and conditions divide the long planning horizon into more manageable parts, by setting reasonable interim targets for technologies and practices to meet, in roughly five-year increments. Major anticipated events (like when a roof is scheduled to be replaced) are also captured on the time line. This part of the methodology should also capture good forecast data about the expected availability and performance of different technologies and practices of interest along the time line. Back-casting the steps: Once the framework of milestones and conditions has been established along each pathway, specific steps – specific changes in technology and practice – can be outlined. These are typically become more specific as they move from the distant future to the near term. Again, the purpose of this exercise is not to forecast the future, it is to make a reasonable plan – a reasonable series of steps – for achieving the goal of sustainability.
Goal Matrices for Natural Resource Impacts and Functional Pathways The team created goal matrices for five natural resource impacts and the three detailed functional pathways:
Natural resource impacts
Energy Materials Air Land Water
Functional Pathways
Information and Communications Mobility Facility Operations
• Shelter and Infrastructure • Comfort-Health-Safety • Interiors and Furnishing
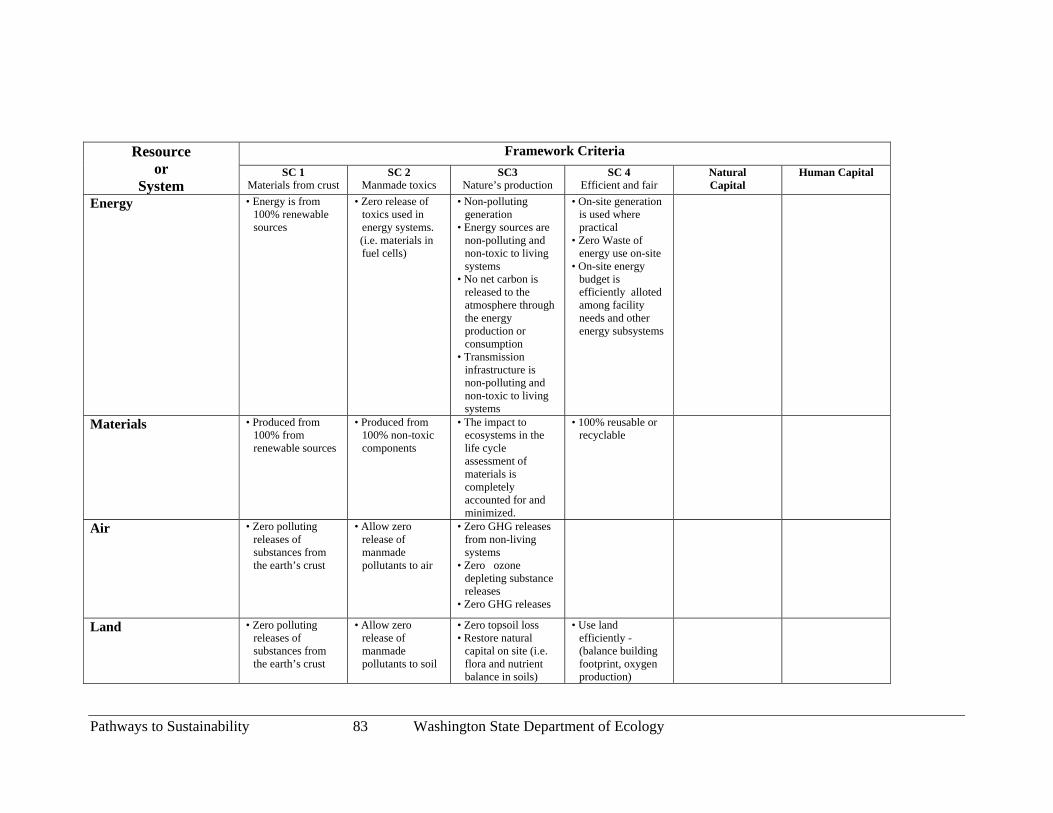
Pathways to Sustainability 83 Washington State Department of Ecology
Framework Criteria Resource
or System
SC 1 Materials from crust
SC 2 Manmade toxics
SC3 Nature’s production
SC 4 Efficient and fair
Natural Capital
Human Capital
Energy • Energy is from 100% renewable sources
• Zero release of toxics used in energy systems.
(i.e. materials in fuel cells)
• Non-polluting generation
• Energy sources are non-polluting and non-toxic to living systems
• No net carbon is released to the atmosphere through the energy production or consumption
• Transmission infrastructure is non-polluting and non-toxic to living systems
• On-site generation is used where practical
• Zero Waste of energy use on-site
• On-site energy budget is efficiently alloted among facility needs and other energy subsystems
Materials • Produced from 100% from renewable sources
• Produced from 100% non-toxic components
• The impact to ecosystems in the life cycle assessment of materials is completely accounted for and minimized.
• 100% reusable or recyclable
Air • Zero polluting releases of substances from the earth’s crust
• Allow zero release of manmade pollutants to air
• Zero GHG releases from non-living systems
• Zero ozone depleting substance releases
• Zero GHG releases
Land
• Zero polluting releases of substances from the earth’s crust
• Allow zero release of manmade pollutants to soil
• Zero topsoil loss • Restore natural
capital on site (i.e. flora and nutrient balance in soils)
• Use land efficiently - (balance building footprint, oxygen production)
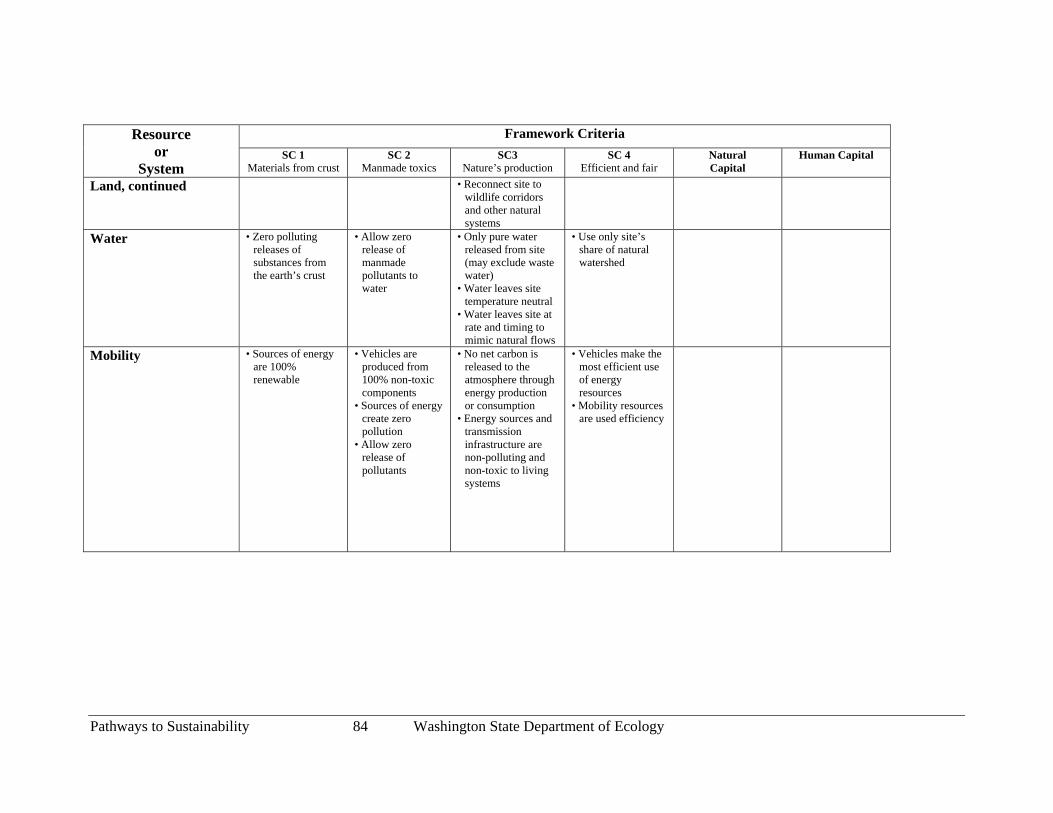
Pathways to Sustainability 84 Washington State Department of Ecology
Framework Criteria Resource or
System SC 1
Materials from crust SC 2
Manmade toxics SC3
Nature’s production SC 4
Efficient and fair Natural Capital
Human Capital
Land, continued • Reconnect site to wildlife corridors and other natural systems
Water • Zero polluting releases of substances from the earth’s crust
• Allow zero release of manmade pollutants to water
• Only pure water released from site (may exclude waste water)
• Water leaves site temperature neutral
• Water leaves site at rate and timing to mimic natural flows
• Use only site’s share of natural watershed
Mobility • Sources of energy are 100% renewable
• Vehicles are produced from 100% non-toxic components
• Sources of energy create zero pollution
• Allow zero release of pollutants
• No net carbon is released to the atmosphere through energy production or consumption
• Energy sources and transmission infrastructure are non-polluting and non-toxic to living systems
• Vehicles make the most efficient use of energy resources
• Mobility resources are used efficiency
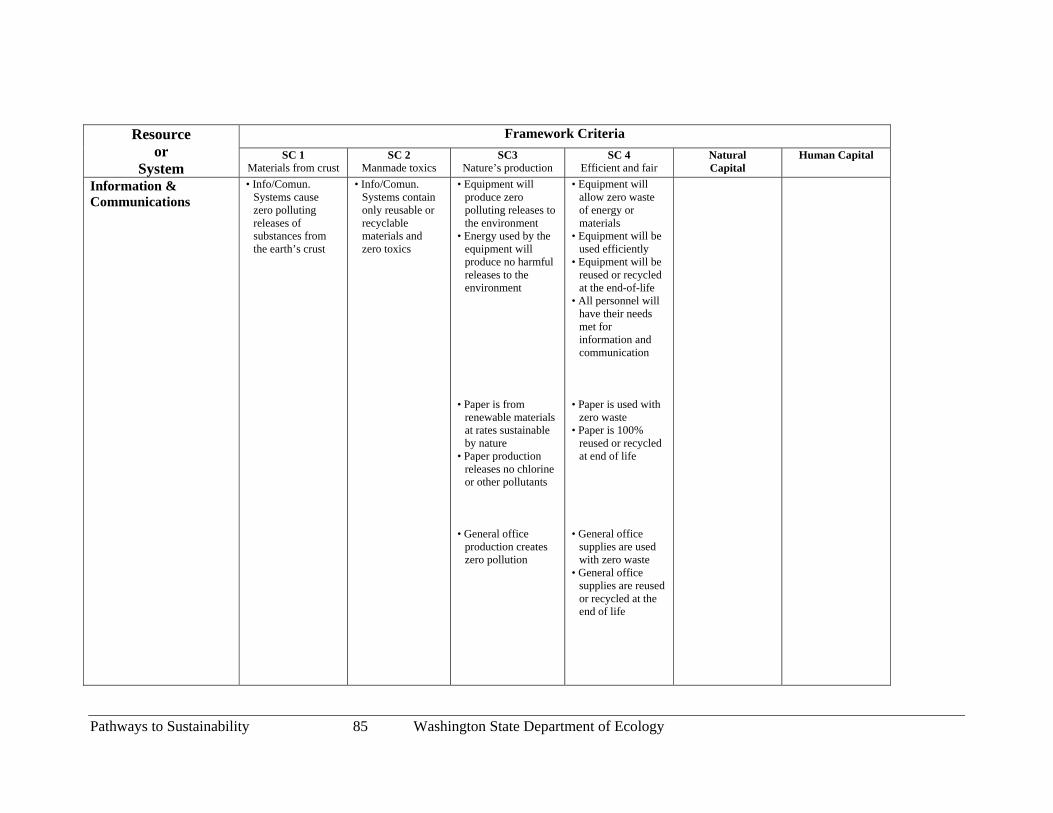
Pathways to Sustainability 85 Washington State Department of Ecology
Framework Criteria Resource or
System SC 1
Materials from crust SC 2
Manmade toxics SC3
Nature’s production SC 4
Efficient and fair Natural Capital
Human Capital
Information & Communications
• Info/Comun. Systems cause zero polluting releases of substances from the earth’s crust
• Info/Comun. Systems contain only reusable or recyclable materials and zero toxics
• Equipment will produce zero polluting releases to the environment
• Energy used by the equipment will produce no harmful releases to the environment
• Paper is from
renewable materials at rates sustainable by nature
• Paper production releases no chlorine or other pollutants
• General office
production creates zero pollution
• Equipment will allow zero waste of energy or materials
• Equipment will be used efficiently
• Equipment will be reused or recycled at the end-of-life
• All personnel will have their needs met for information and communication
• Paper is used with
zero waste • Paper is 100%
reused or recycled at end of life
• General office
supplies are used with zero waste
• General office supplies are reused or recycled at the end of life

Pathways to Sustainability 86 Washington State Department of Ecology
Framework Criteria Resource or
System SC 1
Materials from crust SC 2
Manmade toxics SC3
Nature’s production SC 4
Efficient and fair Natural Capital
Human Capital
Shelter & Infrastructure
• Energy sources used in the construction and renovation process are renewable, non-polluting and non-toxic.
• Materials used in the construction and renovation process cause zero polluting releases of substances from the earth’s crust
• Materials used in the construction and renovation process cause zero polluting releases of manmade toxic substances
• Construction and renovation processes produce no net loss to natural capital on site.
• Construction process meets goals of Energy, Water, Air, Land Impacts
• Life Cycle Assessment of process and product determines first priority basis-of- selection
• Water used during construction is clean and temperature neutral when it leaves the site
• Stormwater runoff and Wind erosion is minimized using predevelopment conditions as a benchmark
• No net loss of Habitat
• Construction sources are local and community-based where feasible
• Construction process uses management and methods which align with the material and energy goals for System Conditions 1,2 & 3
• Facility supports energy production, balanced against facility requirements i.e. daylighting)
Natural Capital increases as: • Fewer materials
are used in new system design.
• Materials are reused or recycled.
• Life Cycle Impacts help eliminate toxic substances, eliminate harm to habitat, and use less energy.
• Human Capital increases with healthier building environment.
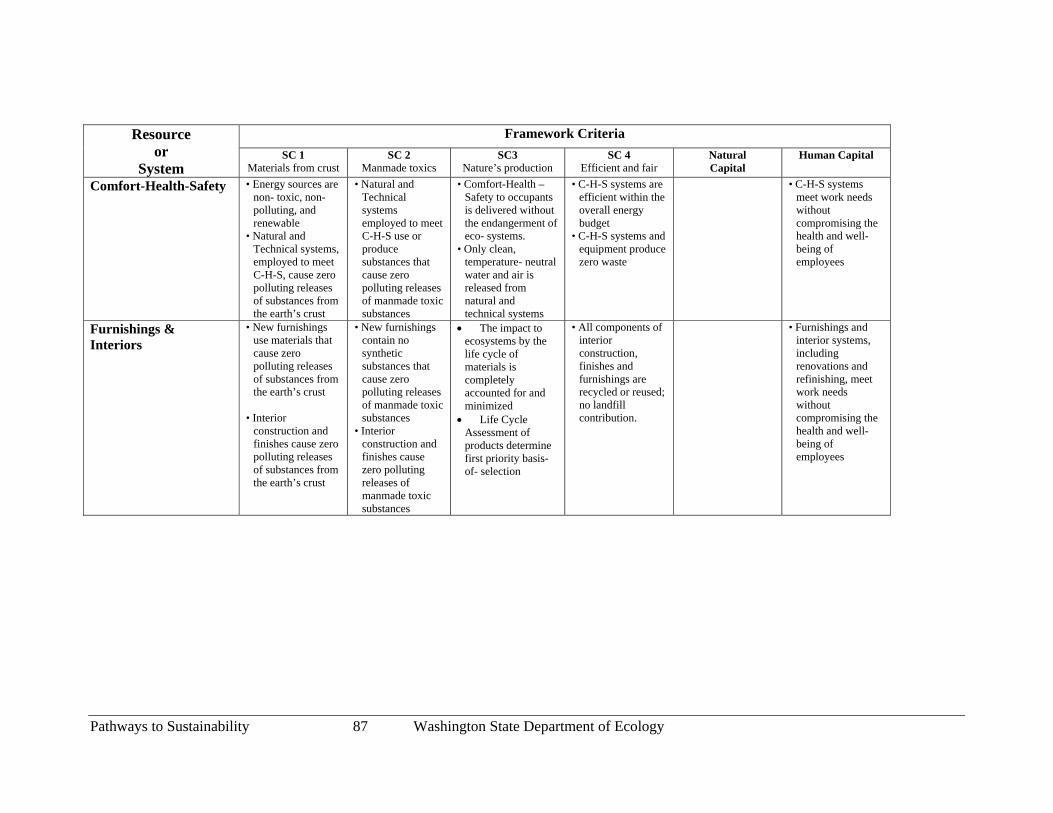
Pathways to Sustainability 87 Washington State Department of Ecology
Framework Criteria Resource or
System SC 1
Materials from crust SC 2
Manmade toxics SC3
Nature’s production SC 4
Efficient and fair Natural Capital
Human Capital
Comfort-Health-Safety • Energy sources are non- toxic, non-polluting, and renewable
• Natural and Technical systems, employed to meet C-H-S, cause zero polluting releases of substances from the earth’s crust
• Natural and Technical systems employed to meet C-H-S use or produce substances that cause zero polluting releases of manmade toxic substances
• Comfort-Health – Safety to occupants is delivered without the endangerment of eco- systems.
• Only clean, temperature- neutral water and air is released from natural and technical systems
• C-H-S systems are efficient within the overall energy budget
• C-H-S systems and equipment produce zero waste
• C-H-S systems meet work needs without compromising the health and well-being of employees
Furnishings & Interiors
• New furnishings use materials that cause zero polluting releases of substances from the earth’s crust
• Interior
construction and finishes cause zero polluting releases of substances from the earth’s crust
• New furnishings contain no synthetic substances that cause zero polluting releases of manmade toxic substances
• Interior construction and finishes cause zero polluting releases of manmade toxic substances
• The impact to ecosystems by the life cycle of materials is completely accounted for and minimized
• Life Cycle Assessment of products determine first priority basis-of- selection
• All components of interior construction, finishes and furnishings are recycled or reused; no landfill contribution.
• Furnishings and interior systems, including renovations and refinishing, meet work needs without compromising the health and well-being of employees
Pathways to Sustainability 88 Washington State Department of Ecology
Appendix D. User Data Entry Spreadsheet The following three pages show the user data entry spreadsheets, which are a templated tool for calculating the payback of a given investment. The example shown here compares several different automobiles, but the spreadsheets can be easily adapted to calculate paybacks for other products or choices along the sustainability pathway. The three slides presented are: Vehicle Payback Model – User Inputs Vehicle Payback Model – Money Payback Results Vehicle Payback Model – Money and Environmental Payback
Contact John Erickson directly for the Microsoft Excel version of the spreadsheets.

Pathways to Sustainability 89 Washington State Department of Ecology
Vehicle Payback Model – User Inputs
Miles Driven per Year: Projected Fuel Prices: Year 1 Year 2City = 5,000 Gasoline $1.70 $1.75
Highway = 20,000 Diesel $1.50 $1.55Biodiesl $1.50 $1.55
New Vehicle Information: Electricity $0.06 $0.08 Toyota Prius 4-Dr HEV EPA Estimated MPG:
City = 52Highway = 45
Electric Car miles/kwh: = 0 MSRP: = $19,995 Vehicle Fuel Type: Gasoline Enter Gasoline, Diesel, Biodiesel, or Electric in cell to left.
Baseline Vehicle: Ford Taurus 4-Dr EPA Estimated MPG:
City = 18Highway = 27
Electric Car miles/kwh: = 0 MSRP: = $18,450 Vehicle Fuel Type: Gasoline Enter Gasoline, Diesel, Biodiesel, or Electric in cell to left.
Payback & Present Value CalculationsDiscount Rate = 3.0%
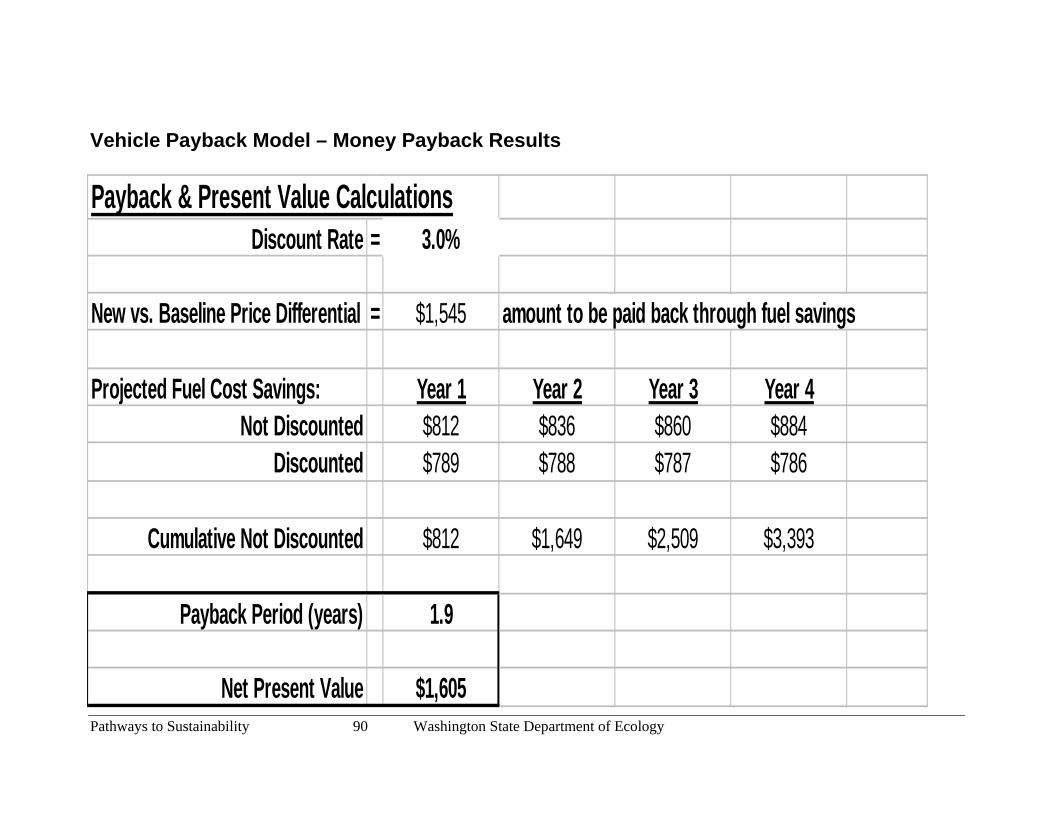
Pathways to Sustainability 90 Washington State Department of Ecology
Vehicle Payback Model – Money Payback Results Payback & Present Value Calculations
Discount Rate = 3.0%
New vs. Baseline Price Differential = $1,545 amount to be paid back through fuel savings
Projected Fuel Cost Savings: Year 1 Year 2 Year 3 Year 4Not Discounted $812 $836 $860 $884
Discounted $789 $788 $787 $786
Cumulative Not Discounted $812 $1,649 $2,509 $3,393
Payback Period (years) 1.9
Net Present Value $1,605

Pathways to Sustainability 91 Washington State Department of Ecology
Vehicle Payback Model – Financial and Environmental Payback Environmental Impacts Emissions Estimated Environmental Cost Savings
Reductions Low Estimate High EstimateAnnual Atmospheric Emissions (thousand lbs) (annual $) (annual $)Particulates (Total) 0.0 $37 $189Nitrogen Oxides 0.0 $16 $180Hydrocarbons (non CH4) 0.1 $17 $261Sulfur Oxides 0.0 $0 $15Carbon Monoxide 0.3 $2 $139CO2 (biomass) 0.0 $0 $0CO2 (non biomass) 10.0 $2 $122Ammonia 0.0 $0 $0Lead 0.0 $0 $0Methane 0.0 $0 $0Hydrochloric acid 0.0 $0 $0
$74 $906Payback & Present Value Calculations Including Environmental Cost Savings
Projected Total Cost Savings:(Fuel+Average Environmental) Year 1 Year 2 Year 3 Year 4
Not Discounted $1,303 $1,326 $1,350 $1,374Discounted $1,265 $1,250 $1,236 $1,221
Cumulative Not Discounted $1,303 $2,629 $3,979 $5,354
Payback Period (years) 1.2
Net Present Value $3,427

Pathways to Sustainability 92 Washington State Department of Ecology
Appendix E. Consultant and Organization Profiles This appendix contains profiles of the consultants who worked on the project and their respective organizations: • Larry Chalfan of The Zero Waste Alliance • Logan Cravens of SERA Architects • Christopher Juniper of Rocky Mountain Institute • Jeff Morris of Sound Resource Management Group • Joshua Skov of Good Company The Zero Waste Alliance The Zero Waste Alliance (ZWA) serves as a bridge between the needs of organization and the capabilities available through universities, national labs, state, federal and local government resources and private consulting firms. The approach combines the concepts and tools of industrial ecology and green chemistry to work toward a future where society’s systems mimic Nature’s systems by becoming cyclical with no waste and no pollution. It provides management support, education and training, and technical services including a resource clearinghouse for technical solutions to challenging problems. • The Mission of the Zero Waste Alliance is to support organizations in the creation of a
more sustainable future. • The Objective of the Zero Waste Alliance is to accelerate the development and
implementation of practices that lead to the reduction and elimination of waste and toxics; promoting an effective strategy for improving profitability, competitiveness and environmental performance.
The Zero Waste Alliance has provided education and training to thousands of individuals through outreach presentations, a successful workshop series on environmental management systems and a recent conference on Green Chemistry for business. Projects have included the development of an ISO 14001 environmental management system that includes elements to move the organization toward sustainability and the development of an Enhanced Chemical Management System for the City of Portland’s Columbia Boulevard Wastewater Treatment Facility. The Zero Waste Alliance is program of the International Sustainable Development Foundation, a 501(c)(3) non-profit corporation. Larry Chalfan Mr. Chalfan is the Executive Director of the Zero Waste Alliance, a partnership of universities, businesses and government organizations dedicated to helping organizations become more competitive while they become more ecologically sustainable. It focuses on elimination of wastes of all kinds and supports the use of the tools of industrial ecology to work toward a cyclical industrial system without waste to nature. He is a 30-year veteran of the semiconductor industry and previously was President and CEO of Oki Semiconductor Manufacturing, the first company in Oregon to achieve ISO 14001 certification for its environmental management system. To work toward sustainability, Oki added the System Conditions of the Natural Step to the ISO 14001 structure.

Pathways to Sustainability 93 Washington State Department of Ecology
He received MS and BS degrees in Electrical Engineering from Oregon State University. He serves on numerous boards including the Oregon State University college of Engineering Advisory Board, The board of the Center for Watershed and Community Health and the Steering Committee of the Oregon Natural Step Network. Larry Chalfan, Executive Director, Zero Waste Alliance 121 SW Salmon Street, Suite 210, Portland, OR 97204 Tel: 503-279-9382 Fax: 503-279-9381 [email protected] www.zerowaste.org SERA Architects SERA Architects’ commitment to sustainability is documented by its 32-year history of creating successful, environmentally responsive projects. As a firm offering fully integrated urban planning, architecture and interior design services, SERA has managed more than $700 million (US) in public and private projects ranging in project size from 100 sq. m. to 25,000 sq. m. Since its founding, SERA has proven its capability both in the design and management of new construction as well as in the renovation of older buildings. Our specialties include historic preservation, seismic upgrading of existing structures to meet new earthquake standards, and developing workshop processes that involve the public or key stakeholders in the creation of a design. Our leadership within national organizations that promote sustainability in the construction industry, such as the U.S. Green Building Council, the Oregon Natural Step Network and the AIA Committee on the Environment, provides us with up- to-date knowledge of green building design. SERA is a leader in sustainable design among Portland, Oregon design firms and the Pacific Northwest. We are committed to producing efficient, attractive, humane buildings that are environmentally responsible and reduce costs for our clients. Logan Cravens Logan Cravens has 15 years architectural experience in a number of building types including churches, primary and secondary schools, commercial planning and design, and a variety government and university facilities. After graduating in 1986 with a Masters of Architecture from The University of Texas at Austin, Logan worked for 3 years in the Washington, D.C. area with a firm primarily involved with church and school design in the region. In 1990, he moved with his wife and two boys to Portland, Oregon which remains their home. Two years were principally spent in construction administration of a major shopping center development in Wilsonville, Oregon. In 1992, Logan passed his architectural exam and accepted an offer to work with the Portland firm of Zimmer Gunsul Frasca. There he had the opportunity to work on such projects as the Ronald Reagan Federal Building and Courthouse in Santa Ana, California and two U.S. Embassy projects in Istanbul, Turkey and Sofia, Bulgaria. In 2001, he became the Director of Green Building Resources at SERA Architects PC, also in Portland. Since 1992, Logan is a recognized leader in the Portland’s sustainable design community. While at ZGF he was Environmental Team Coordinator for ZGF’s four offices. He is a past chair and active member of the AIA/Portland Chapter Committee on the Environment. He is also a founding board member and current president of the Cascadia Region Green Building Council, a firm representative to the U.S. Green Building Council, a member of the Oregon

Pathways to Sustainability 94 Washington State Department of Ecology
Governor’s Sustainable Suppliers Council, and a participating member of the Oregon Natural Step Network Building Task Force. Logan is a certified LEED™ Professional Designer. Rocky Mountain Institute Rocky Mountain Institute was established in 1982 by resource analysts Hunter and Amory Lovins, who still lead it. What began as a small group of colleagues focusing on energy policy has since grown into a broad-based institution with more than 45 full-time staff, an annual budget of nearly $7 million (much of it earned through programmatic enterprise), and a global reach. RMI brings a unique perspective to resource issues, guided by the following core principles: • Advanced resource productivity • Systems thinking • Positive action • Market-oriented solutions • End-use/least-cost approach • Biological insight • Corporate transformation • The pursuit of interconnections • Natural Capitalism More information about RMI is available at www.rmi.org. Christopher Juniper Christopher Juniper, Senior Research Associate and Consultant, is an environmental economist, economic development professional, and small businessperson. Prior to joining RMI, he was Principal of EcoLogic Resources, a business and community sustainability consulting firm. He also served as business development and policy/planning manager for the Portland (Oregon) Development Commission and director of the Oregon Natural Step Network. In Portland, he specialized in sustainable development, neighborhood planning and revitalization, tax policy, and business location issues. He has also served as executive director of the Southwest Colorado Economic Development District, a business development officer for the state of Colorado, the owner/manager of three small businesses, and a home builder/remodeler. Sound Resource Management Group Sound Resource Management (SRMG) is celebrating its 16th anniversary as one of the premier resource management consulting and research firms in the Northwest. True to their passion and convictions, SRMG's principals and staff focus on developing, planning, implementing and managing waste prevention and diversion, recycled-content product, product stewardship and sustainability programs. Located in Seattle and Bellingham, WA, SRMG's mission is distilled in the concept "ZeroWaste." SRMG has helped create and implement nationally recognized programs in the U.S. and Canada.
Pathways to Sustainability 95 Washington State Department of Ecology
Jeff Morris Jeff Morris is a Ph.D. economist trained at the University of California, Berkeley who has been analyzing resource and energy management practices for over fifteen years. Specializing in econometrics and economic planning models, Jeff is well versed in the intricacies of measuring environmental impacts and creating indexes to compare in economic terms otherwise dissimilar measures such as releases of carbon dioxide and mercury to the atmosphere. Jeff also has extensive experience in policy analysis-- for example, serving on the Washington Department of Ecology's stakeholders advisory committee that oversaw development of Washington State's Hazardous Waste Management Plan and serving on the Washington Utilities and Transportation Commission's Regulatory Structures Advisory Committee.
Good Company works with organizations to find opportunity in sustainable development. Good Company’s services help diverse organizations understand sustainability trends, assess
performance, create feasible goals, and communicate sustainable practices to internal and external stakeholders. Good Company has worked recently with such diverse groups as Reed College (in Portland, Oregon), Vassar College, Oregon Parks and Recreation Department, and Eugene Water and Electric Board. Contact information: Good Company 435 Lincoln Street Eugene, OR 97401
Phone: (541) 341-GOOD/4663 Fax: (541) 341-6412 http://www.goodcompany.cc
Joshua Skov Joshua Skov is a co-founder of Good Company. His work has focused on universities and government agencies, providing strategic planning, assessments, and sustainability education. At Good Company, Josh has worked recently with the University of Oregon, Vassar College, Reed College, the Oregon Parks and Recreation Department, and the Washington State Department of Ecology. Josh presents regularly at conferences, including (recently) the National Recycling Coalition’s 2002 conference in Austin, Texas, and the 2002 Sustainable Business Symposium at UO. Josh has an MA in economics from the University of California, Berkeley.