pathways to progress · better off in their ability to get an education, achieve their professional...
TRANSCRIPT

Pathways to Progress Global Youth Survey 2017: Economic Prospects & Expectations
Based on research and analysis by:

Contents
• Background…………………………………………………..p. 3
• Methodology………………………………………………….p. 4
• Executive Summary…………………………………………p. 5-10
• Detailed Data Tables………………………………………..p. 11-68
• The Optimism Gap (p. 12-21)
• The Opportunity Gap (p. 22-39)
• The Education Gap (p. 40-44)
• The Experience Gap (p. 45-49)
• The Small Business Gap (p. 50-56)
• The US Gen Pop (p. 57-68)
2 Source: Ipsos, Global Youth Survey 2017

Background
• Young people today make up the largest youth population in history (1.2B people and 16% of the world’s population)
• Unfortunately this generation faces a common challenge: persistent youth unemployment (more than 13%).
• In conjunction with the expanded Pathways to Progress global investment, the Citi Foundation commissioned a survey with Ipsos to build on existing research and further gauge the economic prospects and pursuits of youth around the world. Specifically, the research looks at:
• How do young people view their future career success?
• What types of careers are young people interested in?
• What resources do they have to help connect them to employment opportunities?
• What barriers, in their minds, do they face when preparing for their future careers?
3 Source: Ipsos, Global Youth Survey 2017

Methodology
• 20 minute online survey
• Target: 18-24 yr. olds
• ~50% high income / 50% low income
• Total Sample size: N=7,000 (~N=150 per city)
• Geography: 45 global cities in 32 countries
• APAC: Bangkok, Beijing, Delhi, Hong Kong, Jakarta, Kuala Lumpur, Manila, Seoul, Shanghai, Singapore, Sydney, Taipei, Ho Chi Minh, Mumbai, Tokyo
• LATAM: Bogota, Buenos Aires, Lima, Mexico City, Panama City, Sao Paulo, Guadalajara
• EMEA: Casablanca, Dubai, Istanbul, Johannesburg, Lagos, London, Madrid, Moscow, Tel Aviv, Warsaw, Nairobi
• NAM: Chicago, Denver, Los Angeles, Miami, New York, Toronto, Washington D.C., San Francisco, Dallas, St. Louis, Jacksonville/Tampa, Cleveland
• Timing: November 2016 – January 2017
4

Young people are optimistic, despite uncertainty and change across the globe
• Young people from large global cities are very optimistic about their future career opportunities, particularly true of those in developing markets.
• This optimism is grounded in the belief that, relative to their parents, they are much better off in their ability to get an education, achieve their professional goals and have opportunities for professional success.
5
% Believe they are doing better relative to their parents when at the same age
Source: Ipsos, Global Youth Survey 2017
Q When thinking about the economy in your city, do you agree or disagree with the following statements? I have many opportunities to succeed in my preferred career
% Believe they have many opportunities to succeed in their preferred career
70% 64%
79%
Total DevelopedMarkets
DevelopingMarkets
Q. How would you rate how you are doing relative to your parents when they were your age on the following…?

For many youth, a mismatch exists between the jobs they have and their aspirations
6
Q. What type of work do you do? If you work for more than one organization, think of your main employer. Q. What field would you most like to have a career in?
Current vs. Preferred Career
Source: Ipsos, Global Youth Survey 2017
• Globally, 55% of employed young people are currently working in an industry that they don’t aspire to work in

On the job experience and networking are seen to be critical factors that would make it easier to find a job
7
What would make it easier to find a new job?
(Among Total Sample)
Q. What would make it easier to find a job/employment?
Developed
Markets
Developing
Markets
47% 50%
42% 39%
36% 35%
34% 32%
35% 31%
32% 29%
30% 24%
Source: Ipsos, Global Youth Survey 2017

Higher Education is also seen to be an important key to success, but is out of reach for many
• Globally, 67% of young people believe that college is necessary to be successful.
• While seen as vital, 69% of young people believe higher education is beyond their financial means.
• The inequality of education opportunity is especially acute in cities in developing countries, like Sao Paulo, New Delhi, Mumbai and Manila.
8
Q. When thinking about the economy in your city, do you agree or disagree with the following statements? You need a university education to be successful Q. When thinking about your education and work opportunities, do you agree or disagree with the following statements? The education I want to achieve is beyond my financial means
The education I want to achieve is beyond my financial means (% Strongly/Somewhat Agree)
Perceived Necessity of University Education vs. Perception Education is Beyond Means
Source: Ipsos, Global Youth Survey 2017

Apprenticeships/Internships believed to be critical for success; however, not enough exist
• Perceived access to apprenticeships and internships is not equally distributed, with cities in developing countries at a disadvantage—including Mumbai, Nairobi, Manila, Jakarta, Lima, Panama City and Delhi.
9
Q. When thinking about the economy in your city, do you agree or disagree with the following statements? Apprenticeships or internships are critical for career success Q. When thinking about your education and work opportunities, do you agree or disagree with the following statements? There are not enough apprenticeships or internships in my city
Perceptions of Apprenticeships / Internships (Strongly/Somewhat Agree)
Importance of Apprenticeships / Internships vs. Perceived Availability
Source: Ipsos, Global Youth Survey 2017
• 8 in 10 believe internships/apprenticeships are critical to career success, particularly pronounced in developing markets.
• However, the majority feel these opportunities do not exist in their city.

The entrepreneurial spirit is strong among young people, but many cite barriers and challenges to achieving this dream
• 69% of young people dream of starting their own business, but lack of education and skills is a key barrier to achieving their dream—particularly in cities in developing markets.
10
Q. Do you agree or disagree with the following statements?
Entrepreneurial Aspirations & Challenges: (% Strongly/Somewhat Agree)
Source: Ipsos, Global Youth Survey 2017

Detailed Data Tables

The Optimism Gap

Opportunity to Succeed in Preferred Career
13
Q. When thinking about the economy in your city, do you agree or disagree with the following statements? I have many opportunities to succeed in my preferred career
Source: Ipsos, Global Youth Survey 2017

Opportunity to Succeed in Preferred Career – City Level
14
Developed Cities Strongly/
Somewhat Agree Los Angeles 74%
St Louis 73%
San Francisco 73%
Cleveland 72%
Washington DC 72%
Denver 71%
Tampa/Jacksonville 71%
Chicago 70%
Miami 70%
New York 70%
Taipei 70%
Moscow 69%
Istanbul 67%
Dallas 66%
Sydney 63%
Tel Aviv 63%
Warsaw 63%
Dubai 60%
Toronto 59%
Singapore 56%
London 54%
Madrid 52%
Hong Kong 48%
Tokyo 44%
Seoul 38%
Developing Cities
Strongly/ Somewhat Agree
Jakarta 93%
Mumbai 92%
Manila 91%
Delhi 87%
Lagos 83%
Beijing 82%
Panama City 82%
Ho Chi Minh 81%
Shanghai 81%
Lima 79%
Johannesburg 78%
Kuala Lumpur 78%
Nairobi 78%
Bangkok 77%
Bogota 74%
Guadalajara 74%
Casablanca 73%
Buenos Aires 67%
Mexico City 66%
Sao Paulo 66%
Q. When thinking about the economy in your city, do you agree or disagree with the following statements? I have many opportunities to succeed in my preferred career
Source: Ipsos, Global Youth Survey 2017

Life Relative to Parents – Total and Region
15
US & Canada
Latin America
Europe Africa/ Mid East
Asia- Pacific
80%
86%
77%
84%
86%
74%
84%
70%
83%
79%
72%
78%
66%
83%
83%
74%
81%
67%
82%
79%
52%
64%
50%
57%
62%
Q. How would you rate how you are doing relative to your parents when they were your age on the following?
Source: Ipsos, Global Youth Survey 2017

Life Relative to Parents – Total, Levels of Development and SES
16
Cities in Developi
ng Markets
Cities in Developed Markets
High SES
Low SES
89% 79% 85% 82%
87%
71%
79%
77%
84%
72%
79%
76%
85%
71%
78%
76%
70%
48%
57%
57%
Q. How would you rate how you are doing relative to your parents when they were your age on the following?
Source: Ipsos, Global Youth Survey 2017

Ability to Get An Education – City Level
17
Developed Cities Much/ Somewhat Better Off Hong Kong 91%
San Francisco 86%
Tampa/Jacksonville 85%
Singapore 84%
St. Louis 82%
New York 81%
Cleveland 80%
Los Angeles 80%
Taipei 80%
Chicago 79%
Moscow 79%
Sydney 79%
Warsaw 79%
Washington DC 79%
Istanbul 78%
Madrid 78%
Seoul 78%
Tel Aviv 78%
Toronto 78%
Dallas 77%
Denver 77%
Miami 77%
London 71%
Dubai 70%
Tokyo 57%
Developing Cities Much/ Somewhat Better Off Nairobi 97%
Jakarta 96%
Mumbai 95%
Bangkok 94%
Delhi 94%
Manila 94%
Guadalajara 91%
Ho Chi Minh 90%
Panama City 90%
Lagos 89%
Shanghai 89%
Beijing 88%
Johannesburg 88%
Kuala Lumpur 87%
Bogota 86%
Sao Paulo 85%
Lima 84%
Buenos Aires 83%
Mexico City 83%
Casablanca 82%
Q. How would you rate how you are doing relative to your parents when they were your age on the following?
Source: Ipsos, Global Youth Survey 2017

Ability to Achieve Your Professional Goals – City Level
18
Developed Cities Much/ Somewhat Better Off Cleveland 84%
St. Louis 81%
Los Angeles 80%
Hong Kong 79%
Tampa/Jacksonville 77%
Tel Aviv 77%
Hong Kong 75%
Moscow 75%
Warsaw 75%
Chicago 74%
Miami 74%
New York 74%
Singapore 74%
Sydney 73%
Dubai 71%
San Francisco 71%
Washington DC 71%
Denver 70%
Dallas 68%
Toronto 66%
London 61%
Seoul 60%
Madrid 59%
Taipei 58%
Tokyo 52%
Developing Cities Much/ Somewhat Better Off Mumbai 94%
Jakarta 93%
Manila 93%
Panama City 93%
Delhi 92%
Johannesburg 91%
Nairobi 91%
Lagos 90%
Beijing 89%
Guadalajara 88%
Bogota 87%
Lima 87%
Shanghai 86%
Kuala Lumpur 84%
Bangkok 82%
Ho Chi Minh 82%
Sao Paulo 81%
Mexico City 78%
Casablanca 76%
Buenos Aires 75%
Q. How would you rate how you are doing relative to your parents when they were your age on the following?
Source: Ipsos, Global Youth Survey 2017

Access to Quality Health Care – City Level
19
Developed Cities Much/ Somewhat Better Off Singapore 85%
Tel Aviv 83%
Hong Kong 82%
Toronto 82%
Los Angeles 79%
Istanbul 78%
San Francisco 76%
Sydney 76%
Taipei 76%
New York 75%
Seoul 74%
Chicago 73%
Dubai 73%
Washington DC 73%
Cleveland 72%
St. Louis 71%
Tampa/Jacksonville 70%
Miami 68%
Denver 67%
Madrid 66%
Warsaw 65%
Dallas 63%
Moscow 62%
Tokyo 62%
London 60%
Developing Cities Much/ Somewhat Better Off Manila 92%
Nairobi 92%
Beijing 89%
Jakarta 89%
Mumbai 89%
Delhi 86%
Bangkok 87%
Casablanca 86%
Ho Chi Minh 86%
Johannesburg 86%
Panama City 86%
Shanghai 86%
Guadalajara 81%
Sao Paulo 81%
Buenos Aires 80%
Lagos 80%
Kuala Lumpur 78%
Mexico City 75%
Bogota 73%
Lima 71%
Q. How would you rate how you are doing relative to your parents when they were your age on the following?
Source: Ipsos, Global Youth Survey 2017

Opportunities for Professional Success – City Level
20
Developed Cities Much/ Somewhat Better Off Moscow 82%
Tel Aviv 80%
Cleveland 79%
Chicago 78%
Los Angeles 77%
New York 77%
Tampa/Jacksonville 77%
Dubai 76%
Istanbul 76%
Miami 76%
Singapore 76%
St Louis 76%
Dallas 73%
Denver 73%
Hong Kong 73%
San Francisco 73%
Sydney 73%
Warsaw 72%
Washington DC 68%
Toronto 67%
London 58%
Taipei 57%
Tokyo 54%
Seoul 51%
Madrid 48%
Developing Cities Much/ Somewhat Better Off Mumbai 95%
Delhi 93%
Jakarta 92%
Manila 92%
Panama City 91%
Johannesburg 89%
Beijing 87%
Guadalajara 87%
Shanghai 87%
Lagos 86%
Lima 85%
Bogota 84%
Ho Chi Minh 84%
Nairobi 83%
Bangkok 82%
Kuala Lumpur 82%
Sao Paulo 77%
Casablanca 76%
Mexico City 73%
Buenos Aires 71%
Q. How would you rate how you are doing relative to your parents when they were your age on the following?
Source: Ipsos, Global Youth Survey 2017

Ability to Afford a Home – City Level
21
Developed Cities Much/ Somewhat Better Off Istanbul 67%
Moscow 67%
Miami 60%
New York 60%
St Louis 60%
Tampa/Jacksonville 60%
Dubai 58%
Chicago 57%
Los Angeles 52%
Warsaw 52%
Dallas 51%
Cleveland 50%
Washington DC 50%
Singapore 44%
Hong Kong 43%
Sydney 43%
Denver 42%
San Francisco 41%
Taipei 36%
Toronto 34%
Madrid 33%
Seoul 33%
Tokyo 33%
London 31%
Tel Aviv 31%
Developing Cities Much/ Somewhat Better Off Manila 89%
Delhi 85%
Jakarta 84%
Mumbai 82%
Shanghai 79%
Ho Chi Minh 77%
Lima 73%
Johannesburg 72%
Lagos 70%
Beijing 69%
Guadalajara 67%
Panama City 67%
Bogota 66%
Kuala Lumpur 65%
Nairobi 64%
Bangkok 62%
Sao Paulo 61%
Mexico City 59%
Buenos Aires 54%
Casablanca 51%
Q. How would you rate how you are doing relative to your parents when they were your age on the following?
Source: Ipsos, Global Youth Survey 2017

The Opportunity Gap

Current Career – Total and Regions
23
Q. What type of work do you do? If you work for more than one organization, think of your main employer.
US & Canada
Latin America Europe Africa/
Mid East Asia-
Pacific
21%
18%
17%
18%
14%
12% 11% 9% 15% 12%
10% 17% 11% 11% 13%
6% 13% 11% 7% 10%
6% 4% 10% 9% 12%
9% 5% 7% 8% 7%
8% 3% 7% 4% 5%
5% 5% 4% 4% 5%
2% 4% 5% 6% 6%
4% 3% 4% 3% 6%
1% 4% 2% 3% 3%
Source: Ipsos, Global Youth Survey 2017

Current Career – Total, Levels of Development and SES
24
Q. What type of work do you do? If you work for more than one organization, think of your main employer.
Cities in Developing
Markets
Cities in Developed
Markets
High SES
Low SES
16% 18% 15% 20%
13% 11% 14% 9%
13% 11% 10% 15%
11% 8% 11% 7%
9% 8% 9% 8%
6% 9% 7% 8%
3% 7% 5% 6%
5% 5% 5% 4%
6% 3% 4% 5%
4% 5% 5% 4%
3% 2% 2% 3%
Source: Ipsos, Global Youth Survey 2017

Preferred Career – Total and Regions
25
Q. What field would you most like to have a career in?
US & Canada
Latin America Europe Africa/ Mid
East Asia-
Pacific
19%
23%
18%
24%
17%
8% 13% 13% 10% 12%
16% 10% 11% 8% 9%
16% 9% 8% 8% 7%
4% 7% 8% 9% 12%
3% 7% 7% 8% 8%
9% 6% 8% 5% 8%
6% 4% 7% 5% 7%
5% 5% 6% 5% 9%
3% 6% 5% 8% 6%
1% 1% 2% 3% 2%
Source: Ipsos, Global Youth Survey 2017

Preferred Career – Total, Levels of Development and SES
26
Q. What field would you most like to have a career in?
Cities in Developing Markets
Cities in Developed
Markets
High SES Low SES
23% 17% 22% 18%
12% 10% 13% 9%
8% 13% 10% 12%
6% 13% 11% 9%
10% 7% 8% 8%
8% 5% 6% 7%
7% 8% 6% 8%
6% 6% 5% 6%
6% 6% 5% 7%
7% 4% 6% 5%
2% 2% 1% 2%
Source: Ipsos, Global Youth Survey 2017
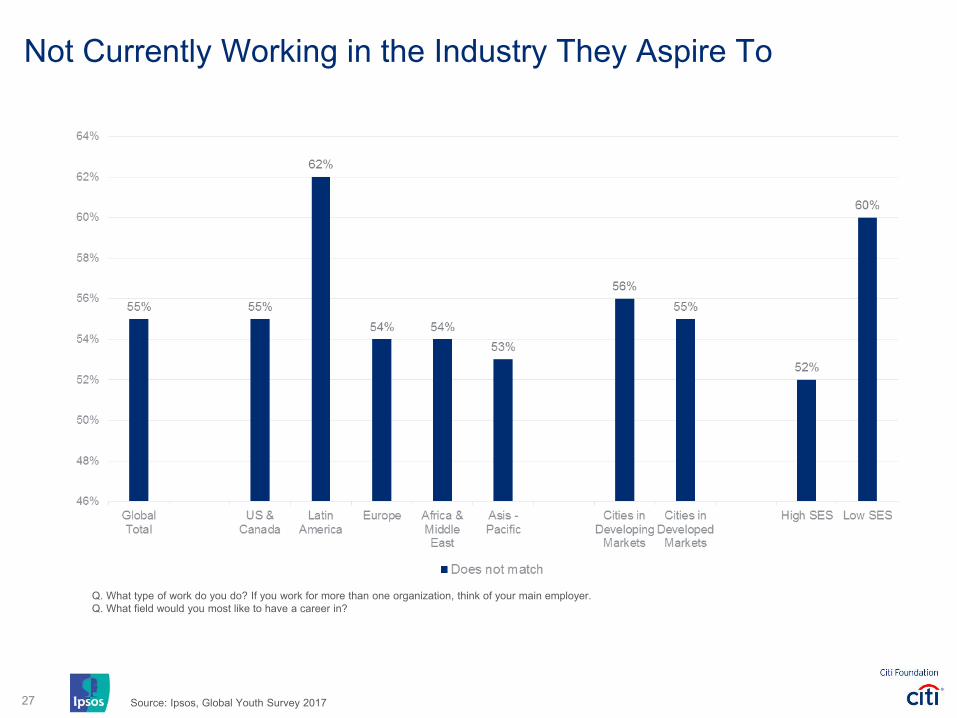
Not Currently Working in the Industry They Aspire To
27
Q. What type of work do you do? If you work for more than one organization, think of your main employer. Q. What field would you most like to have a career in?
Source: Ipsos, Global Youth Survey 2017

Not Currently Working in the Industry They Aspire To – City Level
28
Developed Cities Mismatch Moscow 68% Tel Aviv 68% Sydney 65% Seoul 64% Chicago 63% Cleveland 63% Toronto 61% Washington DC 59% Singapore 57% Istanbul 56% St Louis 56% Tampa/Jacksonville 56% San Francisco 55% Los Angeles 53% Dallas 52% Warsaw 51% Madrid 51% Miami 51% Tokyo 50% Denver 49% Hong Kong 49% London 48% New York 48% Dubai 45% Taipei 39%
Developing Cities Mismatch Buenos Aires 69% Guadalajara 68% Bogota 68% Shanghai 65% Mexico City 63% Ho Chi Minh 62% Sao Paulo 61% Kuala Lumpur 59% Panama City 58% Beijing 54% Lagos 54% Nairobi 52% Johannesburg 52% Casablanca 51% Jakarta 49% Bangkok 48% Manila 47% Lima 47% Mumbai 45% Delhi 43%
Q. What type of work do you do? If you work for more than one organization, think of your main employer. Q. What field would you most like to have a career in?
Source: Ipsos, Global Youth Survey 2017

Current: Tech and Science Career – City Level
29
Developed Cities Working in Tech or Science San Francisco 23%
Istanbul 19%
Madrid 19%
London 18%
Taipei 18%
Miami 17%
Denver 16%
New York 16%
Toronto 16%
Chicago 15%
Seoul 15%
Hong Kong 14%
Los Angeles 14%
Tampa/Jacksonville 14%
Washington DC 14%
Dallas 13%
Dubai 13%
Sydney 13%
Moscow 12%
Tel Aviv 12%
Tokyo 12%
Singapore 10%
Warsaw 9%
Cleveland 8%
St Louis 5%
Developing Cities Working in Tech or Science Lagos 35%
Beijing 34%
Manila 25%
Mumbai 25%
Lima 24%
Nairobi 23%
Shanghai 23%
Casablanca 22%
Delhi 20%
Johannesburg 19%
Guadalajara 18%
Kuala Lumpur 18%
Bogota 16%
Buenos Aires 16%
Ho Chi Minh 14%
Mexico City 14%
Sao Paulo 14%
Jakarta 12%
Bangkok 9%
Panama City 6%
Q. What type of work do you do? If you work for more than one organization, think of your main employer.. [Technology or science & Internet start up]
Source: Ipsos, Global Youth Survey 2017
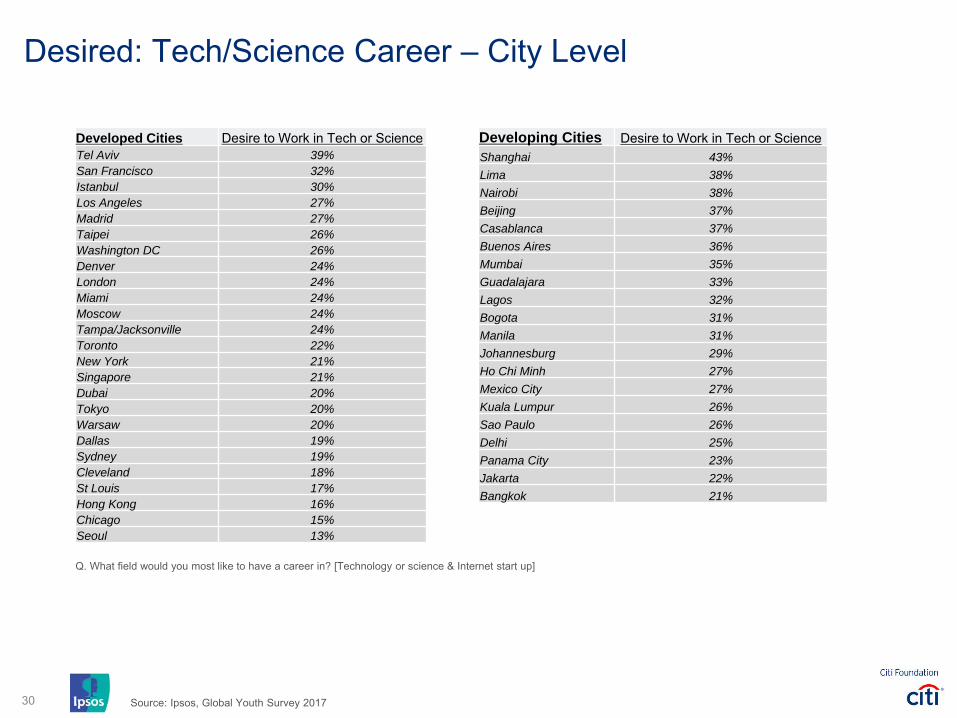
Desired: Tech/Science Career – City Level
30
Developed Cities Desire to Work in Tech or Science Tel Aviv 39%
San Francisco 32%
Istanbul 30%
Los Angeles 27%
Madrid 27%
Taipei 26%
Washington DC 26%
Denver 24%
London 24%
Miami 24%
Moscow 24%
Tampa/Jacksonville 24%
Toronto 22%
New York 21%
Singapore 21%
Dubai 20%
Tokyo 20%
Warsaw 20%
Dallas 19%
Sydney 19%
Cleveland 18%
St Louis 17%
Hong Kong 16%
Chicago 15%
Seoul 13%
Developing Cities Desire to Work in Tech or Science Shanghai 43%
Lima 38%
Nairobi 38%
Beijing 37%
Casablanca 37%
Buenos Aires 36%
Mumbai 35%
Guadalajara 33%
Lagos 32%
Bogota 31%
Manila 31%
Johannesburg 29%
Ho Chi Minh 27%
Mexico City 27%
Kuala Lumpur 26%
Sao Paulo 26%
Delhi 25%
Panama City 23%
Jakarta 22%
Bangkok 21%
Q. What field would you most like to have a career in? [Technology or science & Internet start up]
Source: Ipsos, Global Youth Survey 2017

Assistance in Finding Careers – Total and Regions
31
What Would Make It Easier to Find A New Job
(% Agree) North
America
Latin
America Europe EMEA
Asia-
Pacific
45% 53% 46% 44% 51%
46% 39% 36% 40% 39%
37% 30% 28% 34% 40%
33% 32% 30% 30% 36%
32% 21% 29% 31% 41%
31% 31% 28% 27% 33%
27% 17% 30% 24% 33%
Q. What would make it easier to find a job/employment?
Source: Ipsos, Global Youth Survey 2017

Assistance in Finding Careers – Total and Levels of Development
32
What Would Make It Easier to Find A New Job
(% Agree)
Q. What would make it easier to find a job/employment?
Cities in
Developed
Markets
Cities in
Developing
Markets
High
SES
Low
SES
47% 50% 50% 46%
42% 39% 43% 38%
36% 35% 36% 35%
35% 31% 32% 34%
34% 32% 33% 33%
32% 29% 31% 31%
30% 24% 29% 25%
Source: Ipsos, Global Youth Survey 2017

Assistance Finding Careers – More Jobs in My Field – City Level
33
Developed Cities Agree Seoul 56%
New York 49%
Chicago 43%
Dubai 41%
Taipei 41%
Sydney 37%
Toronto 36%
Singapore 33%
San Francisco 32%
Hong Kong 31%
Istanbul 31%
Los Angeles 31%
Miami 31%
Cleveland 30%
Madrid 30%
Tampa/Jacksonville 30%
Moscow 28%
Tel Aviv 28%
Denver 27%
London 27%
Warsaw 25%
Dallas 21%
St Louis 21%
Washington DC 19%
Tokyo 16%
Developing Cities Agree Sao Paulo 45%
Mumbai 41%
Delhi 39%
Manila 33%
Beijing 32%
Guadalajara 32%
Mexico City 32%
Shanghai 31%
Lagos 31%
Buenos Aires 30%
Kuala Lumpur 28%
Bangkok 28%
Panama City 27%
Bogota 26%
Ho Chi Minh 26%
Lima 25%
Johannesburg 25%
Nairobi 25%
Jakarta 19%
Casablanca 15%
More Jobs in My Field (% Agree)
Q. What would make it easier to find a new job/employment?
Source: Ipsos, Global Youth Survey 2017

Assistance Finding Careers – More Jobs in My City – City Level
34
More Jobs in My City (% Agree)
Q. What would make it easier to find a new job/employment?
Developed Cities Agree Seoul 46%
Singapore 43%
Dubai 41%
Hong Kong 36%
New York 36%
Istanbul 35%
San Francisco 34%
Toronto 33%
Madrid 32%
Sydney 31%
London 30%
Chicago 29%
Moscow 29%
Tokyo 29%
Washington DC 28%
Los Angeles 27%
Denver 26%
Taipei 25%
Dallas 24%
Miami 22%
St Louis 22%
Cleveland 21%
Warsaw 21%
Tampa/Jacksonville 20%
Tel Aviv 18%
Developing Cities Agree Kuala Lumpur 40%
Delhi 39%
Jakarta 38%
Mumbai 35%
Bangkok 35%
Johannesburg 30%
Manila 29%
Sao Paulo 27%
Ho Chi Minh 23%
Nairobi 23%
Beijing 23%
Shanghai 22%
Lima 20%
Lagos 18%
Casablanca 14%
Bogota 14%
Guadalajara 14%
Mexico City 14%
Panama City 14%
Buenos Aires 13%
Source: Ipsos, Global Youth Survey 2017

Assistance Finding Careers – On-the-Job Experience – City Level
35
On-the-Job Experience (% Agree)
Q. What would make it easier to find a new job/employment?
Developed Cities Agree Taipei 63%
Singapore 61%
Hong Kong 59%
San Francisco 53%
Warsaw 53%
Chicago 52%
Madrid 52%
Toronto 50%
Washington DC 50%
New York 48%
Tel Aviv 48%
Dubai 47%
Denver 46%
Istanbul 46%
Los Angeles 46%
Dallas 44%
London 44%
Tampa/Jacksonville 44%
St Louis 42%
Cleveland 41%
Seoul 41%
Sydney 41%
Moscow 33%
Tokyo 33%
Miami 30%
Developing Cities Agree Kuala Lumpur 71%
Ho Chi Minh 70%
Beijing 63%
Bogota 60%
Buenos Aires 59%
Mexico City 56%
Panama City 55%
Shanghai 55%
Lima 51%
Guadalajara 47%
Manila 47%
Casablanca 46%
Sao Paulo 46%
Bangkok 45%
Lagos 44%
Delhi 42%
Jakarta 38%
Johannesburg 38%
Nairobi 38%
Mumbai 37%
Source: Ipsos, Global Youth Survey 2017

Assistance Finding Careers – The Right Education – City Level
36
The Right Education (% Agree)
Developed Cities Agree Hong Kong 57%
Taipei 51%
Tokyo 46%
Istanbul 45%
San Francisco 39%
Singapore 39%
Denver 36%
Cleveland 35%
Tel Aviv 35%
St Louis 34%
Dubai 33%
Los Angeles 32%
New York 32%
Tampa/Jacksonville 32%
Dallas 31%
Warsaw 31%
Chicago 29%
Washington DC 28%
Miami 27%
Sydney 27%
Moscow 26%
Seoul 25%
Toronto 25%
London 23%
Madrid 22%
Developing Cities Agree Ho Chi Minh 50%
Kuala Lumpur 49%
Beijing 44%
Shanghai 44%
Delhi 43%
Casablanca 42%
Bangkok 39%
Manila 37%
Lagos 36%
Mumbai 36%
Jakarta 30%
Sao Paulo 26%
Mexico City 26%
Guadalajara 23%
Johannesburg 23%
Buenos Aires 19%
Panama City 19%
Bogota 17%
Nairobi 17%
Lima 15%
Q. What would make it easier to find a new job/employment?
Source: Ipsos, Global Youth Survey 2017

Assistance Finding Careers – Find Out About Jobs – City Level
37
Find Out About Jobs (% Agree)
Q. What would make it easier to find a new job/employment?
Developed Cities Agree Singapore 59%
Dubai 50%
Hong Kong 48%
Seoul 43%
Toronto 42%
San Francisco 41%
New York 39%
Taipei 38%
Madrid 37%
Tokyo 33%
Washington DC 33%
Chicago 32%
Cleveland 32%
St Louis 32%
Tampa/Jacksonville 32%
Sydney 31%
Warsaw 31%
Istanbul 30%
Denver 29%
Los Angeles 29%
Moscow 29%
Dallas 27%
Miami 27%
London 25%
Tel Aviv 20%
Developing Cities Agree Lagos 46%
Ho Chi Minh 45%
Manila 41%
Mumbai 39%
Buenos Aires 38%
Kuala Lumpur 37%
Mexico City 34%
Bogota 33%
Guadalajara 32%
Nairobi 32%
Delhi 31%
Sao Paulo 30%
Beijing 28%
Lima 28%
Panama City 28%
Jakarta 27%
Bangkok 25%
Shanghai 23%
Johannesburg 21%
Casablanca 13%
Source: Ipsos, Global Youth Survey 2017
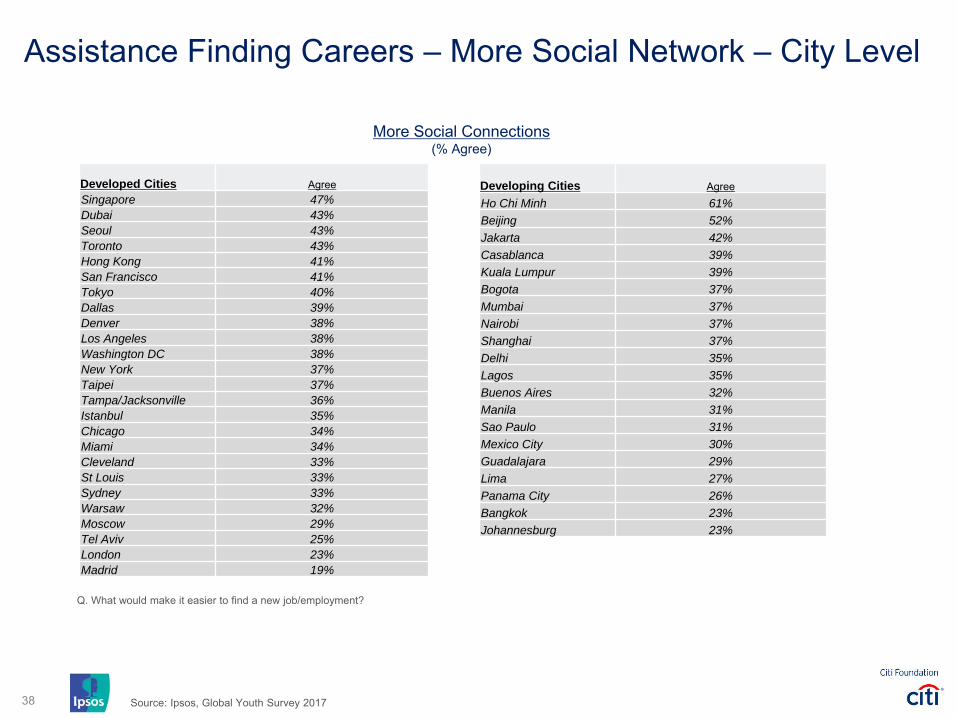
Assistance Finding Careers – More Social Network – City Level
38
More Social Connections (% Agree)
Q. What would make it easier to find a new job/employment?
Developed Cities Agree Singapore 47%
Dubai 43%
Seoul 43%
Toronto 43%
Hong Kong 41%
San Francisco 41%
Tokyo 40%
Dallas 39%
Denver 38%
Los Angeles 38%
Washington DC 38%
New York 37%
Taipei 37%
Tampa/Jacksonville 36%
Istanbul 35%
Chicago 34%
Miami 34%
Cleveland 33%
St Louis 33%
Sydney 33%
Warsaw 32%
Moscow 29%
Tel Aviv 25%
London 23%
Madrid 19%
Developing Cities Agree Ho Chi Minh 61%
Beijing 52%
Jakarta 42%
Casablanca 39%
Kuala Lumpur 39%
Bogota 37%
Mumbai 37%
Nairobi 37%
Shanghai 37%
Delhi 35%
Lagos 35%
Buenos Aires 32%
Manila 31%
Sao Paulo 31%
Mexico City 30%
Guadalajara 29%
Lima 27%
Panama City 26%
Bangkok 23%
Johannesburg 23%
Source: Ipsos, Global Youth Survey 2017

Assistance Finding Careers – More Professional Connections – City Level
39
More Professional Connections (% Agree)
Q. What would make it easier to find a new job/employment?
Developed Cities Agree Singapore 59%
San Francisco 55%
Taipei 54%
Toronto 52%
Washington DC 52%
Dallas 50%
Los Angeles 49%
Denver 48%
Dubai 47%
Chicago 43%
Istanbul 42%
New York 42%
Cleveland 41%
St Louis 40%
Sydney 39%
Miami 38%
Tampa/Jacksonville 38%
Hong Kong 36%
London 36%
Moscow 35%
Madrid 34%
Tel Aviv 33%
Warsaw 32%
Seoul 27%
Tokyo 13%
Developing Cities Agree Ho Chi Minh 54%
Lagos 51%
Bogota 49%
Kuala Lumpur 49%
Nairobi 49%
Mumbai 45%
Jakarta 44%
Buenos Aires 43%
Panama City 40%
Delhi 39%
Guadalajara 36%
Mexico City 36%
Beijing 35%
Manila 35%
Sao Paulo 34%
Lima 33%
Casablanca 32%
Johannesburg 29%
Shanghai 27%
Bangkok 25%
Source: Ipsos, Global Youth Survey 2017

The Education Gap

Education Perspectives – Total and Regions
41
Views On Education (% Strongly/Somewhat Agree)
North
America
Latin
America Europe EMEA
Asia-
Pacific
65% 74% 61% 74% 72%
66% 75% 58% 61% 70%
Q. When thinking about the economy in your city, do you agree or disagree with the following statements? You need a university education to be successful Q. When thinking about your education and work opportunities, do you agree or disagree with the following statements? The education I want to achieve is beyond my financial means
Source: Ipsos, Global Youth Survey 2017

Education Perspectives – Total and Levels of Development
42
Views On Education (% Strongly/Somewhat Agree)
Q. When thinking about the economy in your city, do you agree or disagree with the following statements? You need a university education to be successful Q. When thinking about your education and work opportunities, do you agree or disagree with the following statements? The education I want to achieve is beyond my financial means
Cities in
Developed
Markets
Cities in
Developin
g Markets
High
SES
Low
SES
64% 77% 64% 74%
63% 72% 69% 65%
Source: Ipsos, Global Youth Survey 2017

Education Beyond Financial Means – City Level
43
Education is Beyond means (% Strongly/Somewhat Agree)
Q. When thinking about your education and work opportunities, do you agree or disagree with the following statements? The education I want to achieve is beyond my financial means
Developed Cities Agree Istanbul 75%
Washington DC 74%
Tampa/Jacksonville 71%
Madrid 68%
Denver 68%
Taipei 68%
Dallas 68%
Singapore 67%
Dubai 67%
St Louis 66%
Toronto 65%
Miami 65%
Seoul 64%
New York 64%
Chicago 64%
Hong Kong 63%
Moscow 62%
Los Angeles 61%
San Francisco 60%
Cleveland 60%
Tel Aviv 60%
Sydney 57%
Tokyo 57%
London 50%
Warsaw 50%
Developing Cities Agree Manila 90%
Lagos 85%
Delhi 84%
Guadalajara 84%
Jakarta 83%
Johannesburg 83%
Mumbai 82%
Sao Paulo 79%
Nairobi 79%
Kuala Lumpur 76%
Ho Chi Minh 76%
Lima 76%
Mexico City 75%
Panama City 74%
Shanghai 73%
Casablanca 73%
Beijing 70%
Bogota 69%
Bangkok 61%
Buenos Aires 58%
Source: Ipsos, Global Youth Survey 2017

Need a University Education – City Level
44
Need a University Education (% Strongly/Somewhat Agree)
Q. When thinking about the economy in your city, do you agree or disagree with the following statements? You need a university education to be successful
Developed Cities Agree New York 72%
San Francisco 72%
Chicago 72%
Los Angeles 72%
Singapore 71%
Taipei 70%
Istanbul 69%
Dubai 68%
Moscow 68%
Denver 68%
St Louis 67%
Miami 66%
Washington DC 64%
Hong Kong 61%
Cleveland 61%
Tampa/Jacksonville 61%
Dallas 60%
Tel Aviv 60%
Madrid 58%
Toronto 57%
Sydney 57%
Seoul 56%
Tokyo 53%
London 49%
Warsaw 48%
Developing Cities Agree Mumbai 90%
Delhi 86%
Sao Paulo 84%
Manila 80%
Buenos Aires 79%
Panama City 78%
Beijing 74%
Casablanca 74%
Bogota 74%
Johannesburg 73%
Mexico City 73%
Shanghai 72%
Jakarta 71%
Kuala Lumpur 70%
Guadalajara 70%
Lima 69%
Bangkok 68%
Ho Chi Minh 67%
Lagos 54%
Nairobi 38%
Source: Ipsos, Global Youth Survey 2017

The Experience Gap

Necessity of Experience – Total and Regions
46
Mentorship Requirements of Success (% Strongly/Somewhat Agree)
North
America
Latin
America Europe EMEA
Asia-
Pacific
75% 81% 75% 80% 80%
59% 67% 51% 64% 59%
51% 55% 48% 56% 63%
Q. When thinking about the economy in your city, do you agree or disagree with the following statements? Apprenticeships or internships are critical for career success; I have a strong mentor helping me shape my career Q. When thinking about your education and work opportunities, do you agree or disagree with the following statements? There are not enough apprenticeships or internships in my city
Source: Ipsos, Global Youth Survey 2017

Necessity of Experience – Total and Levels of Development
47
Mentorship Requirements of Success (% Strongly/Somewhat Agree)
Q. When thinking about the economy in your city, do you agree or disagree with the following statements? Apprenticeships or internships are critical for career success; I have a strong mentor helping me shape my career Q. When thinking about your education and work opportunities, do you agree or disagree with the following statements? There are not enough apprenticeships or internships in my city
Cities in
Develope
d Markets
Cities in
Developin
g Markets
High
SES
Low
SES
73% 85% 80% 77%
56% 65% 58% 62%
48% 65% 57% 54%
Source: Ipsos, Global Youth Survey 2017

Need for Internships – City Level
48
Apprenticeships or Internships are Critical for Career Success (% Strongly/Somewhat Agree)
Developed Cities Strongly/Somewhat Agree Taipei 89%
Chicago 83%
Moscow 83%
Tel Aviv 81%
Istanbul 79%
New York 79%
St Louis 79%
Denver 77%
Singapore 77%
Madrid 76%
San Francisco 75%
Tampa/Jacksonville 75%
Warsaw 75%
Toronto 74%
Cleveland 73%
Dallas 73%
Los Angeles 73%
Washington DC 72%
Hong Kong 70%
Miami 70%
Sydney 66%
London 60%
Dubai 59%
Seoul 59%
Tokyo 54%
Developing Cities Strongly/Somewhat Agree Jakarta 95%
Nairobi 95%
Mumbai 92%
Shanghai 91%
Bogota 89%
Delhi 88%
Kuala Lumpur 87%
Panama City 87%
Ho Chi Minh 86%
Lima 86%
Casablanca 85%
Manila 85%
Bangkok 84%
Beijing 84%
Guadalajara 83%
Lagos 83%
Buenos Aires 77%
Johannesburg 76%
Mexico City 76%
Sao Paulo 70%
Q. When thinking about the economy in your city, do you agree or disagree with the following statements? Apprenticeships or internships are critical for career success
Source: Ipsos, Global Youth Survey 2017

Lack of Internships – City Level
49
There are Not Enough Apprenticeships or Internships in My City (% Strongly/Somewhat Agree)
Developed Cities Strongly/Somewhat Agree Cleveland 73%
Dubai 67%
Chicago 64%
Los Angeles 63%
Sydney 63%
St Louis 62%
Tel Aviv 62%
Miami 61%
Dallas 60%
Istanbul 60%
Toronto 60%
Hong Kong 59%
Madrid 59%
Singapore 59%
Tampa/Jacksonville 57%
Washington DC 57%
San Francisco 56%
Denver 52%
New York 50%
Seoul 50%
Moscow 49%
London 46%
Taipei 46%
Warsaw 42%
Tokyo 33%
Developing Cities Strongly/Somewhat Agree
Mumbai 78%
Nairobi 78%
Manila 77%
Panama City 77%
Delhi 76%
Lima 75%
Sao Paulo 69%
Guadalajara 67%
Johannesburg 67%
Jakarta 66%
Buenos Aires 61%
Kuala Lumpur 61%
Lagos 61%
Mexico City 61%
Ho Chi Minh 59%
Bogota 56%
Beijing 54%
Bangkok 52%
Shanghai 50%
Casablanca 48%
Q. When thinking about the economy in your city, do you agree or disagree with the following statements? There are not enough apprenticeships or internships in my city
Source: Ipsos, Global Youth Survey 2017

The Small Business Gap

Small Business Attitudes – Total and Regions
51
Attitudes Regarding Small Business (% Strongly/Somewhat Agree)
Q. Do you agree or disagree with the following statements?
North
America
Latin
America Europe EMEA
Asia-
Pacific
78% 82% 74% 72% 83%
72% 85% 69% 82% 75%
57% 84% 61% 81% 70%
49% 66% 46% 67% 65%
37% 57% 38% 58% 56%
Source: Ipsos, Global Youth Survey 2017

Small Business Attitudes – Total and Levels of Development
52
Attitudes Regarding Small Business (% Strongly/Somewhat Agree)
Cities in
Developed
Markets
Cities in
Developing
Markets
High
SES
Low
SES
76% 82% 79% 78%
67% 87% 77% 75%
56% 86% 68% 70%
47% 74% 60% 58%
36% 66% 48% 51%
Q. Do you agree or disagree with the following statements?
Source: Ipsos, Global Youth Survey 2017

Dream of Owning Business – City Level
53
Dream is to Own My Own Business
(% Strongly/Somewhat Agree)
Developed Cities Strongly/Somewhat Agree Istanbul 75%
Dubai 66%
Miami 66%
Tampa/Jacksonville 64%
Moscow 63%
Toronto 63%
Warsaw 61%
Los Angeles 58%
Tel Aviv 58%
Chicago 57%
New York 57%
Washington DC 57%
Dallas 56%
Denver 54%
Madrid 52%
St Louis 52%
Sydney 52%
London 51%
San Francisco 51%
Singapore 51%
Taipei 51%
Cleveland 48%
Seoul 48%
Hong Kong 47%
Tokyo 32%
Developing Cities Strongly/Somewhat Agree Jakarta 97%
Nairobi 96%
Lagos 95%
Lima 95%
Panama City 95%
Bangkok 92%
Mumbai 91%
Bogota 90%
Johannesburg 89%
Manila 89%
Guadalajara 88%
Delhi 85%
Casablanca 84%
Beijing 82%
Mexico City 82%
Shanghai 82%
Kuala Lumpur 77%
Ho Chi Minh 76%
Sao Paulo 71%
Buenos Aires 70%
Q. Do you agree or disagree with the following statements? My dream is to own my own business
Source: Ipsos, Global Youth Survey 2017

Perspectives on New Business – Total and Regions
54
Barriers to Entrepreneurships (% Strongly/Somewhat Agree)
Q. Do you agree or disagree with the following statements?
North
America
Latin
America Europe EMEA
Asia-
Pacific
60% 84% 69% 79% 71%
68% 70% 59% 72% 69%
59% 68% 54% 77% 71%
53% 53% 58% 47% 58%
Source: Ipsos, Global Youth Survey 2017

Perspectives on New Business – Total and Levels of Development
55
Barriers to Entrepreneurships (% Strongly/Somewhat Agree) Cities in
Developed
Markets
Cities
Developin
g Markets
High
SES
Low
SES
58% 87% 69% 72%
66% 71% 68% 68%
57% 78% 64% 67%
54% 55% 53% 56%
Q. Do you agree or disagree with the following statements?
Source: Ipsos, Global Youth Survey 2017

Small Business Barriers – City Level
56
New or Small Business Not Likely To Succeed in My City
(% Strongly/Somewhat Agree)
Developed Cities Strongly/Somewhat Agree Seoul 74%
Chicago 69%
Istanbul 67%
Hong Kong 66%
New York 64%
Dubai 63%
Miami 62%
Moscow 59%
Warsaw 59%
Madrid 58%
Sydney 58%
Washington DC 57%
Los Angeles 53%
London 49%
San Francisco 49%
Tampa/Jacksonville 49%
Tel Aviv 49%
Toronto 49%
Cleveland 48%
Taipei 47%
Dallas 43%
Denver 42%
Singapore 41%
St Louis 41%
Tokyo 30%
Developing Cities Strongly/Somewhat Agree Jakarta 76%
Delhi 71%
Mumbai 71%
Mexico City 65%
Beijing 64%
Shanghai 62%
Sao Paulo 59%
Johannesburg 56%
Manila 56%
Bangkok 55%
Ho Chi Minh 53%
Bogota 52%
Casablanca 52%
Kuala Lumpur 52%
Lima 52%
Guadalajara 51%
Panama City 47%
Buenos Aires 45%
Lagos 32%
Nairobi 31%
Q. Do you agree or disagree with the following statements? New or small businesses are not likely to succeed in my city
Source: Ipsos, Global Youth Survey 2017
U.S. General Population Data

Base: US Gen Pop Currently Employed or Running own Business Q. What type of work do you do? If you work for more than one organization, think of your main employer. Q. What field would you most like to have a career in?
Gap Between Current and Preferred Careers
Current and Preferred Careers (US Gen Pop)
58 Source: Ipsos, Global Youth Survey 2017

Base: US Gen Pop Q. What field would you most like to have a career in?
Avg/High SES
Low SES Male Female
Moved W/in 2
Yrs
Not Moved W/in 2
Yrs
23% 18% 30% 12% 15% 25%
19% 14% 6% 27% 25% 14%
10% 11% 10% 11% 11% 10%
5% 6% 5% 7% 4% 6%
5% 8% 10% 2% 4% 7%
5% 5% 6% 5% 1% 7%
5% 6% 5% 5% 6% 6%
5% 6% 5% 5% 6% 6%
5% 3% 6% 3% 5% 3%
3% 2% 4% - 3% 1%
1% 3% 2% 1% 1% 2%
Preferred Careers – By Subgroups (US Gen Pop)
59 Source: Ipsos, Global Youth Survey 2017

Base: US Gen Pop Q. What field would you most like to have a career in?
Current Student Not Student Working Not Working
22% 19% 20% 22%
20% 13% 15% 19%
10% 11% 9% 13%
12% 11% 12% 11%
5% 7% 5% 7%
4% 9% 8% 4%
3% 8% 7% 4%
6% 4% 4% 6%
5% 4% 4% 4%
2% 2% 4% -
- 4% 2% 1%
Preferred Careers – By Subgroups Cont (US Gen Pop)
60 Source: Ipsos, Global Youth Survey 2017

Base: US Gen Pop Q. When thinking about the economy in your city, do you agree or disagree with the following statements?
Avg/High SES
Low SES Male Female
Moved W/in 2
Yrs
Not Moved W/in 2
Yrs
80% 68% 74% 75% 75% 76%
71% 61% 64% 69% 72% 68%
67% 64% 66% 66% 61% 66%
53% 60% 57% 56% 55% 57%
57% 53% 57% 53% 51% 57%
57% 54% 55% 56% 51% 56%
51% 45% 53% 43% 45% 50%
44% 45% 47% 42% 32% 49%
44% 42% 56% 30% 34% 44%
Experience is Necessary – By Subgroups (US Gen Pop)
61 Source: Ipsos, Global Youth Survey 2017

Base: US Gen Pop Q. When thinking about the economy in your city, do you agree or disagree with the following statements?
Current Student
Not Student Working
Not Working
78% 69% 76% 73%
69% 62% 68% 65%
69% 61% 67% 65%
55% 58% 58% 55%
57% 52% 58% 52%
61% 47% 56% 54%
48% 49% 54% 41%
43% 46% 44% 45%
39% 48% 47% 37%
Experience is Necessary – By Subgroups Cont (US Gen Pop)
62 Source: Ipsos, Global Youth Survey 2017

Base: US Gen Pop Q . When thinking about your education and work opportunities, do you agree or disagree with the following statements?
Avg/High SES
Low SES Male Female
Moved W/in 2
Yrs
Not Moved W/in 2
Yrs
88% 80% 80% 88% 84% 84%
85% 73% 79% 79% 80% 80%
78% 74% 78% 75% 74% 76%
61% 66% 65% 62% 57% 64%
63% 62% 64% 60% 52% 67%
Lack of Internships – By Subgroups (US Gen Pop)
63 Source: Ipsos, Global Youth Survey 2017

Base: US Gen Pop Q . When thinking about your education and work opportunities, do you agree or disagree with the following statements?
Current Student
Not Student Working
Not Working
89% 78% 81% 88%
81% 77% 80% 79%
77% 75% 77% 76%
59% 69% 64% 63%
62% 63% 64% 60%
Lack of Internships – By Subgroups Cont (US Gen Pop)
64 Source: Ipsos, Global Youth Survey 2017

Base: US Gen Pop Q. Do you agree or disagree with the following statements?
Avg/High SES
Low SES Male Female
Moved W/in 2
Yrs
Not Moved W/in 2
Yrs
75% 74% 75% 74% 84% 70%
69% 70% 74% 65% 67% 71%
61% 62% 70% 53% 52% 65%
58% 54% 61% 51% 44% 58%
Small Business Attitudes – By Subgroups (US Gen Pop)
65 Source: Ipsos, Global Youth Survey 2017

Base: US Gen Pop Q. Do you agree or disagree with the following statements?
Current Student
Not Student Working
Not Working
73% 77% 77% 72%
66% 75% 72% 66%
61% 61% 63% 60%
54% 59% 61% 50%
Small Business Attitudes – By Subgroups Cont (US Gen Pop)
66 Source: Ipsos, Global Youth Survey 2017

Base: US Gen Pop Q. Do you agree or disagree with the following statements?
Avg/High SES
Low SES Male Female
Moved W/in 2
Yrs
Not Moved W/in 2
Yrs
78% 79% 77% 80% 74% 82%
73% 71% 76% 68% 69% 72%
53% 61% 64% 49% 45% 59%
54% 53% 63% 44% 44% 59%
39% 46% 54% 32% 29% 47%
Entrepreneurial Attitudes – By Subgroups (US Gen Pop)
67 Source: Ipsos, Global Youth Survey 2017

Base: US Gen Pop Q. Do you agree or disagree with the following statements?
Entrepreneurial Attitudes – By Subgroups (US Gen Pop)
Current Student
Not Student Working
Not Working
84% 70% 76% 81%
69% 76% 75% 68%
53% 61% 61% 51%
50% 58% 58% 48%
36% 52% 49% 35%
Source: Ipsos, Global Youth Survey 2017 68