patent cooperation treaty yearly review - wipo - world ...economics & statistics series 2016...
TRANSCRIPT
Eco
nom
ics
& S
tatis
tics
Ser
ies
2016
Patent Cooperation TreatyYearly Review
Pat
ent
Co
op
erat
ion
Trea
ty Y
earl
y R
evie
w
The International Patent System
Eco
nom
ics
& S
tatis
tics
Ser
ies
2016

Eco
nom
ics
& S
tatis
tics
Ser
ies
2016
Patent Cooperation Treaty Yearly Review
The International Patent System


3
The PCT Yearly Review was developed under the direction of Francis Gurry (Director General) and su-pervised by Carsten Fink (Chief Economist). The report was prepared by a team led by Bruno Le Feuvre and comprising Kyle Bergquist, Mosahid Khan, Ryan Lamb, Gerard Torres, Yukio Yanagimoto and Hao Zhou, all from the Economics and Statistics Division.
Additional valuable contributions were provided by Philippe Baechtold, Matthew Bryan, Debra Collier, Patrick Genin, Thomas Marlow, Ken-Ichiro Natsume, Bert Beijer, James Phillips, Mike Richardson and Ting Zhao and other colleagues in the Patents and Technology Sector.
Samiah Do Carmo Figueiredo and Caterina Valles Galmes provided valuable administrative support. Gratitude is also due to Brenda O’Hanlon for editing the review; to the Communications Division for design-ing the review; and to staff in the Language Division and the Printing and Publication Production Section for their services.
Finally, WIPO is grateful to national and regional patent offices for sharing their annual statistics.
Online resourcesThe electronic version of the review, as well as the images and the underlying data used to compute all figures and tables, can be downloaded at www.wipo.int/ipstats.This webpage also provides links to the IP Statistics Data Center – offering access to WIPO’s statistical data – and the IP statistical country profiles.
Conditions of useYou are welcome to use the information provided in this publication, but please cite WIPO as the source.
By using WIPO’s statistical data, you agree not to republish or commercially resell WIPO’s statistical datasets. In addition, when using WIPO’s statistics data in any written work, you are requested to cite
“WIPO Statistics Database” as the source of the data.
Contact informationEconomics and Statistics DivisionWebsite: www.wipo.int/ipstatse-mail: [email protected]
AcknowledgementsFurther Information

4
2015 Key Numbers
Number Description (Trend1)
595,400 PCT national phase entries2 (+5.2%)
218,000 PCT applications filed (+1.7%)
48,539 Applicants3
(-2.2%)
132 Countries in which PCT applications were filed (+8)
57 Share of PCT national phase entries (+1.4) in worldwide non-resident filings (in percent)
1. Trends correspond to annual growth rates in percentage, in volume or in percentage point.2. The latest available year for PCT national phase entry data is 2014.3. PCT applicants refer to first-named applicants in published PCT applications.

5
HighlightsPCT applications grew by 1.7%
An estimated 218,000 PCT applications were filed in 2015, representing an increase of 1.7% on filings in 2014. The year 2015 marked the fifth consecutive year of growth.
Filings dropped in the U.S. and grew sharply in Asia
Applicants from the U.S. accounted for the largest number of PCT applications, with 57,385 applications filed in 2015. Compared with 2014, the number of such filings decreased by 6.7%. This drop was likely due to an unusually large number of filings in 2014 that was linked to changes in the U.S. patent system.
Of the world’s six main geographical regions, Asia recorded by far the sharpest growth in filings (+9%). Filings in Europe (+0.3%) remained stable whereas those in North America (-6.7%) decreased. Four of the top 10 PCT filing countries in Asia saw double-digit growth, such as China (+16.8%) and the Republic of Korea (+11.5%). Japan, the second largest user of the System, saw growth of 4.4% in 2015.
Among middle-income countries, notable increases were seen in Thailand (+94.1%), Peru (+47.1%), Turkey (+19.1%) and Mexico (+12.7%).
Huawei remained the top PCT applicant, with almost 4,000 applications
The top five applicants were largely unchanged from 2014. With 3,898 published PCT applications, Huawei Technologies of China remained the top PCT applicant. It was followed by US-based Qualcomm Incorporated (2,442 published applications) and China’s ZTE (2,155). The only change among the top five came from Samsung Electronics (1,683) of the Republic of Korea, which moved up seven places to rank fourth, before Mitsubishi Electric (1,593) of Japan.
Electrical engineering was the main sector of filing for the majority of the top 50 companies; of these com-panies, 9 were among the top 10 PCT applicants. A large number of the top 50 companies mainly filed in the field of digital communication, including 6 of the top 7 applicants.
The U.S. accounted for the largest number of applicants among the top 50 universities. However, with four fewer applicants than in the previous year, 2015 marked the first time that U.S. universities did not account for the majority of universities in the top PCT applicants list. Altogether, universities from 10 countries ranked among the top 50 applicants, including for the first time a university from Saudi Arabia.
Two government and research institutions from middle-income countries – Malaysia and India – ranked sixth and ninth, respectively, among the top PCT applicants in the government and research institutions sector. The Republic of Korea and the U.S. had the largest number of applicants in the top 30 list for this sector, with six each. They were followed by China, France and Japan, each of which had three applicants.
Computer technology remained the field of technology with the most applications
For the second consecutive year, computer technology was the field of technology with the highest number of PCT applications published (16,385). It was followed by digital communication (16,047) and electrical ma-chinery (14,612). The ranking of these top three fields of technology remained unchanged from 2014.
National phase entries grew by 5% worldwide
National phase entries (NPEs) totaled an estimated 595,400 in 2014, representing an increase of 5.2% compared with 2013. The U.S. (44%), China (15%) and Japan (10%) drove most of this growth. At the global level, NPEs accounted for 57% of all patent applica-tions filed abroad.
China joined the top five origins list
Applicants from the U.S. remained the largest filers of NPEs, with 170,928 applications and a growth rate of 8.2% on 2013. The U.S. was followed by appli-cants from Japan (123,787), Germany (60,224), France (30,153) and China (22,473). With an annual growth rate of 24.1%, China advanced three places to become the fifth largest filer of NPEs in 2014.
Growth in the number of NPEs initiated was also notable in the case of applicants residing in Saudi Arabia (+148%), Chile (+45.5%), Malaysia (+25.4%), Turkey (+24.7%) and South Africa (+19.6%).

6
Table of Contents2015 Key Numbers 4
Highlights 5
A Brief Presentation of the Patent Cooperation Treaty 9
Data Description 12
Special Theme – the PCT Market Share 13
Section A – Statistics on The International Phase: PCT Applications 25
A.1 – Overview 25A.1.1 – Overall trend 25A.1.2 – Top receiving offices 25
A.2 – PCT applications by country of origin 26A.2.1 – World map 26A.2.2 – Filing trends 27A.2.3 – PCT applications as a share of resident applications 28
A.3 – PCT applicants 30A.3.1 – Distribution of applicants 30A.3.2 – Share of PCT applications with foreign co-applicants 30A.3.3 – Top PCT applicants 32
A.4 – PCT applications by fields of technology 34A.4.1 – Overall trend 34A.4.2 – Countries’ specialization 34
Section B – Statistics on PCT National Phase Entries 41
B.1 – Overview 41B.1.1 – Overall trend 41B.1.2 – Non-resident patent applications by filing route 42
B.2 – National phase entries by country of origin 42B.2.1 – World map 42B.2.2 – Filing trends 44B.2.3 – PCT national phase entries per PCT application 46B.2.4 – Share of PCT national phase entries in total filings abroad 47
B.3 – National phase entries by office 48B.3.1 – Top offices 48B.3.2 – Share of PCT national phase entries in non-resident filings 50

7
TABLE OF CONTENTS
Section C – Performance of the PCT System 53
C.1 – International Bureau 53C.1.1 – Electronic filing and processing 53C.1.2 – Translation and terminology database 54C.1.3 – Timeliness in examining and publishing PCT applications 56C.1.4 – Quality in processing applications 58C.1.5 – Efficiency in processing applications 59
C.2 – Receiving offices 60C.2.1 – Distribution of applications by medium of filing 60C.2.2 – Timeliness in transmitting applications 60
C.3 – International searching authorities 63C.3.1 – International search reports by authority 63C.3.2 – Timeliness in transmitting reports 65
C.4 – Supplementary international searching authorities 67C.4.1 – Supplementary international search reports by authority 67
C.5 – International preliminary examining authorities 67C.5.1 – International preliminary reports on patentability by authority 67C.5.2 – Timeliness in transmitting reports 68
C.6 – PCT-Patent Prosecution Highway pilots 70C.6.1 – New PCT-PPH pilots 70C.6.2 – Number of requests by office 70
C.7 – PCT user satisfaction survey 72
Section D – Development of the PCT System 75
D.1 – Electronic Filing and Processing of PCT Applications 75D.1.1 – ePCT-Filing 75D.1.2 – ePCT system 75D.1.3 – Decommissioning of PCT EASY 76
D.2 – PATENTSCOPE Search System 76
D.3 – WIPO Pearl database 77
D.4 – Legal Developments 77D.4.1 – Amendments that entered into force in 2015 77D.4.2 – Amendments adopted in 2015 that will enter into force in 2016 78D.4.3 – Amendments adopted in 2015 that will enter into force in 2017 78
D.5 – Meetings 78D.5.1 – Meeting of International Authorities 78D.5.2 – PCT Working Group 78D.5.3 – PCT Assembly 79
D.6 – PCT Training 79D.6.1 – Seminars 79D.6.2 – Webinars 79D.6.3 – Distance learning 79D.6.4 – International cooperation 79
Statistical Table 81
Acronyms 84
Glossary 85
PCT Contracting States 88
Additional Resources 89

8
XXX XXX
9
A Brief Presentation of the Patent Cooperation Treaty
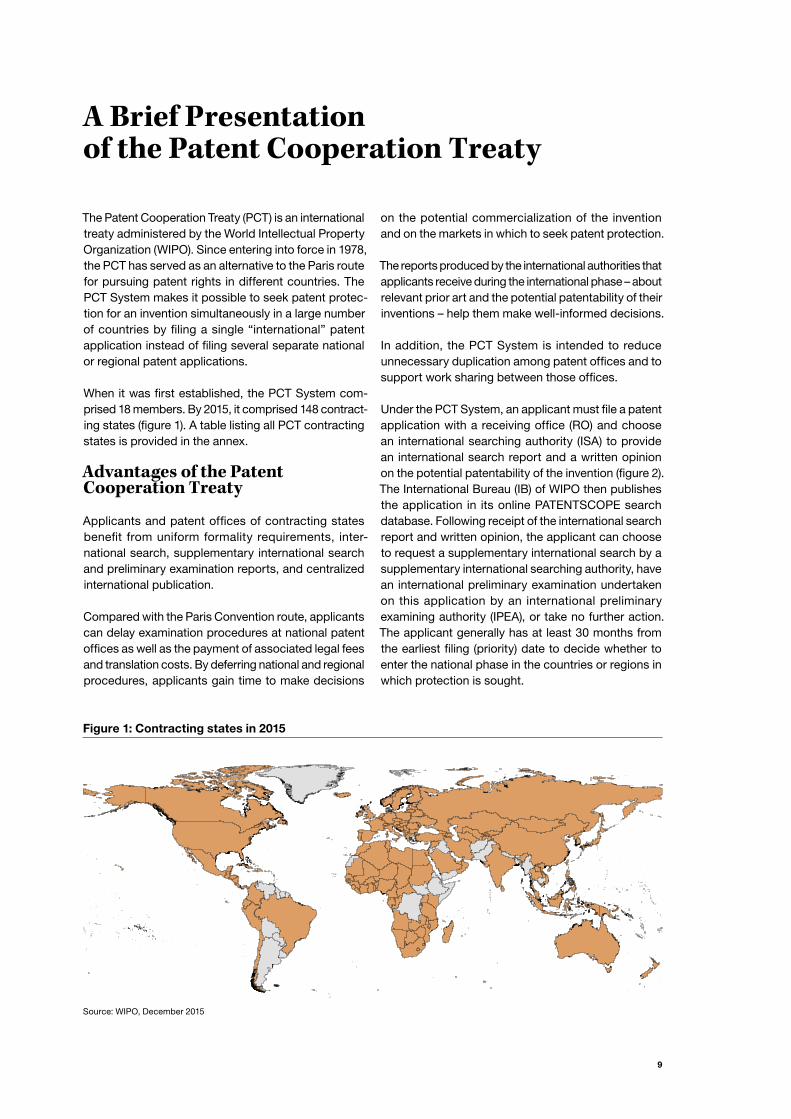
The Patent Cooperation Treaty (PCT) is an international treaty administered by the World Intellectual Property Organization (WIPO). Since entering into force in 1978, the PCT has served as an alternative to the Paris route for pursuing patent rights in different countries. The PCT System makes it possible to seek patent protec-tion for an invention simultaneously in a large number of countries by filing a single “international” patent application instead of filing several separate national or regional patent applications.
When it was first established, the PCT System com-prised 18 members. By 2015, it comprised 148 contract-ing states (figure 1). A table listing all PCT contracting states is provided in the annex.
Advantages of the Patent Cooperation Treaty
Applicants and patent offices of contracting states benefit from uniform formality requirements, inter-national search, supplementary international search and preliminary examination reports, and centralized international publication.
Compared with the Paris Convention route, applicants can delay examination procedures at national patent offices as well as the payment of associated legal fees and translation costs. By deferring national and regional procedures, applicants gain time to make decisions
on the potential commercialization of the invention and on the markets in which to seek patent protection.
The reports produced by the international authorities that applicants receive during the international phase – about relevant prior art and the potential patentability of their inventions – help them make well-informed decisions.
In addition, the PCT System is intended to reduce unnecessary duplication among patent offices and to support work sharing between those offices.
Under the PCT System, an applicant must file a patent application with a receiving office (RO) and choose an international searching authority (ISA) to provide an international search report and a written opinion on the potential patentability of the invention (figure 2). The International Bureau (IB) of WIPO then publishes the application in its online PATENTSCOPE search database. Following receipt of the international search report and written opinion, the applicant can choose to request a supplementary international search by a supplementary international searching authority, have an international preliminary examination undertaken on this application by an international preliminary examining authority (IPEA), or take no further action. The applicant generally has at least 30 months from the earliest filing (priority) date to decide whether to enter the national phase in the countries or regions in which protection is sought.
Figure 1: Contracting states in 2015
Source: WIPO, December 2015

10
A BRIEF PRESENTATION OF THE PATENT COOPERATION TREATY
Figure 2: Overview of the PCT System
International phase
The international phase usually continues for a period of 18 months and mainly involves the filing and formal examination of the application, international search, international publication, optional supplementary inter-national search and optional international preliminary examination. Published applications are accessible free of charge through WIPO’s online PATENTSCOPE search system.
Filing applications
Typically, applicants seeking to protect an invention in more than one country first file a national or regional patent application with their national or regional patent office. Within 12 months from the filing date of that first application (a time limit set by the Paris Convention), they file an international application under the Patent Cooperation Treaty with a receiving office – the respec-tive national or regional patent office, or the IB – thus beginning the international phase. Only a national or
resident of a PCT contracting state can file a PCT ap-plication. If there are several applicants named in the PCT application, only one of them needs to comply with this requirement.
Because the application has legal effect in all con-tracting states, applicants can effectively postpone the requirement to pay certain substantial fees and costs, such as the translation of the application into national languages.
The RO transmits a copy of the application to the IB, which is responsible for:• receiving and storing all application documents;• performing a second formalities examination;• translating the title and abstract of the application
and certain associated documents into English and/or French, where necessary;
• publishing the application and related documents in PATENTSCOPE; and
• communicating documents to offices and third parties.

11
A BRIEF PRESENTATION OF THE PATENT COOPERATION TREATY
International search
Applications are subject to an international search by one of the 19 functioning ISAs,4 which identify the prior art relevant to the patentability of the invention, estab-lish an international search report, and provide a written opinion on the invention’s potential patentability. That opinion can assist the applicant in deciding whether to continue to seek protection for the invention. If the writ-ten opinion is unfavorable, the applicant may choose to amend the application to improve the probability of obtaining a patent, to withdraw the application before international publication and before incurring additional costs, or to do nothing.
Supplementary international search
Since January 1, 2009, the supplementary international search service has offered applicants the option to request additional searches from ISAs other than the one that carried out the initial search. This service aims to give applicants the option of obtaining a more complete overview of the prior art in the international phase by allowing them to have an additional search performed in an ISA’s specialty language. Applicants can request a supplementary international search report by a supplementary ISA up to 19 months from the filing (priority) date.
International preliminary examination
After receiving the ISA’s written opinion, applicants can request an optional international preliminary examina-tion – a second evaluation of the invention’s patent-ability – to be carried out by an IPEA, usually on an amended version of the application (all ISAs are also IPEAs). The resulting international preliminary report on patentability further assists the applicant in determining whether to enter the national phase.
National phase
Applicants have at least 18 months from the filing date of their applications before entering the national phase at individual patent offices. This delay affords additional time – compared with that allowed under the Paris Convention – to evaluate the chances of obtaining a
4. The State Intellectual Property Service of Ukraine notified that it would commence operations on February 5, 2016 and the Visegrad Patent Institute was appointed as an international searching authority (ISA), bringing to 21 the total number of ISAs. However, these two offices had not yet commenced operations in 2015.
patent and to plan how to use the invention commer-cially in the countries in which protection is sought. In the national phase, each patent office is responsible for processing the application in accordance with its national patent laws, and for deciding whether to grant patent protection. The time required for that processing varies across patent offices.
Patent Prosecution Highway
The PCT Patent Prosecution Highway (PCT-PPH) pilots comprise bilateral agreements between patent offices to enable applicants to request a fast-track examination procedure. Under these agreements, an applicant re-ceiving a written opinion or an international preliminary report on patentability indicating that at least one claim in the PCT application has novelty, an inventive step and industrial applicability may request that the other patent offices fast-track the examination of correspond-ing claims in corresponding applications. The applicant may request the PCT-PPH procedure when entering the national phase of the PCT in a participating designated state. The advantage for PCT applicants is that patent applications are processed faster and more efficiently by designated (or elected) offices. Participating offices also benefit from a reduced examination workload and additional knowledge sharing.
The Global Patent Prosecution Highway (GPPH) was launched in 2014. The GPPH pilot is a single multilat-eral agreement between a group of offices (a total of 21 at the end of 2015). It enables applicants to make a request for accelerated processing at any participating office, based on work products (including PCT reports) from any of the other participating offices, using a single set of qualifying requirements.
For more information on the PCT, please visit www.wipo.int/pct/.
12
Data Description
In order to compile figures on the international phase of the PCT System, data were drawn from the WIPO Statistics Database. Due to the delay in transmitting PCT applications to WIPO, the figures for 2015 are esti-mates. For top filing countries, the estimates are made using several statistical and econometric models. For other countries, the estimates adjust actual received applications according to each country’s share of the estimated total PCT filings.
In 2015, the number of published PCT applications decreased by nearly 5%. This decrease was partly due to the fact that in 2014 – as happens every five to six years – the number of weeks of publication was 53 instead of 52, which resulted in an increase in the num-ber of publications recorded that year. This affected the annual growth rates presented in indicators based on published PCT applications, such as the lists of the top PCT applicants.
For confidentiality reasons, the lists of top applicants and PCT applications by fields of technology are based on the publication date.
For the national phase of the PCT System, statistics are based on data supplied to WIPO by national and regional patent offices – data which WIPO often re-ceives six months or more after the end of the year in question. Therefore, the latest year for which data are available is 2014. Data may be missing for some offices and may be incomplete for some origins. Data are available for the majority of larger offices. With the 2014 data supplied to WIPO corresponding to 99.5% of the world total, only a small proportion of the total is estimated. Missing data are estimated using such methods as linear extrapolation and averaging adjacent data points. The equivalent patent application concept is not used in this review. National phase entry data by country of origin may therefore differ slightly from other sources, such as WIPO’s IP Statistics Data Center.
The income groups correspond to those used by the World Bank5 and the groupings by region are based on the United Nations (UN) definition of regions.6
The figures in this review are subject to change.7
5. Available at http://data.worldbank.org/about/country-and-lending-groups
6. Available at unstats.un.org/unsd/methods/m49/m49regin.htm. Although the geographical terms used by WIPO may differ slightly from those defined by the UN, the composition of regions and subregions remains identical.
7. Regular updates are available at www.wipo.int/ipstats/

13
Special Theme The PCT Market Share When pursuing patent rights outside their home juris-dictions, patent applicants can choose between two filing routes. The first, which has existed since 1883, is the so-called Paris route. This enables an applicant who has filed an application in one office of a Paris Convention signatory to file subsequent applications referring to the same priority date directly in the offices of other signatories, subject to certain conditions. The second option is the PCT route. Since 1978, this has allowed applicants to seek patent protection simulta-neously in a large number of offices by filing a single
“international” PCT application.
This special theme analyzes the frequency with which applicants choose the PCT rather than the Paris route
– that is, the PCT “market share”.
The market share indicators compiled for this special theme rely on international patent family data, rather than patent applications filed abroad. This choice reflects the following considerations:• Patent family data avoids the multiple counting
of patent filings at different offices related to the same invention. A patent family corresponds ap-proximately to a unique invention.
• Patent family data include PCT filings that do not see any subsequent national phase entry. It is arguably important to account for these applica-tions when evaluating the PCT market share, as applicants in these cases showed some intention at the outset to pursue patent rights outside their home jurisdictions.
• Patent family data offer information on the number of patent offices in which applicants eventually seek protection – an important criterion in the choice of filing route.
Please refer to the definitional box for further details of the international patent family data that underlie the analysis in this special theme. Note that the family-based market share indicators presented here are not directly comparable to the application-based market share indicators presented in section B of this review.
The discussion that follows will first take a closer look at international patent family filing trends, analyzing their growth in absolute terms, their distribution and average size by filing route, at the global level and for the top five countries of origin. It will then provide simi-lar information for each of the 35 fields of technology and for the 100 applicants worldwide with the largest numbers of international patent families.
International patent families
To estimate the number of inventions for which applicants pursue patent rights, WIPO has developed a patent family database. Patent families are a set of interrelated patent applications which are filed in one or more offices, so as to protect the same invention. International patent families are those for which the patent applicants have filed at least one application in an office other than the office in which the priority filing took place.
Patent families are defined as applications interlinked by one or more of the following: addition, continuation application, continuation-in-part application, divisional application, internal priority claim, Paris Convention priority claim, PCT application, PCT national phase entry and provisional application. Data are taken from EPO’s PATSTAT database, which contains unit record data for published applications. For the purpose of this analysis, patent families containing a PCT application but no PCT national phase entry are considered to be international pat-ent families, except for the calculation of the average size of families. But families where applicants file abroad first with no subsequent filing are excluded from the analysis. The year of filing, the country or territory of residence of the first-named applicant, and the first-named applicant of the priority filing are used to determine the year, the origin and the applicant’s name of a given family. Because one PCT application may refer to more than one priority filing, the number of international patent families using the PCT route may be higher than the number of PCT applications. Due to the usual publication delay, the latest available year for international patent family data is 2012.
Use of the PCT route
In 2012, almost 264,000 international patent families were created worldwide; of these, nearly 60% con-tained an application filed through the PCT route (fig-ure 1). Since 1993, the number of international patent families has increased from year to year, with only four exceptions (in 2001 and from 2007 to 2009), coinciding with economic downturns. On average, the number of international patent families grew by 5.5% per year since the mid-1990s, with the PCT route (+9.9%) con-tributing much more to that growth than the Paris route (+2.3%). Indeed, over the period 2003-2012 there was almost no growth in the number of Paris route families (+0.6%) whereas the PCT route saw continuous average annual growth of 5%. This was due to particularly sharp falls in the number of international patent families us-ing the Paris route between 2006 and 2009 combined with a much more rapid recovery for families using the PCT route. The number of the latter increased continu-ously over the past 20 years, except in 2008, when it decreased by 0.4%.

14
SPECIAL THEME – THE PCT MARKET SHARE
Figure 1: Trend in international patent families for the top 5 origins and the world by filing route, 1993-2012
World Japan
50,000
100,000
150,000
200,000
250,000
0
Inte
rnat
iona
l pat
ent f
amili
es
1994 1996 1998 2000 2002 2004 2006 2008 2010 2012
Year
Paris route PCT route
20,000
40,000
60,000
80,000
0
Inte
rnat
iona
l pat
ent f
amili
es
1994 1996 1998 2000 2002 2004 2006 2008 2010 2012
Year
Paris route PCT route
United States of America Germany
10,000
20,000
30,000
40,000
50,000
60,000
0
Inte
rnat
iona
l pat
ent f
amili
es
1994 1996 1998 2000 2002 2004 2006 2008 2010 2012
Year
Paris route PCT route
5,000
10,000
15,000
20,000
25,000
0
Inte
rnat
iona
l pat
ent f
amili
es
1994 1996 1998 2000 2002 2004 2006 2008 2010 2012
Year
Paris route PCT route
Republic of Korea China
5,000
10,000
15,000
20,000
25,000
0
Inte
rnat
iona
l pat
ent f
amili
es
1994 1996 1998 2000 2002 2004 2006 2008 2010 2012
Year
Paris route PCT route
5,000
10,000
15,000
0
Inte
rnat
iona
l pat
ent f
amili
es
1994 1996 1998 2000 2002 2004 2006 2008 2010 2012
Year
Paris route PCT route
Sources: WIPO Statistics Database and EPO PATSTAT database, May 2016.

15
SPECIAL THEME – THE PCT MARKET SHARE
In 2012, patent applicants residing in Japan and the U.S. created the largest numbers of international pat-ent families worldwide, with 71,274 and 56,000 families, respectively. Japan and the U.S. were followed by Germany (25,295), the Republic of Korea (23,706) and China (14,536). Combined, these five origins accounted for 72.4% of all international patent families worldwide.
On average, during the period 1993-2012, the number of international patent families using the PCT route grew faster than the number of international patent families using the Paris route for all the top five origins. The average annual growth rates for families using the PCT route varied from 7.3% for the U.S. to 34.1% for China, whereas average annual growth rates for families using the Paris route varied from 0.4% for the U.S. to 26.4% for China.
Between 1993 and 2012, the overall share of interna-tional patent families using the PCT route increased progressively over time, from 27.6% in 1993 to 59.7% in 2012 (figure 2). Interestingly, the PCT share increased markedly during the course of the global financial cri-sis – from 53.7% in 2006 to 58.1% in 2009, suggesting that applicants re-evaluated their international patent filing strategies in light of the heightened economic un-certainty.
The shares of international patent families using the PCT route also increased for the five main countries of origin. Between 2008 and 2012, China and Japan recorded the largest increases, with shares of 64% and 53% respectively in 2012. After several years of increases, applicants from Germany and the U.S. reached a plateau during recent years, with, respec-tively, about 60% and 70% of families using the PCT route. Despite a sharp increase in their use of the PCT System, applicants from the Republic of Korea had by far the lowest share (36%) of international patent families using the PCT route among the top five origins.
The size of international patent families
The size of a patent family indicates the number of patent offices at which patent applications related to the same invention have been filed. The trend in average size of families provides some information on the patenting strategies of applicants over time. At the global level, an international patent family was composed of applications filed at 3.8 different patent offices on average in 2010 (figure 3). This average size
has decreased since its peak in 1998, when it was 4.4 offices. The average size of those using the PCT route dropped to a much greater extent, from 6 offices in 1998 to 4.6 in 2010.
For each of the top five origins, the average size of inter-national patent families has decreased slightly in recent years. Since the early 1990s, only Japan has seen an increase in the average size of its international patent families; this may be due to its use of the PCT route, which increased rapidly over this period. However, since the second half of the 1990s, the average size of international patent families using the PCT route has markedly decreased for each of these five countries. For example, the average size of families using the PCT route for applicants from the Republic of Korea decreased from 6.7 offices in 1994 to 3.9 offices in 2010.
Generally speaking, the attractiveness of the PCT route relative to the Paris route increases with the size of an international patent family. Interestingly, however, the average size of international patent families using the PCT route has progressively decreased since 1995. This likely reflects a general decline in the average size of international patent families as well as applicants deriving greater value from PCT applications, pos-sibly in the face of heightened economic uncertainty. The greater value of the PCT to applicants lies in the information that they receive on the potential patent-ability of the invention, and the time that they gain in deciding whether to pursue the patent application beyond the PCT international phase and, if so, in which national offices.
Use of the PCT by field of technology
Table 1 shows the number of international patent fami-lies using the PCT route by fields of technology for two five-year periods: 2003-07 and 2008-12. It also provides information, for each field, on the share of the PCT System in total and the average size of international patent families.
Compared with 2003-07, the number of international patent families using the PCT route increased for 30 of the 35 fields of technology in 2008-12. Digital com-munication (+67%) and electrical machinery (+57.9%) increased the most, whereas pharmaceuticals (-11.4%) and basic communication processes (-10.3%) saw the sharpest decreases. The share of international patent families using the PCT route increased for all fields of

16
Figure 2: Share of the PCT route in international patent families for the top 5 origins and the world, 1993-2012
World Japan
0
10
20
30
40
50
60
70
80
Sha
re o
f PC
T ro
ute
(%)
1994 1996 1998 2000 2002 2004 2006 2008 2010 2012
Year
0
10
20
30
40
50
60
70
80
Sha
re o
f PC
T ro
ute
(%)
1994 1996 1998 2000 2002 2004 2006 2008 2010 2012
Year
United States of America Germany
0
10
20
30
40
50
60
70
80
Sha
re o
f PC
T ro
ute
(%)
1994 1996 1998 2000 2002 2004 2006 2008 2010 2012
Year
0
10
20
30
40
50
60
70
80
Sha
re o
f PC
T ro
ute
(%)
1994 1996 1998 2000 2002 2004 2006 2008 2010 2012
Year
Republic of Korea China
0
10
20
30
40
50
60
70
80
Sha
re o
f PC
T ro
ute
(%)
1994 1996 1998 2000 2002 2004 2006 2008 2010 2012
Year
0
10
20
30
40
50
60
70
80
Sha
re o
f PC
T ro
ute
(%)
1994 1996 1998 2000 2002 2004 2006 2008 2010 2012
Year
Sources: WIPO Statistics Database and EPO PATSTAT database, May 2016.
SPECIAL THEME – THE PCT MARKET SHARE

17
Figure 3: Trend in average size of international patent families for the top 5 origins and the world, 1993-2010
World Japan
0
1
2
3
4
5
6
7
Ave
rage
siz
e of
inte
rnat
iona
l fam
ilies
1994 1996 1998 2000 2002 2004 2006 2008 2010
Year
Paris route PCT route Total
0
1
2
3
4
5
6
7
Ave
rage
siz
e of
inte
rnat
iona
l fam
ilies
1994 1996 1998 2000 2002 2004 2006 2008 2010
Year
Paris route PCT route Total
United States of America Germany
0
1
2
3
4
5
6
7
Ave
rage
siz
e of
inte
rnat
iona
l fam
ilies
1994 1996 1998 2000 2002 2004 2006 2008 2010
Year
Paris route PCT route Total
0
1
2
3
4
5
6
7
Ave
rage
siz
e of
inte
rnat
iona
l fam
ilies
1994 1996 1998 2000 2002 2004 2006 2008 2010
Year
Paris route PCT route Total
Republic of Korea China
0
1
2
3
4
5
6
7
Ave
rage
siz
e of
inte
rnat
iona
l fam
ilies
1994 1996 1998 2000 2002 2004 2006 2008 2010
Year
Paris route PCT route Total
0
1
2
3
4
5
6
7
Ave
rage
siz
e of
inte
rnat
iona
l fam
ilies
1994 1996 1998 2000 2002 2004 2006 2008 2010
Year
Paris route PCT route Total
Note: The number of patent filings in international patent families as reported in the March 2016 edition of PATSTAT may be incomplete for the most recent years. For this reason, the years 2011 and 2012 have been excluded from these graphs.
Sources: WIPO Statistics Database and EPO PATSTAT database, May 2016.
SPECIAL THEME – THE PCT MARKET SHARE

18
technology between these two periods. This share increased the most for digital communication (+10.7 percentage points), engines, pumps, turbines (+10.1) and transport (+10). In 2008-12, the PCT share was the highest for pharmaceuticals (93%), biotechnology (91.9%) and organic fine chemistry (89.3%). By contrast, basic communication processes (39.3%) and optics (37.6%) were the only two fields for which applicants mainly used the Paris route.
On average, the size of international patent families decreased between the two periods for all fields of technology, irrespective of the route used. The de-creases in average size of families using the PCT route varied from nearly one office to 0.08 offices, depending on the field of technology. For example, they dropped the most for organic fine chemistry (-0.92 offices) and pharmaceuticals (-0.70 offices). The decreases in av-erage size of families using the Paris route were less pronounced, as they varied from 0.41 offices to 0.08 offices. However, compared with the Paris route, the average size of international patent families using the PCT route remained larger for all fields of technology.
The international patent families of the top 100 applicants
During the period 2008-12, the top 100 applicants ac-counted for 26% of all international patent families. Of those, 48 were from Japan, 13 from the Republic of Korea, 9 from Germany, 7 from France and 6 from both China and the U.S. Altogether, the top 100 applicants had 11 different origins distributed in Asia, Europe and North America. Optics (13 applicants), computer technology (11) and electrical machinery (11) were the fields of technology in which the largest number of these applicants mainly filed.
In 2012, the top 100 applicants filed 45% of their total international patent families using the PCT System. This was 15 percentage points below the average for all applicants (60%). In line with their lower PCT share, the top 100 applicants also showed a smaller overall average patent family size of 3.3 in 2010, compared with 3.7 for all applicants.
With about 23,000 international patent families in 2008-12, Samsung Electronics of the Republic of Korea domi-nated the ranking by a great margin. It was followed by four Japanese companies: Panasonic Corporation (15,497), Canon Inc. (14,752), Toshiba (12,743) and Sony Corporation (10,949). IBM, in 43rd position, was the U.S. applicant with the most international patent families.
Applicants from the Republic of Korea that ranked in the top 100 applicants list accounted for the majority (53%) of international patent families originating from this country. This share was much higher than the share of the top 100 applicants combined in the world total (26%), reflecting a particularly high concentration of international patent families among a limited number of applicants. While some of the top applicant companies, such as LG Chemical and LG Innotek, used the PCT for a large number of their international patent families, most applicants from the Republic of Korea listed in the top 100 used the PCT route for less than 1% of their international patent families during the period 2008-12. Samsung Electronics alone accounted for 22% of all international patent families from the Republic of Korea during this period, and its PCT share – while increas-ing – still stood at only 14%. In sum, the relatively low share of families using the PCT route from the Republic of Korea (36%) shown in figure 2 largely reflects the international patent filing strategies of its top applicants.
The top 100 applicants showed high heterogeneity in their use of the PCT: their PCT shares in 2008-12 varied from 0% for five companies to 99.9% for Shenzhen Huaxing Optoelect Tec. Even two companies with a similar profile may use the PCT route quite differently. This is the case, for example, for Panasonic Corporation and Sony Corporation – two Japanese companies filing mainly in the field of audio-visual technology with relatively similar numbers of international pat-ent families. In 2008-12, Panasonic Corporation filed 78% of its international patent families using the PCT while Sony Corporation filed 24% despite having, on average, larger international patent families than Panasonic. Nearly all the top 100 applicants have a practical knowledge of the PCT as they have used it at least once over the past 10 years, and generally for large international patent families.
SPECIAL THEME – THE PCT MARKET SHARE

19
Table 1: International patent families by field of technology
Field of technology
International patent families using the PCT route
Share of international families using the PCT
route in total (in %)Average size of international families using the PCT route
Average size of international families using the Paris route
2003-07 (1)
2008-12 (2)
Growth (in %)
between (1) and (2)
2003-07 (1)
2008-12 (2)
Changes* between
(1) and (2) 2003-07 (1)
2008-12 (2)
Changes between
(1) and (2) 2003-07 (1)
2008-12 (2)
Changes between
(1) and (2)
I Electrical engineering
1 Electrical machinery, apparatus, energy 30,329 47,894 57.9 42.2 50.2 8.1 4.7 4.5 -0.18 3.2 3.0 -0.24
2 Audio-visual technology 24,076 26,190 8.8 35.2 41.3 6.1 4.6 4.3 -0.35 3.1 2.8 -0.29
3 Telecommunications 24,778 24,414 -1.5 48.7 55.4 6.7 4.8 4.5 -0.35 3.0 2.7 -0.24
4 Digital communication 26,475 44,216 67.0 60.1 70.8 10.7 4.8 4.3 -0.46 3.1 2.7 -0.30
5 Basic communication processes 6,351 5,697 -10.3 38.7 39.3 0.6 4.7 4.4 -0.30 2.9 2.7 -0.25
6 Computer technology 40,664 50,433 24.0 42.6 45.8 3.1 4.5 4.2 -0.24 2.9 2.7 -0.22
7 IT methods for management 6,156 8,702 41.4 62.0 65.0 3.0 4.6 4.4 -0.23 2.9 2.7 -0.19
8 Semiconductors 19,077 26,742 40.2 30.9 40.6 9.7 4.5 4.3 -0.14 3.1 3.0 -0.13
II Instruments
9 Optics 17,001 20,041 17.9 30.5 37.6 7.2 4.5 4.3 -0.18 3.1 2.9 -0.19
10 Measurement 24,203 29,141 20.4 51.8 55.7 3.8 4.6 4.4 -0.18 3.1 2.9 -0.12
11 Analysis of biological materials 7,882 8,077 2.5 84.2 86.2 2.1 5.6 5.5 -0.17 3.3 3.0 -0.28
12 Control 9,599 10,319 7.5 47.9 49.5 1.7 4.6 4.4 -0.22 3.1 2.9 -0.26
13 Medical technology 35,033 42,885 22.4 72.9 75.9 3.0 5.2 4.9 -0.27 3.3 3.1 -0.27
III Chemistry
14 Organic fine chemistry 31,323 29,603 -5.5 86.8 89.3 2.5 7.7 6.8 -0.92 3.8 3.5 -0.22
15 Biotechnology 19,640 22,441 14.3 89.5 91.9 2.5 6.3 6.1 -0.24 3.2 2.9 -0.32
16 Pharmaceuticals 37,233 32,987 -11.4 92.7 93.0 0.3 7.9 7.2 -0.70 3.5 3.1 -0.37
17 Macromolecular chemistry, polymers 13,024 15,139 16.2 75.0 79.8 4.7 5.8 5.4 -0.37 3.9 3.6 -0.30
18 Food chemistry 6,804 7,495 10.2 79.6 83.0 3.3 6.5 6.3 -0.24 3.4 3.1 -0.28
19 Basic materials chemistry 17,938 21,856 21.8 74.8 80.5 5.7 6.5 6.0 -0.47 3.7 3.5 -0.19
20 Materials, metallurgy 10,521 13,721 30.4 67.6 74.9 7.3 5.7 5.4 -0.36 3.6 3.3 -0.25
21 Surface technology, coating 15,163 16,873 11.3 61.6 64.0 2.4 5.3 5.1 -0.24 3.5 3.3 -0.25
22 Micro-structural and nano-technology 1,476 2,001 35.6 58.5 61.6 3.0 5.3 4.9 -0.42 3.4 3.0 -0.41
23 Chemical engineering 15,950 18,414 15.4 67.2 72.4 5.2 5.6 5.3 -0.32 3.5 3.3 -0.19
24 Environmental technology 6,886 9,307 35.2 59.2 65.3 6.1 5.4 5.0 -0.34 3.2 3.0 -0.19
IV Mechanical engineering
25 Handling 14,158 16,059 13.4 52.4 55.0 2.6 5.4 5.1 -0.33 3.2 2.9 -0.26
26 Machine tools 12,388 15,429 24.5 51.2 55.2 4.0 5.2 4.9 -0.34 3.4 3.2 -0.20
27 Engines, pumps, turbines 12,876 19,780 53.6 42.1 52.2 10.1 4.8 4.7 -0.08 3.3 3.1 -0.12
28 Textile and paper machines 9,515 8,776 -7.8 37.6 41.0 3.4 5.3 5.1 -0.29 3.0 2.8 -0.20
29 Other special machines 16,537 19,842 20.0 57.8 62.2 4.4 5.6 5.2 -0.39 3.3 3.1 -0.20
30 Thermal processes and apparatus 6,861 10,027 46.2 48.0 56.4 8.3 5.0 4.8 -0.17 3.1 2.9 -0.13
31 Mechanical elements 15,025 19,413 29.2 46.4 55.0 8.6 4.8 4.6 -0.25 3.2 3.0 -0.16
32 Transport 18,225 25,936 42.3 40.5 50.5 10.0 4.5 4.4 -0.11 3.0 2.9 -0.08
V Other fields
33 Furniture, games 9,985 10,417 4.3 48.9 52.2 3.2 4.7 4.6 -0.13 3.1 2.8 -0.38
34 Other consumer goods 9,907 11,571 16.8 52.8 60.0 7.3 5.1 4.8 -0.34 3.3 3.0 -0.30
35 Civil engineering 12'694 17'508 37.9 49.6 59.4 9.8 5.0 4.6 -0.40 2.9 2.7 -0.12
Note: *Changes in percentage points. The number of patent applications in international patent families as reported in the March 2016 edition of PATSTAT may be incomplete for the most recent years. For this reason, the years 2011 and 2012 have been excluded from the average size of international patent families presented in this table.
Sources: WIPO Statistics Database and EPO PATSTAT database, May 2016.
SPECIAL THEME – THE PCT MARKET SHARE

20
Table 2: Top 100 applicants in international patent families, 2003-12
Overallrank Applicant Origin
Main field of technology in 2003-12
International patentfamilies
Share of international
families using the PCT route (in %)
Average size of international families using the PCT route
Average size of international
families using the Paris route
2003-07 2008-12 2003-07 2008-12 2003-07 2008-10 2003-07 2008-10
1 SAMSUNG ELECTRONICS CO., LTD.
Republic of Korea
Computer technology 31,672 22,558 6.8 13.9 5.2 4.3 3.1 2.5
2 PANASONIC CORPORATION Japan Audio-visual technology 18,617 15,497 58.9 78.3 3.9 3.6 3 2.7
3 CANON INC Japan Optics 12,517 14,752 12.3 15.7 3.8 3.6 2.7 2.6
4 TOSHIBA KK Japan Computer technology 11,735 12,743 7.8 15.8 4.3 3.4 2.7 2.4
5 SONY CORPORATION Japan Audio-visual technology 9,230 10,949 20.9 24 5.4 5.9 3.6 3.6
6 ROBERT BOSCH GMBH Germany Engines, pumps, turbines 7,785 9,838 52.2 55.9 4.2 4.2 2.7 2.7
7 FUJITSU LTD Japan Computer technology 10,477 8,425 26.8 26.7 3.1 3.1 2.8 2.5
8 HONGFUJIN PRECISION INDUSTRY (SHENZHEN) CO., LTD.
China Computer technology 2,659 7,580 – 0.1 n.a. 4 2.1 2
9 SHARP CORPORATION Japan Optics 5,856 7,553 43.2 76.9 3.7 3.7 3.1 3
10 SIEMENS AG Germany Electrical machinery, apparatus, energy
8,509 7,423 57.8 54.3 4.1 4.2 2.6 2.8
11 FUJIFILM CORPORATION Japan Optics 4,436 7,077 19.9 40.4 3.9 4.1 2.6 2.7
12 TOYOTA JIDOSHA KABUSHIKI KAISHA
Japan Transport 5,776 6,882 66.4 81.9 4.4 3.9 3.1 2.4
13 SEIKO EPSON CORPORATIONJapan Textile and paper machines
9,105 6,787 7.6 3.5 4.6 5 3.1 2.8
14 MITSUBISHI ELECTRIC CORPORATION
Japan Electrical machinery, apparatus, energy
4,384 6,099 45.9 65.7 4.2 4.2 3.2 3
15 HONDA MOTOR CO LTD Japan Transport 6,312 5,650 19.6 31.5 4.7 4 3.2 3
16 LG ELECTRONICS INC Republic of Korea
Audio-visual technology 11,956 5,644 27.5 37 4.8 3.8 3.3 3
17 HITACHI LTD Japan Computer technology 7,677 5,511 4.1 37.9 3.3 2.9 2.8 2.7
18 RICOH CO LTD Japan Optics 6,234 5,070 11.3 11.8 5.2 5.7 2.6 2.6
19 HUAWEI TECHNOLOGIES CO., LTD.
China Digital communication 2,804 4,903 96.4 93.2 3.2 3.3 2.8 2.7
20 NEC CORPORATION Japan Computer technology 4,523 4,880 50.6 85 3.2 3.2 3.2 2.6
21 KOREA ELECTRONICS TELECOMM
Republic of Korea
Digital communication 3,731 4,836 36.6 16 2.8 3.3 2.2 2.1
22 DENSO CORPORATION Japan Engines, pumps, turbines 6,505 4,815 1.8 11.9 4.3 3.9 2.9 2.7
23 SAMSUNG ELECTRO MECHANICS
Republic of Korea
Electrical machinery, apparatus, energy
1,982 4,034 – 0.1 n.a. 4 3.4 2.7
24 BROTHER INDUSTRIES LTD Japan Textile and paper machines
4,208 4,032 9.3 4.6 3.1 4.9 2.6 2.5
25 ZTE CORPORATION China Digital communication 457 3,612 99.8 99.8 3.3 3.5 3 2
26 BASF SE Germany Organic fine chemistry 1,221 3,564 94.7 93.5 6.7 6.1 2.2 2.1
27 TELEFONAKTIEBOLAGET LM ERICSSON (PUBL)
Sweden Digital communication 2,219 3,359 99.1 97.7 4.4 3.2 2 2
28 KONINKLIJKE PHILIPS ELECTRONICS N.V.
Netherlands Audio-visual technology 8,160 3,205 99.6 98.5 5.1 5.5 2.6 2.1
29 HONGHAI PRECISION INDUSTRY CO., LTD.
Taiwan, Province of China
Electrical machinery, apparatus, energy
1,046 3,187 0.1 – 2 n.a. 2.3 2
30 HYUNDAI MOTOR CO LTD Republic of Korea
Transport 1,246 3,026 0.1 0.3 4 5.3 3.6 3.4
31 FUJI XEROX CO LTD Japan Optics 2,959 2,948 0.5 0.9 4 6 2.6 2.8
32 SANYO ELECTRIC CO Japan Electrical machinery, apparatus, energy
4,318 2,923 13.5 34.9 3.8 3.2 3.5 3.1
33 SUMITOMO CHEMICAL CO Japan Organic fine chemistry 1,755 2,736 52.9 70.8 5.7 5 4.5 4.3
34 MITSUBISHI HEAVY INDUSTRIES LTD
Japan Engines, pumps, turbines 955 2,524 57.1 85.8 4.7 4.7 3.7 3.3
35 SAMSUNG DISPLAY CO LTD Republic of Korea
Semiconductors 6 2,393 – 0.2 n.a. n.a. 4.5 4.8
36 NITTO DENKO CORPORATION
Japan Basic materials chemistry 1,309 2,365 40.4 49.2 4.7 4.8 4.7 4.5
37 COMMISSARIAT Á L’ÉNERGIE ATOMIQUE ET AUX ÉNERGIES ALTERNATIVES
France Semiconductors 1,250 2,352 72.1 70.8 4.6 4.6 3.7 3.9
38 INDUSTRY TECHNOLOGY RESEARCH INSTITUTE
Taiwan, Province of China
Semiconductors 2,278 2,329 0.7 1.1 3.7 3.2 2.3 2.3
39 BSH BOSCH SIEMENS HAUSGERAETE
Germany Other consumer goods 1,512 2,328 76.2 52.3 3.9 3.6 2.2 2.1
40 LG INNOTEK CO LTD Republic of Korea
Semiconductors 335 2,299 58.2 41.1 3.8 4 2.4 4
41 KYOCERA CORPORATION Japan Telecommunications 1,895 2,286 61 83.9 3.3 3.2 3.1 2.3
42 TOKYO ELECTRON LTD Japan Semiconductors 2,192 2,270 43.5 35.2 4.2 4 3.5 3.9
SPECIAL THEME – THE PCT MARKET SHARE

21
Overallrank Applicant Origin
Main field of technology in 2003-12
International patentfamilies
Share of international
families using the PCT route (in %)
Average size of international families using the PCT route
Average size of international
families using the Paris route
2003-07 2008-12 2003-07 2008-12 2003-07 2008-10 2003-07 2008-10
43 INTERNATIONAL BUSINESS MACHINES CORPORATION
United States of America
Computer technology 5,214 2,252 24.5 27.3 4.7 4.5 2.4 2.1
44 HEWLETT PACKARD DEVELOPMENT CO
United States of America
Computer technology 2,210 2,197 28.5 97.6 3.8 3.5 2.7 2.3
45 MURATA MANUFACTURING CO
Japan Electrical machinery, apparatus, energy
1,141 2,066 82.9 75.5 3.8 3.2 3.3 3.2
46 RENESAS ELECTRONICS CORPORATION
Japan Semiconductors 14 2,064 14.3 5.6 5 3.8 3.3 2.4
47 LG DISPLAY CO LTD Republic of Korea
Optics 490 2,013 0.6 0.9 4.3 4 3.2 3.4
48 AU OPTRONICS CORP Taiwan, Province of China
Optics 1,556 1,929 0.1 1.8 3 n.a. 2.3 2.1
49 HYNIX SEMICONDUCTOR INC Republic of Korea
Semiconductors 3,436 1,922 0 – 4 n.a. 2.9 2.5
50 SUMITOMO ELECTRIC INDUSTRIES
Japan Optics 1,290 1,837 44.7 68.4 5.6 5.2 3.1 2.8
51 OLYMPUS CORPORATION Japan Optics 2,812 1,814 42.2 42.2 3.6 3.3 2.4 2.4
52 SAMSUNG MOBILE DISPLAY CO LTD
Republic of Korea
Semiconductors 139 1,787 - 0.1 n.a. 4 3.2 3.1
53 YAZAKI CORPORATION Japan Electrical machinery, apparatus, energy
1,002 1,754 12.6 70.5 4.1 4.3 3 3
54 NTT DOCOMO INC Japan Digital communication 1,456 1,707 43.1 79.4 7 5.4 4.1 3.4
55 KONICA MINOLTA BUSINESS TECHNOLOGIES
Japan Optics 1,759 1,692 1.2 4 2.9 2.6 2.2 2.4
56 LG CHEMICAL LTD Republic of Korea
Electrical machinery, apparatus, energy
1,223 1,674 93.4 92.1 5.3 4.9 3.1 3.5
57 NISSAN MOTOR Japan Transport 2,185 1,664 16.8 79.6 4 5.5 3.4 3
58 SAMSUNG SDI CO LTD Republic of Korea
Electrical machinery, apparatus, energy
5,193 1,621 0 0.2 4.5 n.a. 3.5 2.9
59 SK HYNIX INC Republic of Korea
Computer technology 0 1,570 n.a. – n.a. n.a. n.a. 2.5
60 SHENZHEN FUTAIHONG PRECISION INDUSTRY CO., LTD.
China Audio-visual technology 365 1,501 – – n.a. n.a. 2.1 2.1
61 ALCATEL LUCENT France Digital communication 788 1,497 42.4 83.8 4.9 5.3 2.9 2.3
62 ASAHI GLASS CO LTD Japan Other special machines 904 1,485 80.6 85.3 4.5 4.7 3.7 3.6
63 INTEL CORPORATION United States of America
Computer technology 1,183 1,465 91 97.5 4.3 4.7 2.9 2.4
64 HITACHI HIGH TECHNOLOGIES CORPORATION
Japan Measurement 878 1,414 1.5 62 2.9 2.9 2.4 2.7
65 RESEARCH IN MOTION LTD Canada Digital communication 1,225 1,404 12.2 22.8 4.5 3.8 3.5 2.3
66 NIPPON KOGAKU KK Japan Optics 1,655 1,374 70.1 68.6 4.1 3.5 2.8 2.7
67 SHENZHEN HUAXING OPTOELECT TEC
China Optics 0 1,370 n.a. 99.9 n.a. 2.2 n.a. n.a.
68 NOKIA CORPORATION Finland Digital communication 2,806 1,359 89.4 95.1 4.3 3.3 2.5 2.6
69 GM GLOBAL TECH OPERATIONS INC
United States of America
Transport 992 1,335 23.4 8.2 4.3 4.5 2.7 3.7
70 KOBE STEEL LTD Japan Materials, metallurgy 917 1,255 40.1 53.4 5 4.9 3.8 3.3
71 SCHAEFFLER TECHNOLOGIES GMBH & CO KG
Germany Mechanical elements 40 1,248 67.5 69 3.8 3.4 2.5 2.4
72 KONICA CORPORATION Japan Optics 908 1,225 48.3 64.3 3.5 2.8 2.7 2.4
73 ZAHNRADFABRIK FRIEDRICHSHAFEN
Germany Mechanical elements 1,421 1,219 46.3 52.8 5 4.3 2.4 2.3
74 TORAY INDUSTRIES Japan Macromolecular chemistry, polymers
616 1,200 91.7 99.1 5.6 6.4 4.4 2
75 THOMSON LICENSING France Audio-visual technology 1,244 1,183 75.4 72.1 6.1 4.8 5.1 4.7
76 FRAUNHOFER GES FORSCHUNG
Germany Measurement 1,040 1,164 81.5 78.9 4.2 3.9 2.3 2.5
77 PEUGEOT CITROEN AUTOMOBILES SA
France Transport 1,118 1,154 35 62.5 3.2 3 2.1 2
78 WISTRON CO., LTD. Taiwan, Province of China
Computer technology 138 1,153 1.4 – 6 n.a. 2.1 2.1
79 BRIDGESTONE CORPORATION
Japan Transport 1,071 1,152 85.7 96.5 3.9 4.3 3 3.2
80 THALES SA France Measurement 769 1,149 68.1 36.1 4 4.2 2.7 3.3
81 NXP B.V. Netherlands Semiconductors 1,265 1,133 99.7 55.4 3.9 2.7 2 2.6
SPECIAL THEME – THE PCT MARKET SHARE

22
Overallrank Applicant Origin
Main field of technology in 2003-12
International patentfamilies
Share of international
families using the PCT route (in %)
Average size of international families using the PCT route
Average size of international
families using the Paris route
2003-07 2008-12 2003-07 2008-12 2003-07 2008-10 2003-07 2008-10
82 SHINETSU CHEMICAL CO Japan Macromolecular chemistry, polymers
1,106 1,131 10.8 14.8 5.4 6 3.9 4.4
83 DAIKIN INDUSTRIES LTD Japan Thermal processes and apparatus
1,184 1,130 91.8 83 4.8 4.6 2.1 2
84 CASIO COMPUTER CO LTD Japan Audio-visual technology 908 1,111 24 2.3 5.5 4.8 3.6 3.8
85 L'OREAL France Organic fine chemistry 1,593 1,103 19 76.2 4.5 4 4.2 5
86 KAO CORPORATION Japan Organic fine chemistry 1,248 1,097 60.7 90.2 4.8 4.6 3.8 3
87 NOKIA SIEMENS NETWORKS OY
Finland Digital communication 181 1,093 93.9 98.4 4.1 3.1 2.6 2.5
88 HENKEL KGAA Germany Organic fine chemistry 976 1,045 82 83.4 3.6 3.5 2.1 2
89 SNECMA France Engines, pumps, turbines 187 1,039 2.7 73 6.8 6.2 5.9 2.8
90 AISIN SEIKI Japan Transport 944 1,034 21.2 39.6 3.7 4.2 3.1 3.1
91 HITACHI AUTOMOTIVE SYSTEMS LTD
Japan Engines, pumps, turbines 0 1,031 n.a. 42.7 n.a. 3.6 n.a. 3.4
92 ABB TECHNOLOGY AG United States of America
Electrical machinery, apparatus, energy
312 1,016 75 76.1 5.2 4.9 3.9 3.6
93 DSM IP ASSETS BV Netherlands Organic fine chemistry 973 1,013 97.9 96.9 6.3 5.5 2.7 2.8
94 JFE STEEL KK Japan Materials, metallurgy 421 1,012 91.2 95.1 5.7 6.1 4.3 2.4
95 SEMICONDUCTOR ENERGY LAB
Japan Semiconductors 1,616 1,010 27.4 30.8 4 4.7 3.5 4.7
96 GENERAL ELECTRIC United States of America
Engines, pumps, turbines 2,640 995 21.3 35.2 5.4 5 3.8 3.2
97 AUDI AG Germany Transport 391 956 20.2 53.8 3.6 3.9 2.3 2.5
98 NTN TOYO BEARING CO LTD Japan Mechanical elements 1,441 954 68.9 92.9 3.7 4 2.7 2.3
99 SUMITOMO RUBBER INDUSTRIES
Japan Transport 693 954 16.5 32.7 5.1 5.4 3.5 3.7
100 TSINGHUA UNIVERSITY China Electrical machinery, apparatus, energy
396 946 16.9 19.1 5 3.7 2.8 2.9
Note: The number of patent applications in international patent families as reported in the March 2016 edition of PATSTAT may be incomplete for the most recent years. For this reason, the years 2011 and 2012 have been excluded from the average size of international patent families presented in this table.
Sources: WIPO Statistics Database and EPO PATSTAT database, May 2016.
Conclusion
In 2012, the market share of the PCT was almost 60% of the 264,000 international patent families. Since the mid-1990s, and especially during the financial crisis, the number of international patent families using the PCT route increased faster than the number of families using the Paris route. The number of those using the PCT route grew, on average, by nearly 10% per year be-tween 1993 and 2012, compared with just 2.3% average annual growth for families using the Paris route during the same period. The trends for each of the top five ori-gins are similar to the trend at global level. Their shares of international patent families created using the PCT route have markedly increased since the mid-1990s. In 2012, they varied from 36% for the Republic of Korea to 72.8% for the U.S. The PCT share also increased for all of the 35 fields of technology during the 2008-12 period. Several fields, such as digital communication, saw a sharp increase in their use of the PCT route.
The average size of international patent families de-creased slightly over time, and markedly so for the PCT route, where it dropped from 6 offices in 1998 to
4.6 in 2010. The average size of international patent families using the PCT route decreased markedly for each of the top five countries of origin, as well as for each of the 35 fields of technology. This may indicate that applicants derive increasing value from filing PCT applications independent of the intended size of their patent families.
On average, in 2012 the top 100 applicants (45%) used the PCT route proportionally less than did all appli-cants combined (60%). This may be partly due to the average size of the top 100 applicants’ international patent families (3.3), which is smaller than that for all applicants (3.7). Nearly half the top 100 applicants were from Japan. With only seven applicants each, China and the U.S. had the same number of applicants within this top 100 list. In the case of the Republic of Korea, a majority of its international patent families (53%) was concentrated among applicants appearing in the top 100 applicants list. Although the top 100 applicants show a high degree of heterogeneity in their use of the PCT route, nearly all have used this route in recent years.
SPECIAL THEME – THE PCT MARKET SHARE

24
XXX XXX

25
Section A Statistics on the International Phase: PCT ApplicationsSection A covers the international phase of the PCT procedure. It provides a brief overview of global trends and then focuses on PCT applications by receiving office (RO), country of origin and geographical region. It also contains data by type of applicant and field of technology – and for selected ROs and origins. The statistical table in the annex provides data for all of-fices and origins.
A.1 – Overview
A.1.1 – Overall trend
In 2015, an estimated 218,000 PCT applications were filed, representing an increase of 1.7% on filings in 2014 (figure A.1.1). This was the sixth consecutive year of growth, but also the fourth consecutive year of slow-down in growth, since the 11% increase recorded in 2011.
In 2015, 85 of the 116 ROs, representing 73% of ROs, received at least one PCT application, and of these ROs, 36 received more filings in 2015 than in 2014.
A.1.2 – Top receiving offices
The top 15 ROs accounted for 96% of all applications filed in 2015. With 57,881 filings, the United States Patent and Trademark Office (USPTO) received the highest number of PCT applications; it was followed by the Japan Patent Office (JPO) with 43,285 applications, and the European Patent Office (EPO) with 34,302 (figure A.1.2.1).
Filings increased for 6 of the top 15 ROs. Three offices experienced double-digit growth, namely: the State Intellectual Property Office of the People’s Republic of China (SIPO) (+14.6%), the Korean Intellectual Property Office (KIPO)(+11.6%), and the office of Israel (+10.1%). In contrast, the sharpest annual decreases were seen at the offices of Sweden (-15%), Finland (-9%) and Canada (-8%). The USPTO (-6.6%) also experienced a sharp decrease, which was likely due to a change in the U.S. patent law. The America Invents Act likely contributed to the temporary surge of filings seen in 2014 and filings at USPTO returned to the long-term trend in 2015.
Among middle-income countries, beyond SIPO, the offices of Turkey (705), India (687) and Brazil (484) received the highest numbers of PCT applications in 2015 (figure A.1.2.2). Filings increased at 9 of the listed 15 ROs, with Serbia (+133.3%), Thailand (+65.5%), Peru (+50%), Turkey (+29.4%), Romania (+22.6%), South Africa (+20.8%) and Egypt (+16.7%) showing double-digit annual growth rates. In contrast, the offices of Morocco (-43.1%), India (-15%) and Malaysia (-12.5%) saw the sharpest decreases.
As is the case for all PCT applicants, those from low- and middle-income countries can choose to file their PCT applications with the International Bureau (IB) of WIPO acting as the RO. For certain countries, the IB is the only competent RO. In 2015, the IB as the RO received 1,624 applications from low- and middle-income countries, representing an increase of 7.7% on
Figure A.1.1: Trend in PCT applications
. 15.5 11.0 14.7 17.4 16.9 20.6 18.3 17.5 13.9 22.1 16.1 2.0 4.4 6.4 11.5 9.4 6.9 2.1
-4.8
5.8 11.0 7.1 5.1 4.4 1.7
0
50,000
100,000
150,000
200,000
PCT
appli
catio
ns
1990 1991 1992 1993 1994 1995 1996 1997 1998 1999 2000 2001 2002 2003 2004 2005 2006 2007 2008 2009 2010 2011 2012 2013 2014 2015
PCT applications Growth rate (%)
International filing year
Note: Data for 2015 are WIPO estimates.
Source: WIPO Statistics Database, May 2016.

26
SECTION A STATISTICS ON THE INTERNATIONAL PHASE: PCT APPLICATIONS
2014 figures. Among applicants from the 51 low- and middle-income countries which filed at this RO, those from India (707 filings), China (224) and South Africa (218) filed the highest numbers of PCT applications.
A.2 – PCT applications by country of origin
Counts are based on the international filing date and country of residence of the first-named applicant. A statistical table detailing all origins is provided in the annex.
A.2.1 – World map
Even though applicants from 132 countries filed PCT applications in 2015, the bulk of these applications origi-nated in just a few countries (figure A.2.1). Applicants from Japan and the U.S. combined filed almost half of all applications (47%). When the numbers of filings from China, Germany and the Republic of Korea are included, these top five countries collectively filed 75% of all PCT applications.
High-income countries accounted for 83.5% of total PCT filings, whereas the share for middle-income
Figure A.1.2.1: PCT applications for the top 15 receiving offices, 2015
Growth rate (%)
-6.6 4.8 4.2 14.6 11.6 -0.9 -2.9 1.1 -8.0 0.0 -7.9 -15.0 10.1 -6.3 -9.0
57,881
43,285
34,30231,031
14,65710,430
4,118 3,545 2,000 1,622 1,577 1,469 1,331 1,148 1,009
PCT
appli
catio
ns
United S
tates o
f Americ
aJap
an
Europea
n Pate
nt Offic
eChin
a
Republic
of Kore
a
Interna
tional B
ureau
United K
ingdom Fran
ceCana
da
Australi
a
Germany
Sweden
Israel
Spain
Finland
Receiving office
Note: Data for 2015 are WIPO estimates.
Source: WIPO Statistics Database, May 2016.
Figure A.1.2.2: PCT applications for selected offices of middle-income countries, 2015
Growth rate (%)
29.4 -15.0 -5.5 -12.5 4.2 -6.5 65.5 20.8 16.7 -9.1 22.6 -43.1 133.3 50.0 5.0
705 687
484
253 225
12996 93
49 40 38 33 28 24 21
PCT
appli
catio
ns
Turkey Ind
iaBraz
il
Malaysi
aMexi
coUkra
ine
Thailan
d
South A
frica
Egypt
Bulgaria
Romani
a
Morocco
Serbia
Peru
Kazakhs
tan
Receiving office
Note: Data for 2015 are WIPO estimates. China is not included in this figure because it appears in figure A.1.2.1, and also because of the significant difference between the number of PCT applications received by SIPO and by the ROs of other middle-income countries.
Source: WIPO Statistics Database, May 2016.

27
SECTION A STATISTICS ON THE INTERNATIONAL PHASE: PCT APPLICATIONS
countries was 15.9%. Among middle-income countries, applicants from China were by far the largest users of the PCT System, having filed almost 30,000 applica-tions in 2015. They were followed by applicants from India (1,423), Turkey (1,016) and Brazil (547). Applicants from low-income countries filed 13 PCT applications; of these, filings from the Democratic People’s Republic of Korea (6), the United Republic of Tanzania (2) and Zimbabwe (2) accounted for the highest numbers.
A.2.2 – Filing trends
Despite a 6.7% decrease in filings from the U.S. in 2015, its applicants accounted for the largest number of appli-cations (57,385). Prior to 2015, filings from the U.S. grew continuously except during two periods – 2002-03 and 2008- 10 – which coincided with economic downturns. The decrease in filings in 2015 was the second sharp-est recorded for U.S. applicants since the PCT System entered into force in 1978; the previous highest de-crease (-11.6%) recorded for the U.S. occurred in 2009.
Filings from Japan (44,235) increased by 4.4% in 2015. In 2014, they decreased by 3.2%, ending 22 years of consecutive growth, including a period of strong growth between 2010 and 2012.
China saw the highest growth rate among the top 10 PCT filing countries – annual growth of 16.8%, repre-senting 29,846 applications filed. It became the third largest filer in 2013 due to a sharp increase in filings, especially since 2010.
Germany experienced slight growth of 0.5%, with 18,072 applications filed in 2015. From 1990 onwards, German applicants increased their filings each year until the economic downturn of 2009. Since then, German filings have not exceeded their 2008 level.
Applications from the Republic of Korea rose by 11.5% in 2015 to reach 14,626. This represents the sharpest growth since 2012. Among the top five origins, the Republic of Korea is the only country to have achieved virtually constant growth since 1990. The only decrease (-0.3%) recorded during this period dates back to 1997.
All five countries positioned between sixth and tenth place are in Europe. France is the only one that has seen continuous growth in filings since 1990. The four others in this group have experienced several years of decreases since 2008, and Switzerland is the only one to have exceeded its pre-2009 filing level.
Table A.2.2.2 shows the top countries (up to 10) in each region whose applicants filed more than 20 PCT appli-cations in 2015. These regions are based on the United Nations definition of regions. In 2015, applications were filed by applicants from 132 countries – eight countries more than in the preceding year. Altogether, 79 coun-tries saw an increase in filings and 56 saw a decrease compared with 2014. In each region, the top three origins combined accounted for the majority of filings.
Filings in four of the six regions recorded an increase on 2014 figures. The highest annual growth in numbers of
Figure A.2.1: PCT applications by country of origin, 2015
10,000 - 69,9991,000 - 9,999100 - 99910 - 991 - 9No data
Note: Data for 2015 are WIPO estimates.
Source: WIPO Statistics Database, May 2016.

28
SECTION A STATISTICS ON THE INTERNATIONAL PHASE: PCT APPLICATIONS
applications was seen in Asia (+9%) and Africa (+2.3%). Filings in Latin America and the Caribbean (LAC) and North America decreased by 3.8% and 6.7%, respectively.Asian countries filed 43.5% of all applications in 2015, followed by North America (27.6%) and Europe (27%). Combined, Africa, LAC and Oceania accounted for slightly less than 2% of the total.
A.2.3 – PCT applications as a share of resident applications
Figure A.2.3 presents a hypothetical “conversion ratio” which reflects the proportion of direct resident patent applications converted into PCT applications, defined as the total number of PCT applications divided by the total number of direct resident applications (including regional applications and excluding PCT national phase entries). Resident application data are lagged by one year because applicants have up to 12 months from
the filing date of the earlier national filing to submit a PCT application.8 For example, in order to derive the conversion ratio for Norway, its 2015 PCT applications (679) are divided by the 2014 direct resident applica-tions (1,173), which equals 0.58.
In theory, the conversion ratio should be between zero and one. However, it may exceed one because some applications do not have priority claims associated with prior resident filings. For example, an Israeli applicant may forego filing an application at the Israel Patent Office, but opt to file a first application at the USPTO, after which it is converted into a PCT application.
8. Strictly speaking, the calculation of the conversion ratio should be based on “first” filings at national offices (excluding “subsequent” filings). However, the data collected from most patent offices do not distinguish between first and subsequent filings. The data in figure A.2.3 are therefore based on total resident patent filings.
Figure A.2.2.1: Trend in PCT applications for the top 10 origins
0
10,000
20,000
30,000
40,000
50,000
60,000
PCT
appli
catio
ns
1990 1991 1992 1993 1994 1995 1996 1997 1998 1999 2000 2001 2002 2003 2004 2005 2006 2007 2008 2009 2010 2011 2012 2013 2014 2015
United States of America Japan China Germany Republic of Korea
International filing year
0
2,000
4,000
6,000
8,000
10,000
PCT
appli
catio
ns
1990 1991 1992 1993 1994 1995 1996 1997 1998 1999 2000 2001 2002 2003 2004 2005 2006 2007 2008 2009 2010 2011 2012 2013 2014 2015
France United Kingdom Switzerland Netherlands Sweden
International filing year
Note: Data for 2015 are WIPO estimates.
Source: WIPO Statistics Database, May 2016.

29
SECTION A STATISTICS ON THE INTERNATIONAL PHASE: PCT APPLICATIONS
Table A.2.2.2: PCT applications for the top countries by region
Year of international filingRegional
shareChange
from
Region Name 2011 2012 2013 2014 2015 2015 (%) 2014 (%)
Africa South Africa 309 313 351 313 314 64.2 0.3
Egypt 32 45 50 47 58 11.9 23.4
Morocco 19 39 54 60 35 7.2 -41.7
Others 73 55 63 58 82 16.8 41.4
Total* 433 452 518 478 489 0.2 2.3
Asia Japan 38,864 43,523 43,771 42,381 44,235 46.7 4.4
China 16,398 18,620 21,515 25,548 29,846 31.5 16.8
Republic of Korea 10,357 11,787 12,381 13,117 14,626 15.4 11.5
Israel 1,449 1,374 1,607 1,581 1,698 1.8 7.4
India 1,323 1,309 1,320 1,428 1,423 1.5 -0.4
Turkey 539 536 805 853 1,016 1.1 19.1
Singapore 668 714 838 940 910 1.0 -3.2
Saudi Arabia 147 286 187 381 279 0.3 -26.8
Malaysia 263 292 308 313 268 0.3 -14.4
Thailand 67 65 69 68 132 0.1 94.1
Others 200 279 266 332 361 0.4 8.7
Total* 70,275 78,785 83,067 86,942 94,794 43.5 9.0
Europe Germany 18,846 18,750 17,920 17,983 18,072 30.7 0.5
France 7,406 7,802 7,905 8,260 8,476 14.4 2.6
United Kingdom 4,875 4,917 4,847 5,269 5,313 9.0 0.8
Netherlands 3,511 4,077 4,188 4,206 4,357 7.4 3.6
Switzerland 4,045 4,222 4,372 4,100 4,280 7.3 4.4
Sweden 3,476 3,600 3,946 3,913 3,858 6.6 -1.4
Italy 2,686 2,845 2,868 3,058 3,083 5.2 0.8
Finland 2,075 2,312 2,095 1,811 1,592 2.7 -12.1
Spain 1,732 1,704 1,705 1,706 1,537 2.6 -9.9
Austria 1,343 1,319 1,262 1,387 1,404 2.4 1.2
Others 6,307 6,632 6,939 6,973 6,854 11.7 -1.7
Total* 56,302 58,180 58,047 58,666 58,826 27.0 0.3
Latin America Brazil 562 588 657 580 547 40.3 -5.7
and the Mexico 226 188 233 284 320 23.5 12.7
Caribbean Chile 115 120 142 141 167 12.3 18.4
Barbados 111 168 149 173 125 9.2 -27.7
Colombia 55 71 82 101 86 6.3 -14.9
Argentina 24 25 26 33 28 2.1 -15.2
Peru 6 11 13 17 25 1.8 47.1
Others 97 107 83 84 61 4.5 -27.4
Total* 1,196 1,278 1,385 1,413 1,359 0.6 -3.8
North America United States of America 49,210 51,860 57,455 61,477 57,385 95.3 -6.7
Canada 2,914 2,737 2,845 3,069 2,848 4.7 -7.2
Total* 52,124 54,597 60,300 64,546 60,233 27.6 -6.7
Oceania Australia 1,748 1,710 1,604 1,722 1,752 82.7 1.7
New Zealand 329 303 320 348 360 17.0 3.4
Others 2 2 4 2 6 0.3 200.0
Total* 2,079 2,015 1,928 2,072 2,118 1.0 2.2
Unknown 27 27 47 197 181 n.a. -8.1
Total 182,436 195,334 205,292 214,314 218,000 n.a. 1.7
Note:* indicates the share of world total, and n.a. indicates not applicable. Data for 2015 are WIPO estimates. Table A.2.2.2 shows the top countries in each region (with a maximum of 10 countries per region) whose applicants filed more than 20 PCT applications in 2015.
Source: WIPO Statistics Database, May 2016.

30
SECTION A STATISTICS ON THE INTERNATIONAL PHASE: PCT APPLICATIONS
In 2015, applicants from Israel (2.22), Australia (1.42), Luxembourg (1.26), Sweden (1.22) and Canada (1.08) had conversion ratios above one, reflecting numerous PCT filings with no prior resident filings. In contrast, few direct resident filings from the Republic of Korea (0.09), China (0.04) and the Russian Federation (0.03) were converted into PCT applications.
The conversion ratios of the top five filers – ranging from 0.04 for China to 0.3 for Germany – are relatively low. This likely reflects high levels of filing activity by residents in their respective countries.
A.3 – PCT applicants
This subsection provides data on the distribution of applicants, applications by ownership type, share of applications with foreign co-applicants, and top ap-plicants. Applications by type of applicant are based on international filing date and on the country of resi-dence of the first-named applicant. For confidentiality reasons, the list of top applicants is based on the publication date.9
A.3.1 – Distribution of applicants
In 2015, 200,928 PCT applications were published by the IB and filed by 48,539 applicants. One-fifth of all of applicants accounted for 81.1% of applications
9. For the majority of PCT applications, the difference between the international filing date and the publication date is about six months.
published in 2015. This represents a higher concentra-tion of publications over time among the largest PCT applicants. In 2004, for example, one-fifth of all appli-cants accounted for 75.9% of published applications.
Figure A.3.1.2 shows the distribution of PCT applica-tions for the top 30 origins, broken down by four types of applicant: businesses, individuals, universities, and government and research institutions. In 2015, 85% of all published PCT applications belonged to business applicants, 8% to individuals, 5% to universities, and 2% to government and research institutions.
Businesses represented more than 95% of all pub-lished applications from Finland, Japan and Sweden. Individuals accounted for the majority of applications in the Russian Federation (56.6%) and a large proportion in South Africa (42.8%) and Brazil (37.9%). Universities accounted for a large share of applications in South Africa (18.1%), Poland (16.3%), Singapore (15.8%) and Spain (15.6%). Government and research institutions were responsible for a high share of applications originating in Singapore (15.8%), India (10.8%) and France (9.9%).
A.3.2 – Share of PCT applications with foreign co-applicants
The share of applications jointly filed by applicants from different countries is calculated based on all applicants named in applications published in 2015 (not just first-named applicants) that are corporations (excluding applicants who are natural persons).
Figure A.2.3: Conversion ratio of direct resident patent applications to PCT applications, 2015
2.22
1.421.26 1.22
1.080.95
0.81 0.81 0.74 0.700.59 0.58 0.55 0.50 0.44 0.42
0.32 0.30 0.30 0.27 0.23 0.22 0.21 0.18 0.12 0.12 0.10 0.09 0.04 0.030.0
0.5
1.0
1.5
2.0
2.5
Dire
ct re
siden
t to P
CT a
pplic
ation
co
nver
sion
ratio
(%)
Israel
Australi
a
Luxem
bourg
Sweden
Canada
Singapo
reIrel
and
Switzerlan
dFinla
nd
Netherla
nds
Belgium
Norway
Denmark
Austria
France
Spain
United K
ingdom Ital
y
Germany
Mexico
New Ze
aland
United S
tates o
f Americ
aTurk
eyJap
an India
Brazil
Poland
Republic
of Kore
aChin
a
Russian
Feder
ation
Origin
Note: The ratio is defined for the top 30 origins in terms of PCT applications filed in 2015, divided by resident patent applications (including regional applications and excluding PCT national phase entries) filed in 2014. Data for 2015 are WIPO estimates.
Source: WIPO Statistics Database, May 2016.
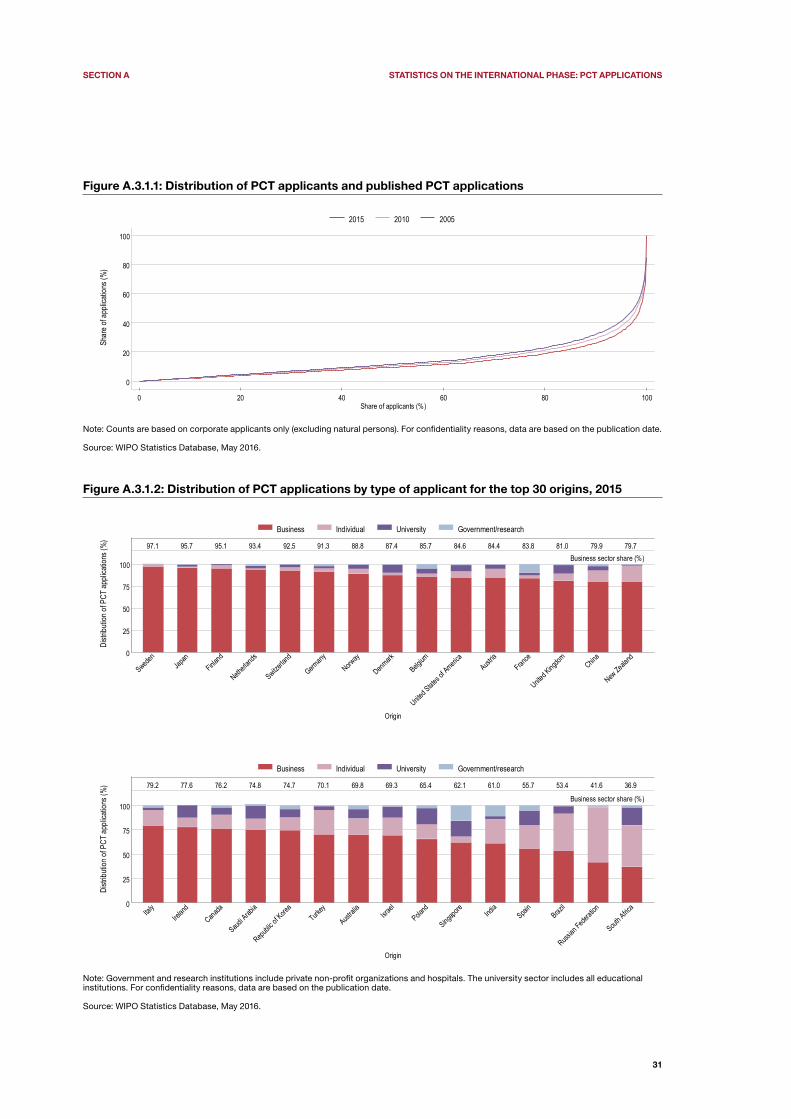
31
SECTION A STATISTICS ON THE INTERNATIONAL PHASE: PCT APPLICATIONS
Figure A.3.1.1: Distribution of PCT applicants and published PCT applications
0
20
40
60
80
100
Shar
e of
appli
catio
ns (%
)
0 20 40 60 80 100
2015 2010 2005
Share of applicants (%)
Note: Counts are based on corporate applicants only (excluding natural persons). For confidentiality reasons, data are based on the publication date.
Source: WIPO Statistics Database, May 2016.
Figure A.3.1.2: Distribution of PCT applications by type of applicant for the top 30 origins, 2015
Business sector share (%)97.1 95.7 95.1 93.4 92.5 91.3 88.8 87.4 85.7 84.6 84.4 83.8 81.0 79.9 79.7
0
25
50
75
100
Distr
ibutio
n of P
CT a
pplic
ation
s (%
)
Sweden
Japan
Finland
Netherla
nds
Switzerlan
d
Germany
Norway
Denmark
Belgium
United S
tates o
f Americ
aAust
riaFran
ce
United K
ingdom Chin
a
New Ze
aland
Origin
Business Individual University Government/research
Business sector share (%)
79.2 77.6 76.2 74.8 74.7 70.1 69.8 69.3 65.4 62.1 61.0 55.7 53.4 41.6 36.9
0
25
50
75
100
Distr
ibutio
n of P
CT a
pplic
ation
s (%
)
Italy
Ireland
Canada
Saudi Arab
ia
Republic
of Kore
aTurk
ey
Australi
aIsra
elPola
nd
Singapo
reInd
iaSpai
nBraz
il
Russian
Feder
ation
South A
frica
Origin
Business Individual University Government/research
Note: Government and research institutions include private non-profit organizations and hospitals. The university sector includes all educational institutions. For confidentiality reasons, data are based on the publication date.
Source: WIPO Statistics Database, May 2016.

32
SECTION A STATISTICS ON THE INTERNATIONAL PHASE: PCT APPLICATIONS
On average, international collaboration among ap-plicants from different countries remained fairly low in 2015, with only 2.8% of applications having at least two joint corporate applicants from different countries (figure A.3.2). This share decreased slightly (-0.2 per-centage points) on the 2011 figure.
Among the top 20 origins, Canada recorded the larg-est share of foreign co-applicants, with 17.2% of its applications listing at least one foreign co-applicant. It was followed by Finland (11.3%) and Belgium (10.8%). Among the top 20 origins, applications from China (1.1%), Japan (0.9%) and the Republic of Korea (0.3%) had the lowest shares of foreign co-applicants.
Compared with 2011, the share of applications with foreign co-applicants in 2014 has changed substantially for Finland (+8.1 percentage points), Canada (+7.5) and the Netherlands (-7.2).
A.3.3 – Top PCT applicants
Business sector
Huawei Technologies of China remained the top PCT applicant in 2015, with 3,898 applications published (table A.3.3.1). Since 2007, Huawei Technologies has ranked among the top five applicants, and it was also
the top PCT applicant in 2008 and 2014. Qualcomm, which is incorporated in the U.S., remained in sec-ond position, with 2,442 applications published. ZTE Corporation of China and Mitsubishi Electric of Japan retained their third and fifth positions, respectively. The only change among the top five PCT applicants related to Samsung Electronics of the Republic of Korea, which advanced seven places to rank in fourth position.
Electrical engineering was the main sector of filing for the majority (31) of the top 50 PCT applicants; the exception among the top 10 applicants in this group was Philips Electronics, which mainly filed in the instru-ments sector. The three fields of technology in which the largest number of the top 50 applicants mainly filed applications were digital communication (with 11 applicants), electrical machinery (9) and computer technology (7); these three fields belong to the electrical engineering sector. The main field of technology of filing for 6 of the top 7 applicants was digital communica-tion; the exception among this group of applicants was Mitsubishi Electric, which mainly filed in the electrical machinery field of technology.
With 19 applicants, Japan had the highest number of applicants ranking among the top 50 PCT applicants. Japan was followed by 13 applicants from the U.S., 7 from China, 4 from Germany and 3 from the Republic of Korea.
Figure A.3.2: Share of PCT applications with foreign co-applicants, 2015
Percentage point change over 2011
7.5 8.1 4.2 4.1 -7.2 0.3 -1.1 -0.1 0.3 -0.2 0.8 -2.6 -1.0 0.3 -0.9 0.8 -0.7 -0.2 -1.0 0.2 -0.7
17.2
11.3 10.8
8.6 8.36.4
5.0 5.0
2.9 2.8 2.8 2.4 2.4 2.2 2.0 2.0 1.9 1.5 1.1 0.9 0.3
Shar
e of
PCT
appli
catio
ns
with
fore
ign co
-app
lican
t(s) (
%)
Canada
Finland
Belgium
Switzerlan
d
Netherla
ndsFran
ceIsra
el
United K
ingdom
Germany Tota
lSpai
nInd
ia
United S
tates o
f Americ
a
Australi
aAust
ria Italy
Denmark
Sweden
China
Japan
Republic
of Kore
a
Origin
Note: Counts are based on corporate applicants only (excluding natural persons) and on all applicants named in PCT applications (not only the first-named applicant). For confidentiality reasons, PCT data are based on the publication date.
Source: WIPO Statistics Database, May 2016.

33
SECTION A STATISTICS ON THE INTERNATIONAL PHASE: PCT APPLICATIONS
Table A.3.3.1: Top 50 PCT applicants: businesses, 2015
Overall rank
Change in position
from 2014 Applicants Origin ApplicationsChange
from 2014
1 0 HUAWEI TECHNOLOGIES CO., LTD. China 3,898 456
2 0 QUALCOMM INCORPORATED United States of America 2,442 33
3 0 ZTE CORPORATION China 2,155 -24
4 7 SAMSUNG ELECTRONICS CO., LTD. Republic of Korea 1,683 302
5 0 MITSUBISHI ELECTRIC CORPORATION Japan 1,593 0
6 1 TELEFONAKTIEBOLAGET LM ERICSSON (PUBL) Sweden 1,481 -31
7 9 LG ELECTRONICS INC. Republic of Korea 1,457 319
8 13 SONY CORPORATION Japan 1,381 399
9 1 KONINKLIJKE PHILIPS ELECTRONICS N.V. Netherlands 1,378 -13
10 15 HEWLETT-PACKARD DEVELOPMENT COMPANY, L.P. United States of America 1,310 484
11 -2 SIEMENS AKTIENGESELLSCHAFT Germany 1,292 -107
12 -6 INTEL CORPORATION United States of America 1,250 -289
13 0 ROBERT BOSCH CORPORATION Germany 1,247 -124
14 20 BOE TECHNOLOGY GROUP CO.,LTD China 1,227 674
15 -3 TOYOTA JIDOSHA KABUSHIKI KAISHA Japan 1,214 -164
16 57 PANASONIC INTELLECTUAL PROPERTY MANAGEMENT CO., LTD. Japan 1,185 918
17 3 HITACHI, LTD. Japan 1,165 169
18 8 HALLIBURTON ENERGY SERVICES, INC. United States of America 1,121 321
19 -5 SHARP KABUSHIKI KAISHA Japan 1,073 -154
20 -3 TENCENT TECHNOLOGY (SHENZHEN) COMPANY LIMITED China 981 -105
21 -3 FUJIFILM CORPORATION Japan 947 -125
22 -7 NEC CORPORATION Japan 895 -320
23 n/a MICROSOFT TECHNOLOGY LICENSING, LLC United States of America 860 860
24 10 LG CHEM, LTD. Republic of Korea 739 186
25 2 BASF SE Germany 735 -45
26 -4 GOOGLE INC. United States of America 721 -196
27 -4 SHENZHEN CHINA STAR OPTOELECTRONICS TECHNOLOGY CO., LTD China 710 -194
28 1 DENSO CORPORATION Japan 704 39
29 -1 3M INNOVATIVE PROPERTIES COMPANY United States of America 676 -20
30 -11 UNITED TECHNOLOGIES CORPORATION United States of America 661 -352
31 2 MURATA MANUFACTURING CO., LTD. Japan 658 70
32 40 OLYMPUS CORPORATION Japan 614 342
33 21 SCHAEFFLER TECHNOLOGIES AG & CO. KG Germany 608 245
34 -10 KABUSHIKI KAISHA TOSHIBA Japan 595 -261
35 7 PROCTER & GAMBLE COMPANY United States of America 546 72
36 1 KONICA MINOLTA, INC. Japan 516 -3
37 -5 GENERAL ELECTRIC COMPANY United States of America 500 -107
38 5 KYOCERA CORPORATION Japan 459 -13
39 8 HUAWEI DEVICE CO., LTD. China 442 22
40 0 ALCATEL LUCENT France 419 -76
41 -5 FUJITSU LIMITED Japan 418 -134
42 2 DOW GLOBAL TECHNOLOGIES INC. United States of America 411 -60
44 -6 APPLE COMPUTER, INC. United States of America 383 -131
45 6 APPLIED MATERIALS, INC. United States of America 376 -19
46 9 SCHLUMBERGER CANADA LIMITED Canada 374 12
47 -16 NISSAN MOTOR CO., LTD. Japan 368 -252
47 -6 MITSUBISHI HEAVY INDUSTRIES, LTD. Japan 368 -119
49 3 NITTO DENKO CORPORATION Japan 366 -26
51 241 KIMREE HI-TECH INC. China 348 267
52 17 HITACHI AUTOMOTIVE SYSTEMS, LTD. Japan 343 53
Note: For confidentiality reasons, data are based on publication date.
Source: WIPO Statistics Database, May 2016.

34
SECTION A STATISTICS ON THE INTERNATIONAL PHASE: PCT APPLICATIONS
University sector
The University of California remained the largest filer among educational institutions, with 361 pub-lished applications in 2015; it was followed by the Massachusetts Institute of Technology (213) and Johns Hopkins University (170) (table A.3.3.2). The University of California was the only educational institution that ranked among the top 50 PCT applicants.
The top seven university applicants were from the U.S. Altogether, 24 of the top 50 applicants in 2015 were based in the U.S.; the comparable figure in 2014 was 28. This was the first year where universities from the U.S. did not account for the majority of the top 50. The U.S. was followed by universities from the Republic of Korea (6), China (5) and Japan (5). Altogether, universi-ties from 10 countries were ranked among the top 50 in 2015. This is one country more than in 2014, with Saudi Arabia included for the first time.
Government and research institutions sector
With 409 published applications, the Commissariat à l’Énergie Atomique et aux Énergies Alternatives of France remained the top PCT applicant among government and research institutions (table A.3.3.3). It was the only such institution that ranked among the top 50 PCT applicants in 2015. It was followed by the Fraunhofer-Gesellschaft zur Forderung der ange-wandten Forschung e.V. of Germany and the Agency of Science, Technology and Research of Singapore.
With six applicants each, the Republic of Korea and the U.S. had the largest number of applicants in this list. China, France and Japan each had three applicants. Two government and research institutions from middle-income countries, other than China, ranked among the top 30 PCT applicants, namely Mimos Berhad of Malaysia and the Council of Scientific and Industrial Research of India, ranking as the top sixth and top ninth PCT applicant, respectively, in the government and research institutions sector in 2015.
A.4 – PCT applications by fields of technology
PCT applications span a wide range of technologies. The tendency to file patent applications differs across technologies, as some technologies depend more on
the patent system than others. This subsection shows the distribution of PCT applications across fields of technology by year and origin, as well as the relative specialization index.
For confidentiality reasons, statistics are based on the publication date rather than the filing date. Statistics based on the publication date have a delay of approxi-mately six months compared with those based on the international filing date. The breakdown of published PCT applications by field of technology is based on a concordance table that relates the International Patent Classification (IPC) symbols to 35 fields of technology.10
A.4.1 – Overall trend
With 16,385 published applications, computer technol-ogy remained the technical field in which the largest number of PCT applications was published in 2015. It was followed by digital communication (16,047), electri-cal machinery (14,612), medical technology (12,633) and transport (8,627) (table A.4.1). This latter field advanced one place on its 2014 position, and was the only change in ranking among the top five fields of technology. The top five fields of technology accounted for slightly more than one-third of the total in 2015.
A.4.2 – Countries’ specialization
The relative specialization index (RSI) measures how much a country specializes in a given technological field. The RSI corrects for the effects of country size and focuses on the concentration in specific technol-ogy fields; it seeks to capture whether applicants from a particular country tend to have a lower or a higher propensity to file in certain technology fields.11
Austria and Japan had a high concentration of applica-tions in electrical machinery (figure A.4.2). RSI values for digital communication are skewed toward just a few origins (China, Finland, Malaysia, the Republic of Korea and Sweden), whereas those for measurement are more evenly distributed. As was the case in 2014, India had a high share of PCT applications in pharma-ceuticals in 2015.
10. The concordance table is available at www.wipo.int/ipstats/en/statistics/patents/.
11. The RSI is calculated using the following formula: where FC and FT denote applications
from country C and in technological field T, respectively. A positive RSI value for a technology indicates that a particular country has a relatively high share of PCT filings related to that field of technology.
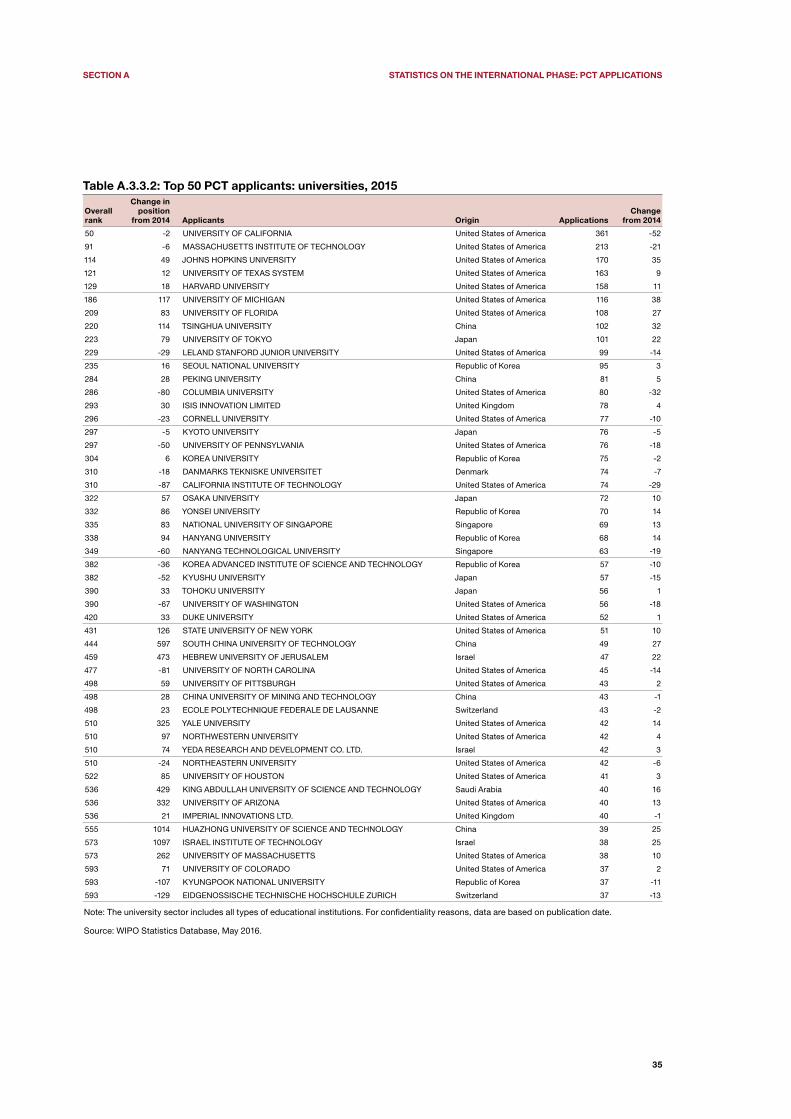
35
SECTION A STATISTICS ON THE INTERNATIONAL PHASE: PCT APPLICATIONS
Table A.3.3.2: Top 50 PCT applicants: universities, 2015
Overall rank
Change in position
from 2014 Applicants Origin ApplicationsChange
from 2014
50 -2 UNIVERSITY OF CALIFORNIA United States of America 361 -52
91 -6 MASSACHUSETTS INSTITUTE OF TECHNOLOGY United States of America 213 -21
114 49 JOHNS HOPKINS UNIVERSITY United States of America 170 35
121 12 UNIVERSITY OF TEXAS SYSTEM United States of America 163 9
129 18 HARVARD UNIVERSITY United States of America 158 11
186 117 UNIVERSITY OF MICHIGAN United States of America 116 38
209 83 UNIVERSITY OF FLORIDA United States of America 108 27
220 114 TSINGHUA UNIVERSITY China 102 32
223 79 UNIVERSITY OF TOKYO Japan 101 22
229 -29 LELAND STANFORD JUNIOR UNIVERSITY United States of America 99 -14
235 16 SEOUL NATIONAL UNIVERSITY Republic of Korea 95 3
284 28 PEKING UNIVERSITY China 81 5
286 -80 COLUMBIA UNIVERSITY United States of America 80 -32
293 30 ISIS INNOVATION LIMITED United Kingdom 78 4
296 -23 CORNELL UNIVERSITY United States of America 77 -10
297 -5 KYOTO UNIVERSITY Japan 76 -5
297 -50 UNIVERSITY OF PENNSYLVANIA United States of America 76 -18
304 6 KOREA UNIVERSITY Republic of Korea 75 -2
310 -18 DANMARKS TEKNISKE UNIVERSITET Denmark 74 -7
310 -87 CALIFORNIA INSTITUTE OF TECHNOLOGY United States of America 74 -29
322 57 OSAKA UNIVERSITY Japan 72 10
332 86 YONSEI UNIVERSITY Republic of Korea 70 14
335 83 NATIONAL UNIVERSITY OF SINGAPORE Singapore 69 13
338 94 HANYANG UNIVERSITY Republic of Korea 68 14
349 -60 NANYANG TECHNOLOGICAL UNIVERSITY Singapore 63 -19
382 -36 KOREA ADVANCED INSTITUTE OF SCIENCE AND TECHNOLOGY Republic of Korea 57 -10
382 -52 KYUSHU UNIVERSITY Japan 57 -15
390 33 TOHOKU UNIVERSITY Japan 56 1
390 -67 UNIVERSITY OF WASHINGTON United States of America 56 -18
420 33 DUKE UNIVERSITY United States of America 52 1
431 126 STATE UNIVERSITY OF NEW YORK United States of America 51 10
444 597 SOUTH CHINA UNIVERSITY OF TECHNOLOGY China 49 27
459 473 HEBREW UNIVERSITY OF JERUSALEM Israel 47 22
477 -81 UNIVERSITY OF NORTH CAROLINA United States of America 45 -14
498 59 UNIVERSITY OF PITTSBURGH United States of America 43 2
498 28 CHINA UNIVERSITY OF MINING AND TECHNOLOGY China 43 -1
498 23 ECOLE POLYTECHNIQUE FEDERALE DE LAUSANNE Switzerland 43 -2
510 325 YALE UNIVERSITY United States of America 42 14
510 97 NORTHWESTERN UNIVERSITY United States of America 42 4
510 74 YEDA RESEARCH AND DEVELOPMENT CO. LTD. Israel 42 3
510 -24 NORTHEASTERN UNIVERSITY United States of America 42 -6
522 85 UNIVERSITY OF HOUSTON United States of America 41 3
536 429 KING ABDULLAH UNIVERSITY OF SCIENCE AND TECHNOLOGY Saudi Arabia 40 16
536 332 UNIVERSITY OF ARIZONA United States of America 40 13
536 21 IMPERIAL INNOVATIONS LTD. United Kingdom 40 -1
555 1014 HUAZHONG UNIVERSITY OF SCIENCE AND TECHNOLOGY China 39 25
573 1097 ISRAEL INSTITUTE OF TECHNOLOGY Israel 38 25
573 262 UNIVERSITY OF MASSACHUSETTS United States of America 38 10
593 71 UNIVERSITY OF COLORADO United States of America 37 2
593 -107 KYUNGPOOK NATIONAL UNIVERSITY Republic of Korea 37 -11
593 -129 EIDGENOSSISCHE TECHNISCHE HOCHSCHULE ZURICH Switzerland 37 -13
Note: The university sector includes all types of educational institutions. For confidentiality reasons, data are based on publication date.
Source: WIPO Statistics Database, May 2016.

36
SECTION A STATISTICS ON THE INTERNATIONAL PHASE: PCT APPLICATIONS
Table A.3.3.3: Top 30 PCT applicants: government and research institutions, 2015
Overall rank
Change in position
from 2014 Applicants Origin ApplicationsChange
from 2014
43 3 COMMISSARIAT A L'ENERGIE ATOMIQUE ET AUX ENERGIES ALTERNATIVES France 409 -25
59 4 FRAUNHOFER-GESELLSCHAFT ZUR FORDERUNG DER ANGEWANDTEN FORSCHUNG E.V.
Germany 323 5
142 -5 AGENCY OF SCIENCE, TECHNOLOGY AND RESEARCH Singapore 148 -4
155 6 INSTITUT NATIONAL DE LA SANTE ET DE LA RECHERCHE MEDICALE (INSERM)
France 137 1
155 -15 CENTRE NATIONAL DE LA RECHERCHE SCIENTIFIQUE (CNRS) France 137 -13
177 14 MIMOS BERHAD Malaysia 121 2
179 -71 CHINA ACADEMY OF TELECOMMUNICATIONS TECHNOLOGY China 118 -78
194 4 NATIONAL INSTITUTE OF ADVANCED INDUSTRIAL SCIENCE AND TECHNOLOGY
Japan 112 -2
201 -8 COUNCIL OF SCIENTIFIC AND INDUSTRIAL RESEARCH India 110 -7
263 26 U.S.A., AS REPRESENTED BY THE SECRETARY DEPT. OF HEALTH AND HUMAN SERVICES
United States of America 87 5
329 47 KOREA INSTITUTE OF INDUSTRIAL TECHNOLOGY Republic of Korea 71 8
339 268 MAYO FOUNDATION FOR MEDICAL EDUCATION AND RESEARCH United States of America 67 29
345 6 NEDERLANDSE ORGANISATIE VOOR TOEGEPAST- NATUURWETENSCHAPPELIJK ONDERZOEK TNO
Netherlands 64 -2
374 49 JAPAN SCIENCE AND TECHNOLOGY AGENCY Japan 59 4
374 -114 CONSEJO SUPERIOR DE INVESTIGACIONES CIENTIFICAS (CSIC) Spain 59 -31
390 96 SLOAN-KETTERING INSTITUTE FOR CANCER RESEARCH United States of America 56 8
399 280 KOREA RESEARCH INSTITUTE OF BIOSCIENCE AND BIOTECHNOLOGY Republic of Korea 55 21
437 -145 KOREA INSTITUTE OF ENERGY RESEARCH Republic of Korea 50 -31
444 -58 BATTELLE MEMORIAL INSTITUTE United States of America 49 -11
465 -334 INSTITUTE OF MICROELECTRONICS OF CHINESE ACADEMY OF SCIENCES China 46 -110
522 -143 KOREA ELECTRONICS TECHNONLOGY INSTITUTE Republic of Korea 41 -21
614 139 DALIAN INSTITUTE OF CHEMICAL PHYSICS, CHINESE ACADEMY OF SCIENCES
China 36 5
614 281 SCRIPPS RESEARCH INSTITUTE United States of America 36 10
623 -16 COMMONWEALTH SCIENTIFIC AND INDUSTRIAL RESEARCH ORGANISATION Australia 35 -3
655 -232 ELECTRONICS & TELECOMMUNICATIONS RESEARCH INSTITUTE OF KOREA Republic of Korea 33 -22
695 -257 CLEVELAND CLINIC FOUNDATION United States of America 31 -22
716 37 KOREA RESEARCH INSTITUTE OF STANDARDS AND SCIENCE Republic of Korea 30 -1
742 402 FONDAZIONE ISTITUTO ITALIANO DI TECNOLOGIA Italy 29 9
742 -98 RIKEN (THE INSTITUTE OF PHYSICAL AND CHEMICAL RESEARCH) Japan 29 -7
770 -233 MAX-PLANCK-GESELLSCHAFT ZUR FORDERUNG DER WISSENSCHAFTEN E.V.
Germany 28 -15
Note: Government and research institutions include private non-profit organizations and hospitals. For confidentiality reasons, data are based on publication date.
Source: WIPO Statistics Database, May 2016.
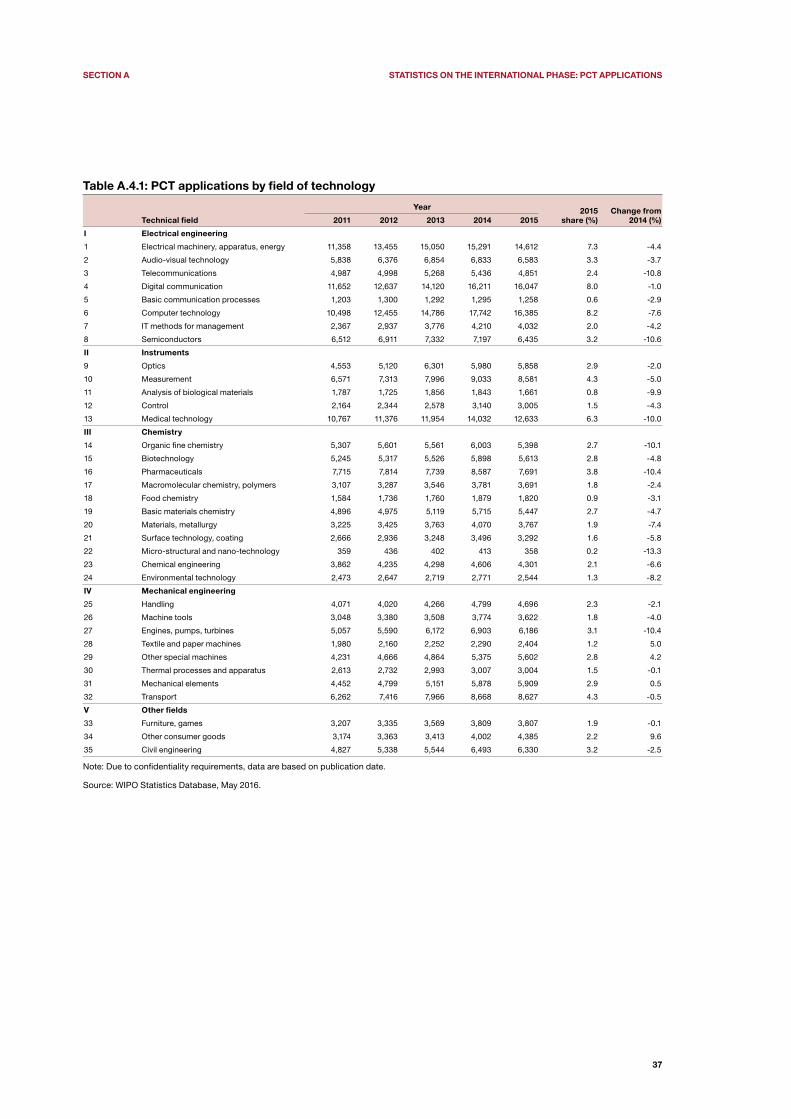
37
SECTION A STATISTICS ON THE INTERNATIONAL PHASE: PCT APPLICATIONS
Table A.4.1: PCT applications by field of technology
Year 2015share (%)
Change from 2014 (%)Technical field 2011 2012 2013 2014 2015
I Electrical engineering
1 Electrical machinery, apparatus, energy 11,358 13,455 15,050 15,291 14,612 7.3 -4.4
2 Audio-visual technology 5,838 6,376 6,854 6,833 6,583 3.3 -3.7
3 Telecommunications 4,987 4,998 5,268 5,436 4,851 2.4 -10.8
4 Digital communication 11,652 12,637 14,120 16,211 16,047 8.0 -1.0
5 Basic communication processes 1,203 1,300 1,292 1,295 1,258 0.6 -2.9
6 Computer technology 10,498 12,455 14,786 17,742 16,385 8.2 -7.6
7 IT methods for management 2,367 2,937 3,776 4,210 4,032 2.0 -4.2
8 Semiconductors 6,512 6,911 7,332 7,197 6,435 3.2 -10.6
II Instruments
9 Optics 4,553 5,120 6,301 5,980 5,858 2.9 -2.0
10 Measurement 6,571 7,313 7,996 9,033 8,581 4.3 -5.0
11 Analysis of biological materials 1,787 1,725 1,856 1,843 1,661 0.8 -9.9
12 Control 2,164 2,344 2,578 3,140 3,005 1.5 -4.3
13 Medical technology 10,767 11,376 11,954 14,032 12,633 6.3 -10.0
III Chemistry
14 Organic fine chemistry 5,307 5,601 5,561 6,003 5,398 2.7 -10.1
15 Biotechnology 5,245 5,317 5,526 5,898 5,613 2.8 -4.8
16 Pharmaceuticals 7,715 7,814 7,739 8,587 7,691 3.8 -10.4
17 Macromolecular chemistry, polymers 3,107 3,287 3,546 3,781 3,691 1.8 -2.4
18 Food chemistry 1,584 1,736 1,760 1,879 1,820 0.9 -3.1
19 Basic materials chemistry 4,896 4,975 5,119 5,715 5,447 2.7 -4.7
20 Materials, metallurgy 3,225 3,425 3,763 4,070 3,767 1.9 -7.4
21 Surface technology, coating 2,666 2,936 3,248 3,496 3,292 1.6 -5.8
22 Micro-structural and nano-technology 359 436 402 413 358 0.2 -13.3
23 Chemical engineering 3,862 4,235 4,298 4,606 4,301 2.1 -6.6
24 Environmental technology 2,473 2,647 2,719 2,771 2,544 1.3 -8.2
IV Mechanical engineering
25 Handling 4,071 4,020 4,266 4,799 4,696 2.3 -2.1
26 Machine tools 3,048 3,380 3,508 3,774 3,622 1.8 -4.0
27 Engines, pumps, turbines 5,057 5,590 6,172 6,903 6,186 3.1 -10.4
28 Textile and paper machines 1,980 2,160 2,252 2,290 2,404 1.2 5.0
29 Other special machines 4,231 4,666 4,864 5,375 5,602 2.8 4.2
30 Thermal processes and apparatus 2,613 2,732 2,993 3,007 3,004 1.5 -0.1
31 Mechanical elements 4,452 4,799 5,151 5,878 5,909 2.9 0.5
32 Transport 6,262 7,416 7,966 8,668 8,627 4.3 -0.5
V Other fields
33 Furniture, games 3,207 3,335 3,569 3,809 3,807 1.9 -0.1
34 Other consumer goods 3,174 3,363 3,413 4,002 4,385 2.2 9.6
35 Civil engineering 4,827 5,338 5,544 6,493 6,330 3.2 -2.5
Note: Due to confidentiality requirements, data are based on publication date.
Source: WIPO Statistics Database, May 2016.

38
SECTION A STATISTICS ON THE INTERNATIONAL PHASE: PCT APPLICATIONS
Figure A.4.2: Relative specialization index for published PCT applications by selected fields of technology, 2015
Note: The IPC technology concordance table (available at: www.wipo.int/ipstats/en) was used to convert IPC symbols into 35 corresponding fields of technology. The data refer to published applications.
Source: WIPO Statistics Database, May 2016.
-0.462-0.343-0.333-0.325
-0.193-0.190-0.166
-0.136-0.129-0.122-0.111
0.0330.061
0.1010.1760.198
GermanySwedenSwitzerlandOthersFranceCanadaIndiaJapanNetherlandsAustraliaUnited Kingdom
FinlandRepublic of Korea
IsraelUnited States of America
China
-1 -0.5 0 0.5 1
Computer technology
-0.439-0.273
-0.227-0.218-0.217-0.217
-0.105-0.084
-0.0310.0490.0690.079
0.1140.125
0.2220.225
SwedenOthersUnited States of AmericaCanadaItalySpainFranceUnited KingdomChina
SingaporeRepublic of Korea
SwitzerlandNetherlands
GermanyJapan
Austria
-1 -0.5 0 0.5 1
Electrical machinery, apparatus, energy
-0.382-0.286
-0.255-0.082
-0.046-0.022
0.0180.049
0.1120.136
0.1770.2570.258
0.3340.356
0.719
JapanGermanyChinaNetherlandsRepublic of KoreaFrance
ItalyOthers
United KingdomCanada
United States of AmericaIsraelSpain
SwitzerlandBelgium
India
-1 -0.5 0 0.5 1
Pharmaceuticals
-0.756-0.664
-0.637-0.539
-0.379-0.287-0.266-0.245
-0.192-0.098
-0.0470.1640.183
0.4670.485
0.582
SwitzerlandOthersGermanyNetherlandsIsraelUnited KingdomJapanSingaporeCanadaFranceUnited States of America
MalaysiaRepublic of Korea
ChinaFinlandSweden
-1 -0.5 0 0.5 1
Digital communication
-0.218-0.185
-0.053-0.053-0.025-0.012
0.0190.053
0.0940.1130.1140.1300.1550.1570.171
0.217
Republic of KoreaChinaOthersItalySwedenUnited States of America
JapanAustria
NetherlandsFrance
GermanyIsrael
SwitzerlandUnited Kingdom
CanadaSingapore
-1 -0.5 0 0.5 1
Measurement
-0.358-0.312-0.298-0.294
-0.217-0.079
0.0040.0620.0810.1020.1140.1320.158
0.2380.322
0.374
ChinaSwitzerlandUnited States of AmericaNetherlandsRepublic of KoreaOthers
CanadaAustria
AustraliaUnited Kingdom
ItalyJapanSpain
SwedenGermany
France
-1 -0.5 0 0.5 1
Transport


41
Section BStatistics on PCT National Phase Entries
The PCT process begins with the international phase and ends with the national phase. The national or re-gional patent office at which an applicant enters the PCT national phase processes the application further with a view to either granting or refusing it, in accordance with the applicable law, taking into account the search result and optional examination from the international phase.
The analysis of national phase entry (NPE) data pro-vides information on the use of the PCT System for seeking patent protection at national and regional offices. Section B briefly describes the global trends for NPEs, comparison of the use of the PCT and the direct filing routes (Paris route), the origin of NPEs, and the main offices of destination.
The data reported here are based on data supplied to WIPO by national and regional patent offices. However, it should be noted that not all offices supply NPE data to WIPO. Offices share their data with WIPO several months after the end of each calendar year. For this reason, the latest available data refer to 2014.
B.1 – Overview
This subsection analyzes the global and latest trends in NPEs as well as their use relative to the Paris route.
B.1.1 – Overall trend
An estimated 595,400 NPEs were initiated in 2014, representing a 5.2% increase on 2013 (figure B.1.1). The year 2014 marked the fifth consecutive year of growth, following a sharp drop in 2009 – the height of the financial crisis. U.S. applicants accounted for 44% of the total growth in NPEs; they were followed by ap-plicants from China (15%) and Japan (10%).
In 2014, about 84% of all NPEs were filed by non-residents (abroad) and 16% were filed by residents (at their country’s home office). The share of NPEs initiated by resident applicants has increased from 13% in 2004 to 16% in 2014. The increase was mainly due to strong growth in resident NPEs at the JPO and the USPTO.
Figure B.1.1: Trend in PCT national phase entries
. 16.1 40.0 16.1 18.6 9.1 20.7 8.5
-0.5
11.3 11.0 11.1 8.8 7.4
-4.1
7.8 4.7 6.5 4.2 5.2
100,000
300,000
500,000
PCT
natio
nal p
hase
entrie
s
1995 1996 1997 1998 1999 2000 2001 2002 2003 2004 2005 2006 2007 2008 2009 2010 2011 2012 2013 2014
PCT national phase entries Growth rate (%)
Application year
Note: These are WIPO estimates. Missing data for offices that do not provide statistics have been estimated by WIPO on an aggregate basis.
Source: WIPO Statistics Database, May 2016.

42
The long-term trend shows continuous year-on-year growth in NPEs since 1995, except for two years: 2003 and 2009. This growth partly reflects the increasing trend of protecting inventions abroad, as well as in-creasing PCT membership, which makes the System more attractive to its users. The 4.1% decrease in NPEs in 2009 was mainly due to a fall in NPEs originating in Germany, the Netherlands and the U.S.
B.1.2 – Non-resident patent applications by filing route
To file a patent application abroad (seeking protection in a foreign country), applicants can decide either to file directly at an office (using the Paris route) or to use the PCT route and pursue the application through NPEs. In 2014, an estimated 501,900 non-resident NPEs were initiated worldwide and about 378,700 applications were filed directly at offices by non-resident applicants (figure B.1.2). In 2014, non-resident NPEs increased by 5.5% on 2013, while non-resident Paris route filings saw a small decrease (-0.3%).
The long-term trend shows that since 1995 both routes trended upward, although the PCT route grew at a much faster rate. On average, the Paris route grew 1.9% a year from 1995 to 2014, but the PCT route grew much faster, by 10% a year. The trend for the Paris route also showed five years of decreases, compared with only two for the PCT route. During the financial crisis and the economic downturn in 2009, Paris route filings decreased by 10%, compared with a 5.5% drop in PCT NPEs.
In 1995, just over three-quarters of all applications filed by non-residents were filed via the Paris route. By 2007, over half of non-resident applications were filed via the PCT route and in 2014 this share reached 57%.
B.2 – National phase entries by country of origin
This subsection analyzes NPEs according to the ap-plicant’s origin. It also provides data by income group and further compares the use of the PCT System with that of the Paris route. Note that the origin of an application is defined using the country/territory of residence of the first-named applicant. Data by origin may be incomplete. A statistical table listing all origins is provided in the annex.
B.2.1 – World map
In 2014, NPEs were initiated by applicants from 148 different origins, but most NPEs were concentrated among Germany, Japan and the U.S. Combined, these three countries were the origin of 60% of all NPEs initi-ated worldwide in 2014 (figure B.2.1). Levels were low for many countries. For example, the top 10 origins accounted for 84% of total NPEs in 2014, while the remaining 138 origins accounted for 16%.
High-income countries accounted for 93% of NPEs, whereas middle-income countries accounted for 5.6%. China, with 22,473 NPEs, filed by far the highest num-ber of NPEs among middle-income countries; it was
Figure B.1.2: Trend in non-resident applications by filing route
0
100,000
200,000
300,000
400,000
500,000
Non-
resid
ent a
pplic
ation
s
1995 1996 1997 1998 1999 2000 2001 2002 2003 2004 2005 2006 2007 2008 2009 2010 2011 2012 2013 2014
Paris route PCT national phase entries
Year
Note: These are WIPO estimates. Missing data for offices that did not provide statistics have been estimated by WIPO on an aggregate basis.
Source: WIPO Statistics Database, May 2016.
SECTION B STATISTICS ON PCT NATIONAL PHASE ENTRIES
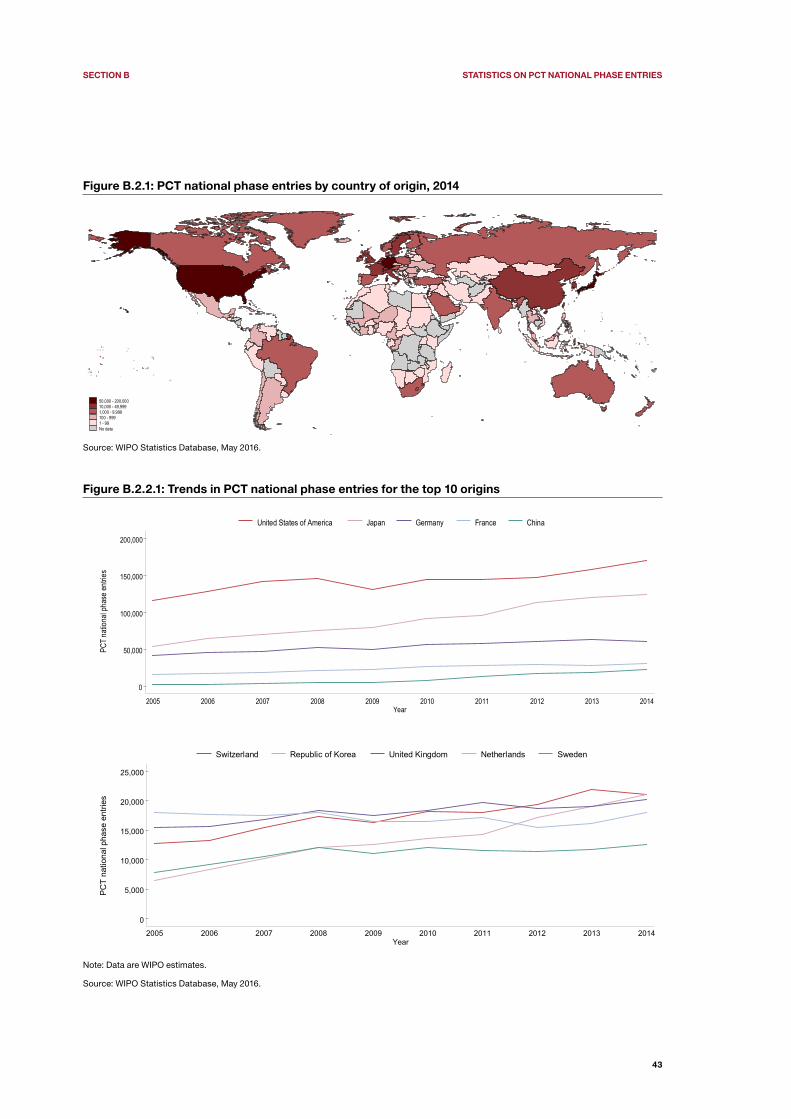
43
Figure B.2.1: PCT national phase entries by country of origin, 2014
50,000 - 200,00010,000 - 49,9991,000 - 9,999100 - 9991 - 99No data
Source: WIPO Statistics Database, May 2016.
Figure B.2.2.1: Trends in PCT national phase entries for the top 10 origins
0
50,000
100,000
150,000
200,000
PCT
natio
nal p
hase
entrie
s
2005 2006 2007 2008 2009 2010 2011 2012 2013 2014
United States of America Japan Germany France China
Year
0
5,000
10,000
15,000
20,000
25,000
PC
T na
tiona
l pha
se e
ntrie
s
2005 2006 2007 2008 2009 2010 2011 2012 2013 2014
Switzerland Republic of Korea United Kingdom Netherlands Sweden
Year
Note: Data are WIPO estimates.
Source: WIPO Statistics Database, May 2016.
SECTION B STATISTICS ON PCT NATIONAL PHASE ENTRIES
44
SECTION B STATISTICS ON PCT NATIONAL PHASE ENTRIES
followed by India (3,681), South Africa (1,364) and Brazil (1,292). Low-income countries filed 80 NPEs, with ap-plicants residing in the Democratic People’s Republic of Korea (29), Niger (10) and Mali (9) accounting for the largest number of such filings.
B.2.2 – Filing trends
The top 10 origins represented 84% of total NPEs in 2014 (figure B.2.2.1). With 170,928 NPEs, applicants from the U.S. remained the largest users of the PCT System; they were followed by applicants from Japan (123,787), Germany (60,224) and France (30,153). China (22,473), which has ranked among the top 10 origins since 2011, advanced to fifth position, overtaking Switzerland (21,095), the Republic of Korea (21,090) and the U.K. (20,277). With the exception of China, which is an upper middle-income country, the top 10 origins are all high-income countries.
The share of the top 10 origins has increased from 80% in 1995 to 84% in 2014. All of the top 10 origins had a higher number of NPEs in 2014 compared with 2005. Among the top 10 origins, the three Asian countries reported the strongest average annual growth between 2005 and 2014 with 31.5% for China, 14.1% for the Republic of Korea and 9.6% for Japan. Except the Netherlands (+0.1%), all other countries had annual growth rates ranging between 3% for the U.K. and 6.9%
for France. Germany and the U.S. each had annual average growth of 4.3%.
Table B.2.2.2 shows the top origins for each region. These data are based on 2014 totals and on the United Nations’ definition of regions.
Europe remained the region that initiated the highest number of NPEs worldwide; NPEs from Europe ac-counted for 35.3% of total NPEs in 2014. This is two percentage points below its 2009 share. With the sharp increase in NPEs from China, Japan and the Republic of Korea, the share of Asia increased from 23.5% in 2009 to 30.8% in 2014, and was ranked in second position. The share of North America remained stable between 2009 and 2014 and was ranked in third position, ac-counting for 30.2% of world total in 2014.
The share of NPEs within regions is skewed towards two or three origins. For example, the U.S. accounted for 95% of all NPEs originating from North America in 2014. Similarly, Australia and New Zealand accounted for almost all NPEs originating from Oceania, while China, Japan and the Republic of Korea accounted for 91.3% of the total in Asia. The share of NPEs within Europe is less skewed compared with other regions. For example, the top origin – Germany – accounted for 28.6% of all NPEs originating from Europe.

45
SECTION B STATISTICS ON PCT NATIONAL PHASE ENTRIES
Table B.2.2.2: PCT national phase entries for the top origins by region
Region Name
Year of national phase entryRegional
shareChange
from
2010 2011 2012 2013 2014 2014 (%) 2013 (%)
Africa South Africa 804 984 934 1,140 1,364 83.4 19.6
Seychelles 28 41 34 89 37 2.3 -58.4
Egypt 12 42 24 36 32 2.0 -11.1
Senegal 1 1 27 1.7 ..
Côte d'Ivoire 1 2 22 1.3 1000.0
Others 70 112 111 125 154 9.4 23.2
Total* 914 1,180 1,105 1,392 1,636 0.3 17.5
Asia Japan 91,240 96,101 112,862 120,839 123,787 67.5 2.4
China 7,724 12,913 16,978 18,106 22,473 12.3 24.1
Republic of Korea 13,565 14,213 17,238 19,086 21,090 11.5 10.5
Israel 5,224 4,967 5,527 5,498 6,055 3.3 10.1
India 2,570 2,950 3,322 3,890 3,681 2.0 -5.4
Singapore 1,821 1,950 2,009 2,368 2,581 1.4 9.0
Saudi Arabia 207 241 211 381 945 0.5 148.0
Turkey 446 594 693 653 814 0.4 24.7
Malaysia 252 486 470 544 682 0.4 25.4
China, Hong Kong SAR 176 217 214 238 279 0.2 17.2
Others 384 411 615 1,374 995 0.5 -27.6
Total* 123,609 135,043 160,139 172,977 183,382 30.8 6.0
Europe Germany 55,914 57,814 59,966 63,173 60,224 28.6 -4.7
France 26,552 28,039 28,943 28,534 30,153 14.3 5.7
Switzerland 18,245 17,971 19,428 21,913 21,095 10.0 -3.7
United Kingdom 18,367 19,771 18,748 19,020 20,277 9.6 6.6
Netherlands 16,452 17,160 15,567 16,126 18,035 8.6 11.8
Sweden 12,024 11,636 11,365 11,795 12,663 6.0 7.4
Italy 8,476 8,841 9,368 9,895 10,370 4.9 4.8
Finland 6,077 5,089 5,774 5,528 6,093 2.9 10.2
Denmark 4,788 5,255 4,975 5,550 5,662 2.7 2.0
Belgium 5,049 5,135 5,272 5,193 5,419 2.6 4.4
Others 14,023 14,048 20,226 20,575 20,410 9.7 -0.8
Total* 189,710 194,920 199,632 207,302 210,401 35.3 1.5
Latin America Brazil 1,016 1,169 1,167 1,250 1,292 40.8 3.4
and the Mexico 448 569 576 545 487 15.4 -10.6
Caribbean Chile 127 239 316 279 406 12.8 45.5
Barbados 307 305 271 434 364 11.5 -16.1
Colombia 69 145 115 79 147 4.6 86.1
Cuba 67 91 103 151 134 4.2 -11.3
Argentina 75 104 121 79 124 3.9 57.0
Panama 41 40 11 47 43 1.4 -8.5
Bahamas 122 73 69 63 39 1.2 -38.1
Ecuador 5 6 1 12 20 0.6 66.7
Saint Vincent and the Grenadines 10 7 10 17 20 0.6 17.6
Others 142 116 119 132 87 2.8 -34.1
Total* 2,429 2,864 2,879 3,088 3,163 0.5 2.4
North America United States of America 143,944 144,598 146,988 157,943 170,928 95.0 8.2
Canada 8,006 8,563 8,947 8,894 8,920 5.0 0.3
Bermuda 177 71 61 95 77 0.0 -18.9
Total* 152,127 153,232 155,996 166,932 179,925 30.2 7.8
Oceania Australia 6,831 6,675 6,941 7,261 6,817 83.8 -6.1
New Zealand 1,132 1,090 1,004 1,183 1,307 16.1 10.5
Others 22 7 8 28 12 0.1 -57.1
Total* 7,985 7,772 7,953 8,472 8,136 1.4 -4.0
Unknown 10,026 14,789 15,196 5,737 8,757 n.a. 52.6
Total 486,800 509,800 542,900 565,900 595,400 n.a. 5.2
Note: World totals and filings of unknown origin are WIPO estimates. * indicates the share of world total. n.a. indicates not applicable. The table shows the top countries of origin whose applicants filed at least 20 NPEs in 2014 for each region (with a maximum of 10 countries per region). Data for all origins are reported in the statistical table in the annex.
Source: WIPO Statistics Database, May 2016.
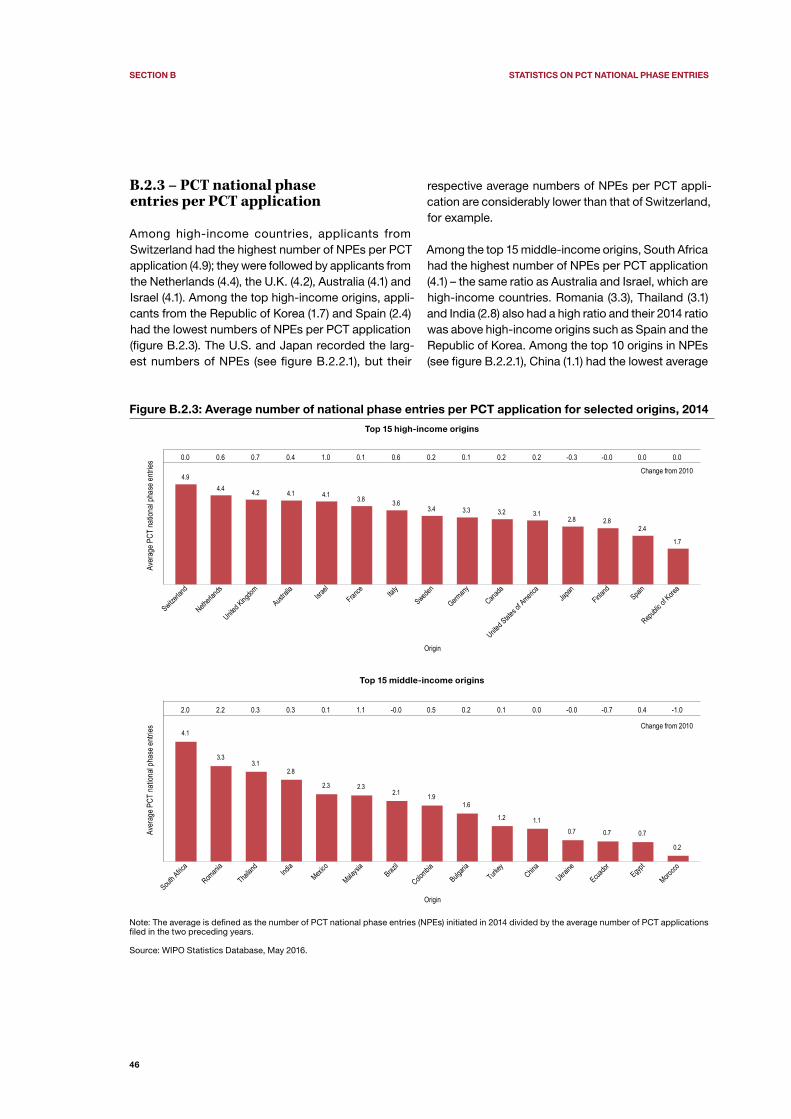
46
SECTION B STATISTICS ON PCT NATIONAL PHASE ENTRIES
B.2.3 – PCT national phase entries per PCT application
Among high-income countries, applicants from Switzerland had the highest number of NPEs per PCT application (4.9); they were followed by applicants from the Netherlands (4.4), the U.K. (4.2), Australia (4.1) and Israel (4.1). Among the top high-income origins, appli-cants from the Republic of Korea (1.7) and Spain (2.4) had the lowest numbers of NPEs per PCT application (figure B.2.3). The U.S. and Japan recorded the larg-est numbers of NPEs (see figure B.2.2.1), but their
respective average numbers of NPEs per PCT appli-cation are considerably lower than that of Switzerland, for example.
Among the top 15 middle-income origins, South Africa had the highest number of NPEs per PCT application (4.1) – the same ratio as Australia and Israel, which are high-income countries. Romania (3.3), Thailand (3.1) and India (2.8) also had a high ratio and their 2014 ratio was above high-income origins such as Spain and the Republic of Korea. Among the top 10 origins in NPEs (see figure B.2.2.1), China (1.1) had the lowest average
Figure B.2.3: Average number of national phase entries per PCT application for selected origins, 2014
Top 15 high-income origins
Change from 2010
0.0 0.6 0.7 0.4 1.0 0.1 0.6 0.2 0.1 0.2 0.2 -0.3 -0.0 0.0 0.0
4.94.4 4.2 4.1 4.1 3.8 3.6
3.4 3.3 3.2 3.12.8 2.8
2.4
1.7
Aver
age P
CT na
tiona
l pha
se e
ntries
Switzerlan
d
Netherla
nds
United K
ingdom
Australi
aIsra
elFran
ce Italy
Sweden
Germany
Canada
United S
tates o
f Americ
aJap
anFinla
ndSpai
n
Republic
of Kore
a
Origin
Top 15 middle-income origins
Change from 2010
2.0 2.2 0.3 0.3 0.1 1.1 -0.0 0.5 0.2 0.1 0.0 -0.0 -0.7 0.4 -1.0
4.1
3.33.1
2.8
2.3 2.32.1 1.9
1.6
1.2 1.10.7 0.7 0.7
0.2
Aver
age P
CT na
tiona
l pha
se e
ntries
South A
frica
Romani
a
Thailan
dInd
iaMexi
co
Malaysi
aBraz
il
Colombia
Bulgaria
Turkey
China
Ukraine
Ecuador Egyp
t
Morocco
Origin
Note: The average is defined as the number of PCT national phase entries (NPEs) initiated in 2014 divided by the average number of PCT applications filed in the two preceding years.
Source: WIPO Statistics Database, May 2016.

47
SECTION B STATISTICS ON PCT NATIONAL PHASE ENTRIES
number of NPEs per PCT application. The majority of the reported origins had a higher average number of NPEs per PCT application in 2014 than in 2010.
B.2.4 – Share of PCT national phase entries in total filings abroad
The top 15 origins are selected based on the total number of filings abroad.12 In 2014, applicants in high-income countries – who accounted for 58% of NPEs ini-tiated abroad – relied slightly more on the PCT System than did applicants in middle-income countries (50%).
The share of NPEs in total filings abroad for the top 15 high-income origins ranged from 71.7% for Sweden to 30.5% for the Republic of Korea (figure B.2.4). Among the top 15 origins, applicants from only three origins
– namely Canada, Israel and the Republic of Korea – relied more on the Paris route than on the PCT System. Compared with 2010, the share of NPEs in total filings abroad increased for a majority of the high-income countries reported in figure B.2.4 (10 countries out of a total of 15), with Japan (+8.4 percentage points) and Italy (+6.9) recording the sharpest increases.
12. NPEs recorded at the EPO by applicants from European Patent Convention (EPC) member countries are included here as they are considered both resident filings and filings abroad.
Figure B.2.4: Share of PCT national phase entries in total filings abroad, 2014
Top 15 high-income origins
Change from 2010
-2.5 -1.1 -0.4 0.8 6.9 0.2 0.1 0.8 -5.0 1.0 3.2 8.4 -3.9 3.6 2.2
71.7 69.3 69.3 67.6 65.9 65.5 63.6 62.6 62.458.4
53.3 52.047.2
37.130.5Sh
are
(%)
Sweden
Netherla
nds
United S
tates o
f Americ
aFran
ce Italy
Australi
a
United K
ingdom
Switzerlan
dFinla
nd
Germany
Austria
Japan
Israel
Canada
Republic
of Kore
a
Origin
Top 15 middle-income origins
Change from 2010
0.4 10.6 2.5 -2.6 11.4 19.4 26.8 -9.0 28.9 12.9 18.9 -6.2 6.2 -26.2 3.7
76.1
66.2 63.359.9
55.651.1 49.1 47.3 47.0
42.238.9
34.3
21.5
6.7 6.2
Shar
e (%
)
South A
frica
Colombia
Turkey
Brazil
China
Malaysi
a
Thailan
dMexi
co
Philippi
nes
Bulgaria
Romani
aInd
iaUkra
ine
Kazakhs
tanBela
rus
Origin
Note: The share is defined as the number of PCT NPEs initiated abroad divided by the total number of patent applications filed abroad. Both of these numbers are WIPO estimates.
Source: WIPO Statistics Database, May 2016.

48
SECTION B STATISTICS ON PCT NATIONAL PHASE ENTRIES
The use of the PCT System across middle-income countries ranged from 76.1% for South Africa to 6.2% for Belarus. Brazil (59.9%), Colombia (66.2%) and Turkey (63.3%) also had a high share of NPEs in total filings abroad. In contrast, Ukraine (21.5%) and India (34.3%) had a relatively low share of NPEs in total filings abroad. A number of origins saw a large increase in the share of NPEs in total filings abroad between 2010 and 2014. Four in particular – Malaysia, the Philippines, Romania and Thailand – recorded the fastest growth among this selection of origins.
B.3 – National phase entries by office
This subsection provides information on the destina-tions of NPEs, NPEs by office and origin, and the NPE share in total non-resident applications. A statistical table listing all offices is provided in the annex. Data for some offices are not available or inexistent.13
B.3.1 – Top offices
The number of NPEs for the top 20 offices reflects the commercial attractiveness of the country or region represented by that patent office. The top 20 offices at-tracted 95.4% of all NPEs initiated in 2014, which is simi-lar to the 2013 share. The USPTO – the most preferred patent office by destination in 2014 – received 128,946 NPEs, representing 21.7% of all NPEs initiated (figure B.3.1.1). The USPTO was followed by the EPO (92,627) and SIPO (79,612). The top 20 offices include, among others, a number of middle-income countries’ offices, such as those of India (26,340), Brazil (22,644) and South Africa (6,523). Thailand, which joined the PCT System in December 2009, received more than 6,000 NPEs in 2014.
All the top 20 offices, except Australia, India and Indonesia, reported growth in the number of NPEs in 2014, with New Zealand (+15.9%), Germany (+15%) and Viet Nam (+14.4%) recording the sharpest increases. In contrast, Indonesia (-22.3%) saw the sharpest decrease in 2014 compared with 2013.
13. For some offices, such as the Institut National de la Propriété Industrielle (INPI) of France, the “national route” via the PCT System is closed (see the PCT contracting states table in the annex). In such cases, PCT applicants must enter the national phase at a regional patent office in order to obtain patent protection in that contracting state via the PCT. For these offices, relevant NPEs are included in the figures for regional offices. Additionally, data are missing on the offices of destination for an estimated 1,245 NPEs initiated in 2014.
In terms of volume, the biggest increases in the num-bers of NPEs were recorded at the USPTO (+9,047), SIPO (+6,745), the EPO (+5,260) and the JPO (+4,180). These four offices accounted for 85% of total NPEs growth in 2014.
Figure B.3.1.1: PCT national phase entries for the top 20 offices, 2014
Growth rate (%)
7.5 6.0 9.3 7.7 5.5 3.1 -4.5 0.3 -7.4 2.6
128,946
92,62779,612
58,337
37,11227,451 26,340 22,644 19,181 13,451
PCT
natio
nal p
hase
entrie
s
United S
tates o
f Americ
a
Europea
n Pate
nt Offic
eChin
aJap
an
Republic
of Kore
aCana
da India
Brazil
Australi
a
Russian
Feder
ation
Office
Growth rate (%)
8.8 8.6 6.8 9.1 15.0 4.9 2.2 -22.3 15.9 14.4
12,801
7,1236,523 6,113 6,042 5,544 5,215 4,765 4,412
3,503
PCT
natio
nal p
hase
entrie
s
M
exico
Singapo
re
South A
frica
Thailan
d
Germany
Malaysi
aIsra
el
Indone
sia
New Ze
aland
Viet Nam
Office
Source: WIPO Statistics Database, May 2016.
Table B.3.1.2 captures the “flow of patents” between territories through the PCT System.14 Among the 128,946 NPEs initiated at the USPTO in 2014, about one-quarter (31,341) originated from applicants resi-dent in Japan and almost one-fifth (24,112) originated from U.S. applicants. In addition, U.S. applicants
14. A PCT applicant seeking patent protection in a European Patent Convention (EPC) member state (see list of PCT contracting states in the annex) can choose to enter the national phase at the national office (if the national route is not closed, as is the case for France) or at the EPO. As a result, the number of NPEs at some European national patent offices is lower than would otherwise be expected given the size of some of these countries’ economies.
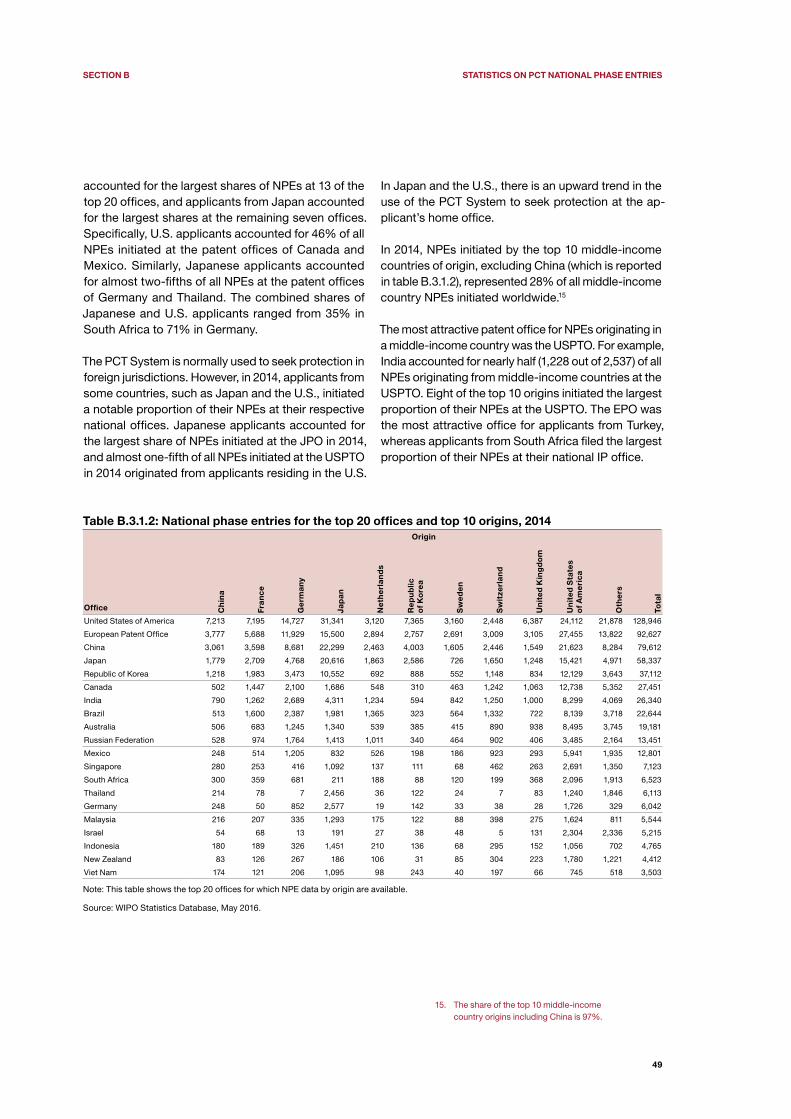
49
SECTION B STATISTICS ON PCT NATIONAL PHASE ENTRIES
accounted for the largest shares of NPEs at 13 of the top 20 offices, and applicants from Japan accounted for the largest shares at the remaining seven offices. Specifically, U.S. applicants accounted for 46% of all NPEs initiated at the patent offices of Canada and Mexico. Similarly, Japanese applicants accounted for almost two-fifths of all NPEs at the patent offices of Germany and Thailand. The combined shares of Japanese and U.S. applicants ranged from 35% in South Africa to 71% in Germany.
The PCT System is normally used to seek protection in foreign jurisdictions. However, in 2014, applicants from some countries, such as Japan and the U.S., initiated a notable proportion of their NPEs at their respective national offices. Japanese applicants accounted for the largest share of NPEs initiated at the JPO in 2014, and almost one-fifth of all NPEs initiated at the USPTO in 2014 originated from applicants residing in the U.S.
In Japan and the U.S., there is an upward trend in the use of the PCT System to seek protection at the ap-plicant’s home office.
In 2014, NPEs initiated by the top 10 middle-income countries of origin, excluding China (which is reported in table B.3.1.2), represented 28% of all middle-income country NPEs initiated worldwide.15
The most attractive patent office for NPEs originating in a middle-income country was the USPTO. For example, India accounted for nearly half (1,228 out of 2,537) of all NPEs originating from middle-income countries at the USPTO. Eight of the top 10 origins initiated the largest proportion of their NPEs at the USPTO. The EPO was the most attractive office for applicants from Turkey, whereas applicants from South Africa filed the largest proportion of their NPEs at their national IP office.
15. The share of the top 10 middle-income country origins including China is 97%.
Table B.3.1.2: National phase entries for the top 20 offices and top 10 origins, 2014
Office
Origin
Ch
ina
Fra
nc
e
Ger
ma
ny
Jap
an
Net
her
lan
ds
Rep
ub
lic
of K
ore
a
Sw
eden
Sw
itze
rla
nd
Un
ited
Kin
gd
om
Un
ited
Sta
tes
of A
mer
ica
Oth
ers
Tota
l
United States of America 7,213 7,195 14,727 31,341 3,120 7,365 3,160 2,448 6,387 24,112 21,878 128,946
European Patent Office 3,777 5,688 11,929 15,500 2,894 2,757 2,691 3,009 3,105 27,455 13,822 92,627
China 3,061 3,598 8,681 22,299 2,463 4,003 1,605 2,446 1,549 21,623 8,284 79,612
Japan 1,779 2,709 4,768 20,616 1,863 2,586 726 1,650 1,248 15,421 4,971 58,337
Republic of Korea 1,218 1,983 3,473 10,552 692 888 552 1,148 834 12,129 3,643 37,112
Canada 502 1,447 2,100 1,686 548 310 463 1,242 1,063 12,738 5,352 27,451
India 790 1,262 2,689 4,311 1,234 594 842 1,250 1,000 8,299 4,069 26,340
Brazil 513 1,600 2,387 1,981 1,365 323 564 1,332 722 8,139 3,718 22,644
Australia 506 683 1,245 1,340 539 385 415 890 938 8,495 3,745 19,181
Russian Federation 528 974 1,764 1,413 1,011 340 464 902 406 3,485 2,164 13,451
Mexico 248 514 1,205 832 526 198 186 923 293 5,941 1,935 12,801
Singapore 280 253 416 1,092 137 111 68 462 263 2,691 1,350 7,123
South Africa 300 359 681 211 188 88 120 199 368 2,096 1,913 6,523
Thailand 214 78 7 2,456 36 122 24 7 83 1,240 1,846 6,113
Germany 248 50 852 2,577 19 142 33 38 28 1,726 329 6,042
Malaysia 216 207 335 1,293 175 122 88 398 275 1,624 811 5,544
Israel 54 68 13 191 27 38 48 5 131 2,304 2,336 5,215
Indonesia 180 189 326 1,451 210 136 68 295 152 1,056 702 4,765
New Zealand 83 126 267 186 106 31 85 304 223 1,780 1,221 4,412
Viet Nam 174 121 206 1,095 98 243 40 197 66 745 518 3,503
Note: This table shows the top 20 offices for which NPE data by origin are available.
Source: WIPO Statistics Database, May 2016.

50
SECTION B STATISTICS ON PCT NATIONAL PHASE ENTRIES
Table B.3.1.3: National phase entries for top 20 offices in terms of middle-income country filings and the top 10 middle-income origins, 2014
Office
Origin
Bra
zil
Co
lom
bia
Cu
ba
Ind
ia
Mal
aysi
a
Mex
ico
Ph
ilip
pin
es
So
uth
Afr
ica
Th
aila
nd
Turk
ey
Oth
ers
Tota
l
United States of America 367 39 19 1,228 109 128 15 238 38 163 193 2,537
European Patent Office 148 12 7 429 44 40 13 102 16 244 101 1,156
South Africa 25 5 128 10 8 1 442 1 4 17 641
China 107 6 5 217 56 26 10 70 21 71 49 638
India 45 2 8 258 42 32 7 72 12 16 39 533
Japan 66 7 7 170 25 17 7 32 12 42 29 414
Brazil 121 12 8 106 15 34 2 47 5 14 26 390
Australia 38 1 5 163 27 9 5 67 12 12 25 364
Canada 51 3 8 146 14 26 1 54 5 10 35 353
Republic of Korea 58 1 6 116 19 22 4 29 11 23 34 323
Mexico 69 11 7 77 6 53 1 20 3 7 14 268
Singapore 27 2 3 78 34 1 2 14 6 2 74 243
Thailand 6 3 26 106 2 3 1 10 2 159
Russian Federation 16 4 55 4 4 18 3 15 27 146
Malaysia 8 4 2 46 38 2 3 14 12 3 13 145
Indonesia 5 3 42 38 2 3 9 9 5 14 130
African Intellectual Property Organization
2 2 126 130
Turkey 1 7 3 1 114 2 128
New Zealand 6 2 72 6 3 19 1 2 7 118
Philippines 3 2 4 50 22 2 5 6 11 1 6 112
Note: This table shows the top 20 offices in terms of middle-income country filings for which NPE data by origin are available. China, a top 10 origin, is not reported in this table as it is included in table B.3.1.2.
Source: WIPO Statistics Database, May 2016.
B.3.2 – Share of PCT national phase entries in non-resident filings
In 2014, the use of the PCT route (as opposed to the Paris route) for non-resident filings varied widely from one office to another, with shares ranging from 94.3% for Israel to 25.2% for the U.K. (figure B.3.2).
The use of the PCT System is, however, quite intense at the offices of middle-income countries. Seven of the top 10 offices are in the middle-income country category. In contrast, several offices in the high-income country category had a low share of NPEs; these include the patent offices of Germany, Japan, the U.K. and the U.S.
Figure B.3.2: Share of PCT national phase entries in total non-resident filings by office, 2014
Change from 2013
-0.2 .. 2.2 1.3 0.4 1.1 3.3 -0.1 -0.2 1.6 1.2 3.8 2.4 -1.6 3.2 .. 1.4 2.1 1.5 2.5 0.4
94.3 90.1 88.3 88.1 87.9 87.7 85.6 84.6 82.8 82.3 78.4 76.9 75.3 71.4 70.865.0 62.8 60.3
35.729.1 25.2
Shar
e (%
)
Israel
South A
frica
Viet Nam
Thailan
d
Malaysi
aBraz
ilMexi
co India
Canada
Russian
Feder
ation
Republic
of Kore
a
Australi
a
Singapo
re
New Ze
aland
Europea
n Pate
nt Offic
e
Indone
siaJap
anChin
a
United S
tates o
f Americ
a
Germany
United K
ingdom
Office
Note: The share is defined as non-resident PCT NPEs initiated, divided by the number of non-resident patent applications filed. It includes data from the 20 offices that received the most non-resident filings in 2014, i.e. data from countries that are members of the PCT System and that provided data broken down by filing route.
Source: WIPO Statistics Database, May 2016.


53
Section C Performance of the PCT System
C.1 – International Bureau
In addition to its role as a receiving office (RO), the International Bureau (IB) of WIPO is responsible for functions related to the international phase of the PCT System, including examining formalities, translating abstracts, titles and patentability reports, and publish-ing PCT applications.
C.1.1 – Electronic filing and processing
Medium of filing
Every PCT application is filed using one of three meth-ods: paper; paper plus PCT-EASY (the application is prepared electronically using WIPO-provided software known as PCT-SAFE); and fully electronic media in different formats, such as PDF or XML (figure C.1.1). Electronic filing is encouraged by way of fee reductions, as it offers benefits to applicants, offices and the IB.
The share of electronic filings continued to increase in 2015, rising to nearly 94% of all applications filed. Following the introduction of fully electronic filing, the number of paper plus PCT-EASY filings dropped con-siderably. As of July 1, 2015, it is no longer possible to file a PCT application using PCT-EASY. Paper filings accounted for just 5.5% of all filings in 2015.
ePCT-Filing
As highlighted above, electronic filings have increased rapidly in recent years and continue to account for a vast majority of PCT applications filed. At the end of 2014, two challenges remained: first, to make it practical for the remaining applicants who had so far been unable to file electronically to do so; second, to further improve the quality of electronic filings submitted. In 2015, the ePCT System successfully addressed both challenges. Prior to 2015, ePCT-Filing was available at 10 ROs. However, in 2015, 19 additional
Figure C.1.1: PCT applications by medium of filing
Share of fully electronic filings (%)0.0 0.0 0.0 1.0 14.1 26.2 32.4 52.7 64.1 72.6 78.3 82.8 87.3 89.6 91.3 93.6
0
25
50
75
100
Distr
ibutio
n of P
CT a
pplic
ation
s (%
)
2000 2001 2002 2003 2004 2005 2006 2007 2008 2009 2010 2011 2012 2013 2014 2015International filing year
Paper Paper + PCT EASY Fully electronic (PDF, EFS-Web and XML)
Note: Data for 2015 are WIPO estimates.
Source: WIPO Statistics Database, May 2016.

54
SECTION C PERFORMANCE OF THE PCT SYSTEM
ROs announced that they would begin receiving and processing ePCT-Filings. Several of the offices con-cerned had not previously permitted electronic filing, but were able to benefit from services hosted by the IB.
In addition to the increase in coverage in terms of the number of ROs offering ePCT-Filing to applicants, the spread of ePCT-Filing has also markedly improved the quality of electronically filed applications, since the business validations prior to filing are checked in real time against the IB’s centralized reference data.
In 2015, the request form was made available also in the Arabic language in ePCT-Filing (the only PCT elec-tronic software that offers this feature), which means that all 10 publication languages are now covered by the ePCT system.
For details of other developments within the ePCT System, please see section D.1.
Automation
In 2015, the IB continued to improve and expand automation of certain processes related to formalities examination of international search reports, decla-rations under Article 17(2)a, written opinions of the ISA and international preliminary reports on patent-ability (Chapter II of the PCT) received in Extensible Markup Language (XML) and PDF format from the EPO, JPO, KIPO and SIPO acting as ISAs. The formality
examination has been automated for approximately 70% of international search reports and 90% of written opin-ions of the ISAs. This has allowed the IB to maintain pro-ductivity and timeliness in processing these documents. The procedure will also be extended to future docu-ments received from other ISAs in XML and PDF format.
C.1.2 – Translation and terminology database
Languages of publication
A PCT application may be filed in any language ac-cepted by the relevant RO, but must be published in one of the 10 official publication languages.
Figure C.1.2.1 shows that the number of applications published in English increased almost continuously from 1995 to 2008. In 2009, 2010 and 2015, however, the number of publications in English decreased sharp-ly compared with previous years. Japanese, which since 2004 has been the second most frequently used language of publication, experienced its first decrease in 2015. Chinese, which has experienced dramatic in-creases since 2010, became the third most frequently used language of publication in 2014. Since 2006, the number of applications published in German each year has remained fairly stable, ranging between 15,700 and 17,800. Korean has seen uninterrupted growth since 2009, the year it became one of the 10 official publication languages.
Figure C.1.2.1: Trend in PCT applications for top five languages of publication
0
20,000
40,000
60,000
80,000
100,000
120,000
PCT
publi
catio
ns
1995 1996 1997 1998 1999 2000 2001 2002 2003 2004 2005 2006 2007 2008 2009 2010 2011 2012 2013 2014 2015
English Japanese Chinese German Korean
Publication year
Note: Data for 2015 are WIPO estimates.
Source: WIPO Statistics Database, May 2016.
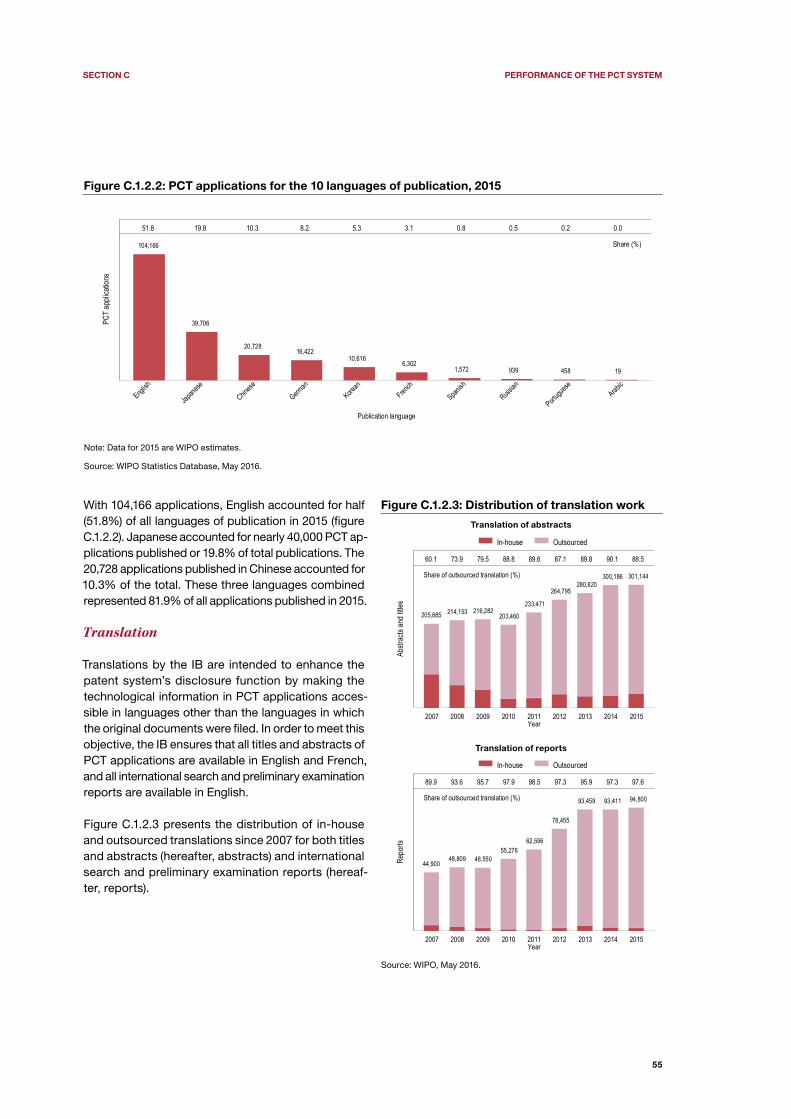
55
SECTION C PERFORMANCE OF THE PCT SYSTEM
Figure C.1.2.2: PCT applications for the 10 languages of publication, 2015
Share (%)
51.8 19.8 10.3 8.2 5.3 3.1 0.8 0.5 0.2 0.0
104,166
39,706
20,72816,422
10,6166,302
1,572 939 458 19
PCT
appli
catio
ns
English
Japane
se
Chinese
German
Korean
French
Spanish
Russian
Portugue
seArab
ic
Publication language
Note: Data for 2015 are WIPO estimates.
Source: WIPO Statistics Database, May 2016.
With 104,166 applications, English accounted for half (51.8%) of all languages of publication in 2015 (figure C.1.2.2). Japanese accounted for nearly 40,000 PCT ap-plications published or 19.8% of total publications. The 20,728 applications published in Chinese accounted for 10.3% of the total. These three languages combined represented 81.9% of all applications published in 2015.
Translation
Translations by the IB are intended to enhance the patent system’s disclosure function by making the technological information in PCT applications acces-sible in languages other than the languages in which the original documents were filed. In order to meet this objective, the IB ensures that all titles and abstracts of PCT applications are available in English and French, and all international search and preliminary examination reports are available in English.
Figure C.1.2.3 presents the distribution of in-house and outsourced translations since 2007 for both titles and abstracts (hereafter, abstracts) and international search and preliminary examination reports (hereaf-ter, reports).
Figure C.1.2.3: Distribution of translation work
Translation of abstracts
Share of outsourced translation (%)
60.1 73.9 79.5 88.8 89.6 87.1 89.8 90.1 88.5
205,885 214,153 216,282203,460
233,471
264,795280,820
300,186 301,144
Abstr
acts
and
titles
2007 2008 2009 2010 2011 2012 2013 2014 2015Year
In-house Outsourced
Translation of reports
Share of outsourced translation (%)
89.9 93.6 95.7 97.9 98.5 97.3 95.9 97.3 97.6
44,90048,809 48,550
55,27662,596
78,455
93,459 93,411 94,800
Repo
rts
2007 2008 2009 2010 2011 2012 2013 2014 2015Year
In-house Outsourced
Source: WIPO, May 2016.
56
SECTION C PERFORMANCE OF THE PCT SYSTEM
In 2015, the number of translated abstracts remained stable compared with 2014 at just over 300,000 trans-lations. Substantial increases in Korean and Chinese translations and a more moderate increase in Japanese translations were offset by decreases in English-French translations and Russian translations. The number of reports translated and the share of reports translated outside the IB also remained relatively stable in 2015.
Other important developments in 2015 included the fol-lowing:
The IB continued its roll-out of the translation manage-ment system, which makes the translation process more efficient and also ensures a higher level of security for the increased volumes of text-based electronic data received from the offices. In addition, since 2014 it has been possible to use the translation management sys-tem to track translations back to individual translators in translation agencies.
The increasing length of reports is a continued cause for concern and one that is likely to have a substantial budgetary impact. The average length of a translated report increased from 685 words in 2014 to 750 words in 2015, with the largest increases seen in Korean and Chinese language reports.
A tender for Japanese translation was successfully concluded, achieving a reduction in unit price, which had a budgetary impact starting in the middle of 2015.
The number of early translations of patentability reports fell from 1,059 in 2014 to 954 in 2015, which led to a slight reduction in the internal workload.
Finally, a new localization translation management system was successfully implemented, resulting in a highly efficient system with smooth software developer integration.
Terminology database
In order to improve the quality of internally and exter-nally produced translations, the IB continued to de-velop its multilingual terminology database. Emphasis was placed on adding terms in languages that were
underrepresented in the database – Arabic, Chinese, German, Japanese, Korean, Portuguese, Russian and Spanish. During 2015, approximately 13,300 terms were added across all 10 publication languages, with the largest growth seen in German, followed by Spanish and Portuguese. At the end of 2015, the database contained 113,819 terms, 98% of which were validated. The validated content of the database has been made freely available on the WIPO website since 2014 as WIPO Pearl (see D.3).
C.1.3 – Timeliness in examining and publishing PCT applications
The IB performs a formality examination of PCT applica-tions and related documents promptly after their receipt. Once the formality examination of a PCT application is completed, the IB sends a form to the applicant acknowledging receipt of the application.
In 2015, 80.3% of these forms were sent within two weeks after the date on which the PCT application was received, and 90.7% were sent within three weeks (figure C.1.3.1). These were the highest shares observed since 2007 after those of 2014.
PCT applications and related documents are to be published “promptly” after the expiration of 18 months from the priority date, unless the applicant requests early publication, or the application is withdrawn or considered withdrawn.
In 2015, 77.9% of publications occurred within one week after the expiration of the 18-month period, and almost all publications (99.1%) occurred within two weeks (figure C.1.3.2).
The IB is required to publish applications, even in the absence of an international search report (ISR). In such cases, the application is republished along with the ISR after the report is received.
In 2015, the proportion of applications republished within two months was 73.8%, which was the third highest share since 2001 (figure C.1.3.3). Almost all republications (98.9%) occurred within four months of the IB receiving the ISR.

57
SECTION C PERFORMANCE OF THE PCT SYSTEM
Figure C.1.3.1: Timeliness in formalities examination
Share of examinations finished within two weeks (%)44.3 53.9 63.0 57.4 53.9 54.4 72.0 81.1 80.3
0
25
50
75
100
Distr
ibutio
n by d
elay (
%)
2007 2008 2009 2010 2011 2012 2013 2014 2015Processing year
Within 1 week In the 2nd week In the 3rd week In the 4th week More than 4 weeks
Note: Timeliness is calculated as the time elapsed between the date of receipt of the record copy of the PCT application and the date of issuance of form PCT/IB/301.
Source: WIPO Statistics Database, May 2016.
Figure C.1.3.2: Timeliness in publishing PCT applications
Share of PCT applications published within one week (%)57.3 44.1 22.0 7.4 8.4 49.1 43.1 54.8 65.9 74.2 75.0 77.3 76.4 74.9 77.9
0
25
50
75
100
Distr
ibutio
n by t
ime
cate
gory
(%)
2001 2002 2003 2004 2005 2006 2007 2008 2009 2010 2011 2012 2013 2014 2015Publication year
Within 1 week In the 2nd week In the 3rd week In the 4th week More than 4 weeks
Note: Timeliness is calculated as the time elapsed between the time limit of 18 months from the priority date and the actual publication date.
Source: WIPO Statistics Database, May 2016.
Figure C.1.3.3: Timeliness in republishing PCT applications with ISRs
Share of PCT applications republished within two months (%)2.7 14.8 13.5 46.1 52.6 43.1 45.3 54.3 71.1 76.3 73.7 69.9 58.5 77.4 73.8
0
25
50
75
100
Distr
ibutio
n by t
ime
cate
gory
(%)
2001 2002 2003 2004 2005 2006 2007 2008 2009 2010 2011 2012 2013 2014 2015Republication year
Within 2 months In the 3rd month In the 4th month In the 5th month More than 5 months
Note: Timeliness is calculated as the time elapsed between the date of the receipt of the ISR at the IB and the date of republication by the IB.
Source: WIPO Statistics Database, May 2016.

58
SECTION C PERFORMANCE OF THE PCT SYSTEM
C.1.4 – Quality in processing applications
Formalities examination
In order to measure the quality of the formalities ex-amination by the IB in a simple and comprehensive manner, the IB has developed an aggregate quality index, calculated as the average of four lead quality indicators. Three of these are based on the timeliness of key transactions: acknowledgement of receipt of the application; publication; and republication with ISRs. The fourth lead quality indicator reflects the PCT operation quality control error rate.
The overall quality, as measured by the aggregate index, improved markedly from an average of 81% in 2007 to 92.8% in 2015 (figure C.1.4.1). When the figures for 2014 (77.4%) and 2015 (73.8%) are analyzed, they show that the slight decrease of 0.3 percentage points observed in 2015 was due to a slight decline in timeli-ness in republishing PCT applications with ISRs within two months (see figure C.1.3.3). The three other key transactions used to compute this aggregate quality index improved in 2015 compared with 2014.
Figure C.1.4.1: Formalities examination quality index
75
80
85
90
95
100
Quali
ty ind
ex (%
)
2007 2008 2009 2010 2011 2012 2013 2014 2015
Quality index of formality examination
Year
Note: The quality index is the simple average of: (i) the percentage of forms PCT/IB/301 (notification of receipt of a PCT application) sent within five weeks of the IB receiving a PCT application; (ii) the percentage of PCT applications published within six months and three weeks after the international filing date; (iii) the percentage of republications with ISRs within two months after the IB receives the ISR; (iv) the percentage of corrections to bibliographic data in the published PCT application (from 2007 to 2011); and (v) the PCT operation quality control error rate (from 2012 onwards).
Source: WIPO Statistics Database, May 2016.
Figure C.1.4.2: Translation quality indicator
12.6% 13.5% 15.6% 12.8% 12.9% 14.0% 12.4%
87.4% 86.5% 84.4% 87.2% 87.1% 86.0% 87.6%
0
20%
40%
60%
80%
100%
Distr
ibutio
n of q
uality
resu
lt
2009 2010 2011 2012 2013 2014 2015Year
Acceptable Not acceptable
Source: WIPO, May 2016.

59
SECTION C PERFORMANCE OF THE PCT SYSTEM
Translation
The translation quality indicator shows the average quality of abstracts and reports translated by external suppliers and in-house translators combined, based on the results of the IB’s regular quality control checks (figure C.1.4.2).
In 2015, 87.6% of documents translated by the IB were considered acceptable. This was the highest percent-age achieved since 2009. The share of acceptable translations has remained relatively unchanged since 2009, fluctuating within a margin of three percentage points over six years (with a minimum of 84.4% in 2011 and a maximum of 87.6% in 2015).
C.1.5 – Efficiency in processing applications
The IB’s efficiency in processing PCT applications can be measured by the unit cost of processing, defined as the average total cost of publishing a PCT applica-tion.16 Average total cost is determined by total PCT System expenditure, plus a proportion of expenditure on support and management activities. The unit cost includes the cost of all PCT activities, including transla-tion, communication, management etc.
Costs have direct and indirect components. Direct costs reflect expenditure incurred by the IB in admin-istering the PCT System and related programs. Indirect costs reflect expenditure for supporting activities (such as buildings and information technology). Indirect costs are weighted in order to take into account only the share that is attributable to the PCT System. The unit cost is calculated by dividing the total cost of production by the number of publications.
16. The methodology used to compute the unit cost was revised in 2013 in order to align it with other WIPO unit and union cost calculations, and also in order to better capture a fast-changing environment.
The average cost of processing a published PCT ap-plication was 735 Swiss Francs in 2015, up 11% on 2014 figures. On the one hand, this sharp increase was due to the total cost of production, which increased by 5.9%, having remained almost unchanged in 2014 compared with 2013. On the other hand, it was due to a sharp decrease of 4.6% in the number of published applications. (See the Data description section for further details of this decrease in publications.)
Figure C.1.5: Unit cost of processing a published PCT application
Total processing cost (CHF)
712 722 663 735
248 252232
260
464 470431
475
0
200
400
600
800
Cost
of pr
oces
sing (
CHF)
2012 2013 2014 2015Processing year
Direct costs Indirect costs
Note: The average cost of processing a published PCT application is an estimate that is calculated by dividing the total processing cost by the number of published PCT applications.
Source: WIPO Statistics Database, May 2016.

60
SECTION C PERFORMANCE OF THE PCT SYSTEM
C.2 – Receiving offices
A PCT application is filed with an RO, which may be a national or regional patent office or the IB. In 2015, 116 ROs were responsible for receiving PCT applications, examining their compliance with PCT formality require-ments, receiving the payment of fees, and transmitting copies of the application for further processing to the IB and the ISA. Subsection A.1.2 presents the number of PCT applications filed in 2015 at selected ROs. The statistical table in the annex shows the number of PCT applications for all offices and origins.
C.2.1 – Distribution of applications by medium of filing
Each RO determines the filing media that applicants are allowed to use. Fee reductions may apply for certain media. By the end of 2015, 49 ROs accepted the filing of PCT applications in fully electronic format – 17 more offices than in the preceding year.
In 2015, on average 93.6% of PCT applications were filed using a fully electronic medium (see C.1.1). This share varied considerably across the top 20 ROs, rang-ing from 0% for the Russian Federation to 99.1% for the U.S. (figure C.2.1).
Paper remained the dominant filing medium for the Russian Federation (96.2%). Despite the fact that since July 2015 paper plus PCT-EASY is no longer a medium of filing, it accounted for more than one-tenth of filings in Turkey (23%), India (19.5%) and Singapore (11.2%).
C.2.2 – Timeliness in transmitting applications
The copy of the PCT application sent by the RO must reach the IB before the expiration of the 13th month from the priority date.17 PCT applications are usually filed before the expiration of 12 months from the priority date. Where this occurs, the IB should receive the ap-plication within one month of the international filing date.
17. A copy of the PCT application, known as the record copy, is transmitted to the IB by the RO for processing, publication and communication.
Figure C.2.1: Distribution of media of filing for top 20 receiving offices, 2015
Share of fully electronic filings (%)99.1 98.3 97.2 95.7 95.1 94.9 94.6 94.5 93.6 93.6 92.3 88.1 84.3 79.8 78.0 69.0 68.4 43.5 33.9 0.0
0
25
50
75
100
Distr
ibutio
n by f
iling
metho
d
United S
tates o
f Americ
aJap
anChin
aFinla
nd
Sweden
Israel
France
Netherla
nds
Republic
of Kore
a
United K
ingdom
Europea
n Pate
nt Offic
e
Interna
tional B
ureau
Spain
Australi
a
Singapo
re
Germany
Canada
Turkey Ind
ia
Russian
Feder
ation
Receiving office
Fully electronic (PDF, EFS-Web and XML) Paper + PCT EASY Paper
Note: Data for 2015 are WIPO estimates.
Source: WIPO Statistics Database, May 2016.

61
SECTION C PERFORMANCE OF THE PCT SYSTEM
For the first time since 2012, the average transmittal time decreased in 2015, to 2.7 weeks (figure C.2.2.1). This is the shortest transmittal time achieved since 2001. Between 2001 and 2007, the average transmittal time fluctuated within about six or seven weeks from the international filing date. It then improved markedly, tak-ing approximately three weeks in 2010. This is partly attributable to a shift to electronic filing, which made
the exchange of information between ROs and the IB more efficient.
In 2015, offices transmitted, on average 93.4% of their applications to the IB within four weeks, nearly 10 per-centage points higher than in 2014 (83.5%). Australia, Finland, Israel and Japan transmitted more than 99.6% of their applications to the IB within this four-week time frame (figure C.2.2.2).
Figure C.2.2.1: Average timeliness in transmitting PCT applications to the IB
2
3
4
5
6
7
8
Wee
ks
2001 2002 2003 2004 2005 2006 2007 2008 2009 2010 2011 2012 2013 2014 2015
Average timeliness in transmitting PCT applications
Year
Note: Timeliness is calculated as the time elapsed between the international filing date and the date on which the IB received the PCT application from the RO. Applications transmitted under PCT Rule 19.4 are excluded.
Source: WIPO Statistics Database, May 2016.
Figure C.2.2.2: Timeliness in transmitting PCT applications to the IB by time category and by receiving office, 2015
Share of PCT applications transmitted within 4 weeks (%)99.9 99.8 99.7 99.7 99.2 99.1 99.0 98.8 97.4 94.5 93.4 91.5 89.3 86.1 86.0 82.1 71.9 54.5 33.0 31.7 31.1
0
25
50
75
100
Distr
ibutio
n by t
ime
cate
gory
(%)
Israel
Finland
Japan
Australi
aSwede
n
United K
ingdom
Singapo
re
Republic
of Kore
aChin
a
Europea
n Pate
nt Offic
eTota
l
United S
tates o
f Americ
a
Interna
tional B
ureau
Netherla
nds Spain
Canada
Germany
France Ind
ia
Russian
Feder
ation
Turkey
Receiving office
Within 4 weeks 5-8 weeks More than 8 weeks
Note: Timeliness is calculated as the time elapsed between the international filing date and the date on which the IB received the PCT application from the RO. Applications transmitted under PCT Rule 19.4 are excluded.
Source: WIPO Statistics Database, May 2016.
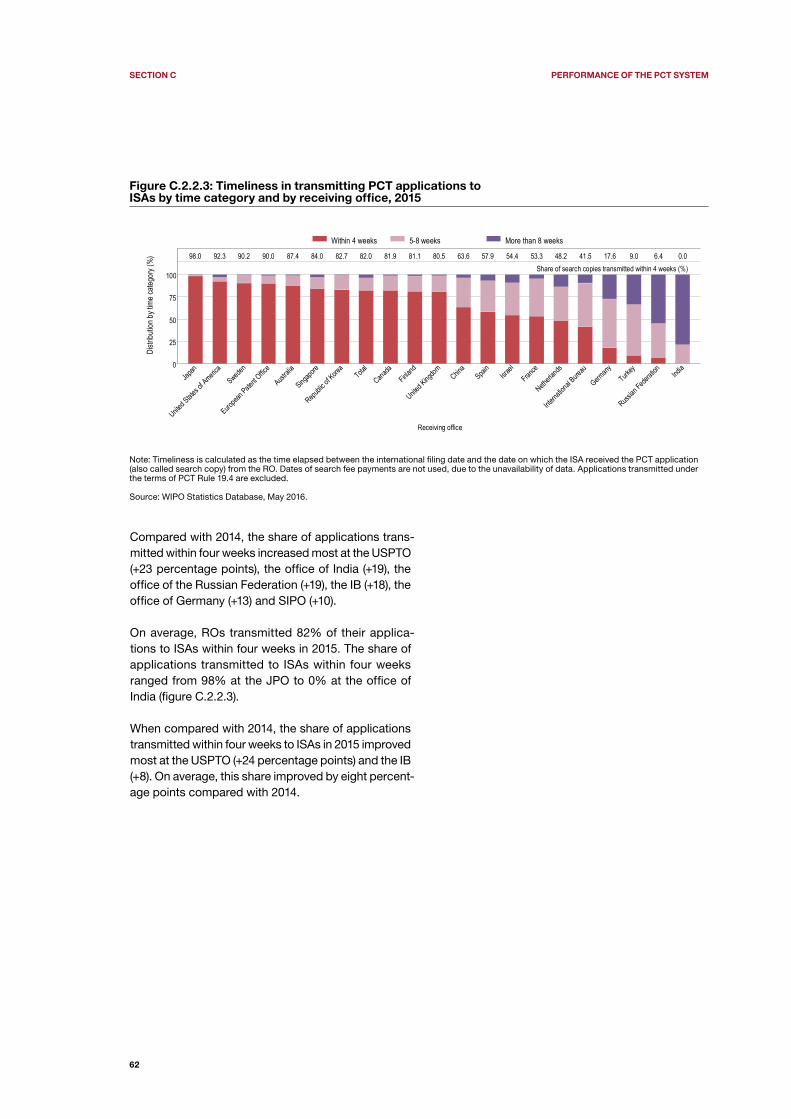
62
SECTION C PERFORMANCE OF THE PCT SYSTEM
Figure C.2.2.3: Timeliness in transmitting PCT applications to ISAs by time category and by receiving office, 2015
Share of search copies transmitted within 4 weeks (%)98.0 92.3 90.2 90.0 87.4 84.0 82.7 82.0 81.9 81.1 80.5 63.6 57.9 54.4 53.3 48.2 41.5 17.6 9.0 6.4 0.0
0
25
50
75
100
Distr
ibutio
n by t
ime
cate
gory
(%)
Japan
United S
tates o
f Americ
aSwede
n
Europea
n Pate
nt Offic
e
Australi
a
Singapo
re
Republic
of Kore
aTota
l
Canada
Finland
United K
ingdom Chin
aSpai
nIsra
elFran
ce
Netherla
nds
Interna
tional B
ureau
Germany
Turkey
Russian
Feder
ation
India
Receiving office
Within 4 weeks 5-8 weeks More than 8 weeks
Note: Timeliness is calculated as the time elapsed between the international filing date and the date on which the ISA received the PCT application (also called search copy) from the RO. Dates of search fee payments are not used, due to the unavailability of data. Applications transmitted under the terms of PCT Rule 19.4 are excluded.
Source: WIPO Statistics Database, May 2016.
Compared with 2014, the share of applications trans-mitted within four weeks increased most at the USPTO (+23 percentage points), the office of India (+19), the office of the Russian Federation (+19), the IB (+18), the office of Germany (+13) and SIPO (+10).
On average, ROs transmitted 82% of their applica-tions to ISAs within four weeks in 2015. The share of applications transmitted to ISAs within four weeks ranged from 98% at the JPO to 0% at the office of India (figure C.2.2.3).
When compared with 2014, the share of applications transmitted within four weeks to ISAs in 2015 improved most at the USPTO (+24 percentage points) and the IB (+8). On average, this share improved by eight percent-age points compared with 2014.

63
SECTION C PERFORMANCE OF THE PCT SYSTEM
C.3 – International searching authorities
Each PCT application must undergo an international search by an ISA. ROs have agreements with at least one (but sometimes several) ISAs that carry out in-ternational searches. If an RO has an agreement with multiple ISAs, the applicant selects one of them.
Once the ISA has performed the search, the applicant receives an ISR containing a list of documents relevant for assessing the patentability of the invention. The ISA also establishes a written opinion, providing a detailed analysis of the potential patentability of the invention in light of the documents found in the search. Consequently, an applicant who has an ISR and a written opinion can make a more informed decision about whether or how to enter the PCT national phase.
The office of Singapore commenced operations on September 1, 2015, and at the end of 2015, the of-fice of Ukraine confirmed that it would commence operations on February 5, 2016. Thus, at the time of writing, there were 20 national or regional patent of-fices operating as ISAs and IPEAs. Furthermore, in October 2015, the Visegrad Patent Institute (VPI) – an intergovernmental organization for cooperation in the field of patents comprising the national offices of the
Czech Republic, Hungary, Poland and Slovakia – was appointed by the Assembly of the PCT Union as an ISA and IPEA. This appointment will be effective from a future date to be notified by the office when it is ready to begin operations.
C.3.1 – International search reports by authority
In 2015, with almost 79,600 ISRs, the EPO remained the most selected ISA. It was followed by the JPO (43,292), SIPO (31,578), KIPO (29,285) and the USPTO (20,914) (table C.3.1). These top five ISAs combined accounted for 94% of all ISRs issued in 2015. Among the most selected ISAs, SIPO (+14.4%) and the JPO (+6.1%) recorded the sharpest growth and the USPTO (-4.6%) and KIPO (-4.4%) recorded the sharpest drops.
The office of Singapore commenced operations in 2015 and issued 115 ISRs during the year. Chile and Egypt, which also began issuing ISRs in recent years, increased their volumes almost fivefold and threefold, respectively. The office of Israel (+35.1%) and the of-fice of India (+32.1%) recorded double-digit growth; whereas, the four European national offices acting as ISAs experienced double-digit decreases: Sweden (-18.4%), Finland (-17.9%), Spain (-12.8%) and Austria (-10.4%).
Table C.3.1: Distribution of international search reports by ISA and by originInternational filing year
ISA share 2015 (%)
Change from
2014 (%)International searching authorities
Total plus the top three origins 2011 2012 2013 2014 2015
Australia Australia 1,636 1,544 1,473 1,594 1,597 61.0 0.2
Singapore 381 387 444 460 329 12.6 -28.5
New Zealand 283 253 261 249 284 10.8 13.9
Total* 3,140 2,832 2,699 2,756 2,619 1.2 -5.0
Austria South Africa 82 91 121 106 93 48.7 -12.7
United Arab Emirates 8 10 25 30 24 12.7 -19.6
Singapore 20 25 22 16 20 10.6 25.7
Total* 251 178 233 212 190 0.1 -10.4
Brazil Brazil 432 425 497 451 429 96.4 -4.8
Peru 5 1.1 n.a.
Colombia 5 2 5 1.1 151.4
Total* 435 429 509 453 445 0.2 -1.7
Canada Canada 2,301 2,179 2,228 2,340 2,163 95.7 -7.6
Barbados 11 6 4 45 44 2.0 -1.7
United States of America 21 80 60 53 15 0.7 -71.5
Total* 2,396 2,339 2,324 2,506 2,259 1.0 -9.8
Chile Chile 35 126 69.8 259.1
Mexico 1 22 12.3 2,112.0
Colombia 21 11.7 n.a.
Total* 38 180 0.1 373.6
China China 16,207 18,273 21,127 25,091 29,414 93.1 17.2
United States of America 583 1,023 1,101 1,254 987 3.1 -21.3
Japan 145 103 137 186 220 0.7 18.4
Total* 18,017 20,720 23,707 27,603 31,578 14.5 14.4

64
SECTION C PERFORMANCE OF THE PCT SYSTEM
International filing year
ISA share 2015 (%)
Change from
2014 (%)International searching authorities
Total plus the top three origins 2011 2012 2013 2014 2015
Egypt Egypt 14 13 21 55.3 62.4
Saudi Arabia 1 17 44.7 1,609.3
Total* 14 14 38 0.02 172.9
European Patent Office United States of America 17,584 18,656 20,993 21,736 21,328 26.8 -1.9
Germany 18,523 18,423 17,623 17,577 17,757 22.3 1.0
France 7,194 7,528 7,681 8,081 8,261 10.4 2.2
Total* 71,620 75,142 77,414 79,587 79,581 36.5 0.0
Finland Finland 914 969 792 588 479 99.0 -18.6
Estonia 2 0.4 n.a.
Sweden 5 1 1 1 0.2 n.a.
Total* 928 977 795 589 484 0.2 -17.9
India India 108 516 676 94.5 30.9
Iran (Islamic Republic of) 12 27 3.8 126.2
United States of America 6 5 0.7 -16.2
Total* 108 541 715 0.33 32.1
Israel Israel 332 815 806 923 78.5 14.5
United States of America 11 21 37 229 19.5 519.6
China 1 3 10 0.9 235.2
Total* 358 854 871 1,176 0.54 35.1
Japan Japan 36,964 41,388 41,890 40,263 42,608 98.4 5.8
United States of America 44 158 136 179 234 0.5 30.9
Singapore 7 18 55 107 139 0.3 29.7
Total* 37,094 41,677 42,270 40,803 43,292 19.9 6.1
Nordic Patent Institute Norway 118 130 115 128 129 54.5 0.5
Denmark 134 128 101 100 99 41.7 -1.5
United Arab Emirates 3 1.3 n.a.
Total* 275 278 223 230 236 0.11 2.7
Republic of Korea Republic of Korea 10,234 11,736 12,312 13,019 14,547 49.7 11.7
United States of America 15,963 14,880 17,269 16,327 13,528 46.2 -17.1
Canada 211 220 276 447 409 1.4 -8.5
Total* 27,180 27,580 30,659 30,641 29,285 13.43 -4.4
Russian Federation United States of America 18 1,367 2,362 1,495 1,430 57.6 -4.4
Russian Federation 930 996 1,069 855 687 27.7 -19.7
Ukraine 113 96 126 118 98 3.9 -17.3
Total* 1,181 2,678 3,802 2,706 2,482 1.14 -8.3
Singapore Singapore 113 98.2 n.a.
United States of America 1 0.9 n.a.
Mexico 1 0.9 n.a.
Total* 115 0.05 n.a.
Spain Spain 1,106 1,069 1,013 1,027 917 73.4 -10.7
Mexico 170 150 205 240 241 19.3 0.5
Colombia 38 58 58 80 48 3.9 -39.7
Total* 1,445 1,401 1,412 1,432 1,249 0.57 -12.8
Sweden Sweden 1,401 1,217 1,272 1,156 951 85.3 -17.7
Norway 131 82 100 105 88 7.9 -15.7
Finland 317 217 108 82 60 5.4 -26.4
Total* 1,941 1,577 1,522 1,366 1,115 0.51 -18.4
United States of America United States of America 14,550 15,299 15,178 20,178 19,276 92.2 -4.5
Israel 662 493 326 300 317 1.5 5.6
India 216 250 204 176 181 0.9 2.8
Total* 16,488 17,118 16,696 21,925 20,914 9.6 -4.6
Unknown 45 50 52 40 45 n.a. n.a.
Total 182,436 195,334 205,293 214,313 218,000 100.0 1.7
Note: * indicates the share of total PCT applications, and n.a. indicates not applicable. Data for 2015 are WIPO estimates.
Source: WIPO Statistics Database, May 2016.

65
SECTION C PERFORMANCE OF THE PCT SYSTEM
C.3.2 – Timeliness in transmitting reports
The ISA must establish the ISR within three months of re-ceiving a copy of the application (the “search copy”) or nine months from the priority date (or, if no priority is claimed, from the international filing date), whichever expires later.
In 2015, the average time in transmitting ISRs to the IB was 3.3 months (figure C.3.2.1). This is the shortest trans-mittal time achieved since 2001. From 2001 to 2008, the average transmittal time, measured from the date of re-ceipt of search copy to the IB, increased by approximately
two months (from four months to almost six months); however, since 2008, it has improved enormously. The electronic transmittal of numerous ISRs to the IB may have played an important role in this improvement.
In 2015, ISAs transmitted on average 76.3% of ISRs to the IB within three months from the date of receipt of the search copy (figure C.3.2.2). In 2015, this share improved on average by nearly 10 percentage points compared with 2014 (67%). It improved most at the office of the Republic of Korea (+25 percentage points), the office of Finland (+12) and the EPO (+11). In contrast, it decreased most at the office of Brazil (-7) and the office of India (-20).
Figure C.3.2.1: Average timeliness in transmitting ISRs to the IB, measured from the date of receipt of the search copy
3
4
5
6
Month
s
2001 2002 2003 2004 2005 2006 2007 2008 2009 2010 2011 2012 2013 2014 2015
Average timeliness in transmitting ISRs (from receipt of search copy)
YearNote: Timeliness is calculated as the time between the date when the ISA receives a copy of the PCT application and the date when the ISA transmits the ISR to the IB (or, if applicable, the date of receipt of the declaration under Article 17(2)(a)). The figure shows timeliness in establishing the ISR, where the applicable time limit for establishing the ISR under Rule 42 is three months after the date of receipt of the search copy.
Source: WIPO Statistics Database, May 2016.
Figure C.3.2.2: Timeliness in transmitting ISRs to the IB, measured from date of receipt of the search copy by time category and by ISA, 2015
Share of international search reports transmitted within 3 months (%)100.0 100.0 99.1 99.0 98.4 96.6 95.1 91.9 90.3 87.2 81.3 81.2 76.3 75.3 68.2 56.2 56.0 40.4 39.5 26.9
0
25
50
75
100
Distr
ibutio
n by t
ime
cate
gory
(%)
Egypt
Singapo
reJap
anSpai
nChile Chin
aCana
da
Australi
a
Republic
of Kore
a
Nordic P
atent I
nstitut
eBraz
ilAust
ria Total
Finland
Europea
n Pate
nt Offic
eIsra
el
Russian
Feder
ation
India
United S
tates o
f Americ
aSwede
n
International Searching Authority
Within 3 months 4-5 months 6-7 months 8-9 months More than 9 months
Note: Timeliness is calculated as the time between the date when the ISA receives a copy of the PCT application and the date when the ISA transmits the ISR to the IB (or, if applicable, the date of receipt of the declaration under Article 17(2)(a)). The figure shows timeliness in establishing the ISR, where the applicable time limit for establishing the ISR under Rule 42 is three months from receipt of the search copy.
Source: WIPO Statistics Database, May 2016.

66
SECTION C PERFORMANCE OF THE PCT SYSTEM
Figure C.3.2.3 presents the timeliness in transmitting ISRs to the IB for ISRs where the deadline is nine months from the priority date. On average, the share of ISRs transmitted within nine months from the prior-ity date was 75.2% in 2015. On average, the share of ISRs transmitted within nine months increased by 13.4 percentage points compared with 2014 (61.8%). This share improved most at the office of Finland (+24 per-centage points), KIPO (+20) and SIPO (+18). In contrast, it decreased most at the office of Egypt (-29), at the Nordic Patent Institute (-20), the office of Israel (-6) and the office of Brazil (-5).
A further measure of timeliness of an ISA is the propor-tion of ISRs that are transmitted to the IB in time for publication with the PCT application. Figure C.3.2.4 presents this measure of timeliness, showing the percentage of applications published with the ISR (A1 publication) by ISA. Overall, 93.4% of PCT applica-tions were published with the ISR in 2015, compared to 89.7% in 2014. The share of A1 publications was above 95% for 12 of the 18 ISAs in 2015.
Figure C.3.2.3: Timeliness in transmitting ISRs to the IB, measured from priority date by time category and by ISA, 2015
Share of international search reports transmitted within 9 months (%)98.1 96.8 95.9 91.9 91.1 88.7 87.8 86.8 84.7 82.4 81.1 80.3 77.3 75.2 75.0 72.5 71.4 61.7 57.3 42.9
0
25
50
75
100
Distr
ibutio
n by t
ime
cate
gory
(%)
Chile Spain
Finland
Canada
Republic
of Kore
aIsra
elJap
anBraz
il
Russian
Feder
ation
India
Australi
aAust
ria
Europea
n Pate
nt Offic
eTota
l
Singapo
re
United S
tates o
f Americ
aEgyp
t
Sweden
China
Nordic P
atent I
nstitut
e
International Searching Authority
Within 9 months Within the 10th month Within the 11th month Within the 12th month More than 12 months
Note: Timeliness is calculated as the time elapsed between the priority date and the date on which the ISA transmits the ISR to the IB (or, if applicable, the date of receipt of the declaration under Article 17(2)(a)), for ISRs where the deadline is nine months from the priority date.
Source: WIPO Statistics Database, May 2016.
Figure C.3.2.4: Share of published PCT applications with and without ISRs by ISA, 2015
Share of international publications with ISR (%)100.0 99.8 99.3 98.8 98.8 98.5 97.7 96.8 96.8 96.7 96.5 96.2 90.2 89.2 80.5 76.7 66.7 51.1
0
25
50
75
100
Distr
ibutio
n by p
ublic
ation
type
(%)
ChileJap
anChin
aFinla
nd
Sweden
Nordic P
atent I
nstitut
eIsra
el
Australi
aBraz
il
Republic
of Kore
aCana
daSpai
n
Europea
n Pate
nt Offic
e
Russian
Feder
ation
United S
tates o
f Americ
aAust
riaEgyp
tInd
ia
International Searching Authority
A1 (with ISR) A2 (without ISR)
Source: WIPO Statistics Database, May 2016.

67
SECTION C PERFORMANCE OF THE PCT SYSTEM
C.4 – Supplementary international searching authorities
Since 2009, the supplementary international search (SIS) service has enabled PCT applicants to request searches in additional languages, complementing the search by the main ISAs.
C.4.1 – Supplementary international search reports by authority
In 2015, 64 SIS requests were recorded, represent-ing 45 fewer requests than in the previous year (table C.4.1). Only three offices recorded SIS requests, namely the EPO with 40 requests, the office of the Russian Federation (22) and the office of Austria (2).
Table C.4.1: Distribution of supplementary international search reports by SISASupplementary International Searching Authority
Year
2011 2012 2013 2014 2015
Austria 1 2 2 2 2
European Patent Office 7 21 30 61 40
Finland 1
Nordic Patent Institute 3
Russian Federation 31 19 32 46 22
Sweden 2 3
Total 41 46 67 109 64
Note: The figures for 2015 may be incomplete.
Source: WIPO Statistics Database, May 2016.
C.5 – International preliminary examining authorities
PCT applicants can request an optional international preliminary examination (IPE) from an international preliminary examining authority (IPEA) with compe-tence based on negotiated agreements between ROs and IPEAs.
Once the IPE has been carried out, an International Preliminary Report on Patentability (IPRP) is sent by the IPEA to the applicant, who is then better placed to make an informed decision about whether or not to enter the PCT national phase. The report is also transmitted to national offices in their capacity as the
“elected” office.18 In examining the PCT application dur-ing the national phase, patent offices take into account the IPRP (as well as the ISR and the written opinion of the ISA) when considering the patentability of the underlying invention.
The office of Singapore commenced operations on September 1, 2015, and at the end of 2015 the office of Ukraine confirmed that it would commence operations on February 5, 2016. Thus, at the time of writing, there were 20 national or regional patent offices operating as ISAs and IPEAs. Furthermore, in October 2015, the Visegrad Patent Institute (VPI), an intergovernmental organization for cooperation in the field of patents comprising the national offices of the Czech Republic, Hungary, Poland and Slovakia, was appointed by the Assembly of the PCT Union as an ISA and IPEA. This appointment will be effective from a future date to be notified by the office when it is ready to begin operations.
C.5.1 – International preliminary reports on patentability by authority
In 2015, the number of IPRPs issued reached 15,706, representing an increase of 14.4% on 2014 (table C.5.1). The EPO (+1,483 reports) and the JPO (+250) accounted for most of this increase.
18. “Elected” offices are national or regional offices at which the PCT application has potential legal effect.
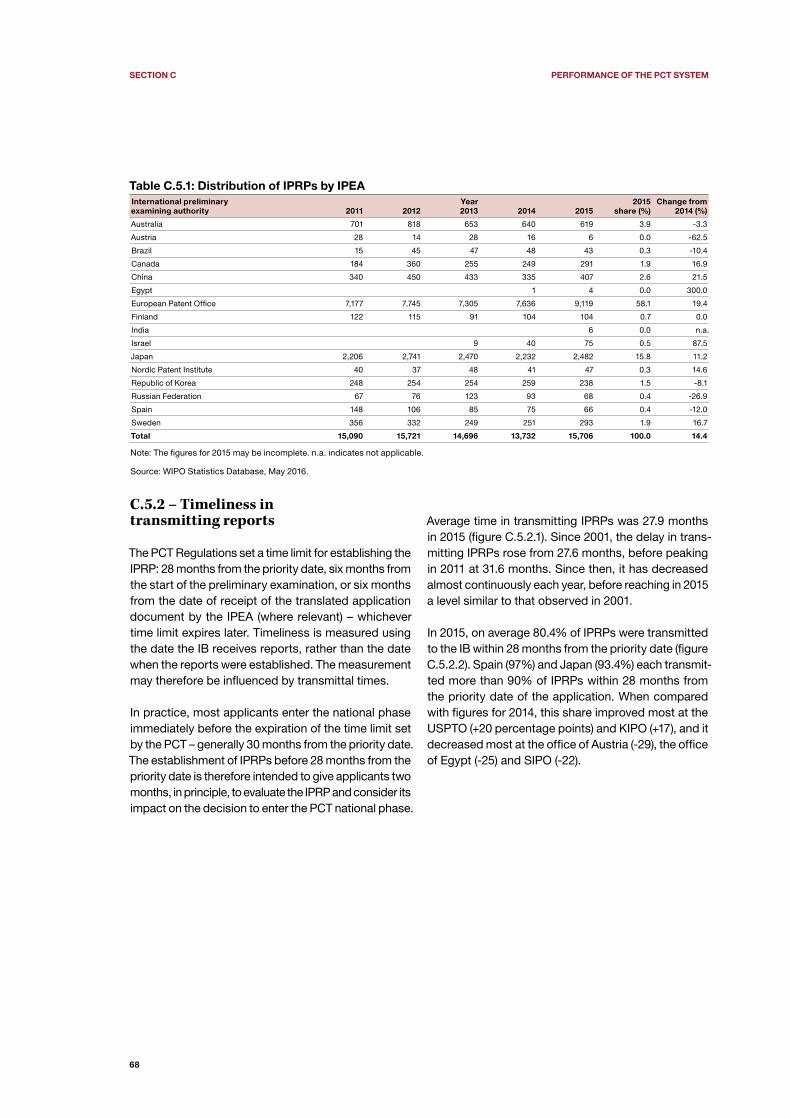
68
SECTION C PERFORMANCE OF THE PCT SYSTEM
Table C.5.1: Distribution of IPRPs by IPEAInternational preliminaryexamining authority 2011 2012
Year 2013 2014 2015
2015share (%)
Change from 2014 (%)
Australia 701 818 653 640 619 3.9 -3.3
Austria 28 14 28 16 6 0.0 -62.5
Brazil 15 45 47 48 43 0.3 -10.4
Canada 184 360 255 249 291 1.9 16.9
China 340 450 433 335 407 2.6 21.5
Egypt 1 4 0.0 300.0
European Patent Office 7,177 7,745 7,305 7,636 9,119 58.1 19.4
Finland 122 115 91 104 104 0.7 0.0
India 6 0.0 n.a.
Israel 9 40 75 0.5 87.5
Japan 2,206 2,741 2,470 2,232 2,482 15.8 11.2
Nordic Patent Institute 40 37 48 41 47 0.3 14.6
Republic of Korea 248 254 254 259 238 1.5 -8.1
Russian Federation 67 76 123 93 68 0.4 -26.9
Spain 148 106 85 75 66 0.4 -12.0
Sweden 356 332 249 251 293 1.9 16.7
Total 15,090 15,721 14,696 13,732 15,706 100.0 14.4
Note: The figures for 2015 may be incomplete. n.a. indicates not applicable.
Source: WIPO Statistics Database, May 2016.
C.5.2 – Timeliness in transmitting reports
The PCT Regulations set a time limit for establishing the IPRP: 28 months from the priority date, six months from the start of the preliminary examination, or six months from the date of receipt of the translated application document by the IPEA (where relevant) – whichever time limit expires later. Timeliness is measured using the date the IB receives reports, rather than the date when the reports were established. The measurement may therefore be influenced by transmittal times.
In practice, most applicants enter the national phase immediately before the expiration of the time limit set by the PCT – generally 30 months from the priority date. The establishment of IPRPs before 28 months from the priority date is therefore intended to give applicants two months, in principle, to evaluate the IPRP and consider its impact on the decision to enter the PCT national phase.
Average time in transmitting IPRPs was 27.9 months in 2015 (figure C.5.2.1). Since 2001, the delay in trans-mitting IPRPs rose from 27.6 months, before peaking in 2011 at 31.6 months. Since then, it has decreased almost continuously each year, before reaching in 2015 a level similar to that observed in 2001.
In 2015, on average 80.4% of IPRPs were transmitted to the IB within 28 months from the priority date (figure C.5.2.2). Spain (97%) and Japan (93.4%) each transmit-ted more than 90% of IPRPs within 28 months from the priority date of the application. When compared with figures for 2014, this share improved most at the USPTO (+20 percentage points) and KIPO (+17), and it decreased most at the office of Austria (-29), the office of Egypt (-25) and SIPO (-22).

69
SECTION C PERFORMANCE OF THE PCT SYSTEM
Figure C.5.2.1: Average timeliness in transmitting IPRPs to the IB
27
28
29
30
31
32
Month
s
2001 2002 2003 2004 2005 2006 2007 2008 2009 2010 2011 2012 2013 2014 2015
Average timeliness in transmitting International Preliminary Reports on Patentability (from priority date)
Year
Note: Timeliness is calculated as the time elapsed between the priority date and the date on which the IB received the IPRP from the IPEA.
Source: WIPO Statistics Database, May 2016.
Figure C.5.2.2: Timeliness in transmitting IPRPs to the IB by time, category and IPEA, 2015
Share of IPRPs transmitted within 28 months (%)97.0 93.4 89.5 89.4 84.8 84.1 83.7 81.8 80.7 80.4 75.0 73.2 69.9 57.4 53.2 39.6 33.3 16.7
0
25
50
75
100
Distr
ibutio
n by t
ime
cate
gory
(%)
Spain
Japan
Sweden
Finland
Nordic P
atent I
nstitut
e
Australi
aBraz
il
Canada
Europea
n Pate
nt Offic
eTota
lEgyp
t
Republic
of Kore
a
United S
tates o
f Americ
a
Russian
Feder
ation
Israel
China
Austria Ind
ia
International Preliminary Examining Authority
Within 28 months 29-30 months 31-32 months More than 32 months
Note: Figure C.5.2.2 presents the same timeliness information for 2014 as that presented in figure C.5.2.1, but breaks down this information by IPEA. Timeliness is calculated as the time elapsed between the priority date and the date when the IB received the IPRP from the IPEA.
Source: WIPO Statistics Database, May 2016.

70
SECTION C PERFORMANCE OF THE PCT SYSTEM
C.6 – PCT-Patent Prosecution Highway pilots
Where a favorable written opinion or IPRP has been issued by the participating ISA and/or IPEA, use of the PCT-Patent Prosecution Highway (PCT-PPH) pilots enables applicants to fast-track patent examination procedures in the national phase and, generally, to obtain a patentability decision more quickly from participating offices.
In 2015, 69 PCT-PPH bilateral pilots were active, with the participation of 28 offices, including 14 international authorities. More comprehensive pilot programs with multilateral agreements, which also include PCT work products, were also active – namely, the Global PPH pilot program (GPPH) and the IP5 PPH pilot program. Between them, they included 23 participating offices at the end of 2015.
C.6.1 – New PCT-PPH pilots
Bilateral and unilateral pilots
The following offices commenced bilateral PCT-PPH pilots in 2015 (in chronological order):• Canadian Intellectual Property Office and the EPO• EPO and Israel Patent Office• EPO and Mexican Institute of Industrial Property • EPO and Industrial Property Office of Singapore• Industrial Property Office (Czech Republic) and
the JPO • State Office for Inventions and Trademarks
(Romania) and the JPO.
Global PPH pilot
In 2015, the Estonian Patent Office and the German Patent and Trade Mark Office joined the pilot program of the GPPH arrangement, whereby it is possible for a
request for accelerated processing to be made at any participating office based on work products, includ-ing a written opinion or IPRP under the PCT, from any of the other participating offices. The pilot program uses a single set of qualifying requirements and aims to simplify and improve the existing PPH network to make it more accessible to users. In 2015, 21 offices took part in the GPPH pilot.
C.6.2 – Number of requests by office
Table C.6.2.1 presents the number of requests for PCT-PPH fast-track patent examination in 2015 by office of PCT national phase entry and by ISA. Due to techni-cal reasons, the USPTO, as the office of PCT national phase entry – which in 2013 accounted for 54.8% of all requests – did not provide its 2014 and 2015 PCT-PPH statistics. Data for the offices of Germany and Indonesia are also missing.
Offices of PCT national phase entry received a total of 5,804 requests in 2015, with the exception of the three above-mentioned offices. This represents an increase of 40.6% on 2014 figures. Almost all offices presented in the table experienced growth compared with the previous year. SIPO recorded the sharpest increase in the number of requests (+537), followed by the JPO (+308) and the EPO (+240).
Table C.6.2.2 compares the July to December 2015 data for PCT-PPH applications with total patent applica-tions for some key elements of the patent examination procedure. It should be noted that due to important differences in patenting procedures among offices, a cross-office comparison is not relevant.
Compared with the available PPH statistics, the grant rates and first-action allowance rates were higher for PCT-PPH applications in all cases.

71
SECTION C PERFORMANCE OF THE PCT SYSTEM
Table C.6.2.1: Distribution of PCT-PPH requests by international authority and office of PCT national phase entry, 2015
International authority
Office of PCT national phase entry A
ust
ralia
Au
stri
a
Ca
nad
a
Ch
ina
Eu
rop
ean
Pat
ent
Offi
ce
Fin
lan
d
Isra
el
Jap
an
No
rdic
P
aten
t In
stit
ute
Rep
ub
lic
of K
ore
a
Ru
ssia
n F
eder
atio
n
Sin
ga
po
re
Sp
ain
Sw
eden
Un
ited
S
tate
s o
f A
mer
ica
Tota
l
Japan 6 0 7 84 461 2 3 1,262 0 78 7 0 4 10 19 1,943
China - 2 - - 507 9 6 765 - 125 6 - 5 17 48 1,490
European Patent Office - - 29 125 - - 20 423 - 63 - - - - 86 746
Republic of Korea 4 2 8 64 173 7 4 219 1 56 3 0 1 9 42 593
Canada 5 3 144 - 92 3 3 40 0 42 4 0 0 4 57 397
Australia 0 0 11 - - 1 7 58 0 70 1 0 0 13 78 239
Russian Federation 1 0 7 5 - 2 2 74 0 3 0 0 1 3 29 127
Israel 0 0 1 0 36 0 18 8 0 16 3 1 0 3 9 95
Mexico - - 0 0 13 - - 55 - 0 - - 21 - 2 91
Philippines - - - - - - - 24 - - - - - - 12 36
Malaysia - - - - - - - 23 - - - - - - - 23
United Kingdom 0 0 0 4 - 0 0 2 1 3 0 0 0 0 0 10
Singapore 0 0 0 - 1 0 0 2 0 3 0 0 0 0 1 7
Denmark 0 0 0 0 - 0 0 2 0 0 0 0 0 0 0 2
Finland 0 0 0 - 0 0 0 2 0 0 0 0 0 0 0 2
Sweden 0 0 0 0 - 0 0 1 0 0 0 0 0 1 0 2
Norway 0 0 0 - - 0 0 0 0 1 0 0 0 0 0 1
Total 16 7 207 282 1,283 24 63 2,960 2 460 24 1 32 60 383 5,804
Note: - indicates PCT-PPH is not available between these two offices. Data for Germany, Indonesia and the USPTO acting as office of PCT national phase entry are missing. The office of Germany and the USPTO do not distinguish between PCT-PPH and PPH in their statistical reporting. The office of Indonesia did not provide its 2015 statistics.
Source: WIPO, based on data from the JPO, May 2016.
Table C.6.2.2: Additional statistics on PCT-PPH applications, July to December 2015Office of PCT national phase entry
Additional statistics Ca
nad
a
Un
ited
K
ing
do
m
Isra
el
Jap
an
Rep
ub
lic
of K
ore
a
Mex
ico
Mal
aysi
a
Ru
ssia
n F
eder
atio
n
Sw
eden
Grant rate (%)
PCT-PPH applications 89.0 100.0 100.0 82.1 77.0 88.9 56.0 100.0 100.0
All applications combined 59.0 69.3* 79.7
First action allowance rate (%)
PCT-PPH applications 25.0 40.0 93.0 16.0 10.3 55.6 56.0 80.0 100.0
All applications combined 2.6 9.0 25.0
Note: *January to December 2014.
Source: WIPO, based on data from the JPO, May 2016.

72
SECTION C PERFORMANCE OF THE PCT SYSTEM
C.7 – PCT user satisfaction survey
A survey of PCT users was conducted in 2015.19 It aimed to measure user satisfaction with the PCT ser-vices provided by WIPO, patent offices and interna-tional authorities within the PCT System. This was the second survey of PCT users conducted by WIPO and was developed in cooperation with Mbee.M, an external service provider. Slightly more than 1,000 users completed the survey and provided free-text comments. Applicants from the U.S. (17%), China (14%) and Japan (9%) accounted for the largest proportion of respondents. The results showed a high level of sat-isfaction with PCT services provided by WIPO among the survey respondents, with all comparable areas showing improvement over the baseline established in 2009, when the first survey was conducted.
The overall global satisfaction indicator for the PCT information products and services provided by WIPO was 89%. WIPO received an overall rating of 87% for the processing of PCT applications (including filing with the RO of the IB), processing by the IB, and ePCT (figure C.7.1).
The PCT training provided by WIPO was highly rated, with user satisfaction ratings of over 90% for the in-dividual training-related services: seminars, webinars, distance learning course and video training series (figure C.7.2). Despite this positive feedback, users indicated a lack of awareness with regard to the avail-ability of PCT training.
Offices and international authorities were evaluated collectively and achieved an overall satisfaction rating of 83% (figure C.7.3). The services provided by ROs (with the exception of the RO of the IB) received an overall satisfaction rating of 83%. Services provided by ISAs received an overall satisfaction rating of 82% and those provided by IPEAs received an overall sat-isfaction rating of 81%. The overall usefulness of PCT reports produced by the ISAs and IPEAs was highly rated, although there were reduced levels of satisfac-tion with regard to timeliness, the specific quality of products, and the accessibility and availability of staff in the international authorities when such contact was needed.
Figure C.7.1: Specific overall satisfaction ratings for processing of PCT applications
25%
18%
24%
16%
33%
34%
31%
32%
32%
36%
35%
39%
9%
10%
8%
12%
1%
2%
2%
1%
0 20% 40% 60% 80% 100%
Overall PCT processing at WIPO
ePCT
Processing by IB
Filing with RO/IB
Excellent Very good Good Average Poor
Note: Overall satisfaction rating: 87%
Source: WIPO, PCT Survey, 2015.
18. Available at: www.wipo.int/edocs/mdocs/pct/en/pct_wg_9/pct_wg_9_11.pdf

73
SECTION C PERFORMANCE OF THE PCT SYSTEM
Figure C.7.2: Overall satisfaction ratings for PCT training, in percent
91
95
95
91
92
93
96
96
0 20 40 60 80 100
PCT video training series
PCT distance learning course
PCT webinar
PCT seminar
Quality Overall satisfaction
Source: WIPO, PCT Survey, 2015
Figure C.7.3: Specific overall satisfaction ratings for PCT services provided by patent offices and international authorities
16%
12%
11%
11%
31%
29%
28%
32%
36%
41%
42%
40%
13%
15%
16%
15%
4%
3%
3%
2%
0 20% 40% 60% 80% 100%
As a whole
IPEAs
ISAs
ROs (excluding RO/IB)
Excellent Very good Good Average Poor
Note: Overall satisfaction rating: 83%
Source: WIPO, PCT Survey, 2015.

75
SECTION D DEVELOPMENT OF THE PCT SYSTEM
D.1 – Electronic filing and processing of PCT applications
By the end of 2015, 49 out of a total of 116 PCT ROs (17 more than at the end of 2014) accepted the filing of PCT applications in fully electronic format.
D.1.1 – ePCT-Filing
By the end of 2015, 29 ROs were accepting PCT fil-ings using the ePCT-Filing portal. During the course of the year, the offices of the following countries an-nounced that they were prepared to accept such fil-ings: Algeria, Azerbaijan, Colombia, Czech Republic, Denmark, Estonia, Hungary, Latvia, Mexico, Norway, Poland, Qatar, Saudi Arabia, Singapore, South Africa and Turkey.
In addition, at the end of 2015 the ROs of Brunei Darussalam, Iceland, Indonesia, the Philippines and the Russian Federation notified the IB that they would begin accepting such filings from January 2016.
D.1.2 – ePCT system
The ePCT system enables applicants to securely file and manage their PCT applications and to access the bibliographic data and documents in real time through-out the lifetime of the international application, including prior to publication. The system comprises two modes: ePCT public services (submission of electronic docu-ments but no access to confidential data and docu-ments, online “Actions” limited to requests to record changes under PCT Rule 92bis for published applica-tions, and submission by third parties of observations as to close prior art) and ePCT private services (filing of PCT applications, real-time access to confidential data and documents, and 17 semi-automated “Actions”).
The system also provides services for offices – primarily for ROs, but also in roles as ISAs, IPEAs and designated and elected offices. By the end of 2015, 59 offices had accessed the system.
ePCT for applicants
Following an initial pilot phase during which the inter-face was available in English only, it became available in the other nine languages of international publication (Arabic, Chinese, French, German, Japanese, Korean, Portuguese, Russian and Spanish) on April 16, 2015.
The updates to the ePCT System that were deployed in April, August and December 2015 incorporated a number of new features, including:• new ePCT Actions, including one to submit amend-
ments to the claims under PCT Article 19 to the IB in text format (with the possibility to save a draft copy prior to submission and use a function which assists with the preparation of the letter that must accom-pany the amendments), one to prepare a power of attorney and submit it to the IB post-filing, and one to submit a translation for international publication to the IB and convert it into the required format;
• the ability to select multiple applications and man-age access rights for all the selected applications in one step;
• the possibility to select several new PCT applica-tions on the ePCT-Filing screen and either manage the access rights or delete them in a single opera-tion;
• default access rights automatically applied when a new international application is created for filing via ePCT;
• when cloning an existing application to create a new application, the user can specify that, in addition to the bibliographic data, the documents contained in the application are also to be cloned;
• the National Institute of Industrial Property (Brazil) has informed WIPO that it provides certified copies of earlier applications in electronic format (signed PDF). Therefore, it is now possible to attach such signed PDF documents in ePCT-Filing on the prior-ity claims screen and also when using the Upload Documents function in ePCT private and public services;
• in ePCT-Filing, where the selected receiving office has a fee structure involving more than one currency, it is now possible to indicate multiple currencies on the Fees screen;
• provided that a PCT application has been published, it is possible to use the ePCT Action “Rule 92bis change request” in ePCT public services; and
• an improved format for FAQ documentation that makes it easier to find answers and solutions to common issues, whether related to ePCT, digital certificates or other PCT electronic services.
Section DDevelopment of the PCT System
76
SECTION D DEVELOPMENT OF THE PCT SYSTEM
ePCT for offices
A number of new features were added to ePCT for offices and international authorities in August and December 2015, including:• the possibility to transmit priority documents to
the IB;• an Action to record receipt of a demand for inter-
national preliminary examination and transmit it to the IB;
• an Action to withdraw an application;• an Action for the receiving office to input data relat-
ing to requests under Rule 92bis; • the possibility to generate a number of forms
through ePCT for use by receiving offices, including a feature to specify the delivery method (e-mail, fax);
• functions for processing of documents (edit pagina-tion, merge documents);
• an Action for designated offices to notify receipt of a national phase entry by specifying the national application number and the date, and subsequently have access to documents on file in ePCT; and
• the ability to generate a variety of reports to assist the management of RO and ISA functions.
D.1.3 – Decommissioning of PCT-EASY
On July 1, 2015, the PCT-EASY functionality of PCT-SAFE was decommissioned. It therefore became no longer possible to file PCT applications with the request form in PCT-EASY format, namely on paper, together with a copy of the request and the abstract in electronic form in character-coded format. PCT-EASY filings had been possible since 1998, and were a precursor to the current fully electronic filing systems available with PCT-SAFE and ePCT-Filing. Although PCT-EASY filings made up about 45% of all PCT filings in 2003, their share of filings later decreased significantly due to the growing importance of fully electronic filing systems, and in recent years they represented only small proportion of total filings (see C.1.1).
PCT applicants who did not already do so were actively encouraged to file using ePCT-Filing in order to benefit from the many advantages offered under this mode of filing. Nevertheless, the special EFS-Web functionality for the USPTO acting as RO remained in the software, and filers continued to be able to prepare and upload the “PCT-EASY.zip” file to the EFS-Web system.
D.2 – PATENTSCOPE Search System
The national collections of Tunisia and the U.K. were added to PATENTSCOPE. This brings to 41 the number of national (or regional) offices whose data are available in PATENTSCOPE. In 2015, it was possible to search over 50 million patent documents, including over 2.8 million published PCT applications.
Following the addition of Arabic on August 20, 2015, the PATENTSCOPE search system has now become available in all 10 languages of publication.
A new “machine translation” button allows users to choose between machine translation tools, including WIPO’s machine translation tool “WIPO Translate” for translation into eight languages. Additionally, this tool is available for the translation of full-length Chinese documents into English, and vice versa. WIPO Translate can also be used as an individual translation tool for the translation of patent-related texts in 14 language pairs.
Access to the PATENTSCOPE website and all of the associated functionality has become more secure due to the strong encryption available via the http protocol,
“https”. With this encryption, user confidentiality is en-sured as account data, identity data, search data and results are protected from being modified or monitored.

77
SECTION D DEVELOPMENT OF THE PCT SYSTEM
D.3 – WIPO Pearl database
Since September 2014, WIPO Pearl has been providing free access to a wealth of multilingual scientific and technical terminology found in patents and published patent applications.20 It promotes accurate and consis-tent use of terms across the 10 publication languages of the PCT and makes it easier to search and share scientific and technical knowledge.
The IB continued to develop WIPO Pearl during 2015, adding to the contents of the database and enhancing the application. More than 1,000 new concepts and 20,000 new terms were added, such that at the end of the year the database contained 16,300 concepts and 110,000 terms, all entered and validated by WIPO-PCT language experts (translators and terminologists) who have considerable experience in working with patent documents in multiple languages. In addition, more than 10,000 concepts are now linked to other con-cepts in the database, and these relationships can be browsed in the Concept Map Search.
The new features added to WIPO Pearl in 2015 included:• a “picture” icon that allows users to search for im-
ages of terms found in Linguistic Search;• a quick-view “Term” list in Linguistic Search that
helps users see at a glance all the terms that are relevant for the searched term, before exploring details in the main hit list;
• statistics in Linguistic Search that show the number of hits per language and subject field; and
• concept maps accessed from Linguistic Search can now be expanded to show all the concepts in the subfield.
Feedback on WIPO Pearl is welcomed and can be sent to [email protected] or via the “Contact us” link on the WIPO website.
20. Available at: www.wipo.int/reference/en/wipopearl
D.4 – Legal developments
Changes in the PCT Regulations that entered into force or were adopted by the Assembly of the International Patent Cooperation Union (PCT Assembly) in 2015 are presented below.
D.4.1 – Amendments that entered into force in 2015
Amendments adopted by the PCT Assembly in October 2014 – and which entered into force on July 1, 2015 – in-cluded the introduction of a requirement, in the case of applicants making an express request for early national phase entry, to file any request for the restoration of the right of priority at the designated or elected office within one month from the date of receipt of the request for early national phase entry (rather than one month from the expiration of the normal period for entering the national phase) (amendment of PCT Rule 49ter.2 and 76.5). An amendment was also made to enable the IB, in cases where it receives a notice of withdrawal together with a copy of the general power of attorney, to process the notice of withdrawal without requiring the agent to submit a separate original power of attorney.
In view of the withdrawal of the PCT-EASY service on July 1, 2015, the PCT Schedule of Fees was also revised with effect from that date to remove the fee reduction available for such filings. Furthermore, the eligibility criteria for the 90% reduction in the international filing fee, the supplementary search handling fee and the handling fee, which is available for applicants from certain states, were revised with effect from July 1, 2015, with the following effect: natural persons who are na-tionals and residents of Singapore and the United Arab Emirates will no longer benefit from the fee reduction, but natural persons who are nationals and residents of the Bahamas, Cyprus, Greece, Malta, Nauru, Palau, Portugal, Saudi Arabia, Slovenia and Suriname will be able to benefit from the fee reduction.
As a consequence of the above-mentioned amend-ments to the Regulations under the PCT, modifications to the Administrative Instructions under the PCT, the PCT Receiving Office Guidelines, the PCT International Search and Preliminary Examination Guidelines and certain PCT forms were made accordingly, with effect from July 1, 2015.
78
SECTION D DEVELOPMENT OF THE PCT SYSTEM
D.4.2 – Amendments adopted in 2015 that will enter into force in 2016
Amendments to the PCT Regulations which were ad-opted by the PCT Assembly in October 2015, and which will enter into force on July 1, 2016, were agreed so as to enable applicants to request that information normally included accidentally in the international application or associated documents be omitted from the published version of an international application or the associated files if it does not obviously serve the purpose of inform-ing the public about the international application, if it would prejudice the personal or economic interests of any person and if there is no prevailing public interest to have access to that information (amendment of PCT Rules 9, 48 and 94).
Amendments were also agreed to allow applicants to request that certain documents relating to requests for restoration of the right of priority not be forwarded by the receiving offices to the IB (amendment of PCT Rules 26bis and 48). A new provision was introduced to PCT Rule 82quater to allow time limits to be extended where a time limit had been missed because of a general failure of electronic communications services in the area where the interested party resides; such extension of time limits is subject to the fulfillment of certain conditions.
Furthermore, an enabling provision was added to PCT Rule 92 under which the IB will allow applicants to write to the IB in publication languages other than English or French. Initially, this will be where such correspondence is transmitted through ePCT.
D.4.3 – Amendments adopted in 2015 that will enter into force in 2017
Amendments were agreed to the PCT Regulations adopted by the PCT Assembly in October 2015. The Regulations, which will enter into force on July 1, 2017, require receiving offices to forward details of search and/or classification results from earlier applications to the ISA when permitted to do so under national law (amendment of PCT Rules 12bis, 23bis and 41). Also, in order to increase the amount of information available in PATENTSCOPE and in bulk format to other pat-ent information providers concerning national phase entries, national publication and grants, amendments were agreed to PCT Rules 86 and 95 to require des-ignated offices to send such information in a timely manner to the IB.
D.5 – Meetings
Several meetings take place every year between the PCT International Authorities, the IB, PCT member states and/or offices, in order to ensure the smooth operation of the System, improve its performance and facilitate its use. The main developments in 2015 are described below.
D.5.1 – Meeting of International Authorities
The 22nd session of the Meeting of International Authorities under the PCT was held in Tokyo, Japan, from February 4 to February 6, 2015. The matters discussed at the meeting included: a document by the USPTO proposing areas for further work (for example, mandatory replies to negative indications by the ISA/IPEA on national phase entry, formal incorporation of the PPH into the PCT and a mandatory written opinion under the Chapter II procedure); a report by the JPO on ongoing discussions relating to the strengthening of links between the international and national phases of the PCT procedure; a report by the EPO on its new
“PCT Direct” service (this allows applicants, when filing a PCT application claiming priority of an earlier applica-tion which has already been searched by the EPO, to furnish to the EPO in its capacity as an ISA informal comments on any objections raised in the search opinion drawn up on the earlier application – Authorities supported extending this possibility to other ROs); and a proposal by KIPO concerning the requirements under PCT Rule 6.4 for dependent claims in an international application. The Meeting also noted a Summary by the Chair of the Meeting’s Quality Subgroup and approved the recommendations for further work, for example, on the exchange of quality policies and guidelines, and the sharing of search strategy information.
D.5.2 – PCT Working Group
The eighth session of the PCT Working Group was held in Geneva from May 26 to May 29, 2015. The Working Group recommended proposed amendments to the PCT Regulations which were later adopted by the PCT Assembly (see D.4.2 and D.4.3). The Working Group discussed a number of other matters, including: the set-ting of equivalent amounts of the international filing fee on an annual basis with hedging of the fee as far as the risk resulting from transactions in euro, Japanese yen and U.S. dollars is concerned; the progress being made with WIPO’s electronic services; the problem of lack of agreement regarding whether or not an erroneously

79
SECTION D DEVELOPMENT OF THE PCT SYSTEM
filed specification should be allowed to be replaced under the “missing parts” arrangements; whether or not to allow claims of priority from “earlier” applications filed on the same date as the PCT application; and the possible coordination by the IB of examiner training activities for national offices.
D.5.3 – PCT Assembly
The 47th session of the PCT Assembly was held in Geneva from October 5 to October 14, 2015, as part of the meetings of the Assemblies of the Member States of WIPO. The PCT Assembly adopted amendments to the PCT Regulations which will enter into force on either July 1, 2016 or July 1, 2017 (see D.4.2 and D.4.3). It appointed the Visegrad Patent Institute (VPI) as an ISA and IPEA, effective from a future date to be noti-fied by the office when it is ready to begin operations. In addition, the Assembly noted reports on the work being undertaken by the PCT Working Group and the PCT Meeting of International Authorities to find ways to improve the delivery of PCT services to stakehold-ers, and it approved recommendations on further work.
D.6 – PCT training
The IB offers training sessions and provides training materials on the PCT System to a wide range of inter-ested parties worldwide.
D.6.1 – Seminars
In 2015, the PCT Legal Division participated in 58 seminars for PCT users. The seminars were held in 15 countries (Australia, Belgium, China, Finland, France, Germany, Japan, Latvia, New Zealand, Poland, Spain, Sweden, Switzerland, the U.K. and the U.S.) and were provided in five languages (Chinese, English, French, German and Japanese). The above list includes an annual seminar organized at WIPO Headquarters that is offered free of charge to current and potential users of the PCT System. In addition, 46 presentations were provided to academics, user groups, companies and other stakeholders.
D.6.2 – Webinars
In 2015, eight webinars, including “PCT update” webi-nars and webinars on the use of the ePCT System, were provided to a total of 557 participants. The recordings and accompanying PowerPoint presentations are avail-able on the PCT website. In addition, 11 webinars were
held on a number of topics related to the use of the PATENTSCOPE search system. The PowerPoint slides that were used for those webinars are also available on the WIPO website.
D.6.3 – Distance learning
The PCT distance learning course entitled “Introduction to the PCT”, available in all 10 PCT languages of pub-lication, was followed via the Internet by 4,346 par-ticipants.
D.6.4 – International cooperation
The PCT International Cooperation Division organized and participated in 46 events such as seminars and workshops mainly for offices of PCT member states and possible PCT member states as well as other stakeholders. These were held in 34 countries and at WIPO Headquarters. There were more than 3,000 participants from more than 65 countries.


81
ANNEXES
Statistical TableThe table shows the number of PCT applications filed in 2015 and the number of PCT national phase entries in 2014 by office and by country or territory of origin.21
The following example may be of assistance in under-standing the table below: the patent office of Australia
received 1,622 PCT applications as a PCT receiving office in 2015 and 19,181 PCT national phase entries as a designated office in 2014; applicants residing in Australia filed 1,752 PCT applications in 2015 and initiated 6,817 PCT national phase entries worldwide in 2014.
Name Code
PCT applications filed in 2015 (international phase)
PCT national phase entries in 2014
at receiving office
by country of origin
at office of destination
by country of origin
African Intellectual Property Organization OA 1 n.a. 149 n.a.
African Regional Intellectual Property Organization AP 0 n.a. 788 n.a.
Albania AL 2 2 2 3
Algeria DZ 6 8 701 3
Andorra AD n.a. 5 n.a. 1
Angola AO IB 1 -- --
Antigua and Barbuda AG 0 0 15 --
Argentina AR n.a. 28 n.a. 124
Armenia AM 4 5 2 22
Aruba AW n.a. 0 n.a. 1
Australia AU 1,622 1,752 19,181 6,817
Austria AT 494 1,404 462 5,358
Azerbaijan AZ 1 1 1 71
Bahamas BS n.a. 10 n.a. 39
Bahrain BH 0 5 196 3
Bangladesh BD n.a. 0 n.a. 8
Barbados BB IB 125 38 364
Belarus BY 5 12 81 14
Belgium BE 71 1,185 EP 5,419
Belize BZ 0 0 36 12
Benin BJ OA 0 OA 6
Bermuda BM n.a. 0 n.a. 77
Bonaire, Sint Eustatius and Saba BQ n.a. 0 n.a. 1
Bosnia and Herzegovina BA 3 4 2 6
Botswana BW 0 0 5 1
Brazil BR 484 547 22,644 1,292
Brunei Darussalam BN 0 5 -- 2
Bulgaria BG 40 55 6 75
Burkina Faso BF OA 0 OA 5
Cameroon CM OA 1 OA 26
Canada CA 2,000 2,848 27,451 8,920
Central African Republic CF OA 0 OA 4
Chad TD OA 0 OA 2
Chile CL 137 167 2,468 406
China CN 31,031 29,846 79,612 22,473
China, Hong Kong SAR HK n.a. 0 n.a. 279
China, Macao SAR MO n.a. 0 n.a. 10
Colombia CO 12 86 1,819 147
Comoros KM OA 0 OA 1
Congo CG OA 1 OA 9
Cook Islands CK n.a. 0 n.a. 1
Costa Rica CR 2 6 530 5
Côte d'Ivoire CI OA 2 OA 22
Croatia HR 22 28 15 42
21. A PCT applicant seeking protection in any of the European Patent Convention (EPC) member states can generally choose to enter the national phase at the relevant national office or at the EPO (see EPC member states indicated in the PCT contracting states table in the annex). This explains why the number of PCT national phase entries at some European national offices is lower than would otherwise be
expected. The PCT national phase route is closed for France, Italy, the Netherlands and several other countries (again, see the PCT contracting states table in the annex). A PCT applicant seeking protection in those countries must enter the PCT national phase at the regional office (the EPO). Only countries and territories for which statistical data were available are included in the table.
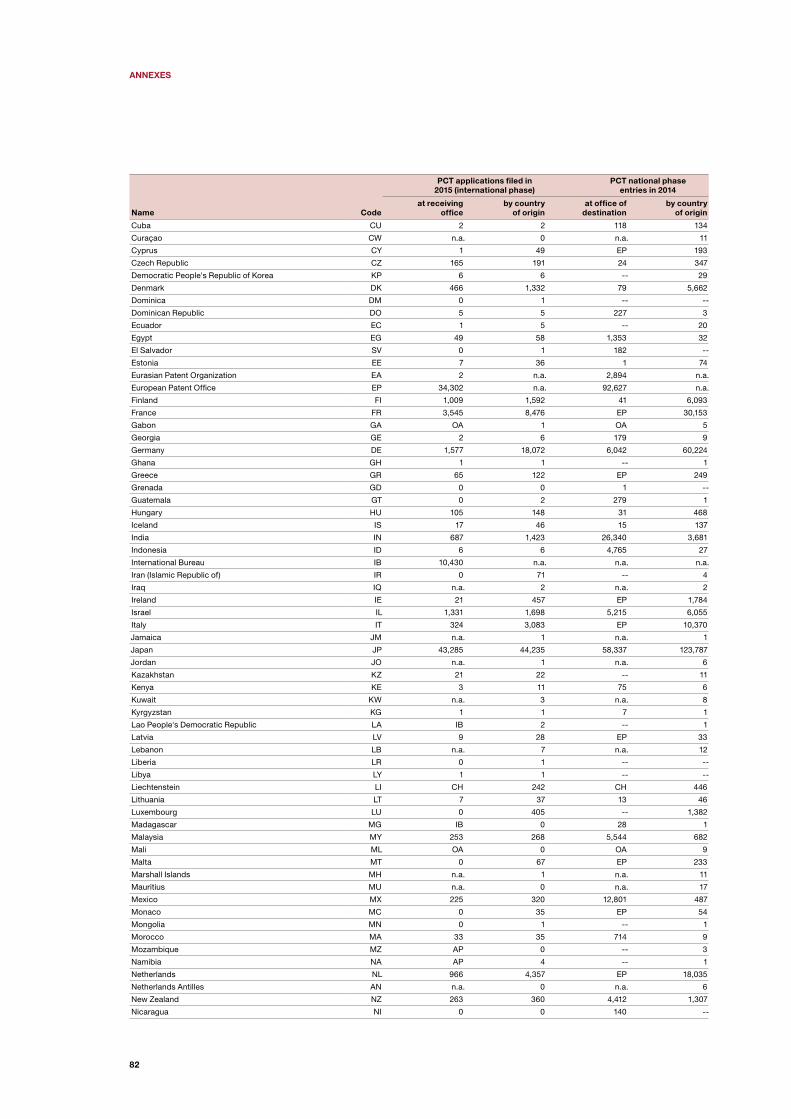
82
ANNEXES
Name Code
PCT applications filed in 2015 (international phase)
PCT national phase entries in 2014
at receiving office
by country of origin
at office of destination
by country of origin
Cuba CU 2 2 118 134
Curaçao CW n.a. 0 n.a. 11
Cyprus CY 1 49 EP 193
Czech Republic CZ 165 191 24 347
Democratic People's Republic of Korea KP 6 6 -- 29
Denmark DK 466 1,332 79 5,662
Dominica DM 0 1 -- --
Dominican Republic DO 5 5 227 3
Ecuador EC 1 5 -- 20
Egypt EG 49 58 1,353 32
El Salvador SV 0 1 182 --
Estonia EE 7 36 1 74
Eurasian Patent Organization EA 2 n.a. 2,894 n.a.
European Patent Office EP 34,302 n.a. 92,627 n.a.
Finland FI 1,009 1,592 41 6,093
France FR 3,545 8,476 EP 30,153
Gabon GA OA 1 OA 5
Georgia GE 2 6 179 9
Germany DE 1,577 18,072 6,042 60,224
Ghana GH 1 1 -- 1
Greece GR 65 122 EP 249
Grenada GD 0 0 1 --
Guatemala GT 0 2 279 1
Hungary HU 105 148 31 468
Iceland IS 17 46 15 137
India IN 687 1,423 26,340 3,681
Indonesia ID 6 6 4,765 27
International Bureau IB 10,430 n.a. n.a. n.a.
Iran (Islamic Republic of) IR 0 71 -- 4
Iraq IQ n.a. 2 n.a. 2
Ireland IE 21 457 EP 1,784
Israel IL 1,331 1,698 5,215 6,055
Italy IT 324 3,083 EP 10,370
Jamaica JM n.a. 1 n.a. 1
Japan JP 43,285 44,235 58,337 123,787
Jordan JO n.a. 1 n.a. 6
Kazakhstan KZ 21 22 -- 11
Kenya KE 3 11 75 6
Kuwait KW n.a. 3 n.a. 8
Kyrgyzstan KG 1 1 7 1
Lao People's Democratic Republic LA IB 2 -- 1
Latvia LV 9 28 EP 33
Lebanon LB n.a. 7 n.a. 12
Liberia LR 0 1 -- --
Libya LY 1 1 -- --
Liechtenstein LI CH 242 CH 446
Lithuania LT 7 37 13 46
Luxembourg LU 0 405 -- 1,382
Madagascar MG IB 0 28 1
Malaysia MY 253 268 5,544 682
Mali ML OA 0 OA 9
Malta MT 0 67 EP 233
Marshall Islands MH n.a. 1 n.a. 11
Mauritius MU n.a. 0 n.a. 17
Mexico MX 225 320 12,801 487
Monaco MC 0 35 EP 54
Mongolia MN 0 1 -- 1
Morocco MA 33 35 714 9
Mozambique MZ AP 0 -- 3
Namibia NA AP 4 -- 1
Netherlands NL 966 4,357 EP 18,035
Netherlands Antilles AN n.a. 0 n.a. 6
New Zealand NZ 263 360 4,412 1,307
Nicaragua NI 0 0 140 --

83
ANNEXES
Name Code
PCT applications filed in 2015 (international phase)
PCT national phase entries in 2014
at receiving office
by country of origin
at office of destination
by country of origin
Niger NE OA 1 OA 10
Nigeria NG IB 5 -- 1
Norway NO 291 679 416 2,623
Oman OM IB 3 -- 3
Pakistan PK n.a. 2 n.a. 14
Panama PA 3 15 241 43
Paraguay PY n.a. 1 n.a. 2
Peru PE 24 25 1,089 16
Philippines PH 17 27 3,063 121
Poland PL 304 440 59 794
Portugal PT 61 161 13 334
Qatar QA 4 19 464 87
Republic of Korea KR 14,657 14,626 37,112 21,090
Republic of Moldova MD 7 7 62 2
Romania RO 38 34 17 95
Russian Federation RU 839 792 13,451 1,337
Rwanda RW 0 1 -- 1
Saint Kitts and Nevis KN 0 1 -- 3
Saint Lucia LC IB 1 -- --
Saint Vincent and the Grenadines VC IB 0 8 20
Samoa WS n.a. 5 n.a. --
San Marino SM 0 3 -- 5
Saudi Arabia SA 22 279 -- 945
Senegal SN OA 16 OA 27
Serbia RS 28 38 5 25
Seychelles SC 0 7 -- 37
Sierra Leone SL AP 0 -- 3
Singapore SG 665 910 7,123 2,581
Slovakia SK 19 38 9 96
Slovenia SI 37 84 EP 169
South Africa ZA 93 314 6,523 1,364
Spain ES 1,148 1,537 147 4,072
Sri Lanka LK IB 14 -- 8
Sudan SD 0 5 8 2
Swaziland SZ AP 3 AP 3
Sweden SE 1,469 3,858 64 12,663
Switzerland CH 190 4,280 76 21,095
Syrian Arab Republic SY 2 1 -- 1
T F Y R of Macedonia MK 2 2 -- 6
Thailand TH 96 132 6,113 206
Togo TG OA 0 OA 3
Trinidad and Tobago TT 0 4 180 2
Tunisia TN 4 8 394 19
Turkey TR 705 1,016 296 814
Uganda UG AP 0 3 2
Ukraine UA 129 139 2,138 100
United Arab Emirates AE IB 77 1,383 77
United Kingdom GB 4,118 5,313 2,330 20,277
United Republic of Tanzania TZ AP 2 -- --
United States of America US 57,881 57,385 128,946 170,928
Uruguay UY n.a. 6 n.a. 11
Uzbekistan UZ 2 3 209 15
Venezuela (Bolivarian Republic of) VE n.a. 0 n.a. 12
Viet Nam VN 15 21 3,503 43
Yemen YE n.a. 1 n.a. --
Zambia ZM 0 0 22 --
Zimbabwe ZW 0 2 -- 1
Unknown n.a. 181 1,245 8,757
Total 218,000 218,000 595,400 595,400
-- indicates data are unknown;n.a. indicates not applicable, as it is not an office of a PCT member state; AP, CH, EP, IB and OA are the competent – designated, elected or receiving – offices for certain member states; PCT national phase entries by origin, world totals and PCT application data are WIPO estimates; and offices of destination are designated and/or elected offices.
Source: WIPO Statistics Database, May 2016.

84
ANNEXES
EPC European Patent ConventionEPO European Patent OfficeGPPH Global Patent Prosecution HighwayIB International Bureau of WIPOIP intellectual propertyIPC international patent classificationIPE international preliminary examinationIPEA international preliminary
examining authorityIPRP international preliminary report
on patentabilityISA international searching authorityISR international search reportJPO Japan Patent OfficeKIPO Korean Intellectual Property OfficeNPE national phase entryPCT Patent Cooperation TreatyPCT-PPH Patent Cooperation Treaty-Patent
Prosecution HighwayPCT-SAFE PCT-Secure Application
Filed ElectronicallyPDF portable document formatRO receiving office SAFE secure application filed electronicallySIPO State Intellectual Property Office of the
People’s Republic of ChinaSIS supplementary international searchSISA authority specified for supplementary
search (supplementary international searching authority)
SISR supplementary international search report
USPTO United States Patent and Trademark Office
WIPO World Intellectual Property Organization
XML extensible markup language
Acronyms

85
ANNEXES
Applicant: An individual or legal entity that files a patent application. There may be more than one applicant in an application. For PCT statistics, the place of residence of the first-named applicant is used to determine the origin of a PCT application.
Application: The procedure for requesting IP rights at a patent office which then examines the application and decides whether to grant protection. Also refers to a set of documents submitted to an office by the applicant.
Application abroad: See “Filing abroad”.
Authority specified for supplementary international search (SISA): An international searching author-ity (ISA) that provides a supplementary international search service – also known as a supplementary international searching authority (SISA).
Chapter I of the PCT: The provisions in the PCT that regulate the filing of PCT applications, the international searches and written opinions by ISAs, and the interna-tional publication of PCT applications – and that provide for the communication of PCT applications and related documents to designated offices.
Chapter II of the PCT: The provisions in the PCT that regulate the optional international preliminary examina-tion procedure.
Designated office: A national or regional office of, or acting for, a state designated in a PCT application under Chapter I of the PCT.
Designated state: A contracting state in which pro-tection for the invention is sought, as specified in the PCT application.
Elected office: The national or regional office of, or act-ing for, a state elected by the applicant under Chapter II of the PCT, where the applicant intends to use the results of the international preliminary examination.
Filing abroad: For statistical purposes, an applica-tion filed by a resident of a given state or jurisdiction with an IP office of another state or jurisdiction. For example, an application filed by an applicant domiciled in France with the Japan Patent Office (JPO) is con-sidered an application abroad from the perspective of France. This differs from a “non-resident application”, which describes an application filed by a resident of a foreign state or jurisdiction from the perspective of
the office receiving the application, so the example above would be a non-resident application from the JPO’s point of view.
Global Patent Prosecution Highway (GPPH): The GPPH pilot is a single multilateral agreement between a group of offices. It allows applicants to make a re-quest for accelerated processing at any participating office, based on work products from any of the other participating offices (including PCT reports), using a single set of qualifying requirements.
International application: See “PCT application”.
International authority: A national or regional patent office or international organization that fulfills specific tasks, as prescribed by the PCT.
International Bureau (IB) of WIPO: In the context of the PCT, the IB of WIPO acts as a receiving office for PCT applications from all contracting states. It also handles certain processing tasks for all PCT applica-tions filed with all receiving offices worldwide.
International filing date: The date on which the receiv-ing office receives a PCT application, provided certain formality requirements have been met.
International Patent Classification (IPC): An interna-tionally recognized patent classification system, the IPC has a hierarchical structure of language-independent symbols and is divided into sections, classes, subclass-es and groups. IPC symbols are assigned according to the technical features in patent applications. A patent application that relates to multiple technical features can be assigned several IPC symbols.
International phase of the PCT: The international phase consists of five main stages: 1. Filing of a PCT application by the applicant and its
processing by the receiving office.2. Establishment of an ISR and a written opinion by
an ISA.3. Publication of the PCT application and related
documents, as well as their communication to designated and elected offices by the IB.
4. Optional establishment of an SISR by a SISA.5. Optional establishment of an IPRP by an IPEA.
For further details on the international phase, see “A brief presentation of the Patent Cooperation Treaty”.
Glossary
86
ANNEXES
International preliminary examining authority (IPEA): A national or regional patent office appointed by the PCT Assembly to carry out international pre-liminary examination. Its task is to establish the IPRP (Chapter II of the PCT).
International preliminary report on patentability (Chapter II of the PCT) (IPRP): A preliminary non-binding opinion established by an IPEA at the request of the applicant, on whether the claimed invention appears to be novel, to involve an inventive step (is not obvious) and to be industrially applicable. Prior to January 1, 2004, this report was known as the
“International Preliminary Examination Report”.
International search report (ISR): A report estab-lished by an ISA containing citations of documents (prior art) considered relevant for determining, in par-ticular, the novelty and inventive step of the invention as claimed. The ISR also includes the classification of the subject matter of the invention and an indication of the fields searched as well as any electronic data-bases searched.
International searching authority (ISA): A national patent office or intergovernmental organization ap-pointed by the PCT Assembly to carry out international searches. ISAs establish ISRs and written opinions on PCT applications.
Invention: A new solution to a technical problem. To obtain patent rights, an invention must be novel, involve an inventive step and be industrially applicable, as judged by a person skilled in the art.
National phase entry (NPE): The national phase un-der the PCT follows the international phase of the PCT procedure and consists of the entry and processing of the international application in the individual countries or regions in which the applicant seeks protection for an invention. The entry must in general take place within 30 months from the priority date of the appli-cation, although longer time periods are allowed by some offices. National phase entry (NPE) involves the payment of fees and, where necessary, the submission of a translation of the PCT application.
Non-resident filing: For statistical purposes, a “non-resident” application refers to an application filed with the IP office of, or acting for, a state or jurisdiction in which the first-named applicant in the application is not domiciled. For example, an application filed with the
JPO by an applicant residing in France is considered a non-resident application from the perspective of the JPO. Non-resident applications are sometimes referred to as foreign applications.
Origin: For statistical purposes, the origin of an ap-plication means the country or territory of residence (or nationality, in the absence of a valid residence) of the first-named applicant in the application.
Paris Convention: The Paris Convention for the Protection of Industrial Property is an international convention signed in Paris (France) on March 20, 1883. It is one of the first and most important intellectual property treaties. The Paris Convention establishes, among other things, the “right of priority” principle, which enables a patent applicant to claim a priority of up to 12 months when filing an application in countries other than the original country of filing.
Paris route: Applications for patent protection filed directly with the national/regional office of, or acting for, the relevant state or jurisdiction (as opposed to the
“National phase under the PCT”). The Paris route is also called the “direct route” or “national route”.
Patent: An exclusive right granted by law to an ap-plicant for an invention for a limited period of time (generally 20 years from the time of filing). The pat-ent system is designed to encourage innovation by providing innovators with time-limited exclusive legal rights, which enables them to appropriate the returns from their innovative activity. In return, the applicant is obliged to disclose the invention to the public in a manner that enables others skilled in the art to replicate it. The patent system is also designed to balance the interests of applicants (exclusive rights) with the inter-ests of society (disclosure of the invention). Patents are granted by national or regional patent offices and are limited to the jurisdiction of the issuing authority. Patent rights can be sought by filing an application directly with the relevant national or regional office(s), or by filing a PCT application.
Patent Cooperation Treaty (PCT): An international treaty administered by WIPO, the PCT allows applicants to seek patent protection for an invention simultane-ously in a large number of countries (PCT contracting states) by filing a single PCT international application. The granting of patents, which remains under the con-trol of national or regional patent offices, is carried out in what is called the “national phase under the PCT”.

87
ANNEXES
PATENTSCOPE search system: Provides access, free of charge, to all published PCT applications along with their related documents, and to the national or regional patent collections from numerous offices worldwide. Since April 2006, the PATENTSCOPE search system is the authentic publication source of PCT applications.
PCT application: A patent application filed through the WIPO-administered PCT, also known as an inter-national application.
PCT-Patent Prosecution Highway Pilots (PCT-PPH): A number of bilateral agreements signed between pat-ent offices that enable applicants to request a fast-track examination procedure, whereby patent examiners can make use of the work products of another office or of-fices. These work products can include the results of a favorable written opinion by an international search-ing authority, the written opinion of an international preliminary examining authority or the international preliminary report on patentability issued within the framework of the PCT. By requesting this procedure, applicants can generally obtain patents from participat-ing offices more quickly.
PCT route: Patent applications filed or patents granted based on PCT international applications.
Prior art: All information disclosed to the public about an invention, in any form, before a given date. Information on the prior art can assist in determining whether the claimed invention is new and involves an inventive step (is not obvious) for the purposes of international searches and international preliminary ex-amination.
Priority date: The filing date of the application on the basis of which priority is claimed.
Publication of PCT application: The IB publishes the PCT application and related documents promptly after the expiration of 18 months from the priority date. If the PCT application is withdrawn or considered withdrawn before the technical preparations for publication are completed, the application is not published. An appli-cant can request early publication of a PCT application.
Receiving office (RO): A patent office – or the IB – with which the PCT application is filed. The role of the RO is to check and process the application in accordance with the PCT and its regulations.
Resident filing: For statistical purposes, a resident ap-plication refers to an application filed with the IP office of, or acting for, the state or jurisdiction in which the first-named applicant in the application has residence. For example, an application filed with the JPO by a resident of Japan is considered a resident application for the JPO. Resident applications are sometimes referred to as “domestic applications”.
Supplementary international searching authority (SISA): See “Authority specified for supplementary international search”.
Supplementary international search report (SISR): A report, similar to the ISR, established during the supplementary international search, that allows the applicant to request, in addition to the main interna-tional search, one or more supplementary international searches, each to be carried out by an international authority other than the ISA that carries out the main international search. The SIS primarily focuses on the patent documentation in the language in which the SISA specializes.
World Intellectual Property Organization (WIPO): A United Nations specialized agency dedicated to the promotion of innovation and creativity for the economic, social and cultural development of all coun-tries through a balanced and effective international IP system. Established in 1967, WIPO’s mandate is to promote the protection of IP throughout the world through cooperation among states and in collaboration with other international organizations.
Written opinion of the ISA (WOSA): For every PCT application filed on or after January 1, 2004, an ISA es-tablishes, at the same time that it establishes the ISR, a preliminary and non-binding written opinion on whether the claimed invention appears to be novel, to involve an inventive step and to be industrially applicable.

88
ANNEXES
In 2015, 148 countries were contracting states of the PCT.
Albania (EP)AlgeriaAngolaAntigua and BarbudaArmenia (EA)AustraliaAustria (EP)Azerbaijan (EA)BahrainBarbadosBelarus (EA)Belgium (EP)2
BelizeBenin (OA)2
Bosnia and Herzegovina1
Botswana (AP)BrazilBrunei DarussalamBulgaria (EP)Burkina Faso (OA)2
Cameroon (OA)2
CanadaCentral African Republic (OA)2
Chad (OA)2
ChileChinaColombiaComoros (OA)2
Congo (OA)2
Costa RicaCôte d’Ivoire (OA)2
Croatia (EP)CubaCyprus (EP)2
Czech Republic (EP)Democratic People’s Republic of KoreaDenmark (EP)
DominicaDominican RepublicEcuadorEgyptEl SalvadorEquatorial Guinea (OA)2
Estonia (EP)Finland (EP)France (EP)2
Gabon (OA)2
Gambia (AP)GeorgiaGermany (EP)Ghana (AP)Greece (EP)2
GrenadaGuatemalaGuinea (OA)2
Guinea-Bissau (OA)2
HondurasHungary (EP)Iceland (EP)IndiaIndonesiaIran (Islamic Republic of)Ireland (EP)2
IsraelItaly (EP)2
JapanKazakhstan (EA)Kenya (AP)Kyrgyzstan (EA)Lao People’s Democratic RepublicLatvia (EP)2
Lesotho (AP)Liberia (AP)LibyaLiechtenstein (EP)
Lithuania (EP)Luxembourg (EP)MadagascarMalawi (AP)MalaysiaMali (OA)2
Malta (EP)2
Mauritania (OA)2
MexicoMonaco (EP)2
MongoliaMontenegro1
Morocco3
Mozambique (AP)Namibia (AP)Netherlands (EP)2
New ZealandNicaraguaNiger (OA)2
NigeriaNorway (EP)OmanPanamaPapua New GuineaPeruPhilippinesPoland (EP)Portugal (EP)QatarRepublic of KoreaRepublic of Moldova4
Romania (EP)Russian Federation (EA)Rwanda (AP)Saint Kitts and NevisSaint LuciaSaint Vincent and the GrenadinesSan Marino (EP)
Sao Tome and Principe (AP)5
Saudi ArabiaSenegal (OA)2
Serbia (EP)SeychellesSierra Leone (AP)SingaporeSlovakia (EP)Slovenia (EP)2
South AfricaSpain (EP)Sri LankaSudan (AP)Swaziland (AP)2
Sweden (EP)Switzerland (EP)Syrian Arab RepublicTajikistan (EA)ThailandThe former Yugoslav Republic of Macedonia (EP)Togo (OA)2
Trinidad and TobagoTunisiaTurkey (EP)Turkmenistan (EA)Uganda (AP)UkraineUnited Arab EmiratesUnited Kingdom (EP)United Republic of Tanzania (AP)United States of AmericaUzbekistanViet NamZambia (AP)Zimbabwe (AP)
Note: 1 Extension of European patent possible. 2 May only be designated for a regional patent (the national route via the PCT has been closed). 3 Validation of European patent possible for international applications filed on or after March 1, 2015. 4 Validation of European patent possible for international applications filed on or after November 1, 2015. 5 Only PCT applications filed on or after August 19, 2014 will include the designation of Sao Tome and Principe for an ARIPO patent.
Where a state can be designated for a regional patent, the two-letter code for the regional patent concerned is indicated in parentheses (AP = ARIPO patent, EA = Eurasian patent, EP = European patent, OA = OAPI patent).
Source: WIPO, January 2016.
PCT Contracting States

89
ANNEXES
Additional ResourcesThe following patent resources are available on the WIPO website:
PATENTSCOPE – enables the search and download of published PCT applications and national/regional patent collections. It also provides access to related patent and technology information programs and services.www.wipo.int/patentscope
ePCT Portal – provides access to ePCT public and private services.https://pct.wipo.int
PCT resources – WIPO’s gateway to PCT resources for the public, applicants and offices.www.wipo.int/pct
PCT newsletter – PCT monthly magazine containing information about the filing of PCT applications and news about changes relating to the PCT.www.wipo.int/pct/en/newslett
PCT statistics – provides access to the IP Statistics Data Center (enabling access to WIPO’s statistical data), to the top PCT applicants list and to the electronic ver-sion of this review.www.wipo.int/ipstats
Law of patents – includes current and emerging issues related to patents, information on WIPO-administered treaties, access to national/regional patent laws, patent law harmonization.www.wipo.int/patents

Pat
ent
Co
op
erat
ion
Trea
ty Y
earl
y R
evie
w
For more information contact WIPO at www.wipo.int
World Intellectual Property Organization34, chemin des ColombettesP.O. Box 18CH-1211 Geneva 20Switzerland
Tel: + 4122 338 91 11Fax: + 4122 733 54 28
WIPO Publication No. 901E16
ISBN 978-92-805-2760-5 Eco
nom
ics
& S
tatis
tics
Ser
ies
2016