pat for the on-line characterization of continuous...
TRANSCRIPT
PAT for the On-line Characterization of Continuous Manufacturing Systems
Thomas O’Connor, Ph.D.
Office of Pharmaceutical Science
FDA/PQRI Conference: Innovation in Manufacturing and Regulatory Assessment September 16th, 2014
1

Outline
• Role of PAT for Continuous Manufacturing
• Process Monitoring
• Statistical Process Control (SPC)
• Lessons for SPC from Chemical Industry
• Real Time Release Testing
• Concluding Remarks
2

Process Analytical Technology
• Process analytical technology (PAT) is “a system for designing, analyzing, and controlling manufacturing through timely measurements (i.e., during processing) of critical quality and performance attributes of raw and in-process materials and processes, with the goal of ensuring final product quality” PAT Guidance
• PAT tools – Multivariate tools for design, data acquisition, and analysis
– Process analyzers
– Process control tools
– Continuous improvement and knowledge management tools
3

Role of PAT for Continuous Processes
• Process development – Continuous and fast response of process to factor changes allows
efficient experimentation – Increases process understanding within the range of conditions
studied during development
• Commercial Manufacturing – Process Monitoring
• Assure desired product quality is being consistently manufactured • Identify non-conforming material
– Real Time Release Testing (RTRT)
• Evaluate the quality of final product based a combination of measured material attributes and process controls, ICH Q8 R(2)
• Continuous manufacturing naturally lends itself to RTRT approaches
4

Sampling Considerations for PAT Measurements • Probe/sample location representative of the entire vessel
– Minimize the effect of the probe on the process
• Required measurement frequency based on process dynamics – Measurement resolution should sufficient for the detection of a
pulse of variability from a process disturbance
• Sample volume/mass – Representative of a unit dose
• Sample Interface – Remains constant during the process run (e.g., no fouling) – Environment factors (e.g., temperature, humidity)
• Evaluate reproducibility of online measurements – Include sampling considerations – On-line and in-line measurements may reduce but do not eliminate
sampling errors
5

Conceptual Implementation of PAT for Continuous Manufacturing
6
Receiving
Feeder
Blending Drying
Granulation
Blending
Feed Frame
Tablet Press Coating
Milling
At-line Chemical Properties & Physical Properties for Raw Materials
Concentration & Uniformity (Multi-component)
Particle size distribution Moisture content
Weight & Hardness Digital Imaging
Surrogate Dissolution
Model (release) Real-Time
Release Testing Online Assay
Chemometric model
Chemometric model
Raw material characterization, process data, & chemometric model outputs integrated into a supervisory control and data acquisition (SCADA) system

In-Process Control Requirements
• To assure batch uniformity in-process controls shall be established – CFR 211.110(a) – Examinations to be conducted on appropriate samples of in-process
materials for each batch • Requires higher frequency measurements for continuous processes
compared to batch processes – Controls shall monitor and validate the performance of the manufacturing
processes that may cause variability in the drug product
• Valid in-process specifications shall be consistent with the release specification – CFR 211.110(b) – Limits shall be derived from acceptable process variability estimates where
possible
• Rejected in-process materials shall be identified and isolated – CFR 211.110(d)
• PAT tools can utilized to meet the regulatory requirements for in-process monitoring – Approaches may include multivariate process monitoring
7

Approaches for Process Monitoring
• Statistical Quality Control (SQC) – Variability in quality attributes of the product are monitored over time – Appropriate limits are defined based on the statistical analysis of historical
operations – Does not guarantee that the process is in control (lagging indicator)
• Statistical Process Control (SPC) – The variability in critical process parameters are monitored over time – Monitoring the process expected to supply more information (e.g.,
detection and diagnosis) – May generate a large number of univariate control chart that need to be
monitored
• Multivariate Statistical Process Control (MSPC) – Takes advantage of correlations between process variables
– Reduces the dimensionality of the process into a set of independent variables
– May detect abnormal operations not observed by SPC
8
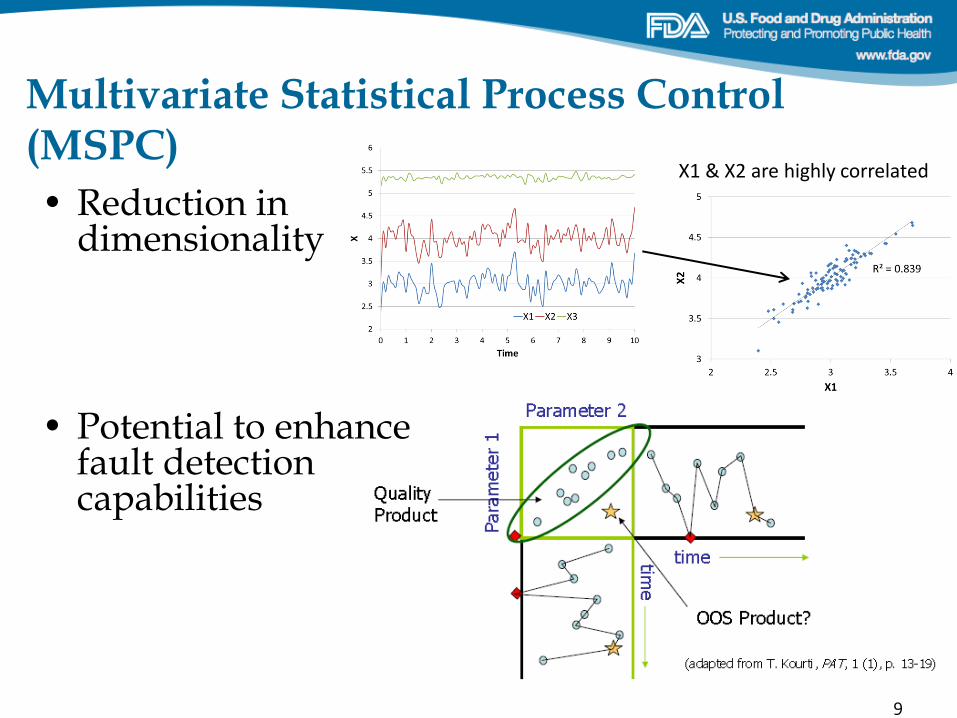
Multivariate Statistical Process Control (MSPC)
• Reduction in dimensionality
• Potential to enhance fault detection capabilities
9
X1 & X2 are highly correlated

Control Strategy Implementation
• Process monitoring strategy may depend upon control strategy implementation
• MSPC strategy may be more suitable for Level 1 and 2 control strategies
10
Level 3 End product testing + tightly constrained material
attributes and process parameters
Level 2 Reduced end product testing + Flexible
CMA & CPP within design space
Level 1 Real-time automatic
control + Flexible CPPs to respond to variability in CMAs
Control Strategy Implementation Options1
1. Yu, L et. al. AAPS J. 2014 Vol. 16 771-783

Multivariate Methods
• Latent Variable Models – Process data and product quality data are decomposed into scores (T) and
loading (P, W) • X= 𝑇𝑃𝑇 + 𝐸 • Y= 𝑇𝑄𝑇 + 𝐸
– Scores are related to samples and represent the projection of each sample into the space defined by the new latent variables
– Loading are related to variables and represent the relationship between the process variables and the new latent variables
• Principal Component Analysis (PCA) – Determines the latent variables that maximize the variation in process data
captured by the model – Well suited for process monitoring applications
• Partial Least Squares (PLS) – Determines the latent variable that maximizes the correlation between the
process and product quality data – Well suited for predicting quality attributes from process data (e.g. soft
sensors, surrogate models etc.)
11
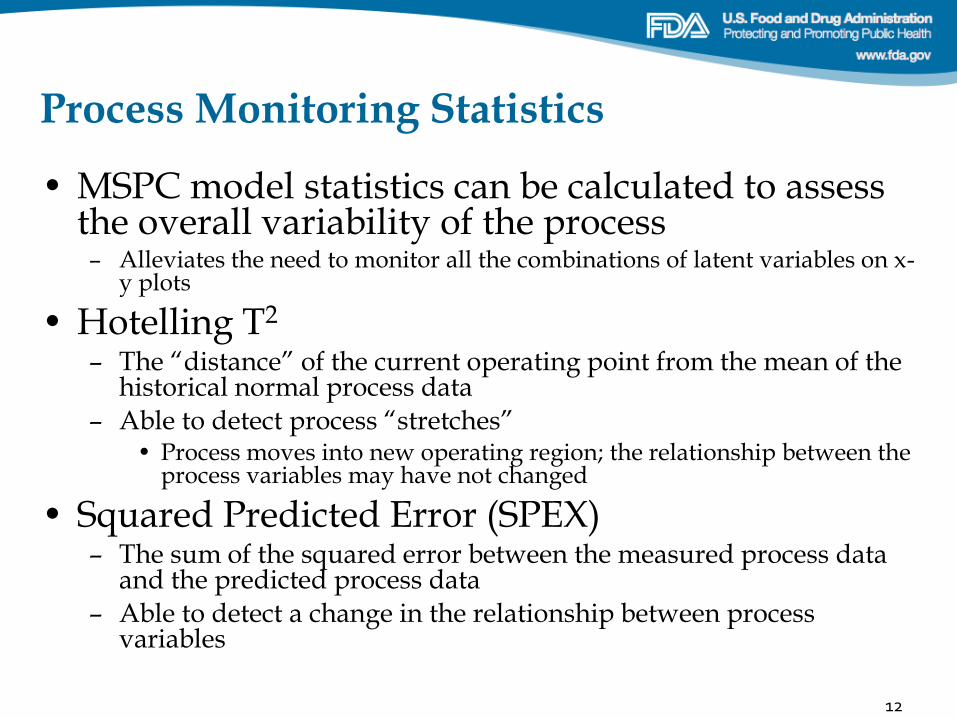
Process Monitoring Statistics
• MSPC model statistics can be calculated to assess the overall variability of the process – Alleviates the need to monitor all the combinations of latent variables on x-
y plots
• Hotelling T2
– The “distance” of the current operating point from the mean of the historical normal process data
– Able to detect process “stretches” • Process moves into new operating region; the relationship between the
process variables may have not changed
• Squared Predicted Error (SPEX) – The sum of the squared error between the measured process data
and the predicted process data – Able to detect a change in the relationship between process
variables
12

• Hotelling T2 – Sum of the squared score values normalized by the amount of variation captured by
each latent variable; 𝑇2 = 𝑡2𝑖𝜆𝑖 𝐴
𝑖=1
• Squared Predicted Error – Sum of the squared error between the model predicted and measured process
variables; SPEX= 𝑥𝑚 − 𝑥𝑝 2𝑛
𝑖=1
Diagnosing Process Faults
13

Perspective on MSPC for Continuous Processes from Chemical Industry • Statistical Quality Control routinely utilized to
assess performance of on-line analyzers – Focus on analyzers used to control end product quality – Control charts plot the error between on-line and periodic off-line
measurements
• MSPC utilized for process fault detection to address process safety and reliability issues – Complementary to the alarm and advance control systems
• Considerations for the implementation of MSPC for continuous process – Variable selection for MSPC models – Data selection for building MSPC models – Variable manipulations – MSPC model validation – On-line implementation
14

Variable Selection for MSPC Models
• Utilize process knowledge to select variables – Risk assessment approaches may be used to identify failure modes
– Identify process variables that signal each failure mode
• Examine process variable cross-correlation matrix – Statistical approach used to identify process variables that are related
– Dependent upon the process data selected for analysis
• Investigate control variables as well as process variables – Tightly controlled process variables typically provide little information
– Information may be contained in the manipulated variable (e.g., valve opening etc.)
15
L
The % valve opening contains information about the variation in the process

Data Selection for MSPC Model Building
• Historical data utilized should capture the normal variations expected during the process lifecycle
– Should include data from routine operations (e.g. feeder refills, etc.)
• Process data from disturbances should be removed from the model building data set
• Minimize amount of steady-state data included in the model building data set
– Steady state data masks the relationship between variables
– Variation is mostly due to noise
– Statistic filters can be used to remove steady state data
16
Majority of variation reflects noise
Majority of variation reflects physical relationship
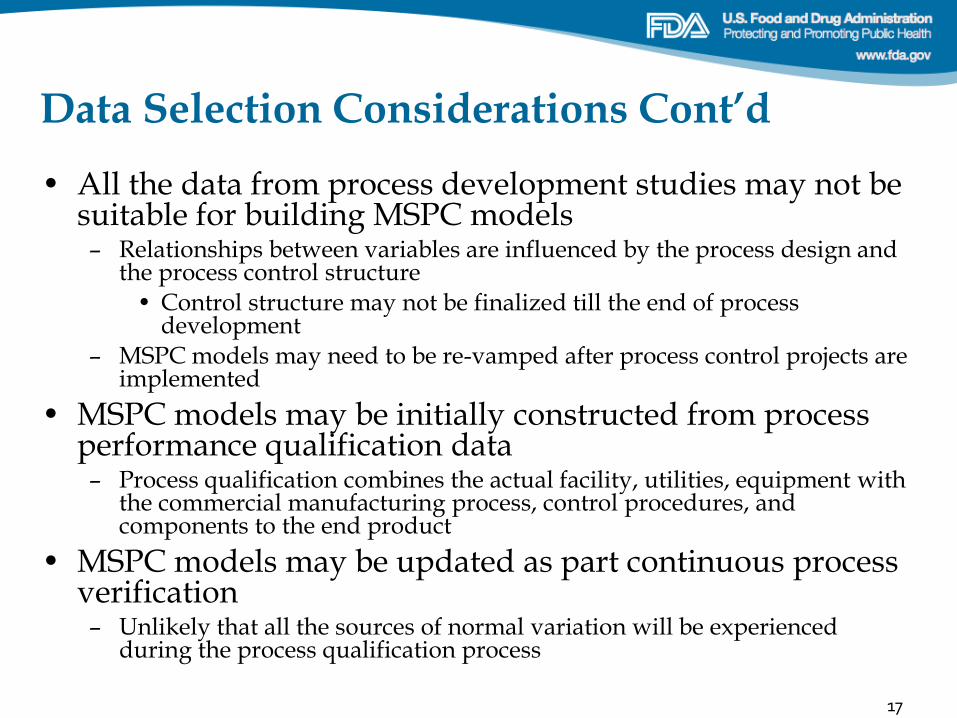
Data Selection Considerations Cont’d
• All the data from process development studies may not be suitable for building MSPC models – Relationships between variables are influenced by the process design and
the process control structure • Control structure may not be finalized till the end of process
development – MSPC models may need to be re-vamped after process control projects are
implemented
• MSPC models may be initially constructed from process performance qualification data – Process qualification combines the actual facility, utilities, equipment with
the commercial manufacturing process, control procedures, and components to the end product
• MSPC models may be updated as part continuous process verification – Unlikely that all the sources of normal variation will be experienced
during the process qualification process
17

Considerations for Variable Transformations • Process data is typically auto-scaled
– Mean-centered to focus on variation (i.e. 𝑥 =0)
– Scaled by the standard deviation to equally weight each variable (i.e. s=1)
• The mean and std. dev. of each process variable is calculated from the model building data set
• A constant mean may not be suitable for monitoring a continuous process
– Filter mean to remove the impact of slow process shifts or a change in operating condition (e.g., high vs low flow rates)
– Filter constant should be based on the process time constant
– Do not utilize mean updating to monitor long term issues (e.g., catalyst aging, fouling)
18
Increased sensitivity over a process run

Variable Transformations Cont’d
• Weight variables to increase or decrease their influence in the MSPC model
– Considering increasing the weight of variables that are early indicators of faults identified by the risk analysis
– Considering decreasing the weight of redundant measurements (e.g., multiple temperature measurements in an unit operation)
– Equivalent to manipulating the standard deviation for the process variable
• PCA/PLS multivariate models are linear – Utilize transformation to incorporate non-linear relationship
• PCA/PLS multivariate models are static – Need to compensate for time lags for upstream and downstream process variables
19
The MSPC models should utilize the dynamically compensated variable

MSPC Model Validation
• Utilize independent data sets for validation studies • Validate models with normal operating data
– Goal is to minimize false positive alerts
• Validate models with operating data during process disturbances (if available) – Assess detection ability and timing for process faults
• Distribution of process diagnostic statistics have “fat tails” – Better performance obtained by setting SPEX and T2 limits based on
validation studies rather than the std. dev. obtained form normal operating data
– Minimizes false positives with minimal impact on detection capability or detection timing
20
On-line Implementation Considerations
• Ensure reading of process variables are synchronized – Facilitated be integrating all process and quality data into a single source
(e.g., process historian, supervisory control system, etc.)
• Ensure process data are not compressed – Process historians may utilize compression for storing data – Data compression can mask the relationship between process variables
• Need to account for missing and bad data – May be able to use model estimates for the missing data – Need to establish criteria when the status of the model will become bad
(e.g., number of bad inputs, missing critical inputs) – Utilize bumpless transfers when missing process data becomes available
• Incorporate MSPC model into the Quality Management System – Establish work process for responding to alerts – Establish work process for assessing the health of the MSPC model
21

Relationship between RTRT, Process Monitoring, and PAT
• Real-time-release-testing (RTRT), when used, is part of the Control Strategy – Can include some or all of then finale product CQAs
• Science and risk based approaches generally required for both MSPC and RTRT
• Not all Process Analytical Technology leads to RTRT – PAT systems can be designed to control CQAs of raw materials or in-
process materials and not contribute to RTRT – Some PAT tools may be utilized for both process monitoring and RTRT
• MSPC approaches that establish a process signature are an evolving approach for RTRT
22

Benefits of RTRT
• Provides for increased assurance of quality – More process data collected
• Provides increased manufacturing flexibility and efficiency – Shorter cycle time – Reduced inventory – Reduction in end product testing – Reduction in manufacturing costs
23

Consideration for the Point of Testing
• Is there a potential for the measured CQA to change downstream from the measurement point? For example, – Blend desegregation – Loss of weight (e.g., chipping) after weighting step – Hydrolytic degradation during aqueous film coating
• Is identity determined at a point that is visually unique? – Mitigation of potential human and/or system error – Unique identifiers on the intermediate when measured (e.g.,
embossing, size, shape)
• Risk assessment is valuable to exploring potential failure modes
24

Considerations for RTRT Specification
• Specification still required in an RTRT approach – (CFR 314.50(d) and CFR 211.165(a))
• Should be representative of actual measurement – Can include in-process measurements (e.g., NIR measurements for
assay of uncoated tablets) – Can include surrogate measurements (e.g., models for dissolution) – Methods should be appropriately validated (including models used
as surrogate measurements)
• Alternatives can be included for stability testing • Utilization of appropriate statistical criteria for
large sample sizes
25

Concluding Remarks
• Continuous manufacturing process facilitate the adoption of PAT tools for the development of process understanding, process monitoring, and real time release testing
• PAT may required to meet the regulatory requirements for in-process monitoring
• MSPC offers several advantages over univariate monitoring of process data
• MSPC is a complementary process control tool to an automatic process control system
• MSPC approaches that establish a process signature are an evolving approach for RTRT
26