past to future south atlantic meridional overturning ... · oceanographic institute –university...
TRANSCRIPT

Oceanographic Institute – University of São Paulo, Brazil 1/42Fernanda Marcello and Ilana Wainer
Past to future South Atlantic Meridional Overturning
Circulation:
pathways and low-frequency variability
Oceanographic Institute -- University of São Paulo, Brazil (IO-USP)
Laboratory of Physical Oceanography, Climate and Cryosphere
2018 International AMOC Science Meeting
July, 26.
Fernanda Marcello and Ilana Wainer

Oceanographic Institute – University of São Paulo, Brazil 2/42Fernanda Marcello and Ilana Wainer
AMOC:
Wind-driven + Thermohaline
• Near-surface currents are required to close the flow.
• Wind-driven gyres can alter the pathways and time
scales of AMOC variability.
Rick Lumpkin (NOAA/AOML)
INTRODUCTION

Oceanographic Institute – University of São Paulo, Brazil 3/42Fernanda Marcello and Ilana Wainer
The South Atlantic Ocean:
• Upper limb of
the AMOC
• Subtropical
gyre
circulation
+
Rick Lumpkin (NOAA/AOML)
INTRODUCTION

Oceanographic Institute – University of São Paulo, Brazil 4/42Fernanda Marcello and Ilana Wainer
The South Atlantic Ocean:
the only ocean in which the heat transport is directed from the
poles towards the equator;
intermittent supply of heat and salt received from the Indian Ocean;
The Agulhas leakage pre-conditions the Atlantic as a site of major MOC.
~Arnold Gordon
strategic location // critical crossroad for the AMOC.
the only basin which is in direct contact with all the other major
oceans;
Beal et al. (2011)
Trenberth and Caron (2001)
it connects the source region of the most abundant deep water
found in the global oceans – the NADW – to the rest of the ocean
basins;
INTRODUCTION
The SAO is not just a passive conduit for the transit of remotely formed water
masses, but instead actively participates in their transformation.Garzoli and Matano (2011)

Oceanographic Institute – University of São Paulo, Brazil 5/42Fernanda Marcello and Ilana Wainer
The South Atlantic Ocean:
Pattern of gyre-scale flow is strongly influenced by
interocean connections:
Impacts
on the SASG
External
forcings
Boundary
currents
variability
• Brazil Current Weak among global WBCs
Transport is directed northwardEvans & Signorini (1985)
Stramma et al. (1990)
Peterson & Stramma (1999)
Lynne Talley (2011)
INTRODUCTION

Oceanographic Institute – University of São Paulo, Brazil 6/42Fernanda Marcello and Ilana Wainer
The South Atlantic Ocean:
Rick Lumpkin (NOAA/AOML)
DWF upper limb inflow
INTRODUCTION

Oceanographic Institute – University of São Paulo, Brazil 7/42Fernanda Marcello and Ilana Wainer
The South Atlantic Ocean:
Rick Lumpkin (NOAA/AOML)
DWF upper limb inflow SASG circulation AMOC variations
INTRODUCTION
+ boundary currents

Oceanographic Institute – University of São Paulo, Brazil 8/42Fernanda Marcello and Ilana Wainer
The South Atlantic Ocean:
Rick Lumpkin (NOAA/AOML)
DWF upper limb inflow SASG circulation AMOC variations
INTRODUCTION
+ boundary currents

Oceanographic Institute – University of São Paulo, Brazil 9/42Fernanda Marcello and Ilana Wainer
The South Atlantic Ocean:
Rick Lumpkin (NOAA/AOML)
INTRODUCTION

Oceanographic Institute – University of São Paulo, Brazil 10/42Fernanda Marcello and Ilana Wainer
The South Atlantic Ocean:
Rick Lumpkin (NOAA/AOML)
INTRODUCTION

Oceanographic Institute – University of São Paulo, Brazil 11/42Fernanda Marcello and Ilana Wainer
The South Atlantic Ocean:
Rick Lumpkin (NOAA/AOML)
INTRODUCTION

Oceanographic Institute – University of São Paulo, Brazil 12/42Fernanda Marcello and Ilana Wainer
The South Atlantic Ocean:
Rick Lumpkin (NOAA/AOML)
SBL
SBL = sSEC bifurcation latitude
division
between both
large-scale
regimes* sSEC = southern branch of the South Equatorial Current
INTRODUCTION

Oceanographic Institute – University of São Paulo, Brazil 13/42Fernanda Marcello and Ilana Wainer
NBUC Equator NH
INTRODUCTION

Oceanographic Institute – University of São Paulo, Brazil 14/42Fernanda Marcello and Ilana Wainer
NBUC Equator NH
BC
INTRODUCTION

Oceanographic Institute – University of São Paulo, Brazil 15/42Fernanda Marcello and Ilana Wainer
NBUC Equator NH
BC SASG
INTRODUCTION

Oceanographic Institute – University of São Paulo, Brazil 16/42Fernanda Marcello and Ilana Wainer
~15ºS sSECm
n
m=n
A
x
y
SBL
NBUC
BC
north of
15ºSsSEC
m
n
m<n
B
SBL
NBUC
BC
south of
15ºS
sSECm
n
m>n
C
SBL
NBUC
BC
NBUC Equator NH
BC SASG
INTRODUCTION

Oceanographic Institute – University of São Paulo, Brazil 17/42Fernanda Marcello and Ilana Wainer
~15ºS sSECm
n
m=n
A
x
y
SBL
NBUC
BC
sSEC
m
n
m<n
B
SBL
NBUC
BC
south of
15ºS
sSECm
n
m>n
C
SBL
NBUC
BC
NBUC Equator NH
BC SASG
INTRODUCTION

Oceanographic Institute – University of São Paulo, Brazil 18/42Fernanda Marcello and Ilana Wainer
~15ºS sSECm
n
m=n
A
x
y
SBL
NBUC
BC
north of
15ºSsSEC
m
n
m<n
B
SBL
NBUC
BC
south of
15ºS
sSECm
n
m>n
C
SBL
NBUC
BC
NBUC Equator NH
BC SASG
INTRODUCTION

Oceanographic Institute – University of São Paulo, Brazil 19/42Fernanda Marcello and Ilana Wainer
~15ºS sSECm
n
m=n
A
x
y
SBL
NBUC
BC
north of
15ºSsSEC
m
n
m<n
B
SBL
NBUC
BC
south of
15ºS
sSECm
n
m>n
C
SBL
NBUC
BC
NBUC Equator NH
BC SASG
INTRODUCTION

Oceanographic Institute – University of São Paulo, Brazil 20/42Fernanda Marcello and Ilana Wainer
~15ºS sSECm
n
m=n
A
x
y
SBL
NBUC
BC
north of
15ºSsSEC
m
n
m<n
B
SBL
NBUC
BC
sSECm
n
m>n
C
SBL
NBUC
BC
NBUC Equator NH
BC SASG
INTRODUCTION

Oceanographic Institute – University of São Paulo, Brazil 21/42Fernanda Marcello and Ilana Wainer
~15ºS sSECm
n
m=n
A
x
y
SBL
NBUC
BC
north of
15ºSsSEC
m
n
m<n
B
SBL
NBUC
BC
south of
15ºS
sSECm
n
m>n
C
SBL
NBUC
BC
NBUC Equator NH
BC SASG
INTRODUCTION

Oceanographic Institute – University of São Paulo, Brazil 22/42Fernanda Marcello and Ilana Wainer
~15ºS sSECm
n
m=n
A
x
y
SBL
NBUC
BC
north of
15ºSsSEC
m
n
m<n
B
SBL
NBUC
BC
south of
15ºS
sSECm
n
m>n
C
SBL
NBUC
BC
NBUC Equator NH
BC SASG
INTRODUCTION

Oceanographic Institute – University of São Paulo, Brazil 23/42Fernanda Marcello and Ilana Wainer
Model simulation results:
I) single-realization -- the ocean component (CESM-POP2) ------> 1970-2015
II) 10-member ensemble -- the Last Millennium experiment (CESM-LME) ------> 850-2005
III) 33-member ensemble -- the Large Ensemble project (CESM-LEns) ------> 1920-2100
The Community Earth System Model:
** with small random round-off (order 10-14 K) differences in
the air temperature field at the start of each ensemble member
((coupled ocean-atmosphere realizations ))
(Time)
((single-model ensemble approaches))

Oceanographic Institute – University of São Paulo, Brazil 24/42Fernanda Marcello and Ilana Wainer
Model simulation results:• The ocean component of the Community Earth System Model: POP2
forced with Coordinated Ocean-Ice Reference Experiments (CORE-II)
[1970 -- 2015]
(interannually varying atmospheric data set)
Marcello et al. (2018) - JGR
Large and Yeager (2009)
Danabasoglu et al. (2012)

Oceanographic Institute – University of São Paulo, Brazil 25/42Fernanda Marcello and Ilana Wainer
Model simulation results:
Marcello et al. (2018) - JGR
[1970 -- 2015]• The ocean component of the Community Earth System Model: POP2
forced with Coordinated Ocean-Ice Reference Experiments (CORE-II)(interannually varying atmospheric data set) Large and Yeager (2009)
Danabasoglu et al. (2012)

Oceanographic Institute – University of São Paulo, Brazil 26/42Fernanda Marcello and Ilana Wainer
Model simulation results:
Increased:
# Wind stress curl,
Marcello et al. (2018) - JGR
[1970 -- 2015]• The ocean component of the Community Earth System Model: POP2
forced with Coordinated Ocean-Ice Reference Experiments (CORE-II)(interannually varying atmospheric data set) Large and Yeager (2009)
Danabasoglu et al. (2012)

Oceanographic Institute – University of São Paulo, Brazil 27/42Fernanda Marcello and Ilana Wainer
Model simulation results:
Increased:
# Wind stress curl,
# Sea surface height and
Marcello et al. (2018) - JGR
[1970 -- 2015]• The ocean component of the Community Earth System Model: POP2
forced with Coordinated Ocean-Ice Reference Experiments (CORE-II)(interannually varying atmospheric data set) Large and Yeager (2009)
Danabasoglu et al. (2012)

Oceanographic Institute – University of São Paulo, Brazil 28/42Fernanda Marcello and Ilana Wainer
Model simulation results:
Increased:
# Wind stress curl,
# Sea surface height and
# Barotropic stream function
within the limits of the gyre.Marcello et al. (2018) - JGR
[1970 -- 2015]• The ocean component of the Community Earth System Model: POP2
forced with Coordinated Ocean-Ice Reference Experiments (CORE-II)(interannually varying atmospheric data set) Large and Yeager (2009)
Danabasoglu et al. (2012)

Oceanographic Institute – University of São Paulo, Brazil 29/42Fernanda Marcello and Ilana Wainer
Model simulation results:
SASG boundaries
shift southward: Zonally averaged
maximums
increase:
Zonally averaged
maximums
shift southward:
MODEL SIMULATION RESULTS – CESM-POP2 (1970-2015)
Marcello et al. (2018) - JGR

Oceanographic Institute – University of São Paulo, Brazil 30/42Fernanda Marcello and Ilana Wainer
Model simulation results:
SASG boundaries
shift southward: Zonally averaged
maximums
increase:
Zonally averaged
maximums
shift southward:
MODEL SIMULATION RESULTS – CESM-POP2 (1970-2015)
Marcello et al. (2018) - JGR

Oceanographic Institute – University of São Paulo, Brazil 31/42Fernanda Marcello and Ilana Wainer
Model simulation results:
• Southward
migration
MODEL SIMULATION RESULTS – CESM-POP2 (1970-2015)
sSEC bifurcation latitude at 25 m: sSEC bifurcation latitude at 100 m:
Marcello et al. (2018) - JGR

Oceanographic Institute – University of São Paulo, Brazil 32/42Fernanda Marcello and Ilana Wainer
Model simulation results:
MODEL SIMULATION RESULTS – CESM-POP2 (1970-2015)
Marcello et al. (2018) - JGR

Oceanographic Institute – University of São Paulo, Brazil 33/42Fernanda Marcello and Ilana Wainer
Model simulation results:
• The Community Earth System Model – Last Millennium Experiment (CESM-LME)
> 10 ensemble members with the full-set of external forcings
[850 -- 1850] Otto-Bliesner et al. (2016)

Oceanographic Institute – University of São Paulo, Brazil 34/42Fernanda Marcello and Ilana Wainer
Model simulation results:
MODEL SIMULATION RESULTS – CESM-LME (850-2005)

Oceanographic Institute – University of São Paulo, Brazil 35/42Fernanda Marcello and Ilana Wainer
Model simulation results: WSC SST
SSH BSF
850-1850 = 1000 years
1850-2005 = 155 years
1980-2005 = 25 years
MODEL SIMULATION RESULTS – CESM-LME (850-2005)

Oceanographic Institute – University of São Paulo, Brazil 36/42Fernanda Marcello and Ilana Wainer
Model simulation results:
MODEL SIMULATION RESULTS – CESM-LME (850-2005)
Oceanographic Institute – University of São Paulo, Brazil 37/42Fernanda Marcello and Ilana Wainer
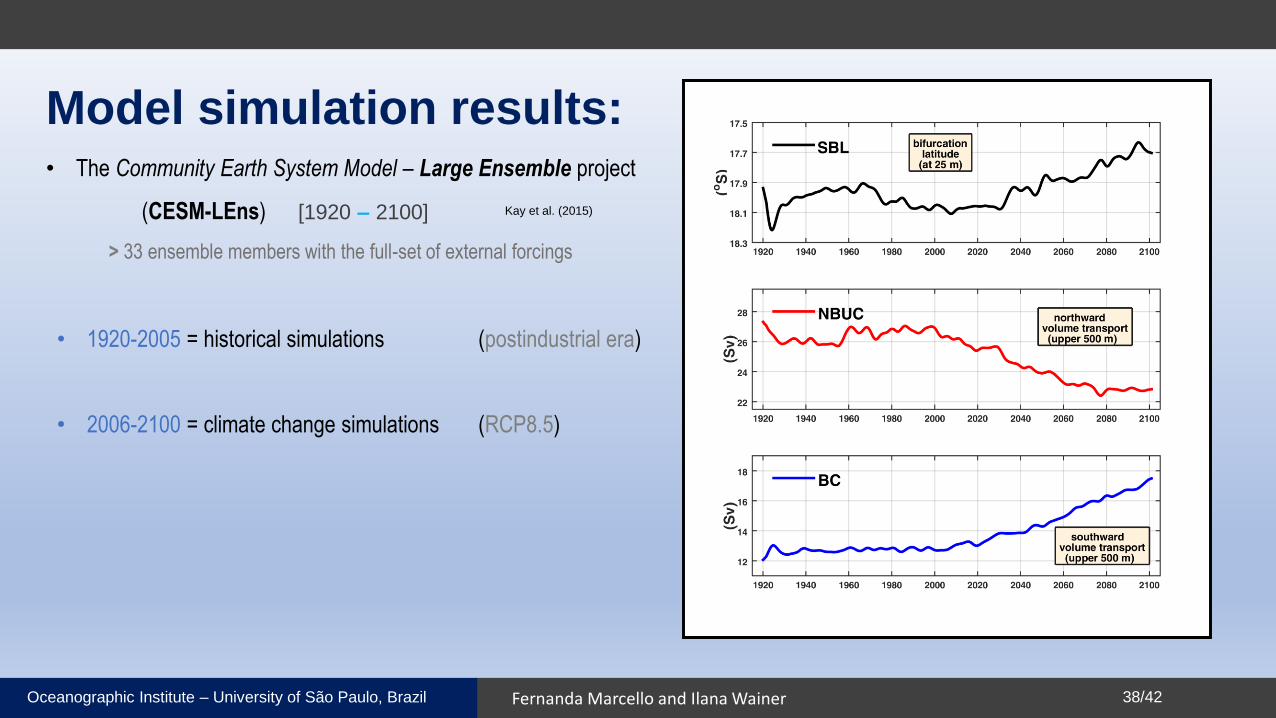
• The Community Earth System Model – Large Ensemble project
(CESM-LEns)
> 33 ensemble members with the full-set of external forcings
[1920 – 2100]
Model simulation results:
Kay et al. (2015)
• 1920-2005 = historical simulations (postindustrial era)
• 2006-2100 = climate change simulations (RCP8.5)
Oceanographic Institute – University of São Paulo, Brazil 38/42Fernanda Marcello and Ilana Wainer
• The Community Earth System Model – Large Ensemble project
(CESM-LEns)
> 33 ensemble members with the full-set of external forcings
[1920 – 2100]
Model simulation results:
Kay et al. (2015)
• 1920-2005 = historical simulations (postindustrial era)
• 2006-2100 = climate change simulations (RCP8.5)

Oceanographic Institute – University of São Paulo, Brazil 39/42Fernanda Marcello and Ilana Wainer
• The Community Earth System Model – Large Ensemble project
(CESM-LEns)
> 33 ensemble members with the full-set of external forcings
[1920 – 2100]
Model simulation results:
Kay et al. (2015)

Oceanographic Institute – University of São Paulo, Brazil 40/42Fernanda Marcello and Ilana Wainer
MODEL SIMULATION RESULTS – CESM-LEns (1920-2100)

Oceanographic Institute – University of São Paulo, Brazil 41/42Fernanda Marcello and Ilana Wainer
MODEL SIMULATION RESULTS – CESM-POP2 / CESM-LME / CESM-LEns 1970-2015 / 850-2005 / 1920-2100

Oceanographic Institute – University of São Paulo, Brazil 42/42Fernanda Marcello and Ilana Wainer
Conclusions // The take-home message:
Variations in the South Atlantic subtropical
gyre circulation might reflect variations in the
upper-limb of the AMOC and vice-versa;
Coupled
large-scale
features
Subtropical
gyre
circulation
Insights on
the
upstream
flow
DWF regionwarm + cold
routes
sSEC
bifurcation
latitude
how much waters veering
north/southward??

Oceanographic Institute – University of São Paulo, Brazil 43/42Fernanda Marcello and Ilana Wainer
Thank you! ☺
Oceanographic Institute of the
University of São Paulo