past and present vessel traffic through the straits of ...japan)(imo-kl meeting).pdf · survey of...
TRANSCRIPT
Survey of Traffic Volume through the Straits of Malacca and SingaporeSurvey of Traffic Volume through the Straits of Malacca and Singapore
PRESENTED AT Kuala Lumpur Meeting
on the straits of Malacca and Singapore 19 September, 2006 Kuala Lumpur
Kenji NAGAMATSUMaritime Bureau
Ministry of Land, Infrastructure and Transport
Past and Present Vessel Traffic through the Straits of Malacca and Singapore ー Trend Analysis in the Decade 1994-2004 ー

2
Survey of Traffic Volume through the Straits of Malacca and SingaporeSurvey of Traffic Volume through the Straits of Malacca and Singapore
Ⅰ Aim of Survey of Traffic Volume through the Straits
(1) In 1960s, traffic volume of Japanese vessels was dominant.
(2) Recent economic growth of Asian countries changed the situation significantly, both in total traffic volume and share of user states.
(3) Estimation of traffic volume contributes to discussions about international cooperation.
(Burden-Sharing)
MLITMLIT

Survey of Traffic Volume through the Straits of Malacca and SingaporeSurvey of Traffic Volume through the Straits of Malacca and Singapore
(1) Estimation of 2004 traffic volume(2) Estimation of 1994 traffic volume・ Estimate 1994 traffic volume data based on
the same method as Estimation of 2004 traffic volume ⇒Compare 2004 data with 1994 date⇒Analyze trend
(3) Forecast of the future traffic volume: scheduled to be completed early 2007 ・ Forecast of future traffic volume by simulation*This Survey is conducted by MLIT and the
Nippon Foundation.
Ⅱ Whole Picture of Survey
MLITMLIT

Survey of Traffic Volume through the Straits of Malacca and SingaporeSurvey of Traffic Volume through the Straits of Malacca and Singapore
Ⅲ Method of Survey
Data for 1994 and 2004, presented by LMIU (Lloyd’s Marine Intelligence Unit)
[Estimation route](1994) The date of 440,452 vessels movements
(2004) The date of 606,911 vessels movements
(Only “Ocean Going Vessels”of 100GT or more.)
[Estimation result](1994) The date of 75,061 vessels through the Straits(2004) The date of 93,757 vessels through the Straits
[Analysis]・By Ship types
・By Flag state, Parent company’s nationality
・By Last calling port’s Nationality before entering/leaving the Straits,First calling port’s Nationality after entering/leaving the Straits

Survey of Traffic Volume through the Straits of Malacca and SingaporeSurvey of Traffic Volume through the Straits of Malacca and Singapore
① Passing through the Straits② Going from westbound to ports in the Straits③ Going from ports in Straits to westbound④ Going From eastbound/southbound to ports in the Straits⑤ Going from ports in the Straits to eastbound/southbound
Ⅳ Concept of Traffic Volume through the Straits

Survey of Traffic Volume through the Straits of Malacca and SingaporeSurvey of Traffic Volume through the Straits of Malacca and Singapore
Ⅴ-1(1) Number and Tonnage (D.W.) of vessels by Ship types
(1.28)(43)(33)
1.59 3,989,3212,503,7551.25 93,75575,061GRAND TOTAL
(0.12)(3)(24)
0.26 14,18053,9982.24 5,0382,245OTHERS
(1.08)(9)(9)
0.66 133,560202,5270.61 14,06423,080CARGO VESSEL
(0.93)(35)(38)
1.24 138,636111,7391.34 3,9332,935LNG/LPG
(1.16)(57)(49)
1.54 772,555503,1761.32 13,59910,280BULK CARRIER
(1.01)(13)(13)
1.48 59,77140,4681.46 4,4543,041RORO CARGO CARRIER
(1.31)(34)(26)
2.54 1,013,552399,5081.94 29,67215,295CONTAINER VESSEL
(1.23)(81)(66)
1.56 1,857,0671,192,3391.26 22,99518,185TANKER VESSEL
Rate of increase20041994Rate of increase20041994
(Average D.W.(1000M/T))
Tonnage of vessels (D.W.)(1000M/T)Number of vessels
SHIPTYPES

Survey of Traffic Volume through the Straits of Malacca and SingaporeSurvey of Traffic Volume through the Straits of Malacca and Singapore
Ⅴ-1(2) Tonnage (D.W.) of vessels by Ship types
①1994 ②2004
D.W.
OTHERS0.4%LNG/LPG
3.5%BULK
CARRIER
19.4%
RORO
CARGO
CARRIER1.5%
TANKER
VESSEL
46.6%
CARGO
VESSEL
3.3%
CONTAINER
VESSEL
25.4%
D.W
OTHERS
2.2%LNG/LPG
4.5%
BULK
CARRIER
20.1%
RORO
CARGO
CARRIER
1.6%
TANKER
VESSEL
47.6%
CARGO
VESSEL
8.1%
CONTAINER
VESSEL
16.0%

Survey of Traffic Volume through the Straits of Malacca and SingaporeSurvey of Traffic Volume through the Straits of Malacca and Singapore
Ⅴ-2(1) Tonnage (D.W.) of vessels by Flag State
①1994 ②2004
D.W.
Cyprus
3.7%Greece
4.4%
Bahamas
5.2%
China
7.1%
Singapore
8.5%
Norway
2.9%
Marshall Islands
3.3%
Panama
20.3%Others
25.9%
Malta
7.1%
Liberia
11.6%
D.W.
Germany
2.7%
Bahamas
3.2%
Marshall Islands
5.0%
Singapore
8.2%
China
8.4%Malta
2.4%
Cyprus
2.5%
Panama
27.8%
Others
24.9%
Greece
4.6%
Liberia
10.2%

Survey of Traffic Volume through the Straits of Malacca and SingaporeSurvey of Traffic Volume through the Straits of Malacca and Singapore
Ⅴ-2(1) Tonnage (D.W.) of vessels by Flag State
100.0%3,989,321100.0%2,503,755Grand Total
0.9%36,8740.4%9,737French Southern Ter.20
1.0%38,1181.2%30,419Korea19
1.0%39,5770.5%12,819Iran18
1.3%51,3880.7%18,743Isle of Man17
1.3%53,2091.2%29,742United Kingdom16
1.6%65,7042.9%72,764Norway15
1.8%70,2441.9%48,504India14
1.9%76,2221.8%44,011Japan13
2.0%78,9791.3%31,354Malaysia12
2.0%80,9850.3%7,009Denmark11
2.4%93,7527.1%177,194Malta10
2.5%101,1453.7%93,628Cyprus9
2.7%109,0550.7%18,215Germany8
3.2%127,3145.2%129,305Bahamas7
4.6%182,7194.4%110,822Greece6
5.0%201,2273.3%81,406Marshall Islands5
8.2%328,1608.5%213,892Singapore4
8.4%334,6967.1%177,618China3
10.2%408,30311.6%291,081Liberia2
27.8%1,108,02520.3%508,420Panama1
Share(%)2004Share(%)1994
D.W.(1,000M/T)Flag StateNo.

Survey of Traffic Volume through the Straits of Malacca and SingaporeSurvey of Traffic Volume through the Straits of Malacca and Singapore
Ⅴ-3(1) Tonnage (D.W.) of vessels by Parent Company’s Nationality
②2004①1994
*Parent company:・ If a vessel becomes a Total Loss, this is the company which would receive payment
from the insurers. ・ It is also referred to as the beneficial owner which is the person or company that has the
right to sell/dispose of a ship or to transfer shares in a ship.
D.W.
Korea
3.5% Norway
4.6%
Singapore
5.8%
United
Kingdom
7.1%
China
7.8%
Taiwan
2.8%
Denmark
3.2%
Japan
20.8%Others
30.5%
U.S.A.
5.8%
Greece
8.1%
D.W.
Taiwan
4.2%
Korea
4.2%
Singapore
5.2%
Germany
9.3%China
10.5%U.S.A.
2.6%
Denmark
2.9%
Japan
18.6%Others
24.5%
Norway
4.6%
Greece
13.4%

Survey of Traffic Volume through the Straits of Malacca and SingaporeSurvey of Traffic Volume through the Straits of Malacca and Singapore
Ⅴ-3(2) Tonnage (D.W.) of vessels by Parent Company’s Nationality
100.0%3,989,321100.0%2,503,755Grand Total
0.9%36,7400.8%19,233Cyprus20
0.9%37,1861.4%35,431Indonesia19
1.0%38,5400.5%11,542Belgium18
1.0%41,0350.5%12,663Iran17
1.1%45,5721.2%31,126Monaco16
1.5%59,3810.3%7,292Switzerland15
1.6%64,9881.3%32,850Malaysia14
1.9%77,2461.3%32,410India13
2.1%85,2977.1%177,624United Kingdom12
2.5%100,8021.9%48,072Israel11
2.6%103,3055.8%144,819U.S.A.10
2.9%114,2823.2%79,118Denmark9
4.2%167,5012.8%69,861Taiwan8
4.2%167,6553.5%87,808Korea7
4.6%182,2574.6%114,924Norway6
5.2%207,9455.8%144,919Singapore5
9.3%371,3122.2%56,286Germany4
10.5%419,4787.8%196,134China3
13.4%535,2618.1%203,273Greece2
18.6%743,60920.8%520,414Japan1
Share(%)2004Share(%)1994
D.W.(1,000M/T)Parent CompanyNo.

Survey of Traffic Volume through the Straits of Malacca and SingaporeSurvey of Traffic Volume through the Straits of Malacca and Singapore
Ⅴ-4(1) Tonnage (D.W.) of vessels by Last calling port’s Nationality before entering/passing the Straits
①1994 ②2004
D.W.
Malaysia
3.5%
Korea
4.6%
Indonesia
6.2%
U.A.E.
6.2%China
7.3%
India
2.1%
Egypt
3.5%
Singapore
31.5%
Others
17.0%
Saudi Arabia
5.9%
Japan
12.3%
D.W.
China
10.7%
U.A.E.
4.6%
Others
21.3%Singapore
29.5%
Indonesia
3.6%
India
3.3%
Japan
7.8%
Malaysia
5.9%
Saudi Arabia
5.4%Korea
4.3%Egypt
3.6%

Survey of Traffic Volume through the Straits of Malacca and SingaporeSurvey of Traffic Volume through the Straits of Malacca and Singapore
Ⅴ-4(2) Tonnage (D.W.) of vessels by Last calling port’s Nationality
100.0%3,989,321100.0%2,503,755Grand Total
0.7%27,2971.0%25,526South Africa20
0.7%28,7250.7%16,779U.S.A.19
0.9%37,2740.9%21,583Sri Lanka18
1.0%39,8290.5%13,170Kuwait17
1.6%62,0000.9%21,583Brazil16
1.6%63,4652.0%50,410Oman15
1.8%71,4181.6%40,184Iran14
2.0%79,3211.6%38,957Thailand13
2.0%80,1611.6%40,371Australia12
2.3%91,4861.8%45,664Taiwan11
3.3%133,2582.1%51,795India10
3.6%142,0456.2%154,147Indonesia9
3.6%142,6903.5%86,819Egypt8
4.3%173,3734.6%114,890Korea7
4.6%182,7406.2%154,983U.A.E.6
5.4%213,6555.9%148,961Saudi Arabia5
5.9%234,6753.5%88,871Malaysia4
7.8%311,3247.3%181,646Japan3
10.7%428,44512.3%307,958China2
29.5%1,176,22831.5%787,803Singapore1
Share(%)2004Share(%)1994
D.W.(1,000M/T)Last calling port’s Nationality No.
Survey of Traffic Volume through the Straits of Malacca and SingaporeSurvey of Traffic Volume through the Straits of Malacca and Singapore
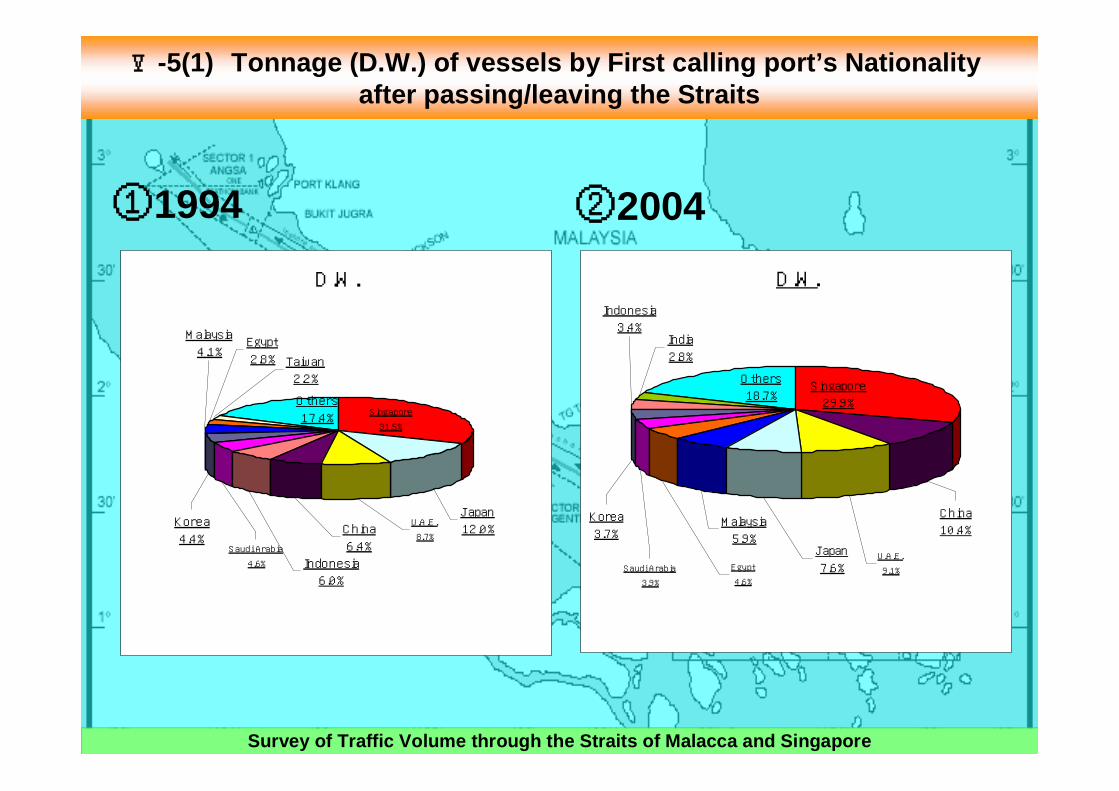
Ⅴ-5(1) Tonnage (D.W.) of vessels by First calling port’s Nationality after passing/leaving the Straits
①1994 ②2004D.W.
Korea
3.7%
Saudi Arabia
3.9%
Malaysia
5.9%Japan
7.6%U.A.E.
9.1%
India
2.8%
Indonesia
3.4%
Singapore
29.9%
Others
18.7%
Egypt
4.6%
China
10.4%
D.W.
Malaysia
4.1%
Korea
4.4%
Indonesia
6.0%
China
6.4%
U.A.E.
8.7%
Taiwan
2.2%
Egypt
2.8%
Singapore
31.5%
Others
17.4%
Saudi Arabia
4.6%
Japan
12.0%

Survey of Traffic Volume through the Straits of Malacca and SingaporeSurvey of Traffic Volume through the Straits of Malacca and Singapore
Ⅴ-5(2) Tonnage (D.W.) of vessels by First calling port’s Nationality
100.0%3,989,321100.0%2,503,755Grand Total
0.6%24,4921.2%29,015Philippines20
0.7%28,0740.5%12,734U.S.A.19
0.9%37,5961.5%37,234Sri Lanka18
0.9%37,7610.9%22,697Oman17
1.0%37,9390.9%21,429Kuwait16
1.2%46,6061.2%30,125South Africa15
1.5%58,0151.5%38,152Iran14
1.5%61,5371.9%48,781Australia13
1.9%75,5691.4%34,838Thailand12
2.4%97,6012.2%54,585Taiwan11
2.8%110,9871.9%48,491India10
3.4%134,8296.0%149,374Indonesia9
3.7%149,1324.4%109,418Korea8
3.9%154,9264.6%114,412Saudi Arabia7
4.6%182,5512.8%69,243Egypt6
5.9%233,7254.1%102,605Malaysia5
7.6%303,41312.0%301,330Japan4
9.1%364,6318.7%217,731U.A.E.3
10.4%413,9346.4%160,338China2
29.9%1,193,88431.5%789,605Singapore1
Share(%)2004Share(%)1994
D.W.(1,000M/T)First calling port’s NationalityNo.

Survey of Traffic Volume through the Straits of Malacca and SingaporeSurvey of Traffic Volume through the Straits of Malacca and Singapore
The result shows :☆ Rapid total traffic growth in decade☆ Japan obtains the benefits from passage
of the Straits☆ Wide range of countries receives the
benefit from the Straits, such as・East Asian countries,・Europe countries,・Middle Eastern oil producing countries
☆ The relative importance of Japan has been decreasing
Ⅵ Results of Survey
MLITMLIT

Survey of Traffic Volume through the Straits of Malacca and SingaporeSurvey of Traffic Volume through the Straits of Malacca and Singapore
☆ Various beneficiaries of passage through the Straits☆ Steadily increase of traffic volume in the Straits
Need for enhancing measure for safe navigational and environment protection
A new framework for international cooperation( Burden sharing between littoral States, user
States and other stakeholders)
MLITMLIT
Ⅶ Conclusions

Survey of Traffic Volume through the Straits of Malacca and SingaporeSurvey of Traffic Volume through the Straits of Malacca and Singapore
Thank You