passive acoustic monitoring of cook inlet beluga whales (delphinapterus leucas)
TRANSCRIPT

Passive acoustic monitoring of Cook Inlet beluga whales(Delphinapterus leucas)
Marc O. Lammersa)
Hawaii Institute of Marine Biology, 46-007 Lilipuna Road, Kaneohe, Hawaii 96744
Manuel CastelloteNational Marine Mammal Laboratory, Alaska Fisheries Science Center, National Oceanic and AtmosphericAdministration, 7600 Sand Point Way Northeast, Seattle, Washington 98115
Robert J. SmallAlaska Department of Fish and Game, 1255 West 8th Street, Juneau, Alaska 99811
Shannon AtkinsonSchool of Fisheries and Ocean Sciences, University of Alaska Fairbanks, 17101 Point Lena Loop Road,Juneau, Alaska 99801
Justin JennigesAlaska Department of Fish and Game, 1255 West 8th Street, Juneau, Alaska 99811
Anne RosinskiHawaii Institute of Marine Biology, 46-007 Lilipuna Road, Kaneohe, Hawaii 96744
Julie N. OswaldBioWaves, Incorporated, 517 Cornish Drive, Encinitas, California 92024
Chris GarnerU.S. Air Force, 6326 Arctic Warrior Drive, Joint Base Elmendorf-Richardson, Alaska 99506
(Received 18 October 2011; revised 3 February 2013; accepted 21 February 2013)
The endangered beluga whale (Delphinapterus leucas) population in Cook Inlet, AK faces threats
from a variety of anthropogenic factors, including coastal development, oil and gas exploration, vessel
traffic, and military activities. To address existing gaps in understanding about the occurrence of belu-
gas in Cook Inlet, a project was developed to use passive acoustic monitoring to document the year-
round distribution of belugas, as well as killer whales (Orcinus orca), which prey on belugas.
Beginning in June 2009, ten moorings were deployed throughout the Inlet and refurbished every two
to eight months. Despite challenging conditions consisting of strong tidal currents carrying debris and
seasonal ice cover, 83% of mooring deployments were successfully recovered. Noise from water flow,
vessel traffic, and/or industrial activities was present at several sites, potentially masking some signals.
However, belugas were successfully detected at multiple locations. Detections were relatively com-
mon in the upper inlet and less common or absent at middle and lower inlet locations. Killer whale sig-
nals were also recorded. Some seasonal variability in the occurrence of both belugas and killer whales
was evident. VC 2013 Acoustical Society of America. [http://dx.doi.org/10.1121/1.4816575]
PACS number(s): 43.80.Ka, 43.80.Ev [AMT] Pages: 2497–2504
I. INTRODUCTION
Beluga whales (Delphinapterus leucas) are one of two
cetacean species in the family Monodontidae occurring in
Arctic and sub-Arctic waters; the narwal (Monodon mono-ceros) is the other species. Belugas occupy a discontinuous
circumpolar distribution in waters ranging from 50�N to 80�Nlatitude, primarily along the coasts of Alaska, Canada,
Greenland, and Russia. A genetically distinct population of
belugas occurs in Cook Inlet, a 300 km-long estuary in south
central Alaska that stretches northeast from the Gulf of Alaska
at 59�N to Alaska’s largest city, Anchorage, at 61�150N. The
land surrounding Cook Inlet is home to nearly half the state’s
human population and the waters are subject to myriad anthro-
pogenic activities, including coastal development, oil and gas
exploration and extraction, commercial shipping, recreational
boating, and military activities.
The Cook Inlet beluga whale population has declined
from an estimated 653 animals in 1994 to 345 in 2011 (Allen
and Angliss, 2012). It was listed as “endangered” under the
U.S. Endangered Species Act in 2008, and has shown no
signs of recovery since the primary cause of the decline,
over-harvest, was sharply curtailed in 1999 (Lowry et al.,2006). The Cook Inlet population is currently the smallest in
Alaska and population viability analyses indicate a relatively
high risk of extinction (Hobbs et al., 2006). As a result, state
and federal regulatory agencies are evaluating management
and conservation strategies, and a recovery plan is being
a)Author to whom correspondence should be addressed. Electronic mail:
J. Acoust. Soc. Am. 134 (3), Pt. 2, September 2013 VC 2013 Acoustical Society of America 24970001-4966/2013/134(3)/2497/8/$30.00
Downloaded 30 Sep 2013 to 132.206.27.25. Redistribution subject to ASA license or copyright; see http://asadl.org/terms
drafted. To establish an effective recovery program, substan-
tial gaps in understanding about the population will need to
be addressed, including these principal information needs:
quantifiable measures of seasonal beluga presence in Cook
Inlet, temporal and spatial patterns of habitat preference, and
the occurrence of animals in areas impacted by, or considered
for, industrial development and military use.
To address these information needs, in 2008 we initiated
a collaborative research project based on a passive acoustic
monitoring strategy to address the primary objective of
examining the seasonal distribution of beluga whales in
Cook Inlet. An acoustic approach was chosen because Cook
Inlet is a notoriously challenging place for conducting tradi-
tional vessel and aircraft-based visual surveys on a year-
round basis due to frequent inclement weather conditions,
turbid silt-laden waters, and heavy seasonal ice cover that
make the detection of belugas problematic. To date, these
challenges have resulted in a paucity of information on the
seasonal distribution of belugas, in particular, since the sharp
decline in abundance that occurred in the late 1990s.
Acoustic moorings are less limited by weather and surface
conditions and are thus able to provide continuous observa-
tions of cetacean activity near a mooring site. Beluga whales
are well suited for acoustic monitoring because they are
notoriously vociferous animals with a diverse repertoire of
signals (Sjare and Smith, 1986; Chmelnitsky and Ferguson,
2012). Acoustic monitoring also allows the investigation of
the ambient noise environment that characterizes Cook Inlet,
which is important for evaluating the potential effects of
noise pollution on belugas. Further, acoustic monitoring can
help document the presence of other marine mammals, such
as killer whales (Orcinus orca), which are known predators
of beluga whales. Here, we detail the methodologies being
applied in this research project and describe the challenges,
successes, and initial results from the first year (June 2009–
May 2010) of the project.
II. METHODS
A. Acoustic mooring design
Cook Inlet is characterized by large, semi-diurnal tidal
variations (as great as 10 m) resulting in strong currents that
regularly exceed 3.6 m/s at their peak. In addition, vast quan-
tities of sediment, glacial silt, and large debris are continually
washed into the inlet through a network of rivers and streams
originating in the surrounding mountains, which results in
much of the inlet being characterized by mudflats and contin-
ually shifting bottom sediment under a turbid water column.
The upper half of Cook Inlet is covered by seasonal ice from
November to May, which due to the strong tidal currents is
generally broken and free flowing across the inlet, converging
in some areas and diverging in others. These conditions pose
a significant challenge to the use of acoustic moorings due to
the potential for entanglement with debris, entrapment by
sediment, collisions with sub-surface ice, and excessive water
flow noise on recordings that can mask signals of interest.
Beluga and killer whale signals span a broad range of
frequencies. Social sounds, including calls, whistles, and
buzzes generally occur at frequencies below approximately
12 kHz, although many sounds are broadband and have
energy extending above 20 kHz (Sjare and Smith, 1986; Ford,
1989; Thomsen et al., 2001; Chmelnitsky and Ferguson,
2012). Echolocation clicks, on the other hand, have consider-
ably higher peak frequencies than social sounds. The clicks
of beluga whales range in peak frequency between 40 and
120 kHz and have bandwidths between 20 and 40 kHz (Au
et al., 1985). Killer whale clicks have broadband bimodal fre-
quency spectra with low and high frequency peaks between
24 and 108 kHz and bandwidths between 35 and 50 kHz (Au
et al., 2004; Simon et al., 2007).
To account for the wide frequency range of both beluga
and killer whale signals and to increase the likelihood of re-
cording them under the difficult conditions present in Cook
Inlet, two types of acoustic sensors were utilized in tandem:
an ecological acoustic recorder (EAR) and a C-POD. The
EAR is a computer-based recorder with a programmable duty
cycle and bandwidth (up to 40 kHz) produced by Oceanwide
Science Institute (Honolulu, HI; Lammers et al., 2008). The
C-POD (v.0) is a click logger produced by Chelonia, Ltd.
(Cornwall, UK) that detects and classifies odontocetes echolo-
cation signals. The EAR was used to record primarily the
calls, whistles, and buzzes produced by beluga and killer
whales, but also the lower frequency components (if present)
of echolocation clicks. The C-POD was used to log and
classify echolocation clicks exclusively. Here, we present the
methods and detection results obtained using only EARs. A
comparison and integration of the detections obtained by both
instruments will be presented in a subsequent manuscript.
All EARs were programmed to record at a sampling rate
of 25 kHz on a 10% duty cycle of 30 s “on” every 5 min.
These settings were selected to maximize the EAR’s avail-
able data storage capacity and battery power, allowing for a
deployment life of approximately 22–24 weeks. This duty
cycle was assumed to be sufficient to capture the signals of
acoustically active belugas milling or transiting within the
EAR’s listening range over a minimum 10–20 min period.
Although the EAR’s listening range was not empirically
established for all mooring locations, an informal test using
an artificial 15–20 kHz frequency modulation sweep pro-
jected with a source level of 140 dB re 1 lPa was conducted
at two Cook Inlet sites: Port of Anchorage (61�13.50N,
149�54.60W, depth: �10 m) and Chickaloon Bay (61�00.50N,
150�11.70W, depth: �8 m). In each case, the EAR was sus-
pended at a depth of 3 m from a stationary vessel while the
artificial source was projected at a depth of 2–4 m from sev-
eral distances off a mobile vessel. The maximum range of
detection was �2.2 km at the Port of Anchorage and
�3.3 km at Chickaloon Bay.
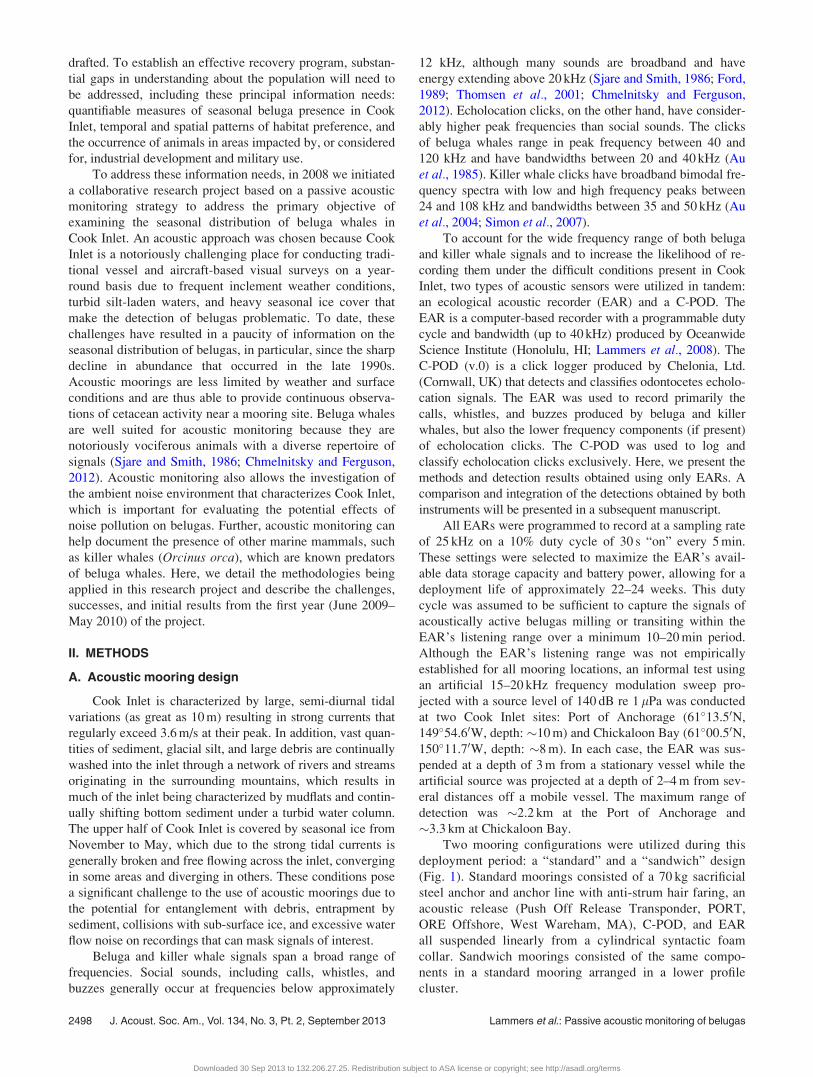
Two mooring configurations were utilized during this
deployment period: a “standard” and a “sandwich” design
(Fig. 1). Standard moorings consisted of a 70 kg sacrificial
steel anchor and anchor line with anti-strum hair faring, an
acoustic release (Push Off Release Transponder, PORT,
ORE Offshore, West Wareham, MA), C-POD, and EAR
all suspended linearly from a cylindrical syntactic foam
collar. Sandwich moorings consisted of the same compo-
nents in a standard mooring arranged in a lower profile
cluster.
2498 J. Acoust. Soc. Am., Vol. 134, No. 3, Pt. 2, September 2013 Lammers et al.: Passive acoustic monitoring of belugas
Downloaded 30 Sep 2013 to 132.206.27.25. Redistribution subject to ASA license or copyright; see http://asadl.org/terms
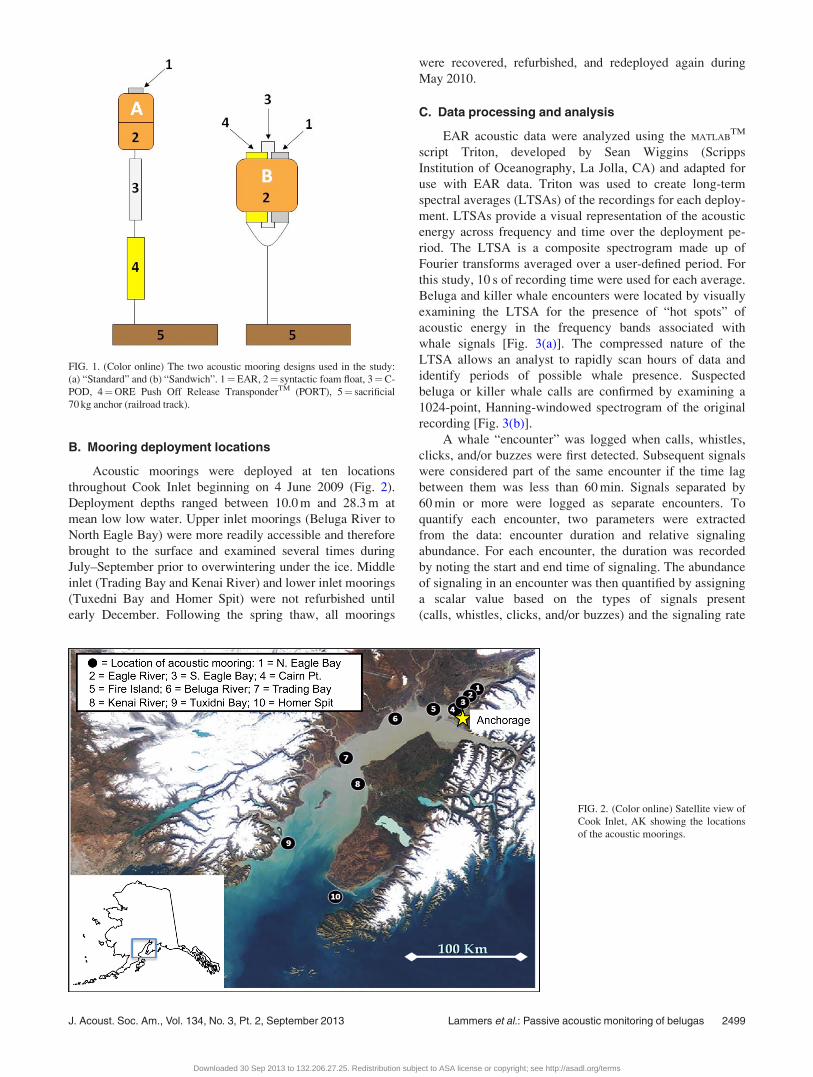
B. Mooring deployment locations
Acoustic moorings were deployed at ten locations
throughout Cook Inlet beginning on 4 June 2009 (Fig. 2).
Deployment depths ranged between 10.0 m and 28.3 m at
mean low low water. Upper inlet moorings (Beluga River to
North Eagle Bay) were more readily accessible and therefore
brought to the surface and examined several times during
July–September prior to overwintering under the ice. Middle
inlet (Trading Bay and Kenai River) and lower inlet moorings
(Tuxedni Bay and Homer Spit) were not refurbished until
early December. Following the spring thaw, all moorings
were recovered, refurbished, and redeployed again during
May 2010.
C. Data processing and analysis
EAR acoustic data were analyzed using the MATLABTM
script Triton, developed by Sean Wiggins (Scripps
Institution of Oceanography, La Jolla, CA) and adapted for
use with EAR data. Triton was used to create long-term
spectral averages (LTSAs) of the recordings for each deploy-
ment. LTSAs provide a visual representation of the acoustic
energy across frequency and time over the deployment pe-
riod. The LTSA is a composite spectrogram made up of
Fourier transforms averaged over a user-defined period. For
this study, 10 s of recording time were used for each average.
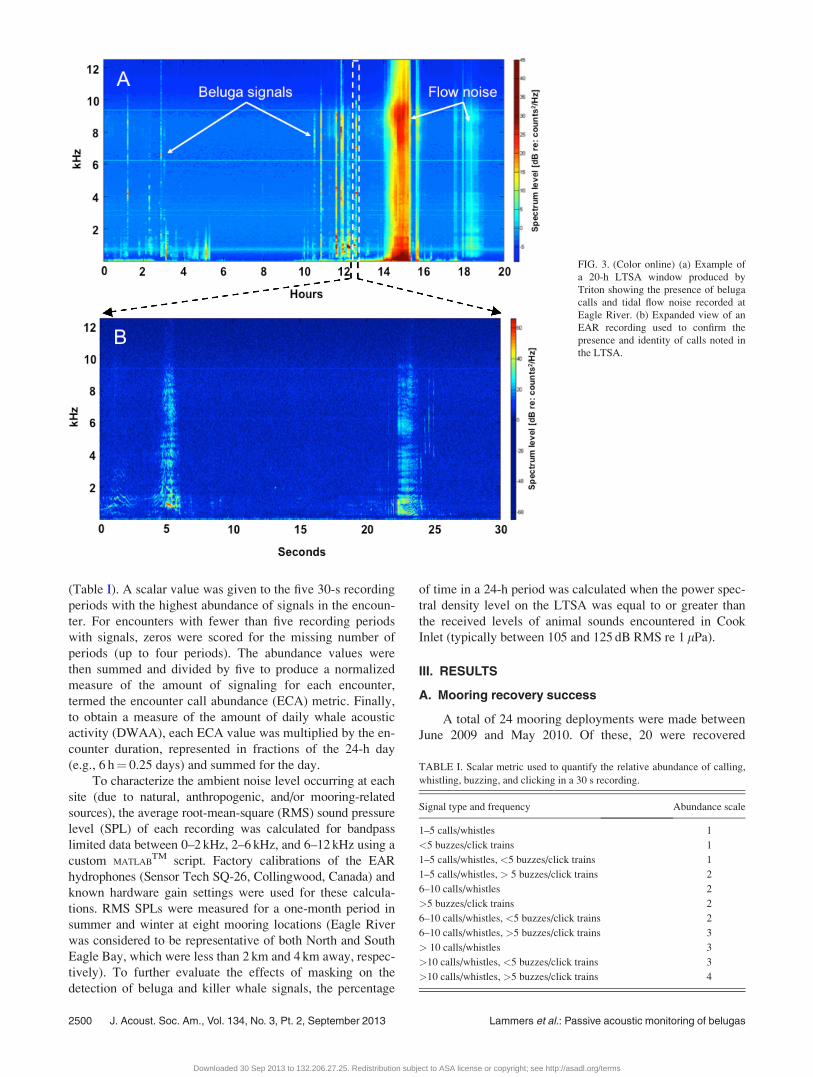
Beluga and killer whale encounters were located by visually
examining the LTSA for the presence of “hot spots” of
acoustic energy in the frequency bands associated with
whale signals [Fig. 3(a)]. The compressed nature of the
LTSA allows an analyst to rapidly scan hours of data and
identify periods of possible whale presence. Suspected
beluga or killer whale calls are confirmed by examining a
1024-point, Hanning-windowed spectrogram of the original
recording [Fig. 3(b)].
A whale “encounter” was logged when calls, whistles,
clicks, and/or buzzes were first detected. Subsequent signals
were considered part of the same encounter if the time lag
between them was less than 60 min. Signals separated by
60 min or more were logged as separate encounters. To
quantify each encounter, two parameters were extracted
from the data: encounter duration and relative signaling
abundance. For each encounter, the duration was recorded
by noting the start and end time of signaling. The abundance
of signaling in an encounter was then quantified by assigning
a scalar value based on the types of signals present
(calls, whistles, clicks, and/or buzzes) and the signaling rate
FIG. 1. (Color online) The two acoustic mooring designs used in the study:
(a) “Standard” and (b) “Sandwich”. 1¼EAR, 2¼ syntactic foam float, 3¼C-
POD, 4¼ORE Push Off Release TransponderTM (PORT), 5¼ sacrificial
70 kg anchor (railroad track).
FIG. 2. (Color online) Satellite view of
Cook Inlet, AK showing the locations
of the acoustic moorings.
J. Acoust. Soc. Am., Vol. 134, No. 3, Pt. 2, September 2013 Lammers et al.: Passive acoustic monitoring of belugas 2499
Downloaded 30 Sep 2013 to 132.206.27.25. Redistribution subject to ASA license or copyright; see http://asadl.org/terms
(Table I). A scalar value was given to the five 30-s recording
periods with the highest abundance of signals in the encoun-
ter. For encounters with fewer than five recording periods
with signals, zeros were scored for the missing number of
periods (up to four periods). The abundance values were
then summed and divided by five to produce a normalized
measure of the amount of signaling for each encounter,
termed the encounter call abundance (ECA) metric. Finally,
to obtain a measure of the amount of daily whale acoustic
activity (DWAA), each ECA value was multiplied by the en-
counter duration, represented in fractions of the 24-h day
(e.g., 6 h¼ 0.25 days) and summed for the day.
To characterize the ambient noise level occurring at each
site (due to natural, anthropogenic, and/or mooring-related
sources), the average root-mean-square (RMS) sound pressure
level (SPL) of each recording was calculated for bandpass
limited data between 0–2 kHz, 2–6 kHz, and 6–12 kHz using a
custom MATLABTM script. Factory calibrations of the EAR
hydrophones (Sensor Tech SQ-26, Collingwood, Canada) and
known hardware gain settings were used for these calcula-
tions. RMS SPLs were measured for a one-month period in
summer and winter at eight mooring locations (Eagle River
was considered to be representative of both North and South
Eagle Bay, which were less than 2 km and 4 km away, respec-
tively). To further evaluate the effects of masking on the
detection of beluga and killer whale signals, the percentage
of time in a 24-h period was calculated when the power spec-
tral density level on the LTSA was equal to or greater than
the received levels of animal sounds encountered in Cook
Inlet (typically between 105 and 125 dB RMS re 1 lPa).
III. RESULTS
A. Mooring recovery success
A total of 24 mooring deployments were made between
June 2009 and May 2010. Of these, 20 were recovered
FIG. 3. (Color online) (a) Example of
a 20-h LTSA window produced by
Triton showing the presence of beluga
calls and tidal flow noise recorded at
Eagle River. (b) Expanded view of an
EAR recording used to confirm the
presence and identity of calls noted in
the LTSA.
TABLE I. Scalar metric used to quantify the relative abundance of calling,
whistling, buzzing, and clicking in a 30 s recording.
Signal type and frequency Abundance scale
1–5 calls/whistles 1
<5 buzzes/click trains 1
1–5 calls/whistles, <5 buzzes/click trains 1
1–5 calls/whistles, > 5 buzzes/click trains 2
6–10 calls/whistles 2
>5 buzzes/click trains 2
6–10 calls/whistles, <5 buzzes/click trains 2
6–10 calls/whistles, >5 buzzes/click trains 3
> 10 calls/whistles 3
>10 calls/whistles, <5 buzzes/click trains 3
>10 calls/whistles, >5 buzzes/click trains 4
2500 J. Acoust. Soc. Am., Vol. 134, No. 3, Pt. 2, September 2013 Lammers et al.: Passive acoustic monitoring of belugas
Downloaded 30 Sep 2013 to 132.206.27.25. Redistribution subject to ASA license or copyright; see http://asadl.org/terms
successfully and four were lost. The four lost moorings were
from North Eagle Bay (early summer 2009), Eagle River
(over winter 2009–2010), Cairn Point (late summer 2009),
and Fire Island (overwinter 2009–2010). The moorings at
North Eagle Bay and Fire Island were each later found on a
beach several km from their deployment sites in the spring
and fall of 2010, respectively, and the data were successfully
recovered. Of the 24 mooring deployments made, 21 were
standard design and 3 were “sandwich” design moorings. Of
the four moorings that were not successfully recovered, three
were standard and one was a “sandwich” design mooring.
The cause of the mooring failures could not be established
conclusively, but in the standard moorings it is suspected
that debris and/or sediment may have become entangled
with the mooring and prevented surfacing. The sandwich
mooring is believed to have been destroyed by winter ice.
B. The acoustic environment and masking
The large tidal variations characteristic of Cook Inlet
produced cyclical periods of strong water flow, during which
EAR recordings were sometimes saturated by flow noise.
This caused beluga signals to be partially or fully masked
(Fig. 3). In addition, other natural and anthropogenic noises
were also present in recordings. Natural noises originated
predominantly from debris striking the mooring and, at some
locations, pebbles or stones moving along the bottom with
the tide. These did not generally interfere with the detection
of beluga calls because their occurrence was low and/or
because the predominant energy was in a lower frequency
band. Anthropogenic noise originated from a variety of sour-
ces at the different locations including: vessel traffic (Cairn
Point, Fire Island, Trading Bay, Homer Spit), industrial/con-
struction activities (Cairn Point), and aircraft (Cairn Point,
Eagle River, Eagle Bay). Some of these noise sources did
overlap in frequency with beluga and killer whale signals
and may therefore have contributed to masking. Table II
summarizes the average daily percentage of time that partial
or full masking occurred at each site in the winter and
summer. Masking periods varied in duration between a few
minutes to the majority of the 24-h day, depending on the
location. In the summer, the duration of masking was rela-
tively low at Tuxedni Bay, Trading Bay, Beluga River,
Kenai River, and Eagle River. It was intermediate at Cairn
Point and Homer Spit and was high at Fire Island. In the
winter, masking decreased substantially in duration at Cairn
Point and Homer Spit, increased by several hours at Trading
Bay, Beluga Rive, and Fire Island, and did not change much
at Kenai River and Tuxedni Bay.
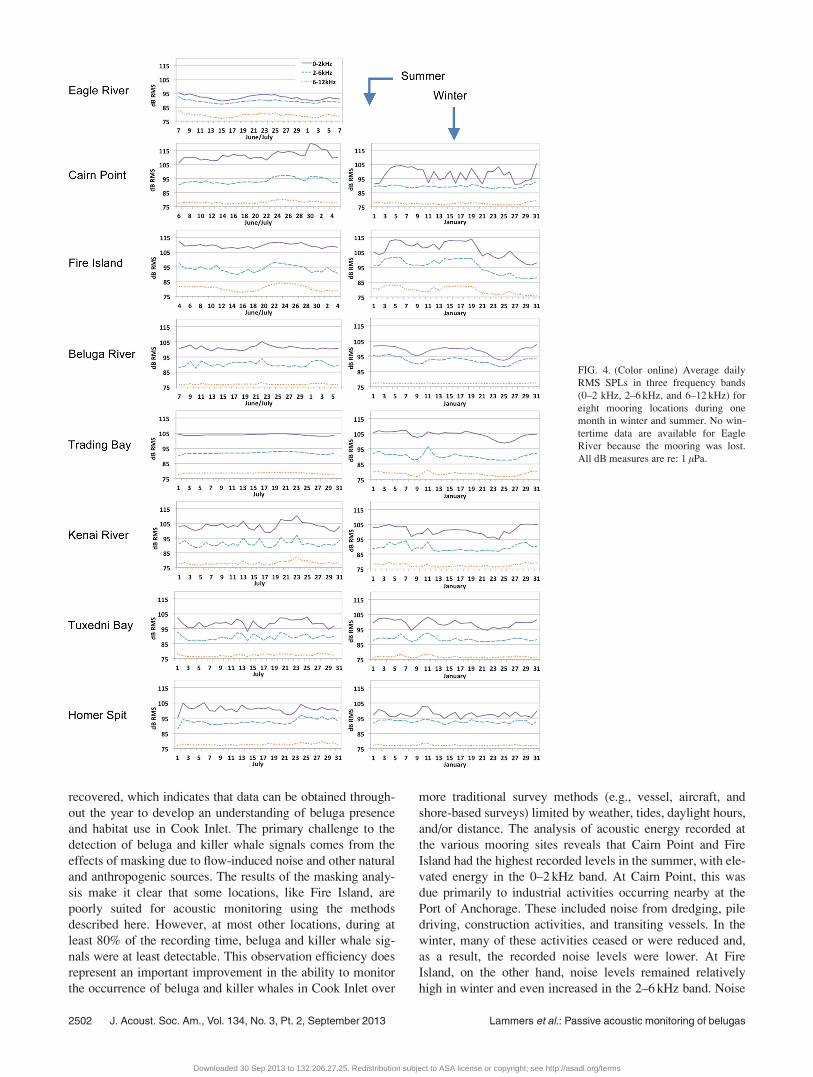
Figure 4 shows a comparison of the summer and winter
noise levels measured in three frequency bands at each site,
representing contributions from all sound sources. In all
cases, the 0–2 kHz frequency band had the highest RMS
SPLs, the 2–6 kHz band was intermediate, and the 6–12 kHz
band had the lowest levels. The highest ambient noise levels
measured in the summer were at Cairn Point and Fire Island.
The lowest were at Eagle River. In the winter, average levels
mostly decreased or remained unchanged (þ/�1 dB) in all
bands, except at Beluga River and Fire Island, where RMS
SPLs in the 2–6 kHz band increased by 2.2 and 2.0 dB re:
1 lPa, respectively. Of note is the substantial decrease in
wintertime noise at Cairn Point, where the average level in
the 0–2 kHz band decreased by 13.6 dB re: 1 lPa.
C. Beluga and killer whale detections
Beluga signals or killer whale signals were detected at all
locations except North and South Eagle Bay (which were
monitored for only 17 and 31 days, respectively). Table III
summarizes the incidence of signals at the ten mooring sites.
Beluga whales were recorded at Eagle River, Cairn Point, Fire
Island, Beluga River, Trading Bay, and Kenai River. Killer
whale calls occurred at Tuxedni Bay and Homer Spit. The ma-
jority of beluga detections took place at Beluga River.
However, relative to the number of recording days, Eagle River
had a slightly higher incidence than Beluga River, with 0.23
encounters per day versus 0.22, respectively. Both Beluga
River and Eagle River also had the highest encounter durations.
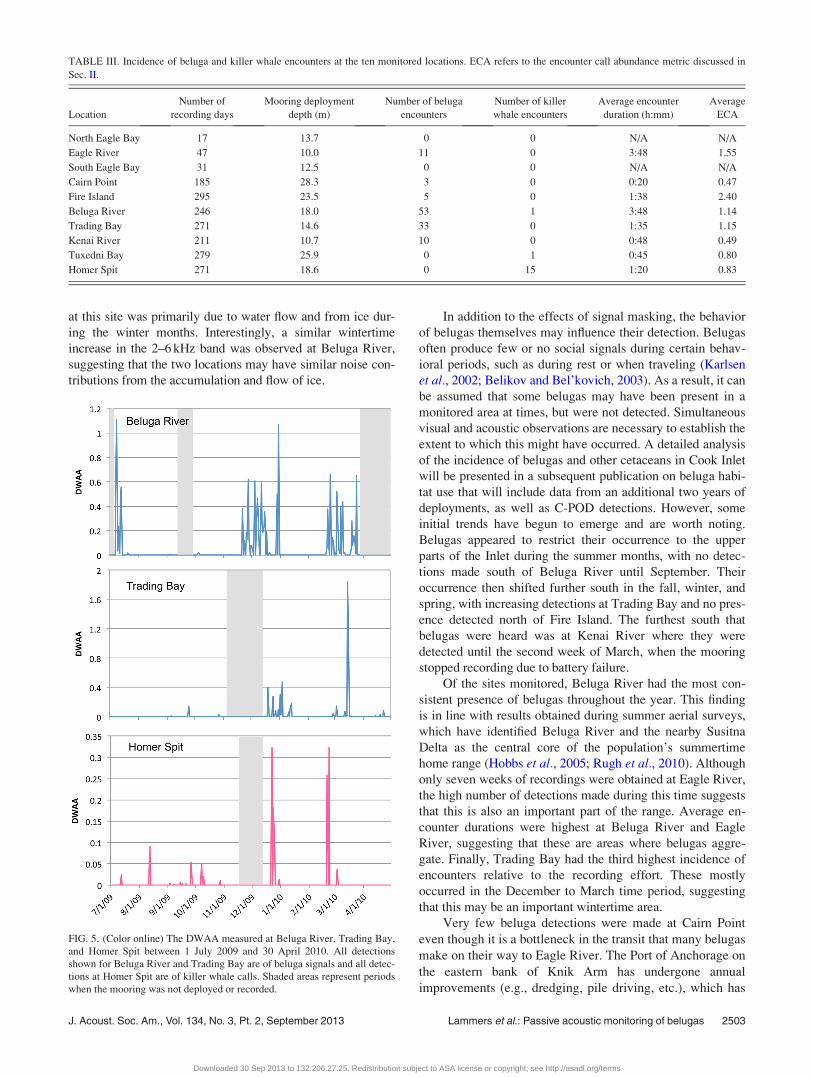
Beluga detections did not take place with regularity at
any location, but rather occurred as multi-day episodes sepa-
rated by long intervals of absence (Fig. 5). Episodes of beluga
presence varied in duration between 1 and 30 days. Belugas
were heard at upper inlet locations in summer (Eagle River,
Cairn Point, Fire Island, and Beluga River), fall (Fire Island
and Beluga River), winter (Fire Island and Beluga River),
and spring (Beluga River) and were detected in the middle
inlet (Trading Bay and Kenai River) in the fall, winter, and
spring, but not in summer. Belugas were not detected at any
lower inlet locations, but signals produced by killer whales
were recorded multiple times at Homer Spit (Fig. 5) and once
at Tuxedni Bay (Oct. 28, 2009). Calls recorded at Homer Spit
and Tuxedni Bay were tentatively identified as belonging to
resident killer whales of the AB clan (C. Matkin, personal
communication). Killer whale detections at Homer Spit
occurred with regularity in the summer and fall and more epi-
sodically in winter and spring (Fig. 5).
IV. DISCUSSION
The results of this phase of the project reveal that investi-
gating the occurrence and distribution of beluga whales in
Cook Inlet using an acoustic approach is feasible, despite the
challenging conditions. Eighty-three percent of the moorings
deployed for longer than one month were successfully
TABLE II. The average daily number of hours that beluga and killer whale
calls were masked by flow/mooring noise, as well as other natural and also
anthropogenic sound sources in summer and winter.
Location
Average (standard deviation)
daily hours of masking
in summer
Average (standard deviation)
daily hours of masking
in winter
Eagle River 2.2 (0.4) N/A
Cairn Point 3.7 (3.5) 0.9 (0.8)
Fire Island 9.9 (5.9) 16.3 (6.5)
Beluga River 1.3 (2.4) 9.3 (6.0)
Trading Bay 1.0 (1.4) 4.5 (2.3)
Kenai River 1.5 (2.2) 0.7 (1.8)
Tuxedni Bay 0.1 (0.1) 0.3 (0.7)
Homer Spit 4.0 (2.6) 2.3 (1.6)
J. Acoust. Soc. Am., Vol. 134, No. 3, Pt. 2, September 2013 Lammers et al.: Passive acoustic monitoring of belugas 2501
Downloaded 30 Sep 2013 to 132.206.27.25. Redistribution subject to ASA license or copyright; see http://asadl.org/terms
recovered, which indicates that data can be obtained through-
out the year to develop an understanding of beluga presence
and habitat use in Cook Inlet. The primary challenge to the
detection of beluga and killer whale signals comes from the
effects of masking due to flow-induced noise and other natural
and anthropogenic sources. The results of the masking analy-
sis make it clear that some locations, like Fire Island, are
poorly suited for acoustic monitoring using the methods
described here. However, at most other locations, during at
least 80% of the recording time, beluga and killer whale sig-
nals were at least detectable. This observation efficiency does
represent an important improvement in the ability to monitor
the occurrence of beluga and killer whales in Cook Inlet over
more traditional survey methods (e.g., vessel, aircraft, and
shore-based surveys) limited by weather, tides, daylight hours,
and/or distance. The analysis of acoustic energy recorded at
the various mooring sites reveals that Cairn Point and Fire
Island had the highest recorded levels in the summer, with ele-
vated energy in the 0–2 kHz band. At Cairn Point, this was
due primarily to industrial activities occurring nearby at the
Port of Anchorage. These included noise from dredging, pile
driving, construction activities, and transiting vessels. In the
winter, many of these activities ceased or were reduced and,
as a result, the recorded noise levels were lower. At Fire
Island, on the other hand, noise levels remained relatively
high in winter and even increased in the 2–6 kHz band. Noise
FIG. 4. (Color online) Average daily
RMS SPLs in three frequency bands
(0–2 kHz, 2–6 kHz, and 6–12 kHz) for
eight mooring locations during one
month in winter and summer. No win-
tertime data are available for Eagle
River because the mooring was lost.
All dB measures are re: 1 lPa.
2502 J. Acoust. Soc. Am., Vol. 134, No. 3, Pt. 2, September 2013 Lammers et al.: Passive acoustic monitoring of belugas
Downloaded 30 Sep 2013 to 132.206.27.25. Redistribution subject to ASA license or copyright; see http://asadl.org/terms
at this site was primarily due to water flow and from ice dur-
ing the winter months. Interestingly, a similar wintertime
increase in the 2–6 kHz band was observed at Beluga River,
suggesting that the two locations may have similar noise con-
tributions from the accumulation and flow of ice.
In addition to the effects of signal masking, the behavior
of belugas themselves may influence their detection. Belugas
often produce few or no social signals during certain behav-
ioral periods, such as during rest or when traveling (Karlsen
et al., 2002; Belikov and Bel’kovich, 2003). As a result, it can
be assumed that some belugas may have been present in a
monitored area at times, but were not detected. Simultaneous
visual and acoustic observations are necessary to establish the
extent to which this might have occurred. A detailed analysis
of the incidence of belugas and other cetaceans in Cook Inlet
will be presented in a subsequent publication on beluga habi-
tat use that will include data from an additional two years of
deployments, as well as C-POD detections. However, some
initial trends have begun to emerge and are worth noting.
Belugas appeared to restrict their occurrence to the upper
parts of the Inlet during the summer months, with no detec-
tions made south of Beluga River until September. Their
occurrence then shifted further south in the fall, winter, and
spring, with increasing detections at Trading Bay and no pres-
ence detected north of Fire Island. The furthest south that
belugas were heard was at Kenai River where they were
detected until the second week of March, when the mooring
stopped recording due to battery failure.
Of the sites monitored, Beluga River had the most con-
sistent presence of belugas throughout the year. This finding
is in line with results obtained during summer aerial surveys,
which have identified Beluga River and the nearby Susitna
Delta as the central core of the population’s summertime
home range (Hobbs et al., 2005; Rugh et al., 2010). Although
only seven weeks of recordings were obtained at Eagle River,
the high number of detections made during this time suggests
that this is also an important part of the range. Average en-
counter durations were highest at Beluga River and Eagle
River, suggesting that these are areas where belugas aggre-
gate. Finally, Trading Bay had the third highest incidence of
encounters relative to the recording effort. These mostly
occurred in the December to March time period, suggesting
that this may be an important wintertime area.
Very few beluga detections were made at Cairn Point
even though it is a bottleneck in the transit that many belugas
make on their way to Eagle River. The Port of Anchorage on
the eastern bank of Knik Arm has undergone annual
improvements (e.g., dredging, pile driving, etc.), which has
TABLE III. Incidence of beluga and killer whale encounters at the ten monitored locations. ECA refers to the encounter call abundance metric discussed in
Sec. II.
Location
Number of
recording days
Mooring deployment
depth (m)
Number of beluga
encounters
Number of killer
whale encounters
Average encounter
duration (h:mm)
Average
ECA
North Eagle Bay 17 13.7 0 0 N/A N/A
Eagle River 47 10.0 11 0 3:48 1.55
South Eagle Bay 31 12.5 0 0 N/A N/A
Cairn Point 185 28.3 3 0 0:20 0.47
Fire Island 295 23.5 5 0 1:38 2.40
Beluga River 246 18.0 53 1 3:48 1.14
Trading Bay 271 14.6 33 0 1:35 1.15
Kenai River 211 10.7 10 0 0:48 0.49
Tuxedni Bay 279 25.9 0 1 0:45 0.80
Homer Spit 271 18.6 0 15 1:20 0.83
FIG. 5. (Color online) The DWAA measured at Beluga River, Trading Bay,
and Homer Spit between 1 July 2009 and 30 April 2010. All detections
shown for Beluga River and Trading Bay are of beluga signals and all detec-
tions at Homer Spit are of killer whale calls. Shaded areas represent periods
when the mooring was not deployed or recorded.
J. Acoust. Soc. Am., Vol. 134, No. 3, Pt. 2, September 2013 Lammers et al.: Passive acoustic monitoring of belugas 2503
Downloaded 30 Sep 2013 to 132.206.27.25. Redistribution subject to ASA license or copyright; see http://asadl.org/terms

contributed industrial noise to the ambient sounds of Cook
Inlet. It is possible that this noise could have masked the
calls of some transiting belugas, however, it is unlikely that
this alone would explain the paucity of detections. Another
possibility is that belugas may have consistently transited
2 km away along the western bank of Knik Arm, and
remained out of the EAR detection range. Visual observa-
tions made during this time suggest, however, that although
there was a preference for the western bank, belugas did
periodically transit near the mooring site (Cornik and Saxon
Kendall, 2010). Finally, it is possible that belugas may have
suppressed their acoustic behavior while transiting past this
area of high anthropogenic activity. Belugas in other loca-
tions have been shown to modify their acoustic behavior in
response to vessel sounds, which are common near the Port
of Anchorage (Lesage et al., 1999). Such modifications may
represent a predator avoidance strategy (Karlsen et al.,2002), a response to stress (Castellote and Fossa, 2006), or
perhaps a response to signal masking by the noise.
There was no observed overlap in the EAR data between
the distribution of belugas and killer whales. Resident killer
whales are known to occur in lower Cook Inlet and were
detected there (at Homer Spit). However, killer whales were
heard only once further north at Tuxedni Bay. It is unclear
why this is the case, but it suggests that fish-eating resident
killer whales do not directly compete for resources with
belugas in Cook Inlet. Alternatively, belugas may actively
remain in heavily sedimented, high-current upper inlet
waters to avoid predation by their main, non-human preda-
tors, marine mammal-eating transient killer whales.
Transient killer whales are known to produce fewer calls,
whistles, and echolocation clicks than residents, presumably
to avoid detection by their prey (Felleman et al., 1991;
Barrett-Lennard et al., 1996). Therefore, the relative lack of
detected killer whale signals in the upper inlet is not neces-
sarily an accurate indication of their absence from the area.
In conclusion, an acoustic framework for documenting
the spatial and temporal distribution of belugas in Cook Inlet
has been established. This effort compliments and adds to a
growing body of information obtained during similar proj-
ects aimed at acoustically monitoring threatened beluga pop-
ulations in other parts of the world (e.g., Simard et al., 2010;
Delarue et al., 2011). The framework created here will help
to advance the current understanding of beluga seasonal
occurrence in Cook Inlet and will help monitor the popula-
tion’s use of designated critical habitats (76 FR 20180, April
11, 2011). Continued data collection efforts will also provide
baseline patterns of occurrence to help gauge the effective-
ness of management efforts over time.
ACKNOWLEDGMENTS
We are grateful to Sean Wiggins who created Triton and
Lisa Munger who adapted it for EAR data analysis. Jennifer
Ewald and David Lee provided technical assistance on
mooring design, and Dave McKay and Bill Choate assisted
with the deployment of moorings. Funding for this research
was provided by NOAA Fisheries Grant No.
NA07NMF4390364.
Allen, B. M., and Angliss, R. P. (2012). “Alaska marine mammal stock
assessments, 2011,” U.S. Dept. of Commerce, NOAA Tech. Memo.
NMFS AFSC-234, pp. 1–288.
Au, W. W. L., Carder, D. A., Penner, R. H., and Scronce, B. L. (1985).
“Demonstration of adaptation in Beluga whale echolocation signals,”
J. Acoust. Soc. Am. 77, 726–730.
Au, W. W. L., Ford, J. K. B., Horne, J. K., and Allman, K. A. N. (2004).
“Echolocation signals of free-ranging killer whales (Orcinus orca) and
modeling of foraging for Chinook salmon (Oncorhynchus tshawytscha),”
J. Acoust. Soc. Am. 115, 901–909.
Barrett-Lennard, L. G., Ford, J. K. B., and Heise, K. A. (1996). “The mixed
blessing of echolocation: Differences in sonar use by fish-eating and
mammal-eating killer whales,” Anim. Behav. 51, 553–565.
Belikov, R. A., and Bel’kovich, V. M. (2003). “Underwater vocalization
of the beluga whales (Delphinapterus leucas) in a reproductive gathering
in various behavioral situations,” Oceanology (Engl. Transl.) 43,
112–120.
Castellote, M., and Fossa, F. (2006). “Measuring acoustic activity as a
method to evaluate welfare in captive beluga whales (Delphinapterusleucas),” Aquat. Mamm. 32, 325–333.
Chmelnitsky, E. G., and Ferguson, S. H. (2012). “Beluga whale,
Delphinapterus leucas, vocalizations from the Churchill River, Manitoba,
Canada,” J. Acoust. Soc. Am. 131, 4821–4835.
Cornik, L. A., and Saxon Kendall, L. (2010). “Distribution, habitat use and
behavior of Cook Inlet beluga whales and other marine mammals at the
Port of Anchorage Marine Terminal Redevelopment Project
May–November 2009,” Scientific Marine Mammal Monitoring Program
2009 Annual Report (United States Department of Transportation
Maritime Administration, Washington, DC), pp. 1–99.
Delarue, J., Laurinolli, M., and Martin, B. (2011). “Acoustic detections of
beluga whales in the northeastern Chukchi Sea, July 2007 to July 2008,”
Arctic 64, 15–24.
Felleman, F. L., Heimlich-Boran, J. R., and Osborne, R. W. (1991). “The
feeding ecology of killer whales (Orcinus orca) in the Pacific Northwest,”
in Dolphin Societies: Discoveries and Puzzles, edited by K. Pryor and K.
S. Norris (University of California Press, Berkeley, CA), pp. 113–147.
Ford, J. K. B. (1989). “Acoustic behavior of resident killer whales (Orcinusorca) off Vancouver Island, British Columbia, Canada,” Can. J. Zool. 67,
727–745.
Hobbs, R. C., Laidre, K. L., Vos, D. J., Mahoney, B. A., and Eagleton, M.
(2005). “Movements and area use of belugas, Delphinapterus leucas, in a
subarctic Alaskan estuary,” Arctic 58, 331–340.
Hobbs, R. C., Shelden, K. E. W., Vos, D. J., Goetz, K. T., and Rugh, D. J.
(2006). “Status review and extinction assessment of Cook Inlet belugas
(Delphinapterus leucas),” AFSC Processed Report 2006-16, pp. 1–74.
Karlsen, J. D., Bisther, A., Lydersen, C., Haug, T., and Kovacs, K. M.
(2002). “Summer vocalizations of adult male white whales
(Delphinapterus leucas) in Svalbard, Norway,” Pol. Biol. 25, 808–817.
Lammers, M. O., Brainard, R. E., Au, W. W. L., Mooney, T. A., and Wong,
K. (2008). “An ecological acoustic recorder (EAR) for long-term monitor-
ing of biological and anthropogenic sounds on coral reefs and other marine
habitats,” J. Acoust. Soc. Am. 123, 1720–1728.
Lesage, V., Barrette, C., Kingsley, M. C. S., and Sjare, B. (1999). “The
effect of vessel noise on the vocal behavior of belugas in the St. Lawrence
River Estuary, Canada,” Marine Mammal Sci. 15, 65–84.
Lowry, L., O’Corry-Crowe, G., and Goodman, D. (2006). “Delphinapterusleucas (Cook Inlet subpopulation),” in IUCN 2012, IUCN Red List of
Threatened Species, Version 2012.1, http://www.iucnredlist.org (Last
viewed 27 July 2012).
Rugh, D. J., Shelden, K. E. W., and Hobbs, R. C. (2010). “Range contraction
in a beluga whale population,” Endang. Species Res. 12, 69–75.
Simard, Y., Roy, N., Giard, S., Gervaise, C., Conversano, M., and Menard,
N. (2010). “Estimating whale density from their whistling activity:
Example with St. Lawrence beluga,” Appl. Acoust. 71, 1081–1086.
Simon, M., Wahlberg, M., and Miller, L. A. (2007). “Echolocation clicks
from killer whales (Orcinus orca) feeding on herring (Clupea harengus),”J. Acoust. Soc. Am. 121, 749–752.
Sjare, B. L., and Smith, T. G. (1986). “The vocal repertoire of white whales,
Delphinapterus leucas, summering in Cunningham Inlet, Northwest
Territories,” Can. J. Zool. 64, 407–415.
Thomsen, F., Franck, D., and Ford, J. K. B. (2001). “Characteristics of whis-
tles from the acoustic repertoire of resident killer whales (Orcinus orca)
off Vancouver Island, British Columbia,” J. Acoust. Soc. Am. 109,
1240–1246.
2504 J. Acoust. Soc. Am., Vol. 134, No. 3, Pt. 2, September 2013 Lammers et al.: Passive acoustic monitoring of belugas
Downloaded 30 Sep 2013 to 132.206.27.25. Redistribution subject to ASA license or copyright; see http://asadl.org/terms