passenger car equivalent (pce) of through vehicles at signalized ... · pdf filepassenger car...
TRANSCRIPT
IATSS ReSeARch Vol.33 No.2, 2009 ��
PASSENGER CAR EQUIVALENT (PCE) OF THROUGH VEHICLES AT SIGNALIZED INTERSECTIONS IN DHAkA METROPOLITAN CITY, BANGLADESH P. SAHA, DR. Q. S. HOSSAIN, H. M. I. MAHMUD, MD. Z. ISLAM
1. introdUction
The travel characteristics, road networks and local constraints are very different in the cities of developing countries than those of developed countries. It is there-fore necessary to determine the different parameters of traffic movements which are suitable for local urban trans-port system characteristics. One such effort is to deter-mine passenger car equivalent (PCE) values at signalized intersections using an established method for Dhaka Metropolitan City where the street networks, travel pat-terns and local constraints are completely different from any other city in the world.
In the design of a signalized intersection, it is very important to determine the saturation flow of that inter-section. Saturation flow is the maximum constant depar-
ture rate of queues from the stop line of an approach lane during the green signal period. An idealized view of saturation flow at signalized intersections is illustrated in Figure 11. However, saturation flows in vehicles per hour depend on the type and proportion of vehicles in the traf-fic stream2. In most developing countries, urban traffic flow is heterogeneous in nature. As a result it is necessary to convert heterogeneous traffic into a stream of homog-enous traffic by using appropriate passenger car equiva-lents (PCE) for analyzing mixed traffic. In addition, appropriate PCE are also used for capacity analysis as well as traffic engineering research.
The concept of the passenger car equivalent (PCE) was first introduced in the Highway Capacity Manual (HCM)3 to account for the effect of trucks and buses in the traffic stream. The Highway Capacity Manual4,5 de-
passenger car eqUiVaLent (pce) oF tHroUgH VeHicLes at signaLized intersections in dHaKa metropoLitan city, BangLadesH
Partha SAHALecturer
Department of civil engineeringWorld University of Bangladesh
Dhaka, Bangladesh
DR. Quazi Sazzad HOSSAINProfessor
Department of civil engineeringKhulna University of engineering & Technology
Khulna, Bangladesh
H. M. Iqbal MAHMUDAssistant Professor
Department of civil engineeringKhulna University of engineering & Technology
Khulna, Bangladesh
MD. Zahurul ISLAMJunior consultant
ADB ProjectWASA
Dhaka, Bangladesh
(Received August 6, 2009)
The road traffic systems, travel patterns and other traffic characteristics are different for each country due to differences in geometric patterns of a country, available transport facilities for commuters, rate of development in the transport sector and so on. Consequently, many standard relations and factors used in one region may not be suited for others. Therefore, an issue comes up to determine the different traffic engineering parameters which are appropriate to local urban transport system characteristics. One such endeavor is to determine the passenger car equivalent (PCE) at signalized intersections for the Dhaka Metropolitan City in Bangla-desh where traffic characteristics are completely different from any other cities of the world.
PCE currently used in Bangladesh is based on the values given in Geometric Design of Highways (MoC, 2001), which is the modification of the values given by webster (1958) on the study performed in the United kingdom in the 50’s and 60’s. But now-a-days, the situation is far different both for traffic and road user as the characteristics have changed from that time. Hence, in this paper an empirical study was carried out to determine the PCE of different types of vehicle that reflect the actual traffic conditions of Dhaka Metropolitan City. Data were collected from ten signalized intersections and the headway ratio method was used to estimate the PCE of different types of vehicle. The main vehicle compositions observed during the study period consist of passenger cars, auto-rick-shaws, mini-buses and buses. The PCE obtained in this study were compared to the values established earlier. It was found that the estimated PCE are smaller than those being used in Bangladesh.
Key Words: Passenger car equivalent (PCE), Headway ratio method, Saturation flow rate, Through traffic, Signalized intersections

100 IATSS ReSeARch Vol.33 No.2, 2009
TRANSPORTATION
fines PCE as “the number of passenger cars that are dis-placed by a single heavy vehicle of a particular type under prevailing roadway, traffic and control conditions”. In Bangladesh, vehicle types are divided into several cate-gories. Thus, the mixed traffic compositions encountered in Bangladesh, PCE of each category of vehicles has been found to be of major significance, particularly in the esti-mation of saturation flow at signalized intersections.
Passenger car equivalent (PCE) currently used in the design and analysis of signalized intersections in Dhaka Metropolitan City as well as in Bangladesh is based on the values given in the Geometric Design of Highways, Min-istry of Communication6. The values of PCE in the Geo-metric design of Highways are the modification of the PCE given by Webster7. These PCE derived in those re-search are shown in Table 1. The values determined by Webster7 are based on the study performed in the United Kingdom in the 50’s and 60’s. But now-a-days, more pow-erful vehicles are introduced on the roads through the use of automatic transmissions and by increasing the power to weight ratios and also the driver's behavior, traffic com-positions and the roadway characteristics in Bangladesh are far different from that of the original publication. As a result these values may not be representative of local traffic conditions in Bangladesh.
Furthermore, the number of vehicles and their com-positions in Dhaka Metropolitan City is increasing day by day with the increase of population. Statistics shows that the growth rate of motorized vehicles in Bangladesh is around 10 percent per annum8. Moreover, the composi-tions of the traffic at the studied intersections are very complex. Both motorized and non-motorized traffic moves through the intersections. There is no lane marking or lane restriction, no phase in the traffic signal for right turning vehicles, inadequate pedestrian facilities, poor parking
facilities, poor road surface condition and so on. To re-duce the effects of this increasing amount of vehicles and their compositions on the operational system of the sig-nalized intersections and considering other factors, it is necessary to determine the PCE on the basis of current roadway and traffic conditions of Dhaka Metropolitan City, Bangladesh.
Therefore, the objective of this paper is to determine the PCE that reflects the local traffic conditions in Dhaka Metropolitan City, Bangladesh. Emphasis was placed on the through movement of different types of vehicle. The main vehicle compositions observed during the study consist of passenger cars, auto-rickshaws, mini-buses and buses. The performance of the signalized intersections can be improved by using these PCE.
2. stUdy approacH
Methods commonly used for deriving PCE fall into two groups, specifically the headway ratio method and regression method. Headway ratio method has been used by Brown & Odgen9, Cuddon & Odgen10, Hasan et al.11 and William H.K. Lam2 while the regression method has been used by Branston and van Zuylen12 and Kimber et al.1. In this study, the headway ratio method was used for the calculation of PCE. According to Leong13, the satura-tion flow rate based on PCE of the headway ratio method predicts better than the saturation flow rate based on PCE of regression analysis.
This procedure is recommended by examining the condition — ‘necessary and sufficient condition for the effect of a certain type of vehicle to be independent of the type of vehicle preceding it and following it’. The follow-ing condition should be satisfied if it is wanted to calculate PCE by the headway ratio method10. It involves a com-
Fig.1 Graphic presentation of saturation flow1
Red RedGreen Amber
Effective green
Saturation flow
Starting lost time End lost time
Rat
e of
dis
char
ge o
f qu
eue
in fu
lly s
atur
ated
Table 1 PCE of different types of vehicle in UK7 and Bangladesh6
Vehicle categorieswebster 7
(1958)MoC 6 (2001)
Passenger car 1.00 1.00Light goods vehicle 1.00 1.00Heavy or medium goods vehicle 1.75 -Truck - 3.00Bus 2.25 3.00Tram 2.50 -Auto-rickshaw - 0.75Motorcycle, moped, scooter 0.3 0.75Pedal cycle 0.20 0.50

IATSS ReSeARch Vol.33 No.2, 2009 101
PASSENGER CAR EQUIVALENT (PCE) OF THROUGH VEHICLES AT SIGNALIZED INTERSECTIONS IN DHAkA METROPOLITAN CITY, BANGLADESH P. SAHA, DR. Q. S. HOSSAIN, H. M. I. MAHMUD, MD. Z. ISLAM
parison of two sides of Equation (1) as below:
hc – c + hx – x = hc – x + hx – c (1)
where,hc – c = Average headway of a car followed by a car;hc – x = Average headway of a car followed by a type x
vehicle;hx – c = Average headway of a type x vehicle followed by
a car;hx – x = Average headway of a type x vehicle followed by
a type x vehicle.
For those headway samples that do not exactly ful-fil the independence condition, a corrective factor needs to be applied. Scraggs14 has derived the proof of this con-dition and Kimber et al.1 and Brown and Odgen9 have explained in detail. Scraggs14 derived the corrective fac-tor (C) by using the least square method which is given in Equation (2):
C = abcd (w – x – y – + z)
abc + abd + acd + bcd (2)
wherea = Number of headways for car following car;b = Number of headways for car following type x vehicle;c = Number of headways for type x vehicle following car;d = Number of headways for type x vehicle following type
x vehicle;w = Mean headways for car following car;x = Mean headways for car following type x vehicle;y = Mean headways for type x vehicle following car; andz = Mean headways for type x vehicle following type x ve-
hicle.
Equation (3) represents the adjusted mean head-ways for a car following a car:
hA(c – c) = U –
C No. of headways car following car (3)
where,hA(c – c) = Adjusted mean headways for car following car;U = Uncorrected mean headway; andC = Correction factor
The adjusted mean headways for vehicle type X following vehicle type X can be represented as in Equa-tion (4):
hA(x – x) = U – C
No. of headways vehicle type X following vehicle type X
(4)
where, hA(x – x) = Adjusted mean headways for vehicle type x fol-lowing vehicle type xNote that passenger car equivalent (PCE) for through vehicles compares the headways for a given vehicle type with cars travelling straight through the intersection. Hence, the PCE is calculated using Equation (5):
ex = hA(x – x)
hA(c – c) (5)
3. site descriptions
The purpose of the site survey was to identify po-tential signalized intersections which are suitable for field data collection. The location of the intersections was in the Central Business District (CBD) area. The criteria for site selection have to accommodate significant flows of the selected vehicles (passenger cars, auto-rickshaws, mini-buses and buses) during times of the day when it operated at saturation. It is important to ensure that the signalized intersections being studied are fully saturated or have ad-equately saturated portions of the green interval of longer than 20 seconds15.
The sites selected for data collection are shown in Table 2. In this table ten intersections are listed with their approaches. Each approach of the intersection is de-scribed with the parameters of the number of lanes, width of lanes and percentage of vehicle types. The types of ve-hicle included cars, auto-rickshaws, mini-buses and buses. The trucks were not included in this analysis because this type of vehicle was restricted to enter into the city during the day time (i.e. 8 am to 8 pm).
4. data coLLection and metHodoLogy
Data were collected from through lanes at several signalized intersections in Dhaka Metropolitan City in Bangladesh. The selection of intersections was based on the following criteria: high traffic volumes and signifi-cant queuing, through lanes with protected signal phase, no parking allowed, and no bus blockages permitted. Be-fore starting data collection, the types of vehicle were divided into few categories, i.e. cars, auto-rickshaws, minibuses and buses. Data were collected in a similar fashion to the method used by Hossain16.
Data were collected by using an audio cassette re-corder which can measure the actual time headway be-tween successive straight-ahead vehicles. It was found that the observer may not have enough time to record the

102 IATSS ReSeARch Vol.33 No.2, 2009
TRANSPORTATION
actual time headway of different vehicles passing through the stop line. Thus, by using a cassette recorder, events in the observed lane such as beginning of green interval, the passage of the rear axle of each passing vehicle over the stop line (the rear axle was used because the first vehicle in the queue frequently stops over the stop line) as well as the vehicle type, the end of saturation flow and the begin-ning of amber and red interval can be noted. This method was judged to be fast and accurate, because the observer had only one task to perform in the field. The geometric data of specific lanes at signalized intersections such as lane width, approach grade, and turning radius were mea-sured.
Data were collected during peak periods on week days in dry weather when the intersections were saturat-ed. It is important to make sure that the traffic flows at signalized intersections being studied is saturated. A fully saturated cycle is one which the queue has not fully dis-charged by the beginning of the red interval2. Then by using the software BancianVer 200317, data were down-loaded from the audio cassette to computer for analysis.
In order to estimate the PCE, headways for satura-tion flows were used and the first four vehicles crossing the stop line were excluded to eliminate the effects of queue start-up as vehicles accelerated.
5. resULts and discUssion
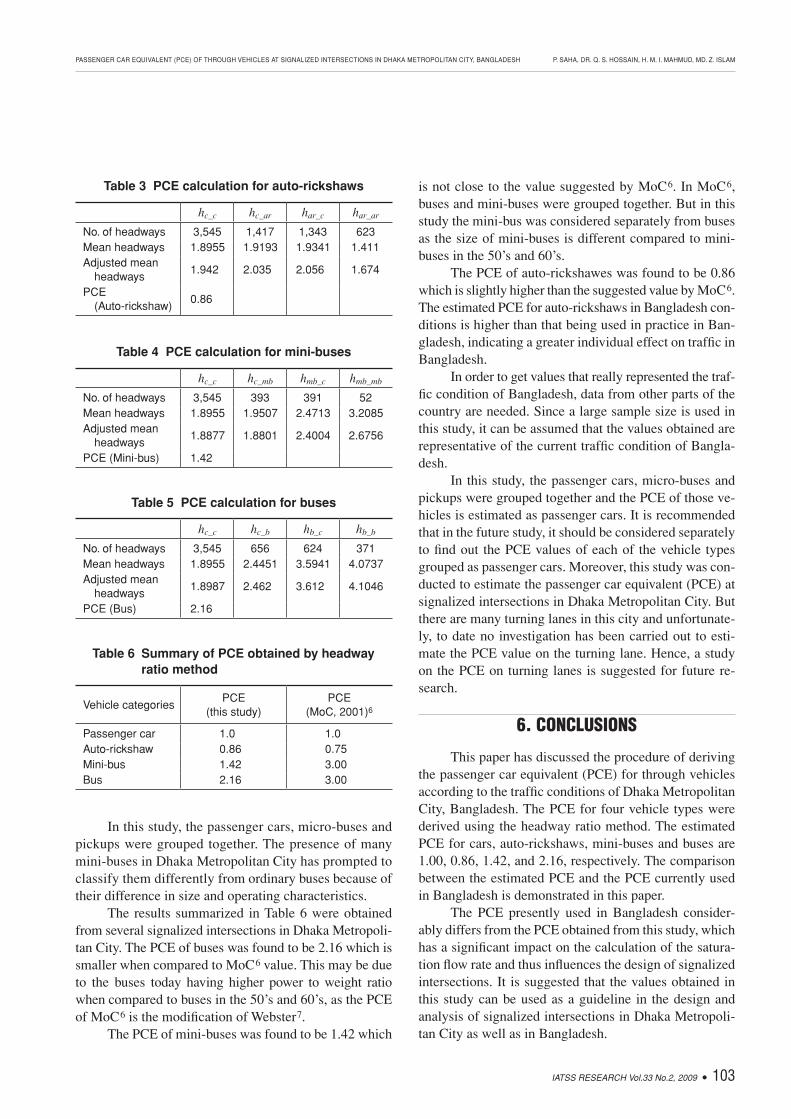
The processed data for through lanes with a level gradient were analyzed to estimate the passenger car equivalents (PCE) for cars, auto-rickshaws, mini-buses and buses using the headway ratio method. In the survey, a detailed record of vehicle departures was made by the observers with event-recording equipment. Hence, the inter-vehicle straight-ahead time headways can be calcu-lated by vehicle type. The PCE computed based on the headway ratio method for auto-rickshaws, mini-buses and buses are shown in Tables 3, 4 and 5 respectively.
The summary of PCE derived using the headway ratio method for each type of vehicle is shown in Table 6. Comparison of PCE obtained from MoC6 was also made and is shown in Table 6.
Table 2 Intersection descriptions
Intersection and Approach Name of the ApproachNo. of lanes in each direction
width of lane (m)
Percentage of vehicle types(Car : Auto-rickshaw : Mini-bus : Bus)
Gul -1 Approach -1 Gulshan Avenue 3 3.42 78:20:1:1Gul -1 Approach - 2 Bir Uttom Mir Sowkat Sarak 3 3.66 72:19:4:5Gul -1 Approach - 3 Gulshan Avenue 3 3.55 62:24:1:13Gul -1 Approach - 4 Gulshan Avenue 3 3.41 62:23:8:7Gul -2 Approach - 1 Bir Uttom Mir Sowkat Sarak 4 3.21 72:20:1:7Gul -2 Approach - 2 Bir Uttom Mir Sowkat Sarak 4 3.05 74:20:2:4Gul -2 Approach -3 Nazmul Haque Avenue 3 3.66 65:24:5:6Gul -2 Approach - 4 kamal Ataturk Avenue 4 3.10 66:21:6:7kalabagan Approach-1 Mirpur Road 3 3.40 58:18:8:16kalabagan Approach-2 Mirpur Road 3 3.33 61:19:4:16kata Ban Approach-1 Elephant Road 2 3.11 43:19:25:13kata Ban Approach-2 New Elephant Road 2 3.30 66:20:1:13Nilkhet Approach -1 Mirpur Road 3 3.97 50:15:8:27Nilkhet Approach -2 Azimpur Road 3 3.86 40:26:3:30Shahbag Approach-1 kazi Nazrul Islam Avenue 3 3.51 69:29:0:2Shahbag Approach-2 kazi Nazrul Islam Avenue 2 4.39 73:25:1:1
Shahbag Approach-3Mowlana Hamid khan
Bhasani Road3 4.18 46:23:2:29
Shahbag Approach-4 Elephant Road 2 4.18 49:19:18:14Science Lab Approach-1 Mirpur Road 3 3.38 52:16:12:20Science Lab Approach-2 Mirpur Road 2 3.20 46:19:18:17Zero Point Approach-1 Abdul Goni Road 3 3.08 52:21:0:27Zero Point Approach-2 Abdul Goni Road 3 3.48 53:20:7:21Zero Point Approach-3 Shahid Nazrul Islam Sarani 3 3.43 48:26:7:20High Court College Road 2 3.45 61:28:0:11Tikatuli Hatkhola Road 2 3.33 42:22:4:32
IATSS ReSeARch Vol.33 No.2, 2009 103
PASSENGER CAR EQUIVALENT (PCE) OF THROUGH VEHICLES AT SIGNALIZED INTERSECTIONS IN DHAkA METROPOLITAN CITY, BANGLADESH P. SAHA, DR. Q. S. HOSSAIN, H. M. I. MAHMUD, MD. Z. ISLAM
In this study, the passenger cars, micro-buses and pickups were grouped together. The presence of many mini-buses in Dhaka Metropolitan City has prompted to classify them differently from ordinary buses because of their difference in size and operating characteristics.
The results summarized in Table 6 were obtained from several signalized intersections in Dhaka Metropoli-tan City. The PCE of buses was found to be 2.16 which is smaller when compared to MoC6 value. This may be due to the buses today having higher power to weight ratio when compared to buses in the 50’s and 60’s, as the PCE of MoC6 is the modification of Webster7.
The PCE of mini-buses was found to be 1.42 which
is not close to the value suggested by MoC6. In MoC6, buses and mini-buses were grouped together. But in this study the mini-bus was considered separately from buses as the size of mini-buses is different compared to mini-buses in the 50’s and 60’s.
The PCE of auto-rickshawes was found to be 0.86 which is slightly higher than the suggested value by MoC6. The estimated PCE for auto-rickshaws in Bangladesh con-ditions is higher than that being used in practice in Ban-gladesh, indicating a greater individual effect on traffic in Bangladesh.
In order to get values that really represented the traf-fic condition of Bangladesh, data from other parts of the country are needed. Since a large sample size is used in this study, it can be assumed that the values obtained are representative of the current traffic condition of Bangla-desh.
In this study, the passenger cars, micro-buses and pickups were grouped together and the PCE of those ve-hicles is estimated as passenger cars. It is recommended that in the future study, it should be considered separately to find out the PCE values of each of the vehicle types grouped as passenger cars. Moreover, this study was con-ducted to estimate the passenger car equivalent (PCE) at signalized intersections in Dhaka Metropolitan City. But there are many turning lanes in this city and unfortunate-ly, to date no investigation has been carried out to esti-mate the PCE value on the turning lane. Hence, a study on the PCE on turning lanes is suggested for future re-search.
6. concLUsions
This paper has discussed the procedure of deriving the passenger car equivalent (PCE) for through vehicles according to the traffic conditions of Dhaka Metropolitan City, Bangladesh. The PCE for four vehicle types were derived using the headway ratio method. The estimated PCE for cars, auto-rickshaws, mini-buses and buses are 1.00, 0.86, 1.42, and 2.16, respectively. The comparison between the estimated PCE and the PCE currently used in Bangladesh is demonstrated in this paper.
The PCE presently used in Bangladesh consider-ably differs from the PCE obtained from this study, which has a significant impact on the calculation of the satura-tion flow rate and thus influences the design of signalized intersections. It is suggested that the values obtained in this study can be used as a guideline in the design and analysis of signalized intersections in Dhaka Metropoli-tan City as well as in Bangladesh.
Table 3 PCE calculation for auto-rickshaws
hc–c hc–ar har–c har–ar
No. of headways 3,545 1,417 1,343 623Mean headways 1.8955 1.9193 1.9341 1.411Adjusted mean
headways1.942 2.035 2.056 1.674
PCE (Auto-rickshaw)
0.86
Table 6 Summary of PCE obtained by headway ratio method
Vehicle categoriesPCE
(this study)PCE
(MoC, 2001)6
Passenger car 1.0 1.0Auto-rickshaw 0.86 0.75Mini-bus 1.42 3.00Bus 2.16 3.00
Table 5 PCE calculation for buses
hc–c hc–b hb–c hb–b
No. of headways 3,545 656 624 371Mean headways 1.8955 2.4451 3.5941 4.0737Adjusted mean
headways1.8987 2.462 3.612 4.1046
PCE (Bus) 2.16
Table 4 PCE calculation for mini-buses
hc–c hc–mb hmb–c hmb–mb
No. of headways 3,545 393 391 52Mean headways 1.8955 1.9507 2.4713 3.2085Adjusted mean
headways1.8877 1.8801 2.4004 2.6756
PCE (Mini-bus) 1.42

104 IATSS ReSeARch Vol.33 No.2, 2009
TRANSPORTATION
reFerences1. kimber, R. M., McDonald, M. and Hounsell, N. B. The predic-
tion of saturation flows for road junctions controlled by traffic signals. Research Report 67. Department of Transport, Trans-portation and Road Research Laboratory, Her Majesty’s Stationery Office, London. pp. 1-14. (1986).
2. Lam, w.H.k. Saturation flows and passenger car equivalents at signalized Intersections in Hong kong. Proceedings of the 2nd International Symposium on Highway Capacity (Akcelik, R., ed.). Australian Road Research Board, Vol. 2: pp. 385-394. (1994).
3. Highway Research Board. Highway Capacity Manual, Na-tional Research Council, Department of Traffic and Opera-tions, Special Report 87. Committee on Highway Capacity, washington, D.C., U.S.A. (1965).
4. Transportation Research Board. Chapter 9: Signalized inter-section. Highway Capacity Manual. National Research Coun-cil, washington, D.C., U.S.A. (1994)
5. Transportation Research Board. Chapter 16: Signalized in-tersection. Highway Capacity Manual. National Research Council, washington, D.C., U.S.A. (2000).
6. Ministry of Communication. Geometric design standards of Roads and Highways Department. Government of the Peo-ple’s Republic of Bangladesh. (2001).
7. webster, F.V. Traffic signal settings. Laboratory Technical Paper 39. Road Research Laboratory, Crowthorne, U.k. (1958).
8. Bari, M. F. and Alam, F. Road Transport. http://banglapedia.com/. (2000). Accessed on: 5 June 2009.
9. Brown, G. E. and Ogden, k. w. The Effect of Vehicle Catego-ry on Traffic Signal Design: A Re-Examination of Through Car Equivalents. Proceedings 14th ARRB Conference, Part 2. pp. 27–37. (1988).
10. Cuddon, A.P. and Ogden, k.w. The effect of heavy vehicles on saturation flows at signalized intersections. Proceedings of the 16th ARRB Conference, Perth, Australia, November 9-13, 16(5). pp. 1-18. (1992).
11. Hasan, A. Sohadi, R.U.R. and karim, M.R. Passenger car unit (pcu) of through vehicles under Malaysian condition. The Monthly Bulletin of the Institution of Engineers Malaysia: pp. 5–9. (1993).
12. Branston, D., and H. van Zuylen. The Estimation of Saturation Flows, Effective Green Time and Passenger Car Equivalents at Traffic Signals by Multiple Linear Regression. Transportation Research, Vol. 12: pp. 47–53. (1978).
13. Leong, L. V. A study on saturation flow rates of through ve-hicles at signalized intersections based on Malaysian road conditions. Ph.D. thesis. Universiti Sains Malaysia. (2004).
14. Scraggs, D.A. The passenger car equivalent of a heavy ve-hicle in single lane flow at traffic signals. Road Research Laboratory, Note No. LN 573/DAS, U.k. (1964).
15. Teply, S., Allingham, D.I., Richardson, D.B. and Stepheson, B.w. Canadian Capacity Guide for Signalised Intersections. Second edition, (S. Teply ed.) District 7, Institute of Transpor-tation Engineers, Canada. (1995).
16. Hosain, Q. S. Estimation of turning lane adjustment factors at signalised intesections according to Malaysian traffic con-ditions. PhD thesis. School of Civil Engineering, University Science Malaysia, Malaysia. (2007).
17. University Science Malaysia. Bancian Users Guide, Highway & Transportation Engineering Group (HiTEG). School of
Civil Engineering, University Science Malaysia, Malaysia. (2003).