passage behavior and survival for radio-tagged yearling
TRANSCRIPT

Passage Behavior and Survival for Radio-Tagged Yearling Chinook Salmon and
Juvenile Steelhead at Lower Monumental Dam, 2007
Eric E. Hockersmith, Gordon A. Axel, Darren A. Ogden, Brian J. Burke, Kinsey E. Frick,
Benjamin P. Sandford, and Randall F. Absolon
Report of research by
Fish Ecology Division
Northwest Fisheries Science Center
National Marine Fisheries Service
National Oceanic and Atmospheric Administration
2725 Montlake Boulevard East
Seattle, Washington 98112
to
Walla Walla District
Northwestern Division
U.S. Army Corps of Engineers
201 North 3rd
Walla Walla, WA 99362-1875
Contract W68SBV92844866
July 2008

ii
iii
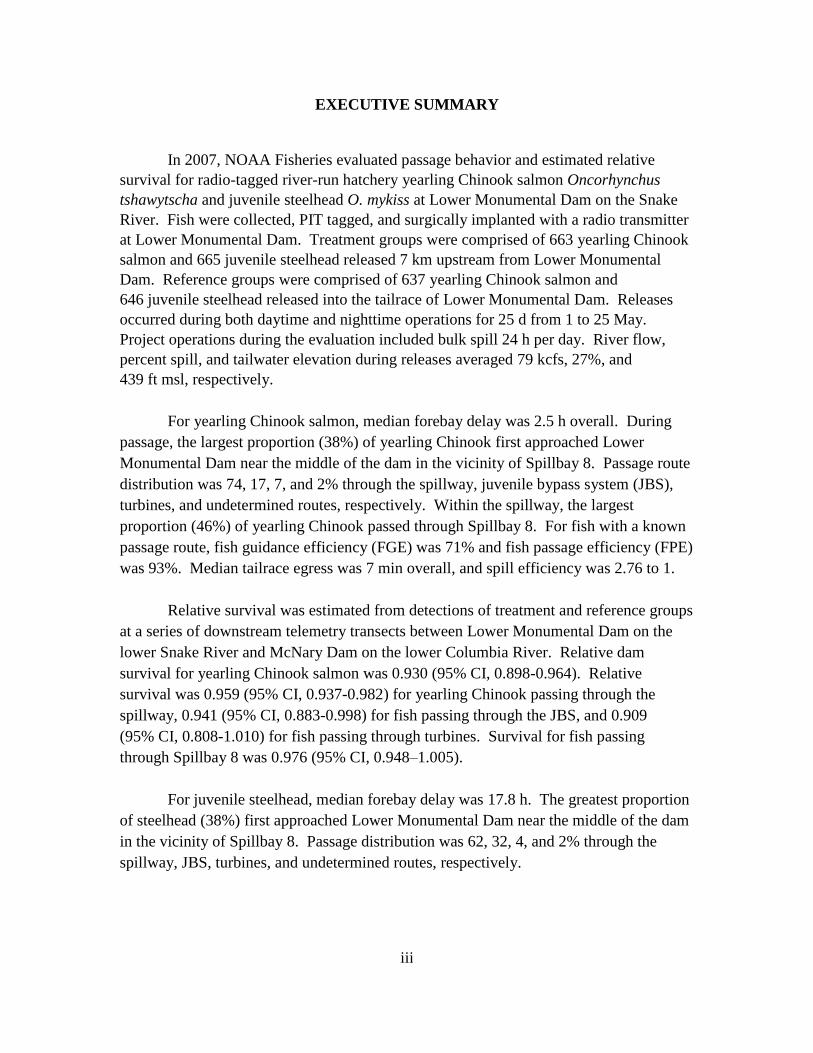
EXECUTIVE SUMMARY
In 2007, NOAA Fisheries evaluated passage behavior and estimated relative
survival for radio-tagged river-run hatchery yearling Chinook salmon Oncorhynchus
tshawytscha and juvenile steelhead O. mykiss at Lower Monumental Dam on the Snake
River. Fish were collected, PIT tagged, and surgically implanted with a radio transmitter
at Lower Monumental Dam. Treatment groups were comprised of 663 yearling Chinook
salmon and 665 juvenile steelhead released 7 km upstream from Lower Monumental
Dam. Reference groups were comprised of 637 yearling Chinook salmon and
646 juvenile steelhead released into the tailrace of Lower Monumental Dam. Releases
occurred during both daytime and nighttime operations for 25 d from 1 to 25 May.
Project operations during the evaluation included bulk spill 24 h per day. River flow,
percent spill, and tailwater elevation during releases averaged 79 kcfs, 27%, and
439 ft msl, respectively.
For yearling Chinook salmon, median forebay delay was 2.5 h overall. During
passage, the largest proportion (38%) of yearling Chinook first approached Lower
Monumental Dam near the middle of the dam in the vicinity of Spillbay 8. Passage route
distribution was 74, 17, 7, and 2% through the spillway, juvenile bypass system (JBS),
turbines, and undetermined routes, respectively. Within the spillway, the largest
proportion (46%) of yearling Chinook passed through Spillbay 8. For fish with a known
passage route, fish guidance efficiency (FGE) was 71% and fish passage efficiency (FPE)
was 93%. Median tailrace egress was 7 min overall, and spill efficiency was 2.76 to 1.
Relative survival was estimated from detections of treatment and reference groups
at a series of downstream telemetry transects between Lower Monumental Dam on the
lower Snake River and McNary Dam on the lower Columbia River. Relative dam
survival for yearling Chinook salmon was 0.930 (95% CI, 0.898-0.964). Relative
survival was 0.959 (95% CI, 0.937-0.982) for yearling Chinook passing through the
spillway, 0.941 (95% CI, 0.883-0.998) for fish passing through the JBS, and 0.909
(95% CI, 0.808-1.010) for fish passing through turbines. Survival for fish passing
through Spillbay 8 was 0.976 (95% CI, 0.948–1.005).
For juvenile steelhead, median forebay delay was 17.8 h. The greatest proportion
of steelhead (38%) first approached Lower Monumental Dam near the middle of the dam
in the vicinity of Spillbay 8. Passage distribution was 62, 32, 4, and 2% through the
spillway, JBS, turbines, and undetermined routes, respectively.

iv
Within the spillway, the largest proportion of steelhead (35%) passed through Spillbay 8.
For fish with a known passage route, FGE was 90% and FPE was 96%. Median tailrace
egress was 8 minutes overall, and spill efficiency was 2.45 to 1.
Relative dam survival was 0.888 (95% CI, 0.854–0.923) for juvenile steelhead.
Relative survival was 0.939 (95% CI, 0.905-0.975) for juvenile steelhead passing through
the spillway and 0.986 (95% CI, 0.955-1.018) for those passing through the JBS.
Survival for juvenile steelhead passing through Spillbay 8 was 0.923 (95% CI,
0.879-0.968).

v
CONTENTS
EXECUTIVE SUMMARY ............................................................................................... iii
INTRODUCTION .............................................................................................................. 1
METHODS ......................................................................................................................... 3
Study Area .............................................................................................................. 3
Fish Collection, Tagging, and Release ................................................................... 4
Telemetry Monitoring ............................................................................................. 5
Data Processing and Analysis ................................................................................. 7
Forebay Residence Time............................................................................. 7
Approach and Passage Distribution ............................................................ 8
Fish Passage Performance Metrics ............................................................. 8
Tailrace Egress ............................................................................................ 9
Survival Estimates ...................................................................................... 9
Avian Predation ........................................................................................ 11
RESULTS ......................................................................................................................... 13
Fish Collection, Tagging, and Release ................................................................. 13
Project Operations ................................................................................................. 18
Forebay Residence Time....................................................................................... 22
Fish Passage Performance Metrics ....................................................................... 28
Tailrace Egress ...................................................................................................... 28
Survival Estimates ................................................................................................ 30
Detection Probability ................................................................................ 30
Project Survival ......................................................................................... 30
Route-Specific Survival ............................................................................ 30
Avian Predation .................................................................................................... 32
DISCUSSION ................................................................................................................... 35
ACKNOWLEDGMENTS ................................................................................................ 38
REFERENCES ................................................................................................................. 39
APPENDIX A: Evaluation of Study Assumptions .......................................................... 43
APPENDIX B: Grouping of Treatment and Reference Release Groups for Estimating
Survival ................................................................................................................. 57
APPENDIX C: Telemetry Data Processing and Reduction ............................................ 66

vi

INTRODUCTION
The Columbia and Snake River Basins have historically produced some of the
largest runs of Chinook salmon Oncorhynchus tshawytscha and steelhead O. mykiss in
the world (Netboy 1980). More recently, however, some stocks have decreased to levels
that warrant listing under the U.S. Endangered Species Act of 1973 (NMFS 1991, 1992,
1998, 1999). Anthropogenic factors that have contributed to the decline and loss of some
salmonid stocks include overfishing, hatchery practices, logging, mining, agricultural
practices, and dam construction and operation (Nehlsen et al. 1991). A primary focus of
recovery efforts for depressed stocks has been assessing and improving fish passage
conditions at dams.
The spillway has long been considered the safest passage route for migrating
juvenile salmonids at Columbia and Snake River dams. Holmes (1952) reported survival
estimates of 96 (weighted average) to 97% (pooled) for fish passing Bonneville Dam
spillway during the 1940s. A review of 13 estimates of spillway mortality published
through 1995 concluded that for fish passing via standard spillbays, mortality rates most
likely range from 0 to 2% (Whitney et al. 1997). Similarly, recent survival studies of
juvenile salmonid passage through various routes at dams on the lower Snake River have
indicated that survival was highest through spillways, followed by bypass systems, then
turbines (Muir et al. 2001). Pursuant to the National Marine Fisheries Service (NMFS)
2000 Biological Opinion (NMFS 2000), project operations at Lower Monumental Dam
have relied on a combination of voluntary spill and collection of fish for transportation to
improve hydropower system passage survival for migrating juvenile salmonids.
Juvenile anadromous salmonids in the Columbia River Basin generally migrate in
the upper 3 to 6 m of the water column (Johnson et al. 2000; Beeman and Maule 2006).
However, juvenile fish passage routes at dams on the lower Columbia and Snake Rivers
require fish to dive to depths of 15 to 18 m in order to enter a passage route. Engineers
and biologists within the U.S. Army Corps of Engineers (USACE) developed a
removable spillway weir (RSW) to provide surface-oriented spillway passage. The RSW
uses a traditional spillway and is attached to the upstream face of the spillbay. In the
lower Snake River, RSWs were installed at Lower Granite Dam in 2001 and Ice Harbor
Dam in 2005. The RSW at Lower Granite Dam has reduced migrational delays,
improved fish passage efficiency, and provided increased passage survival (Plumb et al.
2003, 2004).

2
An RSW is being designed and constructed for installation at Lower Monumental
Dam and is expected to be operational in 2008. The proposed location for an RSW at
Lower Monumental Dam is Spillbay 8 because the majority of fish first approach the dam
in this area (Hockersmith et al. 2005; Johnson et al. 1998).
In 2007 we examined passage behavior and survival at Lower Monumental Dam
during voluntary bulk spill for yearling Chinook salmon and juvenile steelhead. The goal
of this study was to collect baseline data on passage behavior and survival for comparison
to passage behavior and survival after installation of an RSW at Lower Monumental
Dam. Results of this study will be used to inform management decisions for
development and operation of an RSW at Lower Monumental Dam and to optimize
survival and passage for juvenile salmonids. This study addressed research needs
outlined in SPE-W-00-1 of the USACE, Northwestern Division, Anadromous Fish
Evaluation Program.
3
METHODS
Study Area
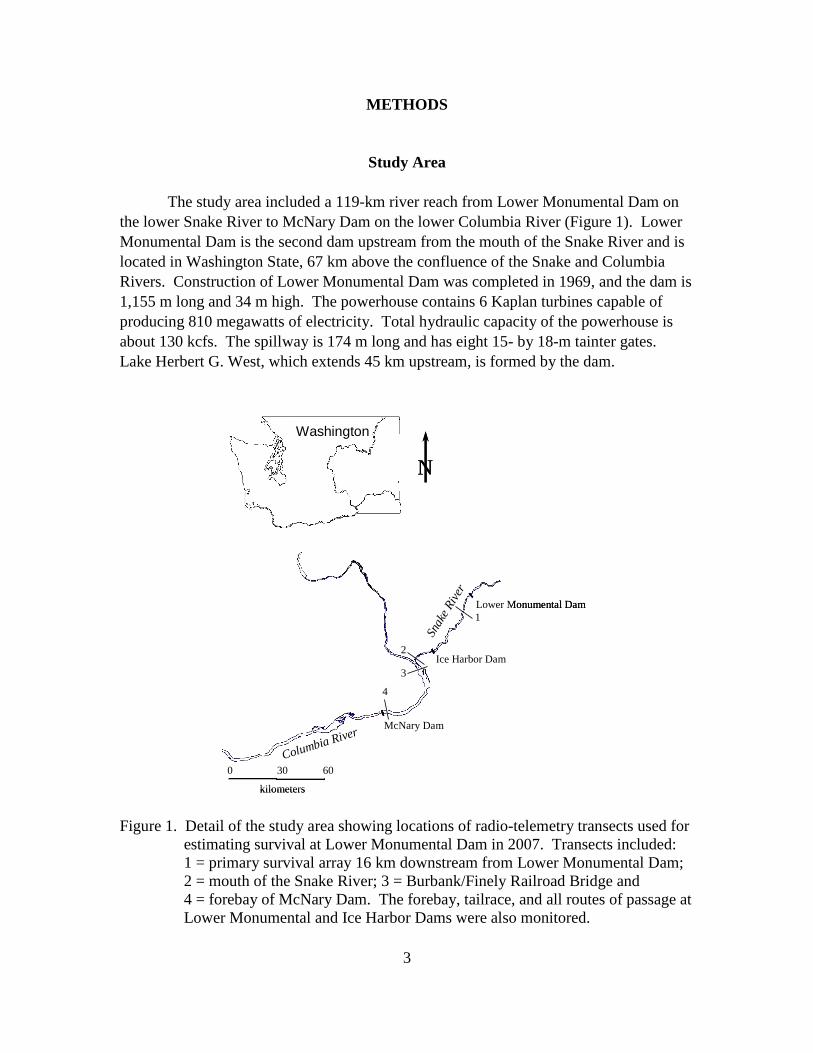
The study area included a 119-km river reach from Lower Monumental Dam on
the lower Snake River to McNary Dam on the lower Columbia River (Figure 1). Lower
Monumental Dam is the second dam upstream from the mouth of the Snake River and is
located in Washington State, 67 km above the confluence of the Snake and Columbia
Rivers. Construction of Lower Monumental Dam was completed in 1969, and the dam is
1,155 m long and 34 m high. The powerhouse contains 6 Kaplan turbines capable of
producing 810 megawatts of electricity. Total hydraulic capacity of the powerhouse is
about 130 kcfs. The spillway is 174 m long and has eight 15- by 18-m tainter gates.
Lake Herbert G. West, which extends 45 km upstream, is formed by the dam.
Figure 1. Detail of the study area showing locations of radio-telemetry transects used for
estimating survival at Lower Monumental Dam in 2007. Transects included:
1 = primary survival array 16 km downstream from Lower Monumental Dam;
2 = mouth of the Snake River; 3 = Burbank/Finely Railroad Bridge and
4 = forebay of McNary Dam. The forebay, tailrace, and all routes of passage at
Lower Monumental and Ice Harbor Dams were also monitored.
Washington
Lower Monumental Dam
Ice Harbor Dam
McNary Dam
0 30 60
kilometers
2
3
4
Snak
e R
iver
Columbia River
N
1
WashingtonWashington
Lower Monumental Dam
Ice Harbor Dam
McNary Dam
0 30 60
kilometers
2
3
4
Snak
e R
iver
Columbia River
N
1

4
Fish Collection, Tagging, and Release
Radio tags were purchased from Advanced Telemetry Systems Inc.1, had a
user-defined shut-off after 10 d, and were pulse-coded for identification of individual
fish. Each radio tag measured 13.2 mm in length by 6.2 mm in diameter, had a volume of
257 mm3, and weighed 1.0 g in air. Each tag had a 30-cm long external antenna.
River-run, hatchery yearling Chinook salmon and juvenile steelhead were
collected from the smolt collection facility at Lower Monumental Dam from 29 April to
23 May. We used only hatchery-origin yearling Chinook salmon and run-of-the-river
juvenile steelhead that were not previously PIT tagged, that had no visual signs of disease
or injury, and that weighed 12 g or more. Fish were anesthetized with tricaine
methanesulfonate (MS-222) and sorted in a recirculating anesthetic system. Fish for
treatment and reference release groups were randomly selected from the daily
smolt-monitoring sample and transferred through a water-filled, 10.2-cm hose to a
935-L holding tank. Following collection and sorting, fish were maintained via
flow-through river water and held a minimum of 18 h prior to radio tagging.
Fish were surgically tagged with a radio transmitter using techniques described by
Adams et al. (1998). A PIT tag was also inserted with the radio transmitter so that test
fish could be separated by code in the fish collection system and returned to the river
(Marsh et al. 1999). Surgical tagging was conducted simultaneously at four tagging
stations. During a 4-h shift, approximately 160 fish were tagged.
Immediately following tagging, fish were placed into aerated 9-L buckets until
they recovered from the anesthesia (2 fish per bucket). Buckets were then closed and
placed into a large holding tank (1.5-m wide, 2.5-m long, 0.5-m deep) that
accommodated up to 28 buckets and into which flow-through water was applied during
tagging and holding. Fish were held a minimum of 24 h with flow-through water for
recovery and determination of post-tagging mortality.
Release procedures followed those used in 2004 at Lower Monumental Dam
during a study to evaluate passage and survival (Hockersmith et al. 2005). After a
post-tagging recovery period, fish were transported in their recovery buckets placed
within holding tanks to release locations (7 km upstream from Lower Monumental Dam
or into the tailrace). Immediately prior to transport to release locations, transmitters of all
tagged fish were checked for operation and to verify that codes were recorded correctly in
the database. To provide mixing of treatment and reference groups, treatment groups
1 Reference to trade names does not imply endorsement by the National Marine Fisheries Service, NOAA.
5
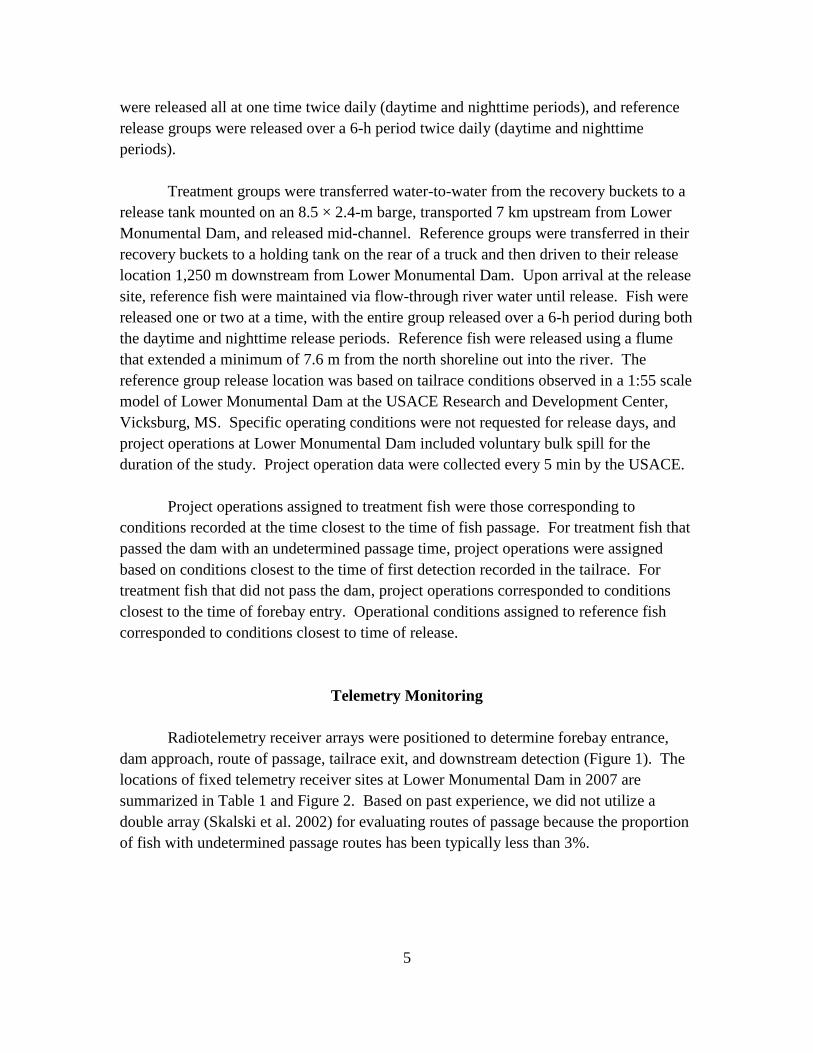
were released all at one time twice daily (daytime and nighttime periods), and reference
release groups were released over a 6-h period twice daily (daytime and nighttime
periods).
Treatment groups were transferred water-to-water from the recovery buckets to a
release tank mounted on an 8.5 × 2.4-m barge, transported 7 km upstream from Lower
Monumental Dam, and released mid-channel. Reference groups were transferred in their
recovery buckets to a holding tank on the rear of a truck and then driven to their release
location 1,250 m downstream from Lower Monumental Dam. Upon arrival at the release
site, reference fish were maintained via flow-through river water until release. Fish were
released one or two at a time, with the entire group released over a 6-h period during both
the daytime and nighttime release periods. Reference fish were released using a flume
that extended a minimum of 7.6 m from the north shoreline out into the river. The
reference group release location was based on tailrace conditions observed in a 1:55 scale
model of Lower Monumental Dam at the USACE Research and Development Center,
Vicksburg, MS. Specific operating conditions were not requested for release days, and
project operations at Lower Monumental Dam included voluntary bulk spill for the
duration of the study. Project operation data were collected every 5 min by the USACE.
Project operations assigned to treatment fish were those corresponding to
conditions recorded at the time closest to the time of fish passage. For treatment fish that
passed the dam with an undetermined passage time, project operations were assigned
based on conditions closest to the time of first detection recorded in the tailrace. For
treatment fish that did not pass the dam, project operations corresponded to conditions
closest to the time of forebay entry. Operational conditions assigned to reference fish
corresponded to conditions closest to time of release.
Telemetry Monitoring
Radiotelemetry receiver arrays were positioned to determine forebay entrance,
dam approach, route of passage, tailrace exit, and downstream detection (Figure 1). The
locations of fixed telemetry receiver sites at Lower Monumental Dam in 2007 are
summarized in Table 1 and Figure 2. Based on past experience, we did not utilize a
double array (Skalski et al. 2002) for evaluating routes of passage because the proportion
of fish with undetermined passage routes has been typically less than 3%.

6
Table 1. Locations of fixed-site telemetry receivers for evaluating passage behavior and survival at Lower Monumental Dam, 2007.
Location
Number of
receivers Type of monitoring Antenna type
Forebay 3 Entrance line and timing 3-element Yagi
Turbine units 1-6 6 Approach and passage location Striped coax
Spillbays 1-8 8 Approach and passage location Underwater dipole
Stilling basin 2 Project passage Tuned loop
Juvenile bypass system 1 Bypass passage Tuned loop
Turbine unit draft tubes 3 Project passage Underwater dipole
Tailrace exit 2 Project passage and egress 3-element Yagi
Total receivers 25
Figure 2. Lower Monumental Dam plan view showing approximate locations of
detection zones for radiotelemetry receivers in 2007. Oval lines represent
underwater antennas, and triangular lines represent aerial antennas.
Tailrace exit line
Stilling basin
SpillwayPowerhouse
Juvenile bypass system
Forebay entrance line
Tailrace exit line
Stilling basin
SpillwayPowerhouse
Juvenile bypass system
Forebay entrance line

7
Data Processing and Analysis
Telemetry data were retrieved through an automated process that downloaded
networked telemetry receivers up to four times daily. Data processing and reduction are
summarized in Appendix Figure C. After downloading, individual data files were
compressed by recording the first time a radio-tagged fish was detected and counting the
number of detections where the time-difference between adjacent detections was less
than or equal to 5 min. When the difference between adjacent detections became greater
than 5 min, a new line of data was created. All compressed data were combined and
loaded into a database, where automated queries and algorithms were used to remove
erroneous data. On the cleaned data set, detailed detection histories were created for each
radio-tagged fish. These detection histories were used to calculate arrival time in the
forebay, forebay approach patterns, passage-route distribution and timing, tailrace exit
timing, and timing of downstream detections for individual radio-tagged fish.
Forebay Residence Time
Forebay arrival time was based on the first time a fish was detected on the forebay
entry line at the upstream end of the boat restricted zone (BRZ) at Lower Monumental
Dam (approximately 500 m upstream from the face of the dam). Forebay residence time
was determined for fish that had been released upstream from Lower Monumental Dam
and detected entering the forebay, detected in a passage route, and detected in the
immediate tailrace on the stilling-basin, turbine draft tube, or tailrace-exit telemetry
receivers (Figure 2). Forebay residence time for individual fish was calculated as the
difference between the time of last detection in a passage route and the first detection on
the forebay entrance line at the upstream end of the BRZ.
Overall forebay residence time was characterized by constructing means and 95%
confidence intervals (i.e. the mean ± t(0.05, n-1) standard errors, where t was the t-value,
given n - 1 degrees of freedom and α = 0.05, and was approximately 2.0) for the 10th
,
50th
, and 90th
percentiles of the residence time distributions. Replicates were fish
grouped by dam passage day. These intervals were also constructed by route of passage
(i.e., bypass, turbine, and spillway) where reasonable. For groups with insufficient
sample size for replicates, intervals for all or some percentiles were not constructed (e.g.,
turbine and some bypass). Time in the bypass route was divided into gatewell and
post-gatewell segments.
Differences in forebay residence time for bypassed vs. non-bypassed fish were
estimated for paired replicates by constructing confidence intervals as above for the 10th,
50th (median), and 90th percentiles. Paired t-tests were calculated to assess statistical
significance for = 0.05.

8
Approach and Passage Distribution
Approach patterns were established based on the first detection at either
underwater dipole spillway antennas (Beeman et al. 2004) or on stripped coax underwater
antennas (Knight et al. 1977) on the standard-length traveling screens. Route of passage
through the dam was based on the last time a fish was detected on a passage-route
antenna and was assigned only to fish that were subsequently detected in the tailrace on
either the stilling-basin, turbine draft tube, or tailrace-exit telemetry receivers (Figure 2).
Tailrace detections were used to validate passage because fish could be detected on a
passage-route receiver while still in the forebay.
Spillway passage was assigned to fish that were detected in the tailrace of the dam
after last being detected in the forebay on one of the eight antenna arrays that were
deployed along each of the two pier noses on the sides of individual spillbays.
Powerhouse passage was assigned to fish last detected in a turbine intake prior to
detection in the tailrace of the dam. Fish passing via the powerhouse were further
partitioned into either turbine or juvenile bypass system (JBS) passage based on the
presence or absence of a detection in the JBS (either PIT-tag or telemetry detection).
Fish that were assigned to powerhouse passage but that did not have a detection in the
JBS were assigned to turbine passage. For analysis of passage-route distributions, we
included only fish that had been released upstream from Lower Monumental Dam,
detected entering the forebay, detected again in a passage route, and detected a third time
in the immediate tailrace either on the stilling-basin, turbine draft tube, or tailrace-exit
telemetry receivers.
Fish Passage Performance Metrics
Fish passage performance metrics included spill efficiency, spill effectiveness,
fish passage efficiency (FPE), and fish guidance efficiency (FGE). These metrics were
estimated as follows:
Spill efficiency: Number of fish passing the dam via the spillway divided by the total
number of fish passing the dam.
Spill effectiveness: Proportion of fish passing the dam via the spillway divided by the
proportion of water spilled.
FPE: Number of fish passing the dam through non-turbine routes divided by total
number of fish passing the dam.
FGE: Number of fish passing the dam through the JBS divided by the total number of
fish passing the dam through the powerhouse (turbines and JBS).

9
Tailrace Egress
For analysis of tailrace egress, we included only fish that had been released
upstream from Lower Monumental Dam, detected entering the forebay, detected again in
a passage route, and detected a third time in the immediate tailrace. Tailrace egress time
for individual fish was calculated as the difference between time of last detection in a
passage route and time of last detection on the tailrace-exit array.
Overall tailrace egress time was characterized by constructing means and 95%
confidence intervals (i.e. means +- t(0.05, n-1) standard errors, where t was the t-value, given
n-1 degrees of freedom and α = 0.05, and was approximately 2.0) for the 10th
, 50th
and
90th
percentiles of the egress time distributions. Replicates were fish grouped by passage
day. These intervals were also constructed by route of passage (i.e., bypass, turbine, and
spillway) where reasonable. For groups with insufficient sample size for replicates,
intervals for all or some percentiles were not constructed (e.g., turbine and some bypass).
Survival Estimates
Survival estimates were based on detections of individual fish at Snake River
telemetry transects 16 km downstream from Lower Monumental Dam, at Ice Harbor
Dam, at the mouth of the Snake River, at Columbia River transects near Burbank, WA,
and in the forebay of McNary Dam (Figure 1). Detection histories were evaluated
independently for treatment and reference groups using the single-release or CJS model
(Cormack 1964; Jolly 1965; Seber 1965). Data were analyzed using Survival with
Proportional Hazards (SURPH), a statistical software developed at the University of
Washington (Smith et al. 1994).
Survival estimates followed the guidelines described by Peven et al. (2005). Dam
survival was defined as survival of treatment fish through all passage routes combined
relative to survival of tailrace-released reference fish. The "effect zone" (Peven et al.
2005) extended from the forebay entrance array to the tailrace control release location.
The forebay entrance array was located at the upstream point of the BRZ, which is
approximately 500 m upstream from the face of the dam. Therefore, dam survival
included losses within the immediate forebay of the dam. The tailrace release location
(reference fish) was approximately 1,250 m downstream from Lower Monumental Dam.
Concrete survival is an estimate of the treatment fish surviving through the
combined passage routes of Lower Monumental Dam relative to survival of the tailrace
reference fish. The effect zone extended from the exit of all passage routes to the tailrace
control release location. Concrete survival did not include any losses in the forebay.

10
Capture histories of treatment and reference groups were partitioned into three
periods for survival estimation: detection at the primary survival array (16 km
downstream from Lower Monumental Dam), detection at Ice Harbor Dam, and detection
downstream from Ice Harbor Dam. Treatment groups for estimates of survival were
comprised of fish released above Lower Monumental Dam and subsequently detected on
the forebay entrance array 500 m upstream from the dam. For estimates of dam survival,
treatment groups were formed based on the date of forebay entry. For estimates of
concrete and route-specific survival, treatment groups were formed based on date of
passage. Reference fish groups were formed based on release date. For estimates of
relative survival, treatment fish that passed the the dam on day i were paired with
reference fish that were released to the tailrace on the same day (i.e., day i). Relative
survival was estimated at the ratio of survival estimates between treatment (numerator)
and reference (denominator) fish groups.
Confidence intervals for estimates of relative survival were constructed using the
geometric mean of daily estimates of survival. Since geometric means were used, the
ratios of proportions were assumed log-normally distributed (Snedecor and Cochran
1980). Thus, the geometric mean was assumed equivalent to the back-transformed
arithmetic mean of the log-transformed estimates. Confidence intervals were of the form:
where x was the geomean; t was the t-value, given α = 0.05 and 25 degrees of freedom
(i.e., approximately equal 2); and SE was the standard error of the geomean.
An assumption of the CJS model is that fish in all groups have equal probabilities
of survival and detection downstream from the point of release (i.e., the tailrace of Lower
Monumental Dam). This assumption is reasonable if release groups have similar passage
distributions at downstream detection sites, in this case, at the primary survival array
16 km downstream from the dam. To evaluate this assumption, we compared differences
between treatment and reference groups in temporal passage distribution at the primary
survival array. Treatment fish were grouped by passage date and were “paired” with
tailrace fish grouped by release date. Confidence intervals (95%) and t-tests were
constructed for statistical comparison. Model assumptions and methods used to evaluate
them are detailed in Appendix A.
Treatment fish were assumed to have passed the dam through the location where
they were last detected. We excluded from analysis any fish that had not been detected
on the forebay entrance array.
SEtxSEtx nene 1,05.1,05. )log( ,)log(

11
To provide continuity between analysis and interpretation of survival and passage
behavior, we excluded any fish that did not meet the criteria for both passage behavior
and survival analyses. These exclusions did not bias any of the estimated parameters, but
decreased the precision of estimates, since the effect was to decrease sample size. At
present, no formal analysis of adult returns of tagged fish used in this study is anticipated.
Avian Predation
Predation by Caspian terns Hydroprogne caspia, double-crested comorants
Phalacrocorax aurtius and gulls Larus spp. was evaluated by physical recovery of radio
transmitters and by PIT-tag detection on Crescent and Foundation Islands in the McNary
Dam Reservoir. Radio transmitters and PIT tags were recovered on nesting colonies
during fall 2007 after the birds had abandoned their nesting colonies. Radio-tag serial
numbers were used to identify individual tagged fish. PIT-tag detections and recovery of
radio transmitters were provided by NMFS (S. Sebring, NOAA Fisheries, personal
communication) and Real Time Research, Inc. (A. Evans, Real Time Research, Inc.,
personal communication). There is an ongoing monitoring effort to detect PIT tags from
active avian colonies in the region conducted by NOAA Fisheries and by the Columbia
Bird Research group.

12

13
RESULTS
Fish Collection, Tagging, and Release
Yearling Chinook salmon and juvenile steelhead were collected, radio tagged, and
PIT tagged at Lower Monumental Dam for 25 d from 30 April to 24 May. The 2007
study period encompassed the smolt passage index at Lower Monumental Dam between
the 3rd
and 99th
percentile for yearling Chinook salmon and between the 1st and 97
th
percentile for juvenile steelhead (Figure 3).
We released 663 radio-tagged yearling Chinook salmon 7 km upstream from
Lower Monumental Dam and 637 yearling Chinook salmon into the tailrace. For
yearling Chinook released above the dam, overall mean fork length was 145.0 mm
(SD = 11.0) and overall mean weight was 25.3 g (SD = 6.7). For yearling Chinook
released below the dam, overall mean fork length was 145.6 mm (SD = 12.2) and overall
mean weight was 25.9 g (SD = 8.0; Tables 2 and 3).
Figure 3. Cumulative passage distribution of hatchery yearling Chinook salmon and
juvenile steelhead at Lower Monumental Dam during 2007.
0%
10%
20%
30%
40%
50%
60%
70%
80%
90%
100%
1-A
pr
5-A
pr
9-A
pr
13
-Ap
r
17
-Ap
r
21
-Ap
r
25
-Ap
r
29
-Ap
r
3-M
ay
7-M
ay
11
-May
15
-May
19
-May
23
-May
27
-May
31
-May
4-J
un
8-J
un
12
-Ju
n
Per
cen
t p
assa
ge
yearling Chinook salmon juvenile steelhead

14
Table 2. Sample size, range, mean, and standard deviation (SD) of fork lengths (mm) for radio-tagged, yearling Chinook salmon released at Lower Monumental Dam to evaluate passage behavior and survival, 2007.
Fork length (mm)
Forebay treatment group Tailrace reference group
Tag date n Min. Max. Mean SD n Min. Max. Mean SD
30 Apr 33 121 178 144.5 13.5 --- --- --- --- ---
1 May 27 125 183 146.9 11.7 24 125 169 141.3 11.3
2 May 27 126 159 141.1 10.2 17 116 161 139.2 13.3
3 May 28 123 165 141.6 12.4 23 123 181 145.5 12.6
4 May 28 127 166 142.3 9.4 31 128 168 144.3 12.9
5 May 25 125 186 146.1 13.3 28 127 173 146.1 12.2
6 May 36 131 182 150.0 12.4 34 127 176 146.6 10.9
7 May 28 126 179 146.8 14.4 28 123 168 144.6 10.3
8 May 27 122 160 145.9 10.3 26 129 191 148.2 13.0
9 May 26 121 157 145.2 8.7 27 123 199 148.8 14.4
10 May 24 127 164 142.1 10.3 28 114 189 140.7 16.5
11 May 28 132 188 151.6 14.5 25 128 210 157.0 21.5
12 May 28 124 181 143.4 14.0 26 117 182 141.0 13.4
13 May 26 135 190 145.0 10.7 27 127 180 142.0 11.2
14 May 27 134 161 145.9 7.2 26 132 158 144.5 6.7
15 May 27 129 159 142.9 7.9 28 127 194 145.3 14.7
16 May 26 130 162 146.4 9.4 28 128 164 144.2 8.0
17 May 28 124 173 143.9 9.7 26 126 168 147.6 9.9
18 May 27 126 160 144.5 8.1 28 129 164 147.1 7.7
19 May 27 126 158 144.3 6.7 27 131 159 145.6 8.4
20 May 27 126 198 146.0 13.7 27 122 172 144.9 10.5
21 May 28 126 164 144.9 8.9 26 128 160 145.9 9.3
22 May 28 129 170 145.8 9.0 27 133 169 149.5 9.1
23 May 27 126 158 142.6 7.6 27 129 173 144.6 10.5
24 May --- --- --- --- --- 23 125 175 149.4 10.2
Overall 663 121 198 145.0 11.0 637 114 210 145.6 12.2

15
Table 3. Sample size, range, mean, and standard deviation (SD) of weights (grams) for radio-tagged, yearling Chinook salmon released at Lower Monumental Dam to evaluate passage behavior and survival, 2007.
Weight (g)
Forebay treatment group Tailrace reference group
Tag date n Min. Max. Mean SD n Min. Max. Mean SD
30 Apr 33 14 47 24.7 7.4 --- --- --- --- ---
1 May 27 15 49 26.0 6.3 24 15 39 23.3 5.8
2 May 27 16 35 23.4 5.3 17 13 34 22.4 6.9
3 May 28 16 40 24.7 6.8 23 14 54 25.3 8.4
4 May 28 16 36 23.3 5.1 31 14 43 25.1 8.1
5 May 25 15 56 26.6 8.4 28 15 45 26.4 7.6
6 May 36 17 51 26.2 7.9 34 15 47 23.7 6.5
7 May 28 15 61 26.2 10.5 28 14 42 25.1 6.1
8 May 27 14 36 26.3 5.6 26 15 64 27.6 9.5
9 May 26 14 35 24.6 5.3 27 16 72 28.4 10.8
10 May 24 16 41 24.5 5.8 28 13 58 24.8 9.6
11 May 28 18 57 30.5 9.6 25 16 81 34.0 17.4
12 May 28 15 51 24.4 8.7 26 13 47 23.0 7.3
13 May 26 20 48 24.7 5.7 27 15 47 23.1 6.1
14 May 27 18 34 25.8 4.6 26 19 34 25.2 4.1
15 May 27 17 34 24.7 3.8 28 14 71 26.3 11.1
16 May 26 16 38 25.2 5.4 28 16 37 23.9 4.7
17 May 28 14 41 23.7 5.5 26 16 34 26.1 4.8
18 May 27 15 32 24.1 4.2 28 16 35 26.0 4.3
19 May 27 16 33 25.1 3.5 27 20 39 27.4 5.1
20 May 27 16 83 26.8 12.0 27 16 51 25.5 6.7
21 May 28 17 32 24.7 4.2 26 19 35 25.9 4.8
22 May 28 18 37 25.9 4.4 27 19 42 28.0 5.3
23 May 27 18 36 25.2 4.2 27 17 47 26.3 6.3
24 May --- --- --- --- --- 23 18 46 29.5 6.3
Overall 663 14 83 25.3 6.7 637 13 81 25.9 8.0
16
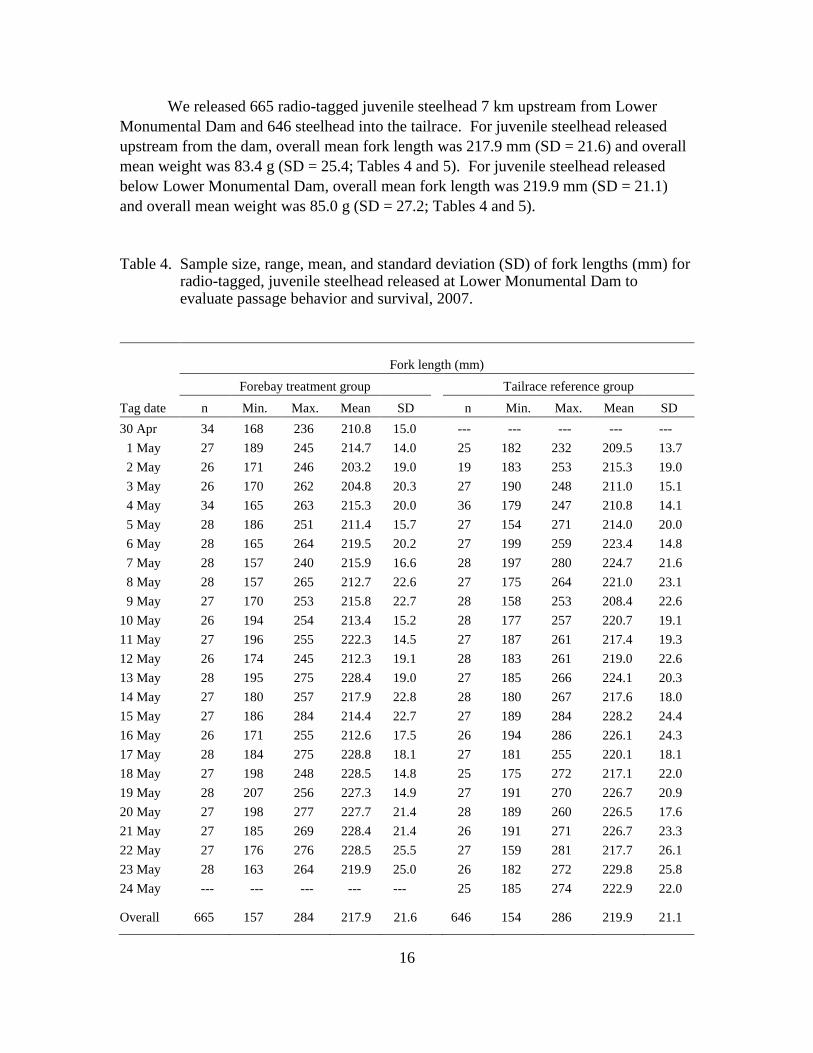
We released 665 radio-tagged juvenile steelhead 7 km upstream from Lower
Monumental Dam and 646 steelhead into the tailrace. For juvenile steelhead released
upstream from the dam, overall mean fork length was 217.9 mm (SD = 21.6) and overall
mean weight was 83.4 g (SD = 25.4; Tables 4 and 5). For juvenile steelhead released
below Lower Monumental Dam, overall mean fork length was 219.9 mm (SD = 21.1)
and overall mean weight was 85.0 g (SD = 27.2; Tables 4 and 5).
Table 4. Sample size, range, mean, and standard deviation (SD) of fork lengths (mm) for
radio-tagged, juvenile steelhead released at Lower Monumental Dam to evaluate passage behavior and survival, 2007.
Fork length (mm)
Forebay treatment group Tailrace reference group
Tag date n Min. Max. Mean SD n Min. Max. Mean SD
30 Apr 34 168 236 210.8 15.0 --- --- --- --- ---
1 May 27 189 245 214.7 14.0 25 182 232 209.5 13.7
2 May 26 171 246 203.2 19.0 19 183 253 215.3 19.0
3 May 26 170 262 204.8 20.3 27 190 248 211.0 15.1
4 May 34 165 263 215.3 20.0 36 179 247 210.8 14.1
5 May 28 186 251 211.4 15.7 27 154 271 214.0 20.0
6 May 28 165 264 219.5 20.2 27 199 259 223.4 14.8
7 May 28 157 240 215.9 16.6 28 197 280 224.7 21.6
8 May 28 157 265 212.7 22.6 27 175 264 221.0 23.1
9 May 27 170 253 215.8 22.7 28 158 253 208.4 22.6
10 May 26 194 254 213.4 15.2 28 177 257 220.7 19.1
11 May 27 196 255 222.3 14.5 27 187 261 217.4 19.3
12 May 26 174 245 212.3 19.1 28 183 261 219.0 22.6
13 May 28 195 275 228.4 19.0 27 185 266 224.1 20.3
14 May 27 180 257 217.9 22.8 28 180 267 217.6 18.0
15 May 27 186 284 214.4 22.7 27 189 284 228.2 24.4
16 May 26 171 255 212.6 17.5 26 194 286 226.1 24.3
17 May 28 184 275 228.8 18.1 27 181 255 220.1 18.1
18 May 27 198 248 228.5 14.8 25 175 272 217.1 22.0
19 May 28 207 256 227.3 14.9 27 191 270 226.7 20.9
20 May 27 198 277 227.7 21.4 28 189 260 226.5 17.6
21 May 27 185 269 228.4 21.4 26 191 271 226.7 23.3
22 May 27 176 276 228.5 25.5 27 159 281 217.7 26.1
23 May 28 163 264 219.9 25.0 26 182 272 229.8 25.8
24 May --- --- --- --- --- 25 185 274 222.9 22.0
Overall 665 157 284 217.9 21.6 646 154 286 219.9 21.1

17
Table 5. Sample size, range, mean, and standard deviation (SD) of weights (grams) for radio-tagged, juvenile steelhead released at Lower Monumental Dam to evaluate passage behavior and survival, 2007.
Weight (g)
Forebay treatment group Tailrace reference group
Tag date n Min. Max. Mean SD n Min. Max. Mean SD
30 Apr 34 53 121 79.4 16.8 --- --- --- --- ---
1 May 27 52 122 80.6 16.1 25 53 108 76.0 14.3
2 May 26 36 117 67.3 21.2 19 52 135 82.7 24.1
3 May 26 35 150 71.0 25.1 27 54 140 76.3 21.0
4 May 34 36 154 80.6 23.8 36 44 120 72.6 16.4
5 May 28 54 140 77.1 20.4 27 25 180 81.5 27.0
6 May 28 30 148 85.4 27.4 27 61 151 89.4 22.6
7 May 28 33 120 82.4 19.7 28 57 180 90.6 30.0
8 May 28 26 174 81.1 29.5 27 42 147 91.2 28.4
9 May 27 42 138 84.0 25.8 28 30 144 73.9 25.1
10 May 26 57 141 78.2 19.4 28 42 141 88.5 23.6
11 May 27 51 132 86.3 18.5 27 47 144 82.2 25.0
12 May 26 37 121 76.6 23.7 28 44 137 80.2 26.4
13 May 28 51 154 96.6 27.9 27 45 176 90.2 29.2
14 May 27 40 141 80.9 28.3 28 43 161 79.8 23.4
15 May 27 48 190 80.0 31.7 27 52 196 101.5 38.7
16 May 26 35 139 74.2 22.3 26 53 206 92.2 43.3
17 May 28 47 159 94.8 26.3 27 43 125 83.2 20.5
18 May 27 53 119 88.4 19.8 25 36 151 80.7 26.1
19 May 28 70 138 93.7 22.1 27 64 155 96.4 27.5
20 May 27 54 155 93.6 28.5 28 47 137 84.4 20.1
21 May 27 49 148 93.3 26.6 26 48 153 90.5 29.4
22 May 27 37 158 93.7 31.3 27 32 176 80.9 30.7
23 May 28 32 132 83.9 27.2 26 43 155 95.3 32.8
24 May --- --- --- --- --- 25 50 152 86.2 25.8
Overall 665 26 190 83.4 25.3 646 25 206 85.0 27.2
18
Post-tagging mortality was 1.0% (11 fish) for yearling Chinook salmon and 0.5%
(6 fish) for juvenile steelhead. Fish that died during the post-tagging holding period were
released in the planned location to verify the assumption that dead fish are not detected
on downstream survival arrays (Appendix Table A17). Treatment fish were released
between 0848 and 0938 and between 1300 and 1520 PDT. Reference fish were released
between 0830 and 1528 and between 2001 and 0332 PDT. Thirty-eight yearling Chinook
salmon and 40 juvenile steelhead were excluded from the analysis because they were not
detected entering the forebay.
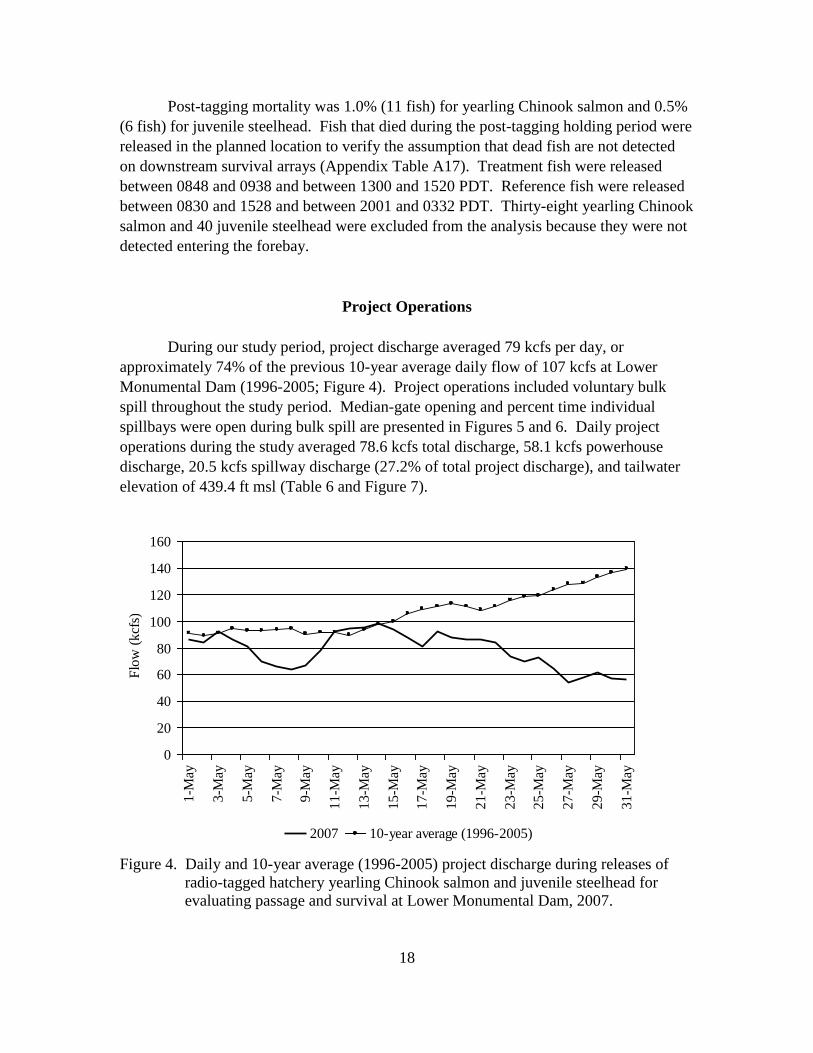
Project Operations
During our study period, project discharge averaged 79 kcfs per day, or
approximately 74% of the previous 10-year average daily flow of 107 kcfs at Lower
Monumental Dam (1996-2005; Figure 4). Project operations included voluntary bulk
spill throughout the study period. Median-gate opening and percent time individual
spillbays were open during bulk spill are presented in Figures 5 and 6. Daily project
operations during the study averaged 78.6 kcfs total discharge, 58.1 kcfs powerhouse
discharge, 20.5 kcfs spillway discharge (27.2% of total project discharge), and tailwater
elevation of 439.4 ft msl (Table 6 and Figure 7).
Figure 4. Daily and 10-year average (1996-2005) project discharge during releases of
radio-tagged hatchery yearling Chinook salmon and juvenile steelhead for
evaluating passage and survival at Lower Monumental Dam, 2007.
0
20
40
60
80
100
120
140
160
1-M
ay
3-M
ay
5-M
ay
7-M
ay
9-M
ay
11
-May
13
-May
15
-May
17
-May
19
-May
21
-May
23
-May
25
-May
27
-May
29
-May
31
-May
Flo
w (
kcf
s)
2007 10-year average (1996-2005)

19
Figure 5. Median spillbay gate opening during passage of radio-tagged hatchery yearling
Chinook salmon and juvenile steelhead at Lower Monumental Dam, 2007.
Figure 6. Percent of the time individual spillbays were open during passage of
radio-tagged hatchery yearling Chinook salmon and juvenile steelhead at
Lower Monumental Dam, 2007.
0.0
0.5
1.0
1.5
2.0
2.5
3.0
3.5
4.0
4.5
5.0
S8 S7 S6 S5 S4 S3 S2 S1
Med
ian
ga
te o
pen
ing
(ft
)
0%
10%
20%
30%
40%
50%
60%
70%
80%
90%
100%
S8 S7 S6 S5 S4 S3 S2 S1
Per
cen
t o
f th
e ti
me
op
en

20
Water temperature during tagging, the post-tagging holding period, and releases ranged
from 11.0 to 14.2°C and averaged 12.7°C. Secchi disk measurements in the forebay of
Lower Monumental Dam during releases averaged 1.1 m and ranged from 1.1 to 1.2 m
(Table 6). Visible depth in the forebay of Lower Monumental Dam during 2007 was
157% of the previous 10-year average of 0.7 m (1996-2005; Figure 8).
Table 6. Average daily conditions during evaluation of passage and survival of
radio-tagged hatchery yearling Chinook salmon and juvenile steelhead at Lower Monumental Dam, 2007.
Release date
Total
discharge
(kcfs)
Powerhouse
(kcfs)
Spill
(kcfs) Spill (%)
Water
temperature
(°C)
Tailwater
(ft msl)
Secchi depth
(m)
1 May 85.7 70.5 15.2 17.8 11.01 439.9 1.2
2 May 83.7 66.2 17.5 20.9 11.25 439.6 1.1
3 May 92.1 76.1 16.0 17.4 11.43 440.3 1.1
4 May 86.4 65.0 21.4 24.8 11.43 439.9 1.1
5 May 81.3 59.9 21.4 26.3 11.65 439.7 1.1
6 May 69.3 47.9 21.4 30.9 11.97 438.9 1.1
7 May 65.9 43.1 22.8 34.6 12.15 438.6 1.1
8 May 63.7 40.5 23.2 36.5 12.33 438.6 1.1
9 May 66.2 45.9 20.3 30.6 12.33 438.8 1.1
10 May 77.9 59.3 18.6 23.9 12.26 439.3 1.1
11 May 92.4 73.8 18.6 20.1 11.91 440.1 1.2
12 May 94.6 77.5 17.2 18.1 11.75 440.3 1.2
13 May 95.3 80.6 14.7 15.4 11.68 440.5 1.2
14 May 98.4 82.3 16.1 16.4 11.66 440.4 ---
15 May 93.7 73.4 20.3 21.7 12.56 440.2 ---
16 May 87.7 66.1 21.6 24.6 13.4 439.9 ---
17 May 80.7 59.3 21.4 26.5 13.55 439.3 ---
18 May 92.6 70.5 22.1 23.9 13.46 440.1 ---
19 May 87.9 66.2 21.7 24.7 13.42 439.9 1.2
20 May 85.8 62.4 23.4 27.2 13.22 439.6 1.2
21 May 85.9 63.2 22.7 26.4 12.97 439.9 1.2
22 May 83.7 61.2 22.5 26.8 13.06 439.7 1.2
23 May 72.8 49.7 23.1 31.7 13.33 439.0 ---
24 May 69.5 46.7 22.8 32.8 13.77 438.8 ---
25 May 72.0 49.4 22.6 31.4 14.12 438.9 ---
26 May 64.4 41.7 22.7 35.2 14.21 438.6 ---
27 May 53.3 31.7 21.6 40.6 14.18 438.2 ---
28 May 57.7 36.8 20.9 36.2 14.19 438.2 1.1
29 May 61.6 40.1 21.5 34.9 14.03 438.4 1.2
30 May 56.8 35.6 21.2 37.4 13.58 438.3 1.2
Average 78.6 58.1 20.5 27.2 12.7 439.4 1.1

21
Figure 7. Average project discharge, powerhouse discharge, spillway discharge, and
tailwater elevation by date during releases of radio-tagged hatchery yearling
Chinook salmon and juvenile steelhead at Lower Monumental Dam, 2007.
Figure 8. Daily and 10-year average (1996-2005) daily turbidity in the forebay of Lower
Monumental Dam during releases of radio-tagged hatchery yearling Chinook
salmon and juvenile steelhead for evaluating passage and survival at Lower
Monumental Dam, 2007. Turbidity was measured by the visible depth of a
Secchi disk below the surface.
0.0
10.0
20.0
30.0
40.0
50.0
60.0
70.0
80.0
90.0
100.0
1-M
ay
3-M
ay
5-M
ay
7-M
ay
9-M
ay
11
-May
13
-May
15
-May
17
-May
19
-May
21
-May
23
-May
25
-May
27
-May
29
-May
Dis
char
ge
(kcf
s)
435.0
440.0
445.0
450.0
Tai
lwat
er e
levat
ion
(ft
msl
)
Total discharge (kcfs) Powerhouse (kcfs) Spill (kcfs) Tailwater elevation
0.0
0.2
0.4
0.6
0.8
1.0
1.2
1.4
1-M
ay
3-M
ay
5-M
ay
7-M
ay
9-M
ay
11-M
ay
13-M
ay
15-M
ay
17-M
ay
19-M
ay
21-M
ay
23-M
ay
25-M
ay
27-M
ay
29-M
ay
Sec
hi d
isc
dep
th (
m)
2007 10 year average

22
Forebay Residence Time
Of the 663 radio-tagged yearling Chinook salmon released above Lower
Monumental Dam, 625 (94%) were detected on the forebay entrance line at the upstream
end of the BRZ. Yearling Chinook salmon entering the forebay of Lower Monumental
Dam had a bimodal distribution with peak numbers between 2300 and 0500 and between
1400 and 1600 (Figure 9). Median forebay residence time was 2.5 h (95% CI 2.1-2.9)
and ranged from 0.4 to 125.4 h (Table 7). Median forebay residence time of yearling
Chinook salmon that passed through the JBS (3.4 h; 95% CI 1.6-5.3) was similar to that
of fish passing through the spillway (2.5 h; 95% CI 1.7-2.3) or turbines (1.3 h, no 95% CI
calculated; P = 0.315).
Figure 9. Hour of first detection for radio-tagged yearling Chinook salmon released
upstream from Lower Monumental Dam and detected in the forebay of Lower
Monumental Dam. Shaded areas indicate night-time hours.
0%
1%
2%
3%
4%
5%
6%
7%
8%
9%
10%
0 1 2 3 4 5 6 7 8 9 10 11 12 13 14 15 16 17 18 19 20 21 22 23
Hour

23
Table 7. Sample size, percentile distribution, minimum, mean, median, mode, and maximum forebay residence time (elapsed time in hours from first detection on the forebay entry line to time of passage) by passage route and overall for radio-tagged hatchery yearling Chinook salmon at Lower Monumental Dam, 2007.
Forebay residence time (h)
Passage percentile JBS Spillway Turbine Overall
N 98 443 42 583
10th 1.1 0.7 0.7 0.7
20th 1.3 1.0 0.8 1.0
30th 1.7 1.3 0.9 1.3
40th 2.4 1.7 1.0 1.7
50th 3.4 2.5 1.3 2.5
60th 4.5 3.9 1.6 3.9
70th 6.5 5.3 2.3 5.4
80th 10.0 8.8 5.8 8.7
90th 15.3 16.2 7.5 15.9
95th 24.0 23.0 8.9 23.0
Minimum 0.5 0.4 0.6 0.4
Mean 7.9 6.2 3.4 6.3
Median 3.4 2.5 1.3 2.5
Mode 4.5 0.5 0.9 0.7
Maximum 125.4 125.1 28.4 125.4
Of the 665 radio-tagged juvenile steelhead released above Lower Monumental
Dam, 625 (94%) were detected on the forebay entrance line at the upstream end of the
BRZ. The timing distribution of juvenile steelhead entering the forebay of Lower
Monumental Dam is presented in Figure 10. Median forebay residence time was 17.8 h
(95% CI 14.0-21.7) and ranged from 0.1 to 204.1 h (Table 8). Median forebay residence
time of juvenile steelhead that passed through the JBS (18.7 h; 95% CI 13.9-23.6) was
similar to that of fish that passed through the spillway (17.8 h ; 95% CI 10.8-24.7;
P = 0.695). Only 20 juvenile steelhead passed through the turbines.
Median gatewell residence time was 0.4 h for yearling Chinook salmon and 1.6 h
for juvenile steelhead (Table 9). For yearling Chinook salmon that passed via the JBS,
median gatewell residence time accounted for 1% of forebay residence time. For juvenile
steelhead that passed via the JBS, median gatewell residence time accounted for 9% of
forebay residence time.

24
Figure 10. Hour of first detection for radio-tagged juvenile steelhead released upstream
from Lower Monumental Dam and detected in the forebay of Lower
Monumental Dam. Shaded areas indicate night-time hours.
Table 8. Sample size, percentile distribution, minimum, mean, median, mode, and maximum forebay residence time (elapsed time in hours from first detection on the forebay entry line to time of passage) by passage route and overall for radio-tagged juvenile steelhead at Lower Monumental Dam, 2007.
Forebay residence time (h)
Passage percentile JBS Spillway Turbine Overall
n 183 360 19 562
10th 2.1 1.5 1.0 1.7
20th 4.0 3.3 1.5 3.3
30th 9.8 5.8 5.5 6.4
40th 15.3 11.6 11.0 13.0
50th 18.7 17.8 15.5 17.8
60th 23.8 23.2 18.3 23.3
70th 33.4 32.6 21.0 32.5
80th 43.6 45.6 31.9 43.8
90th 64.1 74.0 39.0 69.2
95th 90.1 107.6 40.8 98.9
Minimum 0.9 0.1 0.9 0.1
Mean 27.7 29.0 17.5 28.2
Median 18.7 17.8 15.5 17.8
Mode 2.6 1.1 N/A 1.7
Maximum 156.4 204.1 56.3 204.1
0%
2%
4%
6%
8%
10%
12%
0 1 2 3 4 5 6 7 8 9 10 11 12 13 14 15 16 17 18 19 20 21 22 23
Hour

25
Table 9. Sample size, percentile distribution, minimum, mean, median, mode, and maximum gatewell residence time (elapsed time in hours from first detection in the gatewell to time of passage) for radio-tagged hatchery yearling Chinook salmon and juvenile steelhead at Lower Monumental Dam, 2007.
Gatewell residence time (h)
Passage percentile Yearling Chinook salmon Juvenile steelhead
n 98 181
10th 0.1 0.2
20th 0.1 0.4
30th 0.2 0.6
40th 0.3 0.9
50th 0.4 1.6
60th 0.7 3.2
70th 1.1 6.3
80th 2.6 9.9
90th 5.4 16.9
95th 10.9 32.1
Minimum 0.0 0.0
Mean 3.7 7.4
Median 0.4 1.6
Mode 0.1 0.2
Maximum 124.0 117.9
Approach and Passage-Route Distribution
A total of 625 yearling Chinook salmon entered the forebay of Lower
Monumental Dam, and 97% of these fish (608) subsequently passed the dam.
Seventy-six percent of the yearling Chinook salmon first approached the spillway portion
of the dam, with the majority of these (38%) approaching at Spillbay 8 (Figure 11).
Passage-route distribution was 74, 17, and 7%, through the spillway, JBS, and turbines,
respectively. The remaining 2% passed through undetermined routes. The greatest
proportion of yearling Chinook passed through Spillbay 8 (46%; Figure 12).
A total of 625 juvenile steelhead entered the forebay of Lower Monumental Dam,
93% of these fish (581) subsequently passed the dam. Eighty percent of juvenile
steelhead first approached the spillway portion of the dam, with the majority of these
(38%) approaching at Spillbay 8 (Figure 13). Passage-route distribution was 62, 32, and
4% through the spillway, JBS, and turbines, respectively. The remaining 2% passed via
undetermined routes. The largest proportion of juvenile steelhead passed through
Spillbay 8 (35%; Figure 14).

26
Figure 11. Horizontal approach distribution for radio-tagged yearling Chinook salmon
released upstream from Lower Monumental Dam based on first detection at
individual turbine intakes (T) or spillbays (S), 2007.
Figure 12. Passage route distribution for radio-tagged yearling Chinook salmon released
upstream from Lower Monumental Dam, 2007. Passage locations are U =
unidentified route, T = individual turbine intakes, and S = individual spillbays.
0%
5%
10%
15%
20%
25%
30%
35%
40%
45%
T1 T2 T3 T4 T5 T6 S8 S7 S6 S5 S4 S3 S2 S1
Per
cen
t o
f fi
sh
0%
5%
10%
15%
20%
25%
30%
35%
40%
45%
50%
U T1 T2 T3 T4 T5 T6 S8 S7 S6 S5 S4 S3 S2 S1
Per
cen
t o
f fi
sh
Turbine (n = 43) JBS (n = 105) Spillway (n = 448) Unknown (n = 12)
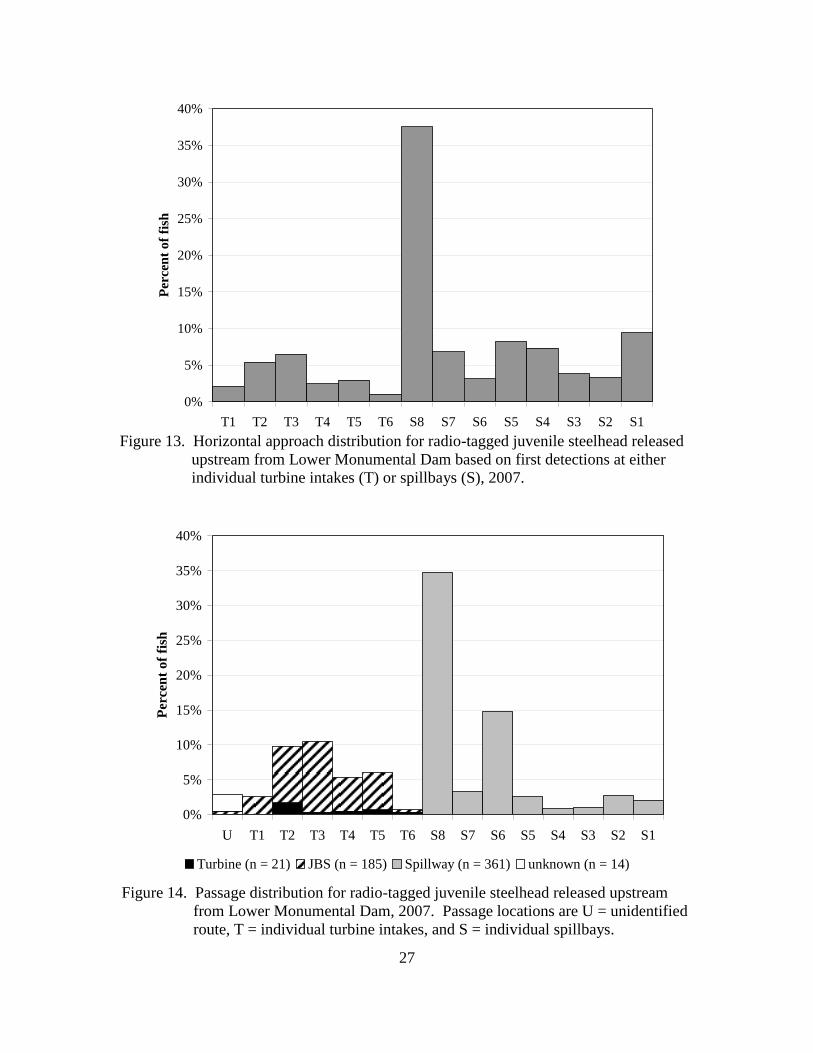
27
Figure 13. Horizontal approach distribution for radio-tagged juvenile steelhead released
upstream from Lower Monumental Dam based on first detections at either
individual turbine intakes (T) or spillbays (S), 2007.
Figure 14. Passage distribution for radio-tagged juvenile steelhead released upstream
from Lower Monumental Dam, 2007. Passage locations are U = unidentified
route, T = individual turbine intakes, and S = individual spillbays.
0%
5%
10%
15%
20%
25%
30%
35%
40%
T1 T2 T3 T4 T5 T6 S8 S7 S6 S5 S4 S3 S2 S1
Per
cen
t o
f fi
sh
0%
5%
10%
15%
20%
25%
30%
35%
40%
U T1 T2 T3 T4 T5 T6 S8 S7 S6 S5 S4 S3 S2 S1
Per
cen
t o
f fi
sh
Turbine (n = 21) JBS (n = 185) Spillway (n = 361) unknown (n = 14)

28
Fish Passage Performance Metrics
For radio-tagged yearling Chinook salmon and steelhead with a known passage
route, fish passage metrics are shown below:
Yearling Chinook Salmon Steelhead
95% CI 95% CI
FGE 0.709 0.670-0.749 0.898 0.873-0.923
FPE 0.928 0.914-0.942 0.963 0.952-0.974
Spill Efficiency 0.752 0.728-0.776 0.673 0.608-0.665
Spill effectiveness (mean spill of 26%) 2.76 to 1 2.676-2.851 2.45 to 1 2.338-2.559
Tailrace Egress
Overall median tailrace egress time was 7.2 min (95% CI, 6.5-7.9) for yearling
Chinook salmon and ranged from 2 to 11,011 min (Table 10). Median tailrace egress
time was longer for yearling Chinook that passed through the powerhouse (JBS;
12.8 min; 95% CI, 0.5-25.0: turbines; 11.9 min, no 95% CI calculated) than for those
that passed through the spillway (5.7 min; 95% CI, 5.1-6.2; P = 0.003). This was
probably related to the proximity of the powerhouse and a strong clockwise eddy that
forms in the tailrace during spill.
Overall median tailrace egress for juvenile steelhead was 8.2 min (95% CI,
6.9-9.6) and ranged from 1 to 8,181 min (Table 11). Median tailrace egress time was
significantly longer for juvenile steelhead that passed through the powerhouse (JBS
12.0 min, 95% CI 8.8-15.1; turbines 11.8 min, no 95% CI calculated) than for those that
passed through the spillway (5.9 min, 95% CI, 5.1-6.6; P < 0.001). The longer egress
times for JBS passage were likely related to the proximity of the powerhouse and strong
clockwise eddy in the tailrace.

29
Table 10. Sample size, distribution, minimum, mean, median, mode, and maximum
tailrace egress time (elapsed time from last detection in a passage route to last
detection in the tailrace) by passage route and overall for radio tagged hatchery
yearling Chinook salmon at Lower Monumental Dam, 2007.
Yearling Chinook tailrace egress time (min)
Passage percentile JBS Spillway Turbine Overall
n 102 443 41 586
10th 7.0 3.7 7.3 3.9
20th 7.9 4.3 8.3 4.5
30th 9.1 4.7 9.0 5.1
40th 10.3 5.1 9.6 5.9
50th 12.8 5.7 11.9 7.2
60th 15.5 7.0 12.4 9.0
70th 23.9 8.9 16.1 11.2
80th 38.7 12.1 19.6 16.4
90th 138.9 34.8 55.0 49.9
95th 831.0 223.9 624.7 347.8
minimum 5.0 2.0 6.0 2.0
mean 304.5 232.9 561.2 251.1
median 12.8 5.7 11.9 7.2
mode 7.9 4.9 N/A 4.9
maximum 10,142 11,011 10,763 11,011
Table 11. Sample size, percentile distribution, minimum, mean, median, mode, and
maximum tailrace egress time (elapsed time in minutes from last detection in a
passage route to last detection in the tailrace) by passage route and overall for
radio-tagged juvenile steelhead at Lower Monumental Dam, 2007.
Juvenile steelhead tailrace egress time (min)
Passage percentile JBS Spillway Turbine Overall
n 184 337 21 542
10th 6.9 3.9 7.6 4.2
20th 7.9 4.3 9.2 4.9
30th 9.0 4.8 10.9 5.7
40th 10.0 5.2 12.3 6.9
50th 12.0 5.9 13.3 8.2
60th 15.1 7.1 14.7 10.1
70th 18.6 8.9 23.1 13.8
80th 27.6 14.4 41.4 20.5
90th 189.3 36.0 135.0 54.9
95th 618.3 146.8 348.0 330.6
minimum 5.4 1.1 11.8 1.1
mean 112.6 88.6 11.8 106.4
median 12.0 5.9 11.8 8.2
mode 9.6 4.3 N/A 6.3
maximum 4,029 8,181 11.8 8,181

30
Survival Estimates
Detection Probability
Detection histories used for survival estimates are presented in Appendix
Tables A1-A11. Detection probabilities at the primary survival array, 16 km downstream
from Lower Monumental Dam, are presented for each species in Appendix Table A12.
Daily survival estimates for paired treatment and reference fish groups are presented in
Appendix Tables B1-B11.
Project Survival
For yearling Chinook salmon, relative dam survival (~500 m upstream to 1 km
downstream from the dam) was estimated at 0.930 (geomean; SE = 0.016; 95% CI,
0.898-0.964; Table 12). Relative concrete survival (all passage routes combined to
approximately 1 km downstream from the dam) for yearling Chinook salmon was
estimated at 0.952 (geomean; SE = 0.011; 95% CI, 0.930-0.975).
For juvenile steelhead, relative dam survival was estimated at 0.888 (geomean;
SE = 0.017; 95% CI, 0.854-0.923; Table 13). Relative concrete survival was estimated at
0.955 for juvenile steelhead (geomean; SE = 0.013; 95% CI, 0.927-0.983).
Route-Specific Survival
For radio-tagged yearling Chinook salmon, relative survival (treatment/reference)
was estimated at 0.959 (SE = 0.011; 95% CI, 0.937-0.982) for fish passing via the
spillway, 0.941 (SE = 0.029; 95% CI, 0.883-0.998) for those passing via the JBS, and
0.909 (SE = 0.051; 95% CI, 0.808-1.010) for those passing via turbines (Table 12). For
yearling Chinook salmon passing through Spillbay 8, relative survival was estimated at
0.976 (SE = 0.014; 95% CI, 0.948-1.005).
For radio-tagged juvenile steelhead passing Lower Monumental Dam, relative
survival was estimated at 0.939 (SE = 0.017; 95% CI, 0.905-0.975) for fish passing via
the spillway and 0.986 (SE = 0.016; 95% CI, 0.955-1.018) for fish passing via the JBS
(Table 13). For juvenile steelhead passing through Spillbay 8, survival was estimated at
0.923 (SE = 0.022; 95% CI, 0.879-0.986).

31
Table 12. Sample sizes and mean estimates of survival for radio-tagged, hatchery yearling Chinook salmon passing (treatment) Lower Monumental Dam relative to fish released into the tailrace (reference), 2007. Standard errors are in parenthesis.
Yearling Chinook salmon
Treatment Reference Relative
survival n Survival n Survival
Project survival
Dam survival 616 0.902 (0.015) 637 0.973 (0.007) 0.930 (0.016)
Concrete survival 596 0.927 (0.011) 637 0.973 (0.007) 0.952 (0.011)
Route-specific survival
Spillway survival 448 0.934 (0.011) 637 0.973 (0.007) 0.959 (0.011)
JBS survival 105 0.914 (0.027) 637 0.973 (0.007) 0.941 (0.029)
Turbine survival 43 0.884 (0.049) 637 0.973 (0.007) 0.909 (0.051)
Spillbay 8 281 0.951 (0.015) 637 0.973 (0.007) 0.976 (0.014)
Table 13. Sample sizes and mean estimates of survival for radio-tagged, hatchery
juvenile steelhead passing (treatment) Lower Monumental Dam relative to fish released into the tailrace (reference), 2007. Standard errors are in parenthesis.
Juvenile steelhead
Treatment Reference
n Survival n Survival Relative survival
Project survival
Dam survival 621 0.868 (0.016) 646 0.976 (0.006) 0.888 (0.017)
Concrete survival 566 0.933 (0.013) 646 0.976 (0.006) 0.955 (0.013)
Route-specific survival
Spillway survival 361 0.919 (0.015) 646 0.976 (0.006) 0.939 (0.017)
JBS survival 185 0.964 (0.014) 646 0.976 (0.006) 0.986 (0.016)
Spillbay 8 202 0.902 (0.021) 646 0.976 (0.006) 0.923 (0.022)
32
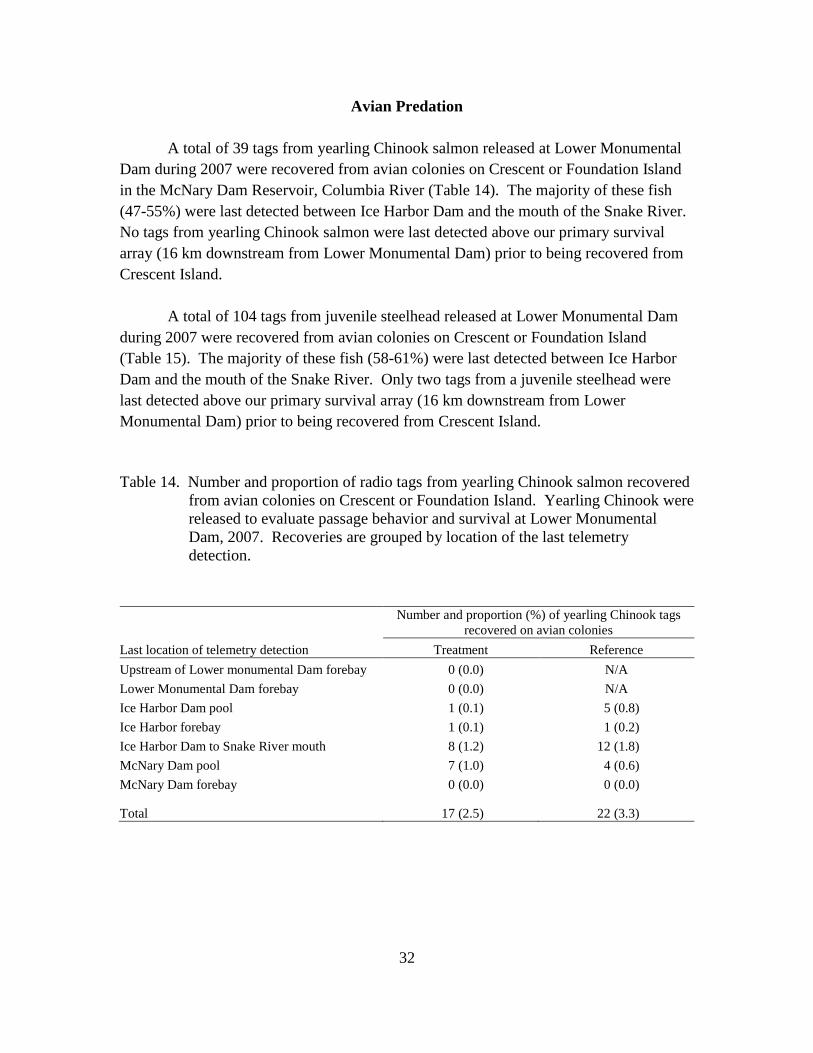
Avian Predation
A total of 39 tags from yearling Chinook salmon released at Lower Monumental
Dam during 2007 were recovered from avian colonies on Crescent or Foundation Island
in the McNary Dam Reservoir, Columbia River (Table 14). The majority of these fish
(47-55%) were last detected between Ice Harbor Dam and the mouth of the Snake River.
No tags from yearling Chinook salmon were last detected above our primary survival
array (16 km downstream from Lower Monumental Dam) prior to being recovered from
Crescent Island.
A total of 104 tags from juvenile steelhead released at Lower Monumental Dam
during 2007 were recovered from avian colonies on Crescent or Foundation Island
(Table 15). The majority of these fish (58-61%) were last detected between Ice Harbor
Dam and the mouth of the Snake River. Only two tags from a juvenile steelhead were
last detected above our primary survival array (16 km downstream from Lower
Monumental Dam) prior to being recovered from Crescent Island.
Table 14. Number and proportion of radio tags from yearling Chinook salmon recovered
from avian colonies on Crescent or Foundation Island. Yearling Chinook were
released to evaluate passage behavior and survival at Lower Monumental
Dam, 2007. Recoveries are grouped by location of the last telemetry
detection.
Number and proportion (%) of yearling Chinook tags
recovered on avian colonies
Last location of telemetry detection Treatment Reference
Upstream of Lower monumental Dam forebay 0 (0.0) N/A
Lower Monumental Dam forebay 0 (0.0) N/A
Ice Harbor Dam pool 1 (0.1) 5 (0.8)
Ice Harbor forebay 1 (0.1) 1 (0.2)
Ice Harbor Dam to Snake River mouth 8 (1.2) 12 (1.8)
McNary Dam pool 7 (1.0) 4 (0.6)
McNary Dam forebay 0 (0.0) 0 (0.0)
Total 17 (2.5) 22 (3.3)

33
Table 15. Number and proportion of radio tags from juvenile steelhead recovered from
avian colonies on Crescent or Foundation Island. Steelhead were released to
evaluate passage behavior and survival at Lower Monumental Dam, 2007.
Recoveries are grouped by location of the last telemetry detection.
Number and proportion (%) of juvenile steelhead tags
recovered on avian colonies
Last location of telemetry detection Treatment fish Reference fish
Upstream of Lower monumental Dam
forebay 2 (0.3) N/A
Lower Monumental Dam forebay 0 (0.0) N/A
Ice Harbor Dam pool 14 (2.1) 12 (1.8)
Ice Harbor forebay 6 (0.9) 8 (1.2)
Ice Harbor Dam to Snake River mouth 12 (1.8) 15 (2.3)
McNary Dam pool 21 (3.1) 12 (1.8)
McNary Dam forebay 1 (0.1) 1 (0.2)
Total 56 (8.4) 48 (7.4)

34

35
DISCUSSION
This report is the second consecutive year of evaluating behavior and survival for
volitionally passing radio-tagged juvenile steelhead and yearling Chinook salmon at
Lower Monumental Dam. These two years had considerably different flow conditions
during spring, with high flows in 2006 and low flows in 2007. Snake River flows in
spring 2007 at Lower Monumental Dam averaged 79 kcfs, or 74% of the 10-year average
(107 kcfs from 1996 through 2005). In contrast, Snake River flows in spring 2006 at the
dam averaged 139 kcfs, or 130% of the same 10-year average (Hockersmith et al. 2008).
Although flow conditions were vastly different between years, Lower Monumental Dam
project operations were relatively similar between years, with 26% of the river spilled in
2006 and 27% in 2007. In addition to flow differences between years, water clarity also
differed in the forebay of Lower Monumental Dam and averaged 0.4 m and 1.1 m in
2006 and 2007, respectively.
During both years the majority of our radio-tagged fish (yearling Chinook salmon
and juvenile steelhead combined) approached and passed the dam in the thalweg of the
river near Spillbay 8. Johnson et al. (1998), using hydroacoustics, observed similar
horizontal distribution patterns, where smolts approached Lower Monumental Dam at the
midpoint of the thalweg. We observed higher proportion of each species passing via the
spillway during the low flow conditions in 2007 compared to the higher flow conditions
in 2006 (yearling Chinook salmon 74% vs. 58%; juvenile steelhead 62% vs. 48%) even
though the proportion of river spilled was almost identical between years (27% vs. 26%).
Median forebay residence time was the same for yearling Chinook salmon
between low flow conditions in 2007 and the higher flow conditions in 2006 (2.5 hours).
However, median forebay residence time for juvenile steelhead was more than three
times longer under the low flow conditions in 2007 than under the high flow conditions
in 2006 (17.8 vs. 5.5 hours).
We did not observe differences in median tailrace egress time among species or
flow conditions between the two study years . In 2007 and 2006, respective tailrace
egress time was 6 and 7 minutes for yearling Chinook and 6 and 8 minutes for juvenile
steelhead.
Spill effectiveness was higher for both species during the low flows in 2007 than
during the higher flows in 2006 (yearling Chinook salmon 2.9 vs. 2.3; juvenile steelhead
2.4 vs.1.9).
36
Relative dam and concrete survival for yearling Chinook salmon were slightly
higher in 2007 compared to 2006 (dam survival 0.930 vs. 0.924; concrete survival 0.952
vs. 0.943). Relative spillway survival for yearling Chinook salmon was slightly higher
(0.959 vs. 0.925) in 2007 compared to 2006. However, relative bypass survival for
yearling Chinook salmon was slightly lower in 2007 compared to 2006 (0.941 vs. 0.987).
Relative dam, concrete, and spillway survival for juvenile steelhead were
significantly lower in 2007 compared to 2006 (two sample t-test) (dam survival 0.888 vs.
0.980 (P<0.001); concrete survival 0.955 vs.1.000 (P=0.007); spillway survival 0.939 vs.
0.999 (P=0.007)).
Forebay delay and survival for yearling Chinook salmon did not appear related to
river flow conditions at Lower Monumental Dam, since we observed similar results
between high and low flow conditions. However for juvenile steelhead, forebay delay
was longer and survival was lower during the low-flow conditions in 2007 compared to
the higher flows in 2006.
Smith (1974) and Beeman and Maule (2006) reported differences in migrational
depth among species of juvenile anadromous salmonids. Yearling Chinook salmon
migrated in deeper water during the day and more shallow water at night, while juvenile
steelhead migrated in shallow water during the day and deeper water at night. Thus, the
lower survival for juvenile steelhead in 2007 may have been due to a combination of
shallow migrational depth during the day, longer forebay delay, and greater water clarity
in 2007, all resulting in increased vulnerability to predation.
Hockersmith et al. (2005) reported lower survival at Lower Monumental Dam
associated with longer forebay residence times, and during periods of no spill compared
to periods of spill. Vigg and Burley (1991) observed a correlation between survival and
exposure time to predators for juvenile salmonids. Collis et al. (2001) and Ryan et al.
(2003) reported significantly higher vulnerability to avian predation for juvenile steelhead
compared to yearling Chinook salmon. Currently, there is no active monitoring of avian
predation activities at Lower Monumental Dam; however, we observed more avian
predation activity in both the forebay and tailrace during 2007 than in 2006. The lower
flows and below-average water turbidity in 2007 may have influenced the predator/prey
dynamics for our radio-tagged steelhead by increasing exposure times and opportunity
due to increased water clarity (Gregory and Levings 1998) resulting in lower survival.
To increase the proportion of fish passing through the spillway, USACE engineers
and biologists developed the RSW, which provides surface-oriented spillway passage.
RSWs were installed at Lower Granite Dam in 2001 and at Ice Harbor Dam in 2005. At

37
both projects, the RSWs reduced migrational delays, improved FPE, and provided
increased passage survival, while spilling either similar or less water (Plumb et al. 2003,
2004; Axel et al. 2007; Ogden et al. 2007). The RSW that will be operational at Lower
Monumental Dam in 2008 is expected to provide improvements in passage behavior and
survival similar to those observed at Lower Granite and Ice Harbor Dams. The goal of
this study was to collect baseline data on passage behavior and survival for comparison to
passage behavior and survival after installation of an RSW at Lower Monumental Dam.

38
ACKNOWLEDGMENTS
We express our appreciation to all who assisted with this research. We thank the
USACE who funded this research; we particularly thank William Spurgeon, Lower
Monumental Dam Project Biologist, Mark Plummer, Ice Harbor Dam Project Biologist,
and Ann Setter and Tim Wik, Walla Walla USACE District office for their help
coordinating research activities. Monty Price, and the staff of the Washington
Department of Fish and Wildlife at Lower Monumental Dam provided valuable
assistance with the collecting and sorting of study fish. Carter Stein and staff of the
Pacific States Marine Fisheries Commission provided valuable assistance in data
acquisition
For their ideas, assistance, encouragement and guidance, we also thank, Joseph
Astley, Steve Brewer, Daniel Charboneau, Scott Davidson, Doug Dey, Nathan Dumdei,
John Ferguson, Josh Gifford, Jeff Hall, Patricia Harshman, Wayne Henry, Byron Iverson,
Bruce Jonasson, Mark Kaminski, Jesse Lamb, Joe Lemoine, Steven Loiacono, Ronald
Marr, Justin Mays, Jeffrey Moser, Matthew Nesbit, Sean Newsome, Sam Rambo,
Thomas Ruehle, Sam Rushing, Bill Ryan, Travis Schuller, Bo Silvers, Jim Simonson,
Steve Smith, Mike Volmer, William Wassard, and Galen Wolf of the Fish Ecology
Division, Northwest Fisheries Science Center, National Marine Fisheries Service.
39
REFERENCES
Adams, N. S., D. W. Rondorf, S. D. Evans, and J. E. Kelly. 1998. Effects of surgically
and gastrically implanted radio transmitters on growth and feeding behavior of
juvenile Chinook salmon. Transactions of the American Fisheries Society
27:128-136.
Axel, G. A., E. E. Hockersmith, D. A. Ogden, B. J. Burke, K. Frick, and B. P. Sandford.
2007. Passage behavior and survival for radio-tagged yearling Chinook salmon
and steelhead at Ice Harbor Dam, 2005. Report of the National Marine Fisheries
Service to the U.S. Army Corps of Engineers, Northwestern Division, Walla
Walla, Washington. (Available from the Northwest Fisheries Science Center,
2725 Montlake Blvd. E., Seattle, WA 98112-2097).
Beeman, J. W., C. Grant, and P. V. Haner. 2004. Comparison of three underwater
antennas for use in radiotelemetry. North American Journal of Fisheries
Management 24:275-281.
Beeman, J. W., and A. G. Maule. 2006. Migration depths of juvenile Chinook salmon
and steelhead relative to total dissolved gas supersaturation in a Columbia River
reservoir. Transactions of the American Fisheries Society 135:584-594.
Collis, K., D. D. Roby, D. P. Craig, B. A. Ryan, and R. D. Ledgerwood. 2001. Colonial
waterbird predations on juvenile salmonids tagged with passive integrated
transponders in the Columbia River estuary: vulnerability of different salmonid
species, stocks, and rearing types. Transactions of the American Fisheries Society
130:385-396.
Cormack, R. M. 1964. Estimates of survival from sightings of marked animals.
Biometrika 51:429-438.
Gregory, R. S. and C. D. Levings. 1998. Turbidity reduces predation of migrating
juvenile pacific salmon. Transactions of the American Fisheries Society
127:275-285.
Hockersmith, E. E., G. A. Axel, M. B. Eppard, D. A. Ogden, and B. P. Sandford. 2005.
Passage behavior and survival for hatchery yearling Chinook salmon at Lower
Monumental Dam, 2004. Report of the National Marine Fisheries Service to the
U.S. Army Corps of Engineers, Northwestern Division, Walla Walla,
Washington. (Available from the Northwest Fisheries Science Center, 2725
Montlake Blvd. E., Seattle, WA 98112-2097).
40
Hockersmith, E. E., G. A. Axel, D. A. Ogden, B. J. Burke, K. E. Frick, B. P. Sandford,
and R. F. Absolon. 2008. Passage behavior and survival for radio-tagged
yearling Chinook salmon and juvenile steelhead at Lower Monumental Dam,
2006. Report of the National Marine Fisheries Service to the U.S. Army Corps of
Engineers, Northwestern Division, Walla Walla, Washington. (Available from
the Northwest Fisheries Science Center, 2725 Montlake Blvd. E., Seattle, WA
98112-2097).
Holmes, H. B. 1952. Loss of salmon fingerlings in passing Bonneville Dam as
determined by marking experiments. Unpublished manuscript, U.S. Bureau of
Commercial Fisheries Report to U.S. Army Corps of Engineers, Northwestern
Division, Portland, Oregon.
Johnson, G. E., N. S. Adams, R. L. Johnson, D. W. Rondorf, D. D. Dauble, and T. Y.
Barila. 2000. Evaluation of the prototype surface bypass for salmonid smolts in
spring 1996 and 1997 at Lower Granite Dam on the Snake River, Washington.
Trans. Am. Fish. Soc. 129:381-397.
Johnson, G. E., R. A. Moursund, and J. R. Skalski. 1998. Fixed location hydroacoustic
evaluation of spill effectiveness at Lower Monumental Dam in 1997. Report of
Pacific Northwest National Laboratories to the U.S. Army Corps of Engineers,
Northwestern Division, Walla Walla, Washington.
Jolly, G. M. 1965. Explicit estimates from capture-recapture data with both death and
immigration-stochastic model. Biometika 52:225-247.
Knight, A. E., G. Marancik, and J. B. Layzer. 1977. Monitoring movements of juvenile
anadromous fish by radiotelemetry. Progressive Fish-Culturist 39:148-150.
Marsh, D. M., G. M. Matthews, S. Achord, T. E. Ruehle, and B. P. Sandford. 1999.
Diversion of salmonid smolts tagged with passive integrated transponders from an
untagged population passing through a juvenile collection system. North
American Journal of Fisheries Management 19:1142-1146.
Muir, W. D., S. G. Smith, J. G. Williams, and B. P. Sandford. 2001. Survival of juvenile
salmonids passing through bypass systems, turbines, and spillways with and
without flow deflectors at Snake River Dams. North American Journal of
Fisheries Management 21:135-146.
Nehlsen, W., J. E. Williams, and J. A. Lichatowich. 1991. Pacific salmon at the
crossroads: stocks at risk from California, Oregon, Idaho, and Washington.
Fisheries 16(2):4-21.
Netboy, A. N. 1980. Columbia River salmon and steelhead trout: their fight for survival.
University of Washington Press, Seattle.

41
NMFS (National Marine Fisheries Service). 1991. Endangered and threatened species:
endangered status for Snake River sockeye salmon. Final Rule. Federal Register
56:224 (20 November 1991):58619-58624.
NMFS (National Marine Fisheries Service). 1992. Endangered and threatened species:
threatened status for Snake River spring/summer Chinook salmon, threatened
status for Snake River fall Chinook salmon. Final Rule. Federal Register 57:78
(22 April 1992):14563-14663.
NMFS (National Marine Fisheries Service). 1995. Reinitiation of consultation on 1994-
1998 operation of the federal Columbia River power system and juvenile
transportation program in 1995 and future years. Endangered Species Act,
Section 7 consultation, Biological opinion. (Available from NMFS Northwest
Regional Office, Hydropower Program, 525 NE Oregon Street, Suite 500,
Portland, OR 97232.)
NMFS (National Marine Fisheries Service). 1998. Endangered and threatened species:
threatened status for two ESUs for steelhead in Washington, Oregon, and
California. Final Rule. Federal Register 63:53 (19 March 1998):13347-13371.
NMFS (National Marine Fisheries Service). 1999. Endangered and threatened species:
threatened status for three Chinook salmon ESUs in Washington and Oregon, and
endangered status of one Chinook salmon ESU in Washington. Final Rule.
Federal Register 64:56(24 March 1999):14307-14328.
NMFS (National Marine Fisheries Service). 2000. Reinitiation of consultation on
operation of the Federal Columbia River power system, including the juvenile fish
transportation program and 19 Bureau of Reclamation projects in the Columbia
Basin. Endangered Species Act - Section 7 Consultation, Biological Opinion.
www.nwr.noaa.gov/1hydrop/hydroweb/docs/Final/2000Biop.html (April 2005).
Ogden, D. A., E. E. Hockersmith, G. A. Axel, B. J. Burke, K. Frick, and B. P. Sandford.
2007. Passage behavior and survival for radio-tagged subyearling Chinook
salmon at Ice Harbor Dam, 2005. Report of the National Marine Fisheries
Service to the U.S. Army Corps of Engineers, Northwestern Division, Walla
Walla, Washington. (Available from the Northwest Fisheries Science Center,
2725 Montlake Blvd. E., Seattle, WA 98112-2097).
Peven, C., A. Giorgi, J. Skalski, M. Langeslay, A. Grassell, S. G. Smith, T. Counihan, R.
Perry, S. Bickford. 2005. Guidelines and recommended protocols for
conducting, analyzing, and reporting juvenile salmonid survival studies in the
Columbia River Basin. Available at
www.pnamp.org//web/workgroups/FPM/meetings/2007_0524/Guid__Sug_Prot_f
inal.pdf (June 2007).
42
Plumb, J. M., A. C. Braatz, J. N. Lucchesi, S. D. Fielding, J. M. Sprando, G. T. George,
N. S. Adams, and D. W. Rondorf. 2003. Behavior of radio-tagged juvenile
Chinook salmon and steelhead and performance of a removable spillway weir at
Lower Granite Dam, Washington, 2002. Annual report to the U. S. Army Corps
of Engineers, Contract W68SBV00104592, Walla Walla, Washington.
Plumb, J. M., A. C. Braatz, J. N. Lucchesi, S. D. Fielding, A. D. Cochran, Theresa K.
Nation, J. M. Sprando, J. L. Schei, R. W. Perry, N. S. Adams, and D. W. Rondorf.
2004. Behavior and survival of radio-tagged juvenile Chinook salmon and
steelhead relative to the performance of a removable spillway weir at Lower
Granite Dam, Washington, 2003. Annual report the U.S. Army Corps of
Engineers, Contract W68SBV00104592, Walla Walla, Washington.
Ryan, B. A., S. G. Smith, J. M. Butzerin, and J. W. Ferguson. 2003. Relative
vulnerability to predation of juvenile salmonids tagged with passive integrated
transponders in the Columbia River Estuary, 1998-2000. . Transactions of the
American Fisheries Society 132:275-288.
Seber, G. A. F. 1965. A note on the multiple recapture census. Biometrika 52:249-259.
Skalski, J. R., R. Townsend, J. Lady, A. E. Giorgi, J. R. Stevenson, and R. D. McDonald.
2002. Estimating route-specific passage and survival probabilities at a
hydroelectric project from smolt radiotelemetry studies. Canadian Journal of
Fisheries and Aquatic Sciences 59:1385-1393.
Smith, J. R. 1974. Distribution of seaward-migrating Chinook salmon and steelhead trout
in the Snake River above Lower Monumental Dam. Marine Fisheries Review
36-8:42-45.
Smith, S. G., J. R. Skalski, W. Schlechte, A. Hoffmann, and V. Cassen. 1994. Statistical
survival analysis of fish and wildlife tagging studies. SURPH.1 Manual.
(Available from University of Washington, School of Aquatic & Fisheries
Science, 1325 Fourth Avenue, Suite 1820, Seattle, WA 98101-2509.)
Snedecor, G. W., and W. G. Cochran. 1980. Statistical Methods. 7th Ed. Iowa St.
Univ. Press, Ames, IA. 507 pp.
Vigg, S., and C. C. Burley. 1991. Temperature-dependent maximum daily consumption
of juvenile salmonids by northern squawfish (Ptychocheilus oregonensis) from
the Columbia River. Canadian Journal of Fisheries and Aquatic Sciences
48:2491-2498.
Whitney, R. R., L. Calvin, M. Erho, and C. Coutant. 1997. Downstream passage for
salmon at hydroelectric projects in the Columbia River Basin: development,
installation, and evaluation. U.S. Department of Energy, Northwest Power
Planning Council, Portland, Oregon. Report 97-15. 101 p.

43
APPENDIX A
Evaluation of Study Assumptions
We used the CJS single-release model (Cormack 1964, Jolly 1965, Seber 1965) to
estimate survival of radio-tagged juvenile Chinook salmon and juvenile steelhead
released above and below Lower Monumental Dam. Ratios of these survival estimates
(treatment survival divided by reference survival) were calculated to determine relative
survival. Evaluation of critical model and biological assumptions of the study are
detailed below.
A1. All tagged fish have similar probabilities of detection at a detection location.
Of the 616 radio-tagged yearling Chinook salmon released above Lower
Monumental Dam and detected on the forebay entrance array, 557 (90.4% of those
released) were detected either at or below our primary survival array 16 km downstream
from Lower Monumental Dam. Of the 637 radio-tagged yearling Chinook salmon
released into the tailrace of Lower Monumental Dam, 618 (97.0% of those released) were
detected either at or below our primary survival array 16 km downstream from Lower
Monumental Dam. Capture histories for survival analysis of yearling Chinook salmon
are presented in Appendix Tables A1-A6.
Of the 621 radio-tagged steelhead released above Lower Monumental Dam and
detected on the forebay entrance array, 538 (86.6% of those released) were detected
either at or below our primary survival array 16 km downstream from Lower
Monumental Dam. Of the 646 radio-tagged steelhead released into the tailrace of Lower
Monumental Dam, 631 (97.7% of those released) were detected either at or below our
primary survival array 16 km downstream from Lower Monumental Dam. Capture
histories for survival analysis of juvenile steelhead are presented in Appendix
Tables A7-A11.
The detection probability for fish used in survival analysis was greater than 0.980
overall (Appendix Table A12). Thus, radiotelemetry detection probability at our primary
array was very near 100%, with few fish detected downstream that were not detected at
the primary array. With detection probabilities at or near 100% for all fish, there was
likely no disparity between detection probabilities of treatment and reference groups.

44
Appendix Table A1. Detection histories of radio-tagged yearling Chinook salmon released above (treatment) and below (reference) Lower Monumental Dam to evaluate dam passage survival in 2007. The primary survival array was 16 km downstream from the dam, and detections downstream from the primary array are shown in Figure 1. Detection histories are 1 = detected; 0 = not detected.
Detection history
Primary survival array Post primary array n
Treatment group (616) 0 0 59
1 0 55
0 1 0
1 1 502
Reference group (637) 0 0 19
1 0 60
0 1 11
1 1 547
Appendix Table A2. Detection histories of radio-tagged yearling Chinook salmon
released above (treatment) and below (reference) Lower Monumental Dam to evaluate concrete passage survival in 2007. The primary survival array was 16 km downstream from the dam, and detections downstream from the primary array are shown in Figure 1. Detection histories are 1 = detected; 0 = not detected.
Detection history
Primary survival array Post primary array n
Treatment group (596) 0 0 43
1 0 56
0 1 0
1 1 497
Reference group (637) 0 0 19
1 0 60
0 1 11
1 1 547
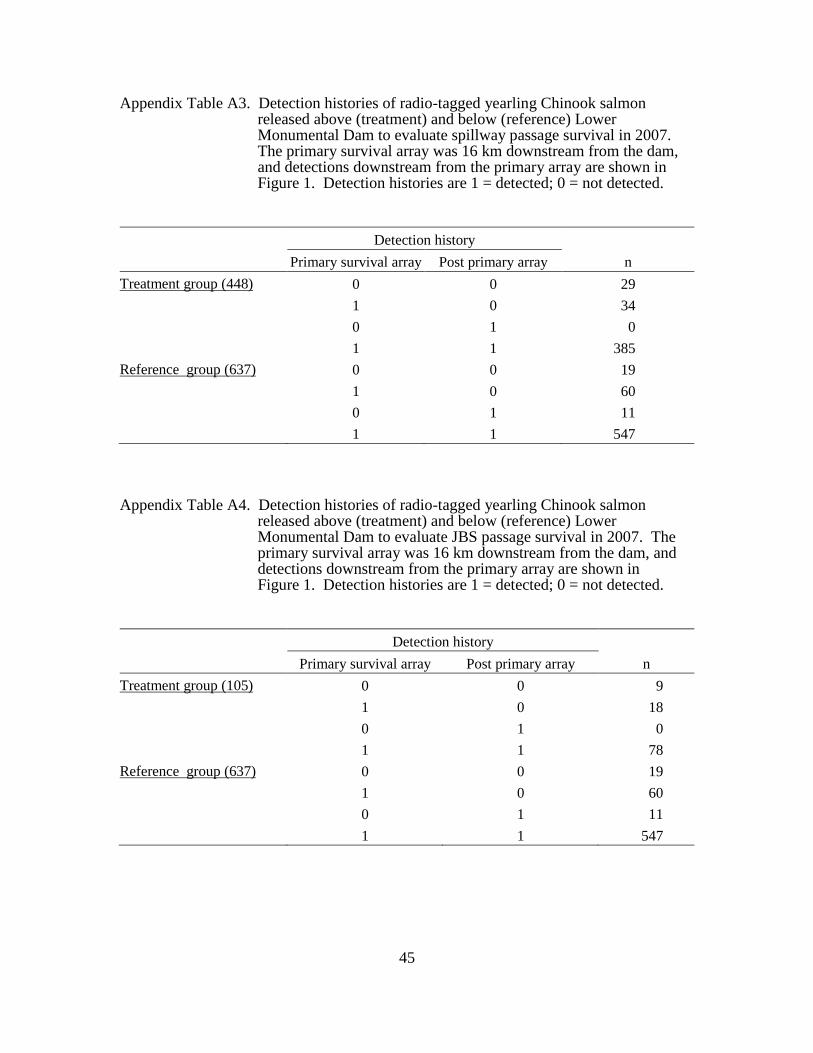
45
Appendix Table A3. Detection histories of radio-tagged yearling Chinook salmon released above (treatment) and below (reference) Lower Monumental Dam to evaluate spillway passage survival in 2007. The primary survival array was 16 km downstream from the dam, and detections downstream from the primary array are shown in Figure 1. Detection histories are 1 = detected; 0 = not detected.
Detection history
Primary survival array Post primary array n
Treatment group (448) 0 0 29
1 0 34
0 1 0
1 1 385
Reference group (637) 0 0 19
1 0 60
0 1 11
1 1 547
Appendix Table A4. Detection histories of radio-tagged yearling Chinook salmon
released above (treatment) and below (reference) Lower Monumental Dam to evaluate JBS passage survival in 2007. The primary survival array was 16 km downstream from the dam, and detections downstream from the primary array are shown in Figure 1. Detection histories are 1 = detected; 0 = not detected.
Detection history
Primary survival array Post primary array n
Treatment group (105) 0 0 9
1 0 18
0 1 0
1 1 78
Reference group (637) 0 0 19
1 0 60
0 1 11
1 1 547

46
Appendix Table A5. Detection histories of radio-tagged yearling Chinook salmon released above (treatment) and below (reference) Lower Monumental Dam to evaluate turbine passage survival in 2007. The primary survival array was 16 km downstream from the dam, and detections downstream from the primary array are shown in Figure 1. Detection histories are 1 = detected; 0 = not detected.
Detection history
Primary survival array Post primary array n
Treatment group (43) 0 0 5
1 0 4
0 1 0
1 1 34
Reference group (637) 0 0 19
1 0 60
0 1 11
1 1 547
Appendix Table A6. Detection histories of radio-tagged yearling Chinook salmon
released above (treatment) and below (reference) Lower Monumental Dam to evaluate Spillbay 8 passage survival in 2007. The primary survival array was 16 km downstream from the dam, and detections downstream from the primary array are shown in Figure 1. Detection histories are 1 = detected; 0 = not detected.
Detection history
Primary survival array Post primary array n
Treatment group (281) 0 0 14
1 0 21
0 1 0
1 1 246
Reference group (637) 0 0 19
1 0 60
0 1 11
1 1 547

47
Appendix Table A7. Detection histories of radio-tagged juvenile steelhead released above (treatment) and below (reference) Lower Monumental Dam to evaluate dam passage survival in 2007. The primary survival array was 16 km downstream from the dam and detections downstream from the primary array are shown in Figure 1. Detection histories recorded as: 1, detected; 0, not detected.
Detection history
Primary survival array Post primary array n
Treatment group (621) 0 0 83
1 0 94
0 1 3
1 1 441
Reference group (646) 0 0 15
1 0 58
0 1 1
1 1 572
Appendix Table A8. Detection histories of radio-tagged juvenile steelhead released
above (treatment) and below (reference) Lower Monumental Dam to evaluate concrete passage survival in 2007. The primary survival array was 16 km downstream from the dam and detections downstream from the primary array are shown in Figure 1. Detection histories are 1 = detected; 0 = not detected.
Detection history
Primary survival array Post primary array n
Treatment group (566) 0 0 40
1 0 90
0 1 3
1 1 433
Reference group (646) 0 0 15
1 0 58
0 1 1
1 1 572

48
Appendix Table A9. Detection histories of radio-tagged juvenile steelhead released
above (treatment) and below (reference) Lower Monumental Dam
to evaluate spillway passage survival in 2007. The primary survival
array was 16 km downstream from the dam and detections
downstream from the primary array are shown in Figure 1.
Detection histories are 1 = detected; 0 = not detected.
Detection history
Primary survival array Post primary array n
Treatment group (361) 0 0 31
1 0 51
0 1 2
1 1 277
Reference group (646) 0 0 15
1 0 58
0 1 1
1 1 572
Appendix Table A10. Detection histories of radio-tagged juvenile steelhead released
above (treatment) and below (reference) Lower Monumental Dam to evaluate JBS passage survival in 2007. The primary survival array was 16 km downstream from the dam and detections downstream from the primary array are shown in Figure 1. Detection histories are 1 = detected; 0 = not detected.
Detection history
Primary survival array Post primary array n
Treatment group (185) 0 0 7
1 0 36
0 1 1
1 1 141
Reference group (646) 0 0 15
1 0 58
0 1 1
1 1 572

49
Appendix Table A11. Detection histories of radio-tagged juvenile steelhead released above (treatment) and below (reference) Lower Monumental Dam to evaluate Spillbay 8 passage survival in 2007. The primary survival array was 16 km downstream from the dam and detections downstream from the primary array are shown in Figure 1. Detection histories are 1 = detected; 0 = not detected.
Detection history
Primary survival array Post primary array n
Treatment group (202) 0 0 15
1 0 27
0 1 1
1 1 159
Reference group (646) 0 0 15
1 0 58
0 1 1
1 1 572
Appendix Table A12. Detections at the primary survival array and below, and the
resulting detection probabilities at the primary survival array 16 km downstream from the dam. These probabilities satisfied assumptions of the CJS model used in evaluating survival of yearling Chinook salmon and juvenile steelhead passing Lower Monumental Dam, 2007.
Release group
Detection at primary
array and below
Detection
below primary array Detection probability
Yearling Chinook salmon
Treatment 507 508 0.998
Reference 547 558 0.980
Totals 1,054 1,056 0.989
Juvenile steelhead
Treatment 445 448 0.993
Reference 572 573 0.998
Totals 1,017 1,021 0.996

50
A2. Treatment and corresponding reference groups are evenly mixed and travel
together through downstream reaches.
The difference in passage distribution of treatment and reference groups at the
primary survival array (16 km downstream from the dam) were examined to determine if
groups were evenly mixed and travel together through downstream reaches (Appendix
Tables A13 and A14). Mixing was compared for specific percentiles (10th, 50th, 90th)
of the passage distribution with t tests for differences in passage distributions (Tables
A15 and A16). For mixing analysis the date of passage of treatment fish at Lower
Monumental Dam was paired with the release date of reference fish.
Tests of homogeneity in passage distributions at the primary survival array
showed statistically significant differences for both species between treatment and
reference groups used to calculate relative survival estimates (Appendix Tables A15 and
A16). However the biological significance is small (-1.5 and -4.0 hours for yearling
Chinook salmon and steelhead, respectively) and is partly explained by the differential
passage at Lower Monumental Dam of treatment (continuous) and control (systematically
for six hours in daylight and darkness). We concluded the overall survival estimates
were not biased regarding mixing through the common reach.
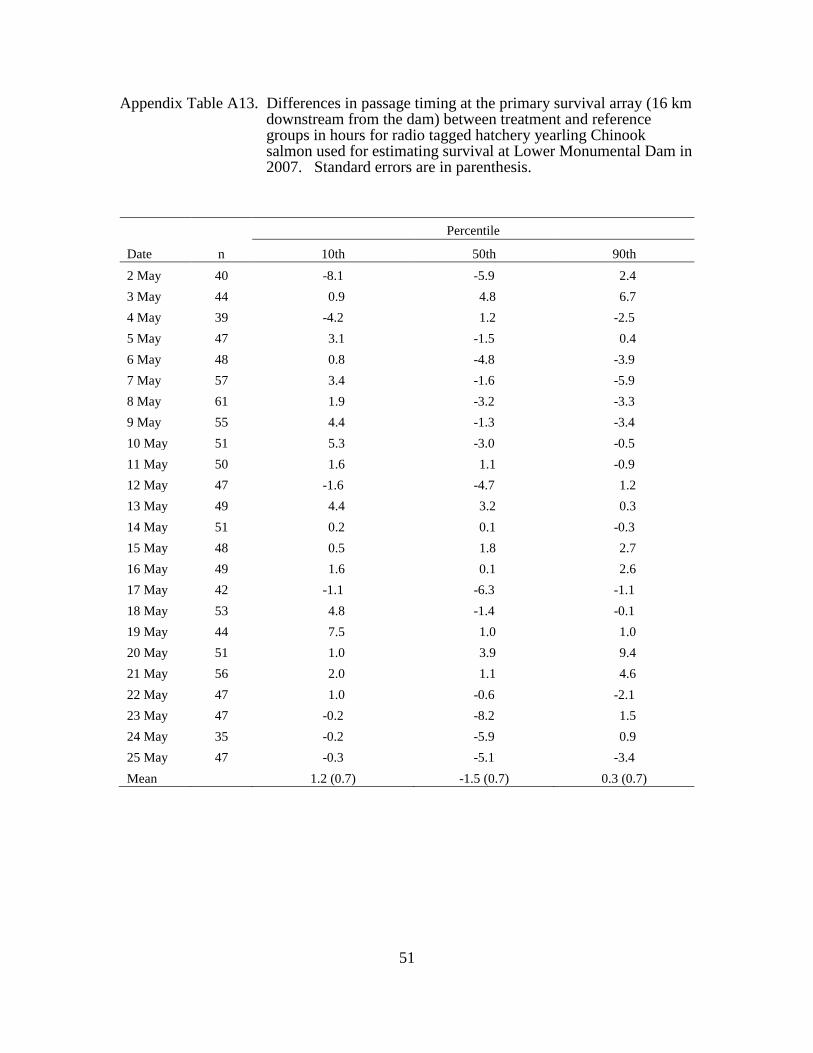
51
Appendix Table A13. Differences in passage timing at the primary survival array (16 km downstream from the dam) between treatment and reference groups in hours for radio tagged hatchery yearling Chinook salmon used for estimating survival at Lower Monumental Dam in 2007. Standard errors are in parenthesis.
Percentile
Date n 10th 50th 90th
2 May 40 -8.1 -5.9 2.4
3 May 44 0.9 4.8 6.7
4 May 39 -4.2 1.2 -2.5
5 May 47 3.1 -1.5 0.4
6 May 48 0.8 -4.8 -3.9
7 May 57 3.4 -1.6 -5.9
8 May 61 1.9 -3.2 -3.3
9 May 55 4.4 -1.3 -3.4
10 May 51 5.3 -3.0 -0.5
11 May 50 1.6 1.1 -0.9
12 May 47 -1.6 -4.7 1.2
13 May 49 4.4 3.2 0.3
14 May 51 0.2 0.1 -0.3
15 May 48 0.5 1.8 2.7
16 May 49 1.6 0.1 2.6
17 May 42 -1.1 -6.3 -1.1
18 May 53 4.8 -1.4 -0.1
19 May 44 7.5 1.0 1.0
20 May 51 1.0 3.9 9.4
21 May 56 2.0 1.1 4.6
22 May 47 1.0 -0.6 -2.1
23 May 47 -0.2 -8.2 1.5
24 May 35 -0.2 -5.9 0.9
25 May 47 -0.3 -5.1 -3.4
Mean 1.2 (0.7) -1.5 (0.7) 0.3 (0.7)
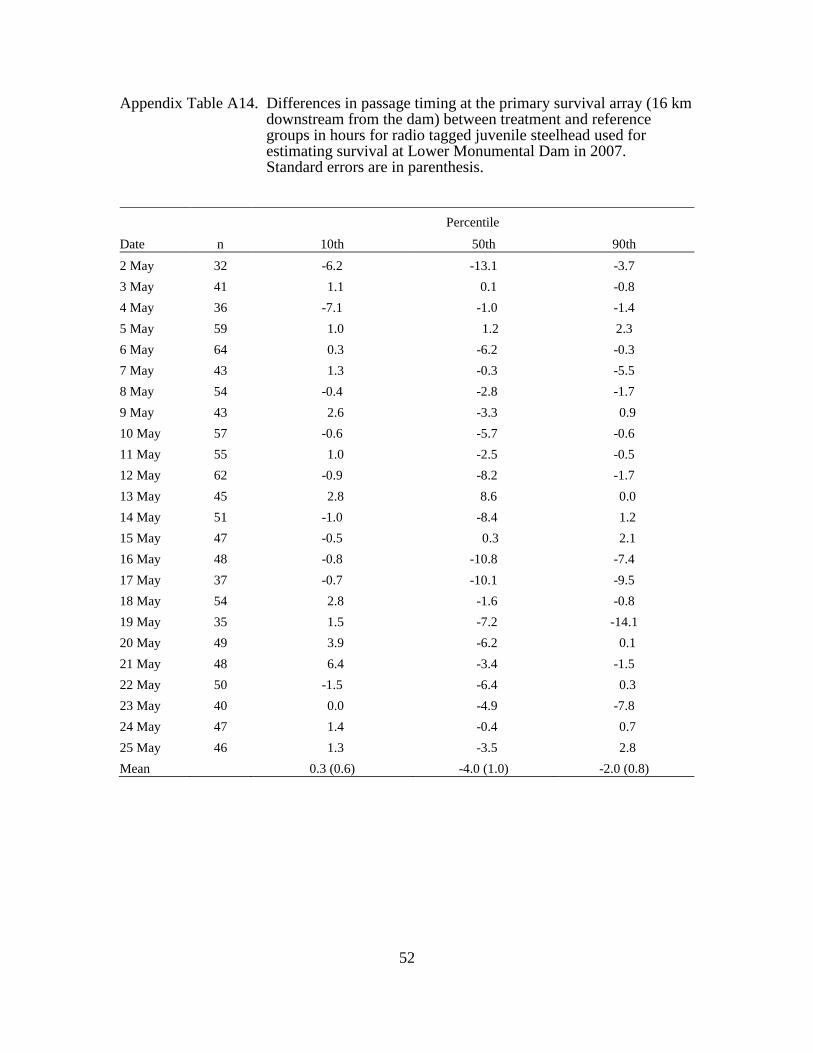
52
Appendix Table A14. Differences in passage timing at the primary survival array (16 km downstream from the dam) between treatment and reference groups in hours for radio tagged juvenile steelhead used for estimating survival at Lower Monumental Dam in 2007. Standard errors are in parenthesis.
Percentile
Date n 10th 50th 90th
2 May 32 -6.2 -13.1 -3.7
3 May 41 1.1 0.1 -0.8
4 May 36 -7.1 -1.0 -1.4
5 May 59 1.0 1.2 2.3
6 May 64 0.3 -6.2 -0.3
7 May 43 1.3 -0.3 -5.5
8 May 54 -0.4 -2.8 -1.7
9 May 43 2.6 -3.3 0.9
10 May 57 -0.6 -5.7 -0.6
11 May 55 1.0 -2.5 -0.5
12 May 62 -0.9 -8.2 -1.7
13 May 45 2.8 8.6 0.0
14 May 51 -1.0 -8.4 1.2
15 May 47 -0.5 0.3 2.1
16 May 48 -0.8 -10.8 -7.4
17 May 37 -0.7 -10.1 -9.5
18 May 54 2.8 -1.6 -0.8
19 May 35 1.5 -7.2 -14.1
20 May 49 3.9 -6.2 0.1
21 May 48 6.4 -3.4 -1.5
22 May 50 -1.5 -6.4 0.3
23 May 40 0.0 -4.9 -7.8
24 May 47 1.4 -0.4 0.7
25 May 46 1.3 -3.5 2.8
Mean 0.3 (0.6) -4.0 (1.0) -2.0 (0.8)

53
Appendix Table A15. Mean difference and tests of homogeneity of passage timing at the primary survival array (16 km downstream from the dam) for treatment groups and reference groups of radio tagged hatchery yearling Chinook salmon used for estimating survival at Lower Monumental Dam in 2007. Significant differences in passage timing among tests was determined for α = 0.05.
Passage percentile Mean difference in timing (hours) t df P
10th 1.2 1.83 23 0.080
50th -1.5 -2.07 23 0.050
90th 0.3 0.37 23 0.718
Appendix Table A16. Mean difference and tests of homogeneity of passage timing at the
primary survival array (16 km downstream from the dam) for treatment groups and reference groups of radio tagged steelhead used for estimating survival at Lower Monumental Dam in 2007. Significant differences in passage timing among tests was determined for α = 0.05.
Passage percentile Mean difference in timing (hours) t df P
10th 0.3 0.56 23 0.583
50th -4.0 -4.20 23 <0.001
90th -2.0 -2.33 23 0.029

54
A3. Individuals tagged for the study are a representative sample of the population of
interest.
River run, hatchery yearling Chinook salmon and juvenile steelhead were
collected at the Lower Monumental Dam smolt collection facility from 1 to 26 May.
Only fish not previously PIT tagged, without any visual signs of disease or injuries, and
12 g or larger were used. Tagging comprised the period between the 3rd
and 99th
passage
percentile for yearling Chinook salmon and between the 1st and 97
th passage percentile
for juvenile steelhead at Lower Monumental Dam in 2007 (Figure 3). Overall mean fork
lengths for yearling Chinook salmon were 145.0 mm (SD = 11.0) and 145.5 mm (SD =
12.2) for fish released into the forebay and tailrace of Lower Monumental Dam,
respectively (Table 2). Overall mean fork lengths for juvenile steelhead were 218.1 mm
(SD = 20.5) and 219.8 mm (SD = 21.1) for fish released into the forebay and tailrace of
Lower Monumental Dam, respectively (Table 4).
A4. The tag and/or tagging method do not significantly affect the subsequent behavior
or survival of the marked individual.
Assumption A4 was not tested for validation in this study. However, the effects
of radio tagging on survival, predation, growth, and swimming performance of juvenile
salmonids have previously been evaluated by Adams et al. (1998) and Hockersmith et al.
(2003). From their conclusions, we assumed that behavior and survival were not
significantly affected over the length of our study area.
A5. Fish that die as a result of passing through a passage route are not subsequently
detected at a downstream array that is used to estimate survival for that passage
route.
In 2007, we conducted a very limited test of the assumption that fish that die as a
result of passing through a passage route are not subsequently detected at a downstream
array that is used to estimate survival for that passage route because past studies at Lower
Monumental Dam have not observed a violation of this assumption. We released 5, 7, 4,
and 2 dead radio tagged hatchery yearling Chinook salmon and juvenile steelhead into
the forebay and the tailrace of Lower Monumental Dam to test Assumption A5
(Appendix Table A17). Forebay releases were 7 km upstream from the forebay entrance
array. The distance between release at Lower Monumental Dam and the first
downstream telemetry array used to estimate survival was 16 km. Similar to past
findings, no dead radio tagged fish were detected at any downstream telemetry arrays.

55
Appendix Table A17. Numbers of dead fish released and subsequent detections downstream from release locations. These releases were used to test the study assumption that fish that die as a result of passing through a passage route at Lower Monumental Dam are not subsequently detected on downstream survival arrays.
Dead fish releases
Yearling Chinook salmon Juvenile steelhead
Forebay Tailrace Overall Forebay Tailrace Overall
Number released 5 7 11 4 2 6
Proportion of total released (%) 0.8 1.1 1.0 0.6 0.0 0.5
Number detected below release site 0 0 0 0 0 0
A6. The radio transmitters functioned properly and for the predetermined period of
time.
All transmitters were checked upon receipt from the manufacturer, prior to
implantation into a fish and prior to release, to ensure that the transmitter was functioning
properly. Of 2,662 tags allocated for the evaluation of Lower Monumental Dam spillway
survival 33 (1.2%) could not be activated and were therefore not used. A total of 2,629
tags were implanted in either hatchery yearling Chinook salmon of juvenile steelhead of
which 2 (0.1%) were not working 24 h after tagging. Of the live fish released with
functional tags, a total of 8 fish (0.3% of those released) (4 yearling Chinook salmon and
4 juvenile steelhead) released upstream from Lower Monumental Dam were subsequently
detected at downstream PIT tag detection facilities and not detected on any
radiotelemetry arrays. The transmitters in these fish likely malfunctioned. All fish with
tags that were known to be not functioning properly were excluded from the study.
In addition, a total of 76 radio transmitters throughout the study were tested for
tag life by allowing them to run in river water and checking them daily to determine if
they functioned for the predetermined period of time. Four tags (5.3%) failed prior to the
preprogrammed shut down after 10 d (Appendix Table A18). Of these, no tags failed in
less than 6 d. Ninety-percent of the fish had travel times to the primary array in less than
4 d and the maximum travel time from release to our primary survival array was 9.2 d
(Appendix Table A19). Although we documented transmitter failures during our study,
the short travel times to our survival array and the relatively low failure rate were such
that they would not have significantly changed our findings.

56
Appendix Table A18. Transmitter battery life testing.
Tags (n) Tags (%) Battery life (d)
0 0.0 1
0 0.0 2
0 0.0 3
0 0.0 4
0 0.0 5
1 1.3 6
1 1.3 7
0 0.0 8
2 2.6 9
72 94.7 10
Appendix Table A19. Travel time from release to detection at the primary survival array
for radio tagged, hatchery yearling Chinook salmon and juvenile steelhead released into the forebay and the tailrace of Lower Monumental Dam, 2007.
Travel time (d) to primary survival array by release location and species
Yearling Chinook salmon Juvenile steelhead
Percentile Forebay Tailrace Forebay Tailrace
10 0.5 0.1 0.8 0.1
20 0.6 0.1 1.0 0.1
30 0.7 0.1 1.2 0.1
40 0.8 0.1 1.5 0.1
50 0.8 0.1 1.7 0.1
60 0.9 0.1 2.0 0.1
70 1.0 0.1 2.3 0.1
80 1.1 0.2 2.9 0.2
90 1.3 0.2 3.8 0.3
Max 7.4 0.6 9.2 3.5
Time > 6 d 1 (0.2%) 0 (0.0%) 10 (0.2%) 0 (0.0%)
n 564 607 539 630

57
APPENDIX B
Grouping of Treatment and Reference Release Groups for Estimating Survival
Appendix Table B1. Daily dam survival estimates and replicate group sizes for yearling
Chinook salmon passing Lower Monumental Dam, 2007. Standard
errors are in parenthesis.
Treatment Reference
Relative survival Date n Survival n Survival
1-2 May 36 0.767 (0.077) 16 1.010 (0.012) 0.759 (0.077)
3 May 25 0.840 (0.073) 25 0.920 (0.054) 0.913 (0.096)
4 May 23 0.913 (0.059) 16 1.000 (0.000) 0.913 (0.059)
5 May 20 0.900 (0.067) 31 1.005 (0.005) 0.896 (0.067)
6 May 24 0.917 (0.056) 27 0.963 (0.036) 0.952 (0.069)
7 May 26 0.923 (0.052) 32 1.000 (0.000) 0.923 (0.052)
8 May 35 0.914 (0.047) 30 0.967 (0.033) 0.946 (0.059)
9 May 28 0.964 (0.035) 29 0.931 (0.047) 1.036 (0.065)
10 May 27 0.963 (0.036) 26 0.962 (0.038) 1.002 (0.054)
11 May 23 1.000 (0.000) 27 1.000 (0.000) 1.000 (0.000)
12 May 26 0.885 (0.063) 25 0.960 (0.039) 0.921 (0.075)
13 May 30 0.867 (0.062) 26 0.885 (0.063) 0.980 (0.099)
14 May 29 0.862 (0.064) 28 0.929 (0.049) 0.928 (0.084)
15 May 26 0.923 (0.052) 24 1.000 (0.000) 0.923 (0.052)
16 May 24 0.917 (0.056) 28 0.964 (0.035) 0.951 (0.068)
17 May 17 0.941 (0.057) 28 0.978 (0.038) 0.962 (0.069)
18 May 31 0.903 (0.053) 26 0.962 (0.038) 0.939 (0.066)
19 May 24 0.792 (0.083) 28 1.005 (0.005) 0.788 (0.083)
20 May 27 0.963 (0.036) 28 0.978 (0.038) 0.985 (0.053)
21 May 29 0.966 (0.034) 28 1.000 (0.000) 0.966 (0.034)
22 May 21 1.000 (0.000) 26 1.000 (0.000) 1.000 (0.000)
23 May 21 0.952 (0.047) 27 1.000 (0.000) 0.952 (0.047)
24 May 19 0.684 (0.107) 25 0.929 (0.056) 0.737 (0.123)
25-27May 25 0.957 (0.043) 31 1.000 (0.000) 0.957 (0.043)
Overall 616 0.902 (0.015) 637 0.973 (0.007) 0.930 (0.016)
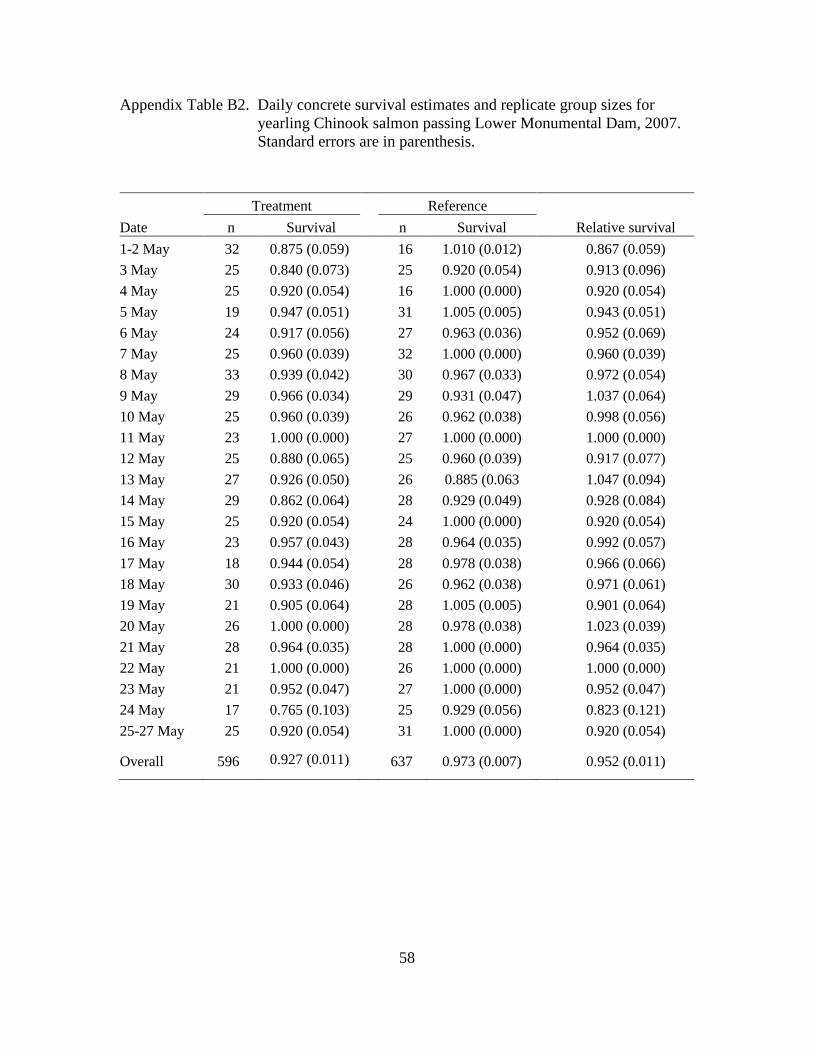
58
Appendix Table B2. Daily concrete survival estimates and replicate group sizes for
yearling Chinook salmon passing Lower Monumental Dam, 2007.
Standard errors are in parenthesis.
Treatment Reference
Date n Survival n Survival Relative survival
1-2 May 32 0.875 (0.059) 16 1.010 (0.012) 0.867 (0.059)
3 May 25 0.840 (0.073) 25 0.920 (0.054) 0.913 (0.096)
4 May 25 0.920 (0.054) 16 1.000 (0.000) 0.920 (0.054)
5 May 19 0.947 (0.051) 31 1.005 (0.005) 0.943 (0.051)
6 May 24 0.917 (0.056) 27 0.963 (0.036) 0.952 (0.069)
7 May 25 0.960 (0.039) 32 1.000 (0.000) 0.960 (0.039)
8 May 33 0.939 (0.042) 30 0.967 (0.033) 0.972 (0.054)
9 May 29 0.966 (0.034) 29 0.931 (0.047) 1.037 (0.064)
10 May 25 0.960 (0.039) 26 0.962 (0.038) 0.998 (0.056)
11 May 23 1.000 (0.000) 27 1.000 (0.000) 1.000 (0.000)
12 May 25 0.880 (0.065) 25 0.960 (0.039) 0.917 (0.077)
13 May 27 0.926 (0.050) 26 0.885 (0.063 1.047 (0.094)
14 May 29 0.862 (0.064) 28 0.929 (0.049) 0.928 (0.084)
15 May 25 0.920 (0.054) 24 1.000 (0.000) 0.920 (0.054)
16 May 23 0.957 (0.043) 28 0.964 (0.035) 0.992 (0.057)
17 May 18 0.944 (0.054) 28 0.978 (0.038) 0.966 (0.066)
18 May 30 0.933 (0.046) 26 0.962 (0.038) 0.971 (0.061)
19 May 21 0.905 (0.064) 28 1.005 (0.005) 0.901 (0.064)
20 May 26 1.000 (0.000) 28 0.978 (0.038) 1.023 (0.039)
21 May 28 0.964 (0.035) 28 1.000 (0.000) 0.964 (0.035)
22 May 21 1.000 (0.000) 26 1.000 (0.000) 1.000 (0.000)
23 May 21 0.952 (0.047) 27 1.000 (0.000) 0.952 (0.047)
24 May 17 0.765 (0.103) 25 0.929 (0.056) 0.823 (0.121)
25-27 May 25 0.920 (0.054) 31 1.000 (0.000) 0.920 (0.054)
Overall 596 0.927 (0.011) 637 0.973 (0.007) 0.952 (0.011)

59
Appendix Table B3. Daily spillway survival estimates and replicate group sizes for
yearling Chinook salmon passing Lower Monumental Dam, 2007.
Standard errors are in parenthesis.
Treatment Reference
Date n Survival n Survival Relative survival
2 May 19 0.842 (0.084) 16 1.010 (0.012) 0.834 (0.083)
3 May 17 0.882 (0.078) 25 0.920 (0.054) 0.959 (0.102)
4 May 19 0.895 (0.070) 16 1.000 (0.000) 0.895 (0.070)
5 May 15 0.933 (0.064) 31 1.005 (0.005) 0.929 (0.064)
6 May 16 0.938 (0.061) 27 0.963 (0.036) 0.974 (0.073)
7 May 24 0.958 (0.041) 32 1.000 (0.000) 0.958 (0.041)
8 May 31 0.936 (0.044) 30 0.967 (0.033) 0.968 (0.056)
9 May 29 0.966 (0.034) 29 0.931 (0.047) 1.037 (0.064)
10 May 18 1.000 (0.000) 26 0.962 (0.038) 1.040 (0.041)
11 May 17 1.000 (0.000) 27 1.000 (0.000) 1.000 (0.000)
12 May 15 0.933 (0.064) 25 0.960 (0.039) 0.972 (0.078)
13 May 13 0.923 (0.074) 26 0.885 (0.063 1.044 (0.112)
14 May 19 0.842 (0.0837) 28 0.929 (0.049) 0.907 (0.102)
15 May 15 0.933 (0.064) 24 1.000 (0.000) 0.933 (0.064)
16 May 16 0.938 (0.061) 28 0.964 (0.035) 0.972 (0.072)
17 May 15 0.933 (0.064) 28 0.978 (0.038) 0.954 (0.075)
18 May 27 0.926 (0.051) 26 0.962 (0.038) 0.963 (0.065)
19 May 15 1.000 (0.000) 28 1.005 (0.005) 0.996 (0.005)
20 May 19 1.000 (0.000) 28 0.978 (0.038) 1.023 (0.039)
21 May 22 0.955 (0.044) 28 1.000 (0.000) 0.955 (0.044)
22 May 17 1.000 (0.000) 26 1.000 (0.000) 1.000 (0.000)
23 May 16 0.938 (0.061) 27 1.000 (0.000) 0.938 (0.061)
24 May 15 0.800 (0.103) 25 0.929 (0.056) 0.861 (0.123)
25-27 May 19 0.947 (0.051) 31 1.000 (0.000) 0.947 (0.051)
Overall 448 0.934 (0.011) 637 0.973 (0.007) 0.959 (0.011)
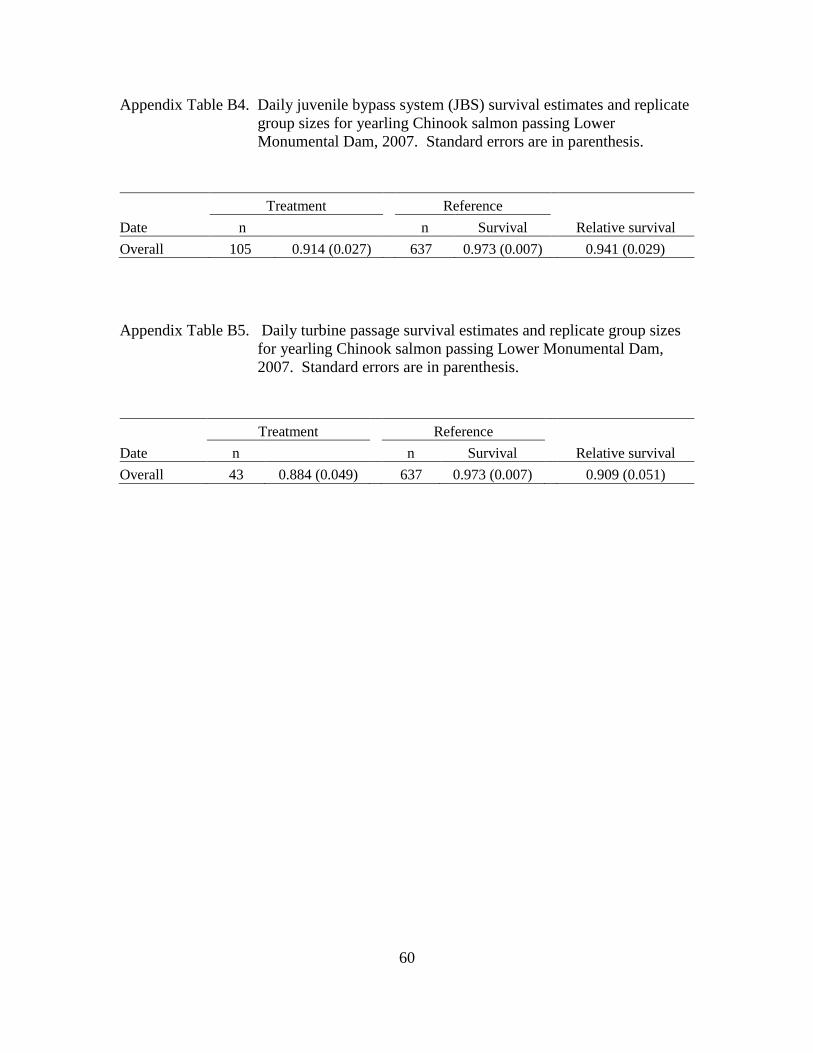
60
Appendix Table B4. Daily juvenile bypass system (JBS) survival estimates and replicate
group sizes for yearling Chinook salmon passing Lower
Monumental Dam, 2007. Standard errors are in parenthesis.
Treatment Reference
Date n n Survival Relative survival
Overall 105 0.914 (0.027) 637 0.973 (0.007) 0.941 (0.029)
Appendix Table B5. Daily turbine passage survival estimates and replicate group sizes
for yearling Chinook salmon passing Lower Monumental Dam,
2007. Standard errors are in parenthesis.
Treatment Reference
Date n n Survival Relative survival
Overall 43 0.884 (0.049) 637 0.973 (0.007) 0.909 (0.051)

61
Appendix Table B6. Daily estimates of survival through Spillbay 8 for yearling Chinook
salmon passing Lower Monumental Dam, 2007. Standard errors
are in parenthesis.
Treatment Reference
Relative survival Date n n Survival
2 May 12 0.833 (0.108) 16 1.010 (0.012) 0.825 (0.107)
3 May 10 1.000 (0.000) 25 0.920 (0.054) 1.087 (0.064)
4 May 17 0.941 (0.057) 16 1.000 (0.000) 0.941 (0.057)
5 May 11 1.000 (0.000) 31 1.005 (0.005) 0.995 (0.005)
6 May 7 1.000 (0.000) 27 0.963 (0.036) 1.038 (0.039)
7 May 16 1.000 (0.000) 32 1.000 (0.000) 1.000 (0.000)
8 May 14 1.000 (0.000) 30 0.967 (0.033) 1.034 (0.036)
9 May 18 0.944 (0.054) 29 0.931 (0.047) 1.014 (0.077)
10 May 14 1.000 (0.000) 26 0.962 (0.038) 1.040 (0.041)
11 May 11 1.000 (0.000) 27 1.000 (0.000) 1.000 (0.000)
12 May 12 0.917 (0.080) 25 0.960 (0.039) 0.955 (0.092)
13 May 6 0.833 (0.152) 26 0.885 (0.063) 0.942 (0.184)
14 May 13 0.846 (0.100) 28 0.929 (0.049) 0.911 (0.118)
15 May 9 1.000 (0.000) 24 1.000 (0.000) 1.000 (0.000)
16 May 8 1.000 (0.000) 28 0.964 (0.035) 1.037 (0.038)
17 May 10 0.900 (0.095) 28 0.978 (0.038) 0.920 (0.103)
18 May 15 0.933 (0.064) 26 0.962 (0.038) 0.971 (0.077)
19 May 9 1.000 (0.000) 28 1.005 (0.005) 0.996 (0.005)
20 May 14 1.000 (0.000) 28 0.978 (0.038) 1.023 (0.039)
21 May 16 0.938 (0.061) 28 1.000 (0.000) 0.938 (0.061)
22 May 8 1.000 (0.000) 26 1.000 (0.000) 1.000 (0.000)
23 May 10 1.000 (0.000) 27 1.000 (0.000) 1.000 (0.000)
24 May 12 0.750 (0.125) 25 0.929 (0.056) 0.807 (0.143)
25-27 May 9 1.000 (0.000) 31 1.000 (0.000) 1.000 (0.000)
Overall 281 0.951 (0.015) 637 0.973 (0.007) 0.976 (0.014)
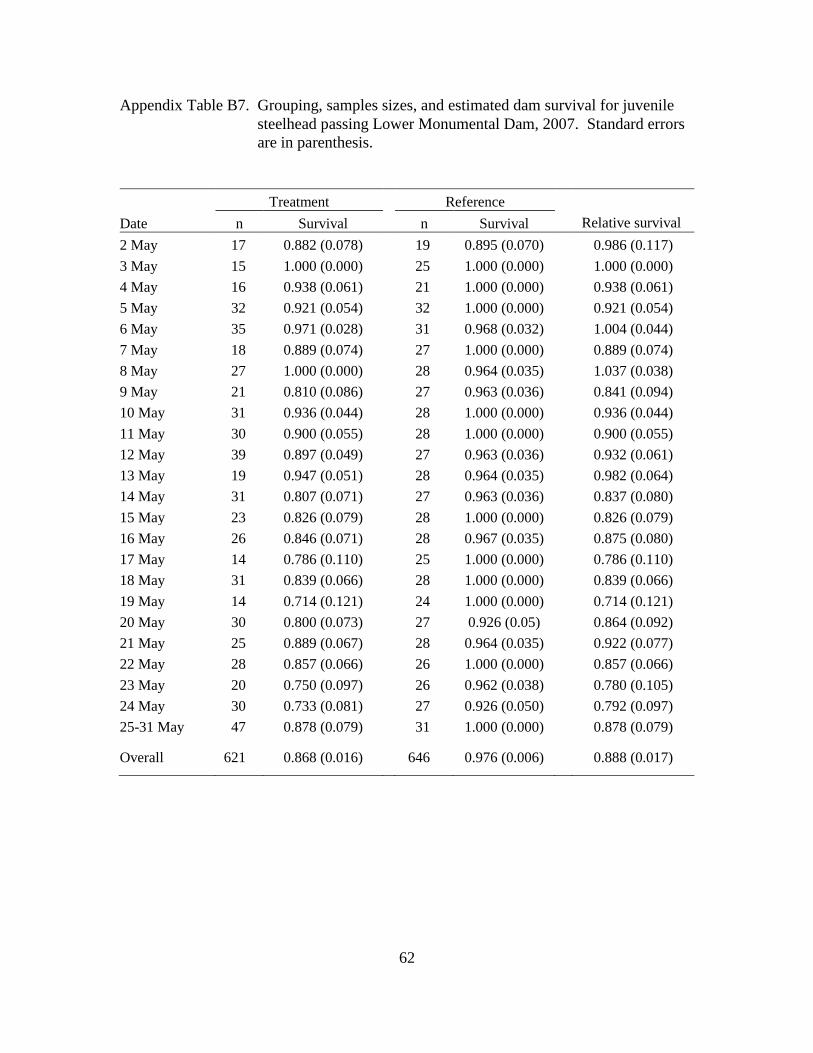
62
Appendix Table B7. Grouping, samples sizes, and estimated dam survival for juvenile
steelhead passing Lower Monumental Dam, 2007. Standard errors
are in parenthesis.
Treatment Reference
Relative survival Date n Survival n Survival
2 May 17 0.882 (0.078) 19 0.895 (0.070) 0.986 (0.117)
3 May 15 1.000 (0.000) 25 1.000 (0.000) 1.000 (0.000)
4 May 16 0.938 (0.061) 21 1.000 (0.000) 0.938 (0.061)
5 May 32 0.921 (0.054) 32 1.000 (0.000) 0.921 (0.054)
6 May 35 0.971 (0.028) 31 0.968 (0.032) 1.004 (0.044)
7 May 18 0.889 (0.074) 27 1.000 (0.000) 0.889 (0.074)
8 May 27 1.000 (0.000) 28 0.964 (0.035) 1.037 (0.038)
9 May 21 0.810 (0.086) 27 0.963 (0.036) 0.841 (0.094)
10 May 31 0.936 (0.044) 28 1.000 (0.000) 0.936 (0.044)
11 May 30 0.900 (0.055) 28 1.000 (0.000) 0.900 (0.055)
12 May 39 0.897 (0.049) 27 0.963 (0.036) 0.932 (0.061)
13 May 19 0.947 (0.051) 28 0.964 (0.035) 0.982 (0.064)
14 May 31 0.807 (0.071) 27 0.963 (0.036) 0.837 (0.080)
15 May 23 0.826 (0.079) 28 1.000 (0.000) 0.826 (0.079)
16 May 26 0.846 (0.071) 28 0.967 (0.035) 0.875 (0.080)
17 May 14 0.786 (0.110) 25 1.000 (0.000) 0.786 (0.110)
18 May 31 0.839 (0.066) 28 1.000 (0.000) 0.839 (0.066)
19 May 14 0.714 (0.121) 24 1.000 (0.000) 0.714 (0.121)
20 May 30 0.800 (0.073) 27 0.926 (0.05) 0.864 (0.092)
21 May 25 0.889 (0.067) 28 0.964 (0.035) 0.922 (0.077)
22 May 28 0.857 (0.066) 26 1.000 (0.000) 0.857 (0.066)
23 May 20 0.750 (0.097) 26 0.962 (0.038) 0.780 (0.105)
24 May 30 0.733 (0.081) 27 0.926 (0.050) 0.792 (0.097)
25-31 May 47 0.878 (0.079) 31 1.000 (0.000) 0.878 (0.079)
Overall 621 0.868 (0.016) 646 0.976 (0.006) 0.888 (0.017)

63
Appendix Table B8. Grouping, samples sizes, and estimated concrete survival for
juvenile steelhead passing Lower Monumental Dam, 2007.
Standard errors are in parenthesis.
Treatment Reference
Relative survival Date n Survival n Survival
1-2 May 18 0.944 (0.054) 19 0.895 (0.070) 1.056 (0.103)
3 May 16 1.000 (0.000) 25 1.000 (0.000) 1.000 (0.000)
4 May 15 1.000 (0.000) 21 1.000 (0.000) 1.000 (0.000)
5 May 29 0.982 (0.037) 32 1.000 (0.000) 0.982 (0.037)
6 May 33 1.000 (0.000) 31 0.968 (0.032) 1.033 (0.034)
7 May 15 1.000 (0.000) 27 1.000 (0.000) 1.000 (0.000)
8 May 26 1.000 (0.000) 28 0.964 (0.035) 1.037 (0.038)
9 May 17 0.941 (0.057) 27 0.963 (0.036) 0.977 (0.070)
10 May 29 0.931 (0.047) 28 1.000 (0.000) 0.931 (0.047)
11 May 28 0.964 (0.035) 28 1.000 (0.000) 0.964 (0.035)
12 May 37 0.946 (0.037) 27 0.963 (0.036) 0.982 (0.054)
13 May 19 0.947 (0.051) 28 0.964 (0.035) 0.982 (0.064)
14 May 26 0.923 (0.052) 27 0.963 (0.036) 0.959 (0.065)
15 May 22 0.864 (0.073) 28 1.000 (0.000) 0.864 (0.073)
16 May 22 0.955 (0.044) 28 0.967 (0.035) 0.987 (0.058)
17 May 14 0.857 (0.094) 25 1.000 (0.000) 0.857 (0.094)
18 May 26 0.962 (0.038) 28 1.000 (0.000) 0.962 (0.038)
19 May 11 0.909 (0.087) 24 1.000 (0.000) 0.909 (0.087)
20 May 26 0.885 (0.063) 27 0.926 (0.050) 0.955 (0.085)
21 May 22 1.011 (0.012) 28 0.964 (0.035) 1.048 (0.040)
22 May 25 0.920 (0.054) 26 1.000 (0.000) 0.920 (0.054)
23 May 16 0.813 (0.098) 26 0.962 (0.038) 0.845 (0.107)
24 May 27 0.815 (0.075) 27 0.926 (0.050) 0.880 (0.094)
25-27 May 47 0.830 (0.055) 31 1.000 (0.000) 0.830 (0.055)
Overall 566 0.933 (0.013) 646 0.976 (0.006) 0.955 (0.013)
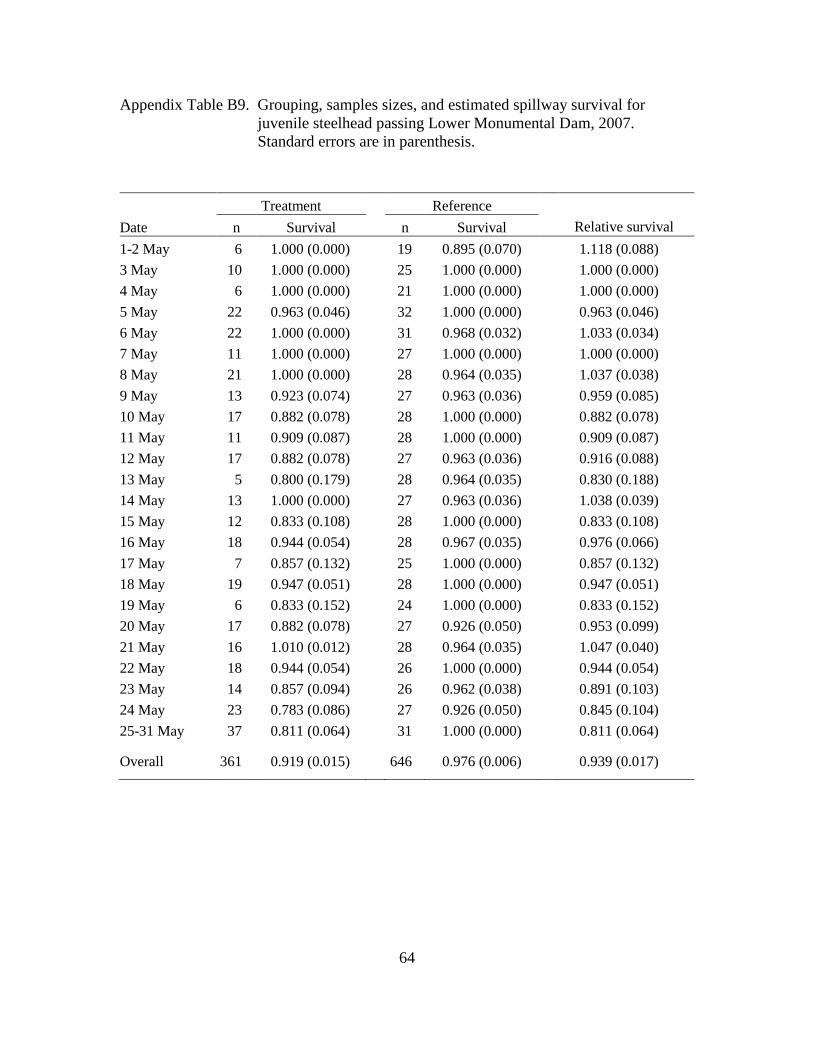
64
Appendix Table B9. Grouping, samples sizes, and estimated spillway survival for
juvenile steelhead passing Lower Monumental Dam, 2007.
Standard errors are in parenthesis.
Treatment Reference
Relative survival Date n Survival n Survival
1-2 May 6 1.000 (0.000) 19 0.895 (0.070) 1.118 (0.088)
3 May 10 1.000 (0.000) 25 1.000 (0.000) 1.000 (0.000)
4 May 6 1.000 (0.000) 21 1.000 (0.000) 1.000 (0.000)
5 May 22 0.963 (0.046) 32 1.000 (0.000) 0.963 (0.046)
6 May 22 1.000 (0.000) 31 0.968 (0.032) 1.033 (0.034)
7 May 11 1.000 (0.000) 27 1.000 (0.000) 1.000 (0.000)
8 May 21 1.000 (0.000) 28 0.964 (0.035) 1.037 (0.038)
9 May 13 0.923 (0.074) 27 0.963 (0.036) 0.959 (0.085)
10 May 17 0.882 (0.078) 28 1.000 (0.000) 0.882 (0.078)
11 May 11 0.909 (0.087) 28 1.000 (0.000) 0.909 (0.087)
12 May 17 0.882 (0.078) 27 0.963 (0.036) 0.916 (0.088)
13 May 5 0.800 (0.179) 28 0.964 (0.035) 0.830 (0.188)
14 May 13 1.000 (0.000) 27 0.963 (0.036) 1.038 (0.039)
15 May 12 0.833 (0.108) 28 1.000 (0.000) 0.833 (0.108)
16 May 18 0.944 (0.054) 28 0.967 (0.035) 0.976 (0.066)
17 May 7 0.857 (0.132) 25 1.000 (0.000) 0.857 (0.132)
18 May 19 0.947 (0.051) 28 1.000 (0.000) 0.947 (0.051)
19 May 6 0.833 (0.152) 24 1.000 (0.000) 0.833 (0.152)
20 May 17 0.882 (0.078) 27 0.926 (0.050) 0.953 (0.099)
21 May 16 1.010 (0.012) 28 0.964 (0.035) 1.047 (0.040)
22 May 18 0.944 (0.054) 26 1.000 (0.000) 0.944 (0.054)
23 May 14 0.857 (0.094) 26 0.962 (0.038) 0.891 (0.103)
24 May 23 0.783 (0.086) 27 0.926 (0.050) 0.845 (0.104)
25-31 May 37 0.811 (0.064) 31 1.000 (0.000) 0.811 (0.064)
Overall 361 0.919 (0.015) 646 0.976 (0.006) 0.939 (0.017)

65
Appendix Table B10. Grouping, samples sizes, and estimated juvenile bypass system
survival for juvenile steelhead passing Lower Monumental Dam,
2007. Standard errors are in parenthesis.
Treatment Reference
Relative survival Date n Survival n Survival
Overall 185 0.964 (0.014) 646 0.976 (0.006) 0.986 (0.016)
Appendix Table B11. Grouping, samples sizes, and estimated Spillbay 8 survival for
juvenile steelhead passing Lower Monumental Dam, 2007.
Standard errors are in parenthesis.
Treatment Reference
Relative survival Date n Survival n Survival
Overall 202 0.902 (0.021) 646 0.976 (0.006) 0.923 (0.022)

66
APPENDIX C: Telemetry Data Processing and Reduction
Data Collection and Storage
Data from radiotelemetry studies are stored in the Juvenile Salmon Radio
Telemetry project, an interactive database maintained by staff of the Fish Ecology
Division at the NOAA Fisheries Northwest Fisheries Science Center. This project tracks
migration routes and passage of juvenile salmon and steelhead past dams within the
Columbia and Snake Rivers using a network of radio receivers to record signals emitted
from radio transmitters (“tags”) implanted into the fish. Special emphasis is placed on
routes of passage and on survival for individual routes at hydroelectric dams on the lower
Columbia and Snake Rivers. The database includes observations of tagged fish and the
locations and configurations of radio receivers and antennas.
The majority of data supplied to the database are observations of tagged fish
recorded at the various radio receivers, which the receivers store in hexadecimal format.
The files are saved to a central computer four times daily and placed on an FTP server
automatically once per day for downloading into the database.
In addition, data in the form of daily updated tagging files were collected. These
files contain the attributes of each fish tagged, along with the channel and code of the
transmitter used and the date, time, and location of release after tagging.
Data are consolidated into blocks in a summary form that lists each fish and the
receiver on which it was detected. This summary includes the specific time of the first
and last detection and the total number of detections in each block, with individual blocks
defined as sequential detections having no more than a 5 min gap between detections.
These summarized data were used for analyses.
The processes in this database fall into three main categories or stages in the flow
of data from input to output: loading, validation, and summarization. These are
explained below and summarized in Appendix Figure C.
The loading process consists of copying data files from their initial locations to
the database server, converting the files from their original format into a format readable
by SQL, and having SQL read the files and stores the data in preliminary tables.

67
Data Validation
During the validation process, the records stored in the preliminary tables are
analyzed. We determine the study year, site identifier, antenna identifier, and tag
identifier for each record, flagging them as invalid if one or more of these identifiers
cannot be determined. Records are flagged by storing brief comments in the edit notes
field. Values of edit notes associated with each record are as follows:
Null: denotes a valid observation of a tag
Not Tagged: denotes an observation of a channel code combination that was not in use at
the time. Such values are likely due to radio frequency noise being picked up at an
antenna.
Noise Record: denotes an observation where the code is equal to 995, 997, or 999.
These are not valid records, and relate to radio frequency noise being picked up at
the antenna.
Beacon Record: hits recorded on channel = 5, code = 575, which indicate a beacon being
used to ensure proper functioning of the receivers. This combination does not
indicate the presence of a tagged fish.
Invalid Record Date: denotes an observation whose date/time is invalid (occurring before
we started the database, i.e., prior to 1 January 2004, or some time in the future).
Due to improvements in the data loading process, such records are unlikely to arise.
Invalid Site: denotes an observation attributed to an invalid (non existent) site. These are
typically caused by typographical errors in naming hex files at the receiver end.
They should not be present in the database, since they should be filtered out during
the data loading process.
Invalid Antenna: Denotes an observation attributed to an invalid (non existent) antenna.
These are most likely due to electronic noise within the receiver.
Lt start time: Assigned to records occurring prior to the time a tag was activated (its start
time). Note: these records are produced by radio frequency noise.
Gt end time: Assigned to records occurring after the end time on a tag (tags run for 10 d
once activated). Note: these records are produced by radio frequency noise.

68
In addition, duplicate records (records for which the channel, code, site, antenna,
date and time are the same as those of another record) are considered invalid. Finally, the
records are copied from the preliminary tables into the appropriate storage table based on
study year. The database can accommodate multiple years with differing sites and
antenna configurations. Once a record‟s study year has been determined, its study year,
site, and antenna are used to match it to a record in the sites table.
Generation of the Summary Tables
The summary table summarizes the first detection, last detection, and count of
detections for blocks of records within a site for a single fish where no two consecutive
records are separated by more than a specified number of minutes (currently using
5 min).
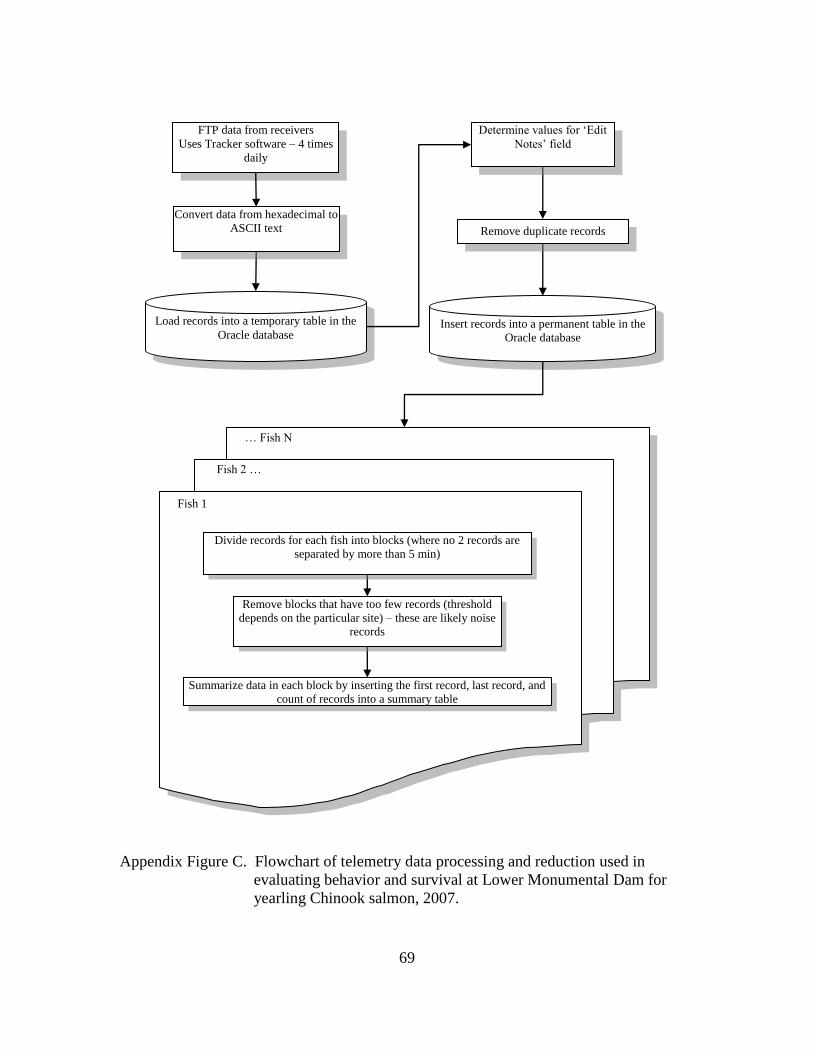
69
FTP data from receivers
Uses Tracker software – 4 times
daily
Load records into a temporary table in the
Oracle database Insert records into a permanent table in the
Oracle database
Divide records for each fish into blocks (where no 2 records are
separated by more than 5 min)
Remove blocks that have too few records (threshold
depends on the particular site) – these are likely noise
records
Summarize data in each block by inserting the first record, last record, and
count of records into a summary table
Fish 1
Fish 2 …
… Fish N
Convert data from hexadecimal to
ASCII text
Determine values for „Edit
Notes‟ field
Remove duplicate records
Appendix Figure C. Flowchart of telemetry data processing and reduction used in
evaluating behavior and survival at Lower Monumental Dam for
yearling Chinook salmon, 2007.