paso robles groundwater subbasin water banking feasibility
TRANSCRIPT

Paso Robles Groundwater Subbasin Water Banking Feasibility Study Final Report
San Luis Obispo County Flood Control And Water Conservation District
Date: April 2008 Project No: 064030


Table of Contents
Table of Contents i
Abbreviations and Acronyms vi
Executive Summary 1 Operational Scenarios 2 Alternative Locations 3 Summary of Results 5 Recommendations 6
1 Introduction 1-1 1.1 Project Background 1-1 1.2 Previous Studies and Management Efforts 1-1
1.2.1 San Luis Obispo County Integrated Regional Water Management Plan (2005) 1-2
1.2.2 Paso Robles Groundwater Basin Study (2002) 1-3 1.2.3 Paso Robles Groundwater Basin Monitoring Program Evaluation
(2003) 1-4 1.2.4 Paso Robles Groundwater Basin Study Phase II – Numerical
Model Development, Calibration, and Application (2005) 1-4 1.2.5 Paso Groundwater Basin Agreement (2005) 1-4
1.3 Project Goals 1-5 1.4 Project Approach 1-5
1.4.1 Project Meetings 1-6 1.4.2 Project Deliverables 1-7
1.5 Project Team 1-7 1.6 Report Outline 1-7
2 Project Setting 2-1 2.1 Central Coast Water Conditions 2-1 2.2 Existing Core Infrastructure 2-2
2.2.1 State Water Project 2-2 2.2.2 Nacimiento Water Project 2-3
2.3 Surface Water Supply Availability 2-3 2.3.1 SWP Water Supply Delivery Reliability 2-4 2.3.2 SWP Water Quality 2-7
2.4 Hydrogeologic Setting 2-10
i

2.4.1 Basin Definition and Boundaries 2-10 2.4.2 Groundwater Occurrence, Levels, and Movement 2-10 2.4.3 Water Quality 2-10 2.4.4 Groundwater in Storage 2-11
3 Potential Water Banking Operations 3-1 3.1 Water Banking Concepts 3-1 3.2 Groundwater Recharge Methods 3-1
3.2.1 Direct Recharge 3-2 3.2.2 Indirect Recharge 3-5
3.3 Recharge and Banking Operational Scenarios 3-6 3.3.1 Baseline Condition 3-8 3.3.2 Recharge Scenario 3-8 3.3.3 Water Banking Scenario 3-8
3.4 Affected Areas 3-9
4 Alternative Locations 4-1 4.1 Location Evaluation Criteria 4-1
4.1.1 Hydrogeologic Criteria 4-1 4.1.2 Engineering Criteria 4-3
4.2 Selected Alternatives 4-4 4.2.1 Shell Creek/Camatta Creek and Lower San Juan Creek Recharge
Areas 4-4 4.2.2 Creston Recharge Area 4-8 4.2.3 Salinas River/Highway 46 Recharge Area 4-11
5 Hydrogeologic Evaluation 5-1 5.1 Model Background Information 5-1 5.2 Evaluation Criteria 5-2 5.3 Baseline Condition 5-2 5.4 Simulation of Recharge and Water Banking Operations 5-3 5.5 Model Implementation and Results 5-5
5.5.1 Alternative 1 – Shell Creek/Camatta Creek and Lower San Juan Creek Recharge Areas 5-5
5.5.2 Alternative 2 - Creston Recharge Area 5-10 5.5.3 Alternative 3 - Salinas River/Highway 46 Recharge Area 5-14
5.6 Summary of Hydrogeologic Feasibility Analysis 5-20 5.6.1 Summary of Recharge Alternatives 5-20 5.6.2 Summary of Water Banking Alternatives 5-23 5.6.3 Findings and Recommendations 5-26
6 Engineering Evaluation and Cost Estimate 6-1 6.1 Evaluation Criteria 6-1
ii

6.2 Water Supply Availability 6-1 6.3 Facility Requirements 6-5 6.4 Project Costs Assumptions 6-5
6.4.1 Capital Project Costs Assumptions 6-6 6.4.2 Operating Costs 6-7 6.4.3 Maintenance Costs 6-7 6.4.4 Water Costs 6-8
6.5 Cost of Alternatives 6-9 6.5.1 Alternative 1a – Recharge Operations for the Shell
Creek/Camatta Creek and Lower San Juan Creek Recharge Areas 6-9
6.5.2 Alternative 1b – Water Banking Operations for the Shell Creek/Camatta Creek and Lower San Juan Creek Recharge Areas 6-10
6.5.3 Alternative 2a – Recharge Operations for Creston Recharge Area 6-11 6.5.4 Alternative 2b – Water Banking Operations for Creston
Recharge Area 6-12 6.5.5 Alternative 3a – Recharge Operations for the Salinas River/Hwy
46 Recharge Area 6-13 6.5.6 Alternative 3b – Water Banking Operations for the Salinas
River/Hwy 46 Recharge Area 6-13 6.6 Alternative Cost Comparison 6-14
6.6.1 Recharge Alternatives 6-17 6.6.2 Water Banking Alternatives 6-18
6.7 Groundwater Management Considerations 6-21 6.8 Groundwater Banking Operational Considerations 6-23
6.8.1 Groundwater Monitoring 6-23 6.8.2 Groundwater Banking Operating Agreements 6-23 6.8.3 Groundwater Banking Operational Criteria 6-23
7 Environmental and Permitting Considerations 7-1 7.1 Key Environmental Issues 7-1
7.1.1 Agricultural Resources 7-1 7.1.2 Biological Resources 7-2 7.1.3 Cultural and Archeological Resources 7-7 7.1.4 Land Use 7-10 7.1.5 Growth-Inducing Effects 7-11
7.2 Permitting Requirements 7-11 7.2.1 Federal Agencies 7-11 7.2.2 State Agencies 7-13 7.2.3 Local Agencies 7-15
7.3 Summary of CEQA/NEPA Approaches 7-16 7.3.1 Approaches to Implement CEQA and/or NEPA 7-17
iii

8 Conclusions and Recommendations 8-1 8.1 Conclusions 8-2
8.1.1 Alternative 1 - Shell Creek/Camatta Creek and Lower San Juan Creek Recharge Areas 8-2
8.1.2 Alternative 2 - Creston Recharge Area 8-3 8.1.3 Alternative 3 - Salinas River/Hwy 46 Recharge Area 8-4
8.2 Recommendations 8-5
9 References 9-1
Table of Figures
Figure ES-1 Project Operations for Recharge and Water Banking Operations ES-3 Figure 1-1 Paso Robles Groundwater Basin 1-2 Figure 3-1 Project Operations 3-7 Figure 4-1 Selected Recharge Alternatives in Paso Robles Groundwater Basin 4-5 Figure 4-2 Alternative 1 – Shell Creek/Camatta Creek and Lower San Juan Creek
Recharge Areas 4-6 Figure 4-3 Alternative 2 – Creston Recharge Area 4-9 Figure 4-4 Alternative 3 – Salinas River/Hwy 46 Recharge Area 4-12 Figure 5-1 Modeling Results for Alternative 1A 5-6 Figure 5-2 Modeling Results for Alternative 1B 5-9 Figure 5-3 Modeling Results for Alternative 2A 5-11 Figure 5-4 Modeling Results for Alternative 2B 5-13 Figure 5-5 Modeling Results for Alternative 3A 5-16 Figure 5-6 Modeling Results for Alternative 3A, Layer 1 5-17 Figure 5-7 Modeling Results for Alternative 3B 5-19 Figure 5-8 Cumulative Change in Groundwater Storage 5-20 Figure 5-9 Cumulative Change in Stream Outflow 5-22 Figure 5-10 Cumulative Change in Groundwater Storage 5-25 Figure 5-11 Cumulative Change in Stream Outflow 5-25 Figure 6-1 Distribution of Costs for Recharge and Water Banking Alternatives 6-17 Figure 6-2 Comparison of Water Costs of Alternatives 6-20
iv

List of Tables
Table ES-1 Comparison of Recharge Alternatives 6 Table ES-2 Comparison of Water Banking Alternatives 6 Table 2-1 2004 Mean Water Quality 2-9 Table 5-1 Summary of Groundwater Model Input Data 5-4 Table 5-2 Summary of Groundwater Modeling Results at End of Simulation Period 5-7 Table 6-1 Disposition of Project Water for Recharge and Water Banking
Alternatives 6-3 Table 6-2 40-Year Project Cost Estimate for Alternative 1a 6-9 Table 6-3 40-Year Project Cost Estimate for Alternative 1b 6-10 Table 6-4 40-Year Project Cost Estimate for Alternative 2a 6-11 Table 6-5 40-Year Project Cost Estimate for Alternative 2b 6-12 Table 6-6 40-Year Project Cost Estimate for Alternative 3a 6-13 Table 6-7 40-Year Project Cost Estimate for Alternative 3b 6-14 Table 6-9 Comparison of Recharge Alternatives 6-18 Table 6-10 Comparison of Water Banking Alternatives 6-21 Table 6-11 Regional GMP Components 6-22 Table 7-1 Potential Permits and Approvals 7-12 Table 7-2 Environmental Constraints 7-16
v

Abbreviations and Acronyms
BMO Basin Management Objective
CAB Creston Advisory Body
CCWA Central Coast Water Authority
CDFG California Department of Fish and Game
CEQA California Environmental Quality Act
CESA California Endangered Species Act
CNPS California Native Plant Society
County San Luis Obispo County
CSD Community Services District
CVP Central Valley Project
District San Luis Obispo County Flood Control and Water Conservation District
DWR California Department of Water Resources
EA Environmental Assessment
ec electrical conductivity
EIR Environmental Impact Report
EIS Environmental Impact Statement
ENR Engineering News Record
ESA Endangered Species Act (federal)
Feasibility Study Paso Robles Groundwater Basin Water Banking Feasibility Study
vi

GBSC Groundwater Banking Subcommittee
GMP groundwater management plan
gpm gallons per minute
HDD horizontal directional drilling
IFI Important Farmlands Inventory
IS Initial Study
M&I municipal and industrial
maf million acre-feet
mgd million gallons per day
MND mitigated negative declaration
MOU memorandum of understanding
NEPA National Environmental Policy Act
NOAA Fisheries National Oceanic Atmospheric Administration, National Marine Fisheries Service
NPDES National Pollution Discharge Elimination System
NWP nationwide permits
O&M operations and maintenance
PETM Preliminary Engineering Technical Memorandum
PPWTP Polonio Pass Water Treatment Plant
PRIOR Paso Robles Imperiled Overlying Rights
Reliability Report The State Water Project Delivery Reliability Report 2005
RWQCB Regional Water Quality Control Board
SAA Lake or Streambed Alteration Agreement
vii

viii
SE state endangered species
SLOAPCD San Luis Obispo Air Pollution Control District
ST state threatened species
SWP State Water Project
TDS total dissolved solids
TM Technical Memorandum
USACE United States Army Corps of Engineers
USBR United States Bureau of Reclamation
USFWS United States Fish and Wildlife Service
WRAC Water Resources Advisory Committee

Executive Summary
The San Luis Obispo County Integrated Regional Water Management Plan (IRWM Plan) identified numerous opportunities that could improve the water supply reliability of San Luis Obispo County. One of the opportunities identified for investigation was banking water in the Paso Robles Groundwater Basin (Basin). This was considered a high-priority project by the County with much potential because the Basin is the largest in the County and the Coastal Branch of the State Water Project (SWP) enters the County adjacent to the Basin. These two features, along with the County’s unused allocation of SWP water, led local water leaders to want to explore the feasibility of banking water in the Basin for the benefit of County residents. The potential benefits of a water bank may include:
Improving local groundwater conditions within the Basin.
Increasing dry-year water supply reliability for local water users and possibly the residents of the County and the Central Coast.
Improving local groundwater quality in the Basin.
Providing greater flexibility of water resources management in the County and the Central Coast.
Reducing the County’s dependence on imported water supplies in below-normal years.
The Paso Robles Groundwater Basin Water Banking Feasibility Study (Feasibility Study) was led by the County Flood Control and Water Conservation District (District) in coordination with the Groundwater Banking Subcommittee (GBSC) of the Water Resources Advisory Committee (WRAC). Additional stakeholders invited to participate include the North County Water Forum, the Shandon Advisory Committee, the Creston Advisory Body (CAB), and State Water Subcontractors.
Two potential groundwater banking concept alternatives for northern San Luis Obispo County were presented to the WRAC in 2005 and included a treated water banking concept and a raw water banking concept. The raw water banking concept investigated in this feasibility study would require constructing a new pipeline to convey raw water from the Polonio Pass Water Treatment Plant (PPWTP) (prior to treatment) to a banking location in the Basin for recharge. When SWP supplies exist in excess of current
ES-1

demand, water could be stored. When SWP water is not available, the previously stored water could be recovered and conveyed back to PPWTP using the same pipeline and on to potential banking partners.
Operational Scenarios
Two operational scenarios that bookend the range of groundwater recharge and water banking opportunities were considered for comparison to the Baseline Condition (no groundwater recharge or recovery). These scenarios include the following:
Recharge Scenario (groundwater recharge only).
Water Banking Scenario (groundwater recharge and recovery).
For purposes of this Feasibility Study, the recharge and recovery capacity was assumed to be 1,500 acre-feet per month (18,000 acre-feet per year). This value represents a potential water supply from the SWP that may be available to the region in many years through a combination of sources, and is considered to be an appropriate magnitude to test the Basin’s response to water recharge and banking operations. An existing groundwater model of the Basin was used to analyze the hydrogeologic feasibility of the alternatives. The model includes a 17-year simulation period representing the 1981 to 1997 hydrologic period that is divided into 34 six-month stress periods to represent the alternative growing and non-growing seasons. Figure ES-1 compares the operational scenarios to the Baseline Condition.
ES-2

Figure ES-1 Project Operations for Recharge and Water Banking Operations
0
25,000
50,000
75,000
100,000
125,000
150,000
175,000
1 2 3 4 5 6 7 8 9 10 11 12 13 14 15 16 17 18 19 20 21 22 23 24 25 26 27 28 29 30 31 32 33 34
Stress Period
Volu
me
(acr
e-fe
et)
Recharge Scenario @ 1,500 af/m Delivery Capacity
Water Banking Scenario @ 1,500 af/m Delivery Capacity
Baseline Condition
No Activity
Recharge Scenario(Recharge Only)
Water Banking Scenario (Recharge and Recovery)
Baseline Condition(No Recharge or Recovery)
Alternative Locations
An initial screening of the groundwater subareas within the Basin was completed using available hydrogeologic information to identify potential project locations for further consideration. Each of the alternative locations that passed the initial screening was further evaluated based on its ability to:
Recharge the aquifer system.
Recover the stored water.
Deliver the stored water to PPWTP.
As a result of the additional review and discussion with the GBSC, the following three alternative locations were identified for additional feasibility analysis:
Alternative 1 - Shell Creek/Camatta Creek and Lower San Juan Creek Recharge Areas.
Alternative 2 - Creston Recharge Area.
ES-3

Alternative 3 - Salinas River/Hwy 46 Recharge Area.
Alternative 1 - Shell Creek/Camatta Creek and Lower San Juan Creek Recharge Areas - This alternative location allows for analysis of recharge and water banking opportunities in the San Juan Subarea. This area is subject to significant seasonal fluctuations and water levels in the area appear to have decreased beginning in 2003. The hydrogeologic setting suggests that the area may be suitable to recharge/banking operations. This alternative is the closest to the PPWTP, and therefore has the smallest additional conveyance infrastructure requirement of the three alternative locations. A combination of direct and in-lieu recharge operations were analyzed to disperse the recharge water activities over a large area. Wells in this area typically produce 1,000 to 2,000 gallons per minute. With this capacity, it was estimated that eight wells would be needed to meet the 1,500 acre-foot per month recovery requirements of the water banking scenario.
Based on the modeling analysis, Alternative 1 appears to have adequate groundwater storage capacity and recharge and recovery capacity to support a recharge or water banking project. There are concerns about the potential impacts to the groundwater system during both recharge and recovery operations, which need further investigation to address.
Alternative 2 - Creston Recharge Area - The Creston Recharge Area alternative provides for the analysis of recharge and water banking opportunities in the Creston Subarea. This area is currently not experiencing groundwater level declines. A combination of direct recharge operations and a small in-lieu component was analyzed for this alternative. Wells in this area typically produce 300 to 400 gallons per minute. With this capacity, it was estimated that 32 wells would be needed to meet the 1,500 acre-foot per month recovery requirements of the water banking scenario.
Based on the modeling analysis, Alternative 2 does not appear to have adequate groundwater storage capacity and recharge and recovery capacity to support a water banking project of the scale evaluated in this feasibility study. The results show that the limited storage capacity causes a significant portion of the recharged water to enter the surface water system and leave the area, thereby becoming unrecoverable by either local groundwater users or a recovery well field. As a result of the limited groundwater storage capacity and less-favorable aquifer conditions, much of the recovered groundwater is native, not stored, which results in a significant drop in groundwater elevations during recovery operations.
Alternative 3 - Salinas River/Hwy 46 Recharge Area - The Salinas River/Hwy 46 Recharge Area allows for the analysis of recharge and water banking opportunities in the
ES-4

Estrella Subarea adjacent to the Salinas River and in the areas currently experiencing groundwater declines northeast of the City of Paso Robles. A combination of in-lieu recharge operations northeast of Paso Robles and direct recharge operations near the Salinas River south of Paso Robles was used to disperse the recharge water activities over a large area and evaluate the impacts of recharge activities in these two different areas.
This alternative is the furthest from the PPWTP, and therefore has the longest additional conveyance infrastructure requirement of the three alternative locations. Wells in this area typically produce up to 1,000 gallons per minute. With this capacity, it was estimated that 15 wells would be needed to meet the 1,500 acre-foot per month recovery requirements of the water banking scenario.
Based on the modeling analysis, Alternative 3 appears to have adequate groundwater storage capacity and recharge and recovery capacity to support a recharge or water banking project. The in-lieu recharge component along Highway 46 west of Whitley Gardens appears to provide considerable recharge potential.
The direct recharge and recovery operations along the Salinas River may prove problematic because the interconnectivity of the alluvial deposits with the river may reduce the ability to recover the recharged water. This area is also relied upon by existing municipal groundwater users that may be impacted by groundwater recovery operations. There may also be environmental impacts to the Salinas River from this Alternative.
Recharge opportunities that warrant further investigation may exist along the Highway 46 corridor to take advantage of in-lieu recharge opportunities and the available storage capacity resulting from the groundwater depression located northeast of the City of Paso Robles.
Summary of Results Recharge Alternatives - The total estimated cost of the recharge alternatives ranges from $282 million to $289 million, which corresponds to about $600 to $620 per acre-foot delivered to the recharge areas. Table ES-1 shows the relative effectiveness of each of the recharge alternatives and their cost. Alternative 1a appears to be the most viable of the recharge alternatives based upon the percent of recharged water remaining in storage, and cost. Alternative 2a is the least favorable due in large part to the hydrogeologic conditions which result in reduced effectiveness for recharge operations. Alternative 3a is considered less favorable because of the higher cost and the potential environmental and hydrologic (losses) impacts to the Salinas River.
ES-5

Table ES-1 Comparison of Recharge Alternatives
Change in Groundwater Storage as Percent of Recharged Water
Rank Cost ($/acre-foot) Rank
Alt 1a 81% 1 $600 1
Alt 2a 29% 3 $600 1
Alt 3a 48% 2 $620 1
Banking Alternatives - The total estimated cost of the banking alternatives ranges from $357 million to $415 million, which corresponds to about $760 to $890 per acre-foot delivered to the recharge areas. Table ES-2 shows the relative effectiveness of each of the water banking alternatives and their cost. Alternative 1b appears to be the most viable of the recharge alternatives based upon the percent of recharged water remaining in storage, and it is the least costly. Alternative 2b is the least favorable due in large part to the impacts to the local groundwater system during recovery of the stored water. Alternative 3b is considered less favorable because of the high cost and the potential environmental and hydrologic impacts to the Salinas River, and the impacts to nearby municipal wells during recovery.
Table ES-2 Comparison of Water Banking Alternatives
Change in Groundwater Storage as Percent of Recharged Water
Rank Cost ($/acre-foot) Rank
Alt 1b 35% 1 $760 1
Alt 2b 0% 2 $810 2
Alt 3b 31% 1 $890 3
Recommendations The following recommendations are suggested to further the understanding and management of the Paso Robles Groundwater Basin and refine potential recharge/water banking opportunities.
Groundwater Management Recommendations - Recommendations for improved groundwater management include:
Preparing a groundwater management plan to provide a framework for managing the Basin and establishing basin management objectives (BMOs).
ES-6

Preparing and implementing a groundwater monitoring plan in the Basin to track changes in groundwater levels and quality.
Installing dedicated monitoring wells as needed to fill data gaps.
Groundwater Banking Recommendations - If the County continues to pursue groundwater recharge or water banking opportunities in the Paso Robles Groundwater Basin, the emphasis should focus on the most viable sites, which include the following:
Recharge and water banking opportunities in the Shell Creek/Camatta Creek and Lower San Juan Creek Recharge Areas (Alternative 1).
In-lieu recharge opportunities along the Highway 46 corridor (part of Alternative 3). This alternative may need to be reformulated to expand the in-lieu recharge opportunities, and reduce the direct recharge element along the Salinas River.
The following activities may be considered for these sites:
Preparing a preliminary engineering evaluation.
Conducting additional hydrogeologic field investigations in potential direct recharge areas to further define the aquifer system and hydrogeologic characteristics.
Conducting pilot recharge tests in potential recharge areas.
Conducting a survey of landowners in potential in-lieu recharge areas to determine their interest and willingness to participate in an agricultural in-lieu recharge program.
Completing a salt balance to estimate the impacts of salt loading resulting from the imported water.
Refining potential project operations to more accurately reflect annual and seasonal water supply availability and demand. This may include identifying specific banking partners that may store water in the basin or use banked water.
Refining the existing groundwater model to provide a more detailed analysis of the potential recharge and water banking operations.
Updating capital and operation and maintenance (O&M) cost estimates based upon refined project descriptions and analyses.
ES-7

ES-8
Exploring the opportunities of delivering banked water directly to the Coastal Branch at locations other than PPWTP to reduce O&M and treatment costs.
Conducting additional analysis of the impacts of potential project operations on existing overlying land uses to identify potential impacts from high groundwater levels.
1 Introduction
The Paso Robles Groundwater Basin (Basin) located in northern San Luis Obispo County (County) is one of the largest groundwater basins in the County (Figure 1-1). The Coastal Branch of the California State Water Project (SWP) enters the County and the central coast just east of the Basin near the town of Shandon and continues southwest across the Basin. These two features along with the County’s unused allocation of SWP water led local water leaders to want to explore the feasibility of banking water in the Basin for the benefit of County residents. The potential benefits of a banking program to County residents are outlined in Section 1.3.
1.1 Project Background The Paso Robles Groundwater Basin Water Banking Feasibility Study (Feasibility Study) for the Paso Robles Groundwater Basin is being led by the County Flood Control and Water Conservation District (District) in coordination with the Groundwater Banking Subcommittee (GBSC) of the Water Resources Advisory Committee (WRAC). Additional stakeholders invited to participate include the North County Water Forum, the Shandon Advisory Committee, the Creston Advisory Body (CAB), and County State Water Subcontractors.
The San Luis Obispo County Integrated Regional Water Management Plan (IRWM Plan) identified the feasibility study of the groundwater banking potential of the Basin as a high-priority planning effort. Funding for this study, as well as several other planning efforts identified in the County IRWM Plan, was provided in part by a Proposition 50 Chapter 8 Integrated Regional Water Management Program Fiscal Year 2005-2006 Planning Grant.
1.2 Previous Studies and Management Efforts Over the last several years, a number of studies and basin management activities were completed that will be used to provide information and guidance for the Feasibility Study. Some of these studies are briefly summarized below.
1-1

Figure 1-1 Paso Robles Groundwater Basin
1-2
1.2.1 San Luis Obispo County Integrated Regional Water Management Plan (2005)
The District, in cooperation with the WRAC, prepared the region’s IRWM Plan to align planning and management efforts toward achieving sustainable water resources County-wide with the State of California’s (State) planning efforts through 2030. The IRWM Plan was used to support the County’s planning and implementation of grant applications. The IRWM Plan integrates 19 different water management strategies that have, or will have, a role in protecting and/or enhancing the region’s water supply reliability, water quality, ecosystems, groundwater, and flood management, historically or in the future. The integration of these strategies resulted in a list of action items (projects, programs, and studies) needed to implement the IRWM Plan. District staff and the WRAC Integrated Regional Water Management Subcommittee prioritized the action items. The IRWM Plan was adopted in December 2005 and updated in July 2007.
The IRWM Plan identified planning efforts to fill data gaps in four areas, the completion of which would support the overall plan goals, objectives, and strategies, and improve the IRWM Plan itself. These projects include the following:
Groundwater Banking Plan (this project)
Regional Permitting Plan
Data Enhancement Plan
Flood Management Plan
These planning projects were included in the Proposition 50 Chapter 8 Integrated Regional Water Management Program Fiscal Year 2005-2006 Planning Grant application, which is funding this Feasibility Study.
1.2.2 Paso Robles Groundwater Basin Study (2002)
In 2002, Fugro West and Cleath and Associates prepared the Paso Robles Groundwater Basin Study (Basin Study), which investigated the hydrogeologic conditions and quantified the water supply capability of the Basin by defining the lateral and vertical extent of the aquifer, groundwater flow and movement, current water quality conditions, and perennial yield.
1-3

1.2.3 Paso Robles Groundwater Basin Monitoring Program Evaluation (2003)
The County has been monitoring groundwater levels for more than 40 years in the Basin. The Monitoring Program Evaluation was completed in 2003 by Cleath and Associates to evaluate the efficiency and effectiveness of the County’s Monitoring Program for wells located in the Basin. Based on the final report of the 154 wells in the program, County Public Works employees monitor 99 wells, and 55 wells were monitored by local municipal water company employees (who forward the data to the County’s Public Works Department for inclusion in the monitoring program database). The report provides several recommendations for improving the monitoring program.
1.2.4 Paso Robles Groundwater Basin Study Phase II – Numerical Model Development, Calibration, and Application (2005)
In 2005, Fugro West and ETIC Engineering developed a numerical groundwater flow model as a quantitative tool to evaluate future hydraulic conditions of the Basin. Using the model, the study evaluated the Basin’s response to current and future water demands with and without supplemental water and identified areas of declining water levels.
1.2.5 Paso Groundwater Basin Agreement (2005)
The Agreement was entered into on August 19, 2005, by the District, selected landowners who have organized as the Paso Robles Imperiled Overlying Rights (PRIOR) group, and the City of Paso Robles and the County Service Area No. 16 (collectively referred to as Municipal Users) to avoid potential litigation regarding groundwater conditions. The Agreement requires the public agencies to declare the Basin to be in a state of overdraft, when appropriate, allowing overlying landowners sufficient time to react to such a declaration. In the Agreement, the District serves as the technical advisor to both the landowners and Municipal Users.
The Agreement recognizes the need for monitoring and appropriate management of the existing Basin supplies and also recognizes that bringing additional water resources to the Basin could delay or prevent entirely the Basin becoming overdrafted in the future. The Agreement also recognizes signatories’ desire to preserve their respective groundwater rights, notwithstanding implementation of any management measures, thereby providing the framework for cooperation among the landowners and Municipal Users to develop a groundwater management plan.
1-4

1.3 Project Goals The goal of the Feasibility Study is to determine the feasibility and magnitude of potential water recharge and banking opportunities in the Basin. If feasible water banking opportunities are identified in this Feasibility Study, they can be compared to other water management options identified by the District to improve the long-term water supply reliability for the residents of the County and the Central Coast. Potential benefits of a water bank may include:
Improving local groundwater conditions within the Basin.
Increasing dry-year water supply reliability for local water users and possibly the residents of the County and the Central Coast.
Improving local groundwater quality in the Basin.
Providing greater flexibility of water resources management in the County and the Central Coast.
Reducing the County’s dependence on imported water supplies in below-normal years.
1.4 Project Approach Potential water recharge and banking opportunities within the Basin were evaluated based upon several different feasibility components that contribute to the overall feasibility, including:
The availability of a water supply for recharge and banking.
The ability to recharge the aquifer system.
The ability to recover the banked water.
The ability to deliver the banked water to the end user.
The water banking feasibility factors will be evaluated to address the hydrogeologic considerations, engineering considerations, and other considerations (such as environmental issues and overall groundwater management) to determine the overall feasibility and magnitude of individual water banking opportunities.
Hydrogeologic Considerations focus on the effects of local geologic and hydrogeologic conditions on the feasibility of banking water at selected locations
1-5

within the Basin. The local hydrogeologic conditions also determine the size of potential water banking opportunities.
Engineering Considerations focus on the technical requirements, including water supply availability, infrastructure requirements, project operations, and the project costs associated with constructing and operating a water bank in the Basin.
Other Considerations focus on environmental issues and the overall approach to groundwater management, which may include institutional issues, legal issues, and governance issues associated with groundwater management, including water banking operations.
1.4.1 Project Meetings
The project was completed on an accelerated schedule to meet the grant funding project schedule. A subcommittee of the WRAC was established during the previous Basin Study to facilitate stakeholder involvement. The GBSC served in a similar capacity during this study. A series of presentations to the stakeholders were used to inform the GBSC and interested parties about the project’s progress and elicit feedback. A total of five presentations were made to the GBSC/WRAC, as listed below:
GBSC Meeting No. 1 – October 4, 2006 - Introduction and Project Goals
GBSC Meeting No. 2 – January 4, 2007 – Alternatives Development and Project Screening
GBSC Meeting No. 3 – March 1, 2007 – Water Banking Project Refinement
GBSC Meeting No. 4 – May 3, 2007 – Hydrogeologic Reconnaissance and Alternative Selection
GBSC Meeting No. 5 – September 6, 2007 – Hydrogeologic Feasibility Analysis
Presentations were also given at key project milestones directly to the WRAC, Shandon Advisory Council, and CAB to maximize feedback – November 7, 2007 – Engineering Analysis and Draft Report.
Presentations to the GBSC are available on the County water resources website under the IRWM Quicklink at: www.slocountywater.org.
1-6

1.4.2 Project Deliverables
The following documents were prepared during the completion of this project and presented to the GBSC to document the progress and refine project assumptions on water banking alternatives and project operations.
Preliminary Engineering Technical Memorandum (PETM). The PETM presented basic information on groundwater recharge and conjunctive use project formulation that was used to develop and evaluate potential water banking opportunities in the Basin.
Description of Water Banking Alternatives (Alternatives TM). The Alternatives TM was distributed and presented at the June 6, 2007 WRAC meeting (separate from the GBSC meeting list above). The Alternatives TM described the alternatives and operational scenarios that were being considered for evaluation. The alternatives and operational scenarios were refined based on input received on the Alternatives TM and responses from the June WRAC meeting.
Hydrogeologic Feasibility Progress Report (Progress Report). The Progress Report summarized the information and approach used to develop the water banking alternatives, and presented the results of the groundwater modeling conducted to determine the hydrogeologic feasibility of developing a water bank within the Basin.
1.5 Project Team This work was completed by the project team, which was led by GEI Consultants, Inc., with hydrogeologic support by Fugro West and Cleath and Associates, and environmental support by Rincon Associates.
1.6 Report Outline The report is organized into the following sections:
Section 1, Introduction, provides project background information, identifies previous studies, summarizes the project goals, and outlines the project approach.
Section 2, Project Setting, provides some general background information on local agencies, the existing core infrastructure that may be used in a project, the surface water supply availability for water banking operations, and includes a brief summary of the hydrogeologic setting in the Basin.
1-7

1-8
Section 3, Potential Water Banking Operations, summarizes the water banking concepts considered by the WRAC and describes potential water banking operations.
Section 4, Water Banking Alternatives, describes the process used to identify and select the alternatives for analysis, and describes the selected alternatives.
Section 5, Hydrogeologic Evaluation, provides some background information on the groundwater model used to evaluate the hydrogeologic feasibility of the alternatives and presents the results of the modeling analysis.
Section 6, Engineering Evaluation and Cost Estimate, identifies the facility requirements for each of the alternatives and associated capital and operations and maintenance (O&M) costs. This section also identifies issues associated with groundwater management and operation of potential projects.
Section 7, Environmental and Permitting Considerations, identifies the environmental and permitting issues that may need to be addressed to develop a project.
Section 8, Conclusions and Recommendations, summarizes the project results and provides recommendations to further evaluate water banking opportunities.
Section 9, References, provides a list of the references used to complete the project.

2 Project Setting
The purpose of this section is to describe the project setting for water banking opportunities in the Paso Robles Groundwater Subbasin. This includes:
Describing the water issues of the Central Coast of California.
Identifying the existing core infrastructure that may be utilized to implement the project.
Identifying the available water supply to support the project operations.
Describing the hydrogeologic setting of the Basin.
Identifying the agencies or groups that may be involved in or affected by project implementation or operations.
2.1 Central Coast Water Conditions Anticipating the eventual need for supplemental water supplies on the Central Coast, the District, and Santa Barbara County Flood Control and Water Conservation District (Santa Barbara County) entered into water supply contracts with the State of California in 1963. Under these contracts, water would be delivered to these Central Coast agencies through the Coastal Branch of the SWP.
Phase I of the Coastal Branch was completed in 1968 and included a 15-mile aqueduct branching off of the California Aqueduct in northwestern Kern County. San Luis Obispo and Santa Barbara Counties postponed construction of the remaining portion of the Coastal Branch until 1991. The postponement in construction was permitted under the Counties’ contract with the State. Even though the Coastal Branch had not been constructed, San Luis Obispo and Santa Barbara Counties were obligated to make payments under their State contracts for those facilities (such as Oroville Dam and the California Aqueduct) that would eventually convey SWP water to the Central Coast.
The Central Coast Water Authority (CCWA) was formed in 1992 to facilitate the development and operation of the Coastal Branch in San Luis Obispo and Santa Barbara Counties. In San Luis Obispo County, the District has maintained its contractual relationship with the State. It has signed agreements with CCWA to treat its SWP water and to operate and maintain the pipeline and facilities in the County.
2-1

2.2 Existing Core Infrastructure
2.2.1 State Water Project
Since 1963, the California Department of Water Resources (DWR) has constructed most of the SWP elements to convey water from northern California to urban and agricultural users throughout the state. The SWP delivers water under long-term contracts to 29 public water agencies, providing water for about two-thirds of the state’s population and to irrigate, in part, 700,000 acres of agriculture.
The SWP supplies originate at Lake Oroville on the Feather River. Flows released from Lake Oroville reach the Sacramento-San Joaquin Delta, where much of the water is pumped into the California Aqueduct for delivery to water users to the south. The SWP includes 32 water storage facilities, more than 600 miles of aqueducts, more than 20 pumping plants, and several hydroelectric plants.
The State of California designed, engineered, and constructed these facilities, and operates and maintains them with funds received from its 29 contractors. The payments from the 29 contractors allow the State to fully recover all its costs to finance, design, and build the SWP under “take or pay” contracts.
2.2.1.1 Coastal Branch Phase I
Coastal Branch Phase I branches off the California Aqueduct in southern Kings County near Kettleman City and extends into northern Kern County in the vicinity of Devils Den. Berrenda Mesa Water District and Castaic Lake Water Agency receive water through the Phase I facilities. The two pumping plants within the Phase I reach are the Las Perillas and Badger Hill Pumping Plants.
2.2.1.2 Polonio Pass Water Treatment Plant
The section of the Coastal Branch from Devils Den Pumping Plant to Polonio Pass Water Treatment Plant (PPWTP) was constructed as part of Phase II. This section of the Coastal Branch Pipeline has an estimated capacity of 74,125 acre-feet over the course of 11 months per year.
The PPWTP has an existing capacity rating of 48 million gallons per day (mgd) for 11 months, equaling 49,286 acre-feet per year. Current demands for treated water on the Coastal Branch total about 44,000 acre-feet per year (4,830 acre-feet per year for San Luis Obispo County and 39,078 acre-feet per year for Santa Barbara County). Based upon these capacity estimates, the Coastal Branch between Devils Den and PPWTP has about 25,000 acre-feet more capacity than the current treatment capacity of the PPWTP.
2-2

2.2.1.3 Coastal Branch Phase II
Phase II is a 101-mile buried pipeline extending from Devils Den (Phase I) to Vandenberg Air Force Base. To serve the other cities of southern Santa Barbara, CCWA built a 42-mile extension terminating at Lake Cachuma for a total length of 143 miles. The pipe diameter starts at 57 inches at Devils Den, reduces to 42 inches south of the City of Arroyo Grande, and reduces further to between 30 and 39 inches south of Vandenberg Air Force Base. Two turnouts are located in the County, Chorro Valley Pipeline and the Lopez Turnout. The Coastal Branch has a treated capacity of about 48,600 acre-feet per year—45,486 acre-feet per year contracted capacity for CCWA and 4,830 acre-feet per year contracted capacity for the District.
2.2.2 Nacimiento Water Project
The Nacimiento Water Project is one of the high-priority projects for the County and is currently in the construction phase. The project consists of a pipeline, storage tanks, pump stations, and appurtenant facilities to convey water from Lake Nacimiento south to the communities of Paso Robles, Templeton, Atascadero, and San Luis Obispo, with options for future extensions. Since only about 60 percent of the supply is committed to the contracting parties, its capacity will meet additional supply reliability needs far into the future. In the meanwhile, groundwater banking opportunities and other conjunctive use possibilities can be researched and evaluated. These may include water recharge, banking, and conjunctive use opportunities along the western side of the Basin.
2.3 Surface Water Supply Availability Historically, California water users have relied on multiple sources of water supply in order to meet changing and increasing water demands. Typically, local water providers mix and match their supply sources to maximize water supply and quality and to minimize costs to meet both current and long-term water supply requirements. In addition to groundwater supplies, the County relies on surface supplies from local sources as well as imported supplies. Two water supplies to the County include the Nacimiento Water Project (under development) and the SWP.
2-3

2.3.1 SWP Water Supply Delivery Reliability
The projected future water delivery for the SWP is presented in the recent DWR report, The State Water Project Delivery Reliability Report 2005 (Reliability Report). The Reliability Report provides information to local water agencies to help them determine how they should integrate the SWP water supply into their water supply equation.
The Reliability Report describes water delivery reliability as how much one can count on a certain amount of water being delivered to a specific place at a specific time. This description addresses such things as facilities, system operations, water demand, and weather projections. In addition, water delivery reliability is based in part upon an acceptable or desirable level of dependability that is usually determined by the local water agency in coordination with the public it serves. In total, this information is used to determine the level of service and reliability, which, in turn, identifies the need for additional water supply sources, new facilities, demand management, and conservation programs.
One of the assumptions included in the Reliability Report is that past rainfall-runoff patterns will be repeated in the future. It is recognized that this assumption has some inherent uncertainty, especially given the evolving information about the effects of global climate change. It has been documented that since the 1950s the percentage of total annual runoff that occurs during the April to July period has declined progressively, which reflects earlier snowmelt and warmer temperatures. These impacts to the Sierra snowpack result in a decline in the amount of water in the Sierra snowpack, which in turn leads to reduced spring and early summer river flows. These changes in the runoff patterns may make it more difficult to refill reservoir flood control space during the late spring and early summer, potentially reducing the amount of surface water available during the dry season.
2.3.1.1 Water Delivery Reliability Factors
The actual water supply available from the SWP or other imported sources depends on several factors, including the following:
Availability of water from the source – The water source availability depends on the amount and timing of precipitation and runoff.
Availability of means of conveyance – The ability to convey water from the source depends on the existence and physical capacity of the diversion, storage, and conveyance facilities, and on the contractual, statutory, and regulatory limitations on the facilities’ operations.
2-4

The level and pattern of water demand – The level of water demand is affected by the magnitude and types of water demands, level of conservation strategies, local weather patterns, water costs, and other factors.
2.3.1.2 SWP Level of Demand
The SWP was built with a capacity to deliver about 4.2 million acre-feet (maf) of water. Recent annual deliveries to the 29 contractors have averaged about 2.3 maf and peaked at 3.5 maf in 2000, so the SWP has available physical capacity to make additional deliveries, assuming the water supply is also available at the same time. The following section describes SWP supplies that may be available for banking opportunities in the Basin.
Table A – An individual contractor’s portion of its SWP annual allocation is presented on Table A of their contract. Table A contract amounts are not a guarantee of the available supply to the contractor each year, but rather a tool in an allocation process that defines an individual contractor’s share.
Article 21 – Article 21 refers to water supply contracts that allow additional water to be delivered to contractors under certain conditions, including the following:
It is available only when it does not interfere with Table A allocations and SWP operations.
It is available only when excess water is available in the Delta.
It is available only when conveyance capacity is not being used for SWP purposes or scheduled SWP deliveries.
It cannot be stored within the SWP system; i.e., the contractors must be able to use the Article 21 water directly or store it in their own system.
In order to acquire Article 21 water, SWP contractors must be able to use the water directly or store it in their own system. Article 21 water can be stored directly in a reservoir or by offsetting other water that would have been withdrawn from storage, such as local groundwater. The Reliability Report states that,
“In the absence of storage, Article 21 water is not likely to contribute significantly to local water supply reliability. Incorporating supplies received under Article 21 into the assessment of water supply reliability is a local decision based on specific local circumstances, facts and level of water supply reliability required.”
2-5

Article 21 water represents a SWP water supply source that may be available in some years to SWP contractors.
2.3.1.3 Water Supply Availability for Water Banking
The Reliability Report presents DWR’s current information regarding the annual water delivery reliability of the SWP for existing and future levels of development in the water source areas, assuming historical patterns of precipitation.
The water supply availability for this feasibility study is based in part upon the CalSim II model studies used in the Reliability Report and the District’s Table A allocation. CalSim II is a planning model developed by the DWR and United States Bureau of Reclamation (USBR) to simulate the SWP and Central Valley Project (CVP) and areas tributary to the Sacramento-San Joaquin Delta. It uses historic rainfall and runoff data, which have been adjusted for changes to land and water use conditions that have occurred or may occur in the future, to simulate water resources operations in the Sacramento and San Joaquin River Basins on a month-to-month basis. The month-to-month simulations are based on the 73-year period (1922-1994) of the adjusted historical rainfall/runoff data. This assumption is based on the assumption that the next 73 years will have the same rainfall/snowmelt amount and pattern, within-year and from year to year, as the 1922 to 1994 period. The availability is based upon past rainfall-runoff observations. Future availability may differ from the past due to a variety of reasons, which may include global climate change, the state of the Sacramento-San Joaquin River Delta system, and environmental challenges to SWP operations.
Table A Allocation – The Table A annual allocation for the District totals 25,000 acre-feet at an instantaneous rate of delivery of 35 cfs. This corresponds to a monthly delivery rate of 2,083 acre-feet. The County currently utilizes 4,830 acre-feet per year of the Table A annual allocation, which is delivered to 11 urban water users in the County, leaving the remaining Table A supply available in any given year for water banking operations.
In 1963, the Santa Barbara County Flood Control and Water Conservation District contracted with DWR for the delivery of SWP water. At the time, the County began payments to DWR to retain an entitlement to the SWP for 57,700 acre-feet per year. In 1981, the contract with DWR was amended to reduce the County’s SWP entitlement to 45,485 acre-feet per year. Santa Barbara County currently utilizes about 43,000 acre-feet of its 45,485 acre-feet Table A allocation, which is delivered to numerous entities within Santa Barbara County. Santa Barbara County is currently considering reacquiring its 12,214 acre-feet of suspended Table A supply. This additional supply may be available to improve water supply reliability for direct use within Santa Barbara County, and/or
2-6

improve the amount and reliability for other uses such as the water banking project being evaluated.
Drought Buffer – Drought buffer is a portion of unused Table A allocation that has been contractually reserved to firm up the reliability of the contract allocation that is used in those years when full SWP deliveries are not available.
The focus of this study is utilization of the County’s SWP water supply; therefore, the Nacimiento Water Project will not be considered as a potential supply source for this Feasibility Study.
2.3.2 SWP Water Quality
Many Californians rely on the SWP for part or all of their residential water supply. In addition, the SWP provides water for agriculture, industry, power generation, recreation, and fish and wildlife needs. DWR monitors SWP water quality throughout the system using a combination of automated sampling and field samples collected weekly, monthly, quarterly, or annually to ensure it meets the water quality objectives for the beneficial uses of water. Water quality standards and objectives are categorized by the beneficial use they are intended to protect, including municipal, industrial, agricultural, fish, and wildlife.
The existing SWP water quality is considered appropriate for both residential and agricultural uses. The SWP supply is treated at PPWTP and delivered through the Coastal Branch Aqueduct for potable municipal and industrial (M&I) uses in San Luis Obispo and Santa Barbara Counties. In Kern County, raw water from the SWP is used to irrigate crops and recharge the groundwater basin. Table 2-1 lists the 2004 mean water quality data for the California Aqueduct at Kettleman City (Check 21), which is located just upstream of the Coastal Branch.
The potential impacts of salt loading on the basin should be considered prior to implementation of a water recharge or banking project. All surface water and groundwater naturally contain some level of salts, although the concentrations may vary widely from surface water source to source and throughout the groundwater basin. A general measure of salt content can be obtained from electrical conductivity (EC) of the water, or total dissolved solids (TDS) concentration, where fresh water generally has a TDS of 0 to more than 1,000 mg/l. Thus, when importing water to a region, consideration must be given to the salts content of the imported water as well as the differing geochemical characteristics of the imported water and native groundwater.
2-7

Any imported water source, including the SWP water, contains some measurable level of salts; therefore, application of that water to the soil zone applies salts to the soil. Because crops basically extract pure water, application of the imported water as crop irrigation water will leave the salts in the imported water source behind, and without some type of action to remove them the salts will build up in the soil and potentially create problems. Artificially increased salt concentrations, such as would occur with a groundwater recharge or banking project, and irrigation-induced soil salinity are potential threats to the sustainability of irrigated agriculture.
Crops are affected by salts through interference with the osmotic process and with uptake of nutrients. Crop types that have a low tolerance to salt include wine grapes, avocado, most pitted fruits and citrus crops, pears, apples, celery, green beans, and clover. Salts also alter metabolic reactions and interfere with soil microbiology. With increased EC, the specific analytes of concern are typically sodium and chloride. At high concentrations sodium and chloride can produce significant problems to irrigated agriculture. Sodium can cause hardening of the soil and a reduction in permeability, and make the soil harder to work with when damp or wet.
An analysis should be conducted on the potential impact of salt loading on the water quality of the Paso Robles basin if additional consideration is given to a recharge and water banking project. This would involve a comparison of the chemical characteristics of the water to be imported and the groundwater of the Paso Robles Basin and/or specific groundwater in areas that are to receive imported water.
2-8

Table 2-1 2004 Mean Water Quality
2-9

2.4 Hydrogeologic Setting The hydrogeologic description presented in the Basin Study is briefly described below.
2.4.1 Basin Definition and Boundaries
The Basin encompasses an area of approximately 505,000 acres (790 square miles). The Basin ranges from the Garden Farms area south of Atascadero to San Ardo in Monterey County, and from the Highway 101 corridor east to Shandon (Figure 1-1). Internally, the Atascadero subbasin was identified, which encompasses the Salinas River corridor area south of Paso Robles and includes the communities of Garden Farms, Atascadero, and Templeton.
The hydrogeologic setting is based on the best available information collected and documented as part of the studies and investigations described in Section 1.2. Because of the limited spatial and temporal distribution of available data, assumptions and extrapolations were used to describe the basin-wide hydrogeologic setting. Additional data collection and monitoring is needed to verify the variations in the hydrogeologic conditions at an appropriate level of detail to refine potential projects prior to design or implementation.
2.4.2 Groundwater Occurrence, Levels, and Movement
Water level data show that over the 18-year period extending from July 1980 through June 1997 (base period) there is no definitive upward or downward water level trend for the basin as a whole. However, different water level trends are observed at specific locations within the Basin. Water levels have declined rather dramatically in the Estrella and San Juan areas, while rising water levels have been experienced in the Creston area. In general, groundwater flow moves northwesterly across the Basin towards the Estrella area, then northerly towards the Basin outlet at San Ardo. The biggest change in groundwater flow patterns during the base period is the hydraulic gradient east of Paso Robles, along the Highway 46 corridor, which has steepened in response to greater pumping by the increasingly concentrated development of rural ranchettes, vineyards, golf courses, and municipal supply wells.
2.4.3 Water Quality
In general, the quality of groundwater in the Basin is relatively good, with few areas of poor quality and few significant trends of ongoing water quality deterioration. Historical water quality trends were evaluated to identify areas of deteriorating water quality. A major water quality trend is defined as a clear trend that would result in a change in the
2-10

potential use of water within 50 years, if continued. Six major trends of water quality deterioration in the Basin were identified, including the following:
Increasing total dissolved solids (TDS) and chlorides in shallow Paso Robles Formation deposits along the Salinas River in the central Atascadero subbasin.
Increasing chlorides in the deep, historically artesian aquifer northeast of Creston.
Increasing TDS and chlorides near San Miguel.
Increasing nitrates in the Paso Robles Formation in the area north of Highway 46, between the Salinas River and the Huerhuero Creek.
Increasing nitrates in the Paso Robles Formation in the area south of San Miguel.
Increasing TDS and chlorides in deeper aquifers near the confluence of the Salinas and Nacimiento rivers.
2.4.4 Groundwater in Storage
The total estimated groundwater in storage within the Basin is approximately 30.5 maf. This value changes yearly, depending on recharge and net pumpage.
1980 to 1997 Period – Between 1980 and 1997, groundwater in storage increased approximately 12,000 acre-feet, or less than 0.1 percent of the groundwater in storage. This represents an average increase in storage of less than 1,000 acre-feet per year. On one hand, this relatively small percentage could be viewed as an indication of stable basin-wide conditions; however, it is noted that steadily decreasing storage in the 1980s was offset by increased water in storage throughout the 1990s. Furthermore, not all areas of the Basin have evidenced the same trends in water levels and change in storage.
1997 to 2006 Period – The Update for the Paso Robles Groundwater Basin includes additional water level data for the 1997 to 2006 period. Overall, the direction and pattern of regional groundwater flow within the Basin were basically unchanged from the 1997 to 2006 period. Individual groundwater level hydrographs showed that groundwater level declines persisted in portions of the Estrella and San Juan subareas from 1981 to 2006. The change in groundwater storage was estimated to be a net decline of about 29,767 acre-feet, or -3,307 acre-feet per year.
In the Atascadero subbasin, total groundwater in storage averaged about 514,000 acre-feet. Approximately 2,600 acre-feet more groundwater was in storage in the subbasin in 1997 compared to 1980, which is an increase of less than one percent in total
2-11

2-12
groundwater in storage during the base period. This represents an annual increase in storage of about 200 acre-feet.
3 Potential Water Banking Operations
As described in Section 2, there are water supply availability and hydrogeologic factors that need to be considered during the evaluation of project feasibility. The purpose of this section is to identify the water banking operations that have been considered and describe the operations that are being used in this study to test project feasibility.
3.1 Water Banking Concepts The October 5, 2005 CCWA memorandum to the WRAC, entitled San Luis Obispo County Water Reliability Opportunities Update, identified two potential groundwater banking concept alternatives for northern San Luis Obispo County.
Treated Water Banking Concept: This concept included creating a new turnout from the Coastal Branch Aqueduct to deliver treated water to a banking location for recharge (through injection, spreading, or in-lieu recharge). When SWP supplies exist in excess of current demand, water would be banked. When SWP water is not available, the previously banked water would be recovered and conveyed to the Coastal Branch for delivery water users.
Raw Water Banking Concept: This concept would require constructing a new pipeline to convey raw water from PPWTP (prior to treatment) to a banking location in the Paso Robles Groundwater Basin for recharge (through stream recharge, spreading, or in-lieu recharge). When SWP supplies exist in excess of current demand, water would be banked. When SWP water is not available, the previously banked water would be recovered and conveyed to the Coastal Branch for delivery to water users, or, if necessary, pumped back to PPWTP for treatment using the same pipeline.
Only the Raw Water Banking Concept is being evaluated in this feasibility study, in part, because the available supply for banking significantly exceeds the existing capacity of the PPWTP and treated water pipeline capacity.
3.2 Groundwater Recharge Methods Groundwater recharge occurs naturally through percolation from rivers and streams, infiltration and percolation of precipitation on the groundwater basin, and the subsurface lateral movement of water into the groundwater basin from areas of relatively higher groundwater levels. In some cases, natural groundwater recharge cannot keep pace with groundwater use, resulting in long-term declines in groundwater levels, which may result
3-1

in impacts to local streams, degradation of local groundwater quality, or land subsidence. Artificial recharge may be used as a groundwater management tool to protect and maintain the available groundwater resources for current and future uses.
There are two approaches to artificial groundwater recharge: direct recharge and indirect recharge. Direct recharge includes physically delivering water to the aquifer system, whereas indirect recharge increases groundwater storage by reducing the groundwater removed from the basin. There are advantages to each approach, and local conditions may suggest which method(s) is more appropriate for a particular location.
3.2.1 Direct Recharge
The types of direct groundwater recharge methods that have been identified for consideration in this study include the following:
Recharge Basins/Ponds
Injection
River/Stream Recharge
Each of these recharge methods is briefly described below.
3.2.1.1 Recharge Basins/Ponds
The use of surface spreading basins or spreading ponds is the most common type of artificial groundwater recharge. Typically, a recharge location would consist of a series of connected surface basins that may range in size, depending on the available space and slope of the land. Recharged water moves away laterally and vertically from the recharge ponds, initially through the unsaturated zone to the unconfined aquifer system. The existence of low permeability layers in the near surface may affect the performance of the recharge ponds. If low permeability layers are encountered near the ground surface, they may be excavated and removed during pond construction, with the excavated material used to construct the dikes or berms that create the individual ponds.
The type and location of the recharge basins may dictate the level of engineering and construction needed to develop and operate recharge basins/ponds. Spreading ponds utilizing existing excavations, such as sand and gravel mines, borrow pits, or natural depressions such as low lying abandoned river channels, may require few improvements. Where these opportunities do not exist, recharge basins may require more extensive planning, engineering, and construction.
3-2

Recharge ponds/basins are often constructed in a series, with the initial ponds serving to settle the fine materials that may clog the pore space. Multiple settling basins are often interconnected to allow individual basins to be removed from service for maintenance. Aside from the periodic drying of the pond bottoms, maintenance may include scarifying, disking, or other mechanical means to remove fines and maintain infiltration rates. Additional maintenance may be needed on the levees or dikes to repair erosion caused by wind or wave action.
Some of the features of recharge basins/ponds include:
Recharge of unconfined aquifer system.
Relatively low cost to design and construct.
No seasonal constraint on their use.
Existing opportunities such as gravel pits may be utilized.
Factors affecting successful implementation include:
Requires large areas of relatively flat land.
Requires permeable soils with no impermeable layers in near-surface.
Requires the presence of a significant unsaturated depth below the surface of potential ponding sites.
Requires considerable unrestricted unsaturated permeable margin areas beyond the boundaries of the proposed pond area.
This method may be utilized in some locations within the Basin. Opportunities for recharge basins have been investigated by the Templeton Community Services District and the Atascadero Mutual Water Company along the Salinas River as part of the Nacimiento Water Project.
3.2.1.2 Injection Wells
Injection wells have been used to recharge aquifer systems for many years with varying degrees of success. Typically, injection wells have been used in areas where spreading may not be feasible due to space constraints; land is too expensive to use more land-intensive recharge methods; or thick, impermeable clay layers overlie the principal water bearing deposits.
3-3

Injection wells have been used in the West Coast Basin in Los Angeles for over 40 years to create a barrier to prevent seawater intrusion. These wells have been used only for recharge and not for recovery of the injected water. More recently, specially designed and constructed wells are used to both inject water into the aquifer system and later extract the stored groundwater.
One of the difficulties associated with injection wells is maintaining adequate recharge rates. Several factors that may affect the long-term viability of injection wells include:
Chemical reactions in the aquifer.
The formation of biosolids and precipitation on the well screens.
Entraining air in the aquifer system.
Deflocculation caused by the reaction of high-sodium water with soil particles.
Where it is used, injection well spacing depends upon the radius of influence of the injected water, which, in turn, depends on the aquifer characteristics, water levels, and well construction details such as the length of casing penetrating the aquifer and the number of casing perforations.
This method requires the source water to be treated, and sediment must be almost completely removed. In addition, there may be water quality complications injecting water into the aquifer system.
Injection well recharge is an expensive recharge method that is not likely to be utilized in the Basin because of the high capital costs and high operation and maintenance (O&M) costs. In addition, the area does not have the space limitations that prevent other recharge methods from being used.
3.2.1.3 River/Stream Recharge
River and stream channels typically have sand and gravel beds with relatively high permeability, which provide natural recharge opportunities, as described earlier. In some cases, improvements can be made to increase the amount of water that would percolate naturally by increasing the period of time that water is available for seepage and/or by increasing the wetted area and ponded depth of water of the streambed.
The length of time that water is available for recharge is usually determined by the hydrologic characteristics of the stream and watershed. The construction of dams or
3-4

reservoirs may be used to regulate available supplies and therefore modify the duration of flow and increase groundwater recharge.
In addition, streambed modifications may be used to increase the wetted area of the stream. This may include diverting water to sand and gravel areas adjacent to the main meandering stream. Another method may include extending a small weir or low dam across the bed where the stream has a very wide bottom caused by the meandering of the channel. The water behind and spilling over the weir spreads out in a shallow depth over the entire streambed, thereby increasing the wetted area and resultant recharge. Precautions should be taken to not create a hazard in a time of flooding by backing water out of its normal streambed. In this regard, rubber dams have been used to temporarily expand the wetted area.
By its nature, stream and river recharge has direct interaction between the groundwater and surface water systems. This may result in the recharged water returning to the stream at other locations, or during periods when recharge activities are not taking place.
3.2.2 Indirect Recharge
Indirect recharge differs from the direct recharge methods because it does not physically place the water into the aquifer system; rather, surface water replaces the use of groundwater, thereby reducing local demand on the groundwater basin and providing the opportunity for the basin to recharge through the natural sources mentioned earlier. Indirect recharge is often called in-lieu recharge and is commonly used in areas where the historical water demand has relied on the underlying groundwater basin for supply, which has resulted in declining groundwater levels.
In-lieu recharge has been used in both urban and agricultural areas and often utilizes the existing infrastructure to distribute water supply to individual customers. One of the requirements of an in-lieu recharge program is that the replacement supply must be of the appropriate quantity and quality to satisfy the existing supply requirements.
Because recharge is not concentrated as in the case of direct recharge methods, it does not result in a mound of recharge water; rather, a more gradual increase in groundwater levels is evidenced over a larger area where pumping has suspended.
In-lieu recharge programs are often used to improve overall supply reliability by using the imported surface water supply in wet years or months when it is available, thereby reducing the dependence on the groundwater basin. Then in dry years, when imported supplies may be reduced or not available, groundwater is used to meet those demands not met by the imported supply. An in-lieu recharge program is effective when the imported
3-5

water reduces the demand on the local groundwater system, and is not used to accommodate increases in demand. In addition, local hydrologic and hydrogeologic conditions must be considered to balance the in-lieu program with the existing natural recharge. In this fashion, in-lieu recharge also takes advantage of the natural hydrogeologic setting and the existing groundwater infrastructure.
Some of the benefits of in-lieu recharge include:
Relatively cost-effective when able to use existing local infrastructure.
Does not require construction of recharge facilities.
Effectiveness is not dependent upon near-surface local hydrogeologic conditions.
Does not create a localized mound of banked water near the recharge facilities that may limit recharge capacity.
Factors affecting successful implementation include:
An existing water demand met by groundwater storage that is balanced with the natural recharge.
A soil profile and hydrologic system that can provide an acceptable water and salt balance.
Access to reliable imported water supply of suitable quality.
The ability to utilize existing infrastructure.
This method may be utilized in the Basin where existing groundwater demands have resulted in declines in local groundwater levels.
3.3 Recharge and Banking Operational Scenarios Three operational scenarios are being considered to evaluate the water recharge and banking feasibility in the Paso Robles Groundwater Basin. These scenarios bookend the range of groundwater recharge and water banking opportunities in the basin that may be considered based in part upon the SWP supply availability described in Section 2.3. These scenarios include the following:
Baseline Condition (no groundwater recharge or recovery).
Groundwater Recharge Scenario (groundwater recharge only).
3-6

Water Banking Scenario (groundwater recharge and recovery).
For purposes of this feasibility study, the recharge and recovery capacity was assumed to be 1,500 acre-feet per month (18,000 acre-feet per year). This value represents a potential water supply available to the region in most years through a combination of sources described in Section 2.3.1, and is considered to be an appropriate magnitude to test the Basin’s response to recharge and banking operations. The magnitude of the project operations is considered to be consistent with the detail level of the available hydrogeologic data and assumptions used to describe the hydrogeologic setting in the groundwater model.
Operational scenarios may be updated in a future analysis based on the collection of additional hydrogeologic data and identification of banking participants.
These operational scenarios were evaluated using the previously developed groundwater model of the Paso Robles Groundwater Basin described in the Phase II Groundwater Basin Study. The model includes a 17-year simulation period divided into 34 six-month stress periods, which alternate the growing season (April to September) and the non-growing season (October to March). Figure 3-1 shows the project operations for the
Figure 3-1 Project Operations
0
25,000
50,000
75,000
100,000
125,000
150,000
175,000
1 2 3 4 5 6 7 8 9 10 11 12 13 14 15 16 17 18 19 20 21 22 23 24 25 26 27 28 29 30 31 32 33 34
Stress Period
Volu
me
(acr
e-fe
et)
Recharge Scenario @ 1,500 af/m Delivery Capacity
Water Banking Scenario @ 1,500 af/m Delivery Capacity
Baseline Condition
No Activity
Recharge Scenario(Recharge Only)
Water Banking Scenario (Recharge and Recovery)
Baseline Condition(No Recharge or Recovery)
3-7

Baseline Condition, Recharge Scenario, and the Groundwater Banking Scenario based upon the 1,500 acre- feet per month project capacity for the simulation period. Each of these operational scenarios is described below.
3.3.1 Baseline Condition
The Baseline Condition is used to represent the groundwater basin without groundwater recharge or water banking operations, and is therefore used to evaluate the effects of the Recharge Scenario and the Water Banking Scenario (described below) on the groundwater basin. The Baseline Condition for this analysis is the Buildout Scenario (Scenario 2 from the Phase II Groundwater Basin Study). The Buildout Scenario was developed to simulate the effects of urban growth build-out and maximum reasonable agricultural demand on groundwater elevations throughout the Paso Robles Groundwater Basin, and to identify areas of special concern within the Basin. The Baseline Condition is described in more detail in the Phase II Groundwater Basin Study.
As shown in Figure 3-1, the Baseline Condition does not include any recharge or recovery operations during the 17-year simulation period.
3.3.2 Recharge Scenario
The Recharge Scenario focuses on improving local water supply conditions by supplementing existing groundwater supplies with an imported water supply. The imported supply may be used instead of pumping groundwater (in-lieu recharge) or directly recharging the groundwater basin (direct recharge), thereby reducing the net demand on the groundwater system. Reducing the annual net groundwater demand results in higher groundwater levels than would have occurred without the recharge program. Existing (or new) groundwater wells are used to recover the recharged water for use on the overlying lands.
The purpose of the Recharge Scenario is to evaluate the effect of recharge operations on the Baseline Condition. This scenario includes only recharge operations; the groundwater pumping is the same as in the Baseline Condition to meet municipal, agricultural, and rural water demands. As shown in Figure 3-1, recharge occurs in nine years and totals about 162,000 acre-feet during the 17-year simulation period. These recharge periods were selected based upon SWP supply availability, described in Section 2.3.1. Recharge occurs in years with above-average rainfall and runoff.
3.3.3 Water Banking Scenario
The goal of water banking is to store and recover water for an intended use. Imported water is ‘banked’ in wet years when surplus supplies are available and recovered in drier
3-8

years when the banked water is needed. A water banking program differs from a groundwater recharge program by storing water for others that may or may not overlie the portion of the groundwater basin involved in the groundwater recharge activities. A water banking program requires an accounting system to distribute the costs and benefits of the program among the participants (including the banking partners and overlying groundwater users). The banking program may serve an outside interest that pays either water and/or money to store water in the “bank” for their time of need.
Groundwater levels in the area affected by water banking operations may have greater fluctuations than there would have been without the banking program. During periods of recharge, groundwater levels may be higher than they would have been without the project. During recovery periods, groundwater pumping may exceed that of what was normally used, resulting in localized drawdown at the recovery wells that would have been greater than without the banking project.
The purpose of the Water Banking Scenario is to evaluate the effect of recharge and recovery operations (for export from the Basin) on the Baseline Condition and the Recharge Scenario. This scenario includes the same recharge operations as the Recharge Scenario. The recovery operations include the local demand (as in the Recharge Scenario) and an additional recovery component to represent pumping of banked water to meet an additional demand. The disposition of the water recovered from the basin has not been associated with any individual water user.
For the Water Banking Scenario, the recharge operations are the same as the Recharge Scenario, as shown in Figure 3-1. During years when there is no supply for groundwater recharge, it is assumed that the banked water would be recovered and delivered for use outside of the basin. In the Water Banking Scenario, 90,000 acre-feet of groundwater is recovered during the simulation period. This represents about 55 percent of the total amount of recharged water. The recovery of banked water occurs in three periods, stress period 11-12, stress period 19-24 (3-year period), and stress period 27-28.
3.4 Affected Areas The affected areas are identified below because they may have a role in the planning, implementation, and operation of water banking projects in the Paso Robles Groundwater Basin for the following reasons:
They supply water for recharge and banking.
They use recharge and/or banked water.
They may be involved or impacted by recharge and recovery operations.
3-9

3-10
Future efforts will be needed to identify and codify the specific coordination, cooperation, and management of any future water banking activities among local and state agencies, as well as local land owners.
San Luis Obispo County Flood Control and Water Conservation District – The District has the SWP contract that is being used in this study as the water supply source for banking operational scenarios. It also has the contract with CCWA to treat and convey water to the existing M&I contractors in the County.
Central Coast Water Authority – CCWA operates and maintains the Coastal Branch Aqueduct and the PPWTP. CCWA also represents potential urban water users that may be interested in receiving banked water.
Local Agricultural Water Users – Local agricultural water users may provide local agricultural in-lieu recharge opportunities and may be affected by groundwater banking operations. The local agricultural areas are identified based on a 2006 County land use survey prepared by the San Luis Obispo County Agricultural Commissioner’s Office. Coordination with agricultural land owners that may choose to participate in a feasible water banking project would occur under future efforts.
Local Urban and Rural Water Users – Local urban and rural water users may be affected by water recharge and banking operations. They may also be potential project participants that utilize recharged banked water. Coordination with local cities, communities, and residences may be necessary in the future to evaluate the effects of a potential water banking project on their existing water supply wells and to evaluate opportunities for them to participate in any potential project. This includes local purveyors like the City of Paso Robles and the Templeton Community Services District, and local advisory groups such as the Shandon Advisory Council and the Creston Advisory Body.
Regional Urban Water Users – Regional urban water users are included to represent potential out-of-basin water users that may become partners in a water banking project.

4 Alternative Locations
This section describes the approach used to identify the locations in the Basin where recharge and recovery operations were evaluated. The locations of the water banking alternatives evaluated in this feasibility study were identified primarily based upon information describing the local hydrogeologic conditions. This approach was described in the PETM and presented at several GBSC meetings as part of the initial project screening and project site selection process.
4.1 Location Evaluation Criteria An initial screening of all seven groundwater subareas was completed using the available hydrogeologic information to identify potential project locations for further consideration.
Each of the water banking opportunities that passed the initial screening was evaluated based on its ability to satisfy the following water banking activities:
The ability to recharge the aquifer system.
The ability to recover the banked water.
The ability to deliver the banked water to the end user.
The specific hydrologic and engineering criteria described below were used to provide a preliminary assessment of water banking potential for individual sites.
4.1.1 Hydrogeologic Criteria
The specific hydrogeologic evaluation criteria are described below.
Geologic/Hydrogeologic Setting
o High Feasibility: Includes areas with a thick, highly permeable aquifer that has a simple structure.
o Low Feasibility: Includes areas with a thin, low-permeability aquifer with a complex structural setting.
4-1

Near Surface Conditions
o High Feasibility: Includes areas with highly permeable soils and near surface conditions and low relief.
o Low Feasibility: Includes areas with clay-rich soils and saturated near surface conditions and areas with high relief.
Available Groundwater Storage Capacity
o High Feasibility: Includes areas with large available groundwater storage capacity (thick unsaturated zone).
o Low Feasibility: Includes areas with small available groundwater storage capacity (thin unsaturated zone).
Ability to Recharge Aquifer System
o High Feasibility: Includes areas with a highly permeable aquifer, lack of clay-rich aquitards, and direct hydraulic communication with the producing aquifer.
o Low Feasibility: Includes areas with a low-permeability aquifer, a presence of aquitards and other impediments to vertical percolation, and indirect or no hydraulic communication with the producing aquifer.
Ability to Recover Banked Water
o High Feasibility: Includes areas with large pumping capability from wells penetrating the receiving aquifer.
o Low Feasibility: Includes areas with small pumping capability from wells penetrating the receiving aquifer.
Interaction with Surface Water
o High Feasibility: Includes areas located away from surface streams.
o Low Feasibility: Includes areas located near surface streams where the banking aquifer system and water table are near the ground surface.
4-2

Water Quality Considerations
o High Feasibility: Includes areas of generally good quality for the specific uses (agricultural or urban) of the target aquifer.
o Low Feasibility: Includes areas of generally poor quality for the specific uses (agricultural or urban) of the target aquifer. This may include high total dissolved solids, nitrates, boron, or other natural or anthropogenic sources.
4.1.2 Engineering Criteria
The engineering criteria listed below did not affect the selection of potential water banking locations to be evaluated, but were developed to identify other factors that may distinguish between alternatives.
Water Supply Availability – The available water supplies and assumptions regarding their reliability were identified and evaluated for use in this study. As described in Section 3, each alternative would be evaluated using the same water supply pattern, so this was not a criterion that would distinguish between alternatives.
Ability to Utilize Existing Infrastructure – The water banking opportunities utilized the available infrastructure to deliver water from the SWP to the Basin; i.e., through the Coastal Branch and the PPWTP. All potential banking projects used this as the starting point to identify additional conveyance requirements. It was determined that each alternative would be evaluated using the same starting and return point (at the inflow of the PPWTP), so this was not a criterion that would distinguish between alternatives.
Capital Cost and Operation and Maintenance Costs – The required facilities for an individual water banking opportunity were based upon size and location as determined by the hydrogeologic evaluation. Capital costs for the required facilities (suitable for comparative purposes between water banking alternatives) were based on readily available local information. It is expected that project costs will be a significant factor affecting the overall feasibility of water banking opportunities in the Basin, and one of the primary factors distinguishing between projects.
4-3

4.2 Selected Alternatives The three selected alternatives presented below were developed based on review of the existing available information collected and documented in previous studies, primarily the Paso Robles Groundwater Basin study (Fugro and Cleath, 2002; Fugro and ETIC, 2005), as well as field investigations to verify local conditions. Additional field work, including the performance of pumping tests, measuring of water levels, and other data collection and monitoring efforts are needed to verify the hydrogeologic conditions at an appropriate level of detail at each alternative location under consideration to refine potential projects prior to design or implementation.
For evaluation purposes, each of the three alternatives assumes a combination of direct recharge and agricultural in-lieu recharge. The recharge area was evaluated to determine a combination of direct and in-lieu recharge based upon the existing land use and local hydrogeologic conditions, as described above.
For the evaluation of the recovery of banked water, the recovery wells were assumed to be located to minimize drawdown interference during recovery operations with existing wells and other recovery wells while limiting infrastructure requirements. The assumed number and distribution of recovery wells is based on existing well locations and local hydrogeologic conditions.
Figure 4-1 shows the locations of the three different areas for evaluation, which include:
Shell Creek/Camatta Creek and Lower San Juan Creek Recharge Areas.
Creston Recharge Area.
Salinas River/Hwy 46 Recharge Area.
4.2.1 Shell Creek/Camatta Creek and Lower San Juan Creek Recharge Areas
The purpose of this alternative is to evaluate the groundwater banking potential in the San Juan Subarea shown on Figure 4-2. Potential areas that may support direct recharge were identified along Shell/Camatta Creeks and San Juan Creek. In addition, the agricultural areas (primarily vineyards) present in the Shandon area and along Shell Creek may provide in-lieu recharge opportunities.
The recharge operations included a combination of agricultural in-lieu recharge and direct recharge. This combination of in-lieu and direct recharge would disperse the recharge activities over a large area in order to access as much of the aquifer system as
4-4
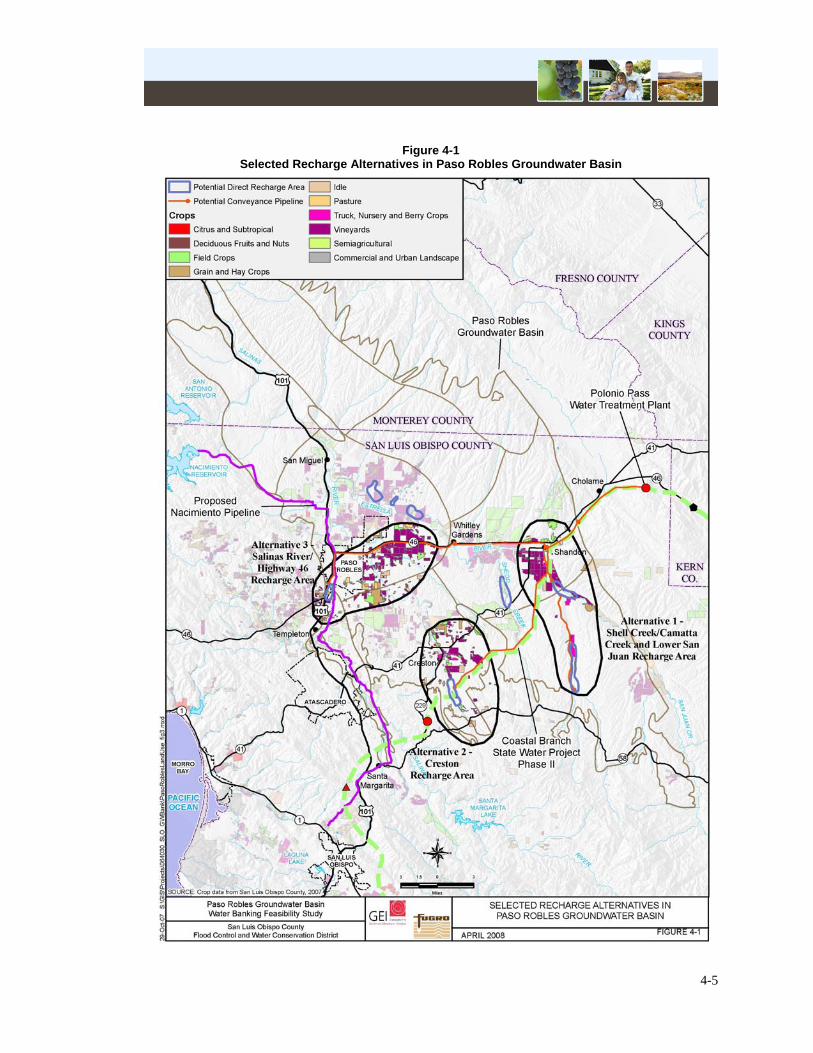
Figure 4-1 Selected Recharge Alternatives in Paso Robles Groundwater Basin
4-5

Figure 4-2 Alternative 1 – Shell Creek/Camatta Creek and Lower San Juan Creek Recharge Areas
4-6

possible. This area is subject to significant seasonal fluctuations and water levels in the area appear to have decreased beginning in 2003.
Recovery operations would take place throughout the area receiving recharge water. Wells in this area can produce from 1,000 to 2,000 gallons per minute (gpm). It is expected that new groundwater recovery wells would be located along the conveyance pipeline to recover the banked water and return it to the PPWTP.
4.2.1.1 Hydrogeologic Setting
The average thickness of the aquifer system in the San Juan Subarea is approximately 450 feet, with an average specific yield of about 10 percent, resulting in an estimated groundwater storage capacity of about 4.2 million acre-feet. The aquifer typically consists of sand and gravel interbedded with discontinuous clay horizons. In the Shell Creek/Camatta Creek area, the aquifer contains sequences of sand and gravel up to several hundred feet thick. Previous field investigations have noted significant stream recharge in Shell/Camatta Creek (Fugro, 2002).
Throughout most of the area, the Paso Robles Formation, which comprises the deep aquifer and primary producing geologic unit, is underlain by the Santa Margarita Formation. Within the stream valleys, the alluvium is thin but highly permeable, consisting of sand and gravel with very high transmissivity values.
In the lower San Juan Creek and Shell Creek/Camatta Creek area, well production typically ranges from 1,000 to 2,000 gpm, with typical specific capacity values of about 26 gpm per foot of drawdown.
Water levels in wells in the San Juan area have shown both rising and falling conditions over the past 25 years. Wells exhibiting both the greatest decline and the greatest water level increases can be found in Camatta Canyon, indicating the effects of localized heavy agricultural pumping as well as the impacts of significant stream recharge. In general, the lower San Juan Creek and upper Shell Creek areas experienced a long period of declining water levels from the early 1960s through the mid-1990s, followed by a marked increase from the mid-1990s to the present. Wells along Camatta Canyon appear not to have experienced the same period of recovery in the 1990s, however, resulting in a slight decline of water levels. Groundwater flow in the area is generally to the north-northwest.
Groundwater quality in the subarea is variable, depending on the area and the depth of the well. Groundwater quality in the Shell Creek and Camatta Canyon areas is typically very good, with TDS concentrations in the range of 150 to 300 mg/L, chloride concentrations of less than 40 mg/L, and nitrates generally about 10 to 15 mg/L. Concentration levels of the major constituents of concern are relatively stable.
4-7
Groundwater quality in the lower San Juan Creek area is more variable. The shallow aquifer zones in the lower San Juan Creek area, near the confluence of Shell Creek and San Juan Creek, have TDS concentrations greater than 2,000 mg/L with increasing nitrate levels that occasionally exceed 45 mg/L. Partially because of the water quality, this shallow zone is not used to a large degree.
The deeper aquifer in the lower San Juan Creek area is more typical of the deep Paso Robles Formation, with TDS concentrations in the 500 to 700 mg/L range and chloride concentrations in the 40 to 60 mg/L range.
The aquifer in the Shell Creek/Camatta Creek area is unconfined, with an apparent high degree of hydraulic communication between the shallow alluvium and the underlying Paso Robles Formation. Streamflow in the Shell Creek/Camatta Creek alluvium directly recharges the underlying deep aquifer. To the north of the confluence of the Camatta Creek and San Juan Creek, however, the deep primary production aquifer is semi-confined to confined, with limited direct hydraulic communication between the aquifer and the shallow alluvial systems. Thus, direct recharge applications in the lower San Juan Creek appear to have limited deep aquifer recharge potential.
4.2.2 Creston Recharge Area
The purpose of this alternative is to evaluate the groundwater banking potential in the Creston Subarea shown in Figure 4-3. The sand and gravel zones of the Creston basin sediments appear to be in direct contact with the shallow alluvial sand and gravel deposits of the Huerhuero Creek, which may provide direct recharge to the basin. Groundwater quality is generally good in the shallow zones, with increased mineralization from the southwest to the northeast.
The East Branch of the Huerhuero Creek has been identified as a potential recharge area. In addition, the agricultural areas (primarily vineyards) present in the Creston area may provide in-lieu recharge opportunities.
The recharge operations included, primarily using direct recharge along the Huerhuero recharge area, and secondarily using agricultural in-lieu in the Creston Area. This combination of in-lieu and direct recharge dispersed the recharge activities over a large area in order to access as much of the aquifer system as possible. Groundwater levels in this area are relatively stable.
4-8

Figure 4-3 Alternative 2 – Creston Recharge Area
4-9

Recovery operations would take place throughout the area receiving recharge water from the shallow alluvial aquifer and the Paso Robles Formation. Wells in this area can produce from 300 to 400 gallons per minute. It is expected that new groundwater recovery wells would be located along the pipeline to recover the banked water and return it to the PPWTP.
4.2.2.1 Hydrogeologic Setting
The average thickness of the aquifer system in the Creston Subarea is approximately 450 feet, with an average specific yield of about 9 percent, resulting in an estimated groundwater storage capacity of about 2 million acre-feet. This area has a two-layered aquifer system, with the shallow alluvial aquifer system overlying the Paso Robles Formation.
Throughout the Creston area, the deep basin sediments of the Paso Robles Formation are underlain predominantly by Tertiary-age marine sediments. In the southern portion of the area, the basin sediments are underlain by and in contact with the granitic rocks that form the groundwater basin boundary. The Paso Robles Formation sediments in the Creston area are typical of the rest of the basin, comprised of relatively thin, discontinuous sand and gravel layers interbedded with thicker layers of silt and clay.
Throughout most of the Creston area, alluvial deposits of variable thicknesses overlie the Paso Robles Formation beneath the flood plains and older stream terraces of Huerhuero Creek. These alluvial deposits reach depths as great as 100 feet in places and consist of much coarser and unconsolidated sedimentary layers than are typically found in the Paso Robles Formation. Groundwater recharge to the Creston area occurs where the shallow alluvial deposits are in contact with (overlying) the coarse-grained Paso Robles Formation aquifer.
Producing water wells in the Creston area penetrate and extract groundwater from both the alluvium and the Paso Robles Formation. Wells producing from the unconfined and highly permeable alluvium typically pump in the range of 300 to 400 gpm, with specific capacities in the range of 60 to 70 gpm per foot. Wells producing from the Paso Robles Formation also typically pump in the range of 300 to 400 gpm, but with much lower specific capacities, generally in the 5 to 10 gpm-per-foot range.
Water levels in wells in the northern part of the Creston area showed a general decline from the mid-1960s into the early 1990s. From the early 1990s to about 2000, water levels in most wells in the area increased markedly, resulting in more than 50 feet of water-level rise in the 20-year period prior to about 2000. Since 2000, water levels appear to have stabilized or perhaps declined slightly.
4-10

Near the town of Creston, water levels have remained relatively stable for many years. Several wells, particularly along the course of the Huerhuero Creek south of town, experienced flowing conditions and historic high water levels in the late 1990s.
Groundwater and surface water flows northward out of the Creston area primarily along the Huerhuero Creek drainage. Groundwater flow is generally to the northwest at a regional hydraulic gradient of approximately 0.009 feet per foot.
Groundwater quality in the Creston area is generally very good for drinking and for direct agricultural application. Typical TDS concentrations are in the 250 to 500 mg/L range, with chloride concentrations about 50 mg/L and nitrates generally below 20 mg/L. Overall, water quality trends in the area are relatively stable.
The primary source of recharge to the deep aquifer in the Creston area appears to be Huerhuero Creek. The aquifer in the Creston area, particularly in the northern portion of the subarea, appears to be unconfined for the most part, with an apparent high degree of hydraulic communication between the shallow alluvium of the creek and its tributaries and the underlying Paso Robles Formation.
4.2.3 Salinas River/Highway 46 Recharge Area
The purpose of this alternative is to evaluate the groundwater banking potential along Highway 46 and in the Salinas River Area shown in Figure 4-4.
Within the Subarea, the Estrella River north of Highway 46 has some areas that may provide favorable surface recharge, but the connection of these areas to the main aquifer system is not clearly understood at this time.
The Salinas River just south of Paso Robles has been identified as a potential recharge area. In addition, the agricultural areas (primarily vineyards) present along Highway 46 may provide in-lieu recharge opportunities.
Groundwater levels along Highway 46 and near Paso Robles have experienced the greatest declines in the basin. It is expected that groundwater recharge alternatives in this area may reduce the rate of groundwater-level declines and may allow for the recovery of groundwater levels during recharge operations.
The recharge operations included, primarily using direct recharge along the Salinas River recharge area, and secondarily using agricultural in-lieu in the Highway 46 Area. This combination of in-lieu and direct recharge dispersed the recharge activities over a large area in order to access as much of the aquifer system as possible.
4-11

Figure 4-4 Alternative 3 – Salinas River/Hwy 46 Recharge Area
4-12

Recovery operations would take place throughout the area receiving recharge water from the shallow alluvial aquifer and the Paso Robles Formation. Wells in this area can produce up to 1,000 gpm. Groundwater recovery wells may have to be dispersed over a large area to reduce the impacts of recovery operations on existing groundwater users.
4.2.3.1 Hydrogeologic Setting
The aquifer system in the Estrella Subarea averages about 700 feet of thickness with an 8 percent specific yield resulting in an estimated groundwater storage capacity of about 8.8 million acre-feet. This area has a two-layered aquifer system, with the shallow alluvial aquifer system overlying the Paso Robles Formation. Groundwater quality is generally good east of the Salinas River; however, elevated nitrate levels are present in some areas.
In the area of potential in-lieu recharge opportunities along Highway 46, the Paso Robles Formation consists of interbedded sand and gravel zones with clay beds that retard vertical percolation of groundwater. The direct recharge potential appears to be limited in this area because of the prevalence of clay interbeds, relatively low conductivity of the near-surface soils, and the thin to nil alluvial cover.
The Salinas River aquifer is a Recent-age younger alluvium comprised of stream channel and flood plain sediments deposited by the Salinas River. The thickness of the alluvium varies but is typically 75 to 100 feet thick in the potential direct recharge area. Short-term specific capacities at discharge rates of 1,000 gpm range from 20 to 60 gpm per foot of drawdown, with transmissivity values of about 100,000 gallons per day per foot of aquifer.
Well production yields in the Salinas River alluvium typically range from 800 gpm to as high as 1200 gpm. Well yields in the Paso Robles Formation in the Estrella area vary widely, but average about 500 to 800 gpm.
Water levels in wells in the Estrella area have exhibited severe declines over the past 25 years, through a combination of the presence of older, less permeable sediments along with localized increased water demand in the area. Water level declines have been noted in wells in the area ranging from 50 feet to as high as 200 feet.
Groundwater flows into the Estrella area from the north and northeast, from the east from Shandon and the San Juan Creek area, and from the south out of the Huerhuero Creek drainage. Along the Salinas River, groundwater flow follows the river drainage northward across the western portion of the basin towards the basin outlet.
4-13

4-14
Groundwater quality in the Estrella area is generally good, with TDS concentrations ranging from 400 to 700 mg/L, chlorides in the range of 50 to 80 mg/L, and nitrates generally below 40 mg/L. In the area of potential in-lieu recharge opportunities, water quality trends are relatively stable.

5 Hydrogeologic Evaluation
This section describes the results of the hydrogeologic evaluation of the recharge and water banking scenarios using a numerical groundwater flow model previously developed for the Paso Robles Groundwater Basin.
5.1 Model Background Information The groundwater flow model used in this study to evaluate the recharge and water banking scenarios was previously developed for the County of San Luis Obispo Public Works Department by Fugro West, Inc. and ETIC Engineering (Fugro, 2005). The numerical groundwater model was developed in MODFLOW-2000 using the Groundwater Vistas graphical-user-interface for MODFLOW. The function of the model was to simulate groundwater level and storage changes in the Paso Robles Groundwater Basin for the 17-year simulation period representing the 1981 through 1997 historical period. In that study, the model was further adapted to evaluate three different scenarios of future water supply and demand in the Paso Robles Groundwater Basin.
The aquifer system in the Paso Robles Groundwater Basin is simulated in the groundwater flow model using four model layers.
Model layer 1 represents the highly permeable unconfined, coarse-grained alluvial sediments associated with the channel corridors of the Salinas River and the Estrella River. Alternative 3 includes direct recharge into this layer.
Model layer 2 represents the less permeable channel bed of the Salinas River and a low permeable fine-grained unit that underlies the modeled extent of the Estrella River and also extends to the north and south of the Estrella River by approximately three to four miles in each direction. None of the simulated alternatives include direct recharge into this layer.
Model layers 3 and 4 represent the upper and lower portions of the confined to semi-confined Paso Robles Formation. Alternatives 1 and 2 include direct recharge into this layer. The project pumping associated with the groundwater recovery operations occur in these model layers.
Reductions in groundwater pumping resulting from the in-lieu recharge operations were assigned to the individual model layer where the pumping occurs.
5-1

The model calculates the changes in groundwater levels and groundwater storage in each layer over the 17-year base period. Each year in the base period was divided into two 6-month stress periods, resulting in a total of 34 stress periods over the 17 years. The stress period concept implies that the modeled groundwater recharge and discharge stresses have constant rates of application during each 6-month stress period. Although the rates are constant in time during a given stress period, the stresses may and often do vary spatially during the same stress period. The different recharge and discharge stresses frequently change from stress period to stress period. In the model, the recharge stresses included: 1) subsurface inflows, 2) percolation of precipitation, 3) streambed percolation, 4) percolation of irrigation water, and 5) percolation of wastewater discharge. Conversely, the discharge stresses included: 1) subsurface outflows; 2) urban, agricultural, and domestic groundwater pumping; 3) discharges to streams; and 4) extraction by phreatophytes.
5.2 Evaluation Criteria Numerical evaluation of the recharge and water banking scenarios was performed by comparing the simulated groundwater levels, groundwater storage changes, and groundwater mass balance components (i.e., other recharge and discharge stresses) against those generated by the Baseline Condition. Other mass balance components include changes to evapotranspiration losses, stream flows, and subsurface flows through the boundary conditions caused by the recharge and water banking scenarios.
Finally, the efficiency of the recharge and water banking scenarios was evaluated by comparing the simulated volumes of recharge retained in the aquifer system under the various alternatives to the amounts of recharge actually implemented according to the recharge and water banking schedules.
5.3 Baseline Condition In the groundwater modeling study performed for the Paso Robles Groundwater Basin (Fugro, 2005), Scenario 2 of that study was referred to as the “Build-Out Scenario.” The Build-Out Scenario evaluated the future impacts on basin groundwater resources of urban build-out and maximum reasonable agricultural water demand, which increases basin-wide groundwater pumping by about 33,000 acre-feet per year. The groundwater flow model that simulated the Build-Out Scenario is the same model that is used in this study to evaluate the recharge and water banking scenarios for the three alternatives. The simulated groundwater levels and storage changes from the original Build-Out Scenario were used as the baseline conditions (i.e., Baseline Condition) for this study for comparison of the impacts of the recharge and water banking scenarios. The Baseline
5-2

5-3
Condition, therefore, represents the future scenario in which no recharge operations and no water banking operations are implemented in the Paso Robles Groundwater Basin.
The annual agricultural groundwater pumping demand for the Baseline Condition is assumed to be constant over the 34 stress periods. For each year, the total annual agricultural pumping demand is divided between the Fall-Winter stress period and the Spring-Summer stress period. Since the Spring-Summer stress period coincides with the predominant portion of the crop-growing season during which agricultural water demands are greatest during the year, the pumping rate for the Spring-Summer stress period is always greater than the Fall-Winter stress period.
5.4 Simulation of Recharge and Water Banking Operations The modifications to the Baseline Condition to account for recharge and recovery operations evaluated in the groundwater modeling are shown in Figure 3-1.
The recharge operations (i.e., direct recharge plus in-lieu recharge) are applied during the active recharge stress periods numbered 7 to 10, 13 to 18, 25 to 26, and 29 to 34. Direct recharge was implemented in model layer 4 in Alternatives 1 and 2, and in model layer 1 in Alternative 3. The in-lieu recharge potential for these areas occurs at specific wells within the model for each alternative. The in-lieu recharge was implemented in model layer 4 for all three alternatives. For these active recharge stress periods, pumping from these agricultural wells was disabled in the model simulations and the water demands for those agricultural areas were assumed to be met with available SWP water. During the stress periods when recharge was not active, agricultural pumping in the wells associated with the in-lieu recharge areas is once again active in the model. The total amount of agricultural pumping demand in the in-lieu recharge areas for each stress period was subtracted from the 9,000 acre-feet of available SWP water for recharge operations. The remainder of the 9,000 acre-feet of SWP water is assumed to be available for direct recharge. The allotments of direct recharge and in-lieu recharge for each alternative are presented in Table 5-1.
During water banking operations, recharge operations and recovery operations do not occur during the same stress periods, but vary according to the water banking schedule shown in Figure 3-1 and Table 5-1. Recovery wells for each alternative were located to maximize the recovery of the recharged water while being no less than 2,500 feet from the nearest modeled urban, agricultural, or domestic well. Each recovery well is screened only in model layer 4 (i.e., the Paso Robles Formation), the layer where most of the existing active wells currently produce.

5-4
Table 5-1 Summary of Groundwater Model Input Data

5.5 Model Implementation and Results This section describes the application of the groundwater model to each alternative, and presents the resulting changes to the groundwater conditions compared to the Baseline Conditions.
5.5.1 Alternative 1 – Shell Creek/Camatta Creek and Lower San Juan Creek Recharge Areas
5.5.1.1 Alternative 1a: Recharge-Only Scenario
Alternative 1a involves the implementation of the recharge-only schedule in the Shell Creek/Camatta Creek and Lower San Juan Creek recharge areas shown in Figure 4-2. The southern site is located in the Shell Creek/Camatta Creek area and the northern site is located in the Lower San Juan Creek area. Preliminary model simulations of Alternative 1a indicated that the northern site would be inappropriate for recharge-only operations due to the existence of the semi-confining to confining layer. Consequently, all of the water available for direct recharge was directed to the southern recharge site (i.e., Shell Creek/Camatta Creek).
As shown on Table 5-1, the total in-lieu recharge potential for the Fall-Winter and Spring-Summer stress periods in Alternative 1 are 413 and 2,340 acre-feet, respectively, or 4.6 percent and 26 percent of the 9,000 acre-feet of water available for recharge during active recharge stress periods. The remaining water available for direct recharge during the Fall-Winter and Spring-Summer stress periods in Alternative 1 was 8,587 and 6,660 acre-feet, respectively.
Direct recharge in the southern area of Alternative 1 was implemented in 18 grid cells in model layer 4, for a total recharge area of 180 acres (i.e., 10 acres per grid cell).
The model results comparing the changes in groundwater levels and storage between Alternative 1a and the Baseline Condition following stress periods 18, 24, and 34 are shown in Figure 5-1. Direct recharge in the southern area resulted in groundwater levels in the range of 50 to 100 feet higher than would otherwise be observed without the recharge project. As expected, the increased groundwater levels are centered about the recharge cells corresponding to the southern recharge site and decrease radially away from the recharge areas. The decrease in the groundwater levels between stress period 18 and stress period 24 reflects the dissipation of the recharged water into the aquifer system towards the Baseline Condition groundwater levels during this 3-year period in which recharge was not active. The subsequent increase in groundwater levels in Alternative 1a relative to the Baseline Condition from stress period 24 to stress period 34 reflects the active recharge operations from stress periods 25 to 26 and stress periods 29 to 34.
5-5

Figure 5-1 Modeling Results for Alternative 1A
5-6

The Change in Groundwater Storage Graph presented in Figure 5-1 shows the effect of Alternative 1a on the Baseline Condition, and the response of groundwater storage to the seasonal and annual fluctuations of the 17-year simulation period (34 stress periods).
The Cumulative Change in Groundwater Storage Graph for Alternative 1a has a similar shape and magnitude to the recharge-only schedule curve that is also displayed in Figure 5-1, demonstrating that much of the recharged water remains in the basin as groundwater storage. Of the total recharge amount of 162,000 acre-feet implemented over the 34 stress periods, approximately 131,400 acre-feet (about 81 percent) of this amount is reflected in increased groundwater storage (Table 5-2).
The remaining 30,600 acre-feet (about 19 percent) of the recharged water discharges from the aquifer system to the stream network and leaves the area as stream outflow (Figure 5-1 and Table 5-2). Increases in evapotranspiration losses and subsurface outflows through the boundary conditions relative to the Baseline Condition were not significant for Alternative 1a.
Table 5-2 Summary of Groundwater Modeling Results at End of Simulation Period
5.5.1.2 Alternative 1b: Water Banking Scenario
Alternative 1b involves the implementation of the water banking schedule (Figure 3-1) in and around the southern recharge site in the Shell Creek/Camatta Creek area (Figure 4-2). The water banking schedule includes both direct and in-lieu recharge operations according to the recharge schedule used for Alternative 1a as well as recovery operations during stress periods when recharge operations are not active (see Table 5-1 and Figure 3-1). The recharge operations for Alternative 1b are identical to those implemented in Alternative 1a.
5-7

5-8
For Alternative 1b, a total of eight recovery wells were implemented in the model with a combined extraction rate of 9,000 acre-feet per stress period (i.e., 1,500 acre-feet per month for six months) for stress periods when recharge operations are active.
Maps displaying the differences between Alternative 1b and the Baseline Condition in simulated groundwater levels in model layer 4 following stress periods 18, 24, and 34, are presented in Figure 5-2. At the end of stress period 18 after a three-year recharge operation, regional groundwater levels in Alternative 1b were as high as 50 to 100 feet more than would otherwise be observed if there were no recharge project.
At the end of stress period 24 after a three-year recovery-only operation, the differences in groundwater levels between Alternative 1b and the Baseline Condition ranged from 100 feet lower to 25 feet higher than would otherwise be observed without the recharge and recovery project (Figure 5-2). After stress period 24, groundwater levels in Alternative 1b were generally less than those of the Baseline Condition in the vicinity of the recovery well field; however, groundwater levels for Alternative 1b remained higher in other areas near the recharge site where recovery wells were not present. At the end of stress period 34 after another three-year recharge operation, the differences in groundwater levels between Alternative 1b and the Baseline Condition ranged from about equal to the Baseline Condition (i.e., no overall groundwater level increase or decline) to as much as 100 feet higher than would otherwise be observed without the project (Figure 5-2).
Generally, groundwater level differences after stress period 34 were similar to those differences following stress period 24. Overall, the highest positive differences in groundwater levels for Alternative 1b over the Baseline Condition occurred after the three-year recharge operations (i.e., stress periods 13 to 18 and stress periods 29 to 34); while the highest negative differences occurred after the three-year recovery operation (i.e., stress periods 19 to 24).
A plot of the increase in groundwater storage for Alternative 1b above the Baseline Condition over the 34 stress periods is also presented in Figure 5-2. The cumulative storage change curve over the 34 stress periods is similar in shape to the water banking schedule curve that is also displayed in Figure 5-2. At the end of stress period 34, the water banking operation had extracted 90,000 acre-feet of groundwater; groundwater storage had increased by about 55,900 acre-feet above the Baseline Condition; and 16,100 acre-feet of groundwater above the Baseline Condition discharged to the stream network and left the basin as stream outflow, as shown on Table 5-2 (i.e., 90,000 + 55,900 + 16,100 = 162,000 acre-feet of total recharge over the 34 stress periods, according to the recharge schedule).

Figure 5-2 Modeling Results for Alternative 1B
5-9

Increases in evapotranspiration losses and subsurface outflows through the boundary conditions relative to the Baseline Condition were not significant for Alternative 1b.
5.5.2 Alternative 2 - Creston Recharge Area
5.5.2.1 Alternative 2a: Recharge-only Scenario
Alternative 2a involves the implementation of the recharge-only schedule in the Creston recharge area (Figure 4-3). The allotments of direct recharge and in-lieu recharge for each stress period are presented in Table 5-1. The total in-lieu recharge potentials for the Fall-Winter and Spring-Summer stress periods in Alternative 2 are 65 and 370 acre-feet, respectively, or 0.7 percent and 4 percent of the 9,000 acre-feet of water available for recharge during active recharge stress periods. The remaining water available for direct recharge during the Fall-Winter and Spring-Summer stress periods in Alternative 2 was 8,935 and 8,630 acre-feet, respectively.
Direct recharge in the Creston area was implemented in 9 grid cells in model layer 4, for a total recharge area of 90 acres (i.e., 10 acres per grid cell). Maps displaying the differences in simulated groundwater levels in model layer 4 between Alternative 2a and the Baseline Condition following stress periods 18, 24, and 34 are presented in Figure 5-3. Direct recharge in the Creston Area resulted in significant increases in groundwater levels that would likely result in either water ponding at the ground surface or artesian conditions in some wells. As expected, the increased groundwater levels are centered about the recharge cells corresponding to the Creston recharge area and decrease in the northern direction away from these recharge cells (Figure 5-3).
As with Alternative 1a, the decrease in the groundwater level rise between stress period 18 and stress period 24 reflects the recovery of the aquifer system towards the Baseline Condition groundwater levels during this three-year period in which recharge was not active. The subsequent increase in groundwater levels in Alternative 2a relative to the Baseline Condition from stress period 24 to stress period 34 reflects again the active recharge operations from stress periods 25 to 26 and stress periods 29 to 34.
The Change in Groundwater Storage Graph presented in Figure 5-3 shows the effect of Alternative 2a on the Baseline Condition, and the response of groundwater storage to the seasonal and annual fluctuations of the 17-year simulation period (34 stress periods).
The Cumulative Change in Groundwater Storage Graph for Alternative 1a has a similar shape and magnitude to the recharge-only schedule curve that is also displayed in Figure 5-3, demonstrating that much of the water recharged remains in the basin as groundwater storage. Of the total recharge amount of 162,000 acre-feet implemented
5-10

Figure 5-3 Modeling Results for Alternative 2A
5-11

over the 34 stress periods, approximately 45,900 acre-feet (about 28 percent) of this amount is reflected in increased groundwater storage (Table 5-2).
The remaining 114,800 acre-feet (about 71 percent) of the recharged water discharges from the aquifer system to the stream network and leaves the area as stream outflow (Figure 5-3 and Table 5-2). Increases in evapotranspiration losses and subsurface outflows through the boundary conditions relative to the Baseline Condition were not significant for Alternative 2a.
5.5.2.2 Alternative 2b: Water Banking Scenario
Alternative 2b involves the implementation of the water banking schedule (Figure 3-1) in and around the Creston recharge area (Figure 4-3). The water banking schedule includes both direct and in-lieu recharge operations according to the recharge schedule used for Alternative 2a, as well as recovery operations during stress periods when recharge operations are not active. The recharge operations for Alternative 2b are identical to those implemented in Alternative 2a. In the water banking scenario, recharge operations and recovery operations do not occur during the same stress periods but instead alternate according to the water banking schedule.
For Alternative 2b, a total of 33 recovery wells were implemented in the model, with a combined extraction rate of 9,000 acre-feet per stress period (i.e., 1,500 acre-feet per month for six months). The locations of the recovery wells are displayed in Figure 5-4. In the model, four recovery wells were placed just east of the grid cells representing the Creston recharge area, one was placed to the west of the recharge cells, and the remaining 29 recovery wells were placed north of these recharge grid cells in the down-gradient direction. The recovery wells were placed in and around the area in which significant groundwater level rises were observed in Alternative 2a following stress periods 18 and 34 (Figure 5-4).
Plan view maps displaying the differences in simulated groundwater levels in model layer 4 between Alternative 2b and the Baseline Condition following stress periods 18, 24, and 34 are presented in Figure 5-4. At the end of stress period 18, groundwater levels were significantly higher than the Baseline Condition, which would likely result in either ponding at the ground surface or artesian conditions in some wells.
At the end of stress period 24, the recovery effects would likely result in groundwater levels several tens of feet lower than would otherwise be observed without the recharge and recovery project.
At the end of stress period 34, the groundwater levels would likely recover in the southern portion of the area where direct recharge occurs, but water levels would still be
5-12

Figure 5-4 Modeling Results for Alternative 2B
5-13

significantly lowered in the northern and eastern part of the area as a result of the earlier groundwater recovery operations.
Generally, groundwater level differences after stress period 34 were similar to those differences following stress period 24 in and around the immediate recharge area. However, groundwater levels further north from the recharge area after stress period 34 had not recovered to the levels experienced after the three-year recharge period following stress period 18. Overall, the highest positive differences in groundwater levels for Alternative 2b over the Baseline Condition occurred after the three-year recharge operations (i.e., stress periods 13 to 18 and stress periods 29 to 34) in the immediate Creston recharge area, while moderate negative differences persisted elsewhere at the end of the 34 stress periods due to delayed recovery of groundwater levels.
A plot of the increase in groundwater storage for Alternative 2b above the Baseline Condition over the 34 stress periods is also presented in Figure 5-4. The cumulative storage change curve over the 34 stress periods bears a similar shape to the water banking schedule curve, although the two curves diverge significantly by the end of the 34 stress periods because of the continued loss of recharge water in the streams and the inability of the aquifer to absorb the volume of the recharge project. At the end of stress period 34, the water banking operation had extracted 90,000 acre-feet of groundwater; groundwater storage had decreased by 3,900 acre-feet below the Baseline Condition; and 77,300 acre-feet of groundwater above the Baseline Condition discharged to the stream network and left the area as stream outflow. Increases in evapotranspiration losses and subsurface outflows through the boundary conditions relative to the Baseline Condition were not significant for Alternative 2b.
5.5.3 Alternative 3 - Salinas River/Highway 46 Recharge Area
5.5.3.1 Alternative 3a: Recharge-Only Scenario
Alternative 3a involves the implementation of the recharge-only schedule in the Salinas River/Highway 46 recharge area (Figure 4-4). The allotments of direct recharge and in-lieu recharge for each stress period are presented in Table 5-1. The total in-lieu recharge potential for the Fall-Winter and Spring-Summer stress periods in Alternative 3 are 926 and 4,818 acre-feet, respectively, or 10 percent and 54 percent of the 9,000 acre-feet of water available for recharge during active recharge stress periods. The remaining water available for direct recharge during the Fall-Winter and Spring-Summer stress periods in Alternative 3 was 8,074 and 4,182 acre-feet, respectively. Direct recharge in the Salinas River/Highway 46 area was implemented in 9 grid cells in model layer 1, for a total recharge area of 90 acres (i.e., 10 acres per grid cell).
5-14

5-15
The model results comparing the changes in groundwater levels and storage between Alternative 3a and the Baseline Condition are shown in Figure 5-5 for layer 4 and Figure 5-6 for layer 1.
In general, the highest groundwater level increases in model layer 4 are centered about the Salinas River recharge cells and the in-lieu recharge areas to the northwest, and decrease radially away from the middle regions of these areas (Figure 5-5). As with Alternatives 1a and 2a, the decrease in the groundwater level rise between stress period 18 and stress period 24 reflects the recovery of the aquifer system towards the Baseline Condition groundwater levels during this three-year period in which recharge was not active. The subsequent increase in groundwater levels in Alternative 3a relative to the Baseline Condition from stress period 24 to stress period 34 reflects again the active recharge operations from stress periods 25 to 26 and stress periods 29 to 34.
A plot of the increase in groundwater storage for Alternative 3a (layer 1 and layer 2) above the Baseline Condition over the 34 stress periods is also presented in Figure 5-5. The cumulative storage change curve retains a similar shape to the recharge-only schedule curve over the 34 stress periods. The impacts of Alternative 3a on stream outflow and overall groundwater storage relative to the Baseline Condition are presented in Table 5-2.
Of the total recharge amount of 162,000 acre-feet implemented over the 34 stress periods, approximately 78,000 acre-feet (about 48 percent) of this amount is reflected in increased groundwater storage (Figure 5-5). Direct recharge in the Salinas River alluvium resulted in groundwater level increases above the Baseline Condition of 25 to 50 feet following both stress periods 18 and 34 (Figure 5-6). Subsequently, the remaining 83,900 acre-feet of the recharge discharges from the alluvium to the stream network and leaves the area as stream outflow. As with Alternatives 1a and 2a, increases in subsurface outflows through the boundary conditions relative to the Baseline Condition were not significant for Alternative 3a.
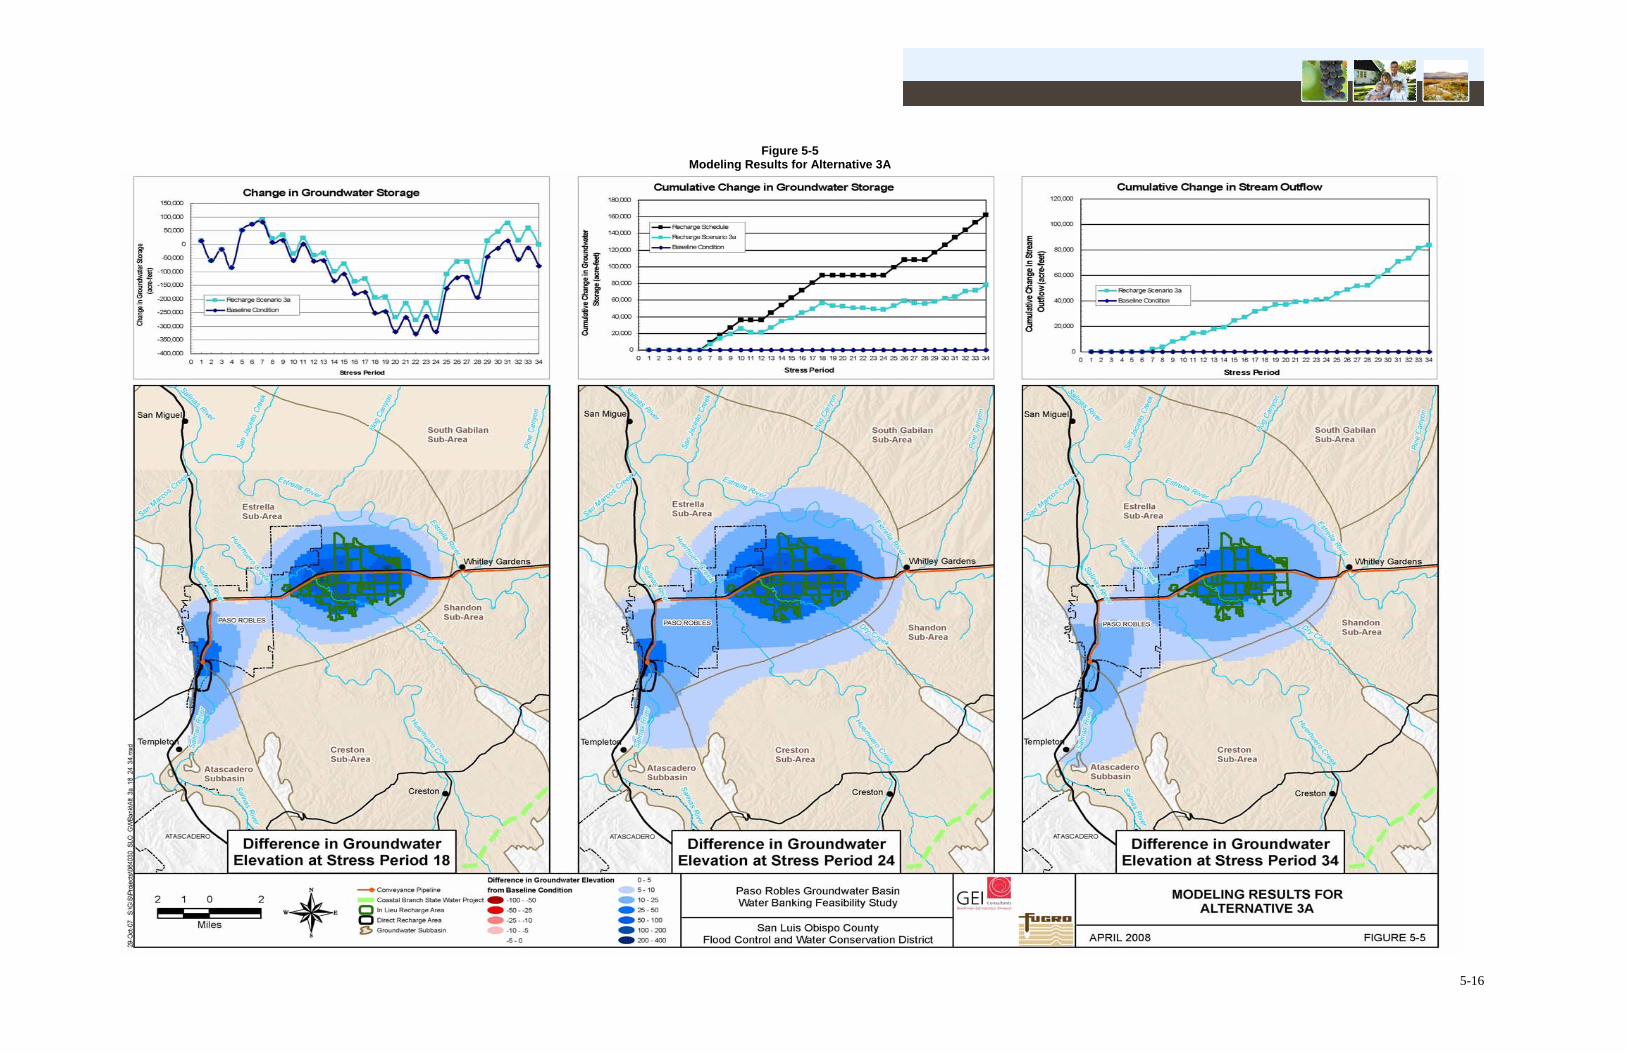
Figure 5-5 Modeling Results for Alternative 3A
5-16

5-17
Figure 5-6 Modeling Results for Alternative 3A, Layer 1

5.5.3.2 Alternative 3b: Water Banking Scenario
Alternative 3b involves the implementation of the water banking schedule (Figure 3-1) in and around the Salinas River/Highway 46 recharge area (Figure 4-4). The water banking schedule includes both direct and in-lieu recharge operations according to the recharge schedule used for Alternative 3a, as well as recovery operations during stress periods when recharge operations are not active (see Table 5-1 and Figure 5-7). The recharge operations for Alternative 3b are identical to those implemented in Alternative 3a. In the water banking scenario, recharge operations and recovery operations do not occur during the same stress periods but instead alternate according to the water banking schedule shown in Figure 3-1 and Table 5-1.
For Alternative 3b, a total of 17 recovery wells were implemented in the model with a combined extraction rate of 9,000 acre-feet per stress period (i.e., 1,500 acre-feet per month for six months) for stress periods when recharge operations are active. The locations of the recovery wells are displayed in Figure 5-7. The 13 recovery wells in the Salinas River recharge area accounted for 87 percent of the total extraction rate of 9,000 acre-feet per stress period and the 4 recovery wells placed in the in-lieu recharge area accounted for the remaining 13 percent of the total extraction.
Maps displaying the differences in simulated groundwater levels in model layer 4 between Alternative 3b and the Baseline Condition following stress periods 18, 24, and 34 are presented in Figure 5-7. At the end of stress period 24, water levels in the in-lieu area would approach the levels expected in the Baseline Condition. However, as noted previously, only 13 percent of the total recovery extraction occurs in the four recovery wells associated with the in-lieu recharge area, subsequently mitigating the drawdown of groundwater levels during recovery periods. Groundwater levels in the Salinas River Area, however, would likely be depressed and might reflect a condition where not all of the water could be recovered due to declining water levels.
At the end of stress period 34 the difference in groundwater levels would again increase significantly because of the direct and in-lieu recharge programs. Generally, groundwater level differences in and around both the Salinas River recharge area and the in-lieu recharge area after stress period 34 were similar to those following stress period 24. Groundwater levels further north from the Salinas River recharge area have not completely recovered after stress period 34 to the levels experienced after the three-year recharge period following stress period 18 (Figure 5-7). Overall, the highest positive differences in groundwater levels for Alternative 3b over the Baseline Condition occurred after the three-year recharge operations (i.e., stress periods 13 to 18 and stress periods 29 to 34) in the in-lieu recharge area, with moderate positive differences occurring around the Salinas River recharge area.
5-18

Figure 5-7 Modeling Results for Alternative 3B
5-19

A plot of the increase in groundwater storage for Alternative 3b above the Baseline Condition over the 34 stress periods is also presented in Figure 5-7. Overall, the cumulative storage change curve for Alternative 3b retains a similar shape to the water banking schedule curve over the 34 stress periods (Figure 5-6). At the end of stress period 34, the water banking operation had extracted 90,000 acre-feet of groundwater; groundwater storage had increased by 49,700 acre-feet above the Baseline Condition; and 22,400 acre-feet of groundwater above the Baseline Condition discharged to the stream network and left the basin as stream outflow. Increases in evapotranspiration losses and subsurface outflows through the boundary conditions relative to the Baseline Condition were not significant for Alternative 3b.
5.6 Summary of Hydrogeologic Feasibility Analysis The recharge and water banking scenarios were simulated in the three alternative areas using the numerical groundwater model by implementation of the recharge and recovery schedules presented in Figure 3-1. The impacts of these scenarios were evaluated by comparing their results against those of the Baseline Condition (i.e., the “no action” scenario of no recharge and no recovery operations in the same 34 stress periods). For the recharge-only scenarios (i.e., Alternatives 1a, 2a, and 3a), a total of 162,000 acre-feet of SWP water was applied over the 34 stress periods. For each stress period in which recharge operations were active, a total of 9,000 acre-feet of SWP water was applied as either direct recharge in the simulated pond areas or as in-lieu recharge in agricultural areas identified as having in-lieu recharge potential. For the water banking scenarios (i.e., Alternatives 1b, 2b, and 3b), 162,000 acre-feet of SWP water was also applied over the 34 stress periods according to the recharge-only schedule and a total of 90,000 acre-feet of groundwater was recovered (via extraction wells) according to the water banking schedule (Figure 3-1). The impacts on basin groundwater levels and storage from the recharge and water banking operations in the three alternative areas relative to the Baseline Condition were presented in Figures 5-1 through 5-7 and Tables 5-1 and 5-2. The overall results of the recharge and water banking scenarios summarized in Table 5-2 are discussed below.
5.6.1 Summary of Recharge Alternatives
Over the 34 stress periods of the model simulation period, a total of 162,000 acre-feet of SWP water was recharged in each of Alternatives 1a, 2a, and 3a. Relative to the Baseline Condition, the 162,000 acre-feet of recharge in each alternative resulted in measurable changes in groundwater storage and stream outflows. Recharge losses from the aquifer system due to evapotranspiration losses, subsurface flows across constant head boundaries, and subsurface flows across general-head boundaries were relatively insignificant in comparison. Recharge impacts on these groundwater mass balance
5-20
components differed between alternatives as a function of their differing local aquifer characteristics (e.g., layer thicknesses, hydraulic conductivities); proximity of direct recharge areas to local streams; existing groundwater pumping operations in each area; locations of in-lieu recharge areas relative to direct recharge areas; and distribution of recharge between direct recharge and in-lieu recharge.
Of the 162,000 acre-feet of SWP water recharged in Alternative 1a, groundwater storage increased by 131,400 acre-feet (about 81 percent), stream outflows increased by 30,600 acre-feet (about 29 percent), and increased losses through evapotranspiration and other boundary conditions were negligible (less than 1 percent). For Alternative 2a, groundwater storage increased by 45,900 acre-feet (about 28 percent); stream outflows increased by 114,800 acre-feet (about 71 percent); and increased losses through evapotranspiration, constant-head boundaries, and general-head boundaries were about 1,400 acre-feet (about 1 percent). For Alternative 3a, groundwater storage increased by 78,000 acre-feet (about 48 percent); stream outflows increased by 83,900 acre-feet (about 52 percent); and increased losses through evapotranspiration, constant-head boundaries, and general-head boundaries were negligible (less 1 percent). Overall, Alternative 1a retained the greatest volume of recharge in groundwater storage at the end of the 34 stress periods, followed by Alternative 3a, and then by Alternative 2a (Figure 5-8). For each of the Alternatives 1a, 2a, and 3a, the most significant losses of groundwater in the system resulting from recharge-only operations are due to stream outflows in the basin. As shown in Figure 5-9, Alternatives 2a and 3a had the greatest losses to stream outflows. Losses of groundwater resulting from the recharge-only operations through evapotranspiration, constant-head boundary conditions, and general-head boundary conditions were relatively minor.
5-21

Figure 5-8 - Cumulative Change in Groundwater Storage
0
20,000
40,000
60,000
80,000
100,000
120,000
140,000
160,000
180,000
0 1 2 3 4 5 6 7 8 9 10 11 12 13 14 15 16 17 18 19 20 21 22 23 24 25 26 27 28 29 30 31 32 33 34
Stress Period
Cum
ulat
ive
Chan
ge in
Gro
undw
ater
S
tora
ge (a
cre-
feet
)
Recharge ScheduleRecharge Scenario 1aRecharge Scenario 2aRecharge Scenario 3aBaseline Condition
Figure 5-9- Cumulative Change in Stream Outflow
0
20,000
40,000
60,000
80,000
100,000
120,000
0 1 2 3 4 5 6 7 8 9 10 11 12 13 14 15 16 17 18 19 20 21 22 23 24 25 26 27 28 29 30 31 32 33 34
Stress Period
Cum
ulat
ive
Chan
ge in
Stre
am
Out
flow
(acr
e-fe
et)
Recharge Scenario 1a
Recharge Scenario 2a
Recharge Scenario 3a
Baseline Condition
5-22

In each alternative, direct recharge in ponds close to local streams no doubt resulted in greater stream flow losses than if the ponds were located in areas away from streams. Losses through stream outflows for Alternative 3a were likely mitigated during the Spring-Summer stress periods when recharge operations were active due to the high allocation of SWP water (54 percent) to in-lieu recharge in the area northeast of the Salinas River/Highway 46 direct recharge site. Relatively high in-lieu recharge allocations of SWP water (26 percent) for Alternative 1a during the Spring-Summer stress periods may have also mitigated against greater stream outflow losses in that area. However, for Alternative 2a, where stream outflows were highest amongst the three alternatives, in-lieu recharge accounted for only 4 percent of the total recharge during the Spring-Summer stress periods when recharge operations were active.
These results suggest that both the location of direct recharge sites and the amount of in-lieu recharge significantly impact the amount of recharge that is retained within groundwater storage.
5.6.2 Summary of Water Banking Alternatives
Over the 34 stress periods of the model simulation period, a total of 162,000 acre-feet of SWP water was recharged in each of the Alternatives 1b, 2b, and 3b, and a total of 90,000 acre-feet of groundwater was also recovered in each. Consequently, a net recharge amount of 72,000 acre-feet (i.e., 162,000 acre-feet of recharge minus 90,000 acre-feet of recovery) was added to the basin over the 34 stress periods. As with the recharge-only scenario, recharge and recovery impacts on the groundwater mass balance components differed between alternatives as a function of a variety of physical and operational differences.
Of the 72,000 acre-feet of net recharge in Alternative 1b, groundwater storage increased by 55,900 acre-feet, stream outflows increased by 16,100 acre-feet, and changes in evapotranspiration losses and other boundary condition flows were negligible. For Alternative 2b, groundwater storage decreased by 3,900 acre-feet, stream outflows increased by 77,300 acre-feet, constant-head boundary inflows increased by about 1,400 acre-feet, and evapotranspiration losses and flows across general-head boundaries were negligible. For Alternative 3b, groundwater storage increased by 49,000 acre-feet, stream outflows increased by 22,400 acre-feet, constant-head boundary inflows increased by about 100 acre-feet, and evapotranspiration losses and flows across general-head boundaries were negligible.
The implementation of recovery operations in Alternatives 1b and 3b resulted in more similar groundwater storage increases at the end of the 34 stress periods between them than under the recharge-only operations. In other words, implementation of recovery
5-23

operations significantly reduced the amount of losses through stream outflows in comparison to stream flow losses experienced under the recharge-only operations of Alternatives 1a and 3a. For the water banking scenario, stream flow losses in Alternative 1 decreased from 30,700 acre-feet to 16,100 acre-feet, while stream flow losses in Alternative 3 decreased from 83,900 acre-feet to 22,393 acre-feet. Overall, groundwater storage increases in Alternative 1b were 55,900 acre-feet (78 percent of total net recharge) while storage increases in Alternative 3b were 49,700 acre-feet (69 percent of total net recharge). Under the recharge-only scenario, groundwater storage increases for Alternative 3a were only 48 percent of the 162,000 acre-feet of recharge versus 81 percent for Alternative 1a. Recharge and recovery operations for Alternative 2b actually resulted in a decrease in groundwater storage relative to the Baseline Condition after the 34 stress periods. For Alternative 2b, due to timing and the locations of the recharge operations, most of the recharge was lost from the area as stream outflow, and the extraction wells subsequently mined the “native” groundwater (i.e., groundwater storage prior to implementation of recharge) thereby reducing groundwater storage below the Baseline Condition levels.
Overall, Alternatives 1b and 3b yielded potentially favorable recharge and recovery results while Alternative 2b performed relatively poorly based on changes in groundwater storage (Figure 5-10) and changes in stream outflow (Figure 5-11). The success of a recharge and recovery program is dependent on the timing, location, and magnitude of application of the recharge. As with the recharge-only scenario, the use of in-lieu recharge can significantly mitigate against the losses of recharge from the system through streams and other boundary conditions located in proximity to the direct recharge sites.
5-24

Figure 5-10 - Cumulative Change in Groundwater Storage
-40,000
-20,000
0
20,000
40,000
60,000
80,000
100,000
120,000
140,000
160,000
180,000
0 1 2 3 4 5 6 7 8 9 10 11 12 13 14 15 16 17 18 19 20 21 22 23 24 25 26 27 28 29 30 31 32 33 34
Stress Period
Cum
ulat
ive
Cha
nge
in G
roun
dwat
er
Stor
age
(acr
e-fe
et)
Water Banking ScheduleWater Banking Scenario 1bWater Banking Scenario 2bWater Banking Scenario 3bBaseline Condition
Figure 5-11 - Cumulative Change in Stream Outflow
0
20,000
40,000
60,000
80,000
100,000
120,000
0 1 2 3 4 5 6 7 8 9 10 11 12 13 14 15 16 17 18 19 20 21 22 23 24 25 26 27 28 29 30 31 32 33 34
Stress Period
Cum
ulat
ive
Cha
nge
in S
trea
m O
utflo
w
(acr
e-fe
et)
Water Banking Scenario 1b
Water Banking Scenario 2b
Water Banking Scenario 3b
Baseline Condition
5-25

5-26
5.6.3 Findings and Recommendations
Based upon the hydrogeologic feasibility analysis completed as part of this analysis:
Alternative 1 appears to have adequate groundwater storage capacity and recharge and recovery capacity to support a water banking project. Additional analysis may be needed to refine project size and operations to reduce losses to the stream system and reduce the groundwater recovery impacts.
Alternative 2 does not appear to have adequate groundwater storage capacity and recharge and recovery capacity to support a water banking project
Alternative 3 appears to have adequate groundwater storage capacity and recharge and recovery capacity to support a water banking project. The in-lieu recharge component along Highway 46 west of Whitley Gardens appears to provide a considerable recharge opportunity. The direct recharge and recovery operations along the Salinas River may prove problematic because the interconnectivity of the alluvial deposits with the river may reduce the ability to recover the recharged water, resulting in the decline of groundwater levels in the main aquifer system as a result of increased pumping associated with the project. This area is also relied upon by existing municipal groundwater users.
Additional analysis may be needed to refine project operations in this portion of the basin to further investigate the benefit of in-lieu recharge opportunities in recharge or water banking operations. This may include reformulating these alternatives to minimize interaction with the Salinas River by increasing the in-lieu recharge along Highway 46 and/or exploring direct recharge opportunities along the Estrella River.

6 Engineering Evaluation and Cost Estimate
The modeling analysis described in Section 5 demonstrated the effectiveness of the alternatives. This section identifies the facilities needed to implement each alternative, and provides a cost estimate that can be used to determine the comparative cost-effectiveness of each of the alternatives.
6.1 Evaluation Criteria The engineering evaluation criteria identified in Section 4.1.2 included the following:
Water Supply Availability
Ability to Utilize Existing Infrastructure
Capital Cost and O&M Costs
All the alternatives evaluated utilized the same existing infrastructure to access the same SWP water supply available for recharge or water banking operations, so these criteria do not discriminate between the alternatives. The required facilities for an individual alternative were based on the project location (described in Section 4) and hydrogeologic evaluation (described in Section 5). The capital costs of the required project facilities and O&M costs for project implementation reflect the differences between alternatives, and were therefore used to provide the comparative evaluation between water banking alternatives.
6.2 Water Supply Availability The County SWP Table A contract amount totaling 25,000 acre-feet per year is the primary source of water for this project. This supply is highly variable, with water supply availability ranging from about 20 percent in 1977 to 100 percent in other years, with a long-term average of about 70 percent of the contract amount for SWP contractors south of the Sacramento-San Joaquin Delta. The hydrologic and water delivery uncertainty associated with the SWP supply is documented in past deliveries records and modeling of future operations as described in Section 2.3. Looking to the future, factors such as climate change, the integrity of the Sacramento-San Joaquin Delta levees, and the protection of threatened or endangered species may continue to affect water supply availability, and may reduce future SWP supply availability compared to past conditions. This uncertainty increases the need to have projects in place to fully utilize the SWP
6-1

6-2
supplies when they are available to improve overall water supply reliability and reduce dependence on SWP water in dry and critically dry years or when operations are curtailed.
For purposes of this analysis, the project deliveries of 1,500 acre-feet per month (18,000 acre-feet per year) were used to test the hydrogeologic feasibility of recharge and recovery operations, and determine the facility requirements and their associated costs. The project delivery rate was developed based on an evaluation of the long-term water supply reliability of the SWP supply provided by DWR and an evaluation of the existing commitments of the supply within the County. Table 6-1 shows the disposition of the SWP Table A contract water for the existing condition and six alternatives considered in this study for a 40-year period. The intended use of the available supplies are described below for the existing condition and the proposed project operations, but this does not reflect the results (change in groundwater storage) from the proposed project operations.

6-3
Calculation Existing Alt 1a Alt 1b Alt 2a Alt 2b Alt 3a Alt 3b
R1 Total SLOC Table A contract allocation Value 25,000 25,000 25,000 25,000 25,000 25,000 25,000
R2 Existing SLOC M&I water contractors allocation Value 4,830 4,830 4,830 4,830 4,830 4,830 4,830
R3 Existing SLOC M&I water contractors Drought Buffer Value 3,617 3,617 3,617 3,617 3,617 3,617 3,617
R4 Excess Allocation of SLOC Table A contract allocation R1-(R2+R3) 16,553 16,553 16,553 16,553 16,553 16,553 16,553
R5 Recharge Operations Value 0 18,000 18,000 18,000 18,000 18,000 18,000
R6 Recovery Operations Value 0 0 18,000 0 18,000 0 18,000
R7 Unused Water during Recharge Years R1-(R2+R5) 20,170 2,170 2,170 2,170 2,170 2,170 2,170
R8 M&I Deliveries Value 40 40 40 40 40 40 40
R9 Recharge Operations Value 26 26 26 26 26 26 26
R10 No Drought Buffer/Excess Allocation for Recharge Operations Value 14 14 14 14 14 14 14
R11 Recovery Operations Value 0 0 14 0 14 0 14
R12 SLOC M&I Water Contractors Deliveries R2*R8 193,200 193,200 193,200 193,200 193,200 193,200 193,200
R13 Drought Buffer (to ensure wet water delivey to M&I contractors) R3*R10 50,638 50,638 50,638 50,638 50,638 50,638 50,638
R14 Recharge Operations R5*R9 0 468,000 468,000 468,000 468,000 468,000 468,000
R15 Total Imported Supply (wet water) R12+R14 193,200 661,200 661,200 661,200 661,200 661,200 661,200
R16 Available Water of SLOC Table A contract amount (R1*R8)-(R12+R13+R14) 756,162 288,162 288,162 288,162 288,162 288,162 288,162
R17 40-Year Table A Contract Amount R13+R15+R16 1,000,000 1,000,000 1,000,000 1,000,000 1,000,000 1,000,000 1,000,000
R18 Recovery Operations R6*R11 0 0 252,000 0 252,000 0 252,000
Table 6-1 Disposition of Project Water for Recharge and Water Banking Alternatives
for a 40-Year Project Life
Annual Water Use (acre-feet per year)
Total Water Use (40-year totals in acre-feet)
Years of Operation

County M&I Water Contractors - The existing County M&I water contractors have a contract for 4,830 acre-feet per year. Over the 40-year project life, this totals 193,200 acre-feet. These deliveries are assumed to have the highest priority of the potential uses for the supply, and would be delivered prior to deliveries for recharge operations.
Drought Buffer - The existing County M&I water contractors have a drought buffer totaling 3,617 acre-feet per year. The drought buffer is used to ensure full delivery (up to 4,830 acre-feet per year) to the M&I water users in years when delivery amounts are reduced due to dry conditions.
For purposes of this analysis, it is assumed that the drought buffer would be requested in about 35 percent of years during the 40-year project life. No recharge operations take place during these years for the recharge alternatives. For the water banking alternatives, these years coincide with recovery operations (18,000 acre-feet per year). Over the 40-year project life, this totals 50,638 acre-feet. The drought buffer has the second-highest priority for the available SWP supply.
Excess Allocation – This represents the unused portion of the County’s SWP supply that is available for others to use. In most years, it is the difference between the contract amount and the actual deliveries to County M&I water contractors. The annual excess allocation is reduced by the amount of the drought buffer in years when the drought buffer is implemented.
The excess allocation represents water that is not imported into the basin. Over the 40-year project life, this totals 288,162 acre-feet. One of the goals of this project is to better utilize the County’s SWP supply, which can be described as minimizing the excess allocation.
Recharge Operations – This supply represents the water used for groundwater recharge operations in the Paso Robles Groundwater Basin. In the 65 percent of the years when recharge occurs, it totals 18,000 acre-feet per year. Over the 40-year project life, this totals 468,000 acre-feet. Recharge operations have the third priority for the SWP supply.
Recovery Operations – This supply represents the stored water recovered from the Paso Robles Groundwater Basin and returned to PPWTP for use outside the Basin. In the 35 percent of years when recovery operations occur (14 years), it totals 18,000 acre-feet per year. Over the 40-year project life, this totals 252,000 acre-feet.
6-4

6.3 Facility Requirements Water banking facilities were sized to accommodate 1,500 acre-feet per month of recharge and recovery. The main project facilities to implement a recharge or water banking project are listed below.
Conveyance Facilities - The conveyance facilities included the main project pipelines and pumping plants necessary to deliver raw water from PPWTP to the banking location(s) and return recovered water to the PPWTP for delivery to the end users outside of the Basin. The length of the main conveyance pipeline and the number of pumping plants varies for each of the three alternative locations.
Recharge Facilities - The recharge facilities vary by alternative based on the hydrogeologic conditions and the type and amount of in-lieu recharge. The land for the recharge basins, construction of the basins, and additional piping for distribution to the recharge basins are needed for direct recharge operations. Additional pipelines and connections to existing irrigation systems were included to deliver water to the selected agricultural areas for in-lieu recharge operations. The estimated number of recharge basins and agricultural in-lieu recharge acreage varies for each of the three alternative locations.
Recovery Facilities - Recovery facilities include the new wells and pipelines needed to extract the banked water and deliver it to the main conveyance pipeline described above. As described in Section 5, the wells were located to reduce the potential impact of recovery operations on existing wells and other recovery wells in the area. The number of recovery wells and associated collection systems varies for each of the three water banking alternatives.
6.4 Project Costs Assumptions The project costs were developed for each alternative for comparison purposes based on the facility requirements described in Section 6.3, the water supply available as described in Section 6.2, and the project cost assumptions described below. These cost assumptions were considered appropriate based on the detail level of project descriptions and operations. Project costs will be updated in future efforts and may include additional components such as power costs (to deliver recovered water to a specific banking partner) and potential treatment costs as project descriptions are refined and potential banking partners are identified.
6-5

6.4.1 Capital Project Costs Assumptions
Pipeline Costs - Pipeline costs were estimated based on information contained in the 2006 version of Means Heavy Construction Cost Data (Means) as adjusted from December 2005 to November 2006 costs by Engineering News Record (ENR) cost indices (December 2005 at 8462.45, November 2006 at 9123.64). In addition, the national averages published by Means have been adjusted to account for regional differences (Santa Barbara, CA, December 2005 at 7647 to November 20 06 at 7911). The installed cost equaled $211 per foot for ductile iron 30-inch-diameter pipe. Costs estimate includes right-of-way costs for pipeline.
Infiltration Basins - Infiltration basin cost opinions have also been developed through the use of Means. They are based on the use of 11 cubic yard, self-propelled scrapers with a maximum haul distance of 1,500 feet. The cost opinions include the use of a water truck and sheepsfoot roller for compacting berms after the soil is spread by the scrapers. Based on up to five acre basins up to four feet deep and all soil being placed locally, the Engineer’s opinion of cost per cubic yard, adjusted in the same manner as above, will be $5.32.
Recovery Wells - The cost opinions were based on wells estimated to be 16-inch diameter and up to 400 feet deep and producing 1,000 gpm. The well water-level drawdown was assumed to be 100 feet with an additional 50 feet of head loss per well pump, which equals an approximate 50 horsepower demand per well. The cost estimates for drilling and construction of water wells for extraction of banked water are based on local knowledge of well drilling and construction. Depending on local conditions, estimates range from $100,000 to $250,000 per well. For purposes of this analysis, well costs were estimated at $200,000 per well.
Collection System - The cost opinions for the collection system were the same as the pipeline costs described above. Each well was assumed to be connected directly to the main pipeline. The total length of the collection system pipeline was based on the number of wells and spacing requirements for the recovery well field. The collection system pipeline was based on 12-inch-diameter PVC pipe with a cost of $32 per foot.
Pumping Plants - The cost for pumping was based on a number of pumping plant estimates and actual construction costs from late 2003. These estimates were adjusted to November 2006 cost factors through the use of ENR cost indices as discussed above. The costs were based on pumping plants of up to 400 horsepower each. The cost equaled $2,500 per horsepower for a plant with open,
6-6
Neither contingencies nor state sales taxes have been included in the cost opinions above.
Contingencies and Administrative Costs – The following adjustments were made to the construction cost estimate:
o A 30 percent contingency was included in the construction cost estimate to account for the uncertainty associated with the project description and facility locations.
o Engineering and related costs were estimated at ten percent of the construction costs including contingencies.
o Costs associated with construction administration and inspections were estimated at two percent of the construction costs including contingencies.
o Project administration and legal costs were estimated at two percent of the construction costs including contingencies.
6.4.2 Operating Costs
The opinion of costs to operate a water banking facility was almost entirely based on power usage for mechanical equipment such as wells and pumping plants. For the purposes of this cost opinion, it is assumed that all such facilities will be powered by electric motors rather than bottled gas or diesel engine-driven devices. Energy costs were estimate using an “average” energy demand charge of $0.137810 per kilowatt hour. The operating costs do not include treatment of the recovered water supply.
6.4.3 Maintenance Costs
Since maintenance costs can vary significantly depending on labor rates and the level of maintenance performed on any system, this opinion assumes the following basis for maintenance costs:
Facility Maintenance Cost Basis
Pipelines None, as pipelines can be up to 50 or more years old before requiring any maintenance
6-7

Infiltration Basins 0.5 percent of the original capital cost for annual cleaning and other maintenance
Wells 0.05 percent of the original capital cost for annual maintenance
Pumping Plants 0.02 percent of the original capital cost for annual maintenance
6.4.4 Water Costs
The project costs were developed for each alternative for comparison purposes based on the facility requirements described in Section 6.3 and the project cost assumptions described in Section 6.4. The preliminary cost estimates for the recharge and water banking alternatives are described below.
6.4.4.1 Unit Water Costs
The cost of the SWP supply consists of fixed costs and the cost to deliver water to PPWTP.
Fixed Costs – The fixed cost for use of the SWP facilities applies to the full contract amount, and totals $64 per acre-foot per year.
Delivery Costs – The current (2007) cost to deliver water to PPWTP totals $494 per acre-foot (including the fixed costs described above).
6.4.4.2 Total Water Costs
The total water costs for the 40-year project life were estimated by applying the unit water costs to the water uses presented in Table 6-1. The total water costs for the different uses are described below.
M&I Water Contractors - The County M&I water contractors have the same water use, and therefore the same water costs, in all the alternatives, totaling about $104.7 million during the 40-year project life, which includes $21.6 million for the fixed-costs contractors (including the fixed costs for the Drought Buffer) and $83.1 million for delivery costs. This is paid for by the County M&I water contractors.
Excess Allocation - Under the existing condition, the 40-year cost of the excess allocation totals $45.2 million, which is paid by County residents. The reduction in the excess allocation resulting from the recharge operations reduces the
6-8

County’s cost share to $15.2 million over the 40-year period. The cost difference ($30 million) is included in the water costs for the recharge operations (described below).
Project Water for Recharge Operations - Based upon the unit costs provided above and the recharge operations engineering analysis assumptions, the cost for the water supply for the 40-year project life totals $231.2 million. This includes about $30 million in fixed costs and $201.2 million for delivery of the water to PPWTP. These costs are applied to all the alternatives.
6.5 Cost of Alternatives The cost estimate for each of the alternatives is presented below.
6.5.1 Alternative 1a – Recharge Operations for the Shell Creek/Camatta Creek and Lower San Juan Creek Recharge Areas
The 40-year project costs for Alternative 1a total $282.2 million as shown on Table 6-2.
Table 6-2 40-Year Project Cost Estimate for Alternative 1a
Cost Element Cost ($ million) Percent of Total Project Cost
Water $231.2 82%
Conveyance Facilities $25.9 9%
Recharge Facilities $8.7 3%
Recovery Facilities $0 0%
Contingency and Administration $15.2 5%
O&M $1.2 <1%
TOTAL $282.2 100%
Conveyance Facilities - The primary conveyance facilities for Alternative 1a include approximately 23 miles of 30-inch-diameter iron pipeline. The estimated cost total for the conveyance facilities is about $25.9 million.
Recharge Facilities - The primary recharge facilities included approximately 180 acres of recharge basins and the conveyance and distribution systems to deliver water from the main pipeline to the basins. The in-lieu recharge facilities include the pipelines and connections to the local irrigation systems to accommodate
6-9

approximately 240 acres of in-lieu recharge. The estimated cost for the recharge facilities totals about $8.7 million.
Recovery Facilities - This recharge alternative does not include any recovery facilities.
O&M Costs - The O&M costs for this alternative total about $1.2 million.
6.5.2 Alternative 1b – Water Banking Operations for the Shell Creek/Camatta Creek and Lower San Juan Creek Recharge Areas
The 40-year project costs for Alternative 1b total $357.0 million as shown on Table 6-3.
Table 6-3 40-Year Project Cost Estimate for Alternative 1b
Cost Element Cost ($ million) Percent of Total Project Cost
Water $231.2 65%
Conveyance Facilities $34.0 10%
Recharge Facilities $8.7 2%
Recovery Facilities $3.6 1%
Contingency and Administration $20.4 6%
O&M $59.1 17%
TOTAL $357.0 100%
Conveyance Facilities - The primary conveyance facilities for Alternative 1b include approximately 23 miles of 30-inch-diameter iron pipeline. Pumpstations with a combined capacity of 3,225 horsepower are needed to return the stored water to PPWTP. The estimated cost total for the conveyance facilities is about $34.0 million.
Recharge Facilities - The primary recharge facilities included approximately 180 acres of recharge basins and the conveyance and distribution systems to deliver water from the main pipeline to the basins. The in-lieu recharge facilities include the pipelines and connections to the local irrigation systems to accommodate approximately 300 acres of in-lieu recharge. The estimated costs for the recharge facilities total about $8.7 million.
Recovery Facilities - The primary recovery facilities for this alternative include eight 1,500 gpm wells and approximately 48,000 feet of collection pipelines to
6-10

return the recovered groundwater to the main pipeline. The high local well yields result in fewer production wells needed to recover the stored water. The estimated costs for the recovery facilities total about $3.6 million.
O&M Costs - The O&M costs for this alternative total about $59.1 million, which includes the energy costs to pump the banked water and return it to the PPWTP.
6.5.3 Alternative 2a – Recharge Operations for Creston Recharge Area
The 40-year project costs for Alternative 2a total $280.0 million as shown on Table 6-4.
Table 6-4 40-Year Project Cost Estimate for Alternative 2a
Cost Element Cost ($ million) Percent of Total Project Cost
Water $231.2 83%
Conveyance Facilities $29.3 10%
Recharge Facilities $4.2 2%
Recovery Facilities $0 0%
Contingency and Administration $14.7 5%
O&M $0.6 <1%
TOTAL $280.0 100%
Conveyance Facilities - The primary conveyance facilities for Alternative 2a include approximately 26 miles of 30-inch-diameter iron pipeline. The estimated cost total for the conveyance facilities is about $29.3 million.
Recharge Facilities - The primary recharge facilities included approximately 90 acres of recharge basins and the conveyance and distribution systems to deliver water from the main pipeline to the basins. The in-lieu recharge facilities include the pipelines and connections to the local irrigation systems to accommodate approximately 50 acres of in-lieu recharge. The estimated costs for the recharge facilities total about $4.2 million.
Recovery Facilities - This recharge alternative does not include any recovery facilities.
O&M Costs - The O&M costs for this alternative total about $0.6 million.
6-11
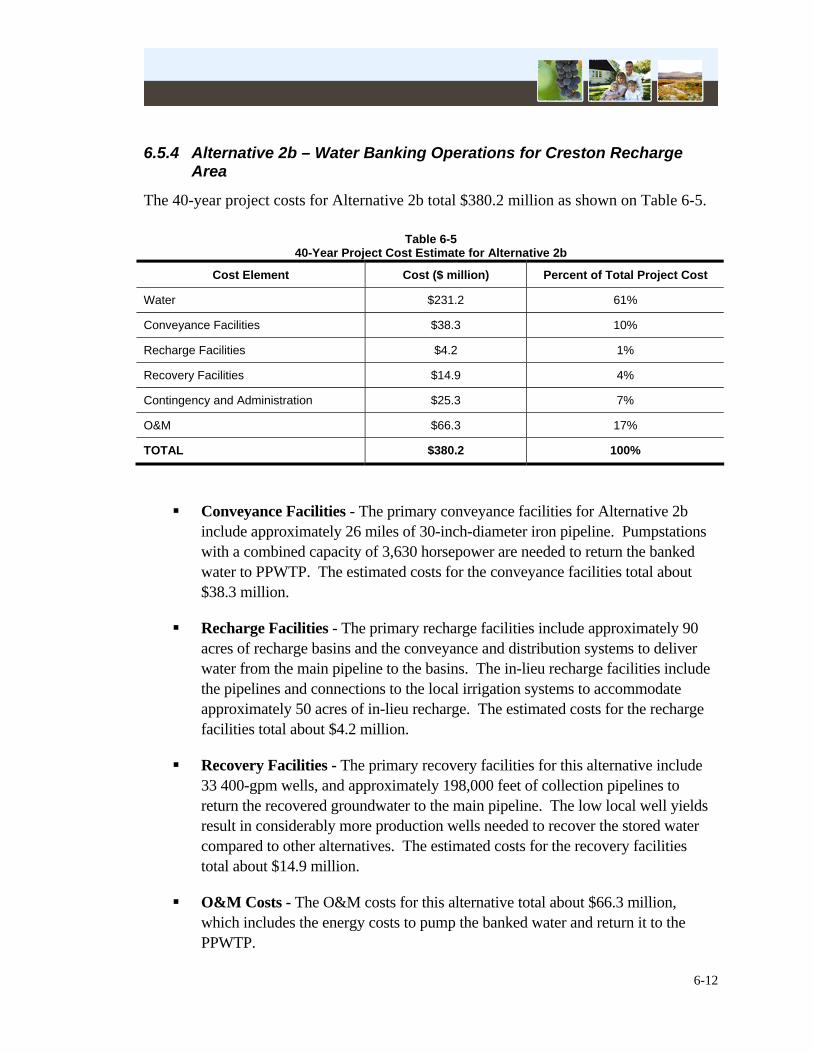
6.5.4 Alternative 2b – Water Banking Operations for Creston Recharge Area
The 40-year project costs for Alternative 2b total $380.2 million as shown on Table 6-5.
Table 6-5 40-Year Project Cost Estimate for Alternative 2b
Cost Element Cost ($ million) Percent of Total Project Cost
Water $231.2 61%
Conveyance Facilities $38.3 10%
Recharge Facilities $4.2 1%
Recovery Facilities $14.9 4%
Contingency and Administration $25.3 7%
O&M $66.3 17%
TOTAL $380.2 100%
Conveyance Facilities - The primary conveyance facilities for Alternative 2b include approximately 26 miles of 30-inch-diameter iron pipeline. Pumpstations with a combined capacity of 3,630 horsepower are needed to return the banked water to PPWTP. The estimated costs for the conveyance facilities total about $38.3 million.
Recharge Facilities - The primary recharge facilities include approximately 90 acres of recharge basins and the conveyance and distribution systems to deliver water from the main pipeline to the basins. The in-lieu recharge facilities include the pipelines and connections to the local irrigation systems to accommodate approximately 50 acres of in-lieu recharge. The estimated costs for the recharge facilities total about $4.2 million.
Recovery Facilities - The primary recovery facilities for this alternative include 33 400-gpm wells, and approximately 198,000 feet of collection pipelines to return the recovered groundwater to the main pipeline. The low local well yields result in considerably more production wells needed to recover the stored water compared to other alternatives. The estimated costs for the recovery facilities total about $14.9 million.
O&M Costs - The O&M costs for this alternative total about $66.3 million, which includes the energy costs to pump the banked water and return it to the PPWTP.
6-12

6.5.5 Alternative 3a – Recharge Operations for the Salinas River/Hwy 46 Recharge Area
The 40-year project costs for Alternative 3a total $289.4 million as shown on Table 6-6.
Table 6-6 40-Year Project Cost Estimate for Alternative 3a
Cost Element Cost ($ million) Percent of Total Project Cost
Water $231.2 80%
Conveyance Facilities $34.9 12%
Recharge Facilities $5.1 2%
Recovery Facilities $0 0%
Contingency and Administration $17.6 6%
O&M $0.6 <1%
TOTAL $289.4 100%
Conveyance Facilities - The primary conveyance facilities for Alternative 3a include approximately 31 miles of 30-inch-diameter iron pipeline. The estimated cost total for the conveyance facilities is about $34.9 million.
Recharge Facilities - The primary recharge facilities include approximately 90 acres of recharge basins and the conveyance and distribution systems to deliver water from the main pipeline to the basins. The in-lieu recharge facilities include the pipelines and connections to the local irrigation systems to accommodate approximately 500 acres of in-lieu recharge. The estimated costs for the recharge facilities total about $5.1 million.
Recovery Facilities - This recharge alternative does not include any recovery facilities.
O&M Costs - The O&M costs for this alternative total about $0.6 million.
6.5.6 Alternative 3b – Water Banking Operations for the Salinas River/Hwy 46 Recharge Area
The 40-year project costs for Alternative 3b total $415.3 million as shown on Table 6-7, with the combined water and energy costs totaling about 80 percent of the total project cost.
6-13

Conveyance Facilities - The primary conveyance facilities for Alternative 3b include approximately 31 miles of 30-inch-diameter iron pipeline. Pumpstations with a combined capacity of 5,615 horsepower are needed to return the banked water to PPWTP. The estimated costs for the conveyance facilities total about $48.9 million.
Table 6-7 40-Year Project Cost Estimate for Alternative 3b
Cost Element Cost ($ million) Percent of Total Project Cost
Water $231.2 56%
Conveyance Facilities $48.9 12%
Recharge Facilities $5.1 1%
Recovery Facilities $7.7 2%
Contingency and Administration $27.1 7%
O&M $95.3 23%
TOTAL $415.3 100%
Recharge Facilities - The primary recharge facilities include approximately 90 acres of recharge basins and the conveyance and distribution systems to deliver water from the main pipeline to the basins. The in-lieu recharge facilities include the pipelines and connections to the local irrigation systems to accommodate approximately 500 acres of in-lieu recharge. The estimated costs for the recharge facilities total about $5.1 million.
Recovery Facilities - The primary recovery facilities for this alternative include 15 800-gpm wells, and approximately 90,000 feet of collection pipelines to return the recovered groundwater to the main pipeline. The local well yields determined the number of production wells needed to recover the stored water. The estimated costs for the recovery facilities total about $24.0 million.
O&M Costs - The O&M costs for this alternative total about $95.3 million, which include the energy costs to pump the banked water and return it to the PPWTP.
6.6 Alternative Cost Comparison The goal of this project was to determine if groundwater banking in the Paso Robles Groundwater Basin is feasible. The alternatives were formulated to deliver the same
6-14

6-15
recharge capacity and recovery capacity (for water banking alternatives) to allow an ‘apples to apples’ comparison of the project effectiveness including the costs. The potential project locations were identified based upon available hydrogeologic information. Groundwater modeling was used to evaluate the hydrogeologic feasibility and effectiveness of each of the alternatives. The initial cost estimates for each of the alternatives were developed and are provided in Tables 6-2 through 6-7. This information is summarized on Table 6-8 to facilitate a comparison between the recharge and water banking alternatives for the 40-year project life of the facilities. The groundwater model simulation period would need to be extended to 40 years (from the current 17-year simulation period) to estimate the 40-year project yield.

6-16
Calculation Existing Alt 1a Alt 1b Alt 2a Alt 2b Alt 3a Alt 3b
R19 SWP Fixed Water Costs Value $64 $64 $64 $64 $64 $64 $64
R20 Delivery Costs to PPWTP Value $430 $430 $430 $430 $430 $430 $430
R21 Total Water Costs to Deliver to PPWTP R19+R20 $494 $494 $494 $494 $494 $494 $494
R22 SLOC M&I Contractors Fixed Costs (including Drought Buffer) ((R2+R3)*R8*R19)/1,000,000 $21.6 $21.6 $21.6 $21.6 $21.6 $21.6 $21.6
R23 SLOC M&I Contractors Delivered Costs to PPWTP (R2*R8*R20)/1,000,000 $83.1 $83.1 $83.1 $83.1 $83.1 $83.1 $83.1
R24 Excess Allocation Fixed Costs (R16*R19)/1,000,000 $45.2 $15.2 $15.2 $15.2 $15.2 $15.2 $15.2
R25 Project Water for Recharge Operations - Fixed Costs (R5*R9*R19)/1,000,000 $0.0 $30.0 $30.0 $30.0 $30.0 $30.0 $30.0
R26 Project Water for Recharge Operations Delivered to PPWTP (R5*R9*R20)/1,000,000 $0.0 $201.2 $201.2 $201.2 $201.2 $201.2 $201.2
R27 Cost of Project Water R25+R26 $0.0 $231.2 $231.2 $231.2 $231.2 $231.2 $231.2
R28 Capital Costs for Conveyance Facilities Cost Estimate $0 $25.9 $34.0 $29.3 $38.3 $34.9 $48.9
R29 Capital Costs for Recharge Facilities Cost Estimate $0 $8.7 $8.7 $4.2 $4.2 $5.1 $5.1
R30 Capital Costs for Recovery Facilities Cost Estimate $0 $0.0 $3.6 $0.0 $14.9 $0.0 $7.7
R31 Contengency and Administration Cost Estimate $0 $15.2 $20.4 $14.7 $25.3 $17.6 $27.1
R32 Operations and Maintenance Costs Cost Estimate $0.0 $1.2 $59.1 $0.6 $66.3 $0.6 $95.3
R33 Total Capital and O&M R28+R29+R30+R31+R32 $0 $51.0 $125.8 $48.8 $149.0 $58.2 $184.1R34 TOTAL COST (40 year totals rounded to $millions) R27+R33 $0.0 $282.2 $357.0 $280.0 $380.2 $289.4 $415.3
R35 Project Cost (40-year totals rounded in $/acre-foot) (R34/R14)/1,000,000 $600 $760 $600 $810 $620 $890
Table 6-8 Preliminary Cost Estimates of Recharge and Water Banking Alternatives
for 40-Year Project Life
Project Costs (40-year totals in $ millions)
Unit Water Costs ($/acre-foot)
Total Cost of Water (40-year totals in $millions)

6.6.1 Recharge Alternatives
The estimated total costs of the recharge alternatives shown on Table 6-8 reflect the distance of the alternative location from the PPWTP and the number of recharge basins needed to meet the recharge goal.
The total estimated 40-year project costs of the recharge alternatives ranges from $282 million to $289 million, which corresponds to $600 to $620 per acre-foot delivered to the recharge area.
The cost of the water, including the fixed costs ($30 million) and the delivery costs to PPWTP ($201.2 million), is the same for all the alternatives (total of $231.2 million) and is about 80 to 83 percent of the total 40-year project cost as shown on Figure 6-1.
Capital costs and O&M costs range from about $48.8 million to about $58.2 million, representing about 17 to 20 percent of the 40-year project costs.
Figure 6-1Distribution of Costs for Recharge and Water Banking Alternatives
Based on 40-Year Project Life
$83.1 $83.1 $83.1 $83.1 $83.1 $83.1 $83.1
$45.2$15.2 $15.2 $15.2 $15.2 $15.2 $15.2$30.0 $30.0 $30.0 $30.0 $30.0 $30.0
$201.2 $201.2 $201.2 $201.2 $201.2 $201.2
$125.8$149.0
$184.1
$21.6$21.6$21.6$21.6$21.6$21.6 $21.6
$0.0
$88.8$57.6
$82.7$48.2$67.7$49.8
$0
$58.2$48.8$51.0
$0.0
$0.0
$100.0
$200.0
$300.0
$400.0
$500.0
$600.0
$700.0
$800.0
Existing Alt 1a Alt 1b Alt 2a Alt 2b Alt 3a Alt 3b
Alternative
Proj
ect C
ost (
$M)
M&I Contractors Fixed Costs M&I Deliveries to PPWTPExcess Allocation Fixed Costs Recharge Water Fixed CostsRecharge Water Deliveries to PPWTP Capital Costs for FacilitiesWater Banking O&M Costs
Proj
ect W
ater
Cos
tsPr
ojec
t Fac
ility
and
O&
M C
osts
Throughout the 17-year simulation period, each year of additional recharge resulted in an increased percentage of water discharging to the stream system as shown in Section 5. This occurs when the groundwater basin fills as a result of the recharge exceeding the local groundwater storage capacity and discharging groundwater into the nearby rivers
6-17

and streams. Each year of additional recharge results in an increased increment of recharge discharging to the local stream system.
As a result of increased discharges to the stream system with continued long-term recharge, the estimated volume of water that may remain in storage over the 40-year project life may be less (as a percentage of the water recharged each year) compared to the results of the 17-year simulation period. This diminishing return on the recharged water would be expected to occur for all the alternatives, and should be considered when comparing the effectiveness of the alternatives.
Therefore, based upon the project descriptions and facility requirements, there are no significant differences in the project costs for the recharge alternatives that distinguish between their cost-effectiveness, as shown in Table 6-9.
Alternative 1a appears to be the most effective recharge alternative because it has the largest volume of recharged water remaining in storage, whereas Alternatives 2a and 3a retain less than one-half of the water in storage at the end of the simulation period, as shown on Table 6-9.
Table 6-9 Comparison of Recharge Alternatives
Change in Groundwater Storage as Percent of Recharged Water
Rank Cost ($/acre-foot) Rank
Alt 1a 81% 1 $600 1
Alt 2a 29% 3 $600 1
Alt 3a 48% 2 $620 1
From Alternative 3a there appears to be potential recharge opportunity along Highway 46. This area has a large agricultural in-lieu potential, and the area is experiencing declining groundwater levels. This area is also located a greater distance from the Salinas River, which may improve the effectiveness of a recharge project.
6.6.2 Water Banking Alternatives
The estimated total costs of the water banking alternatives shown on Table 6-8 reflect the distance of the alternative location from the PPWTP, and the variability of the local hydrogeologic conditions on the ability to recharge and recover water.
6-18

The total estimated 40-year project costs of the water banking alternatives range from $357 million to $415 million, which corresponds to $760 to $890 per acre-foot delivered to the recharge area and the return of stored water to PPWTP.
The cost of the water, including the fixed costs ($30 million) and the delivery costs to PPWTP ($201.2 million), is the same for all the alternatives (total of $231.2 million) and is about 56 to 65 percent of the total project costs as shown on Figure 6-1.
The water banking alternatives result in a smaller change in groundwater storage compared to the recharge-only alternatives because of the recovery of banked water. As shown on Table 6-8, over the 40-year project period the water banking may provide about 252,000 acre-feet of dry year water supply that may be sold to out-of-basin water users to generate revenue to partly fund the projects. In addition, the water banking projects result in increased groundwater in storage in the Basin.
While the recharge alternatives will most likely be funded by the local project participants that benefit from the project, the water banking alternatives distribute the costs among the local project participants and water banking partners, thereby reducing the local cost share. The sale price of the stored water will determine the eventual cost share between local project participants and banking partners. As shown on Figure 6-2, as the price of the stored water increases, the local cost share is reduced.
6-19

Figure 6-2Comparison of Water Costs of Alternatives
$0
$100
$200
$300
$400
$500
$600
$700
$800
$500 $750 $1,000
Sale Price of Stored Water ($/AF)
Loca
l Cos
t Sha
re ($
/AF)
Alt 1b
Alt 2b
Alt 3b
Range of Costs for Recharge Alternatives($600 to $620 per acre-foot)
Based upon the hydrogeologic analysis and the average water costs presented on Table 6-10, Alternative 1b appears to be the best banking alternative because it has the largest volume of recharged water remaining in storage and is the lowest cost water banking alternative.
Alternative 2b does not appear to be a viable water banking option because the limited groundwater storage capacity results in losses of the banked water outside of the system, and may result in recovery of native groundwater to meet the same water banking delivery targets.
Alternative 3a is the farthest from the PPWTP, and thereby has the greatest facility and operations costs of the three water banking alternatives. In addition, as shown in the modeling results, the close interaction between the Salinas River and the adjacent alluvial deposits is likely to result in the losses of recharged water to the Salinas River that are not recoverable. Third, Templeton and the City of Paso Robles have municipal supply wells in the area that may be impacted by groundwater recovery operations.
6-20

Table 6-10 Comparison of Water Banking Alternatives
Change in Groundwater Storage as Percent of Recharged Water
Rank Cost ($/acre-foot) Rank
Alt 1b 35% 1 $760 1
Alt 2b 0% 2 $810 2
Alt 3b 31% 1 $890 3
6.7 Groundwater Management Considerations Groundwater management is the planned and coordinated local effort of sustaining the groundwater basin to meet future water supply needs. In 1992, with the passage of Assembly Bill 3030 (AB 3030), local water agencies were provided a systematic way of formulating groundwater management plans (California Water Code, Sections 10750, et seq.). AB 3030 also encouraged coordination between local entities through joint power authorities or memorandums of understanding (MOU). In 2002, Senate Bill 1938 (SB 1938) was passed, which further emphasized the need for groundwater management in California.
Preparation of a groundwater management plan is the first step in developing the management and monitoring framework that can support future groundwater management efforts by:
Identifying local issues and developing solutions to address them.
Improving the understanding of the local hydrogeologic setting and groundwater conditions through an expanded groundwater monitoring program.
Establishing BMOs that provide quantifiable and measureable targets so that progress towards improved groundwater management can be tracked and monitored.
Meeting eligibility requirements for funding opportunities that support groundwater management activities such as the Local Groundwater Assistance Act of 2000 (AB303).
6.7.1.1 Groundwater Management Plan Components
A groundwater management plan should address the 12 specific technical elements identified in the California Water Code, along with the seven recommended components
6-21

identified in DWR Bulletin 118 (DWR 2003). Table 6-11 lists the required and recommended components.
Table 6-11 Regional GMP Components
Description
SB 1938 Mandatory Components
1. Documentation of public involvement statement
2. Basin Management Objectives (BMOs)
3. Monitoring and management of groundwater elevations, groundwater quality, inelastic land subsidence, and changes in surface water flows and quality that directly affect groundwater levels or quality or are caused by pumping
4. Plan to involve other agencies located in the groundwater basin
5. Adoption of monitoring protocols
6. Map of groundwater basin boundary, as delineated by DWR Bulletin 118, with agency boundaries that are subject to the GMP
7. For agencies not overlying groundwater basins, prepare the GMP using appropriate geologic and hydrogeologic principles
AB 3030 and SB 1938 Voluntary Components
1. Control of saline water intrusion
2. Identify and manage well protection and recharge areas
3. Regulate the migration of contaminated groundwater
4. Administer well-abandonment and destruction program
5. Control and mitigate groundwater overdraft
6. Replenish groundwater
7. Monitor groundwater levels
8. Develop and operate conjunctive-use projects
9. Identify well-construction policies
10. Develop and operate groundwater contamination cleanup, recharge, storage, conservation, water-recycling, and extraction projects
11. Develop relationships with state and federal regulatory agencies
12. Review land use plans and coordinate with land use planning agencies to assess activities that create reasonable risk of groundwater contamination
DWR Bulletin 118 Suggested Components
1. Manage with guidance of advisory committee
2. Describe area to be managed under GMP
3. Create links between BMOs and goals and actions of GMP
4. Describe GMP monitoring programs
5. Describe integrated water-management planning efforts
6. Report of implementation of GMP
7. Evaluate GMP periodically
6-22

Several groundwater management components listed on Table 6-11 recognized the benefit of water banking, groundwater recharge, and conjunctive use operations as tools to manage groundwater levels, control and mitigate overdraft, and replenish the groundwater system. A comprehensive groundwater management program may include a water banking program.
6.8 Groundwater Banking Operational Considerations Prior to the development of a recharge or water banking project, considerable work would need to be completed to develop a program that equitably shares the project’s costs and benefits among the participating entities and those affected by the project operations. Some of these issues (i.e., groundwater monitoring) are similar to those included in the GMP described above.
6.8.1 Groundwater Monitoring
The District has been monitoring groundwater levels in the Paso Robles Basin for over 40 years. The current groundwater monitoring program consists of nearly 145 wells, which are monitored every April and October by District staff (99 wells) or by local agencies (56 wells), with results reported to the District.
An evaluation of the monitoring program completed in 2003 described the existing monitoring program in the Basin and made specific recommendations to improve the program’s efficiency and effectiveness. The recommendations included the evaluation of wells for elimination from the program, identification of gaps in the monitoring network, and planning for additional wells in areas of concern or that have expected high groundwater use. The existing groundwater monitoring protocols will be reviewed and updated as needed to address monitoring and reporting issues associated with a recharge or banking project. This may include a review of how wells are selected for inclusion in the monitoring program, identification of data gaps, data collection, QA/QC procedures, and dissemination of information.
6.8.2 Groundwater Banking Operating Agreements
Agreements will be needed to identify all project participants including the lead agency, potential affected parties, water banking participants, and monitoring groups; and establish the goals and objectives of the project.
6.8.3 Groundwater Banking Operational Criteria
Operational criteria are needed to ensure land owners that they will not be adversely impacted as the result of project operations. The criteria may include the following:
6-23

6-24
Only water stored under the banking agreement may be withdrawn. Water must first be stored before it can be withdrawn.
Establishing criteria to monitor and manage rising groundwater levels near the recharge areas.
A certain amount of stored water will be retained in groundwater storage to account for aquifer and operational losses.
Establishing water quality criteria for imported water supplies used for recharge.
In the case of in-lieu recharge, water will not be pumped from a given farm prior to water being delivered for recharge.
A network of dedicated monitoring wells will be constructed and used to monitor the response of the groundwater basin.
The withdrawal of stored water would be prohibited if such withdrawals would cause average groundwater levels to be lower than some predetermined level that would have prevailed without the project.
Groundwater levels will be reviewed regularly by a committee composed of representatives of the local agencies and land owners.
Establishing procedures to modify project operations in response to impacts to existing local land use or groundwater conditions.

7 Environmental and Permitting Considerations
The following provides an overview of the environmental issues and requirements associated with the Feasibility Study. The objective of this analysis is to evaluate the potential general and site-specific environmental issues and permitting constraints associated with water banking project components and alternatives. This section is organized into the following sections: (1) Key Environmental Issues, (2) Permitting Requirements, and (3) Summary of California Environmental Quality Act (CEQA) and National Environmental Protection Act (NEPA) Approaches.
7.1 Key Environmental Issues The potential key environmental issues associated with the program include agricultural resources, biological resources, cultural resources, land use, and growth-inducing effects.
7.1.1 Agricultural Resources
The State of California, Department of Conservation, Office of Land Conservation, Important Farmlands Inventory (IFI) system is used in San Luis Obispo County to inventory lands considered to have agricultural value. This system classifies land based upon the productive capabilities of the land, rather than the mere presence of ideal soil conditions. Land is divided into several categories of diminishing agricultural importance. The State of California’s IFI is based in part on the Capability Classification System and the Storie Index. Capability classes demonstrate the suitability of soils for most kinds of field crops according to their limitations when used for field crops, the risk of damage when used, and their response to treatment. Class I soils have few limitations that restrict their use, while Class II soils have moderate limitations that reduce the choice of plants or that require moderate conservation practices. The Storie Index expresses numerically a soil’s relative degree of suitability for general intensive agriculture. The rating is based only on soil characteristics and is obtained by evaluating such factors as soil depth, surface texture, subsoil characteristics, drainage, salts and alkali, and relief.
Within the IFI classification, farmlands are designated as “Prime,” “Statewide Importance,” “Unique,” and “Local Importance.” “Prime” farmlands are generally defined as irrigated soils (Class I and II) over 40 inches deep with available water holding capacity of 4 inches or more. Generally well drained, they are free from frequent flooding. Farmlands of “Statewide Importance” are irrigated lands other than Prime that have a good combination of physical and chemical characters for producing feed, fiber,
7-1

food, forage, and oilseed crops. “Unique” farmlands are other lands that produce high-value food and fiber crops. “Local Importance” farmlands represent dry farmed lands, and un-irrigated lands of Prime and Statewide Importance. Lands that have lesser agricultural potential are classified as “Grazing,” “Urban,” or “Other.” The latter classification includes areas that are generally unsuitable for agriculture because of geographic or regulatory constraints.
Impacts to agricultural resources could result from loss of important agricultural lands; conflicts with Williamson Act contracts; and reduction in agricultural soil productivity due to erosion, the build-up of trace elements, or salinity in agricultural soils. The conversion of prime agricultural lands to non-agricultural uses is a concern within the County and across the State.
The status of the farmland at any of the three alternative recharge areas as well as along the conveyance and distribution pipeline alignments and pump station locations would need to be evaluated to determine if there is prime farmland or existing Williamson Act contracts. Due to groundwater recharge, soils at and near the recharge areas may remain saturated longer than without the project, which may delay planting of crops. However, it should be noted that groundwater recharge would be considered a beneficial effect on agricultural water supply. The State requires preparation of an Environmental Impact Report (EIR) for any project for which a Fair Argument can be made that it results in a significant and unavoidable environmental impact relative to adopted State or local thresholds of significance. The conversion of designation lands, prime soils areas, and/or agricultural uses to permanent non-agricultural use may be considered a significant and unavoidable environmental impact.
7.1.2 Biological Resources
For the purpose of this report, special-status species are those plants and animals that are:
Listed, proposed for listing, or candidates for listing as threatened or endangered by the Fish and Wildlife Service (USFWS) under the federal Endangered Species Act (ESA).
Considered “species of concern” by the USFWS.
Listed or proposed for listing as rare, threatened, or endangered by the California Department of Fish and Game (CDFG) under the California Endangered Species Act (CESA).
Animals designated as “Species of Special Concern” by the CDFG.
7-2

Included in the CDFG Special Vascular Plants, Bryophytes, and Lichens List (July 2005).
This latter document includes the California Native Plant Society (CNPS) Inventory of Rare and Endangered Vascular Plants of California, Sixth Edition as updated online (Tibor, 2001). Those plants contained on CNPS lists 1B, 2, and 4 are considered special status species in this study. Per the CNPS code definitions, List 1A species include those presumed extinct in California; List 1B are those declared rare, threatened, or endangered in California and elsewhere; List 2 includes plants that are rare, threatened, or endangered in California but are more common elsewhere; List 3 includes those species that do not fit into another list for lack of necessary information needed to assign them to one list or to reject them; and List 4 species are those of limited distribution or are infrequent throughout a broader range of California, but whose vulnerability or susceptibility to threat appears low at this time.
Riparian and wetland habitat types are of special concern to the resource agencies due to the high value for wildlife and extensive loss of these habitat types in California. Waters of the United States are under the jurisdiction of the United States Army Corps of Engineers (USACE) and waters of the State are under CDFG jurisdiction.
Special-Status Plants and Plant Communities of Special Concern. Special-status plant species that have the potential to occur on the candidate sites include, but are not limited to, the following (Rincon, 2005):
Davidson’s bush mallow (CNPS List 1B)
Dwarf calycadenia (CNPS List 1B)
Hardham’s evening-primrose (CNPS List 1B)
Hooked popcorn-flower (CNPS List 1B)
Jared’s pepper grass (CNPS List 1B)
Mesa horkelia (CNPS List 1B)
Prostrate navarretia (CNPS List 1B)
Round-leaved filaree (CNPS List 2)
San Bernardino aster (CNPS List 1B)
Santa Cruz microseris (CNPS List 1B)
7-3

Shining navarretia (CNPS List 1B)
Special-Status Wildlife. Special-status wildlife species that have the potential to occur on the candidate sites include, but are not limited to, the following (Rincon, 2005):
American badger (State species of special concern)
Blunt-nosed leopard lizard (federally and State endangered species)
Burrowing owl (State species of special concern)
California horned lark (State species of special concern)
California tiger salamander (State species of special concern and federally threatened)
Coast horned lizard (State species of special concern)
Giant kangaroo rat (federally and State endangered species)
Least Bell’s vireo (State and federally endangered species)
Loggerhead shrike (State and federal species of special concern)
Longhorn fairy shrimp (federally endangered species)
Northern harrier (State species of special concern)
Prairie falcon (State species of special concern)
Salinas pocket mouse (State species of special concern)
San Joaquin kit fox (State threatened and federally endangered species)
South-Central California Coast Steelhead (federally endangered species)
Southwestern pond turtle (State species of special concern)
Western spadefoot (State species of special concern)
Vernal pool fairy shrimp (federally threatened species)
Yellow warbler (State species of special concern)
7-4

Conveyance and Distribution Pipelines. Construction of the conveyance and distribution pipelines would temporarily impact habitat special-status plants and plant communities of special concern and special-status wildlife species. The conveyance pipeline may require stream crossings that could require either jack-and-bore installation or horizontal directional drilling (HDD). These methods of stream crossings would avoid/minimize disturbance of existing habitat, thereby potentially avoiding/minimizing costly wetland mitigation and monitoring plans. However, a 404 Permit may still be required from USACE and a 401 water quality certification from the Regional Water Quality Control Board (RWQCB) due to concerns for potential frac-out (release of bentonite) during HDD operations.
Direct Discharge to Streams. If water were to be directly discharged to Shell Creek, East Branch of Huerhuero Creek, or the Salinas River, it could alter the stream’s flow regime and possibly result in a change in stream habitat that could be unsuitable for certain special-status plants and animals. Continual release of water into ephemeral streams would alter the habitat, thereby resulting in different plants, plant communities, and wildlife. If, during a prolonged drought, release of water is halted, impacts could occur.
Furthermore, discharge of treated water may impact special-status species due to concentrations of chlorine and/or disinfection by-products in the stream. Conversely, discharge of raw water may cause impacts to special-status species due to introduction of non-native invasive species from Sacramento-San Joaquin Delta source water.
Discharge to Percolation Ponds. Construction of the percolation ponds would permanently impact special-status plants and plant communities of special concern, and special-status wildlife species and their habitats. There may be opportunities to preserve and enhance habitat (e.g., San Joaquin kit fox habitat) within the approximately 90-acre recharge area, such that the project mitigates for on-site removal of special-status species habitat.
7.1.2.1 Alternative 1 Site
Shell Creek may be waters of the United States under the jurisdiction of the USACE, and waters of the State under CDFG jurisdiction. If the project would disturb riparian or wetland areas, a wetland delineation would be required to determine if the affected area is considered jurisdictional waters.
7.1.2.2 Alternative 2 Site
Huerhuero Creek may be waters of the United States under the jurisdiction of the USACE, and waters of the State under CDFG jurisdiction. If the project would disturb
7-5

riparian or wetland areas, a wetland delineation would be required to determine if the affected area is considered jurisdictional waters.
7.1.2.3 Alternative 3 Site
The Salinas River is considered to be waters of the United States under the jurisdiction of the USACE, and waters of the State under CDFG jurisdiction. If the project would disturb riparian or wetland areas, a wetland delineation would be required to determine if the affected area is considered jurisdictional waters. Furthermore, South-Central California Coast Steelhead are known to occur in the Salinas River; therefore, direct discharge of raw or treated water could result in impacts.
If the project traverses indicated riparian areas, a wetland delineation should be conducted to determine the location and extent of jurisdictional wetlands. Any activity that would remove or otherwise alter riparian and wetland habitats in the study area would be scrutinized by the resource agencies through the California Environmental Quality Act (CEQA) review process. Any impacts to the Salinas River, Huerhuero Creek, or Shell Creek, or the associated riparian and wetland habitat could potentially fall under the jurisdiction of the USACE as waters of the United States pursuant to Section 404 of the Clean Water Act (1972), under the jurisdiction of the RWQCB pursuant to Section 401 of the Clean Water Act, and under the jurisdiction of the CDFG pursuant to Section 1600 et. seq. of California Fish and Game Code. If such areas are determined to be jurisdiction, project construction would require a permit/agreement from these agencies. Pursuant to Section 401 of the Clean Water Act, any action that requires a USACE Section 404 permit also requires Water Quality Certification from the RWQCB to ensure the project would uphold state water quality standards (refer to Section 7.2, Permitting Requirements).
Impacts on riparian habitat types would require on-site compensatory mitigation to replace any habitat loss resulting from project implementation. Additionally, on-site riparian habitats could potentially house special-status species that would require evaluation during the permit process (see special-status species discussion below for additional information).
The USACE, CDFG, and RWQCB typically require compensatory mitigation to replace temporary and permanent loss of wetland and riparian habitat in ratios of 2:1, 3:1, and 5:1 (acres provided to acres lost), respectively. The amount of habitat to be restored, a monitoring program, and an adaptive management plan to help ensure the success of the habitat restoration will be required by the agencies.
7-6

A mitigation and monitoring plan can usually be developed in about 30 days. The time required to monitor and maintain the replacement and maintenance program is generally five years to prove successful implementation.
7.1.3 Cultural and Archeological Resources
The project area lies within the historic territory of the Native American Indian group known as the Chumash. The Chumash occupied the region from San Luis Obispo County to Malibu Canyon on the coast, and inland as far as the western edge of the San Joaquin Valley and the four northern Channel Islands. The Obispeño were the northernmost Chumash group, occupying much of the County, including the Paso Robles area.
The archaeological record indicates that sedentary populations occupied the coastal regions of California more than 9,000 years ago. Several chronological frameworks have been developed for the Chumash region including Rogers (1929), Wallace (1955), Harrison (1964), Warren (1968), and King (1990). King postulates three major periods—Early, Middle, and Late. Based on artifact typologies from a great number of sites, he was able to discern numerous style changes within each of the major periods. The Early Period (8000 to 3350 Before Present [B.P.]) is characterized by a primarily seed processing subsistence economy. The Middle Period (3350 to 800 B.P.) is marked by a shift in the economic/subsistence focus from plant gathering and the use of hard seeds to a more generalized hunting-maritime-gathering adaptation, with an increased focus on acorns. The full development of the Chumash culture, one of the most socially and economically complex hunting and gathering groups in North America, occurred during the Late Period (800 to 150 B.P.). Prehistoric marriage patterns and post-mission settlement patterns have also identified Yokuts and Salinan people living in the northern portions of the County (Gibson, 1998).
The Chumash and Salinan aboriginal way of life ended with Spanish colonization. As neophytes were brought into the mission system, they were transformed from hunters and gatherers into agricultural laborers and exposed to diseases to which they had no resistance. By the end of the Mission Period in 1834, the Chumash and Salinan population had been decimated by disease and declining birthrates. Population loss as a result of disease and economic deprivation continued into the next century.
The first European contact in the County occurred in 1595, when Sebastian Rodriguez Cermeno put in at Port San Luis. The next documented European expedition to land in the area was Sebastian Vizcaino in 1602. Over 150 years passed before the next major European expedition reached the County. In 1769, Gaspar de Portola and Fray Crespi departed the newly established San Diego settlement and marched northward toward
7-7

Monterey with the objective of securing the port and establishing five missions along the route. They passed through present-day San Luis Obispo County that same year. Three years later, in 1772, Father Serra founded the Mission San Luis Obispo de Tolosa. Spanish rule in Alta California came to an end in 1821 with Mexican Independence and the missions were secularized in 1832.
The State provides criteria for evaluating the importance of cultural resources. The State has formulated laws for the protection and preservation of archaeological resources. Generally, a cultural resource shall be considered to be “historically significant” if the resource meets the criteria for listing on the California Register of Historic Resources (Pub. Res. Code SS5024.1, Title 14 CCR, Section 4852), including the following:
Is associated with events that made a significant contribution to the broad patterns of California’s history and cultural heritage.
Is associated with the lives of persons important in our past.
Embodies the distinctive characteristics of a type, period, region, or method of construction, or represents the work of an important creative individual, or possesses high artistic values.
Has yielded, or may be likely to yield, information important in prehistory or history.
The fact that a resource is not listed in, or determined to be eligible for listing in, the California Register of Historical Resources, or is not included in a local register of historical resources (pursuant to section 5020.1(k) of the Public Resources Code), or identified in an historical resources survey (meeting the criteria in section 5024.1(g) of the Public Resources Code) does not preclude an agency from determining that the resource may be an historical resource as defined in Public Resources Code sections 5020.1(j) or 5024.1.
7.1.3.1 California Public Resources Code
Section 5097.9 of the California Public Resources Code stipulates that it is contrary to the free expression and exercise of Native American religion to interfere with or cause severe irreparable damage to any Native American cemetery, place of worship, religious or ceremonial site, or sacred shrine.
7-8

7.1.3.2 State Health and Safety Code § 7050.5 and Public Resources Code §§ 5097.94, 5097.98 and 5097.99
The purpose of the above codes is to provide protection to Native American human burials and skeletal remains from vandalism and destruction and to provide a regular means by which Native American descendents can make known their concerns regarding the need for sensitive treatment and disposition of Native American burials, skeletal remains, and items associated with Native American burials.
Cultural resources have been recorded along the existing Coastal Branch Pipeline alignment. Construction of the conveyance and distribution pipeline may result in impacts to known and/or unknown cultural resources. Furthermore, each of the alternative recharge sites is located adjacent to a waterway, on relatively level ground, which is considered an area that may have been suitable for previous settlement, so the potential for cultural resources exists.
A Phase I Archaeological Investigation should be completed. This investigation shall include a review of previous archaeological surveys and/or excavations within the sites. This review will determine what portions of the site require field surveys. A Phase I Archaeological Investigation would include, but not necessarily be limited to, the following:
A qualified archaeologist and Native American representative shall monitor all initial earth moving activities within native soil.
If an archaeological site is found to be significant/important, measures to reduce the project’s impacts should be implemented as follows:
o Avoidance of impacts to the archaeological site is the favored form of mitigation for significant sites whenever feasible.
o The applicant may choose to cap the resource area using culturally sterile and chemically neutral fill material and shall include open space accommodations and interpretive displays for the site to ensure its protection from development. An archaeologist and Chumash consultant shall be retained to monitor the placement of fill upon the site and to make open space and interpretive recommendations. If a significant site will not be capped, the results and recommendations of the Phase II study shall determine the need for a Phase III Data Recovery Excavation and/or monitoring.
7-9

o Where avoidance is infeasible, impacts may be mitigated when necessary through a Phase III data recovery program.
If the site is determined to not be important, no capping and/or further archaeological investigation should be required. The results and recommendations of the Phase II study shall determine the need for construction monitoring.
It is estimated that upon project approval, a Phase I Archaeological Investigation would take approximately one month to complete, a Phase II Archaeological Investigation would take approximately two months to complete, and a Phase III Archaeological Investigation would take approximately four months to complete.
At the commencement of project construction, an orientation meeting shall be conducted by an archaeologist for construction workers associated with earth disturbing procedures. The orientation meeting shall describe the possibility of exposing unexpected archaeological resources and directions as to what steps are to be taken if such a find is encountered.
An archaeologist shall monitor construction grading within 50 meters (164 feet) of isolated finds. In the event that prehistoric or historic archaeological resources are exposed during project construction, all earth-disturbing work within 50 meters (164 feet) of the find must be temporarily suspended or redirected until an archaeologist has evaluated the nature and significance of the find. After the find has been appropriately mitigated (e.g., curation, preservation in place, etc.), work in the area may resume. The County should consider retaining a Chumash representative to monitor any field work associated with Native American cultural material.
If human remains are exposed, State Health and Safety Code Section 7050.5 requires that no further disturbance shall occur until the County Coroner has made the necessary findings as to origin and disposition pursuant to Public Resources Code Section 5097.98.
Should undocumented cultural resources be identified or discovered, timing would be assessed on a case-by-case basis depending on the extent of the resource.
7.1.4 Land Use
The County Land Use Ordinance and County General Plan Land Use Element regulate land use planning in the County. A constraint is identified for projects that would conflict with existing zoning or General Plan land use designations.
Development of pipelines and recharge facilities most likely would not conflict with agricultural land use designations and zoning; however, the conversion of this land to
7-10

non-agricultural uses constitutes a constraint with respect to agriculture (See Section 7.2.1).
7.1.5 Growth-Inducing Effects
Section 15126.2(d) of the CEQA Guidelines requires that environmental impact reports (EIRs) discuss the potential for projects to induce population or economic growth, either directly or indirectly. CEQA also requires a discussion of ways in which a project may remove obstacles to growth, as well as ways in which a project may set a precedent for future growth.
Growth does not necessarily create significant physical changes to the environment. However, depending upon the type, magnitude, and location of growth, it can result in significant adverse environmental effects. A project’s growth-inducing potential is therefore considered significant if it could result in significant physical effects in one or more environmental issue areas.
Implementation of the project could be considered to result in removal of an obstacle of growth. Various communities within the County have limited water supplies, such that their ability to accommodate future growth may be constrained by the amount of water they have. Provision of additional water (1,500 acre-feet per month or 18,000 acre-feet per year) as a result of the project could result in growth-inducing effects that cause significant environmental impacts.
7.2 Permitting Requirements This section lists and discusses the regulatory agencies that could have jurisdiction and their permitting requirements within the project area. The program would require numerous federal, state, and local approvals. Refer to Table 7-1 for a list of anticipated permitting agencies that could be involved with permitting the program. Presented below is a description of each regulatory agency’s anticipated role in review and permitting of the program.
7.2.1 Federal Agencies
United States Army Corps of Engineers (USACE). The USACE would likely be the lead federal agency for the proposed project for placement of fill (including temporary trench spoils) within navigable waters of the U.S. under Section 404 of the Clean Water Act. The USACE would consult with the USFWS and National Oceanic Atmospheric Administration, National Marine Fisheries Service (NOAA Fisheries) to identify potential effects to endangered and threatened species as required under Section 7 of the Endangered Species Act (ESA). A Biological Assessment would be required as part of
7-11

this consultation to provide sufficient information for the USACE, USFWS, and NOAA Fisheries to fully determine the project’s potential to affect threatened or endangered species.
A Jurisdictional Waters of the U.S. survey (wetlands delineation) may also be required to identify wetlands that may be impacted by the project. USACE’s jurisdiction under Section 404 of the Clean Water Act extends to the ordinary high water mark of a river or
Table 7-1 Potential Permits and Approvals
Agency Role Permit/Approval Regulated Activity Authority
Federal Agencies
U.S. Bureau of Reclamation
Federal Lead Agency
NEPA EA or EIS Federal Funding NEPA
U.S. Army Corps of Engineers
Responsible Agency Section 404 permit Discharge of dredged or fill material into waters of the U.S. during construction. Jurisdictional waters include territorial seas, tidelands, rivers, streams, and wetlands.
Section 404 Clean Water Act (33 USC 1344) NEPA
U. S. Fish and Wildlife Service
Responsible Agency Endangered Species Act, Section 7 consultation
Impacts to federally listed and species proposed for listing
16 USCA 1513 50 CFR Section 17
NOAA Fisheries
Responsible Agency Endangered Species Act, Section 7 consultation
Impacts to federally listed anadromous fish (i.e., steelhead)
16 USCA 1513 50 CFR Section 17
State of California Agencies
California Department of Fish and Game
Responsible/Trustee Agency
1602 permit Section 2081 Management Agreement
Crossing of streams and rivers that cause major disturbance to the streambed or discharge of water into stream or river Potential adverse effects to State listed species
Sections 1601- 1607 of the California Fish and Game Code Section 2081 of the California Fish and Game Code
Regional Water Quality Control Board
Responsible Agency NPDES Section 401 Water Quality Certification General Construction Permit
Discharge of treated water into stream or river Discharges that may affect surface and groundwater quality If construction area greater than 1 acre
Clean Water Act Porter-Cologne State Water Quality Act (1969)
Local Agencies
County of San Luis Obispo
CEQA Lead Agency CEQA IS/MND or EIR
Proposed Project Land use, grading, drainage
CEQA County General Plan, Land Use Ordinance
7-12

Agency Role Permit/Approval Regulated Activity Authority
City of Paso Robles
Responsible Agency Use Permit Grading Permit Construction Permit Permit to Remove
Land use, grading, drainage if any project facilities in city limits Removal of Oak Tree
City Ordinance
San Luis Obispo APCD
Responsible Agency Authority to Construct
Emissions associated with construction may require a permit
Clean Air Act
stream. The project may fall within one or more Nationwide Permits (NWP) (i.e., NWP 33) developed by the USACE for major routine types of construction projects within federal waters. A programmatic environmental impact statement (EIS) was previously prepared for these NWPs to comply with the National Environmental Policy Act (NEPA). NWPs involving discharges or fills into wetlands would require a wetland delineation using the accepted USACE methodology to determine the location and extent of wetlands impacted by the project. The USACE verifies the wetland delineations prepared by applicants. Projects with impacts to waters of the United States greater than 0.5 acre may require a USACE Individual Permit.
NOAA Fisheries. NOAA Fisheries is responsible for the protection of marine species by administering the regulations listed in the ESA, Marine Mammal Protection Act, and the Magnuson-Stevens Fishery Management and Conservation Act (Essential Fish Habitat Assessment). This agency would likely participate in a Section 7 consultation under the ESA with the USACE during the review of the proposed project. Due to the limited potential for impacts to steelhead (i.e., changes in stream flow regime), the USACE would likely consult with NOAA Fisheries through an informal consultation. However, if raw water was discharged directly to a stream channel, the USACE may consult with NOAA Fisheries through a formal consultation.
United States Fish and Wildlife Service. The USFWS would be requested to review the project with respect to potential impacts to threatened or endangered species. Such consultation will be initiated during the 404 permit process. During this process, impacts to federally listed species would be addressed. Impact of critical habitat may also result in seasonal restrictions or recommendations for habitat restoration.
7.2.2 State Agencies
Central Coast RWQCB. The Central Coast RWQCB’s primary responsibility is to protect the quality of the surface water and groundwater within the Region for beneficial uses. The duty is carried out by formulating and adopting water quality plans for specific
7-13

ground or surface water bodies, by prescribing and enforcing requirements on domestic and industrial waste discharges, and by requiring cleanup of water contamination and pollution.
Pursuant to Section 401 of the Clean Water Act, the USACE permit under Section 404 is not active until the State of California first issues a water quality certification to ensure that a project will comply with state water quality standards. The authority to issue water quality certifications in the project area is vested with the Central Coast RWQCB. Water Quality Certification requires a completed Section 401 Application Form, a completed copy of the federal application for the USACE Permit, and the appropriate fees, in addition to CEQA compliance.
If the project were to expose greater than one acre of disturbed construction area to stormwater runoff, a General Permit for Stormwater would be required.
Discharge of treated water directly into a stream or river may require a National Pollution Discharge Elimination System (NPDES) permit.
California Department of Fish and Game. CDFG administers Section 1600 of the California Fish and Game Code. That regulation requires a Lake or Streambed Alteration Agreement (SAA) between CDFG and the applicant before the initiation of any construction project that will: 1) divert, obstruct, or change the natural flow or the bed, channel, or bank of any river, stream, or lake; 2) use materials from a streambed; or 3) result in the disposal or deposition of debris, waste, or other material containing crumbled, flaked, or ground pavement where it can pass into any river, stream, or lake.
In order to notify the CDFG of a proposed project that may impact a river, stream, or lake as required by Fish and Game Code Section 1600, a Lake or Streambed Alteration Notification Form and a Project Questionnaire form along with the appropriate fees must be submitted to the CDFG. CEQA compliance or notice of exemption is also required.
The CDFG also administers a number of laws and programs designed to protect fish and wildlife resources. Principle of these is the California Endangered Species Act of 1984 (CESA - Fish and Game Code Section 2050), which regulates the listing and take of state endangered (SE) and threatened species (ST). Under Section 2081 of the CESA, CDFG may authorize the take of an SE and/or ST species, or candidate species through an Incidental Take Permit. However, plant or animal species that are “Fully Protected” under state law cannot be taken and no Incidental Take Permits may be issued.
7-14

7.2.3 Local Agencies
County of San Luis Obispo. The County of San Luis Obispo would be the lead agency under CEQA for preparation of an EIR. If there is federal funding associated with the project, an Environmental Assessment (EA) or EIS may also need to be prepared pursuant to NEPA. The document would need to assess impacts to various issue areas resulting from construction and operation of the various project components, including:
Conveyance Pipeline
Conveyance Pumping Station
Distribution Pipeline(s)
Percolation Ponds
Use of the water
The County may require that a conditional (or minor) use permit, grading permit, and building permit be issued for the construction and operation of the project and would compare the project with any applicable standards or policies. The County may impose specific requirements/conditions be incorporated into the permit governing the design or operation of the project and may not approve the permit unless it is found to be consistent with the County’s General Plan and Land Use Ordinance.
San Luis Obispo Air Pollution Control District (SLOAPCD). The SLOAPCD would review the proposed project for compliance with applicable federal, State, and local air quality control criteria.
Detailed documentation of existing and proposed project emissions would be required to obtain an Authority to Construct permit. Such emissions calculations would need to be prepared based on established criteria and detailed project equipment inventories. These inventories shall include equipment type and duration of use.
City of Paso Robles. The City of Paso Robles may also be a permitting agency for the project by requiring building and grading permits. A portion of Alternative 3 recharge area is within the City of Paso Robles. This area may contain oak trees that require removal for construction of the percolation ponds. According to the City of Paso Robles Oak Tree Ordinance, no person shall remove or otherwise destroy an oak tree of six inches or greater diameter growing on private or public property within the City Limits unless they have first received approval of a Permit to Remove as authorized by the Director of Community Development or the City Council. A Permit to Remove
7-15

application shall contain a plot plan showing the location, type, and size of tree(s) proposed to be removed, a brief statement of the reason for removal, and other pertinent information that the director may require. Once removed, the City of Paso Robles would require the planting of replacement oak trees equivalent to 25 percent of the diameter of the removed tree(s).
A Permit to Remove must be obtained prior to development of proposed facilities, subject to City Council approval.
7.3 Summary of CEQA/NEPA Approaches Based on the preliminary evaluation of key environmental issues from the possible development of water distribution and banking facilities at the alternative sites, environmental documentation consisting of an EIR and possibly an EA or EIS would likely be required to adequately assess potential impacts, regardless of the site or sites that are ultimately selected. Table 7-2 summarizes the results of the evaluation contained in Section 7-2.
Table 7-2 Environmental Constraints
Component/ Alternative Agricultural Resources
Biological Resources
Cultural Resources Land Use
Conveyance Pipeline 2 2 2 1
Distribution Pipeline 2 2 2 1
Alternative 1 – Shell Creek 2 2 2 1
Alternative 2 – Huerhuero Creek 2 2 2 1
Alternative 3 – Salinas River 2 3 2 1
3 = Major constraint; could be fatal flaw precluding site selection 2 = Moderate constraint; may require additional regulatory permitting time and effort, but site is suitable for proposed use 1 = Minor constraint; this issue may need further evaluation in the CEQA context, but not likely to pose regulatory difficulty
Generally, all components/alternatives have similar environmental constraints. For example, development at all sites could result in impacts to biological resources, particularly because they are each adjacent to riparian areas associated with Shell Creek, Huerhuero Creek, or the Salinas River. At the same time, it is just as likely that such resources could be largely avoided by locating the facilities a sufficient distance from these water bodies/sensitive habitats.
However, the Salinas River alternative may be the only site to have fatal flaws that preclude development of recharge facilities. This is due to the potential for introduction
7-16

of non-native invasive species into the Salinas River, which is known to provide habitat for various special-status species, including the South-Central California Coast steelhead. If the recharge pond area at this site was not constructed with sufficient flood overflow basins to capture flood flows, raw water could overtop the recharge ponds and flow into the Salinas River. In addition, alteration of the Salinas River flow regime could create impacts due to the near surface aquifer system, including the potential for untreated recharged water to come into contact with the Salinas River system and potentially create significant long-term impacts to biological resources.
Construction of the conveyance pipeline along the existing Coastal Branch Pipeline would have constraints related to agricultural resources, biological resources, cultural resources, and land use. Similar constraints would also occur for the distribution pipeline.
One of the key constraints with the overall water banking program is the potential for growth-inducing effects resulting from the increase in water supplies available to accommodate future growth. Such constraint is not dependent on a specific site alternative, but rather the total volume of additional water that could be created and the reliability of such created water supply.
7.3.1 Approaches to Implement CEQA and/or NEPA
Considering the potential impacts to special-status species as well as potential growth-inducing effects, either a Project-Specific EIR or a Program EIR should be prepared for compliance with CEQA. The former would not require subsequent CEQA documentation, but would require a detailed project description of the water banking project. It may be more appropriate to prepare a Program EIR pursuant to Section 15168 of the CEQA Guidelines:
“A program EIR is an EIR which may be prepared on a series of actions that can be characterized as one large project and are related either:
− Geographically,
− As logical parts in the chain of contemplated actions,
− In connection with issuance of rules, regulations, plans, or other general criteria to govern the conduct of a continuing program, or
− As individual activities carried out under the same authorizing statutory or regulatory authority and having generally similar environmental effects which can be mitigated in similar ways.
7-17

7-18
The CEQA Guidelines recognize that a Program EIR can offer a number of advantages in addressing future actions that could be implemented as part of the banking program. Some of these advantages include:
− Provide an occasion for a more exhaustive consideration of effects and alternatives than would be practical in an EIR on an individual action,
− Allow the considerations of alternative approaches or locations;
− Ensure consideration of cumulative impacts that might be slighted in a case-by-case analysis,
− Avoid duplicative reconsideration of basic policy considerations,
− Allow the Lead Agency to consider broad policy alternatives and programwide mitigation measures at an early time when the agency has greater flexibility to deal with basic problems or cumulative impacts, and
− Allow reduction in paperwork.
A Program EIR would serve as an informational document for the public and County decision-makers. The process would culminate with Board of Supervisors hearings to consider certification of a Final EIR and a decision whether to approve the proposed project, possibly with conditions of approval.
The disadvantages of a Program EIR are that subsequent CEQA documentation would be required to authorize construction of project-specific components. Such documentation may comprise either a Project EIR or a Mitigated Negative Declaration.
If there is federal funding associated with the program, compliance with NEPA may also be required. Such federal lead agencies may include the USBR. Compliance with NEPA may involve preparation of either an EA or EIS.

8 Conclusions and Recommendations
The purpose of this project was to determine the feasibility of developing a recharge or water banking project in the Paso Robles Groundwater Basin using the County’s currently unused SWP supply. The feasibility study was intended to identify potential locations within the Basin for potential banking operations and determine the scale of potential projects that could meet the project goals, which include the following:
Improving local groundwater conditions within the Basin.
Increasing dry-year water supply reliability for local water users and possibly the residents of the County and the Central Coast.
Improving local groundwater quality in the Basin.
Providing greater flexibility of water resources management in the County and the Central Coast.
Reducing the County’s dependence on imported water supplies in below-normal years.
The hydrogeologic feasibility of the recharge and water banking alternatives was evaluated at three different locations within the Paso Robles Groundwater Basin using the existing groundwater model, updated to reflect project operations. Project costs were then estimated based upon the facility and operational requirements of each project to allow for a relative comparison between the alternatives.
This section presents the conclusions regarding water banking feasibility in the Paso Robles Groundwater Basin as a method to improve the County’s water supply reliability, and provides recommendations for future efforts to further refine the water banking opportunities.
8-1

8.1 Conclusions
8.1.1 Alternative 1 - Shell Creek/Camatta Creek and Lower San Juan Creek Recharge Areas
Hydrogeologic Feasibility - Alternative 1 appears to have adequate groundwater storage capacity and recharge and recovery capacity to support a recharge or water banking project. The results of the modeling suggest that more recharged water remains in storage than at the other two locations, and fewer wells are needed to recover the stored supply. There are concerns about the potential impacts to the groundwater system during both recharge and recovery operations, which need further investigation to address. Additional investigations are needed to evaluate site-specific aquifer parameters, including aquifer permeability, specific capacity, specific yield, anticipated drawdown at the potential extraction well, and other parameters for the site. These data are important to accurately portray the anticipated responses in the aquifer to changes in water management.
Project Goals - The recharge alternative (1a) provides some benefit to local groundwater users as higher groundwater elevations and improved dry year water supply reliability, but does not provide benefits to other areas.
The banking alternative (1b) may have a smaller benefit to local groundwater users (in the form of higher groundwater levels), but also provides benefits to banking partners, such as improved dry year water supply reliability and operational flexibility.
Additional groundwater quality data collection and analysis is needed to determine potential long-term impacts to local groundwater quality.
Engineering Considerations - Alternative 1 is the closest alternative to the source of the imported recharge water supply (PPWTP), so capital costs and O&M costs are less than the other alternatives. Additional analysis is needed to optimize the project size and operations, minimize potential high groundwater impacts, reduce losses to the stream system, reduce groundwater recovery impacts, and refine project costs.
Environmental Considerations - No environmental considerations or permitting issues have been identified at this time that increase the complexity of implementing a project at this location compared to the other alternatives.
Overall Feasibility - Overall, Alternative 1 has the most favorable hydrogeologic conditions, and the lowest cost of the evaluated alternatives. There are some local concerns about the impacts of the alternatives at this location on local rainfall runoff as they relate to local flooding, and potential delays in early season agricultural activities
8-2

due to wet or muddy conditions. In addition, recharge operations would have to be refined to reduce potential impacts from mounding of recharged water.
8.1.2 Alternative 2 - Creston Recharge Area
Hydrogeologic Feasibility - Alternative 2 does not appear to have adequate groundwater storage capacity and recharge and recovery capacity to support a water banking project of the scale evaluated in this feasibility study. The results show that the limited storage capacity causes a significant portion of the recharged water to enter the surface water system and leave the area, thereby becoming unrecoverable by either local groundwater users or a recovery well field. As a result of the limited groundwater storage capacity and less-favorable aquifer conditions, much of the recovered groundwater is native, not stored, which results in a significant drop in groundwater elevations during recovery operations.
Project Goals - The recharge alternative (2a) provides some benefit to local groundwater users as higher groundwater elevations and improved dry year water supply reliability, but does not provide benefits to other areas.
The banking alternative (2b) results in significant impacts to the local groundwater conditions from the recovery of the stored water. While this alternative may provide benefits to banking partners, such as improved dry year water supply reliability and operational flexibility, the impacts to local groundwater users prevents this alternative from meeting the project goals.
Additional groundwater quality data collection and analysis is needed to determine potential long-term impacts to local groundwater quality.
Engineering Considerations - Because of the less favorable aquifer conditions, Alternative 2 requires more recovery wells, which increase the cost of the water banking alternative at this location. The water banking operations are also more costly because of the increased distance from PPWTP. Additional analysis is needed to determine if smaller-scale recharge operations can be cost-effective at this location, but it does not appear that water banking operations can be effective at this location.
Environmental Considerations - No environmental considerations or permitting issues were identified at this time that increase the complexity of implementing a project at this location compared to the other alternatives.
Overall Feasibility - Overall, Alternative 2 is the least viable of the three sites evaluated in this feasibility study because of the unfavorable aquifer conditions.
8-3

8.1.3 Alternative 3 - Salinas River/Hwy 46 Recharge Area
Hydrogeologic Feasibility - Alternative 3 appears to have adequate groundwater storage capacity, and recharge and recovery capacity to support a recharge or water banking project. The in-lieu recharge component along Highway 46 west of Whitley Gardens appears to provide considerable recharge potential.
The direct recharge and recovery operations along the Salinas River may prove problematic because the interconnectivity of the alluvial deposits with the river may reduce the ability to recover the recharged water. This area is also relied upon by existing municipal groundwater users that may be impacted by groundwater recovery operations. Additional investigations are needed to evaluate site-specific aquifer parameters, including aquifer permeability, specific capacity, specific yield, anticipated drawdown at the potential extraction well, and other parameters for the site. These data are important to accurately portray the anticipated responses in the aquifer to changes in water management.
Project Goals - The recharge alternative (3a) provides some benefit to local groundwater users as higher groundwater elevations and improved dry year water supply reliability, but does not provide benefits to other areas.
The results of the banking alternative (3b) differ considerably between the in-lieu recharge area near Hwy 46 and the direct recharge area near the Salinas River. The portion of the banking alternative (3b) near in-lieu recharge areas appears to benefit from higher groundwater levels during the recharge periods, and more manageable impacts during the recovery period compared to the Salinas River area, which experiences much greater impacts to groundwater levels near the river during recovery periods. While this alternative (3b) may provide benefits to banking partners, such as improved dry year water supply reliability and operational flexibility, it does not meet the project goals without impacts to local groundwater users near the Salinas River and potentially to the flows in the Salinas River.
Engineering Considerations - Alternative 3 is the furthest from the source of the recharge supply, so capital costs and O&M costs are higher compared to the other alternatives. This is evident in the water banking alternative, which includes operation costs of nearly 50 percent more than Alternative 1b.
Environmental Considerations - Because of the proximity to the Salinas River, recharge and recovery operations are likely to have additional environmental issues and permitting requirements than the other alternatives, which may result from the following:
8-4

The potential for introduction of non-native invasive species into the Salinas River, which is known to provide habitat for various special-status species, including the South-Central California Coast steelhead.
The potential for raw water to overtop the recharge ponds and flow into the Salinas River.
The potential for alteration of the Salinas River flow regime that could create impacts due to the near-surface aquifer system, including the potential for untreated recharged water to come into contact with the Salinas River system and potentially create significant long-term impacts to biological resources.
Overall Feasibility - Water banking operations at this location do not appear as favorable compared to Alternative 1b because there are greater potential impacts to the local streams (Salinas River) and other municipal groundwater users, and the project has higher costs.
Recharge opportunities that warrant further investigation may exist along the Highway 46 corridor to take advantage of in-lieu recharge opportunities and the available storage capacity resulting from the groundwater depression located northeast of the City of Paso Robles.
8.2 Recommendations The following recommendations are suggested to further the understanding and management of the Paso Robles Groundwater Basin and refine potential recharge/water banking opportunities.
Groundwater Management Recommendations - Recommendations for improved groundwater management include:
Preparing a groundwater management plan to provide a framework for managing the Basin and establishing BMOs .
Preparing and implementing a groundwater monitoring plan in the Basin to track changes in groundwater levels and quality.
Installing dedicated monitoring wells as needed to fill data gaps.
Groundwater Banking Recommendations - If the County continues to pursue groundwater recharge or water banking opportunities in the Paso Robles Groundwater Basin, the emphasis should focus on the most viable sites, which include the following:
8-5

8-6
Recharge and water banking opportunities in the Shell Creek/Camatta Creek and Lower San Juan Creek Recharge Areas (Alternative 1).
In-lieu recharge opportunities along the Highway 46 corridor (part of Alternative 3). This alternative may need to be reformulated to expand the in-lieu recharge opportunities and reduce the direct recharge element along the Salinas River.
The following activities may be considered for these sites:
Preparing a preliminary engineering evaluation.
Conducting additional hydrogeologic field investigations in potential direct recharge areas to further define the aquifer system and hydrogeologic characteristics.
Conducting pilot recharge tests in potential recharge areas.
Conducting a survey of landowners in potential in-lieu recharge areas to determine their interest and willingness to participate in an agricultural in-lieu recharge program.
Completing a salt balance to estimate the impacts of salt loading resulting from the imported water.
Refining potential project operations to more accurately reflect annual and seasonal water supply availability and demand. This may include identifying specific banking partners that may store water in the basin or use banked water.
Refining the existing groundwater model to provide a more detailed analysis of the potential recharge and water banking operations.
Updating capital and O&M cost estimates based upon refined project descriptions and analyses.
Exploring the opportunities of delivering banked water directly to the Coastal Branch at locations other than PPWTP to reduce O&M and treatment costs.
Conducting additional analysis of the impacts of potential project operations on existing overlying land uses to identify potential impacts from high groundwater levels.

9 References
California Department of Water Resources, The State Water Project Reliability Report, 2005.
California Department of Water Resources, California’s Groundwater, Bulletin 118 – Update 2003.
United States Department of Agriculture, Ground-Water Recharge Hydrology, ARS 41-161, December 1970.
Groundwater Resources Association of California, California Groundwater Management, A Resource for Future Generations, Second Edition, 2005.
Fugro West and ETIC Engineering, Paso Robles Groundwater Basin Study Phase II – Numerical Model Development, Calibration, and Application, 2005.
Fugro West and Cleath and Associates, Paso Robles Groundwater Basin Study, 2002.
San Luis Obispo County Flood Control and Water Conservation District, San Luis Obispo County Integrated Regional Water Management Plan, 2005.
9-1