partition, migration, and jute cultivation in india · munich personal repec archive partition,...
TRANSCRIPT

Munich Personal RePEc Archive
Partition, migration, and jute cultivation
in India
Fenske, James and Bharadwaj, Prashant
Yale University, University of California San Diego
March 2010
Online at https://mpra.ub.uni-muenchen.de/22979/
MPRA Paper No. 22979, posted 04 Jun 2010 10:21 UTC

PARTITION, MIGRATION, AND JUTE CULTIVATION IN INDIA
PRASHANT BHARADWAJ & JAMES FENSKE†
Abstract. Climate change is expected to displace millions of involuntary migrants in Bangladesh.
We draw on history to show that these “environmental refugees” can play a positive role in the
regions that receive them by looking at the partition of India. We use an instrumental variables
(IV) strategy to show that the migrants played a major role in India’s take-up of jute cultivation.
Our estimates suggest that migrants fully explain post-Partition jute cultivation. Consistent
with migrants bringing jute-specific skills with them, we find that migrants increased jute yields
and did not increase the cultivation of other crops.
1. Introduction
In March 2010, a disputed island in the Bay of Bengal disappeared beneath the rising sea.
One expert quoted by BBC News (2010) claimed that global warming would soon swallow
more islands in the Sundarbans region of Bangladesh. Recent accounts in the popular press
have described the struggles of migrants pushed by worsening floods into Dhaka, speculating
that some thirty million Bangladeshis could be displaced by climate change (Harrabin, 2006;
Kakissis, 2010), part of a global population of “environmental refugees” that could reach 150
million by 2050 (Simms, 2003).
Academic projections have been no less gloomy. Bangladesh has been a victim of cyclonic
storms and tidal surges for decades; the worst event in 1970 killed upwards of 300,000 people
(Islam, 1992). Pouliotte et al. (2009) suggest that many of the stresses already faced by com-
munities near sea level will be exacerbated in coming years. Agrawala et al. (2003) list the
likely effects of climate change on Bangladesh as rising sea levels, higher temperatures, evapo-
transpiration losses, enhanced monsoon precipitation, reduced dry season precipitation, and
increased cyclone intensity. These will “reinforce baseline stresses that already pose a serious
impediment to the economic development of Bangladesh.” In particular, the coastal Sundarbans
region may be lost, displacing tens of millions of people. The negative effects of climate change
will not be confined to low-lying coastal areas; the catastrophic landslides in the Chittagong
Hill Tracts region in 2007 drew attention to that region’s vulnerability (Gunter et al., 2008).
Dhaka, too, is at risk (Nicholls, 1995). Other studies have reached similar conclusions (Ali, 1999;
Douglas, 2009; Myers, 1993, 2002; Parry et al., 2007).
How are we to predict the effects of a mass migration due to climate change in Bangladesh?
Reuveny (2007) suggests that the best evidence will come from past experience. He notes that,
† Dept of Economics, UC San Diego and Yale University
E-mail address: prbharadwaj[at]ucsd.edu, james[dot]fenske[at]yale.edu.Date: This version: March 2010.We would like to thank Timothy Guinnane, Atif Mian, Asim Khwaja, and Tirthankar Roy for their comments.
1

2 BHARADWAJ & FENSKE
since 1950, environmental problems have pushed an unknown number of Bangladeshi migrants
into urban areas, half a million into the Chittagong Hill Tracts, and more than fifteen million
into India. In the latter two cases, this has let to severe conflict, insurgency, and massacres.
In this paper, we focus on another historical episode of mass migration in order to answer a
more narrow question – can economies that receive mass migrants absorb them and benefit from
them? In particular, we study the impact of partition migrants on India’s jute economy.
The partition of India pushed three million refugees into the eastern states of India and
separated the jute fields of East Pakistan from Calcutta’s jute mills. In this paper, we use
these twin shocks to investigate the ability of the Indian economy to absorb these migrants.
The answer is related in turn to three broader questions. First, what economic impact did
partition have on India? Second, to what extent are migrants and refugees “good” or “bad” in
general for the receiving economy? Third, can migration act as a substitute for trade? Using
an instrumental-variables approach, we find that districts of eastern India that received more
migrants as a result of partition experienced greater increases in jute acreage and output. Yields
also rose in these districts, and similar effects are not observed for other crops. Refugees did
not depress wages or the price of jute in the districts in which they settled. These latter results
suggest that migrants spurred jute cultivation because they brought specific skills with them,
and not simply because they provided a greater supply of labor.
The migration due to partition involved approximately 16 million people crossing borders in
a span of 3 years (Bharadwaj et al., 2008b). On a broad scale, the migration brought about
demographic changes, altering sex ratios, occupational structures, and literacy rates in Pakistan
and India (Bharadwaj et al., 2008a). Mortality due to the migration was high (Hill et al., 2006).
However, there is little empirical evidence on the economic impacts of the partition. Vakil’s
Economic Consequences of a Divided India (1950) is one of the few works that has examined
some of the economic implications of the Partition. However, his analysis is at a broad level,
often looking at state level data. Moreover, the book was written before the census of 1951 and
before detailed data on agricultural outcomes were collected. Most of the work on Partition has
mainly been qualitative.1 This paper is one of the few to quantitatively analyze the impact the
migratory flows after Partition on specific economic outcomes.
Large-scale migrations are important and disruptive events that have significant impacts on
the receiving economy. While these effects are difficult to quantify, studies have linked mass
migration to, inter alia, environmental degradation in China (Ta et al., 2006), convergence
among OECD countries before 1913 (Taylor and Williamson, 2006), and state security in the
interwar period (Rudolph, 2003). During the nineteenth and early twentieth centuries, millions
of European immigrants came to the United States, and their arrival has been linked to several
outcomes, including the growth of wage inequality (Margo and Villaflor, 1987), the composition
of imports (Dunlevy and Hutchinson, 1999), and the timing of black migration out of the South
(Collins, 1997). Other studies have stressed the capacity of receiving economies to absorb
migrants, showing that they have only minor effects on native labor market outcomes in the
1See Bharadwaj et al. (2008a) for a list of some of the qualitative work on Partition.

PARTITION, MIGRATION, AND JUTE CULTIVATION IN INDIA 3
US (Altonji and Card, 1991; Borjas, 1991; Goldin, 1994; Grossman, 1982) and Israel (Friedberg,
2001).
Most of this literature, however, has concentrated on voluntary migrations, giving little at-
tention to forced or involuntary movements of people. The creation of a new border or the
forced evacuation of a population can be a traumatic event leading to severe economic disloca-
tion (Brada, 1991; Goldman, 1999; Johnson and Anderson, 1988; Kreike, 1996; Pavlinek, 1995).
Studies that examine involuntary migrations tend to focus on the resulting trauma and human
hardship, without addressing how receiving economies may be able to absorb these refugees or
might benefit from an increase in the supply of labor. Understanding this in the context of an
involuntary migration is important because who migrates is not the same as in the case of a
voluntary migration. If most members of a particular religious or ethnic group leave from the
sending country, the same pattern of skill selection may not occur as under a voluntary migration
(Borjas, 1987; Chiquiar and Hanson, 2005). In addition, it is not clear that the occupational
choices made by forced migrants will be responsive to market signals in the receiving country.
Our results suggest that a sudden increase in labor supply can make markets more responsive
to a change in the price of a labor-intensive product. Hence, we suggest that migrants can play
a positive economic role even at a time of crisis and general chaos.
Samuelson’s “Factor Price Equalization” result makes trade a substitute for migration; wages
are made equal across countries that can trade, even if labor cannot move. The reverse may
also be true – countries that cannot trade may achieve specialization through labor migration.
That most countries prefer free trade to free migration, however, suggests that the two are not
perfect substitutes (Wellisch and Walz, 1998). Theoretical and empirical results on this question
have been mixed, and have focused on whether trade encourages migration or vice versa. Lopez
and Schiff (1998) argue that trade and migration are complements, since liberalization may
spur out-migration of unskilled workers. Wong (1986) concludes that, ultimately, the result
will depend on factor endowments, technology, and preferences. In a case more analogous to
forced migration, Ethier (1985) suggests that ‘captive’ migrants unable to return to their home
countries reduce the sensitivity of output and prices to changes in international demand. The
impact of migration will also depend on whether externalities exist from migration, and whether
they can be internalized (e.g. Schiff (1996)).
Empirically, Dunlevy and Hutchinson (1999) find that trade and migration are complements,
as immigrants purchase goods produced in their home countries. Collins et al. (1997), similarly,
find that during the first wave of globalization, the substitutability of trade and migration can
be soundly rejected. Bruder (2004), alternatively, finds that while migration into Germany does
not affect the level of trade with migrants’ home countries, increased trade reduces migration.
We find that ‘captive’ migrants in Eastern India produced what they would have cultivated
in their home country, substituting domestic production for the inter-regional trade that had
existed in the absence of partition.
We address these issues by studying the partition of India in 1947, the subsequent mass
migration, and the sharp increase in the demand for jute in eastern India. Because migrants may
have selected into the districts that were most suitable for an expansion of jute production, we

4 BHARADWAJ & FENSKE
rely on an instrumental-variables approach to identify the impact of partition-related migration.
We use a district’s distance from the border at partition to predict migrant flows into a district.
We find that the districts in Eastern India most affected by migrant flows were those that took
up jute cultivation most extensively after partition, and that migrants increased both output
and yields in the districts in which they settled. Further, we find no evidence that migrants
depressed the wages of locals, or that their expansion of production adversely affected natives
through a decline in the price of jute.
The remainder of this paper proceeds as follows. Section 2 provides background on the jute
industry in Bengal. Section 3 outlines a model that explains how migrants experienced in jute
cultivation can spur not only more extensive production of jute, but also greater yields of the
crop. Section 4 explains the empirical strategy and describes the data used for the study. Section
5 presents the empirical results. Section 6 concludes.
2. Background: Jute in India and the Partition
Jute, the “golden fibre,” dominated the economic life of Bengal from the mid-nineteenth to
the mid-twentieth centuries (Sen, 1999, p. 13). Raw and manufactured jute products taken
together were India’s 5th largest export in 1878, and by 1921 they were 1st, forming more than a
quarter of India’s exports (Stewart, 1998, p. 12). Though the jute industry suffered during the
1930s, by 1940 Indian jute mills possessed 68,415 looms – 57% of the world total (Stewart, 1998,
p. 16). The industry employed approximately 300,000 people in 1940; since most of the mills
were concentrated in Calcutta, this meant that close to 15% of the population of Calcutta worked
in jute (van der Steen, 2005). Bengal held a near-monopoly on world jute cultivation, a position
due largely to its combination of sandy loam, optimal rainfall, hot and humid climate, and access
to rivulets (Sen, 1999, p. 13). Finally, jute was also labor-intensive, requiring ploughing, weeding
during its early stages of growth, harvesting by hand, and retting (Stewart, 1998, p. 28).2 Since
jute is a labor-intensive crop, Bengal’s abundant population may have given it an additional
advantage.
Partition “placed an artificial barrier between the jute-growing eastern districts and the jute
mills that had come up in the west around Calcutta” (Bose, 1993, p. 44). 81% of existing
jute cultivation was in what became East Pakistan, while all of the mills were in West Bengal
(Ghosh, 1999, p. 63). East Pakistan imposed export duties on raw jute, and selectively reduced
the quality of jute shipped to India (Ghosh, 1999, p. 63). The twin results were a sharp decline
in the supply of raw jute to Indian mills, and a subsequent increase in the price of raw jute (see
Figure 1).
Figure 2 presents evidence of the rise in Indian jute cultivation that resulted from partition.
Data here are taken from IJMA (1963). In Figure 1, it is clear that the price increases brought on
by the Second World War were not reversed after 1945. Indeed, the price of loose jute continued
to rise until 1950, and remained well above its historical average afterwards. Figure 2 reports
the total hectares planted to jute and the production of jute in West Bengal and East Pakistan,
each indexed to their 1947-48 values. While it is clear that jute production expands rapidly in
2Retting is a process in which the stalks are soaked before the fibre can be separated from the bark and stem.

PARTITION, MIGRATION, AND JUTE CULTIVATION IN INDIA 5
West Bengal after partition, no similar break appears for East Pakistan.3 Because of restrictions
on trade between the two new countries, the increased price due to demand from mills in West
Bengal affected only the Indian districts that could cultivate jute. Partition induced a clear
supply response from the Indian countryside, but not from East Pakistan. The goal of this
paper is to show the extent to which migrants contributed to this uptake.
One of the main features of the migratory flows during partition was their unevenness across
the two borders. While the flows along the Western border were fairly even (equal numbers of
people moved between West Pakistan and Indian Punjab), the flows along the Eastern border
were very uneven – approximately 3 million migrants came into Bengal and its surrounding
states, while only 600,000 migrants left India to enter East Pakistan (Bharadwaj et al., 2008b).
Hence, along with a split between jute mills and fields, the partition resulted in net positive
migration into West Bengal and states like Bihar and Orissa. Nearly 8% of West Bengal’s
population was composed of migrants in 1951. There was considerable variation in migration
across districts. Nadia and West Dinajpur in West Bengal had populations composed of 37% and
16%, respectively, of the total population in 1951, while in districts like Purnea and Hazaribagh,
this figure was less than 1%.
Though three trade agreements were concluded with East Pakistan between 1950 and 1953,
and by 1958 domestic production had expanded to supply almost the entire raw material needs
of the Indian mills (Ghosh, 1999, p. 64). In a mere 9 years after partition, we find that districts
with more migrants were the predominant suppliers of jute to the mills in Calcutta. However,
the mechanisms by which migrants affect jute outcomes (acreage, output and yield) are difficult
to disentangle, and cannot be conclusively addressed with the data we have. For example, if
the government focussed on areas with more migrants and gave them subsidies for growing
jute, then we cannot distinguish this from a story in which migrants brought in jute-specific
experience. Moreover, we cannot directly test whether migrants worked the jute fields as such
detailed occupation data is not available from this time period. However, the findings that many
other crops did not see an increase in acreage during this period and that jute yields increased
in areas with more migrants are suggestive of the effect of jute-specific skills.
The role, if any, played by migrants in facilitating jute cultivation has received no attention
in the literature. “Indeed,” writes Samaddar (1997, p. 111), “the erasure of the peasant in the
literature on movements of population cannot be more conspicuous.” Though peasants made up
three quarters of East Bengal’s Hindus, they provided only 40% of its refugees (Chatterji, 2007,
p. 118). Few left before communal violence broke out in 1949. Most went to three districts – 24
Paraganas, Calcutta and Nadia – and the rest settled largely in West Dinajpur, Cooch Behar
and Jalpaiguri. Those who were peasants “tended to cluster in agrarian, or semi-agrarian,
3Table 2 makes this point formally. While a Dickey-Fuller test rejects the null of a unit root in the East Pakistannormalized acreage series, the results for West Bengal are inconsistent with stationarity. A regression of the form
(1)Aceraget
Acerage1947= β0 + β1(Y ear − 1935)t + β2(Y ear − 1946) ∗ 1(Y ear > 1946) + ǫt
is conducted on both sub-samples. In East Pakistan, there appears to be a weakly significant downwards trendwhich does not change after 1946. In West Bengal there is no discernable trend before 1946, but after 1946 thereis a significant upwards trend.

6 BHARADWAJ & FENSKE
tracts along the border between the two Bengals” in areas with poorly drained soils that were
formerly areas of out-migration (Chatterji, 2007, p. 122-123). Kin networks helped the refugees
to settle and to buy or rent land (Chatterji, 2007, p. 115). Often, their holdings were too small
or scattered to make a living, and many drifted to urban centers (Chatterji, 2007, p. 125).
Chatterjee (1997) attributes the greatest influence of partition migrants on agrarian relations
in West Bengal not to cultivators, but to urban refugees, who served as “the most organized
and articulate section of the population and as the vanguard of organized political movements
in the state [as it] acquired new tones of radicalism.” By focusing on the role of migrants in
agriculture, we help to fill a gap in the literature, while highlighting a positive contribution made
by these refugees to the Indian economy.
3. Model
We show that the districts of eastern India that received more migrants as a result of partition
responded strongly to the increased price of raw jute. This could conceivably be explained by
the greater labor supply available in these districts, or by the skills specific to jute cultivation
that migrants brought with them, and which may have spilled over to local farmers. We control
for population density in our empirical analysis, we do not find that jute yields declined as a
result of migration, and we show that there are no similar effects for other crops. This suggests
that labor supply alone is not enough to explain the result. Here, we propose a model in which
migrants’ knowledge of a crop will make output and acreage more responsive to an increase in
the price.
This analysis builds on that of Munshi (2004). Consider the acreage allocation decision of a
farmer who must choose what area A of his total landholding L to plant to jute. The remainder,
L−A is planted to a traditional crop, whose yield per acre is known and is denoted by y. The
return to jute cultivation is uncertain. The farmer’s prior distribution on jute yield is normally
distributed, with a mean of ρ and a standard deviation of σ. It is assumed ρ > y. The expected
benefit from allocating A acres to jute is then given by:
(2) Y = ρA+ (L−A)y
The variance of this is given by:
(3) Σ2 = σ2A2
Because the normal distribution can be summarized by two moments, expected utility max-
imization here is equivalent to maximizing a function V (Y,Σ). We assume that VY (Y,Σ) > 0,
VY Y (Y,Σ) < 0, VΣ(Y,Σ) < 0 and VΣΣ(Y,Σ) < 0. The farmer’s problem is then given by:
(4) maxA≤L
V ((ρ− y)A+ Ly, σA)
At an interior solution, the first-order-condition for an optimum is:

PARTITION, MIGRATION, AND JUTE CULTIVATION IN INDIA 7
(5) 0 = VY (ρ− y) + VΣσ
After 1947, the partition of India created new opportunities for jute cultivation in India.
Within the model, these can be interpreted as an increase in ρ. Cultivators responded by
increasing their acreage, which is a prediction of the model. Totally differentiating (5) gives:
(6)dA
dρ= −
[∂VY
∂ρ(ρ− y) + VY + ∂VΣ
∂ρσ]
[∂VY
∂A(ρ− y) + ∂VΣ
∂Aσ]
≈ −
VY Y A(ρ− y) + VY
VY Y (ρ− y)2 + VΣΣσ2
So long as −VY Y (x)VY (x) x < 1, the right-hand side of (6) is positive,4 and the response to an
increase in the expected yield from jute induces increased acreage under cultivation. How do
migrant inflows alter this process? σ can be taken as a measure of the ignorance of the cultivator
about the returns to jute. There are two possible interpretations. First, migrants from East
Bengal brought with them knowledge and experience about jute which, given a change in the
composition of cultivators, will have reduced σ directly. If they passed on their knowledge to
residents of West Bengal, this would have lowered their uncertainties about the returns to jute,
providing another reason why σ may fall. Ignoring higher-order terms, it is clear that an increase
in σ in (6) will make the denominator larger in magnitude. This is equivalent to stating that:
(7)∂ dA
dρ
∂σ< 0
An increase in information makes the cultivator more responsive to a rise in ρ. That is, if
migrants brought with them knowledge and skills related to jute, we should see the greatest
increases in jute cultivation occurring in those districts that received the greatest number of
migrants.
4. Data and Empirical Strategy
4.1. Empirical Strategy. Since we relate migrant presence to jute expansion in a district,
reduced-form estimates of the impact of migration on jute cultivation will be biased by migrant
selection into districts whose unobserved characteristics may be correlated with their suitability
for expansion of jute cultivation. We rely on an instrumental-variables approach that uses the
logarithm of a district’s distance from the border to predict migrant flows into a district. The
4If we make the simplifying assumptions that the cross-partial derivatives can be ignored, i.e. VY Σ ≈ VΣY ≈ 0,then in (6):
∂VY
∂ρ= VY Y A < 0
∂VΣ
∂ρ= VΣY A ≈ 0
∂VY
∂A= VY Y (ρ− y) + VY Σσ ≈ VY Y (ρ− y) < 0
∂VΣ
∂A= VΣY (ρ− y) + VΣΣσ ≈ VΣΣσ < 0

8 BHARADWAJ & FENSKE
idea behind this instrument is that the distance migrants had to travel from East Pakistan
imposed costs on them that entered into their location decisions, and were orthogonal to the
suitability of these districts for the future cultivation of jute.
A simple empirical specification that allows us to examine the impact of partition-related
migration on jute production is:
Yi = βMi +X ′iγ + ǫ.(8)
Here, Yi is jute production or acreage per capita in district i in 1956. Mi is the share of
migrants in that district in 1956. Xi is a set of controls that includes (among other variables)
jute production in 1931, population density in 1956, literacy rates, the share of minorities in
the population in 1931, and state fixed effects. As is mentioned above, the problem with such
a specification is that factors in ǫ matter for both outcomes Yi, as well as migration Mi. OLS
estimates of β, the effect of partition related migration on output, will be biased. One way of
tackling this identification problem is to use instrumental variables. Essentially, we need to find
variables that predict migration, but are not correlated with the elements of ǫ.
Specifically, the second stage equation is:
Yi = τmi +X ′iα+ u,(9)
mi is the predicted net migratory flows in district i and is obtained from a first stage regression:
Mi = λDi +X ′iµ+ ν.(10)
As stated above, log distance Di to the eastern border is the excluded instrument from the
second stage regressions. For this specification to be valid, Di must predict Mi and must also
be uncorrelated with u, the unobserved determinants of jute cultivation. In Bharadwaj et al.
(2008b), the authors establish that partition related migration into district i is strongly related to
the distance of district i from the border. However, there are two reasons the exclusion restriction
may fail. First, distance may induce selection in the types of migrants. Second, distance may be
correlated with unobserved geographic factors that determine a district’s suitability for growing
jute.
The first type of problem is not a major concern here. Bharadwaj et al. (2008b) find that
more literate migrants traveled further from the border. We are concerned, however, with the
impact of largely illiterate and poor migrant peasants. If distance was a greater concern for them
than for wealthier, literate migrants, our instrument will under-predict the impact of distance
on the type of migration we care about, biasing our estimates of β towards, rather than away
from zero. The second concern is more worrisome a priori, but our empirical results provide
evidence in favor of our identification strategy. Our IV results are robust to the inclusion of
other observable features of the districts in our sample. When state fixed effects are included
to account for unobserved heterogeneity, the magnitude of our IV coefficient estimate rises,
suggesting that if we were able to include the full vector of determinants of jute cultivation, the
estimated impact of migration would grow larger, not smaller (Altonji et al., 2005). In addition,
the boundary decision was kept secret until independence was granted on August 15th, 1947 -
hence, there was a “surprise” element to where the boundary was actually placed. Moreover, the

PARTITION, MIGRATION, AND JUTE CULTIVATION IN INDIA 9
boundary decision was based on religious composition of the areas, as opposed to considerations
for agricultural productivity, or as is important for our case, agricultural suitability for jute.
4.2. Data. This paper uses 2 major sources of data. For variables related to demographics and
migration, we use data from the Censuses of India from 1931 and 1951.5 For the agricultural
variables, we use the 1931 Agricultural Census and the World Bank Agricultural and Climate
data set.
We use the Census data at the district level, since this is the lowest administrative unit at
which demographic data is consistently available (the census data is not at the individual level
- it is aggregated data at the district level). Further, it becomes nearly impossible to identify
the same geographical units over time if lower administrative units such as tehsils are used.
In order to create comparable units of analysis that take post-partition boundary changes into
account, administrative maps are used from the two census periods to create a visual match.
These are then validated by comparing census data on land area. These matches are described
in more detail in Bharadwaj et al. (2008a). The most important variable for our purposes is
the measure for migration. In our case, collecting this variable from the Censuses was made
simple as the Censuses of 1951 in India and Pakistan directly ask about migrant status. Hence,
migrant inflows were obtained directly from the 1951 census, since it asked respondents directly
whether they had migrated during partition. The term used for such migrants is “displaced
persons” in India, and “muhajir” in Pakistan. Neither measure captures internal migration, so
these provide a good estimate of the number of people who moved due to Partition on either
side.
The Agricultural Census of India, 1931, provides district level data on acreage and yields of
various crops. We match this district level data to the Census data in 1931 and subsequently to
data from 1951. We use the Agriculture and Climate data set for post-partition agricultural data.
The Agriculture and Climate data does not contain district level agricultural information for
1951, but it does contain district level data starting in 1956. This data set also has information on
acreage and yield of various crops. Hence, we use 1956 as our post-partition data on agriculture.
Jute output is an imputed variable, calculated by multiplying acreage by the estimated yield.
Summary statistics for the data used in our empirical analyses are presented in Table 1.
5. Results
5.1. Did migrants impact acreage and production? Table 3 presents OLS and IV esti-
mates of (8) and (9) for districts in the eastern Indian states of Bihar, West Bengal and Orissa.
These are the states that predominantly received partition migrants, and are those that mostly
cultivated jute. In column (1) of Table 3, we project acres of jute per capita on our measure of
migration and a constant. We use the square root of the migrant share of the population be-
cause visual inspection of the data suggests that the relationship is concave. Since some districts
received either few migrants or none at all, the square root is a more appropriate transforma-
tion than the natural log. Column (1) reveals a positive and statistically significant correlation
5Demographers generally do not consider the 1941 census to be reliable, and so we use the 1931 census forpre-partition district characteristics.

10 BHARADWAJ & FENSKE
between migration and jute cultivation. The raw data along with the regression line predicted
in Column (1) are depicted in Figure 3.
Column (2) adds additional controls. These are: the acreage planted to jute in 1931, popula-
tion density in 1956, a dummy for the presence of a big city in the district, male literacy in 1956,
the share of minorities in 1931, and a dummy for Nadia district. Jute acreage in 1931 is intended
to control for three possibly competing factors – a conditional convergence effect whereby dis-
tricts with low initial acreages might grow more quickly, an experience effect whereby states
with high initial acreages may find further expansion into jute more profitable, and unobserved
long-run determinants of jute suitability. Male literacy proxies for the stock of human capital,
and helps disentangle the separate effects of skilled and unskilled migrants. The big city dummy
captures demand factors that alter the orientation of agriculture. The minority ratio in 1931
controls for the long-run effects of prior occupational differences between Muslims and Hindus
within agriculture. Visually, Nadia appears to be an oultier with the highest migration rate in
the sample, but relatively low levels of jute production.
We find that the impact of partition migrants on jute cultivation is robust to the inclusion of
these additional controls. Jute acreage in 1931 positively predicts cultivation in 1956, suggesting
that it captures either unobserved suitability or the effects of accumulated experience with that
crop over time. Population density negatively predicts jute cultivation. This is surprising, since
it is a crop well suited to labor abundance. This may also be capturing the effect of smaller
urban centers that are not captured by our “big city” dummy, or substitution into even more
labor-intensive crops in these districts. The minority share in 1931 is a strong positive predictor
of jute cultivation. Areas with more minorities in 1931 saw greater out-migration as a result
of partition. That this is positively correlated with jute cultivation suggests that, as migrants
left, their farms became available for planting to other crops. As confirmed by visual inspection,
Nadia is an outlier with cultivation far below the regression line. We find no effect of either the
big city dummy, or of male literacy.
Column (3) adds the state fixed effects to control for unobserved state-level heterogeneity.
The estimated effect of migration is insignificant in this specification, but since the coefficient
has grown larger and the t-statistic is still 1.53, this is most likely due to multi-collinearity. The
estimated coefficients on the other controls remain mostly stable, though the effect of population
density falls and becomes insignificant. Column (4) adds the acreages of the other crops available
in the data in 1931. These are meant to control for similar, though competing effects as the
1931 acreage of jute.6 Unfortunately, the degrees of freedom in this regression are few, and so
the results must be viewed with caution. The estimated effects of migration, minority share
in 1931, and the Nadia dummy remain stable and significant, but the coefficients on 1931 jute
acreage, the big city dummy, and population density all change sign. The magnitude of the
effect of migration is substantial. The OLS estimates in columns (1) through (4) suggest that
a one standard deviation increase in the square root of migrant share increases the acreage
planted to jute by between 0.42 and 0.59 standard deviations. The average increase of 1.19 in
6These crops are wheat, rice, sugar, maize, groundnut, barley, tobacco, gram, ragi, sesamum, rape, bajra, cottonand jowar.

PARTITION, MIGRATION, AND JUTE CULTIVATION IN INDIA 11
our migration measure predicts between a 1.38 and 1.92 unit increase in our normalized measure
of jute acreage per capita – 63% to 83% of the average (2.20).
Columns (1) through (4) are replicated using our instrumental-variables approach in columns
(5) through (8). In all four columns we find that the causal impact of migrants on jute cultiva-
tion is robust to this approach for removing locational selection by migrants. The fact that the
IV estimates are larger suggests that migrants selected into districts that were less disposed to
jute cultivation, making their decisions along dimensions negatively correlated with suitability
for jute. Again, the magnitude of these impacts is of reasonable economic significance; across
columns, the results suggest a one standard deviation increase in our migration measure pro-
duced between a 0.47 and 0.83 standard deviation increase in jute acreage. Following the same
logic as above, our IV results suggest that on average migrants can explain between 70% and
122% of average jute acreage per capita. Estimates on the impacts of the other controls are very
similar in the IV specifications as in the OLS.
Table 4 repeats the analysis of Table 3, with an alternative measure of jute expansion –
physical output. Figure 4 shows the raw data and the regression line predicted by Column (1).
This measure is imputed by multiplying reported acres by reported yield. If, as the literature
suggests, migrants expanded cultivation on marginal lands, it is conceivable that they could
have had substantial impacts on acreage while contributing little to India’s actual take-up of
jute production. This was not the case. The results here are consistent with those of Table 3;
migration is a strong predictor of jute cultivation, and many of the same controls are significant
here and in the same direction as in Table 3. The one exception is population density. While
greater densities reduced jute acreage, table 5 will show that they also spurred higher yields.
The point estimates suggest that a one standard deviation increase in the square root of migrant
share resulted in a 0.41 to 0.57 standard deviation increase in jute output in the OLS and a 0.49
to 0.81 standard deviation increase in the IV.
5.2. Skills versus labor supply. The data we have cannot conclusively tease out the mech-
anism by which migrants drove an increase in jute output. We argue here that migrants also
drove an increase in yields, and that this is consistent with these migrants having skills specific
to jute cultivation. What this rules out is a story of raw labor supply, in which migrants ex-
panded the cultivation only onto marginal lands less suitable for jute. While it is also possible
that increased labor on a fixed amount of land can produce greater yields per acre, we find
that migrants increase yields even conditional on population density. What we cannot rule out
is that government services and agricultural technologies were more available in districts that
received more migrants as a consequence of their arrival.
Table 5 investigates whether the impact of migrants worked through an improvement of jute
yields. The ordering of columns here mirrors Tables 3 and 4. Both the OLS and the IV
estimates suggest that migrants in fact raised jute yields in the districts to which they migrated.
The economic importance of these effects is not as precisely estimated as for output. Across
OLS columns, a one standard deviation increase in our migration measure predicts an increase
in yields between 0.22 and 0.50 standard deviations; in the IV, the comparable range is 0.33 to
0.94.

12 BHARADWAJ & FENSKE
Several of the other coefficients also enter significantly. Jute acres in 1931 positively predict
later yields, furthering the conclusion that this variable is capturing either a district’s intrinsic
suitability for jute cultivation or its accumulated experience with the crop. Population den-
sity positively predicts yields, consistent with an increase in the labor intensity of agricultural
production in all types of agriculture in the most densely settled areas. The big city dummy,
surprisingly, has a negative effect on yields. This may be due to negative externalties from these
centers, greater labor costs in these districts, or to an orientation towards food production near
urban markets. Male literacy has no impact on yields. In the pre-green revolution era, in which
education was less important for farm management than today, this should not be surprising.
The share of minorities in 1931 negatively predicts later yields. Since these districts saw greater
out-migration, this may be serving as a proxy for the degree of disruption during Partition. The
large negative coefficient on yields for Nadia gives one reason why it is such an outlier in the
previous tables; while the district received many migrants, it was less suited to jute cultivation
than its observables would otherwise suggest, and so migrants were less likely to adopt jute
conditional on arriving there.
5.3. Robustness: Did migrants increase the cultivation of other crops? We have argued
so far that we have recovered a causal impact of partition-related migration on jute cultivation,
and that this has been driven by the skills that migrants carried with them. As a falsification
exercise, then, we should be able to show that the impact of migration existed only for jute,
because of its increasing importance after partition and its prevalence in the districts that sent
migrants into eastern India. Table 6 looks at whether this story can be told for crops other than
jute, and replicates column (7) of Table 3 for the other crops in the data. With the exception
of rapeseed, these results are either insignificant or negative, suggesting that the relationship
between jute expansion and migration in a jute-growing region is not a statistical artefact. This
table also builds more evidence towards a jute specific skill story (as opposed to just a net labor
supply story) as another very labor intensive crop - rice, does not see an increase in acreage.
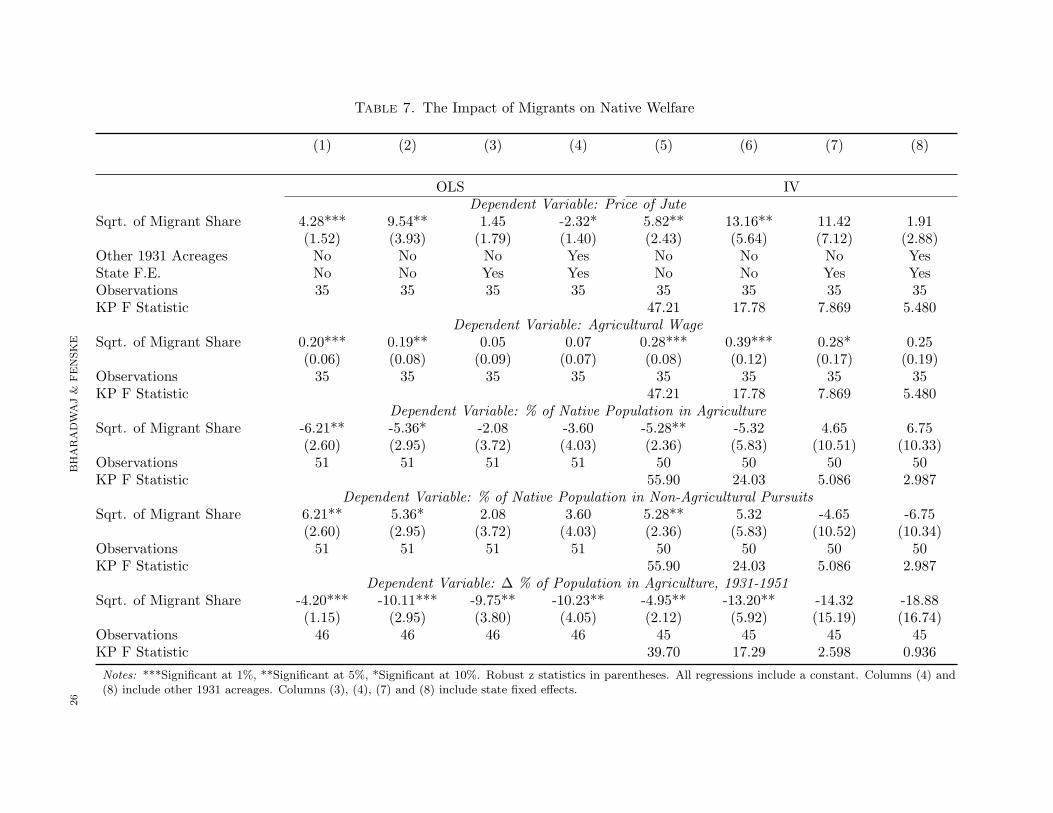
5.4. How did migrants affect native outcomes? While the above analysis shows that mi-
grants from Bangladesh increased jute acreage and output in India, this does not immediately
imply these migrants were a net benefit to the Indian population. For example, an increase in
jute output may have harmed Indian farmers by depressing prices. There are outcomes in the
agricultural census data that allow us to test for possible channels through which these migrants
may have harmed native Indians. In Table 7, we replicate the analysis of Tables 3, 4, and 5,
using these outcomes as dependent variables.
The first outcome we examine is the price of raw jute. Contrary to the suggestion that extra
output depressed prices, both the OLS and IV results suggest that, if migrants had any impact
at all on jute prices, the effect was positive rather than negative. Second, we test whether the
increased supply of labor depressed agricultural wages. Again, we find no evidence for this view.
The OLS results suggest that wages were higher in regions that received more migrants. Clearly,
this result could be due to endogeneity – migrants will, all else equal, prefer districts with higher

PARTITION, MIGRATION, AND JUTE CULTIVATION IN INDIA 13
wages. The IV results show, however, that even controlling for this possible reverse causation
there is a positive association between migration and wages.
Where migrants do appear to have affected natives in the census data is in the composition
of the labor force.7 In districts that received more migrants, the share of the native-born
population engaged in agriculture fell, while the share engaged in non-agricultural pursuits rose.
In addition, the share of the total population engaged in agriculture fell most dramatically
between 1931 and 1951 in districts that received more migrants. We are hesitant to infer a
causal impact from these results. First, when state fixed effects are included in the regressions,
these effects disappear. Second, these measures are coarse. They are divided even further into
8 categories; agriculture on owned lands, agriculture on un-owned lands, cultivating laborers,
land-owners, non-agricultural production, commerce, transport, and “miscellaneous.” We tested
for similar results using these categories (not reported), and found a positive effect of migrants
on agriculture on un-owned lands and a negative effect on cultivating labor.
In sum, there is no evidence that migrants from East Pakistan harmed Indian farmers by
depressing wages or the price of jute. There may have been a crowding out effect, in which
districts that received more migrants saw a drop in the share of both the native-born and total
populations devoted to agriculture, but the statistical evidence for this is weak.
6. Conclusion
In this study, we have used agricultural census data to investigate the differential take-up of
jute cultivation across districts within eastern India following partition. Using an instrumental-
variables strategy, we have shown that those districts that received migrants were better able
to meet the demand from a milling industry whose supply chain had been suddenly disrupted.
Though our results cannot conclusively show that experience is an important determinant of
crop choice and of responsiveness, they are consistent with such an explanation. Migrants also
increased jute yields, even conditioning on population density, and did not have similar effects
on other crops; these findings further support an explanation grounded in migrant skills. There
is no evidence that they harmed locals by depressing wages or jute prices. We have shown,
then, that even at a time of massive involuntary migration, migrants can show responsiveness
to market conditions.
These results tell us about the economic effects of the partition of India, the impact of migra-
tion on receiving economies, and the substitutability of trade for migration. We find that the
migrations associated with Partition caused massive exchanges of labor and skills, and that these
altered output choices and productivity in post-partition India. Migrants here were able to as-
sist India in responding to economic disruption, without depressing yields in jute. This suggests
that they aided both flexibility of agricultural output and brought knowledge with them that
they may have passed on to other cultivators. They produced a crop that had been previously
adopted from abroad, allowing India’s jute milling industry to persevere, substituting for the
7There is information available for these measures in a greater number of districts than for the other variables.Restricting the sample to that used in the other estimations does not change the sign or significance of any of theestimated coefficients.

14 BHARADWAJ & FENSKE
trade in raw jute that had predated partition. Taken as a whole, our results highlight a positive
role played by partition’s refugees in eastern India, one that has been largely overlooked.
Climate change will create severe challenges for Bangladesh. Rising sea levels and greater
erosion threaten to push millions of people from their homes. News accounts and academic
studies have focused on the struggles of these environmental refugees in urban slums, and on the
possibility of violent conflict (e.g. Reuveny (2007)). Our results suggest that migrants and the
economies that receive them are resilient. While this cannot justify the suffering of those who
are forced to move, it is clear that these migrants are capable of making beneficial contributions
where they arrive.
References
Agrawala, S., Ota, T., Ahmed, A. U., Smith, J., and van Aalst, M. (2003). Development and
climate change in Bangladesh: focus on coastal flooding and the Sundarbans. Environment Di-
rectorate and Development Cooperation Directorate, Organisation for Economic Cooperation
and Development (OECD), Paris.
Ali, A. (1999). Climate change impacts and adaptation assessment in Bangladesh. Climate
Research, 12:109–116.
Altonji, J., Elder, T., and Taber, C. (2005). Selection on observable and unobservable variables:
Assessing the effectiveness of Catholic schools. Journal of Political Economy, 113(1):151–184.
Altonji, J. G. and Card, D. (1991). The effects of immigration on the labor market outcomes
of less-skilled natives, pages 201–234. Immigration, trade and the labor market. University of
Chicago Press, Chicago.
BBC News (2010). Disputed Bay of Bengal island ‘vanishes’ say scientists.
Bharadwaj, P., Khwaja, A., and Mian, A. (2008a). The big march: Migratory flows during after
the partition of India. Economic and Political Weekly, (43):39–49.
Bharadwaj, P., Khwaja, A., and Mian, A. (2008b). The partition of India: Demographic conse-
quences. Working Paper.
Borjas, G. J. (1987). Self-selection and the earnings of immigrants. The American Economic
Review, 77(4):531–553.
Borjas, G. J. (1991). Immigrants in the US labor market: 1940-80. The American Economic
Review, 81(2):287–291.
Bose, S. (1993). Peasant Labour and Colonial Capital: Rural Bengal Since 1770. Cambridge
University Press Cambridge (United Kingdom).
Brada, J. C. (1991). The economic transition of Czechoslovakia from plan to market. Journal
of Economic Perspectives, 5(4):171–177.
Bruder, J. (2004). Are trade and migration substitutes or complements?-the case of Germany,
1970-1998. European Trade Study Group, September, pages 9–11.
Chatterjee, P. (1997). The Present History of West Bengal: Essays in Political Criticism. Oxford
University Press.
Chatterji, J. (2007). The Spoils of Partition: Bengal and India, 1947-1967. Cambridge Univer-
sity Press.

PARTITION, MIGRATION, AND JUTE CULTIVATION IN INDIA 15
Chiquiar, D. and Hanson, G. H. (2005). International migration, self-selection, and the distri-
bution of wages: Evidence from Mexico and the United States. Journal of Political Economy,
113(2):239–281.
Collins, W. J. (1997). When the tide turned: Immigration and the delay of the great black
migration. The Journal of Economic History, 57(3):607–632.
Collins, W. J., O’Rourke, K. H., Williamson, J. G., and Center, L. (1997). Were trade and
factor mobility substitutes in history? NBER Working Paper, pages 06–01.
Douglas, I. (2009). Climate change, flooding and food security in south Asia. Food Security,
1(2):127–136.
Dunlevy, J. A. and Hutchinson, W. K. (1999). The impact of immigration on American import
trade in the late nineteenth and early twentieth centuries. Journal of Economic History,
59(4):1043–1062.
Ethier, W. J. (1985). International trade and labor migration. The American Economic Review,
75(4):691–707.
Friedberg, R. M. (2001). The impact of mass migration on the Israeli labor market. Quarterly
Journal of Economics, 116(4):1373–1408.
Ghosh, T. (1999). Income and productivity in the jute industry across the 1947 divide. A case
for labour history, pages 54–81.
Goldin, C. (1994). The political economy of immigration restriction in the United States, 1890
to 1921. The Regulated Economy: A Historical Approach to Political Economy.
Goldman, M. F. (1999). Slovakia Since Independence: A Struggle for Democracy. Greenwood
Publishing Group.
Grossman, J. B. (1982). The substitutability of natives and immigrants in production. The
review of economics and statistics, 64(4):596–603.
Gunter, B. G., Rahman, A., and Rahman, A. F. M. A. (2008). How vulnerable are Bangladeshs
indigenous people to climate change? Bangladesh Development Research Working Paper
Series (BDRWPS).
Harrabin, R. (2006). Climate fears for Bangladesh’s future.
Hill, K., Seltzer, W., Leaning, J., Malik, S. J., and Russell, S. S. (2006). The demographic
impact of partition: Bengal in 1947.
IJMA (1963). Annual summary of jute and gunny statistics. Indian Jute Mills Association,
Calcutta.
Islam, M. (1992). Natural calamities and environmental refugees in Bangladesh. Refuge, 12(1):5–
10.
Johnson, D. H. and Anderson, D. (1988). The Ecology of Survival: Case Studies from Northeast
African History. L. Crook Academic Pub.
Kakissis, J. (2010). Environmental refugees unable to return home. New York Times.
Kreike, E. H. (1996). Recreating Eden, Agro-ecological Change, Food Security and Environmental
Diversity in Southern Angola and Northern Namibia, 1890-1960. Yale University.
Lopez, R. and Schiff, M. (1998). Migration and the skill composition of the labour force: The
impact of trade liberalization in ldcs. The Canadian Journal of Economics, 31(2):318–336.

16 BHARADWAJ & FENSKE
Margo, R. A. and Villaflor, G. C. (1987). The growth of wages in antebellum America: New
evidence. Journal of Economic History, 47(4):873–895.
Munshi, K. (2004). Social learning in a heterogeneous population: Technology diffusion in the
Indian green revolution. Journal of Development Economics, 73(1):185–213.
Myers, N. (1993). Environmental refugees in a globally warmed world. Bioscience, 43(11):752–
761.
Myers, N. (2002). Environmental refugees: A growing phenomenon of the 21st century. Philo-
sophical Transactions of the Royal Society of London, 357(1420):609–613.
Nicholls, R. J. (1995). Coastal megacities and climate change. GeoJournal, 37(3):369–379.
Parry, M. L., Canziani, O. F., Palutikof, J. P., van der Linden, P. J., and Hanson, C. E. (2007).
Climate change 2007: Impacts, adaptation and vulnerability. Cambridge University Press
Cambridge.
Pavlinek, P. (1995). Regional development and the disintegration of Czechoslovakia. Geoforum,
26(4):351–372.
Pouliotte, J., Smit, B., and Westerhoff, L. (2009). Adaptation and development: Livelihoods
and climate change in Subarnabad, Bangladesh. Climate and Development, 1(1):31–46.
Reuveny, R. (2007). Climate change-induced migration and violent conflict. Political Geography,
26(6):656–673.
Rudolph, C. (2003). Security and the political economy of international migration. American
Political Science Review, 97(4):603–620.
Samaddar, R. (1997). Still they come: Migrants in the post-partition bengal. Reflections on
Partition in the East, pages 104–114.
Schiff, M. (1996). South-north migration and trade: a survey. Policy Research Working Paper
Series.
Sen, S. (1999). Women and Labour in Late Colonial India: The Bengal Jute Industry. Cambridge
University Press.
Simms, A. (2003). Unnatural disasters. The Guardian.
Stewart, G. T. (1998). Jute and Empire: The Calcutta Jute Wallahs and the Landscapes of
Empire. Manchester University Press.
Ta, W., Dong, Z., and Sanzhi, C. (2006). Effect of the 1950s large-scale migration for land recla-
mation on spring dust storms in northwest China. Atmospheric Environment, 40(30):5815–
5823.
Taylor, A. M. and Williamson, J. G. (2006). Convergence in the age of mass migration. European
Review of Economic History, 1(1):27–63.
Vakil, C. N. (1950). Economic consequences of divided India: a study of the economy of India
and Pakistan. Vora.
van der Steen, B. (2005). The jute industry: A statistical overview. Working Paper.
Wellisch, D. and Walz, U. (1998). Why do rich countries prefer free trade over free migration?
the role of the modern welfare state. European Economic Review, 42(8):1595–1612.
Wong, K. (1986). Are international trade and factor mobility substitutes? Journal of Interna-
tional Economics, 21(1-2):25–43.

PARTITION, MIGRATION, AND JUTE CULTIVATION IN INDIA 17
Figure 1. The price of raw jute in Calcutta

18 BHARADWAJ & FENSKE
Figure 2. Trend breaks in jute acreage and output
West Bengal is indicated with a solid line, East Pakistan with a dotted line.

PARTITION, MIGRATION, AND JUTE CULTIVATION IN INDIA 19
Figure 3. Migration and Jute Acreage
Figure 4. Migration and Jute Output

20 BHARADWAJ & FENSKE
Figure 5. Migration and Jute Yield

PARTITION, MIGRATION, AND JUTE CULTIVATION IN INDIA 21
Table 1. Summary Statistics
MeanStd.Dev. Min. Max. n
Jute Acres per Capita x 100, 1956 2.20 3.86 0 15.1 35Jute Output per Capita x 100, 1956 1.92 3.34 0 13.7 35Jute Yield x 100, 1956 63.2 42.3 0 129 35Sqrt. of Migrant Share 1.19 1.41 0.14 6.11 35Log Distance from Border 4.12 1.06 1.95 5.48 35Jute Acres/100, 1931 87.3 220 0 1,200 35Pop. Density/100, 1956 6.45 5.01 1.46 28.8 35Big City Dummy 0.057 0.24 0 1 35Male Literacy, 1956 21.3 8.25 7.69 40.5 35Minority Share, 1931 15.8 16.4 0.19 55.6 35Nadia Dummy 0.029 0.17 0 1 35
Table 2. The Structural Break in Jute Acreage
(1) (2)
Dependent Variable: Jute Acreage (1947=1)East Pakistan West Bengal
Year-1935 -0.04* 0.00(0.02) (0.04)
Year-1946 if Year > 1946 0.04 0.16**(0.03) (0.06)
Observations 27 27Dickey Fuller Test -4.407 -1.4531% Critical Value -3.743 -3.74310% Critical Value -2.629 -2.629
Notes: ***Significant at 1%, **Significant at 5%, *Significant at 10%. Absolute value of t statistics in paren-theses. All regressions include a constant.

22
BHARADWAJ&
FENSKE
Table 3. The Impact of Migrants on Jute Acreage
(1) (2) (3) (4) (5) (6) (7) (8)
Dependent Variable: Jute Acres per Capita X 100OLS IV
Sqrt. of Migrant Share 1.61*** 1.16** 1.33 1.48 2.26*** 1.30*** 2.11*** 2.20***(0.43) (0.58) (0.87) (0.95) (0.58) (0.41) (0.66) (0.78)
Jute Acres/100, 1931 0.01*** 0.01*** -0.01 0.01*** 0.01*** -0.01(0.00) (0.00) (0.01) (0.00) (0.00) (0.01)
Pop. Density/100, 1956 -0.10** -0.06 0.26 -0.09* -0.02 0.35**(0.05) (0.05) (0.17) (0.05) (0.05) (0.18)
Big City Dummy 1.07 0.52 -8.03*** 1.06 -0.00 -9.33***(1.33) (1.73) (3.04) (1.33) (1.51) (3.05)
Male Literacy, 1956 -0.08 -0.07 0.01 -0.09 -0.08 -0.00(0.06) (0.07) (0.05) (0.07) (0.08) (0.05)
Minority Share, 1931 0.10*** 0.11*** 0.13*** 0.09*** 0.09*** 0.10**(0.02) (0.02) (0.04) (0.02) (0.03) (0.05)
Nadia Dummy -7.17** -7.90** -6.10* -7.63*** -10.42*** -8.32***(2.81) (3.72) (3.35) (2.05) (2.68) (2.66)
Observations 35 35 35 35 35 35 35 35Other 1931 Acreages No No No Yes No No No YesState F.E. No No Yes Yes No No Yes YesKP F Statistic 47.21 17.78 7.869 5.480
Notes: ***Significant at 1%, **Significant at 5%, *Significant at 10%. Robust z statistics in parentheses. All regressions include a constant.

PARTIT
ION,MIG
RATIO
N,AND
JUTE
CULTIV
ATIO
NIN
INDIA
23
Table 4. The Impact of Migrants on Jute Output
(1) (2) (3) (4) (5) (6) (7) (8)
Dependent Variable: Jute Output per Capita X 100, 1956OLS IV
Sqrt. of Migrant Share 1.36*** 0.98* 1.03 1.18 1.93*** 1.17*** 1.73*** 1.72**(0.33) (0.52) (0.81) (0.79) (0.49) (0.37) (0.65) (0.73)
Jute Acres/100, 1931 0.01*** 0.01*** -0.01 0.01*** 0.01*** -0.01(0.00) (0.00) (0.00) (0.00) (0.00) (0.01)
Pop. Density/100, 1956 -0.06 -0.04 0.40*** -0.05 0.00 0.47***(0.05) (0.05) (0.13) (0.05) (0.05) (0.14)
Big City Dummy 0.22 -0.06 -11.46*** 0.21 -0.53 -12.43***(1.39) (1.68) (2.18) (1.40) (1.49) (2.28)
Male Literacy, 1956 -0.05 -0.05 0.03 -0.06 -0.05 0.02(0.05) (0.06) (0.04) (0.07) (0.07) (0.04)
Minority Share, 1931 0.07** 0.08*** 0.08** 0.06* 0.06 0.06(0.03) (0.03) (0.03) (0.03) (0.04) (0.04)
Nadia Dummy -5.30** -5.61 -3.84 -5.93*** -7.87*** -5.48**(2.54) (3.43) (2.88) (1.83) (2.59) (2.57)
Observations 35 35 35 35 35 35 35 35Other 1931 Acreages No No No Yes No No No YesState F.E. No No Yes Yes No No Yes YesKP F Statistic 47.21 17.78 7.869 5.480
Notes: ***Significant at 1%, **Significant at 5%, *Significant at 10%. Robust z statistics in parentheses. All regressions include a constant.

24
BHARADWAJ&
FENSKE
Table 5. The Impact of Migrants on Jute Yields
(1) (2) (3) (4) (5) (6) (7) (8)
Dependent Variable: Jute Yield X 100, 1956OLS IV
Sqrt. of Migrant Share 9.83*** 22.29*** 11.31 16.04* 14.97*** 34.86*** 42.26** 42.10***(3.10) (6.98) (7.94) (8.29) (5.31) (11.74) (20.79) (15.89)
Jute Acres/100, 1931 0.06*** 0.07*** 0.10* 0.07*** 0.07*** 0.06(0.02) (0.01) (0.05) (0.02) (0.02) (0.07)
Pop. Density/100, 1956 5.51*** 6.06*** 10.47*** 6.25*** 7.81*** 13.68***(1.22) (1.57) (3.44) (1.50) (1.87) (3.54)
Big City Dummy -89.87*** -83.63*** -219.57*** -90.08*** -104.17*** -267.01***
(21.09) (30.80) (68.88) (25.50) (38.72) (76.22)Male Literacy, 1956 -0.91 -1.35 -1.20 -1.59 -1.68* -1.51
(0.95) (0.85) (1.28) (1.04) (0.96) (1.20)Minority Share, 1931 -1.49** -1.17* -1.91*** -2.22** -2.06* -2.79***
(0.72) (0.62) (0.54) (0.94) (1.07) (0.80)Nadia Dummy -55.98*** -30.90 -27.57 -97.08** -129.75* -107.82**
(19.79) (20.40) (26.56) (40.20) (68.24) (49.48)
Observations 35 35 35 35 35 35 35 35Other 1931 Acreages No No No Yes No No No YesState F.E. No No Yes Yes No No Yes YesKP F Statistic 47.21 17.78 7.869 5.480
Notes: ***Significant at 1%, **Significant at 5%, *Significant at 10%. Robust z statistics in parentheses. All regressions include a constant.

PARTIT
ION,MIG
RATIO
N,AND
JUTE
CULTIV
ATIO
NIN
INDIA
25
Table 6. Placebo: The Impact of Migrants on Other Crops
(1) (2) (3) (4) (5) (6) (7)
Dependent Variable: Acreage X 100, 1956Wheat Rice Sugar Maize G.nut Barley Tobacco
Sqrt. of Migrant Share -0.17 -0.94 -0.86 2.85 -0.09 -1.26* 0.49(0.86) (15.25) (0.57) (2.86) (0.07) (0.74) (0.39)
Gram Ragi Sesame Rape Bajra Cotton JowarSqrt. of Migrant Share -0.59 -0.44 -1.13* 0.95*** -0.01 -0.03 -0.01
(1.23) (0.37) (0.68) (0.26) (0.02) (0.04) (0.01)
Notes: ***Significant at 1%, **Significant at 5%, *Significant at 10%. Robust z statistics in parentheses. All regressions include a constant. All regressions areIV with log distance from the border as the excluded instrument. All regressions include state fixed effects and the other controls included in Column (7) ofTable 3. The number of observations is 35 and the Kleibergen-Paap F-Statistic is 7.869.
26
BHARADWAJ&
FENSKE
Table 7. The Impact of Migrants on Native Welfare
(1) (2) (3) (4) (5) (6) (7) (8)
OLS IVDependent Variable: Price of Jute
Sqrt. of Migrant Share 4.28*** 9.54** 1.45 -2.32* 5.82** 13.16** 11.42 1.91(1.52) (3.93) (1.79) (1.40) (2.43) (5.64) (7.12) (2.88)
Other 1931 Acreages No No No Yes No No No YesState F.E. No No Yes Yes No No Yes YesObservations 35 35 35 35 35 35 35 35KP F Statistic 47.21 17.78 7.869 5.480
Dependent Variable: Agricultural WageSqrt. of Migrant Share 0.20*** 0.19** 0.05 0.07 0.28*** 0.39*** 0.28* 0.25
(0.06) (0.08) (0.09) (0.07) (0.08) (0.12) (0.17) (0.19)Observations 35 35 35 35 35 35 35 35KP F Statistic 47.21 17.78 7.869 5.480
Dependent Variable: % of Native Population in AgricultureSqrt. of Migrant Share -6.21** -5.36* -2.08 -3.60 -5.28** -5.32 4.65 6.75
(2.60) (2.95) (3.72) (4.03) (2.36) (5.83) (10.51) (10.33)Observations 51 51 51 51 50 50 50 50KP F Statistic 55.90 24.03 5.086 2.987
Dependent Variable: % of Native Population in Non-Agricultural PursuitsSqrt. of Migrant Share 6.21** 5.36* 2.08 3.60 5.28** 5.32 -4.65 -6.75
(2.60) (2.95) (3.72) (4.03) (2.36) (5.83) (10.52) (10.34)Observations 51 51 51 51 50 50 50 50KP F Statistic 55.90 24.03 5.086 2.987
Dependent Variable: ∆ % of Population in Agriculture, 1931-1951Sqrt. of Migrant Share -4.20*** -10.11*** -9.75** -10.23** -4.95** -13.20** -14.32 -18.88
(1.15) (2.95) (3.80) (4.05) (2.12) (5.92) (15.19) (16.74)Observations 46 46 46 46 45 45 45 45KP F Statistic 39.70 17.29 2.598 0.936
Notes: ***Significant at 1%, **Significant at 5%, *Significant at 10%. Robust z statistics in parentheses. All regressions include a constant. Columns (4) and(8) include other 1931 acreages. Columns (3), (4), (7) and (8) include state fixed effects.