particulate organic matter in sixteen tuamotu atoll lagoons (french polynesia)
TRANSCRIPT

MARINE ECOLOGY PROGRESS SERIES Mar Ecol Prog Ser Published May 22
I
Particulate organic matter in sixteen Tuamotu atoll lagoons (French Polynesia)
Loi'c Charpyl-*, Philippe Dufourl, Nicole Garcia2
'ORSTOM. Centre d'Oceanologie de Marseille, Rue de la Batterie des Lions, F-13007 Marseille, France 'LOB OSU, Luminy, 163 AV. de Luminy, F-13288 Marseille Cedex 09, France
ABSTRACT. The s t and~ng stock and chemical composition of suspended particles were monitored In 16 Tuamotu atoll lagoons and surrounding oceanic water between 1983 and 1996 Temporal and spatial variability was estimated from 18 surveys performed in Takapoto. Atoll lagoon partlculate organic matter (POM) concentrations were compared using data taken during the same months (March and November) and at the same time (morning). It appears that the lagoonal particulate organic carbon concentration depends on the latltude of each lagoon. We interpret this result as an influence of the waters deriving from the Peruvian and equatorial upwellings. Phytoplankton biomass (chlorophyll) concentration was inversely related to the water exchange between lagoon and ocean. Therefore, the best atolls for pearl oyster farming seem to be those located north of the Tuamotu Archipelago and with snlall exchange with the occan. POM concentration cvas 2 to 5 tunes higher in the atoll lagoons than in the surrounding oceanlc water, wlth a hlgher C:N ratio and a lower N:P ratio. The small size of organic particles (70 '% < 3 pm) and the low contl-ibution of phytoplankton to particulate organlc carbon (POC) (S to 19%) in the lagoons must be taken into account when calculating the potential of pearl oysters, which cannot exceed the nutritional potential of Tuamotu atoll lagoons.
KEY WORDS: Particulate matter . Atoll Geomorphology . Pacific Carbon . Nitrogen . Phosphorus Pigments
INTRODUCTION
The lagoons of the Tuamotu archipelago play an important role in the French Polynesian economy. Cul- tured pearls from pearl oyster aquaculture in Tuamotu atolls are French Polynesia's major export (82.3% in 1987). This archipelago also accounts for a great part of the French Polynesian coastal fisheries (77 ?l;!.;, in 1987).
The level of exploitation of the Tuamotu lagoons de- pends on their distance from Tahiti, the most inhabited island of French Polynesia, and also on their natural marlne resources. Many atolls do not have a natural population of pearl oysters and the presence of a pas- sage linking ocean and lagoon is required in order to set up commercial fisheries.
Takapoto atoll pearl culture was begun on a regular basis in 1970. In 1974, this atoll was selected for the UNESCO Man and Biosphere program, which led an
'E-mall: charpy@orstom.~io net
extensive knowledge of the lagoonal ecosystem. Pearl oyster Pinctada margaritifera aquaculture increased from 1970. However, the atoll was devastated in 1983 by a period of high cyclonic activity (Salvat & Richard 1985). In 1985, a massive mortality of P. margarjtifera showed that the biological conditions of the lagoon may have changed drastically Therefore, a multidis- ciplinary program (PGRN) was launched in 1991 to extend the knowledge of the lagoonal ecosystem, com- pare present environmental conditions with conditions existing at the beginning of the aquaculture activity and study the biology of P. rnargaritifera. In 1982 the ORSTOM ATOLL program was launched in Tikehau, an atoll without pearl oyster farming but with an important fishery. The CYEL program (1991 to 1996) is a continuation of the ATOLL program with a special focus on the pelagic microbial loop (Charpy 1992).
The extrapolation of the existing scientific knowl- edge on a few atoll lagoons to most of the others is impossible due to high geomorphological diversity. The oblective of the research program 'TYPATOLL'
0 Inter-Research 1997 Resille of full article not permitted

56 Mar Ecol Prog Ser 151: 55-65, 1997
(1994 to 1997) is to answer the question: 'How does the type of an atoll influence the structure and funct~oning of its lagoon?' (Dufour & Harmelin-Vivien 1997).
The black lip pearl oyster is a filter feeder which obtains its food mainly from the particulate organic matter (POM). It is capable of efficiently filtering par- ticles > 3 pm (Dufour et al. 1996) Therefore, the study of the stock, quality and size of the POM is of great interest for the estlmatlon of the lagoonal aquaculture potential, and also of the lagoon productivity
Here, we present results on POM measurements performed in 16 Tuamotu atoll lagoons between 1983 and 1996. Results of such measurements from Tikehau lagoon were published in Charpy & Charpy-Roubaud (1991) and we used these data for comparison with the other atolls. Temporal variability was estimated using the Takapoto data because we had at our disposal 19 surveys performed between 1991 and 1992. We have tried to estimate the influence of the geomorpholoyy of atol.1~ on the biological fu.nctioning of their lagoons by comparing the quality and the quantity of their POM. The ratio of particulate organic carbon to chlorophyll a (P0C:chl a) was used to estimate the contribution of autotrophic organisms to suspended POM.
The location of the 16 prospected atolls appears in Fig. 1 and their characteristics in Table 1.
MATERIAL AND METHODS
Station location and sampling strategy. The sam- pling strategy used in the 3 programs 1s summarized in Table 2.
During the PGRN program, the lagoon of Takapoto was sampled monthly between June 1991 and Novem- ber 1993 at Stns 1, 2 and 3, at 6:00, 12:00 and 18:00 h at Stns 1 and 2 and at 6:00 and 12:OO h at Stn 3. Stn 1 is located close to the village and shows the maximum density of pearl oyster farms and spat collection. Stn 2 is located close to the main reef flat spillway. The Stn 3 area presents low density of spat collectors and only one pearl oyster farm.
Samples were collected during the TATU expedition of the ATOLL program in November 1985 in 3 atoll lagoons: Rangiroa. Taiaro and Toau.
During TYPATOLL, 3 expeditions (TYl, TY2, TY3) took place in 9 atoll lagoons in 1994 and 10 in 1995 and 1996. Sampling was undertaken in the morning at the surface (0.5 m depth) in 5 areas located at the north, south, east, west and in the center of the lagoon and in 3 stations per area. Sampling was also done at 1.5 m above the bottom in the central station. Six oceanic stations were sampled at the surface in 1995 and 1996.
Fiq. 1. Location of sur-
19" S "eyed atolls and stations prospected in Takapoto,
1 50°W 148"W 146"W 144"W 142"W 140°W Ranyiroa and Toau

Charpy et al. POM In Tuamotu atoll lagoons 57
Table 1. Characteristics of the 16 prospected atolls durlng the ATOLL, PGRN and TYPATOLL programs. S,,: atoll area; S,,,,: lagoon area (km2); NP: no, of passages; EAD: estimated average depth (m); Por . calculated porosity; Inh.. no. of inhabitants;
Expl.: marlne commercial exploltat~on
Atoll Latitude Longit.ude S,,, S,,,, 'NP EAD Por. Inh Expl Source Expedition
Amanu 17"50'S 140°47'W 343 315 3 45 21 100 TY1 Haraiki 17"28'S 143"26'W 24.6 10.4 l 10 19 20 TY1, 2, 3 Hikueru 17'35's 142'38'W 107 82 0 25 18 300 Pearl TY1, 2, 3 Hiti 16'43's 144"06'W 25 15 0 10 19 0 TY2,3 Kaueh~ 15"50'S 145"09'W 343 315 1 50 22 200 Pearl TY1, 2, 3 Marokau 18'03's 142'16'W 256 217 1 30 17 50 TY2,3 Nihiru 16O41'S 142'5O'W 100 80 0 20 25 20 TY1, 2, 3 Rangiroa 15"IO'S 147"40'W 1762 1592 2 25 22 2000 Fish, pearl Stoddart (1969) TATU
Ricard (1985) Reka-Reka 16'50's 141°55'\V 52 0.7 0 1 2 0 TY1, 2, 3 Taiaro 15"45'S 144"38'W 17.3 11.8 0 15 1 3 Chevallier & Salvat (1976) TATU,
Poli & Salvat (1976) TY2,3 Takapoto 14'30's 14S020'W 104 81 0 25 2 500 Pearl Salvat & Richard (1985) PGRN, Tekokota 17"19'S 142"34'W 7.3 5.1 1 3 59 0 TY1. 2, 3 Tepoto Sud 16'49's 144O17'W 6.2 1.6 1 5 15 0 TY1, 2, 3 Tikehau 15"OO'S 148"10aW 448 394 1 25 20 250 Fish Intes et al. (1994) ATOLL Toau 15'50's 146OOO'W 652 561 2 25 39 15 TATU Tuanake 16'38's 144Oll'W 38 26 1 25 24 0 TYl
Water samples were taken with a 5 1 Niskin bottle fitted with a Teflon spring.
Chemical analyses of seston. During the pre-1995 expeditions, 500 to 1000 m1 of sea water was filtered through a 25 mm diameter Whatman GF/F processed filter (precombusted for 4 h at 450°C and precleaned with 1 N HC1) for particulate organic carbon (POC), nitrogen (PON) and phosphorus (POP) analysis. POC and PON concentrations were determined after rinsing the filter with 20 m1 of HCl(0.1 N) with a CHN analyzer (Gordon & Sutcliffe 1973). POP was oxidized with per- sulfate at 110°C for 1.5 h (Menzel & Corwin 1965) and phosphate concentrations were subsequently analyzed by spectrophotometry (Strickland & Parsons 1972).
After 1995, particulate matter samples were col- lected on precombusted (450°C for 24 h) GF/F glass fiber filters (25 mm diameter) by filtering 500 m1 (for phosphorus) and 1000 m1 (for carbon and nitrogen) of sea water. In oceanic areas, 1000 m1 and 2000 m1 were filtered respectively. Particulate C and N concentra- tions were determined with a LECO 800 CHN analyzer calibrated with glycine samples. Two aliauots were necessarv to obtain
was oxidized with persulfate at 120°C for 30 min (Pujo- Pay & Raimbault 1994). The phosphate concentrations were determined in a Technicon Auto Analyzer (Tre- guer & Le Corre 1975).
For chlorophyll determinations, 250 m1 of the water sample was filtered through a GF/F filter or a Nucle- pore 3 pm filter. Pressure heads during fractionation never exceeded 0.004 atm. Fluorescence was mea- sured before and after acidification with 50 p1 of l N HC1 (Yentsch & Menzel 1963). The fluorometer was previously calibrated using Sigma chlorophyll a stan- dard.
Size structure. To measure the size structure of sus- pended particles, water samples were successively fil- tered through a 3 pm filter (Nuclepore), then through a GF/F filter. The percentage of POC, PON and POP in the c3 pm fraction was calculated by comparing with the direct measurement through the GF/F filter. The chlorophyll concentration of the >3 pm fraction was measured directly on the 25 mm diameter 3 pm Nucle- pore filter.
the'organic fraction values (POC and Table 2. Sampllng strategy during the expeditions in the 16 prospected atolls. N.,,,: no. of prospected stations per lagoon
PON). The first filter was used to measure the total (organic + inorganic) carbon and nitrogen and the second One (same and ditions) was combusted at 450°C for
Program Expedition Date N,,,, Depth (m)
ATOLL Surveys Oct 1983-Jan 1987 48 0, 5, 10,15,20,25,30 ATOLL TATU NOV 1985 2 0, 5. 10, 15, 20
24 h to eliminate the organic and keep the inorganic fraction. The difference between the 2 results gives us the POC and PON concentrations. POP
TYP:tTOLL TYI Nov 1994 5 0, bottom TYPATOLL TY2 Nov 1995 5 0, bottom TYPATOLL TY3 Mar l996 5 0, bottom PGRN Surveys Jun 1991-Dec 1992 3 0, 5, bottom
58 Mar Ecol Prog Ser 151: 55-65, 1997
RESULTS
Takapoto atoll
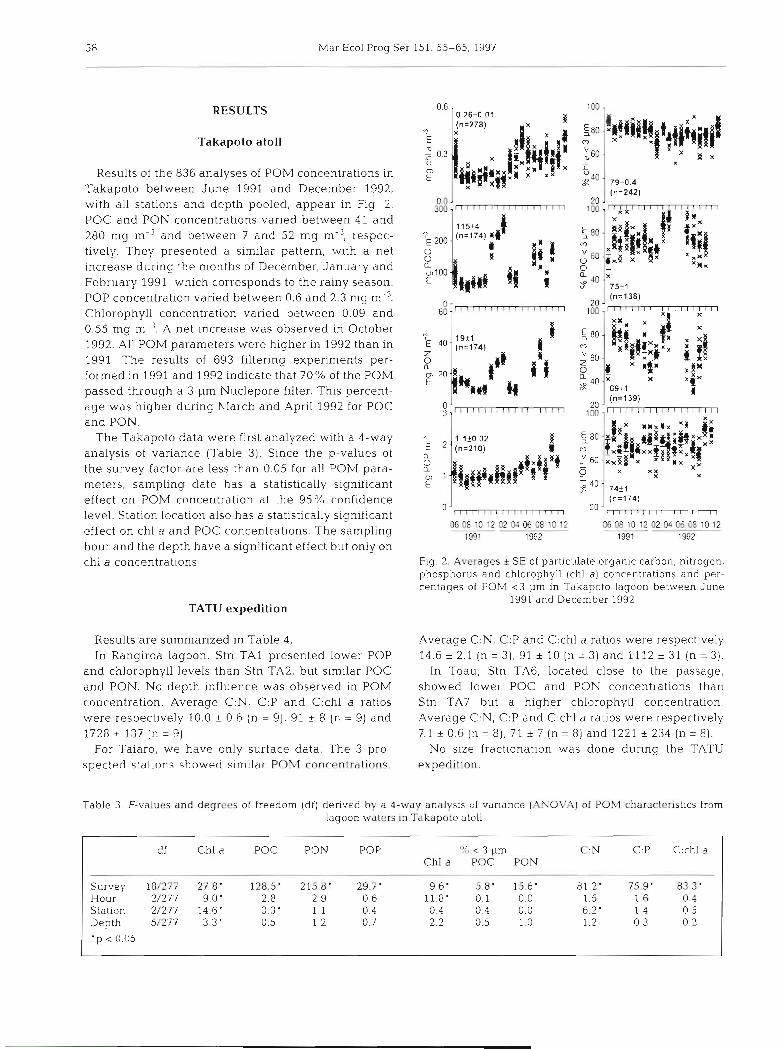
Results of the 836 analyses of POM concentrations in Takapoto between June 1991 and December 1992, with all stations and depth pooled, appear in Fig 2. POC and PON concentrations varied between 41 and 280 mg m-3 and between 7 and 52 mg m-3, respec- tively. They presented a similar pattern, with a net increase during the m.onths of December, January and February 1991, which corresponds to the rainy season. POP concentration varied between 0.6 and 2.3 mg Chlorophyll concentration varied between 0.09 and 0.55 mg m-3. A net increase was observed in October 1992. All POM parameters were hlgher in 3.992 than in 1991 The results of 693 filtering experiments per- formed in 1991 and 1992 indicate that 70% of the POM passed through a 3 pm Nuclepore filter. This percent- age was higher durlng March and April 1992 for POC and PON.
The Takapoto data were first analyzed with a 4-way analysis of variance (Table 3). Since the p-values of the survey factor are less than 0.05 for all POM para- meters, sampling date has a statistically significant effect on POM concentration at the 95% confidence level. Station location also has a statistically significant effect on chl a and POC concentrations. The sampling hour and the depth have a significant effect but only on chl a concentrations
TATU expedition
Results are summarized in Table 4. In Rangiroa lagoon, Stn TA1 presented lower POP
and chlorophyll levels than Stn TA2, but similar POC and PON. No depth influence was observed in POM concentration. Average C:N, C:P and C:chl a ratios were respectively 10.0 i 0.6 (n = 91, 91 + 8 (n = 9) and 1728 + 137 (n = 9).
For Taiaro, we have only surface data. The 3 pro- spected stations showed similar POM concentrations
Fig. 2. Averages & SE of particulate organic carbon, nitrogen, phosphorus and chlorophyll (chl a) concentrations and per- centages of POM <3 pm in Takapoto lagoon between June
1991 and December 1992
Average C:N, C:P and C:chl a ratios were respectively 14.6 * 2.1 (n = 3) , 91 * 10 (n = 3) and 1112 + 31 (n = 3)
In Toau, Stn TA6, located close to the passage, showed lower POC and PON concentrations than Stn TA7 but a higher chlorophyll concentration. Average C:N, C:P and C:chl a ratios were respectively 7.1 _+ 0.6 (n = 81, 71 k 7 ( n = 8) and 1221 + 234 (n = 8).
No size fractionation was done during the TATU expedition.
Table 3 F-values and degrees of freedom (df) derived by a 4-way analysis of vanance (ANOVA) of POM characterist~cs from lagoon waters in Takapoto atoll
df C h l a POC PON POP ')/0<3prn C:N C:P C:chl a C h l a POC PON
Survey 18/277 27.8' 128.5' 215.8' 29.7' 9.6' 5.8' 15.6' 81 2 ' 75.9' 83.3' Hour 2/277 9.0' 2.8 2.9 0.6 11.8' 0.1 0.0 1.5 1.6 0.4 Station 2/277 14.6' 3.3' 1.1 0.4 0.4 0.4 0.0 6.2 ' 1.4 0.5 Depth 5/277 3.3' 0.5 1.2 0.7 2.2 0.5 1.0 1.2 0.3 0.2

Charpy et al.: POM in Tuamotu atoll lagoons 59
Atoll Stn Depth (m) POC PON POP Chl a
Rangiroa TA1 0 214 25 2.0 0 15 6 260 29 3.4 0.14
10 220 26 2.5 0.12 15 194 2 1 1.9 0 12 22 222 27 1.8 0.13
TA2 0 268 29 3.9 0.18 6 253 25 4.0 0.19
10 286 30 5.0 0.20 15 225 27 4.4 0.21
Average 238 * 9 27 t 1 3.2 t 0.4 0.16 t 0.01 N 9 9 9 9
Tairao TA3 0 197 15 2.4 0.17 TA4 0 242 13 2.2 0.23 TA5 0 191 16 2.4 0.17
Average 210 * 16 15 2 1 2.3 * 0.1 0.19 + 0.02 N 3 3 3 3
Toau TA6 0 88 13 2.1 0 16 6 155 25 1.7 0.16
10 103 23 2.1 0.18 15 120 15 2.0 0.18
TA? 0 145 15 1.5 0.11 6 170 28 1.8 0.11
10 239 32 3.4 0.14 15 244 3 1 3.9 0.10
Average 158 * 21 23 t 3 2.3 * 0.3 0.14 t 0.01 N 8 8 8 8
Table 4. POM (mg m-:') and average * standard error in the 3 prospected atoll Dry season (TY3 expedition) lagoons during the TATU expedition (November 1985)
The atolls may be separated into 3 groups according to their average POM concentrations (Fig. 4): (1) Ha- raiki, Reka-Reka, Taiaro; (2) Hik.ueru, Hiti, Marokau, Nihiru, Tepoto; and (3) Kauehi, Tekokota. The chl a concen- tration observed in Tekokota lagoon was lower than the ocean concentra- tion. In surface oceanic waters, the POM concentrations were 0.04 k 0.00 mg chl a m-3, 49 k 5 mg C m-3, 12.8 k
1.3 mg N m-3, 0.4 2 0.0 mg P m-3. The percentages of chl a <3 pm were above 701'0 except in Taiaro (53%), Tepoto (39%) and Tekokota (26%). The percentages of POC and PON < 3 pm were all above 60%.
The same atolls and the same sta- tions we]-e prospected during the TY2 (November, beginning of the rainy season) and TY3 (March to April, be- ginning of dry season) expeditions. These data were analyzed with a l-way analysis of variance (Table 5). The factor 'expedition' has a sig- nificant effect on chl a and PON con- centrations and on the percentages of chl a and POC < 3 pm. Concentrations
Rainy season (TY1 and TY2 expeditions) were higher but percentages <3 pm were lower during the TY3 expedition.
The atolls may be separated into 4 groups according to their average POM concentrations (Fig. 3): (1) Reka- Reka; (2) Taiaro, Tepoto; (3) Amanu, Haraiki, Hikueru, DISCUSSION Hiti, Kauehi, Marokau, Nihiru, Tuanake; and (4) Teko- kota. The chl a observed in Tepoto lagoon was of the Temporal and spatial variability same order of magnitude as in group 3 but POC, PON and POP concentrations were in the range of values In Takapoto, we observed a seasonal variability observed in group 2. In surface oceanic waters, the with an increase of POM concentration during the POM concentrations were 0.06 + 0.01 mg chl a m-3, austral summer, which corresponds to the rainy and 42 k 9 mg C m-" 6.5 k 1.2 mg N m-3, 0.8 + 0.1 mg P m-3. cyclonic period. Indeed, we observed at this period a The percentages of chl a <3 pm were above 70% higher exchange of water between lagoon and ocean except in Taiaro (58":) and Tekokota (58%). The per- due to wave action. The wind also produces a centages of POC and PON <3 pm were all above 60% homogenization, of the water column and a resuspen-
Table 5. F-values and degrees of freedom (df) derlved by a l-way analysls of variance (ANOVA) of POM characteristics from TY2 and TY3 expeditions
Chl a POC PON POP % < 3 p m C:N C:P C:chl a Chl a POC

-oUqd JO Aii~pnpo~d iuei-iodu~! am spaya-i S~J. 'uoou ire rn 5u1u~oui aqi UI pamseam asoqi SB q61q se 331~1 aJaM 6ulua~a am UT paJnsreaiu suoT1reJjuaauoa e 1q3
a6re~as Aq paieu~melu03 aq ABLU pure afire~~r~ aq1 01 asop pa1e301 ST T UIS T PUB z SUIS ire paAJasqo SUO~~SJ~U~~UO~ am JO ~req~ sp~~qj-OMJ sew uoo6e1 ojod -P>IBL u1 1 u~s JB pamseam uoi~re~~ua3uoa e ~qa aqL
juasa~d ie pauire~dxa aq louurea 1661 UI paAJasqo iuaiuo3 wad MOT
3~ ~661 UI pa~~asqo SUOI~~J~U~~UO~ P 1qa 01 JPIIUIS
aJre SJP~A asaq UI paA-iasqo Suogre-rJuaauoa e 1q3
ieqi PaMoqs (9661 AdJ@KI) V66l Pup £66 u! PauJOi -lad Bu!~dures 'paapui -MO[ A~puor~daaxa aq 04
pa-readde 1661 u1 uo~irefluaauoa i/\lod ~uo~suadsnsa~ iuawpas ST AIIA~PP p~ap~q UT asrea~au~ ~ure~~mo~uo~ re 1noqir~ aauepunqe yrepapeq JO asea~au~ ue JOJ uo!] -reue~dxa AIB>IIT isom q IP~ iap~suoa Aau xoo6re1 nreqayii UT a~urepunqre ~e~~apreq pue paads PUIM
UaaMJaq UOTJB~aJJ03 IUPX~~U~IS e paAJaSq0 (i',661) Jnojna 9 UO~~JUOJ. l an em 31ure6~0 31qjuaq JO uors
(uoseas Au!~J) s-ia3e.m. aaej-ins 31ueaao pue suoo6e1 Ilop niomenL papadso~d 91 aqi 30 z~ ui luri p ~od 10 sabeiuas~ad pue suotiel~uaauo3 e lip pue sn~oqdsoqd 'ua6o~i1u 'UOQJE~ srue610 a~e~na~ped 10 33 T sa6e-i~~~ & 6y
Charpy et al.: POM in Tuamotu atoll lagoons 61
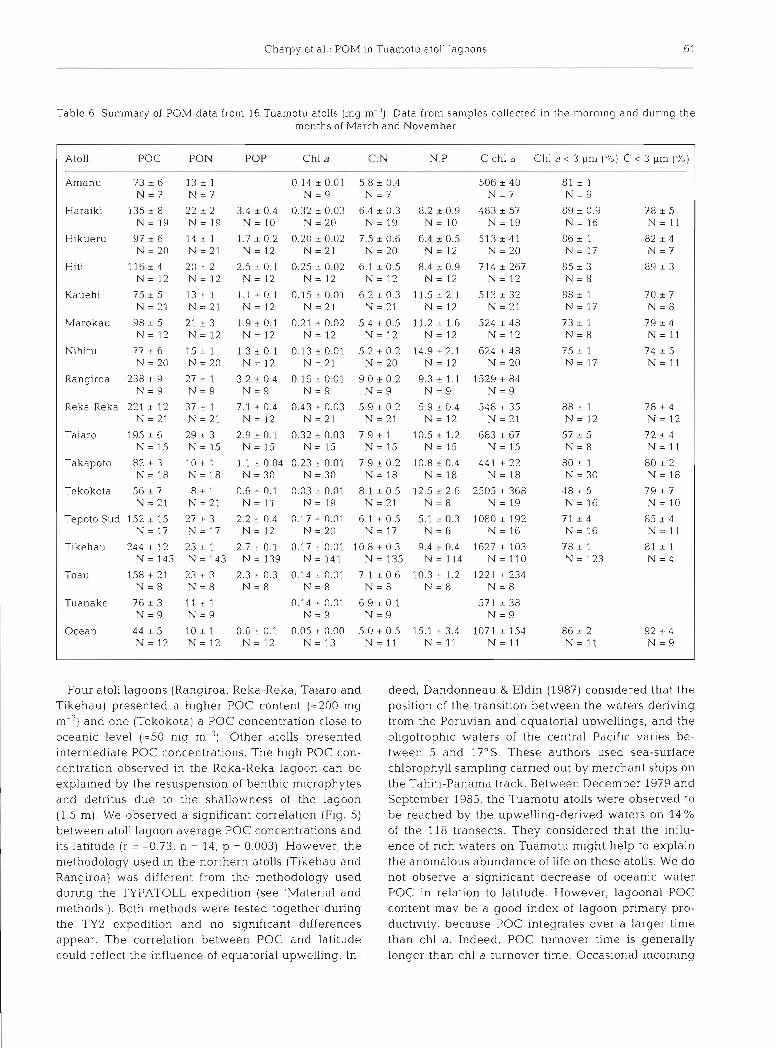
Table 6. Summary of POM data from 16 Tuamotu atolls (mg m--'). Data from samples collected in the mornlng and during the months of March and November
Atoll POC PON POP Chl a C:N N:P C ~ h l a Chl a < 3 pm ( ' V o ) C < 3 pm ('K,) -.
Amanu 7 3 2 6 1 3 * 1 0.14 * 0.01 5 .8 r 0.4 506 r 40 81 * 1 N = 7 N = 7 N = 9 N = 7 N = 7 N = 9
Haraiki 135 * 8 22 * 2 3.4 * 0.4 0.32 * 0.03 6.4 r 0 .3 8 .2 2 0 9 483 r 57 89 z 0.9 78 * 5 N = 1 9 N - 1 9 N = 1 0 N = 2 0 N = 1 9 N = 1 0 N = 1 9 N = 16 N = l l
H~kueru 97 r 6 14 r l 1.7 * 0.2 0.20 * 0.02 7.5 r 0.6 6.4 r 0.5 513 r 41 8 6 * 1 82 * 4 N = 2 0 N - 2 1 N = 1 2 N = 2 1 N = 2 0 N = 1 2 N = 20 N = 17 N = 7
Hltl 116 * 4 20 i 2 2 .5 * 0.1 0.25 * 0.02 6.1 + 0.5 8.4 r 0 9 714 r 267 85 * 3 89 + 3 N = 1 2 N = 1 2 N = 1 2 N = 1 2 N = 1 2 N = 1 2 N = 1 2 N = 8
Kauehi 75 z 5 13 2 1 1.1 * 0.1 0.15 * 0.01 6.2 r 0.3 11.5 + 2 1 513 r 32 88 * 1 70 * 7 N = 2 1 N = 2 1 N = 1 2 N = 2 1 N = 2 1 N = 1 2 N = 2 1 N = 17 N = 8
Marokau 98 * 5 21 * 3 1.9 * 0.1 0.21 + 0.02 5.4 r 0 .5 11.2 r 1.6 524 * 48 73 r l 79 * 4 N = 1 2 N = 1 2 N = 1 2 N = 1 2 N = 1 2 N = 1 2 N = 12 N = 8 N = l l
Nihiru 77 + 6 15 * 1 1.3 + 0.1 0.13 5 0.01 5.2 r 0.2 14.9 t 2.1 624 + 48 75 * 1 74 t 5 N - 2 0 N = 2 0 N = 1 2 N - 2 1 N = 2 0 N = 1 2 N = 2 0 N = 1 7 N = l l
Rangiroa 238 + 9 27 * 1 3.2 * 0.4 0.16 r 0.01 9.0 r 0.2 9.3 r 1.1 1529 * 84 N = 9 N = 9 N = 9 N = 9 N = 9 N = 9 N = 9
Reka-Reka 221 + 12 37 r 1 7.1 2 0.4 0.43 r 0.03 5.9 r 0.2 5.9 + 0.4 548 2 35 8 8 t 1 7 8 ~ 4 N = 2 1 N = 2 1 N - 1 2 N = 2 1 N = 2 1 1\;=12 N = 2 1 N = 12 N - 1 2
Taiaro 195 + 6 29 + 3 2.9 + 0.1 0.32 * 0.03 7.9 * 1 10.5 * 1.2 683 rt 67 57 z 5 72 + 4 N = 1 5 N = 1 5 N = 1 5 N = 1 5 N - 1 5 N = 1 5 N = 1 5 N = 8 N = l 1
Takapoto 82 + 3 10 * 1 1.1 * 0.04 0.23 + 0.01 7.9 + 0.2 10.8 5 0.4 441 + 22 80 * 1 80 * 2 N = 1 8 N = 1 8 N = 3 0 N = 3 0 N = 1 8 N = 1 8 N = 1 8 N = 30 N = 18
Tekokota 56 c 7 8 * 1 0.6 * 0.1 0.03 * 0.01 8.1 r 0.5 12.5 i 2.6 2505 + 368 48 z 5 79 + 7 N = 2 1 N - 2 1 N = l l N = 1 9 N = 2 1 N = 8 N = 1 9 N = 16 N - l 0
Tepoto Sud 152 r 15 27 2 3 2.2 + 0.4 0.17 r 0.01 6.1 r 0.5 5.1 + 0.3 1080 r 192 71 * 4 85 2 4 N = 1 7 N = 1 7 N = 1 2 N = 2 0 N = 1 7 N = 6 N = 16 N = 16 N = l1
Tikehau 244 z 12 23 * 1 2.7 + 0.1 0.17 + 0.01 10 8 r 0 3 9.4 1 0 . 4 1627 + 103 78 * 1 81 * 1 N = 1 4 3 N = 1 4 3 N = 1 3 9 N = 1 4 1 N = 1 3 5 N = 1 1 4 N = 1 1 0 N = 123 N = 4
Toau 158 r 21 23 * 3 2 .3 * 0 .3 0.14 z 0.01 7 1 i 0 6 10.3 -r 1.2 1221 t 234 N = 8 N - 8 N = 8 N = 8 N = 8 N = 8 N = 8
Tuanake 76 r 3 11 t 1 0.14 t 0.01 6 9 * 0.1 571 X 38 N = 9 N = 9 N - 9 N = 9 N = 9
Ocean 44 r 5 10 * 1 0.6 i 0.1 0.05 k 0.00 5 0 t 0.5 15 1 + 3 4 1071 + 154 86 z 2 92 rt 4 N = 1 2 N = 1 2 N = 1 2 N = 1 3 N = l l N - l 1 N = l 1 N = l l N = 9
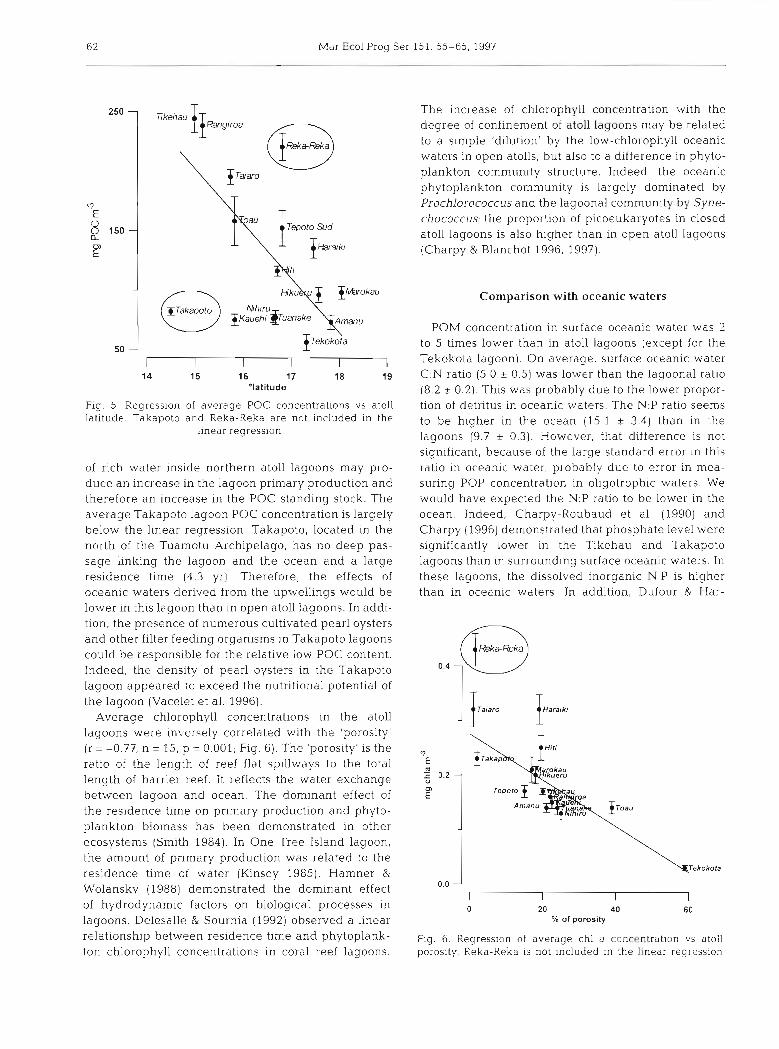
Four atoll lagoons (Rangiroa, Reka-Reka, Taiaro and Tikehau) presented a higher POC content (2200 mg m-3) and one (Tekokota) a POC concentration close to oceanic level (=50 mg m-"). Other atolls presented intermediate POC concentrations. The high POC con- centration observed in the Reka-Reka lagoon can be explained by the resuspension of benthic microphytes and detritus due to the shallowness of the lagoon (1.5 m). We observed a significant correlation (Fig. 5) between atoll lagoon average POC concentrations and its latitude (r = -0.73, n = 14, p = 0.003). However, the methodology used in the northern atolls (Tikehau and Rangiroa) was different from the methodology used during the TYPATOLL expedition (see 'Material and methods'). Both methods were tested together during the TY2 expedition and no significant differences appear. The correlation between POC and latitude could reflect the influence of equatorial upwelling. In-
deed, Dandonneau & Eldin (1987) considered that the position of the transition between the waters deriving from the Peruvian and equatorial upwellings, and the oligotrophic waters of the central Pacific varies be- tween 5 and 17"s. These authors used sea-surface chlorophyll sampling carried out by merchant ships on the Tahiti-Panama track. Between December 1979 and September 1985, the Tuamotu atolls were observed to be reached by the upwelling-derived waters on 1 4 % of the 118 transects. They considered that the influ- ence of rich waters on Tuamotu might help to explain the anomalous abundance of life on these atolls. We do not observe a significant decrease of oceanic water POC in relation to latitude. However, lagoonal POC content may be a good index of lagoon primary pro- ductivity, because POC integrates over a larger time than chl a. Indeed, POC turnover time is generally longer than chl a turnover time. Occasional incoming
62 Mar Ecol Prog Ser 151. 55-65, 1997
+ Tepoto Sud
The increase of chlorophyll concentration with the degree of confinement of atoll lagoons may be related to a simple 'dilution' by the low-chlorophyll oceanic waters in open atolls, but also to a difference in phyto- plankton community structure. Indeed, the oceanic phytoplankton community is largely dominated by Prochlorococcus and the lagoonal community by Syne- chococcus; the proportion of picoeukaryotes in closed atoll lagoons is also higher than in open atoll lagoons (Charpy & Blanchot 1996, 1997).
l 1 I I 1 14 15 16 17 18 19
"latitude
Fig. 5. Regression of average POC concentrations vs atoll latitude. Takapoto and Reka-Reka are not included in the
h e a r regression
of rich water inside northern atoll lagoons may pro- duce an increase in the lagoon primary production and therefore an increase in the POC standlng stock. The average Takapoto lagoon POC concentration is largely below the linear regression. Takapoto, located in the north of the Tuamotu Archipelago, has no deep pas- sage linking the lagoon and the ocean and a large residence time (4.3 yr) Therefore, the effects of oceanic waters derived from the upwellings would be lower in this ].agoon than in open atoll lagoons. In addi- tlon, the presence of numerous cultivated pearl oysters and other filter feeding organisms in Takapoto lagoons could be responsible for the relative low POC content. Indeed, the density of pearl oysters in the Takapoto lagoon appeared to exceed the nutritional potential of the lagoon (Vacelet et al. 1996).
Average chlorophyll concentrations in the atoll lagoons were inversely correlated with the 'porosity' (r = -0.77, n = 15, p = 0.001; Fig. 6). The 'porosity' is the ratio of the length of reef flat spillways t.o the total length of harrier reef. It reflects the water exchange between lagoon and ocean. The dominant effect of the residence time on primary production and phyto- plankton biomass has been demonstrated in other ecosystems (Smith 1984). In One Tree Island lagoon, the amount of primary product~on was related to the residence time of water (Kinsey 1985). Hamner & Wolansky (1988) demonstrated the dominant effect of hydrodynamic factors on biological processes in lagoons. Delesalle & Sournia (1992) observed a linear relationship between residence time and phytoplank- ton chlorophyll concentrations in coral reef lagoons.
Comparison with oceanic waters
POM concentration in surface oceanic water was 2 to 5 times lower than in atoll lagoons (except for the Tekokota lagoon). On average, surface oceanic water C:N ratio (5.0 * 0.5) was lower than the lagoonal ratio (8.2 + 0.2). This was probably due to the lower propor- tion of detritus in oceanic waters. The N:P ratio seems to be higher in the ocean (15.1 * 3.4) than in the lagoons (9.7 + 0.3). However, that difference is not significant, because of the large standard error in this ratio in oceanic water, probably due to error in mea- suring POP concentration in oligotrophic waters. We would have expected the N:P ratio to be lower in the ocean. Indeed, Charpy-Roubaud et al. (1990) and Charpy (1996) demonstrated that phosphate level were significantly lower in the Tikehau and Takapoto lagoons than in surrounding surface oceanic waters. In these lagoons, the dissolved inorganic N:P is higher than in oceanic waters. In addition, Dufour & Har-
1 Haraiki
l
Toau
20 40 60 % of porosity
Fig. 6. Regression of average chl a concentrahon vs atoll porosity. Reka-Reka is not included In the linear regression

Charpy et al.. POM in Tuamotu atoll lagoons 63
melin-Vivien (1997) found evidence that the more the lagoons are isolated from the ocean, the more they are depleted in phosphate. The reverse can be observed for dissolved inorganic nitrogen.
The percentages of POC < 3 pm and chl a 1 3 pm in surface oceanic waters (92 2 4 % and 86 c 2 "/o respec- tively) were higher than in lagoonal waters (79 * 1 % and 78 k 1%) . The small size of organic particles in oceanic waters reflects the high proportion of pro- chlorophytes observed in these waters by Charpy & Blanchot (1996).
Comparisons with other coral reef lagoons
Data on POC concentrations in coral reef lagoons are sparse. Tuamotu POC concentrations were foundable in the same range as other coral reef lagoons (Table 7). The high values observed at the Houtman Abrolhos Reefs (Western Australia) are due to the extensive beds of macroalgae. Their POM export from the surf zone is of the order of 3000 to 9000 g C m-' d-' (Hatcher 1983). However, the absolute values of POM concentrations in coral reef lagoons reflect not only the natural variability of these parameters, but also the major errors asso- ciated with the methods employed (Hatcher 1983).
POM quality
The proportion of phytoplankton C to total POC is low in Tuamotu lagoons. Indeed, using the C:chl a ratio of Table 6 and the phytoplankton C:chl a ratio of 82 determined by Charpy et al. (1992) in Takapoto, we calculate that phytoplankton C represents from 5% (minimum value observed in Tikehau) to 19% (maxi- mum value observed in Takapoto) of the total POC of the prospected atoll lagoons. The metabolism of the numerous cultivated pearl oysters is probably respon- sible for the higher phytoplankton contribution to POM observed in Takapoto. Indeed, waste products from the reared Pinctada margaritifera stock in Takapoto lagoon enhanced the growth rates of phytoplankton by decreasing the regeneration time of the nutrients (Vacelet e t al. 1996). Effectively, the average phyto- plankton doubling rate per day was lower in Takapoto than in Tikehau (1.1 and 1.3 d-' respectively for the < l pm fraction, Charpy 1996). Bacterioplankton consti- tutes 40 to 60% of the living planktonic biomass in Takapoto and Tikehau lagoon (Dufour et al. 1996). Tor- reton & Dufour (1996) have shown that a large part of the bacteria is inactive in these lagoons. Moreover, pearl oysters were capable of efficiently filtering par- ticles >3 pm, including bacterial aggregates and bac-
Table 7. Particulate organic carbon (POC; mg C m-3) In coral reef lagoon waters. Taken partly from Hatcher (19831 and Marshal1 et al. (1975)
Lagoon POC Source Lagoon Ocean
Enewetak Atoll 20-50 18-30 Gerber & Marshal1 (1982) Fdnning Atoll 80 Gordon (1971), Smith & Pesret (1974) Canton Atoll 160 Smith & Jokiel (1975a, b) Kavariti Atoll 349 240 Qasim & Sankaranarayanan (1970) Houtman Atoll 1560-3660 14-42 Hatcher (1983) South Caicos 130 40 Marshal1 et al. (1975) Kanohe Bay 420 Coles & Strathman (1973) Lizard Island 82-16 185-243 Moriarty (1979) New Caledonia 222 + 19 Clavier et a1 (1995) Tikehau Atoll 192 52 + 3 Charpy & Charpy-Roubaud (1991) Great Astrolabe Reef 145 Charpy et al. (1996)
Amanu 73 + 6 44 ? 5 This study Haraiki 135 ? 8 44 2 5 Hikueru 97 * 6 44 + 5 Hiti 116 + 4 44 + 5 Kauehi 75 + 5 4 4 + 5 Marokau 98 + 5 44 + 5 Nihiru 77 2 6 44 + 5 Rangiroa 238 T 9 Reka-Reka 221 + 12 44 * 5 Taiaro 195 r 6 44 k 5 Takapoto 82 2 3 Tekokota 56 ? 7 4 4 * 5 Tepoto Sud 152 + 15 44 + 5 Tikehau 244 + 12 Toau 158 T 21 Tuanake 76 + 3 44 + 5
64 Mar Ecol Prog Ser 151. 55-65, 1997
teria attached to particles. However, these larger par- ticles are generally insignificant in lagoon water (Dufour et al. 1996). The main part of the POC consists of detritus (Charpy & Charpy-Roubaud 1990) with a high turnover time, and more than 70% of the POM has a size smaller than 3 pm and cannot be retained by adult Pinctada margari t i fera . This result has to be taken into account when calculating the density of pearl oysters which can be supported by the nutritional potential of Tuamotu atoll lagoons.
CONCLUSIONS
POM in Tuamotu atoll lagoons varied between 56 and 244 mg C m-3. The concentration increased appre- ciably during the austral summer. The level of POM depends strongly on the latitude of the atoll. Indeed, the northern atolls of the Tuamotu Archipelago will be enriched by nutrient-rich waters deriving from the Peruvian and equatorial upwellings. The more the lagoons are isolated from the ocean, the higher their phytoplankton biomass. POM concentration in lagoons was 2 to 5 times higher than in oceanic waters. Organic particles were larger than in the ocean, w ~ t h higher C:N and lower C:P ratios. However, 70% of the POM had a size under 3 pm and these small pa.rticles would not be usable directly by the adult pearl oysters. These characteristics of the POM in atoll lagoons have to be taken into account in calculations of their biotic capac- ity with a view to defining the densities at which Pinc- t ada margar i t i fera can be cultured. In Takapoto atoll lagoon, the high density of pearl oyster farms causes a decrease in POM content and an increase of phyto- plankton biomass.
Taking into account the POM quality and quantity, the best atolls for pearl oyster farming seem to be those located in the north of the Tuamotu Archipelago (higher POM content), with small exchange with the ocean (higher phytoplankton content).
Acknowledgements. This work was carried out in French Polynesia wlthin the framework of the PGRN, CYEL, PNRCO and TYPATOLL programs. We thank L. Lo, J.-P. Rochette and A. Pellan for technical help in the field and in the lab. This work is dedicated to Sylvaln Bonnet, our friend and colleague who died in an accident in 1996, just after the last TYPATOLL expedition.
LITERATURE CITED
Charpy L (1992) The CYEL program: energy flow and organic-matter cycling in atoll lagoons. UNEP Reg Seas Rep Stud 147:69-75
Charpy L (1996) Phytoplankton biomass and production in two Tuamotu atoll lagoons (French Polynesia). Mar Ecol Prog Ser 145:133-142
Charpy L, Blanchot J (1996) Prochlorococcus contribution to phytoplankton biomass and production of Takapoto atoll (Tuamotu arch~pelago). CR Acad Sci Ser I11 Life Sci 319: 131-137
Charpy L, Blanchot J (1997) Relative contributions of Pro- chlorococcus and Synechococcus to phytoplankton biomass and production in eleven Tuamotu atolls (French Polynesia). Proc 8th Int Symp Coral Reef. Panama (in press)
Charpy L, Blanchot J , Lo L (1992). Contribution des cyano- bacteries (Synechococcus spp.) a la production phyto- planctonique dans un lagon d'atoll ferme (Takapoto, Tuamotu, Polynesie Fran~aise) . CR Acad Sci Ser 111 314:395-401
Charpy L, Charpy-Roubaud CJ (1990) Trophlc structure and productivity of the lagoonal communities of Tikehau atoll (Tuamotu Archipelago, French Polynesia). Mydrobiolog~a 207:43-52
Charpy L , Charpy-Roubaud CJ (1991) Particulate organic matter fluxes in a Tuamotu Atoll Lagoon (French Poly- nesia). Mar Ecol Prog Ser 71:53-63
Charpy L. Harrison N, Maata M (1996) Nutrients and particu- late organic matter in The Great Astrolabe Reef Lagoon. ORSTOM Tahiti Notes et Doc Oceanogr 46:5-10
Charpy-Roubaud CJ. Charpy L, Cremoux JL (19901 Nutnent budget of the lagoonal waters in an open South Pacific atoll (Tikehau. Tuamotu, French Polynesia). Mar Biol 107:67-73
Chevallier JP, Salvat R (1976) Etude geomorphologique et biologique de l'atoll ferme de Taiaro (Tuamotu, Polynesie Fran~aise) . Cah Pac 16:169-202
Clavier J , Chardy P, Chevillon C (1.995) Sedimentation of particulate matter In the south.-west lagoon of New Cale- donia: spatial and temporal patterns. Estuar Coast Shelf Sci 40:281-294
Coles SL, Strathmann R (1973) Observations on coral mucus 'flocs' and their potential trophic significance. Lirnnol Oceanogr 18:673-678
Dandonneau Y. Eldin G (1987) Southwestward extent of chlorophyll-enriched waters from the Peruvian and Equd- tonal upwellings between Tahiti and Panama. Mar Ecol Prog Ser 38:283-294
Delesalle B, Sournia A (1992) Residence time of water and phytoplankton b~omass in coral reef lagoons. Cont Shelf Res 12:939-949
Dufour P, Harmelin-V~vlen M (1997) A research program for a typology of atoll lagoons: strategy and first results Proc 8th Int Symp Coral Reef, Panama (in press)
Dufour P, Torreton J-P Jonquiere G (1996) Utilization of bac- terioplankton as a food source by the pearl oyster Pinctdda rnargaritifera. In: Lessios HA (ed) Proc 8th Int Symp Coral Reef, Panama, Abstracts, p 54
Gerber RP, Marshall N (1982) Characterization of the sus- pended particulate organic matter and fc:c!ding by the lagoon zooplankton at Enewetak atoll. Bull Mar Sci 32: 290-300
Gordon DC Jr (1971) Organlc carbon budget of Fanning Island lagoon. Pacif Scl 25.222-227
Gordon DC Jr, Sutchffe WH Jr (1973) A new dry combust~on method for the simultaneous determination of total organic carbon and nitrogen in sea water. Mar Chem 1:23 1-244
Hamner WM, Wolanski E (1988) Hydrodynam~cs forcing func- tions and biological processes on coral reefs: a status review. Proc 6th Int Symp Coral Reef. Townsville 1:103-114
Hatcher BG 11983) The role of detritus in the metabolism and secondary production of coral reef ecosystems. In: Baker JT et al. (eds) Proc Great Barrier Reef Conference. Aus- tralian Inst Mar Science, Townsville, p 317-325

Charpy et al.: POM in Tuamotu atoll lagoons 65
Intes A, Caillart B. Charpy L, Charpy-Roubaud C, Lemasson L, Morize E (eds) (1994) Tikehau. An atoll of the Tuamotu Archipelago (French Polynesia). Atoll Res Bull 415:l-110
Kinsey DW (1985) The functional role of back-reef and lagoonal systems in the central Great Barrier Reef. In. Gabrie C, Toffard JL, Salvat B (eds) Proc 5th Int Coral Reef Congr Abstracts, Tahiti 2: 203
Marshall N, Durbin AG, Gerber R, Telek G (1975) Observa- tions on particulate and dissolved organic matter in coral reef areas Int Revue Ges Hydrobiol 60:335-3'5
Menzel D, Corwin J (1965) The measurement of total phos- phorus in sea water based on the liberation or organically bound fraction by persulfate oxidation. Limnol Oceanogr 10:280-282
Moriarty DJW (1979) Biomass of suspended bacteria over coral reefs. Mar Biol 53:193-200
Poll G, Salvat B 11976) Etude blonomique d'un lagon d'atoll totalement ferme: TAIRAO. Cah Pac 19:227-252
Pujo-Pay M, Raimbault P (1994) Improvement of the wet- oxidation procedure for simultaneous determination of particulate organic nitrogen and phosphorus collected on filters. Mar Ecol Prog Ser 105.203-207
Q a s ~ m SZ, Sankaranarayanan V N (1970) Production of par- ticulate organic matter by the reef on Kavaratti atoll (Lac- cadives). Limnol Oceanogr 15574-578
Ricard M (1985) Rangiroa atoll, Tuamotu Archipelago. Proc 5th Int Coral Reef Congr, Tahlti 1:159-209
Salvat B, Richard G (1985) Atoll de Takapoto, Archipel des Tuamotu. Proc 5th int Coral Reef Congr, Tahiti 1:325-377
Smith SV (1984) Phosphorus versus nitrogen limitation in the marine environment. Limnol Oceanogr 29:1149-1160
Smith SV, J o k ~ e l PL (1975a) Water composition and biogeo- chemical gradients in the Canton atoll lagoon: 1 Lagoon description; design of system analysis; salt and water budget. Mar Sci Communs 1:?5-100
Smith SV, J'okiel PL (197513) Water composition and bio- geochimical gradients in the Canton atoll lagoon: 2 Bud- gets of phosphorus, nitrogen, carbon dioxide, and particu- late materials. Mar Sci Communs 1:165-207
Smith SV. Pesret F (1974) Processes of carbon dioxide flux in the Fanning island lagoon. Pacif Sci 28:225-245
Stoddart DR (1969) Reconnaissance geomorphology of Kan- glroa atoll, Tuamotu archipelago Atoll Res Bull 125:l-44
Strickland JDH, Parsons TR (1972) Apractical handbook of sea- water analysis, 2nd edn. Bull Fish Res Bd Can 167:l-311
Torreton JP, Dufour P (1996) Bacterioplankton production determined by DNA synthesis, protein synthes~s and fre- quency of dividing cells in Tuamotu atoll lagoons and sur- rounding ocean. Microb Ecol 32:185-202
Torreton JP, Dufour P (1997) Temporal and spatial stability of bacterioplankton biomass and productivity in an atoll lagoon. Aquat h4icrob Ecol 11 251-261
Treguer P, Le Corre P (1975) Manuel d'analyses des sels nutritifs dans l'eau de mer. Laboratoire dlOceanographie Chimique, Universite de Bretagne Occidentale. Brest
Vacelet E, Arnoux A, Thomassin B (1996) Particulate material as an indicator of pearl-oyster excess in the Takapoto lagoon (Tuamotu. French Polynesia). Aquaculture 144: 133-148
Yentsch CS. Menzel DW (1963) A method for the determina- tion of phytoplankton chlorophyll and phaeophytin by fluorescence. Deep Sea Res 10:221-231
T h ~ s article was submitted to the editor Manuscript first received. December 20, 1996 Revised version accepted: March 5, 1997