particulate organic matter contribution of gediz river to ... fileparticulate organic matter...
TRANSCRIPT

Turkish Journal of Fisheries and Aquatic Sciences 11: 547-559 (2011)
www.trjfas.orgISSN 1303-2712
DOI: 10.4194/1303-2712-v11_4_08
© Published by Central Fisheries Research Institute (CFRI) Trabzon, Turkey in cooperation with Japan International Cooperation Agency (JICA), Japan
Particulate Organic Matter Contribution of Gediz River to the Aegean Sea
Introduction
One of the least understood phenomena in riverplumes is how the freshwater discharge mixes withambient coastal waters with respect tobiogeochemical processes (Boicourt et al., 1998).Nutrients, as well as the species composition anddetention time of phytoplankton and zooplankton
entrained into the plume zone, depend on the state ofcoastal processes at the time of entrainment.Suspended particles (SPM), either they areallochthonous or autochthonous, comprise sedimentand seston which are suspended in the water column,either permanently or temporarily in a state ofexchange with the bed sediment reservoir (Turner andMillward, 2002). In general, SPM affect coastal
Kemal Can Bizsel1, Ayşin Suzal1, Aylin Demirdağ1, Burak Evren İnanan1, Esin Esen1,*1 Dokuz Eylul University, Institute of Marine Sciences and Technology, Baku Bulv., No:32, Inciralti 35340 Izmir, Turkey.
* Corresponding Author: Tel.: +90.232 2786525; Fax: +90.232 2785082;E-mail: [email protected]
Received 14 September 2010Accepted 4 April 2011
Abstract
Seasonal behaviour of Gediz River, as a source of particulate matter have been evaluated, by tracing the concentrationof suspended solids and ultimate loads across salinity gradients in Izmir Bay. Particulate Organic Carbon (POC), ParticulateOrganic Nitrogen (PON), Total Particulate Phosphate (TPP), phytoplankton abundance, Suspended Particulate Matter (SPM),Particle Sizes (PS), and salinity were measured in and around the river mouth. Sorptive fractionation of nitrogen rich organicmaterial into particles occured in the river mouth during maximum flushing period where POC:PON ratio was <1. PrincipalComponent Analysis (PCA) indicated that the first component was PON, SPM and PS of 2-5 μm, 5-10 μm, 10-20 μm relatedto 59% of variance, the second component was density, POC and TPP related to 17% of variance and finally 13% of variancewas related to DO as the third component. PCA demonstrated that the density, among all other parameters, played the mostprominent role in their variations. As a conclusion, the river mouth usually seems to be acting as a trap rather than a source forthe particles carried by the river with exceptions occurring during extreme levels of flux when the river acts as a hot spot.
Keywords: Estuarine dynamic, suspended particulate matter, particulate organic carbon, particulate organic nitrogen, GedizRiver, Aegean Sea.Gediz Nehri’nin Ege Denizi’ne olan Partikül Organik Madde Katkısı
Özet
Gediz Nehri’nin partikül madde kaynağı olarak mevsimsel davranışı, İzmir Körfezi’nde yarattığı tuzluluk gradientleriiçerisindeki askıda katı madde konsantrasyonlarındaki ve azami yükler değerlerindeki değişimler izlenerekdeğerlendirilmiştir. Partikül Organik Karbon (POC), Partikül Organik Azot (PON), Toplam Partikül Fosfat (TPP),fitoplankton bolluğu, Askıda Katı Madde (SPM), Partikül Boyutu (PS), Çözünmüş Oksijen (DO) ve tuzluluk nehir ağzınıniçinde ve dışında ölçülmüştür. Partikül içeriğinde azotça zengin organik materyalin sorptiv fraksiyonlarının oluşumu,POC:PON<1 düzeyiyle, nehir ağzında maksimum kabarma zamanında gözlenmiştir. Temel Bileşenler Analizi (PCA) sonucu,birinci bileşen varyansın %59’unu temsil ederken, bu varyansın PON, SPM ile 2-5 μm, 5-10 μm, ve 10-20 μm boyutsınıflarına ait PS ile ilişkili olduğunu, ikinci bileşenin varyansın %17’sini temsil eder. Bu varyansında POC ve TPP ile ilişkiliolduğunu ve nihayet üçüncü bileşenin varyansın %13’ünü temsil ederken, bu varyansında sadece DO ile ilişkili olduğunugöstermiştir. PCA tüm parametreler arasında, yoğunluk değerlerinin varyasyon oluşumunda en belirleyici rolü oynadığını daayrıca göstermiştir. Sonuç olarak, nehir ağzının, aşırı debi düzeyine ulaştığı ve sıcak nokta rolü oynadığı özel şartlar dışında,nehir tarafından taşınan partiküller için bir kaynak rolü oynamaktan çok, genelde kapan rolü oynadığı görülmektedir.
Anahtar Kelimeler: Nehir dinamiği, askıda partikül madde, partikül organik karbon, partikül organik nitrojen, Gediz Nehri,Ege Denizi.
548 K.C. Bizsel et al. / Turk. J. Fish. Aquat. Sci. 11: 547-559 (2011)
environments adversely playing a critical role in someof the long-term coastal problems like shoaling andincreasing oxygen demand due to the decompositionof organic content. Hydrophobic organicmicropollutants and heavy metals adsorb ontosurfaces of fine-grained sediment particles and movewith the sediments so that they are transferred fromland to marine environments (Hong et al., 1999;Turner and Millward, 2002; Suzumura et al., 2004).The major components of estuarine SPM areparticulate organic (POM) and inorganic matters(PIM). PIM includes clay minerals and insoluble salts,whereas POM is likely composed of complex matrixof terrigenous organic matter, living cells ofplanktonic microorganisms and autochthonousorganic debris including nonliving microorganisms(Suzumura et al., 2004). The flux of sediment throughestuaries, in suspension or as bed load, varies greatly(Eisma and Cadee, 1991), although the bed load inmost rivers does not reach the estuary but is depositedin the lower reaches of the river. Therefore,understanding the nature and behavior of SPM in themouth of the river, in other words in the plume zone,can reveal whether this zone acts as a “source” or a“trap” for these particles.
The plume zones have very dynamic propertiesboth physicochemically and biologically. Activeprocesses occur between dissolved and particulatematters, as well as among organisms through siteand/or time specific salinity gradients. Changes insalinity affect the organic carbon distribution viaprocesses altering the forms such as the dissolvedorganic carbon by coagulation and adsorption/desorption properties of particles (Fox, 1983; Oguraet al., 1983). Particularly, sorption reactions betweendissolved and particulate matters may regulate thenutrient availability and associated biologicalproductivity in an estuarine environment.
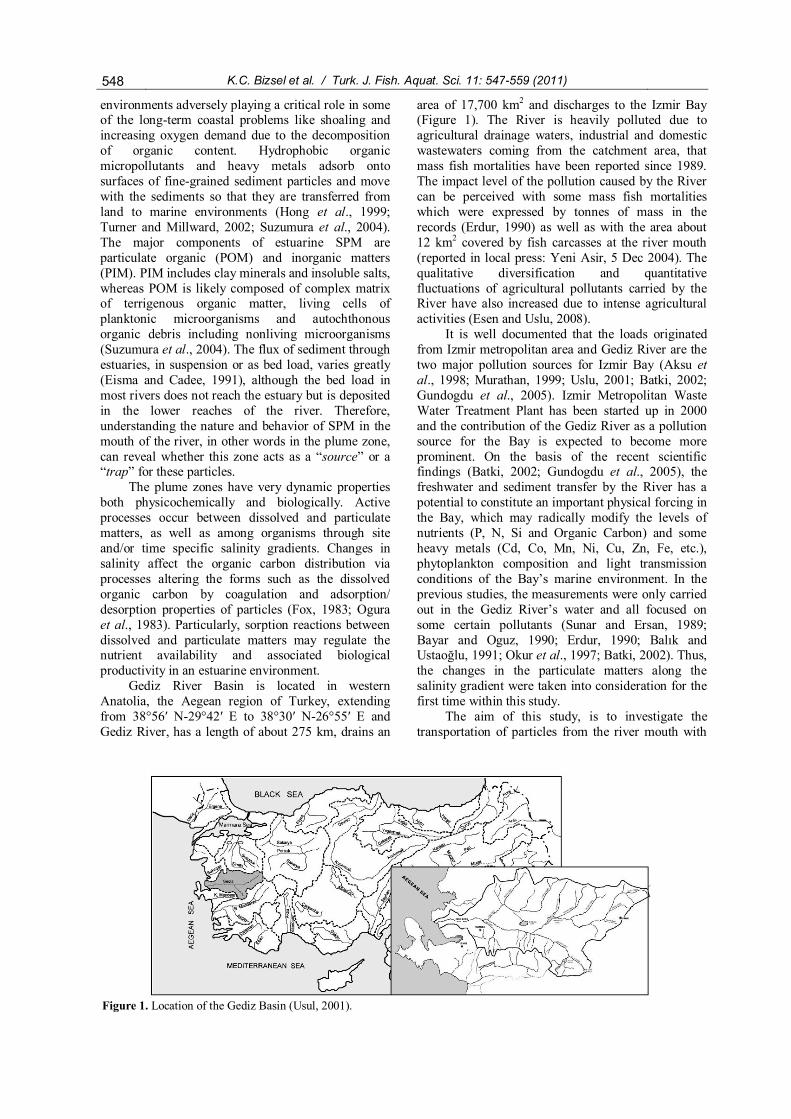
Gediz River Basin is located in westernAnatolia, the Aegean region of Turkey, extendingfrom 38°56′ N-29°42′ E to 38°30′ N-26°55′ E andGediz River, has a length of about 275 km, drains an
area of 17,700 km2 and discharges to the Izmir Bay(Figure 1). The River is heavily polluted due toagricultural drainage waters, industrial and domesticwastewaters coming from the catchment area, thatmass fish mortalities have been reported since 1989.The impact level of the pollution caused by the Rivercan be perceived with some mass fish mortalitieswhich were expressed by tonnes of mass in therecords (Erdur, 1990) as well as with the area about12 km2 covered by fish carcasses at the river mouth(reported in local press: Yeni Asir, 5 Dec 2004). Thequalitative diversification and quantitativefluctuations of agricultural pollutants carried by theRiver have also increased due to intense agriculturalactivities (Esen and Uslu, 2008).
It is well documented that the loads originatedfrom Izmir metropolitan area and Gediz River are thetwo major pollution sources for Izmir Bay (Aksu etal., 1998; Murathan, 1999; Uslu, 2001; Batki, 2002;Gundogdu et al., 2005). Izmir Metropolitan WasteWater Treatment Plant has been started up in 2000and the contribution of the Gediz River as a pollutionsource for the Bay is expected to become moreprominent. On the basis of the recent scientificfindings (Batki, 2002; Gundogdu et al., 2005), thefreshwater and sediment transfer by the River has apotential to constitute an important physical forcing inthe Bay, which may radically modify the levels ofnutrients (P, N, Si and Organic Carbon) and someheavy metals (Cd, Co, Mn, Ni, Cu, Zn, Fe, etc.),phytoplankton composition and light transmissionconditions of the Bay’s marine environment. In theprevious studies, the measurements were only carriedout in the Gediz River’s water and all focused onsome certain pollutants (Sunar and Ersan, 1989;Bayar and Oguz, 1990; Erdur, 1990; Balık andUstaoğlu, 1991; Okur et al., 1997; Batki, 2002). Thus,the changes in the particulate matters along thesalinity gradient were taken into consideration for thefirst time within this study.
The aim of this study, is to investigate thetransportation of particles from the river mouth with
Figure 1. Location of the Gediz Basin (Usul, 2001).
K.C. Bizsel et al. / Turk. J. Fish. Aquat. Sci. 11: 547-559 (2011) 549
respect to the particle size distribution and thebiogeochemical mechanisms determining thecomposition of particulate matters in the interactionzone, i.e. river plume, between Gediz River and IzmirBay, through the salinity gradient in order to be ableto put forth in consideration whether this zone acts asa source or a trap and to discuss on the possibleexplanatory patterns of any of these two actions.
Materials and Methods
Study Area
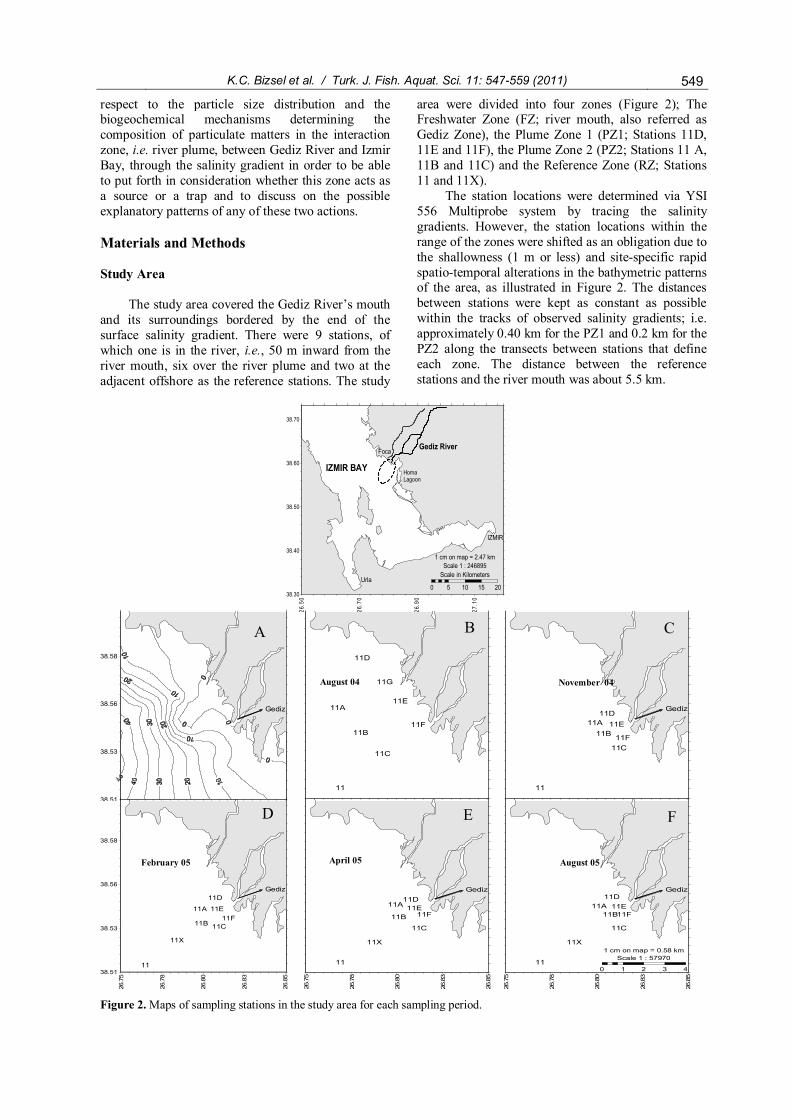
The study area covered the Gediz River’s mouthand its surroundings bordered by the end of thesurface salinity gradient. There were 9 stations, ofwhich one is in the river, i.e., 50 m inward from theriver mouth, six over the river plume and two at theadjacent offshore as the reference stations. The study
area were divided into four zones (Figure 2); TheFreshwater Zone (FZ; river mouth, also referred asGediz Zone), the Plume Zone 1 (PZ1; Stations 11D,11E and 11F), the Plume Zone 2 (PZ2; Stations 11 A,11B and 11C) and the Reference Zone (RZ; Stations11 and 11X).
The station locations were determined via YSI556 Multiprobe system by tracing the salinitygradients. However, the station locations within therange of the zones were shifted as an obligation due tothe shallowness (1 m or less) and site-specific rapidspatio-temporal alterations in the bathymetric patternsof the area, as illustrated in Figure 2. The distancesbetween stations were kept as constant as possiblewithin the tracks of observed salinity gradients; i.e.approximately 0.40 km for the PZ1 and 0.2 km for thePZ2 along the transects between stations that defineeach zone. The distance between the referencestations and the river mouth was about 5.5 km.
Gediz River
IZMIR BAY
IZMIR
Foca
HomaLagoon
Urla
26.5
0
26.7
0
26.9
0
27.1
0
38.30
38.40
38.50
38.60
38.70
0 5 10 15 20
Scale in KilometersScale 1 : 246895
1 cm on map = 2.47 km
Gediz
38.51
38.53
38.56
38.58
38.61
11D
11E
11F
11G
11
11A
11B
11C
Gediz.
11E
11F
11A
11C
11B
11D
11
Gediz.
11B 11C
11D
11E11A
11X
11
11F
26.7
5
26.7
8
26.8
0
26.8
3
26.8
5
38.51
38.53
38.56
38.58
38.61
Gediz
11X
11A
11B
11C
11D11E
11F
.
11
26.7
5
26.7
8
26.8
0
26.8
3
26.8
5
Gediz.
11E11D
11B11F11A
11C
11
11X
26.7
5
26.7
8
26.8
0
26.8
3
26.8
5
0 1 2 3 4
Scale 1 : 579701 cm on map = 0.58 km
Figure 2. Maps of sampling stations in the study area for each sampling period.
August 04 November 04
February 05 April 05 August 05
A B C
D E F
550 K.C. Bizsel et al. / Turk. J. Fish. Aquat. Sci. 11: 547-559 (2011)
Analyses
The sampling were carried out seasonally by theresearch vessel R/V K. Piri Reis and a small shuttleboat, in August 2004, November 2004, February2005, April 2005 and August 2005. The physicalparameters such as temperature, salinity and densitywere measured by YSI 556 probe at the shallowstations while SBE-SeaCAT Profiler was used at thedeeper ones. The density values of the shallowstations were computed according to the methodsproposed by Fofonoff and Millard (1983) by usingtemperature, salinity and depth data. The watersamples were stored into 10 L pre-cleaned plastic jars.The possible macro planktonic contamination waseliminated by filtering the water samples through 200μm mesh size plankton net prior to the POC and PONmeasurements. The residual water filtered through theWhatman GF/F filters which had been pre-exposed to450°C in the oven.
The POC and PON measurements were carriedout by using CHN Carlo ERBA NC2500 ElementalAnalyzer. The Total Particle Phosphate (TPP)samples were processed and measured according tothe method proposed by Solórzano and Sharp (1980).The SPM measurements were carried outgravimetrically by using pre-weighed Millipore filterswith 0.45 μm pore size. The DO was measured byusing Winkler methods. The counts of the particles insize categories of 2-5 μm, 5-10 μm, 10-20 μm, 20-40μm and 40-100 μm were determined by using CoulterCounter (Z series). Phytoplankton was sampled with 5L Nansen bottle only from the surface. The sampleswere fixed with lugol solution and identifiedaccording to Tomas (1997), Paulmier (1997) andDrebes (1974) and counted under an inverted lightmicroscope with phase contrast attachment (OlympusIX 70).
The dispersion patterns of the River’s plumehave been traced by the surface variables due to thesaltwedge characteristics of the study area. Thisapproach had been considered in the data processingand evaluation methodologies.
All statistical calculations were carried out byusing STATISTICA (v.6). The POC:PON:TPP andDOC:POC ratios were obtained by linear regressionanalysis. The significant correlations wereinvestigated among all variables prior to the PrincipalComponent Analysis (PCA) in order to visualize anypossible spatial and/or temporal patterns in terms ofoverall variations of the parameters considered. Thefirst principal component accounts for the highestpossible variance in the data, and each succeedingcomponent explains as much of the remainingvariability as possible. In a cross plot of principalcomponents, the samples with similar analytecompositions will be located near each other (Sokaland Rohlf, 1981; Manly, 1986).
Results
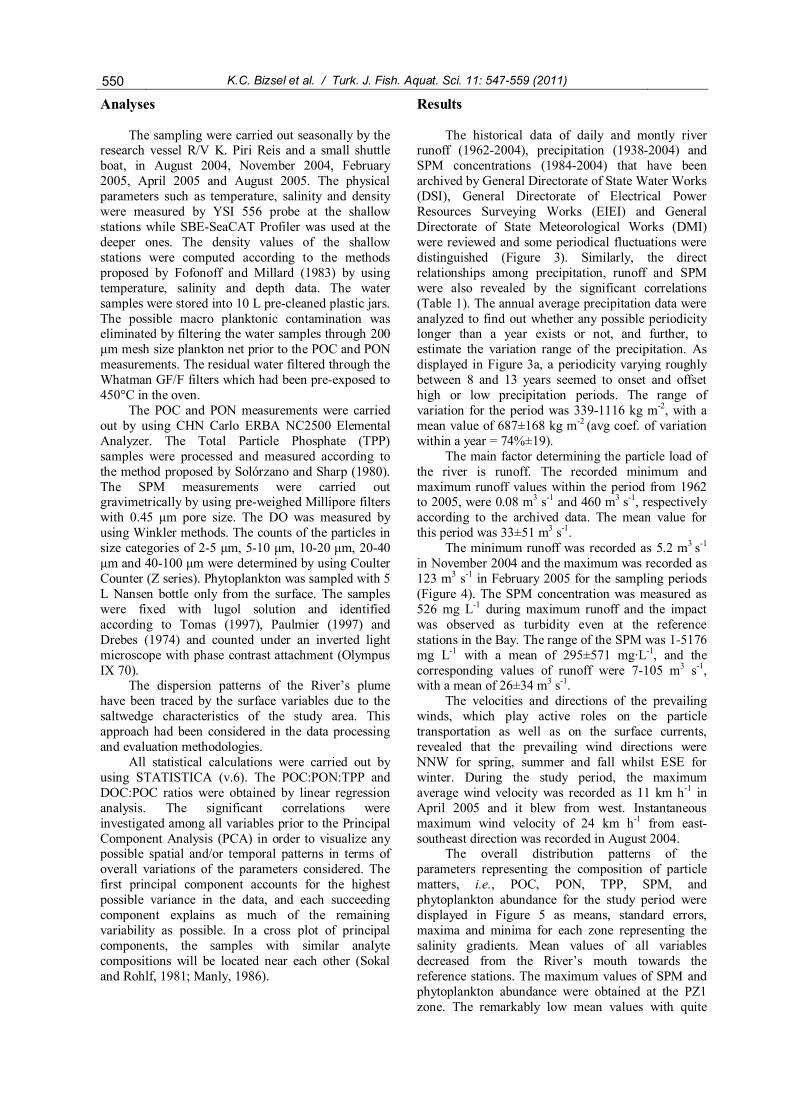
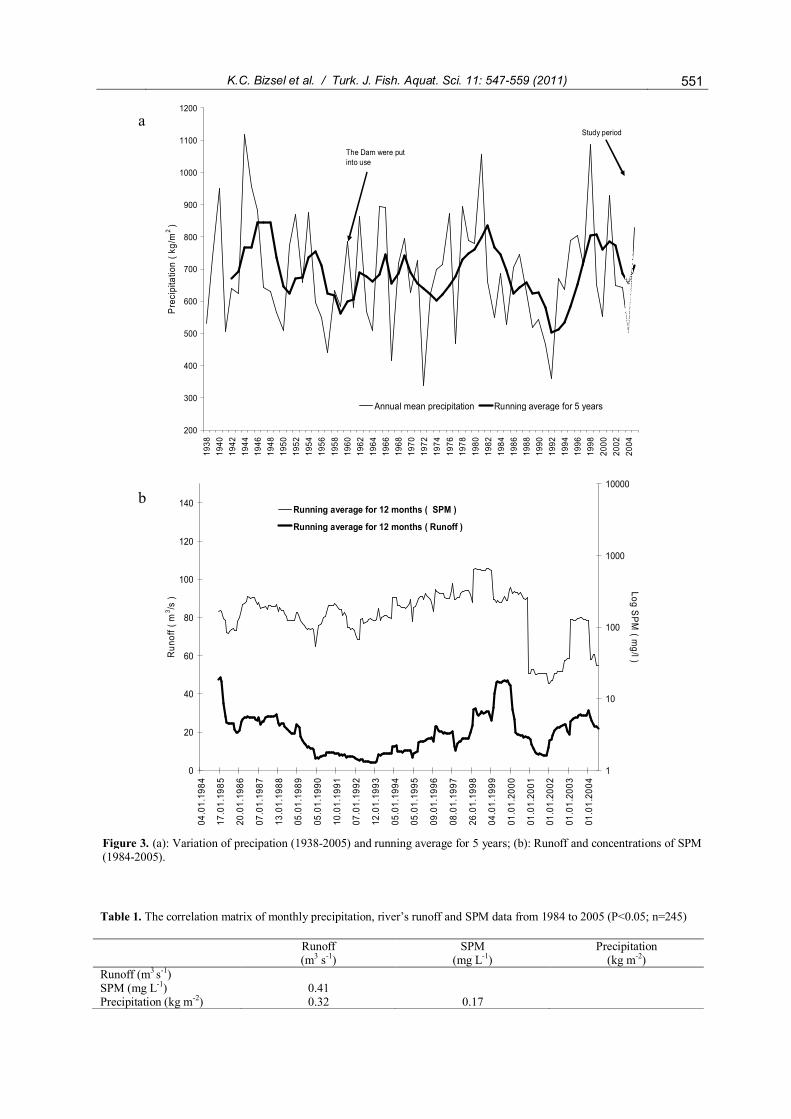
The historical data of daily and montly riverrunoff (1962-2004), precipitation (1938-2004) andSPM concentrations (1984-2004) that have beenarchived by General Directorate of State Water Works(DSI), General Directorate of Electrical PowerResources Surveying Works (EIEI) and GeneralDirectorate of State Meteorological Works (DMI)were reviewed and some periodical fluctuations weredistinguished (Figure 3). Similarly, the directrelationships among precipitation, runoff and SPMwere also revealed by the significant correlations(Table 1). The annual average precipitation data wereanalyzed to find out whether any possible periodicitylonger than a year exists or not, and further, toestimate the variation range of the precipitation. Asdisplayed in Figure 3a, a periodicity varying roughlybetween 8 and 13 years seemed to onset and offsethigh or low precipitation periods. The range ofvariation for the period was 339-1116 kg m-2, with amean value of 687±168 kg m-2 (avg coef. of variationwithin a year = 74%±19).
The main factor determining the particle load ofthe river is runoff. The recorded minimum andmaximum runoff values within the period from 1962to 2005, were 0.08 m3 s-1 and 460 m3 s-1, respectivelyaccording to the archived data. The mean value forthis period was 33±51 m3 s-1.
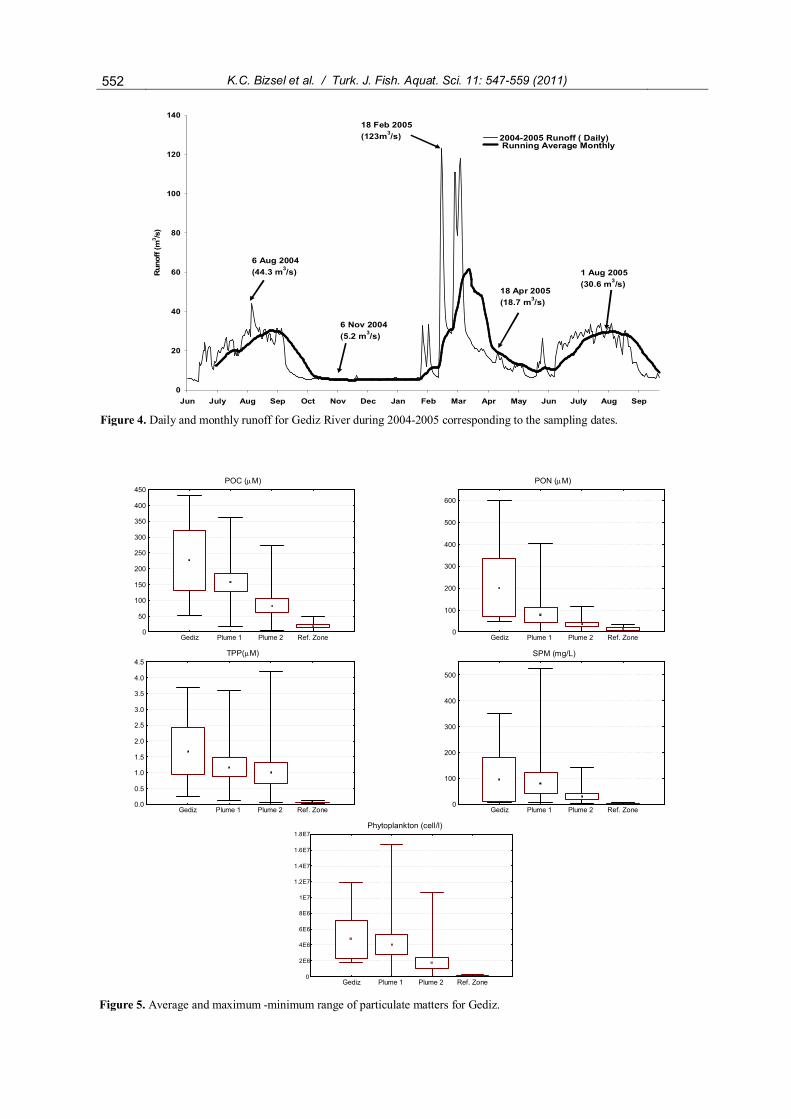
The minimum runoff was recorded as 5.2 m3 s-1
in November 2004 and the maximum was recorded as123 m3 s-1 in February 2005 for the sampling periods(Figure 4). The SPM concentration was measured as526 mg L-1 during maximum runoff and the impactwas observed as turbidity even at the referencestations in the Bay. The range of the SPM was 1-5176mg L-1 with a mean of 295±571 mg·L-1, and thecorresponding values of runoff were 7-105 m3 s-1,with a mean of 26±34 m3 s-1.
The velocities and directions of the prevailingwinds, which play active roles on the particletransportation as well as on the surface currents,revealed that the prevailing wind directions wereNNW for spring, summer and fall whilst ESE forwinter. During the study period, the maximumaverage wind velocity was recorded as 11 km h-1 inApril 2005 and it blew from west. Instantaneousmaximum wind velocity of 24 km h-1 from east-southeast direction was recorded in August 2004.
The overall distribution patterns of theparameters representing the composition of particlematters, i.e., POC, PON, TPP, SPM, andphytoplankton abundance for the study period weredisplayed in Figure 5 as means, standard errors,maxima and minima for each zone representing thesalinity gradients. Mean values of all variablesdecreased from the River’s mouth towards thereference stations. The maximum values of SPM andphytoplankton abundance were obtained at the PZ1zone. The remarkably low mean values with quite
K.C. Bizsel et al. / Turk. J. Fish. Aquat. Sci. 11: 547-559 (2011) 551
200
300
400
500
600
700
800
900
1000
1100
1200
1938
1940
1942
1944
1946
1948
1950
1952
1954
1956
1958
1960
1962
1964
1966
1968
1970
1972
1974
1976
1978
1980
1982
1984
1986
1988
1990
1992
1994
1996
1998
2000
2002
2004
Pre
cipi
tatio
n ( k
g/m
2)
Annual mean precipitation Running average for 5 years
The Dam were putinto use
Study period
0
20
40
60
80
100
120
140
04.0
1.19
84
17.0
1.19
85
20.0
1.19
86
07.0
1.19
87
13.0
1.19
88
05.0
1.19
89
05.0
1.19
90
10.0
1.19
91
07.0
1.19
92
12.0
1.19
93
05.0
1.19
94
05.0
1.19
95
09.0
1.19
96
08.0
1.19
97
26.0
1.19
98
04.0
1.19
99
01.0
1.20
00
01.0
1.20
01
01.0
1.20
02
01.0
1.20
03
01.0
1.20
04
Run
off (
m3 /s
)
1
10
100
1000
10000
Log SP
M ( m
g/l )
Running average for 12 months ( SPM )
Running average for 12 months ( Runoff )
Figure 3. (a): Variation of precipation (1938-2005) and running average for 5 years; (b): Runoff and concentrations of SPM(1984-2005).
Table 1. The correlation matrix of monthly precipitation, river’s runoff and SPM data from 1984 to 2005 (P<0.05; n=245)
Runoff(m3 s-1)
SPM(mg L-1)
Precipitation(kg m-2)
Runoff (m3 s-1)SPM (mg L-1) 0.41Precipitation (kg m-2) 0.32 0.17
a
b
552 K.C. Bizsel et al. / Turk. J. Fish. Aquat. Sci. 11: 547-559 (2011)
0
20
40
60
80
100
120
140
Jun July Aug Sep Oct Nov Dec Jan Feb Mar Apr May Jun July Aug Sep
Run
off (
m3 /s
)
2004-2005 Runoff ( Daily) Running Average Monthly
18 Feb 2005(123m3/s)
18 Apr 2005(18.7 m3/s)
1 Aug 2005(30.6 m3/s)
6 Aug 2004(44.3 m3/s)
6 Nov 2004(5.2 m3/s)
Figure 4. Daily and monthly runoff for Gediz River during 2004-2005 corresponding to the sampling dates.
POC (mM)
Gediz Plume 1 Plume 2 Ref. Zone0
50
100
150
200
250
300
350
400
450PON (mM)
Gediz Plume 1 Plume 2 Ref. Zone0
100
200
300
400
500
600
TPP(mM)
Gediz Plume 1 Plume 2 Ref. Zone0.0
0.5
1.0
1.5
2.0
2.5
3.0
3.5
4.0
4.5SPM (mg/l)
Gediz Plume 1 Plume 2 Ref. Zone0
100
200
300
400
500
Phytoplankton (cell/l)
Gediz Plume 1 Plume 2 Ref. Zone0
2E6
4E6
6E6
8E6
1E7
1.2E7
1.4E7
1.6E7
1.8E7
Figure 5. Average and maximum -minimum range of particulate matters for Gediz.
SPM (mg/L)
K.C. Bizsel et al. / Turk. J. Fish. Aquat. Sci. 11: 547-559 (2011) 553
high precision at the RZ were the evidences of theirreliability for comparisons. The FZ and the PZs hadhigher means and variability as expected.
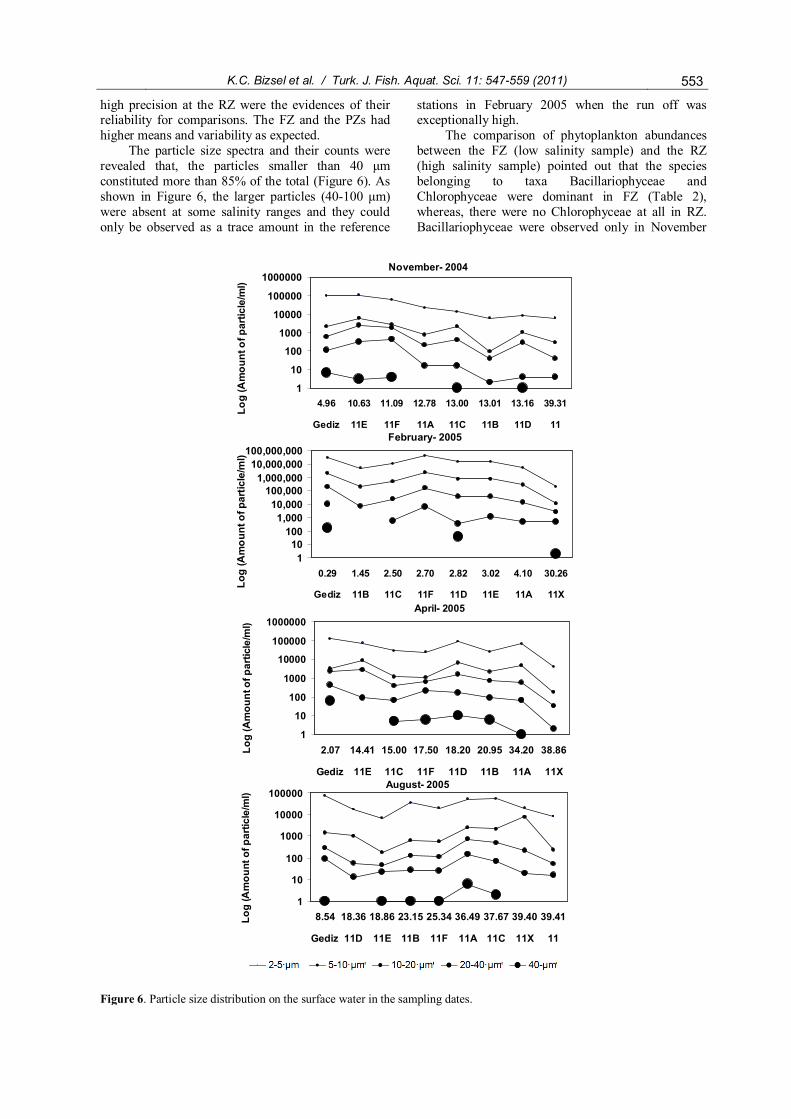
The particle size spectra and their counts wererevealed that, the particles smaller than 40 μmconstituted more than 85% of the total (Figure 6). Asshown in Figure 6, the larger particles (40-100 μm)were absent at some salinity ranges and they couldonly be observed as a trace amount in the reference
stations in February 2005 when the run off wasexceptionally high.
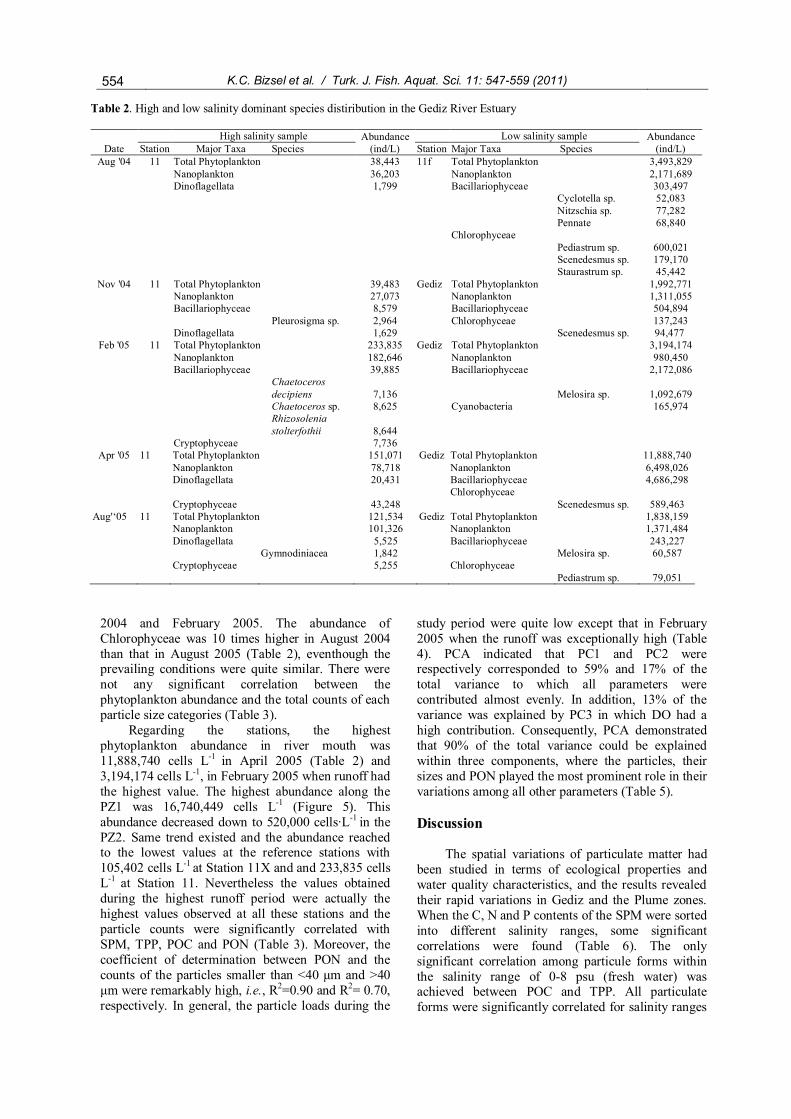
The comparison of phytoplankton abundancesbetween the FZ (low salinity sample) and the RZ(high salinity sample) pointed out that the speciesbelonging to taxa Bacillariophyceae andChlorophyceae were dominant in FZ (Table 2),whereas, there were no Chlorophyceae at all in RZ.Bacillariophyceae were observed only in November
November- 2004
1
10
100
1000
10000
100000
1000000
4.96 10.63 11.09 12.78 13.00 13.01 13.16 39.31
Gediz 11E 11F 11A 11C 11B 11D 11
Log
(Am
ount
of p
artic
le/m
l)
February- 2005
110
1001,000
10,000100,000
1,000,00010,000,000
100,000,000
0.29 1.45 2.50 2.70 2.82 3.02 4.10 30.26
Gediz 11B 11C 11F 11D 11E 11A 11X
Log
(Am
ount
of p
artic
le/m
l)
April- 2005
1
10
100
1000
10000
100000
1000000
2.07 14.41 15.00 17.50 18.20 20.95 34.20 38.86
Gediz 11E 11C 11F 11D 11B 11A 11X
Log
(Am
ount
of p
artic
le/m
l)
August- 2005
1
10
100
1000
10000
100000
8.54 18.36 18.86 23.15 25.34 36.49 37.67 39.40 39.41
Gediz 11D 11E 11B 11F 11A 11C 11X 11
Log
(Am
ount
of p
artic
le/m
l)
Figure 6. Particle size distribution on the surface water in the sampling dates.
554 K.C. Bizsel et al. / Turk. J. Fish. Aquat. Sci. 11: 547-559 (2011)
2004 and February 2005. The abundance ofChlorophyceae was 10 times higher in August 2004than that in August 2005 (Table 2), eventhough theprevailing conditions were quite similar. There werenot any significant correlation between thephytoplankton abundance and the total counts of eachparticle size categories (Table 3).
Regarding the stations, the highestphytoplankton abundance in river mouth was11,888,740 cells L-1 in April 2005 (Table 2) and3,194,174 cells L-1, in February 2005 when runoff hadthe highest value. The highest abundance along thePZ1 was 16,740,449 cells L-1 (Figure 5). Thisabundance decreased down to 520,000 cells·L-1 in thePZ2. Same trend existed and the abundance reachedto the lowest values at the reference stations with105,402 cells L-1 at Station 11X and and 233,835 cellsL-1 at Station 11. Nevertheless the values obtainedduring the highest runoff period were actually thehighest values observed at all these stations and theparticle counts were significantly correlated withSPM, TPP, POC and PON (Table 3). Moreover, thecoefficient of determination between PON and thecounts of the particles smaller than <40 μm and >40μm were remarkably high, i.e., R2=0.90 and R2= 0.70,respectively. In general, the particle loads during the
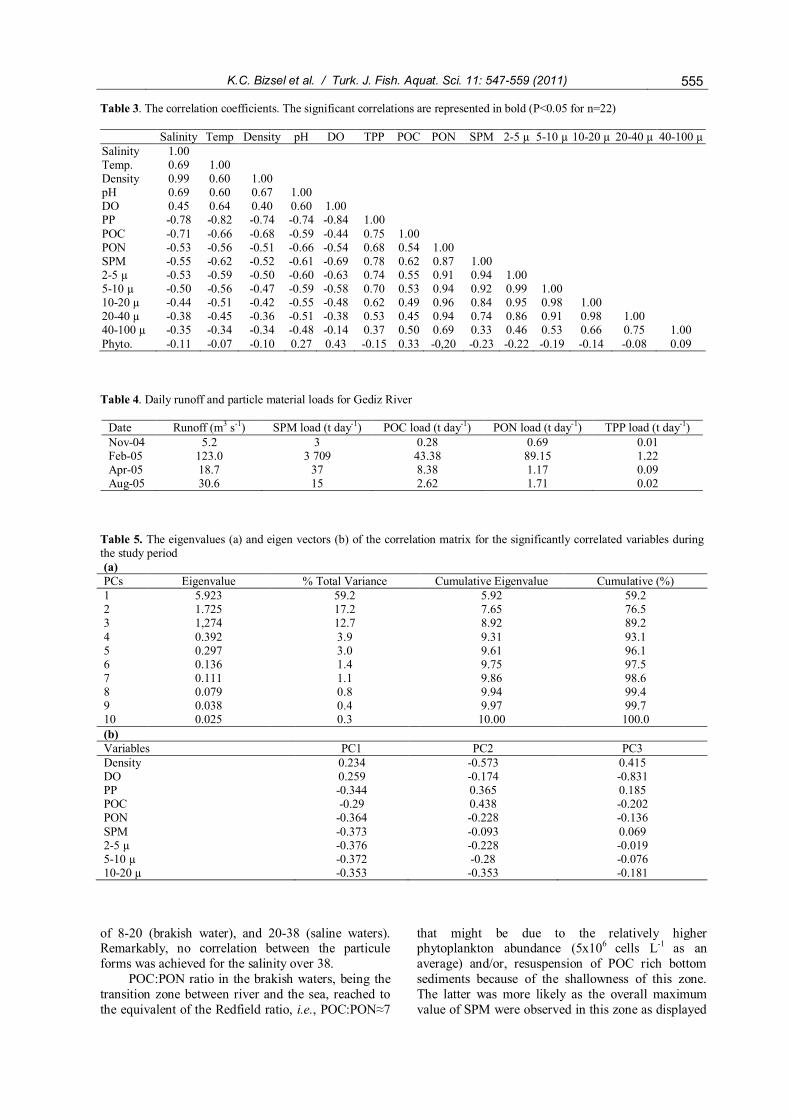
study period were quite low except that in February2005 when the runoff was exceptionally high (Table4). PCA indicated that PC1 and PC2 wererespectively corresponded to 59% and 17% of thetotal variance to which all parameters werecontributed almost evenly. In addition, 13% of thevariance was explained by PC3 in which DO had ahigh contribution. Consequently, PCA demonstratedthat 90% of the total variance could be explainedwithin three components, where the particles, theirsizes and PON played the most prominent role in theirvariations among all other parameters (Table 5).
Discussion
The spatial variations of particulate matter hadbeen studied in terms of ecological properties andwater quality characteristics, and the results revealedtheir rapid variations in Gediz and the Plume zones.When the C, N and P contents of the SPM were sortedinto different salinity ranges, some significantcorrelations were found (Table 6). The onlysignificant correlation among particule forms withinthe salinity range of 0-8 psu (fresh water) wasachieved between POC and TPP. All particulateforms were significantly correlated for salinity ranges
Table 2. High and low salinity dominant species distiribution in the Gediz River Estuary
High salinity sample Abundance(ind/L)
Low salinity sample Abundance(ind/L)Date Station Major Taxa Species Station Major Taxa Species
Aug '04 11 Total Phytoplankton 38,443 11f Total Phytoplankton 3,493,829Nanoplankton 36,203 Nanoplankton 2,171,689Dinoflagellata 1,799 Bacillariophyceae 303,497
Cyclotella sp. 52,083Nitzschia sp. 77,282Pennate 68,840
ChlorophyceaePediastrum sp. 600,021Scenedesmus sp. 179,170Staurastrum sp. 45,442
Nov '04 11 Total Phytoplankton 39,483 Gediz Total Phytoplankton 1,992,771Nanoplankton 27,073 Nanoplankton 1,311,055Bacillariophyceae 8,579 Bacillariophyceae 504,894
Pleurosigma sp. 2,964 Chlorophyceae 137,243Dinoflagellata 1,629 Scenedesmus sp. 94,477
Feb '05 11 Total Phytoplankton 233,835 Gediz Total Phytoplankton 3,194,174Nanoplankton 182,646 Nanoplankton 980,450Bacillariophyceae 39,885 Bacillariophyceae 2,172,086
Chaetocerosdecipiens 7,136 Melosira sp. 1,092,679Chaetoceros sp. 8,625 Cyanobacteria 165,974Rhizosoleniastolterfothii 8,644
Cryptophyceae 7,736Apr '05 11 Total Phytoplankton 151,071 Gediz Total Phytoplankton 11,888,740
Nanoplankton 78,718 Nanoplankton 6,498,026Dinoflagellata 20,431 Bacillariophyceae 4,686,298
ChlorophyceaeCryptophyceae 43,248 Scenedesmus sp. 589,463
Aug'‘05 11 Total Phytoplankton 121,534 Gediz Total Phytoplankton 1,838,159Nanoplankton 101,326 Nanoplankton 1,371,484Dinoflagellata 5,525 Bacillariophyceae 243,227
Gymnodiniacea 1,842 Melosira sp. 60,587Cryptophyceae 5,255 Chlorophyceae
Pediastrum sp. 79,051
K.C. Bizsel et al. / Turk. J. Fish. Aquat. Sci. 11: 547-559 (2011) 555
Table 3. The correlation coefficients. The significant correlations are represented in bold (P<0.05 for n=22)
Salinity Temp Density pH DO TPP POC PON SPM 2-5 µ 5-10 µ 10-20 µ 20-40 µ 40-100 µSalinity 1.00Temp. 0.69 1.00Density 0.99 0.60 1.00pH 0.69 0.60 0.67 1.00DO 0.45 0.64 0.40 0.60 1.00PP -0.78 -0.82 -0.74 -0.74 -0.84 1.00POC -0.71 -0.66 -0.68 -0.59 -0.44 0.75 1.00PON -0.53 -0.56 -0.51 -0.66 -0.54 0.68 0.54 1.00SPM -0.55 -0.62 -0.52 -0.61 -0.69 0.78 0.62 0.87 1.002-5 µ -0.53 -0.59 -0.50 -0.60 -0.63 0.74 0.55 0.91 0.94 1.005-10 µ -0.50 -0.56 -0.47 -0.59 -0.58 0.70 0.53 0.94 0.92 0.99 1.0010-20 µ -0.44 -0.51 -0.42 -0.55 -0.48 0.62 0.49 0.96 0.84 0.95 0.98 1.0020-40 µ -0.38 -0.45 -0.36 -0.51 -0.38 0.53 0.45 0.94 0.74 0.86 0.91 0.98 1.0040-100 µ -0.35 -0.34 -0.34 -0.48 -0.14 0.37 0.50 0.69 0.33 0.46 0.53 0.66 0.75 1.00Phyto. -0.11 -0.07 -0.10 0.27 0.43 -0.15 0.33 -0,20 -0.23 -0.22 -0.19 -0.14 -0.08 0.09
Table 4. Daily runoff and particle material loads for Gediz River
Date Runoff (m3 s-1) SPM load (t day-1) POC load (t day-1) PON load (t day-1) TPP load (t day-1)Nov-04 5.2 3 0.28 0.69 0.01Feb-05 123.0 3 709 43.38 89.15 1.22Apr-05 18.7 37 8.38 1.17 0.09Aug-05 30.6 15 2.62 1.71 0.02
Table 5. The eigenvalues (a) and eigen vectors (b) of the correlation matrix for the significantly correlated variables duringthe study period(a)PCs Eigenvalue % Total Variance Cumulative Eigenvalue Cumulative (%)1 5.923 59.2 5.92 59.22 1.725 17.2 7.65 76.53 1,274 12.7 8.92 89.24 0.392 3.9 9.31 93.15 0.297 3.0 9.61 96.16 0.136 1.4 9.75 97.57 0.111 1.1 9.86 98.68 0.079 0.8 9.94 99.49 0.038 0.4 9.97 99.710 0.025 0.3 10.00 100.0(b)Variables PC1 PC2 PC3Density 0.234 -0.573 0.415DO 0.259 -0.174 -0.831PP -0.344 0.365 0.185POC -0.29 0.438 -0.202PON -0.364 -0.228 -0.136SPM -0.373 -0.093 0.0692-5 µ -0.376 -0.228 -0.0195-10 µ -0.372 -0.28 -0.07610-20 µ -0.353 -0.353 -0.181
of 8-20 (brakish water), and 20-38 (saline waters).Remarkably, no correlation between the particuleforms was achieved for the salinity over 38.
POC:PON ratio in the brakish waters, being thetransition zone between river and the sea, reached tothe equivalent of the Redfield ratio, i.e., POC:PON≈7
that might be due to the relatively higherphytoplankton abundance (5x10⁶ cells L-1 as anaverage) and/or, resuspension of POC rich bottomsediments because of the shallowness of this zone.The latter was more likely as the overall maximumvalue of SPM were observed in this zone as displayed
556 K.C. Bizsel et al. / Turk. J. Fish. Aquat. Sci. 11: 547-559 (2011)
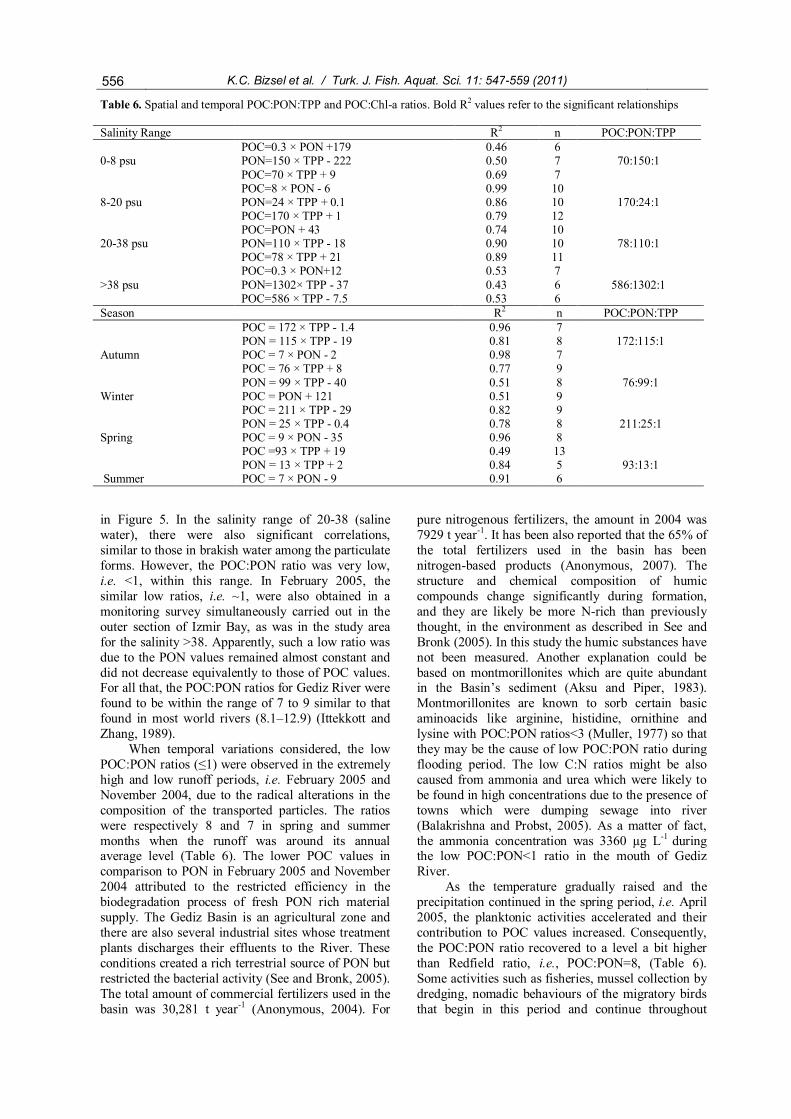
in Figure 5. In the salinity range of 20-38 (salinewater), there were also significant correlations,similar to those in brakish water among the particulateforms. However, the POC:PON ratio was very low,i.e. <1, within this range. In February 2005, thesimilar low ratios, i.e. ~1, were also obtained in amonitoring survey simultaneously carried out in theouter section of Izmir Bay, as was in the study areafor the salinity >38. Apparently, such a low ratio wasdue to the PON values remained almost constant anddid not decrease equivalently to those of POC values.For all that, the POC:PON ratios for Gediz River werefound to be within the range of 7 to 9 similar to thatfound in most world rivers (8.1–12.9) (Ittekkott andZhang, 1989).
When temporal variations considered, the lowPOC:PON ratios (≤1) were observed in the extremelyhigh and low runoff periods, i.e. February 2005 andNovember 2004, due to the radical alterations in thecomposition of the transported particles. The ratioswere respectively 8 and 7 in spring and summermonths when the runoff was around its annualaverage level (Table 6). The lower POC values incomparison to PON in February 2005 and November2004 attributed to the restricted efficiency in thebiodegradation process of fresh PON rich materialsupply. The Gediz Basin is an agricultural zone andthere are also several industrial sites whose treatmentplants discharges their effluents to the River. Theseconditions created a rich terrestrial source of PON butrestricted the bacterial activity (See and Bronk, 2005).The total amount of commercial fertilizers used in thebasin was 30,281 t year-1 (Anonymous, 2004). For
pure nitrogenous fertilizers, the amount in 2004 was7929 t year-1. It has been also reported that the 65% ofthe total fertilizers used in the basin has beennitrogen-based products (Anonymous, 2007). Thestructure and chemical composition of humiccompounds change significantly during formation,and they are likely be more N-rich than previouslythought, in the environment as described in See andBronk (2005). In this study the humic substances havenot been measured. Another explanation could bebased on montmorillonites which are quite abundantin the Basin’s sediment (Aksu and Piper, 1983).Montmorillonites are known to sorb certain basicaminoacids like arginine, histidine, ornithine andlysine with POC:PON ratios<3 (Muller, 1977) so thatthey may be the cause of low POC:PON ratio duringflooding period. The low C:N ratios might be alsocaused from ammonia and urea which were likely tobe found in high concentrations due to the presence oftowns which were dumping sewage into river(Balakrishna and Probst, 2005). As a matter of fact,the ammonia concentration was 3360 µg L-1 duringthe low POC:PON<1 ratio in the mouth of GedizRiver.
As the temperature gradually raised and theprecipitation continued in the spring period, i.e. April2005, the planktonic activities accelerated and theircontribution to POC values increased. Consequently,the POC:PON ratio recovered to a level a bit higherthan Redfield ratio, i.e., POC:PON=8, (Table 6).Some activities such as fisheries, mussel collection bydredging, nomadic behaviours of the migratory birdsthat begin in this period and continue throughout
Table 6. Spatial and temporal POC:PON:TPP and POC:Chl-a ratios. Bold R2 values refer to the significant relationships
Salinity Range R2 n POC:PON:TPP
0-8 psuPOC=0.3 × PON +179 0.46 6
70:150:1PON=150 × TPP - 222 0.50 7POC=70 × TPP + 9 0.69 7
8-20 psuPOC=8 × PON - 6 0.99 10
170:24:1PON=24 × TPP + 0.1 0.86 10POC=170 × TPP + 1 0.79 12
20-38 psuPOC=PON + 43 0.74 10
78:110:1PON=110 × TPP - 18 0.90 10POC=78 × TPP + 21 0.89 11
>38 psuPOC=0.3 × PON+12 0.53 7
586:1302:1PON=1302× TPP - 37 0.43 6POC=586 × TPP - 7.5 0.53 6
Season R2 n POC:PON:TPPPOC = 172 × TPP - 1.4 0.96 7
172:115:1PON = 115 × TPP - 19 0.81 8Autumn POC = 7 × PON - 2 0.98 7
POC = 76 × TPP + 8 0.77 976:99:1PON = 99 × TPP - 40 0.51 8
Winter POC = PON + 121 0.51 9POC = 211 × TPP - 29 0.82 9
211:25:1PON = 25 × TPP - 0.4 0.78 8Spring POC = 9 × PON - 35 0.96 8
POC =93 × TPP + 19 0.49 1393:13:1PON = 13 × TPP + 2 0.84 5
Summer POC = 7 × PON - 9 0.91 6
K.C. Bizsel et al. / Turk. J. Fish. Aquat. Sci. 11: 547-559 (2011) 557summer, also accelarated the carbon dynamics in thesea bottom with the synergistic impact of physicaldriving forces such as the shallowness in the estuarinezone and the prevailing stronger winds during thisperiod.
While most of the POC present in the estuaryappeared to be composed of allochthonous organiccarbon flushed out of the floodplains of the GedizRiver in winter, much of the POC was composed ofautochtonous organic carbon in spring. This was alsosupported by POC:PON ratio (~9) which indicatedhigh phytoplankton production (16.106 cells L-1).
In general, the overall particle size distributionpatterns were determined by the particles smaller than40 μm (Figure 6), since the larger particles could notbe carried far from the river mouth where they wereaccumulated instead. The only remarkable transversalpattern were observed in August 2005 when almostall particles with size between 2-5 µm were seaborne,which recalled the study of Muller (1977) stating thatthe C:N ratios primarily determined by the effect ofinorganic ammonium and organic nitrogencompounds sorbed by clays.
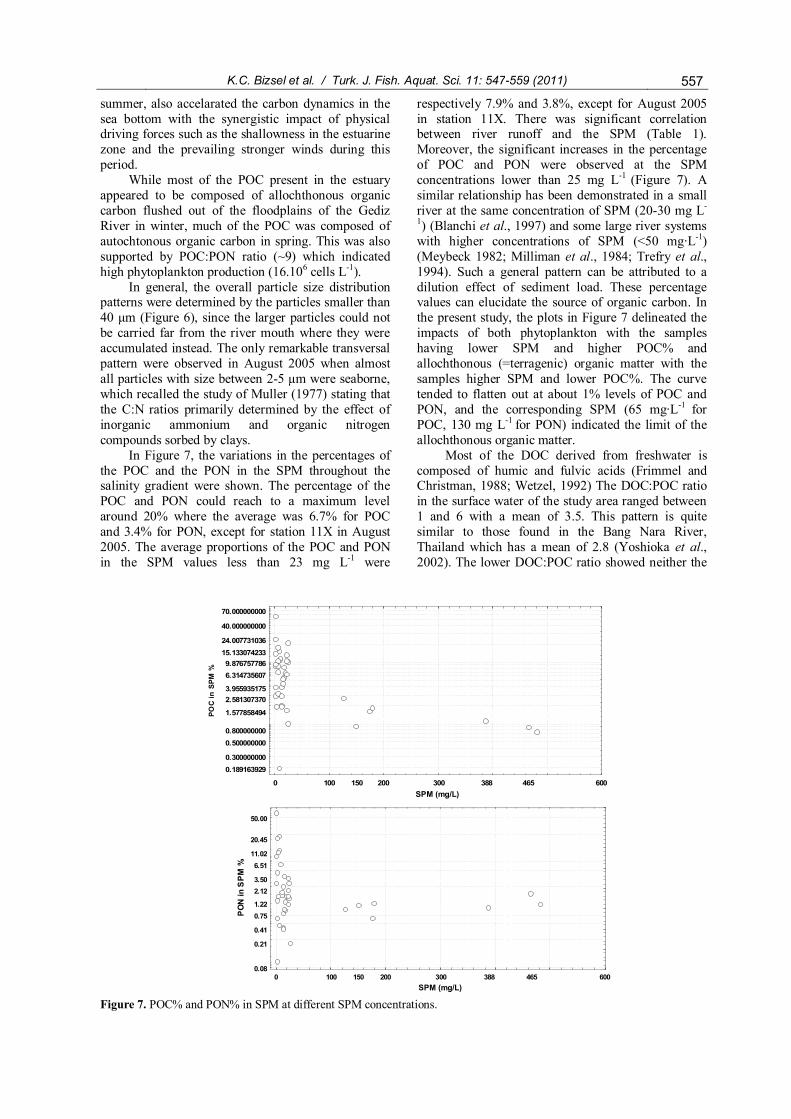
In Figure 7, the variations in the percentages ofthe POC and the PON in the SPM throughout thesalinity gradient were shown. The percentage of thePOC and PON could reach to a maximum levelaround 20% where the average was 6.7% for POCand 3.4% for PON, except for station 11X in August2005. The average proportions of the POC and PONin the SPM values less than 23 mg L-1 were
respectively 7.9% and 3.8%, except for August 2005in station 11X. There was significant correlationbetween river runoff and the SPM (Table 1).Moreover, the significant increases in the percentageof POC and PON were observed at the SPMconcentrations lower than 25 mg L-1 (Figure 7). Asimilar relationship has been demonstrated in a smallriver at the same concentration of SPM (20-30 mg L-
1) (Blanchi et al., 1997) and some large river systemswith higher concentrations of SPM (<50 mg·L-1)(Meybeck 1982; Milliman et al., 1984; Trefry et al.,1994). Such a general pattern can be attributed to adilution effect of sediment load. These percentagevalues can elucidate the source of organic carbon. Inthe present study, the plots in Figure 7 delineated theimpacts of both phytoplankton with the sampleshaving lower SPM and higher POC% andallochthonous (=terragenic) organic matter with thesamples higher SPM and lower POC%. The curvetended to flatten out at about 1% levels of POC andPON, and the corresponding SPM (65 mg·L-1 forPOC, 130 mg L-1 for PON) indicated the limit of theallochthonous organic matter.
Most of the DOC derived from freshwater iscomposed of humic and fulvic acids (Frimmel andChristman, 1988; Wetzel, 1992) The DOC:POC ratioin the surface water of the study area ranged between1 and 6 with a mean of 3.5. This pattern is quitesimilar to those found in the Bang Nara River,Thailand which has a mean of 2.8 (Yoshioka et al.,2002). The lower DOC:POC ratio showed neither the
0 100 150 200 300 388 465 600SPM (mg/)
0.1891639290.300000000
0.5000000000.800000000
1.577858494
2.5813073703.955935175
6.3147356079.876757786
15.13307423324.007731036
40.000000000
70.000000000
POC
in S
PM %
0 100 150 200 300 388 465 600S PM ( mg/l )
0.08
0.21
0.41
0.751.22
2.123.50
6.5111.02
20.45
50.00
PO
N in
SP
M %
Figure 7. POC% and PON% in SPM at different SPM concentrations.
SPM (mg/L)
SPM (mg/L)
558 K.C. Bizsel et al. / Turk. J. Fish. Aquat. Sci. 11: 547-559 (2011)
study region was heterotrophic nor the residence timeof particulate matters was short. In the study area, theDOC and POC were flushed through the Gediz Riverplain and were dispersed into the plume and outer bayas the DOC:POC ratio increased upto 6. Thecharacterization of terrestrial organic carbon transporttherefore is essential to elucidate the land–sea linkage.
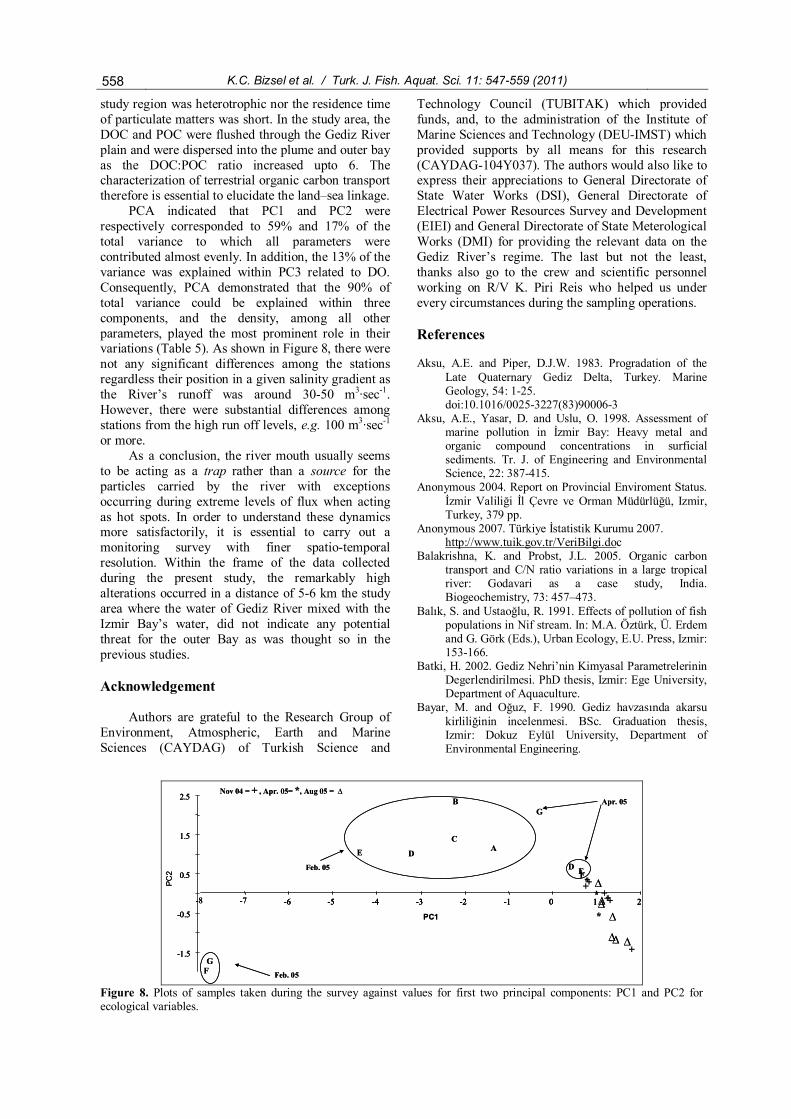
PCA indicated that PC1 and PC2 wererespectively corresponded to 59% and 17% of thetotal variance to which all parameters werecontributed almost evenly. In addition, the 13% of thevariance was explained within PC3 related to DO.Consequently, PCA demonstrated that the 90% oftotal variance could be explained within threecomponents, and the density, among all otherparameters, played the most prominent role in theirvariations (Table 5). As shown in Figure 8, there werenot any significant differences among the stationsregardless their position in a given salinity gradient asthe River’s runoff was around 30-50 m3·sec-1.However, there were substantial differences amongstations from the high run off levels, e.g. 100 m3·sec-1
or more.As a conclusion, the river mouth usually seems
to be acting as a trap rather than a source for theparticles carried by the river with exceptionsoccurring during extreme levels of flux when actingas hot spots. In order to understand these dynamicsmore satisfactorily, it is essential to carry out amonitoring survey with finer spatio-temporalresolution. Within the frame of the data collectedduring the present study, the remarkably highalterations occurred in a distance of 5-6 km the studyarea where the water of Gediz River mixed with theIzmir Bay’s water, did not indicate any potentialthreat for the outer Bay as was thought so in theprevious studies.
Acknowledgement
Authors are grateful to the Research Group ofEnvironment, Atmospheric, Earth and MarineSciences (CAYDAG) of Turkish Science and
Technology Council (TUBITAK) which providedfunds, and, to the administration of the Institute ofMarine Sciences and Technology (DEU-IMST) whichprovided supports by all means for this research(CAYDAG-104Y037). The authors would also like toexpress their appreciations to General Directorate ofState Water Works (DSI), General Directorate ofElectrical Power Resources Survey and Development(EIEI) and General Directorate of State MeterologicalWorks (DMI) for providing the relevant data on theGediz River’s regime. The last but not the least,thanks also go to the crew and scientific personnelworking on R/V K. Piri Reis who helped us underevery circumstances during the sampling operations.
References
Aksu, A.E. and Piper, D.J.W. 1983. Progradation of theLate Quaternary Gediz Delta, Turkey. MarineGeology, 54: 1-25.doi:10.1016/0025-3227(83)90006-3
Aksu, A.E., Yasar, D. and Uslu, O. 1998. Assessment ofmarine pollution in İzmir Bay: Heavy metal andorganic compound concentrations in surficialsediments. Tr. J. of Engineering and EnvironmentalScience, 22: 387-415.
Anonymous 2004. Report on Provincial Enviroment Status.İzmir Valiliği İl Çevre ve Orman Müdürlüğü, Izmir,Turkey, 379 pp.
Anonymous 2007. Türkiye İstatistik Kurumu 2007.http://www.tuik.gov.tr/VeriBilgi.doc
Balakrishna, K. and Probst, J.L. 2005. Organic carbontransport and C/N ratio variations in a large tropicalriver: Godavari as a case study, India.Biogeochemistry, 73: 457–473.
Balık, S. and Ustaoğlu, R. 1991. Effects of pollution of fishpopulations in Nif stream. In: M.A. Öztürk, Ü. Erdemand G. Görk (Eds.), Urban Ecology, E.U. Press, Izmir:153-166.
Batki, H. 2002. Gediz Nehri’nin Kimyasal ParametrelerininDegerlendirilmesi. PhD thesis, Izmir: Ege University,Department of Aquaculture.
Bayar, M. and Oğuz, F. 1990. Gediz havzasında akarsukirliliğinin incelenmesi. BSc. Graduation thesis,Izmir: Dokuz Eylül University, Department ofEnvironmental Engineering.
-8 -7 -6 -5 -4 -3 -2 -1 0 1 2
-1.5
-0.5
0.5
1.5
2.5
+
++++
+++
A
B
C
DE
FG
*
**
D EF
G
∆.
∆
∆
∆∆
∆
∆Feb. 05
Apr. 05Nov 04 = + , Apr. 05= *, Aug 05 = ∆
Feb. 05
PC1
PC2
-8 -7 -6 -5 -4 -3 -2 -1 0 1 2-8 -7 -6 -5 -4 -3 -2 -1 0 1 2-6 -5 -4 -3 -2 -1 0 1 2
-1.5
-0.5
0.5
1.5
2.5
-1.5
-0.5
0.5
1.5
2.5
+
++++
+++
A
B
C
DE
FG
*
**
D EF
G
∆.
∆
∆
∆∆
∆
∆Feb. 05
Apr. 05Nov 04 = + , Apr. 05= *, Aug 05 = ∆
Feb. 05
PC1
PC2
Figure 8. Plots of samples taken during the survey against values for first two principal components: PC1 and PC2 forecological variables.
K.C. Bizsel et al. / Turk. J. Fish. Aquat. Sci. 11: 547-559 (2011) 559Blanchi, T.S., Baskaran, M., DeLord, J. and Ravichandran,
M. 1997. Carbon cycling in a shallow turbid estuaryof Southeast Texas: The use of plant pigmentbiomarkers and water quality parameters. Estuaries,20: 404-415. doi: 10.2307/1352353
Boicourt, W.C., Wiseman, W.J., Valle-Levinson, Jr., A. andAtkinson, L.P. 1998. Continental shelf of thesoutheastern United States and the Gulf of Mexico:the shadow of the Western Boundary Current. In:A.R. Robinson and K.H. Brink (Eds.), The Sea, JohnWiley and Sons Inc., New York: 135-182.
Drebes, G. 1974. Marine Phytoplankton. Georg ThiemeVerlag., Stuttgart, 186 pp.
Eisma, D. and Cadee, C.G. 1991. Particulate matter processin estuaries. In: E. Degens, S. Kempe and J.E. Richey(Eds.), Biogeochemistry of major world rivers,Scientific Committee on Problems of the Environment(SCOPE). Chichester: 283–296
Erdur, D. 1990. Izmir Körfezi’ne Dökülen Nehir veDerelerdeki Azot Kirliliği. BSc. Graduation thesis,Izmir: Dokuz Eylül University, Department ofEnvironmental Engineering.
Esen, E. and Uslu, O. 2008. Assessment of the effects ofagricultural practices on non-point source pollutionfor a coastal watershed: A case study Nif Watershed,Turkey, Ocean and Coastal Management, 51: 601-611. doi:10.1016/j.ocecoaman.2008.06.012
Fofonoff, P. and Millard, R.C. 1983. Algorithms forcomputation of fundamental properties of seawater.UNESCO Technical Papers in Marine Sciences; 44-53.
Fox, L.E. 1983. The removal of dissolved humic acidduring estuarine mixing. Estuarine Coastal and ShelfScience, 16: 431-440.doi:10.1016/0272-7714(83)90104-X
Frimmel, F.H. and Christman, R.F. 1988. Humic Substancesand Their Role in the Environment, J Wiley and Sons,New York, 214 pp.
Gundogdu, V., Torusdag, E. and Sarikaya, D. 2005. Izmirkuş cenneti sulak alanının ekolojik yapısı ve sukirliliği izleme çalışması. Ekoloji, 54: 31-36.
Hong, H., Chen, W., Xu, L., Wang, X. and Zhang, L. 1999.Distribution and fate of organochlorine pollutants inthe Pearl River Estuary. Marine Pollution Bulletin, 39:376–382. doi:10.1016/S0025-326X(99)00081-8
Ittekkott, V. and Zhang, S. 1989. Pattern of particulatenitrogen transport in World Rivers. GlobalBiogeochemical Cycles, 3: 383–391.doi:10.1029/GB003i004p00383
Manly, B.F.J. 1986. Multivariate Statistical Methods.Chapman and Hall, London, 159 pp.
Meybeck, M. 1982. Carbon, nitrogen, and phosphorustransport by World Rivers. American J. of Science,282: 401–450. doi: 10.2475/ajs.282.4.401
Milliman, J.D., Huang-Ting, S., Zuo-Sheng, Y. and Meade,R.H. 1984. Transport and deposition of river sedimentin the Changjiang estuary and adjacent continentalshelf. Continental Shelf Research, 4: 37– 45.doi:10.1016/0278-4343(85)90020-2
Muller, P.J. 1977. C/N ratios in Pacific deep-sea sediments:effect of inorganic ammonium and organic nitrogencompounds sorped by clays. Geochimica etCosmochimica Acta, 41: 765–776.
Murathan, A. 1999. Menemen ovası yeraltı su tabakası ileyüzeyde bulunan su kütleleri Kus Cenneti ve Gediznehri arasındaki ilişki. MSc. thesis, Izmir: DokuzEylül University, Institute of Marine sciences andTechnology.
Ogura, N., Tanaka, Y., Itou, J. and Takahashi, K. 1983.Behavior of proteinaceous substances in the estuary ofthe Tama River. Journal of Oceanographic Society ofJapan, 40: 184-191
Okur, B., Hakerler, H., Anac, D., Anac, S., Dorsan, F. andYagmur, B. 1997. An investigation on monthly andseasonal variation of some pollution parameters ofGediz River. Research Project Report Number: 93-ZRF-043, Ege University, Izmir, Turkey.
Paulmier, P.G. 1997. Direction des ressources vivantes.Institut Français de recherche pour l’exploitation de lamer (IFREMER), Concarneau.
See Ja, H. and Bronk, D.A. 2005. Changes in C:N ratios andchemical structures of estuarine humic substancesduring aging. Marine Chemistry, 97: 334–346doi:10.1016/j.marchem.2005.05.006
Sokal, R.R. and Rohlf, F.J. 1981. Biometry. W.H. Freemanand Company, New York, 859 pp.
Solorzano, L. and Sharp, J.H. 1980. Determination of totaldissolved phosphorus and particulate phosphorus innatural waters. American Society of Limnology andOceanography, 25: 754-758.
Sunar, M. and Ersan, L. 1989. Kemalpaşa Nif Çayı kirlilikkaynakları ve kontrolü, BSc. Graduation thesis, Izmir:Dokuz Eylül University, Department ofEnvironmental Engineering.
Suzumura, M., Kokubun, H. and Arata, N. 2004.Distribution and charactreristics of suspentedparticulate matter in a heavily eutrophic estuary,Tokyo Bay, Japan. Marine Pollution Bulletin, 49:496-503. doi:10.1016/j.marpolbul.2004.03.002
Tomas, C.R. 1997. Identifying Marine Phytoplankton.Academic press, San Diego, California, 858 pp.
Trefry, J., Metz, S., Nelsen, T., Trocine, R. and Eadie, B.1994. Transport of particulate organic carbon by theMississippi River and its fate in the Gulf of Mexico.Estuaries, 17: 839–849.
Turner, A. and Millward, G.E. 2002. Suspended particles:Their role in estuarine biogeochemical cycles.Estuarine, Coastal and Shelf Science, 55: 857-883.doi:10.1006/ecss.2002.1033
Uslu, O. 2001. The Pollution of the Izmir Bay. In: O. Uslu,M. Özerler and E. Sayın (Eds.), ECOSYSTEM 99Workshop on the Role of the Physical, Chemical andBiological Processes in Marine Ecosystems, İzmir:162-198.
Usul, N. 2001. Engineering Hydrology, METU Press,Ankara, 404 pp.
Wetzel, R.G. 1992. Gradient-dominated ecosystems:Sources and regulatory functions of dissolved organicmatter in freshwater ecosystems. Hydrobiologia, 229:l-l 98. doi: 10.1007/BF00007000
Yoshioka, T., Ueda, S., Miyajima, T., Wada, E., Yoshida,N., Sugimoto, A., Vijarnsorn, P. and Boonprakub, S.2002. Biogeochemical properties of a tropical swampforest ecosystem in southern Thailand, Limnology, 3:51–59. doi: 10.1007/s102010200007