particle sieving in a random fiber network
TRANSCRIPT

Particle sieving in a random ®ber network
Jaime Castro, Martin Ostoja-Starzewski *
Institute of Paper Science and Technology, Georgia Institute of Technology, 500 10th Street, NW, Atlanta,
GA 30318-5794, USA
Received 11 March 1999; received in revised form 26 July 1999; accepted 19 October 1999
Abstract
An idealized ®ber network model is developed to study particle sieving by percolation. The model is based on a
Poisson line ®eld in two dimensions, whereby the ®bers are modeled as in®nite length strips of ®nite width, while
particles are modeled as circular disks. The probabilistic sieving problem is equivalent to percolation of disks through
convex polygons of the Poisson line ®eld. The area-based probability of retention (equivalently, percolation) is de-
scribed by an equation which depends on a single non-dimensional number that is proportional to the number of ®ber
per unit area and the particle size. The physical meaning and the applicable range of this number are discussed. Finally,
using a Monte Carlo simulation, the model is generalized to anisotropic Poisson line ®elds. Ó 2000 Elsevier Science
Inc. All rights reserved.
Keywords: Poisson line ®eld; Random ®ber network; Percolation; Monte Carlo simulation
www.elsevier.nl/locate/apm
Applied Mathematical Modelling 24 (2000) 523±534
Notationa; b; c general coe�cientsA areaC constantdf ®ber diameterdh hole or pore diameterdp particle diameterDW window diameterf �d� distribution functionF �d� cumulative distribution of f �d�g�h� angle distribution functionk general integer constantlf ®ber lengthn general integer numberNf number of ®bersp distance from line to coordinate originP probability function
* Corresponding author. Tel.: +1-404-894-5700; fax: +1-404-894-4778.
E-mail address: [email protected] (M. Ostoja-Starzewski).
0307-904X/00/$ - see front matter Ó 2000 Elsevier Science Inc. All rights reserved.
PII: S 0 3 0 7 - 9 0 4 X ( 9 9 ) 0 0 0 5 5 - 4

1. Introduction
The sieving of particles in a porous random structure like paper is of importance in processessuch as particle retention on a paper machine forming section or in operations such as coating andprinting. It also concerns the interaction of ¯uids and particles with ®nished paper products like®lters, board boxes, or cement sacks. However, particle retention by the sieving mechanism is nottotally clear because paper ®bers constitute a very complex, anisotropic microscopic networkwhen formed in a sheet of paper. It is interesting to note here that even the determination of basicgeometric properties of isotropic ®ber structures poses formidable challenges [11].
Our goal in this paper is to report on the development of analytical and computer models thatcan help in analyses of retention of particles by sieving in a ®ber-microstructure model. Corte andKallmes [1,2] were the ®rst to set up a random geometric model of cellulose ®ber networks. Theirswas essentially a germ±grain (Boolean type) model [10] in two dimensions (in the plane of paper),in which ®bers were modeled as ®nite rectangular elements. They de®ned the structure of paper as``the geometric arrangement of ®bres and inter®bre spaces in the sheet''. Soon thereafter, severalcharacteristics of a planar, isotropic Poisson line ®eld were investigated in considerable detail byMiles [3] and Richards [4]. This o�ered a way of modeling paper via a network of in®nitely long®bers and it is adopted in the present study as well. While the assumption of in®nite ®bers is arather strong idealization, the model gives closed form expressions for probability distributions ofseveral basic characteristics (e.g., pore size) and lends itself much more easily than the ®nite ®bermodel, to computer simulations of such properties. Using a computer simulation we can alsogeneralize it to anisotropic ®ber orientations in paper.
2. Model formulation
Fibers are initially taken as in®nitely long, straight cylinders with no internal ®bril structure. Inprojection onto an x, y-plane, ®bers become strips of width df , with their axes being lines of thePoisson line process. In the following we work with a construction in a polar-coordinate system(p, h), whereby a line, represented by a Hesse normal form
xcosh� y sinh � p �1�is speci®ed by a distance p from the origin of the x, y-system and an angle h that the foot of theperpendicular to the line makes with the positive x-axis, Fig. 1(a) and (b). The h-angle range isfrom 0 to 2p and the p-distance range is from 0 to R. In other words, a set of randomly generated
r polygon inscribed circle radiusrM triangle inscribed circleW basis weightwl ®ber weight per unit length�wf average ®ber weightx, y general variables
Greek symbolsC gamma distribution functionu sieving dimensionless parameterk coverage parameter (number of lines per unit area)h orientation angle
524 J. Castro, M. Ostoja-Starzewski / Appl. Math. Modelling 24 (2000) 523±534

points in the p, h-plane is transformed into the x±y plane, thus constituting a realization of in-dependent random secants within the simulation window of diameter DW�� 2R�. With h being auniform random variable, this is known as an `isotropic Poisson line ®eld' [3±5], and e�ectively, aPoisson point process in the p±h plane of intensity k (Fig. 1(a)) leads to a Poisson line ®eld(Fig. 1(b)). The number of randomly generated ®bers is Nf ; these ®bers form what is called a`single layer'.
The particles used in the retention analysis are the two-dimensional projections of spheres ±that is, they are disks of diameter dp. Like the ®ber angle, the particle size can have any distri-bution function, but, without much loss of generality, it is assumed here to be causal (all particleshave the same diameter) so as to simplify the sieving analysis.
It is assumed that each particle is being carried by a ¯uid, so that it will tend to move to theclosest pore (polygon) relative to a given initial position in the simulation ®eld. This model
Fig. 1. (a) Generation of the Poisson line ®eld; (b) Poisson line ®eld of 200 ®bers.
J. Castro, M. Ostoja-Starzewski / Appl. Math. Modelling 24 (2000) 523±534 525

assumes that there are no ionic, electrostatic forces or other means helping the retention ofparticles, and that all the particles will either pass or be retained by the ®ber network dependingon a `geometric ®tting'. Only the sieving mechanism leading to retention is of interest. Further-more, our analysis assumes that the events of retention are independent of each other. Similarly,in the case of a Monte Carlo simulation, we always start with a `clean' ®ber network ± meaningthat no pores are plugged ± when sieving each new particle; this assumption corresponds to lowparticle concentrations.
In general, however, h may follow a preferential orientation distribution in the so-called ma-chine-direction (MD), a situation relevant in the case of machine-made paper, which will bepursued at the end of our study.
3. Analysis
3.1. Polygon-number and area distributions
The Poisson line ®eld results in a mosaic of convex polygons. If d is the largest circle inscribedin a given polygon, its probability density fN �d� follows a negative exponential distribution [3]
fN�d� � C eÿkd : �2�In the above, N indicates that we deal with a polygon number-based density. The ®ber width (or®ber diameter) df is constant by assumption but since the ®ber length inside the window, lf , variesas it is the secant of a circle of diameter DW, an average ®ber length �lf must be used to estimate k,so that
k � Nf�lf
A� Nf pD2
W=4DW
� �pD2
W=4� Nf
DW
: �3�
Relation (2) gives a polygon-number density function fN�d�. It is independent of df ± when the®ber width is increased, the diameter of the inscribed circle is reduced by the same quantity. Anincrease in df makes some polygons to close (the inscribed circle diameter goes to zero) so that thetotal number of polygons is reduced, but the relative distribution is virtually the same. It isequivalent to shifting the curve of fN�d� to the left by df , that is f 0N�d� � CfN�d ÿ df�, but itsnormalization leads again to fN�d�. Constant C is used to normalize the function fN�d� so that the(cumulative) probability distribution FN�1� equals 1, that is
FN�1� �Z 1
0
C eÿkx dx � 1: �4�
The networkÕs ability to retain particles depends on the relative area of the polygon-inscribedcircles, rather than on the number of polygon-inscribed circles itself. It is thus necessary to ®nd anarea-distribution function fA�d�. The corresponding density function fA�d� can be calculated bycounting the square of the diameter of each polygon-inscribed circle, which is proportional to itsarea. Consequently, it follows that
fA�di� � Area of di
Total area� �pd2
i =4�fN�di�Pni�0�pd2
i =4�fN �di� �d2
i eÿkdiPn0 d2
i eÿkdi� CAd2
i eÿkdi : �5�
In the above, A indicates that we deal with a polygon area-based density. Eq. (5) has the form of aGamma distribution [6±8], that is
526 J. Castro, M. Ostoja-Starzewski / Appl. Math. Modelling 24 (2000) 523±534

f �x� � kk
C�k� xkÿ1eÿkx; C�k� �
Z 1
0
xkÿ1eÿx dx � �k ÿ 1�!; �6�
Noting from Eq. (6) that k � 3 (see also Fig. 2), it follows that C�k � 3� � 2!, while the constantto normalize (5) is CA � k3=2, so that
fA�d� � k3
2d2eÿkd : �7�
This ®nding coincides with the experimental results of a study due to Eim et al. [9]. They usednon-woven fabrics to construct a ®ber mat and then found the polygon-inscribed circles by usingan image analysis technique. They concluded that their pore size data could be ®tted by a Gammadistribution, but did not present an analytical expression. On the other hand, Dodson andSampson [7] analytically reached the same conclusion for the pore size distribution based on thesame concept of pore equivalent area from Corte and Kallmes [1] i.e. the polygon area ah isproportional to the square of the average polygon-side length. Basically, in Ref. [7], since the x-and y-direction free-®ber lengths have Gamma distributions, the pore area also has a Gammadistribution.
3.2. The sieving equation
If a particle with diameter dp enters the ®ber network, the probability that it passes through apolygon-inscribed circle (hole) of diameter dh is the same as the probability that dh is larger thandp. This can be expressed as P�dh > dp� and it is equal to a cumulative distribution of fA�dh� for alldh > dp. On the other hand, a probability that a particle can be retained by the network is theprobability that a polygon-inscribed circle diameter dh is smaller than or equal to the particlediameter dp. These two probabilities can be expressed as:
P fRetentiong � P�dh6 dp� � FA�dp� �Xdp
dh�0
fA�dh�; �8�
P fNo Retentiong � P �dh > dp� � 1ÿ FA�dp� � 1ÿXdp
dh�0
fA�dh�: �9�
Fig. 2. Gamma distribution function.
J. Castro, M. Ostoja-Starzewski / Appl. Math. Modelling 24 (2000) 523±534 527

The cumulative distribution FA�dp� is a direct indication of the particle sieving probability, whichis the ®nal objective of this study. The area-density function (7) can be integrated to ®nd FA�dp�and obtain an analytical expression:
FA�dp� �Z dp
0
fA�x�dx �Z dp
0
k3
2x2eÿkx dx: �10�
Upon an integration by parts, this yields
P fRetentiong � FA�dp� � 1ÿ 1
� kdp �
k2d2p
2
!eÿkdp : �11�
The parameters dp and k can jointly be replaced by a single `characteristic parameter' u (takingvalues between 0 and 1) because (11) is symmetric with respect to both of them, that is
Fig. 3. (a) Probability of particle retention by sieving as function of u; (b) probability of particle retention by sieving as
function of the ®bers per window-area and particle diameter.
528 J. Castro, M. Ostoja-Starzewski / Appl. Math. Modelling 24 (2000) 523±534

FA�u� � 1ÿ 1
�� u� u2
2
�eÿu; u � kdp � Nf
DW
dp: �12�
Henceforth, (12) will be referred to as a `retention probability equation' or a `sieving e�ciencyequation'. The probability of retention of particles of size by sieving can be interpreted now as a
Fig. 4. Samples of particle±®bre networks for di�erent values of u.
J. Castro, M. Ostoja-Starzewski / Appl. Math. Modelling 24 (2000) 523±534 529

function of tree parameters: the number of ®bers Nf in a circular area of diameter DW and theparticle diameter dp. Fig. 3(a) and (b) shows the retention of particles as a function of the numberof ®bers per window area and of the particle diameter.
In the context of paper, the number of ®bers per unit area is proportional to the basis weight Win paper. Then, the retention of particles by sieving in paper can be calculated directly from thebasis weight by using the following relation [1]
Nf
A� W
�wf
; �13�
where W is the basis weight of the sample of area A with Nf number of ®bers, and �wf is the average®ber weight. Substituting we ®nd
u � Nf�lf
Adp � W �lf
�wf
dp �14�
or
u � basis weight � average fiber length
average fiber weight� particle diameter:
3.3. The range of interest and use of the sieving equation
As an illustration of the meaning of u, Fig. 4 shows a representation of six random networks,each at a di�erent value of u. These values were calculated according to Table 1. Notice, however,that there are in®nite combinations of Nf , A, and dp that could give the same values of u.
It is evident from Fig. 4 that, for u < 1, the probability of retention by sieving is almost 0%,while, for u � 10, it is nearly 100%. In summary, the range of parameter u, for which the sievingequation has a range of interest, can be identi®ed as 06u6 10. Clearly, the value of u is char-acteristic of each network-particle system, and we propose it as a new dimensionless number.
Table 1
Determination of u for Fig. 4
Number of ®bers Particle diameter Window diameter u
5 10 200 0.25
10 10 200 0.50
20 10 200 1.00
60 10 200 3.00
120 10 200 6.00
200 10 200 10.00
Table 2
Coe�cients of Eq. (15)
Case a0 a1 a2
1 1 1 0
2 1 1 1
3 1 1/2 1/8
4 1 1 1/4
530 J. Castro, M. Ostoja-Starzewski / Appl. Math. Modelling 24 (2000) 523±534
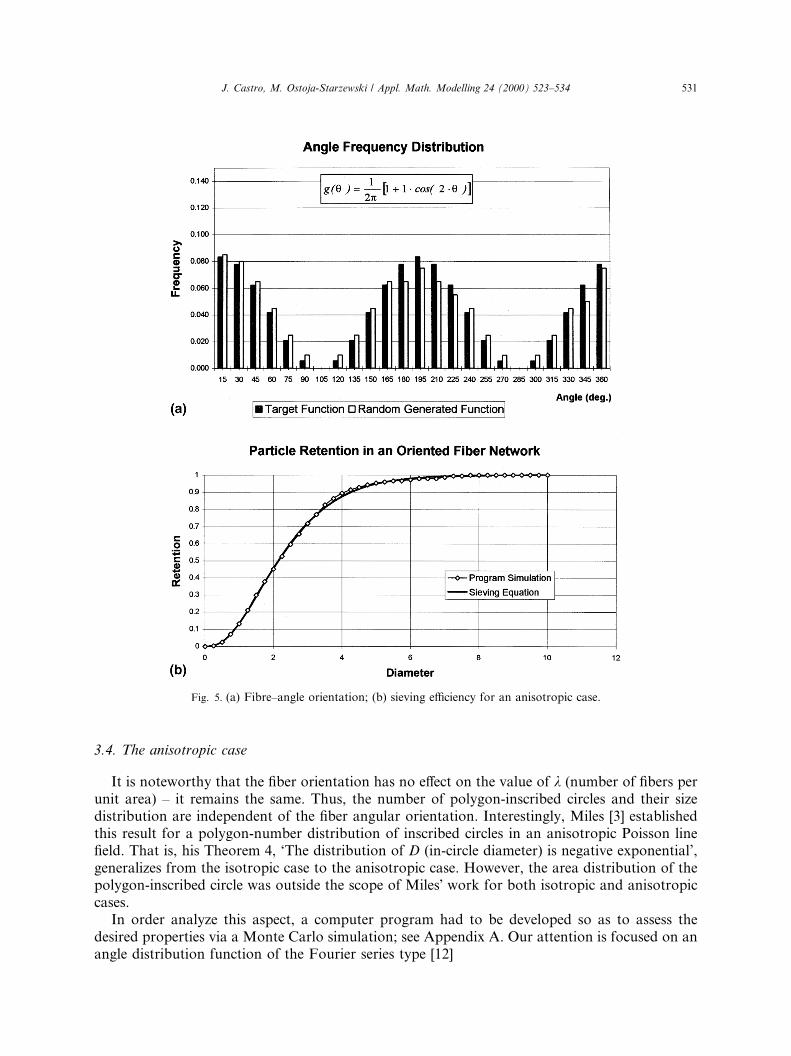
3.4. The anisotropic case
It is noteworthy that the ®ber orientation has no e�ect on the value of k (number of ®bers perunit area) ± it remains the same. Thus, the number of polygon-inscribed circles and their sizedistribution are independent of the ®ber angular orientation. Interestingly, Miles [3] establishedthis result for a polygon-number distribution of inscribed circles in an anisotropic Poisson line®eld. That is, his Theorem 4, `The distribution of D (in-circle diameter) is negative exponential',generalizes from the isotropic case to the anisotropic case. However, the area distribution of thepolygon-inscribed circle was outside the scope of MilesÕ work for both isotropic and anisotropiccases.
In order analyze this aspect, a computer program had to be developed so as to assess thedesired properties via a Monte Carlo simulation; see Appendix A. Our attention is focused on anangle distribution function of the Fourier series type [12]
Fig. 5. (a) Fibre±angle orientation; (b) sieving e�ciency for an anisotropic case.
J. Castro, M. Ostoja-Starzewski / Appl. Math. Modelling 24 (2000) 523±534 531

g�h� � 1
2p
X1n�0
an cos�2nh�; 06 h6 2p: �15�
We have tried several values of the a0; a1, and a2 coe�cients, see Table 2. Results of the ®rst ofthese cases, which, actually, is the strongest case of preferential orientation of ®bers relative to they-axis (Machine Direction (MD) in the paper science terminology) are shown in Fig. 5. Inparticular, Fig. 5(a) presents a plot of the assumed and the simulated angle distributions so as toindicate the quality of the Monte Carlo simulation using just 200 lines. Next, Fig. 5(b) plots theretention probability according to the simulation and according to our sieving Eq. (12). Evidently,the ®t is very good; it was equally good in other cases of Table 2.
4. Conclusions
To simulate and study the retention of particles by sieving in a ®ber network, the ®rst and mostimportant requirement is to de®ne the number of ®bers per network area and the particle size.
The number of inscribed circles and their size distribution in a ®ber network model made ofin®nite-length lines are independent of the ®ber orientation. The pore-size distribution, based onthe measurement of the polygon-inscribed circle, has a Gamma distribution that is a function ofthe number of ®bers per unit area only.
The equation developed to predict the retention probability or the sieving e�ciency of particlesin a ®ber network is a function of a dimensionless parameter, called u. This parameter, in turn, isproportional to the number of ®bers per unit area and the particle size. The usefulness of thedimensionless parameter u is that its magnitude provides an initial estimate of the range for whichthe retention by the sieving mechanism in a ®ber network is either feasible or negligible.
The simulation model results and the analytical expressions developed are in agreement withphysical simulation models made of wax bars resembling the ®bers and marbles resembling theparticles. Bearing in mind the model assumptions (cylindrical ®bers, spherical particles, unifor-mity, etc.), the present model should be applicable to particle sieving in ®ber mats. However, thedegree of agreement and applicability to paper needs further study. This can probably be achievedby ®nding and introducing an appropriate correction factor to the model. A comparison of thepresent model with experiments on a cellulose ®ber network is currently being conducted.
Acknowledgements
This research was made possible by the IPST member companies and the National ScienceFoundation under grant CMS-9713764.
Appendix A. Computer model of retention in anisotropic ®ber networks
Bearing in mind the assumptions and de®nitions stated for the present model, the procedure toconstruct the computer ®ber network is as follows. First, a circular simulation window of di-ameter DW is de®ned. Then, Nf lines are drawn randomly according to the transformation il-lustrated in Fig. 1(a); each line is speci®ed by an angle hi and a distance pi; i � 1; 2; . . . ;Nf . Theprogram follows a `target function', to generate a ®ber orientation angle. As an example, thisfunction generates the frequency distribution shown in the histogram on Fig. 6(a) and (b), whichcorrespond to the Poisson line ®eld presented in Fig. 1(b). This histogram also presents thedistribution of the angles generated by the program. There is a good agreement between both
532 J. Castro, M. Ostoja-Starzewski / Appl. Math. Modelling 24 (2000) 523±534
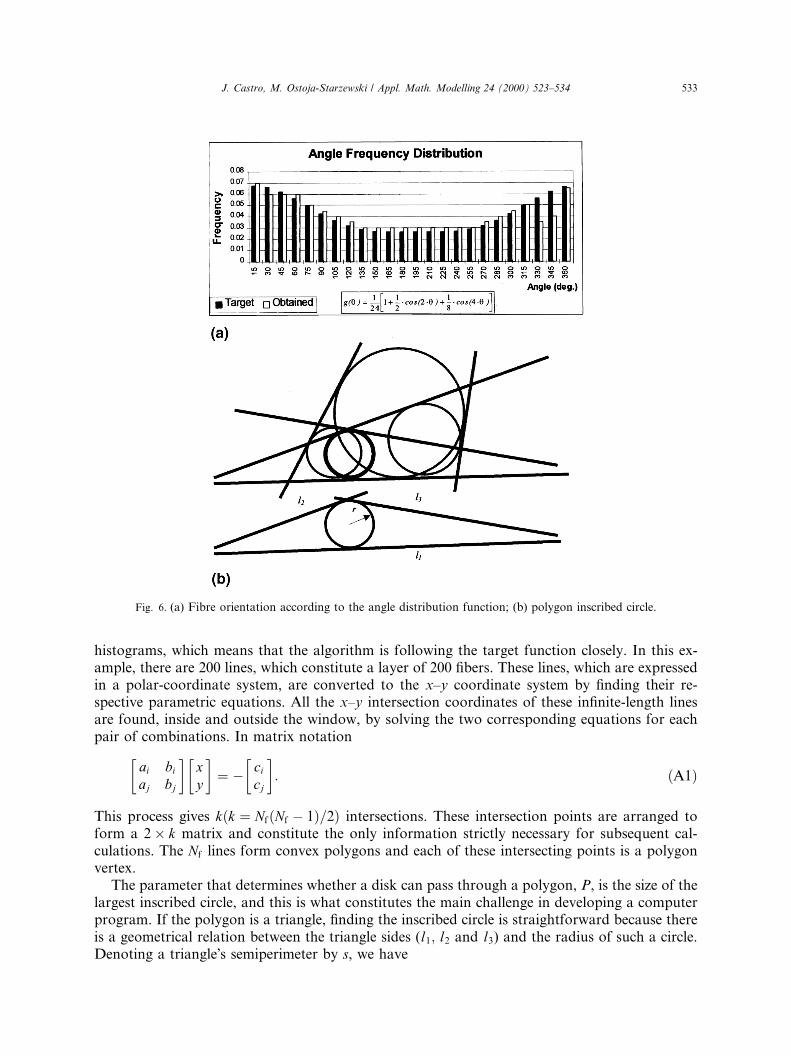
histograms, which means that the algorithm is following the target function closely. In this ex-ample, there are 200 lines, which constitute a layer of 200 ®bers. These lines, which are expressedin a polar-coordinate system, are converted to the x±y coordinate system by ®nding their re-spective parametric equations. All the x±y intersection coordinates of these in®nite-length linesare found, inside and outside the window, by solving the two corresponding equations for eachpair of combinations. In matrix notation
ai bi
aj bj
� �xy
� �� ÿ ci
cj
� �: �A1�
This process gives k�k � Nf�Nf ÿ 1�=2� intersections. These intersection points are arranged toform a 2� k matrix and constitute the only information strictly necessary for subsequent cal-culations. The Nf lines form convex polygons and each of these intersecting points is a polygonvertex.
The parameter that determines whether a disk can pass through a polygon, P, is the size of thelargest inscribed circle, and this is what constitutes the main challenge in developing a computerprogram. If the polygon is a triangle, ®nding the inscribed circle is straightforward because thereis a geometrical relation between the triangle sides (l1; l2 and l3) and the radius of such a circle.Denoting a triangleÕs semiperimeter by s, we have
Fig. 6. (a) Fibre orientation according to the angle distribution function; (b) polygon inscribed circle.
J. Castro, M. Ostoja-Starzewski / Appl. Math. Modelling 24 (2000) 523±534 533

rM ������������������������������������������������s�sÿ l1��sÿ l2��sÿ l3�
ps
; s � 1
2�l1 � l2 � l3�: �A2�
By de®nition, the distance from the center of the inscribed circle to each side of the triangle isconstant and each side is tangent to the same circle.
If the polygon P is more than three-sided, we need to consider all the possible triangles Mformed by the extension of the polygon sides (see Fig. 2(a)). Then, the polygon-inscribed-circle isidenti®ed to be the smallest of all the triangle-inscribed circles: r � minMfrMg. On the other hand,the radius of an inscribed circle is found using Eq. (A2): this is, strictly speaking, a maximum overall circles C contained within a given triangle M : rM � maxC�MfrCg. Thus, the polygon inscribed-circle is found as a solution of a saddle-point problem:
r � minM
maxC�MfrCg
� �: �A3�
Starting with the lowest x±y coordinate vertex of each polygon, the program identi®es eachpolygon by `walking' through its sides in a counter-clockwise manner until it reaches the startingvertex. Each polygon side is transformed into a vector form by ®nding the di�erence between itsending coordinates, xj; yj ÿ xi; yi. The vectorÕs cross-product (~li �~lj) properties are used to ®ndand keep the counter-clockwise direction.
References
[1] H. Corte, O.J. Kallmes, Formation and structure of paper: statistical geometry of a ®ber network, in: F. Bolam
(Ed.), Transactions Second Fundamental Research Symposium 1961, Oxford, BPBMA, London, 1962, pp. 13±46.
[2] H. Corte, O.J. Kallmes, The structure of paper ± I: the statistical geometry of an ideal two-dimensional ®ber
network, Tappi J. 43 (1960) 737.
[3] R.E. Miles, Random polygons determined by random lines in a plane, Proc. Nat. Acad. Sci. USA 52 (1964) 901±
907 and 1157±1160.
[4] P.I. Richards, Averages for polygons formed by random lines, Proc. Nat. Acad. Sci. USA 52 (1964) 1160±1164.
[5] I.K. Crain, R.E. Miles, Monte Carlo estimates of the distribution of the random polygons determined by random
lines in a plane, J. Stat. Comp. 4 (1976) 293±325.
[6] M. Deng, C.T.J. Dodson, Paper an Engineered Stochastic Structure, TAPPI Press, 1990.
[7] C.T.J. Dodson, W. Sampson, The e�ect of paper formation and grammage on its pore size distribution, J. Pulp
Paper Sci. 22 (5) (1996) 165±169.
[8] A. Papoulis, Probability, Random Variables and Stochastic Processes, McGraw-Hill, New York, 1984.
[9] S.Y. Eim, S.O. Hyuns, M.K. Kim, D.L. Lee, J.H. Park, New evaluation system for non-woven fabrics using
images analysis technique: coverstocks ®lters and interlinings, Book of Papers INDA-Tec. 96 (1996) 140±149.
[10] D. Stoyan, H. Stoyan, Fractals, Random Shapes and Point Fields, Wiley, New York, 1994.
[11] J.G. Parkhouse, A. Kelly, The random packing of ®bres in three dimensions, Proc. Roy. Soc. Lond. A. 451 (1995)
737±746.
[12] K.V. Mardia, Statistics of Directional Data, Academic Press, New York, 1972.
534 J. Castro, M. Ostoja-Starzewski / Appl. Math. Modelling 24 (2000) 523±534