particle acceleration and plasma dynamics during magnetic ...guofan/prints/guo2015apj.pdf ·...
TRANSCRIPT
PARTICLE ACCELERATION AND PLASMA DYNAMICS DURING MAGNETIC RECONNECTIONIN THE MAGNETICALLY DOMINATED REGIME
Fan Guo1, Yi-Hsin Liu
2, William Daughton
1, and Hui Li
1
1 Los Alamos National Laboratory, Los Alamos, NM 87545, USA; [email protected] NASA Goddard Space Flight Center, Greenbelt, MD 20771, USA
Received 2015 February 12; accepted 2015 April 28; published 2015 June 17
ABSTRACT
Magnetic reconnection is thought to be the driver for many explosive phenomena in the universe. The energyrelease and particle acceleration during reconnection have been proposed as a mechanism for producing high-energy emissions and cosmic rays. We carry out two- and three-dimensional (3D) kinetic simulations to investigaterelativistic magnetic reconnection and the associated particle acceleration. The simulations focus on electron–positron plasmas starting with a magnetically dominated, force-free current sheet (s pº B n m c(4 ) 1e e
2 2 ). Forthis limit, we demonstrate that relativistic reconnection is highly efficient at accelerating particles through a first-order Fermi process accomplished by the curvature drift of particles along the electric field induced by therelativistic flows. This mechanism gives rise to the formation of hard power-law spectra gµ - -f ( 1) p andapproaches p = 1 for sufficiently large σ and system size. Eventually most of the available magnetic free energy isconverted into nonthermal particle kinetic energy. An analytic model is presented to explain the key results andpredict a general condition for the formation of power-law distributions. The development of reconnection in theseregimes leads to relativistic inflow and outflow speeds and enhanced reconnection rates relative to nonrelativisticregimes. In the 3D simulation, the interplay between secondary kink and tearing instabilities leads to strongmagnetic turbulence, but does not significantly change the energy conversion, reconnection rate, or particleacceleration. This study suggests that relativistic reconnection sites are strong sources of nonthermal particles,which may have important implications for a variety of high-energy astrophysical problems.
Key words: acceleration of particles – galaxies: jets – gamma-ray burst: general – magnetic reconnection – pulsars:general – relativistic processes
1. INTRODUCTION
Magnetic reconnection is a fundamental plasma process thatrapidly rearranges magnetic topology and converts magneticenergy into various forms of plasma kinetic energy, includingbulk plasma flow, thermal and nonthermal plasma distributions(Kulsrud 1998; Priest & Forbes 2000). It is thought to play animportant role during explosive energy release processes of awide variety of laboratory, space, and astrophysical systemsincluding tokamak, planetary magnetospheres, solar flares, andhigh-energy astrophysical objects. Relativistic magnetic recon-nection is often invoked to explain high-energy emissions andultra-high-energy cosmic rays from objects such as pulsar windnebulae (PWNe; Kirk 2004; Arons 2012; Uzdensky &Spitkovsky 2014), jets from active galactic nuclei (AGNs; deGouveia dal Pino & Lazarian 2005; Giannios et al. 2009), andgamma-ray bursts (GRBs; Thompson 1994; Zhang & Yan 2011;McKinney & Uzdensky 2012). In those systems, the magnetiza-tion parameter s pº B n m c(4 )e e
2 2 , is often estimated to bemuch larger than unity, s 1, and the Alfvén speed approachesthe speed of light ~v cA . To explain the observed high-energyemissions, often an efficient energy conversion mechanism isrequired (e.g., Zhang et al. 2007, 2013; Celotti & Ghisel-lini 2008; Zhang & Yan 2011). Collisionless shocks, which canefficiently convert plasma flow energy into thermal andnonthermal energies in low-σ flows, are inefficient in dissipatingmagnetically dominated flows, where most of the energy isstored in magnetic fields. In these regimes, magnetic reconnec-tion is the primary candidate for dissipating and convertingmagnetic energy into relativistic particles and subsequentradiation. Understanding magnetic reconnection is also
important for solving the so-called σ-problem (Coroniti 1990;Lyubarsky & Kirk 2001; Kirk & Skjæraasen 2003; Porthet al. 2013), where strong magnetic dissipation may be requiredto convert the magnetically dominated flow (s 1) to a matter-dominated flow (s 1). However, the detailed physics ofrelativistic magnetic reconnection, including the magneticreconnection rate, energy conversion, and particle acceleration,are not well understood.Blackman & Field (1994) and Lyutikov & Uzdensky (2003)
have studied the properties of relativistic magnetic reconnec-tion using the extended Sweet–Parker and Petschek models.They found that when s 1 the outflow speed uout approachesthe speed of light, and the rate of relativistic magneticreconnection and inflow velocity uin may increase comparedto the nonrelativistic case. This is because of the enhancedoutflow density arising from the Lorentz contraction of plasmapassing through the diffusion region µ G Gu uin out out in, whereGout and Gin are Lorentz factors of outflows and inflows,respectively. However, later analysis (Lyubarsky 2005)showed that for a pressure-balanced current layer( p ~ +B nk T T8 ( )i e
2 ), the thermal pressure constrains theoutflow speed to be mildly relativistic and hence the effect ofLorentz contraction is negligible. Although the rate ofrelativistic magnetic reconnection is reported to increase in anumber of studies using different models (Zenitani et al. 2009;Bessho & Bhattacharjee 2012; Takamoto 2013; Comisso &Asenjo 2014; Guo et al. 2014; Melzani et al. 2014a; Sironi &Spitkovsky 2014), its nature is not clear. This issue has recentlybeen revisited by carefully analyzing results from fully kinetictwo-dimensional (2D) simulations (Liu et al. 2015), whichshow that the plasma density and pressure around the X-line
The Astrophysical Journal, 806:167 (17pp), 2015 June 20 doi:10.1088/0004-637X/806/2/167© 2015. The American Astronomical Society. All rights reserved.
1
drop significantly as the initial high-pressure region is depletedduring reconnection. This results in a reconnection region withs 1 and a relativistic inflow speed ~v cin . The localreconnection rate across the diffusion region is well predictedby a simple model that includes the Lorentz contraction.However, the extension of these results to three-dimensional(3D) kinetic simulations was not considered.
Plasma energization during magnetic reconnection has beenextensively discussed in the literature. However, the primaryacceleration mechanism is still unclear. Romanova & Lovelace(1992) analyzed particle motions in a large-scale reconnectionregion and predicted a spectrum g g= -dN d p with p = 1.5 forthe pair plasma case. Litvinenko (1999) found a solution with aspectral index p = 2 when particles are accelerated in a directelectric field associated with magnetic reconnection. Using amodel for the motions of particles in a steady magneticreconnection region, Larrabee et al. (2003) have found strongparticle acceleration in the reconnection layer and obtained ahard energy spectrum with a spectral index of about p = 1.First-order Fermi acceleration in converging reconnectioninflows has been proposed as a primary acceleration mechan-ism (de Gouveia dal Pino & Lazarian 2005; Lazarian &Opher 2009; Kowal et al. 2012). Drury (2012) studied theacceleration in a reconnection layer including energy change inboth inflows and outflows and demonstrated that fluidcompression is crucial for efficient particle acceleration. Thetest-particle approach has been applied to interpret the strongparticle acceleration responsible for γ-ray flares from the Crabpulsar (Cerutti et al. 2012). The results suggest that magneticreconnection may be responsible for producing the extremeparticle acceleration required to explain high-energy emissionsfrom the Crab flares (see also Cerutti et al. 2013). Self-consistent kinetic simulations have been widely used to studyplasma dynamics and particle energization during magneticreconnection. Most previous kinetic studies have focused onthe regime with s 1, and found a number of accelerationmechanisms such as direct acceleration at X-line regions(Drake et al. 2005; Fu et al. 2006; Pritchett 2006; Huang et al.2010; Oka et al. 2010) and Fermi-type acceleration inreconnection-induced plasma flows within magnetic islands(Drake et al. 2006, 2010; Huang et al. 2010; Oka et al. 2010).A recent attempt to incorporate different acceleration mechan-isms into a new transport equation is presented by Zank et al.(2014). The high-σ regime (s > 1) has been explored in anumber of papers using the Harris equilibrium (Zenitani &Hoshino 2001, 2007; Liu et al. 2011; Bessho & Bhattachar-jee 2012; Cerutti et al. 2013; Melzani et al. 2014b; Sironi &Spitkovsky 2014; Werner et al. 2014). However, the initialcondition employed in these studies requires a hot plasmacomponent inside the current sheet to maintain force balance,which may not be justified for high-σ plasmas. Recently,several studies have reported hard power-law distributions
⩽ ⩽p1 2 when s 1 (Guo et al. 2014; Melzani et al. 2014b;Sironi & Spitkovsky 2014; Werner et al. 2014). For a Harriscurrent layer, it was found that a power-law distribution can beobtained by subtracting the initial hot plasma component in thecurrent layer (Melzani et al. 2014b; Sironi & Spitkovsky 2014;Werner et al. 2014). In contrast, Guo et al. (2014) used a force-free current sheet that does not require the hot plasmapopulation and showed that the energy distribution of particleswithin the entire reconnection layer develops a power-lawdistribution. In this study, the primary acceleration mechanism
was demonstrated to be a first-order Fermi mechanism resultingfrom the curvature drift of particles in the direction of theelectric field induced by the relativistic flows. This mechanismgives rise to the formation of hard power-law spectra
gµ - -f ( 1) p with spectral index approaching p = 1 for asufficiently high σ and a large system size. An analytical modelwas developed to describe the main feature of the simulationsand it gives a general condition for the formation of the power-law particle energy distribution. The solution also appears toexplain simulations from the Harris current layer, in which theparticles initially in the current layer form a heated thermaldistribution and particles injected from the upstream region areaccelerated into a power-law distribution (Melzani et al. 2014b;Sironi & Spitkovsky 2014; Werner et al. 2014).Another important issue is the influence of 3D dynamics that
may significantly modify the reconnection rate, energy release,and particle acceleration process. Recently, the rate of 3Dnonrelativistic magnetic reconnection has been explored andcompared with 2D simulations in a number of nonrelativisticstudies (Liu et al. 2013; Daughton et al. 2014), which showedonly modest differences between 2D and 3D simulationsalthough strong 3D effects emerge as the tearing modedevelops over a range of oblique angles (Daughtonet al. 2011). For relativistic magnetic reconnection with a pairplasma, Sironi & Spitkovsky (2014) reported a decrease ofreconnection rate by a factor of 4 for 3D simulations comparedto 2D simulations. This is in contrast to Guo et al. (2014), whoobserved similar reconnection rates and energy conversionbetween 2D and 3D simulations, although the kink mode(Daughton 1999) strongly interacts with the tearing mode,leading to a turbulent reconnection layer (Yin et al. 2008). Forparticle acceleration in 3D reconnection simulations, earlystudies reported that the drift kink instability can modify theelectric and magnetic field structures in an antiparallelreconnection layer and prohibit nonthermal acceleration(Zenitani & Hoshino 2005, 2007, 2008). However, recentlarge-scale 3D simulations have found that strong nonthermalparticle spectra are produced even when the kink mode is active(Liu et al. 2011; Guo et al. 2014; Sironi & Spitkovsky 2014).Earlier large-scale 3D studies in nonrelativistic regimes alsodemonstrated the development of turbulence in the reconnec-tion layer (Yin et al. 2008), but the influence on energeticparticle acceleration is controversial, particularly in therelativistic regime.In this paper, we perform 2D and 3D fully kinetic
simulations starting from a force-free current sheet withuniform plasma density and temperature to model reconnectionover a broad range in the magnetization parameterσ = 0.25–1600. This paper builds upon earlier work (Guoet al. 2014) and gives further details regarding the plasmadynamics and particle acceleration during relativistic magneticreconnection in the high-σ regime. We also present detailedresults from a 3D simulation that shows a turbulent reconnec-tion layer arising from the interaction between the secondarytearing and kink modes. In Section 2, we describe thenumerical methods and parameters. Section 3 discusses themain results of the paper. In Section 4, we present an analyticalmodel that explains the main feature of particle acceleration inthe simulations. The implications from this work for a range ofastrophysical problems are discussed in Section 5 and ourconclusions are summarized in Section 6. In addition, we havealso explicitly examined the numerical convergence for this
2
The Astrophysical Journal, 806:167 (17pp), 2015 June 20 Guo et al.

problem and the effect of numerical heating in our simulations,which is discussed in the Appendix.
2. NUMERICAL METHODS
We envision a situation where intense current sheets aredeveloped within a magnetically dominated plasma. Earlierwork in nonrelativistic low-β plasmas has shown that thegradual evolution of the magnetic field can lead to formation ofintense, nearly force-free current layers where magneticreconnection may be triggered (Galsgaard et al. 2003; Titovet al. 2003). In the present study, the critical parameter is themagnetization parameter defined as s pº B n m c(4 )e e
2 2 ,which roughly corresponds to the available magnetic energyper particle. The numerical simulations presented in this paperare initialized from a force-free current layer with
l l= +B B z x B z ytanh( ) ˆ sech( ) ˆ0 0 (Che et al. 2011; Liuet al. 2013, 2014), which corresponds to a magnetic field withmagnitude B0 rotating by 180° across the central layer with ahalf-thickness of λ. No external guide field is included in thisstudy but there is an intrinsic guide field By associated with thecentral sheet. The plasma consists of electron–positron pairswith mass ratio =m m 1i e . The initial distributions areMaxwellian with a spatially uniform density n0 and a thermaltemperature ( = =kT kT m c0.36i e e
2). Particles in the centralsheet have a net drift = -U Ui e to represent a current density= -J U Uen ( )i e0 that is consistent with p ´ =B J c4 .
Since the force-free current sheet does not require a hot plasmacomponent to balance the Lorentz force, this initial setup ismore suitable to study reconnection in low-β and/or high-σplasmas. The full particle simulations are performed using theVPIC code (Bowers et al. 2009) and NPIC code (Daughtonet al. 2006; Daughton & Karimabadi 2007), both of whichsolve Maxwell equations and push particles using relativisticapproaches. The VPIC code directly evolves electric andmagnetic fields, whereas in the NPIC code the fields areadvanced using the scalar and vector potentials. Although thetwo codes have very different algorithms, all of the key resultsare in good agreement for this study, thus providing additionalconfidence in our conclusions. In addition, we have developeda particle-tracking module to analyze the detailed physics of theparticle energization process. In the simulations, we define andadjust σ by changing the ratio of the electron gyrofrequencyW = eB m c( )ece to the electron plasma frequency w =pe
pne m4 e2 , s p wº = WB n m c(4 ) ( )e e
2 2ce pe
2. For 2D simu-lations, we have performed simulations with s = 0.25 1600and box sizes ´ = ´L L d d300 194x z i i, ´d d600 388i i, and
´d d1200 776i i, where di is the inertial length wc pe. For 3Dsimulations, the largest case is ´ ´ =L L Lx y z
´ ´d d d300 194 300i i i with σ = 100. For high-σ cases(s > 25), we choose cell sizes sD = D =x y d1.46 i and
sD =z d0.95 i, so the particle gyromotion scale s~v ditheis resolved. The time step is chosen to correspond to a Courantnumber = D D =C c t r 0.7r , where D = D D Dr x y zD D + D D + D Dx y y z x z( ). The half-thickness of the currentsheet is l = d6 i for s ⩽ 100, d12 i for σ = 400, and d24 i forσ = 1600 in order to satisfy the drift velocity <U ci . For both2D and 3D simulations, we have more than 100 electron–positron pairs in each cell. The boundary conditions for 2Dsimulations are periodic for both fields and particles in the xdirection, while in the z direction the boundaries are conductingfor the field and reflecting for the particles. In the 3D
simulations, the boundary conditions are periodic for bothfields and particles in the y direction, while the boundaryconditions in the x and z directions are the same as in the 2Dcases. A weak long-wavelength perturbation (Birn et al. 2001)with =B B0.03z 0 is included to initiate reconnection. Theparameters for different runs are summarized in Table 1, whichalso lists key results such as maximum energy of particles,spectral index, the fraction of kinetic energy converted from themagnetic energy, and the portion of energy gain arising fromthe perpendicular electric fields.Using the set of numerical parameters described above, all of
the simulations show excellent energy conservation withviolation of energy conservation less than 10−3 of the totalenergy in all cases. However, we note that to accuratelydetermine the particle energy spectra, the violation in energyconservation should be smaller than the initial plasma kineticenergy, which is only a small fraction of the total energy forthese problems. Caution is needed when using a small numberof particles per cell and a small initial plasma kinetic energy inthe simulations (Sironi & Spitkovsky 2014), since numericalheating may significantly modify the particle distribution. Inthe Appendix, we have extensively tested how the numericalconvergence varies with the initial plasma temperature, cellsize, number of particles per cell, and time step. For all thecases we present in the main paper, the violation of energyconservation is a few per cent of the initial kinetic energy in thesystem, meaning that effects such as numerical heating have anegligible influence on the simulated energy spectra.
3. SIMULATION RESULTS
3.1. General Feature and Energy Conversion
Figure 1 gives an overview of the evolution of the currentlayer in the case with σ = 100 and domain size
´ = ´L L d d300 194x z i i ( =L d300y i for the 3D simulation)from runs 2D-7 and 3D-7. Panel (a) shows the color-codedcurrent density from the 2D simulation and panel (b) shows a2D cut of the current density and a 3D isosurface of plasmadensity colored by the current density from the 3D simulationat w =t 175pe and w =t 375pe , respectively. Starting from theinitial perturbation, the current sheet gradually narrows as thecurrent density is concentrated in the central region. In the 2Dsimulation, the extended thin current sheet breaks into anumber of fast moving secondary plasmoids (w ~t 225pe ) dueto the secondary tearing instability. The plasmoids coalesce andeventually merge into a single island at the edge of thesimulation domain similar to the nonrelativistic case (Daughton& Karimabadi 2007). In the 3D simulation, as the intrinsicguide field associated with the force-free current layer isexpelled from the central region, the kink instability (Daugh-ton 1999) develops and interacts with the tearing mode, leadingto a turbulent evolution (Yin et al. 2008). However, despite thestrong 3D effects that modify the current layer, small-scaleflux-rope-like structures with intense current density developrepeatedly as a result of the secondary tearing instability.Although the plasma dynamics in the 2D and 3D simulations
appears quite different, the energy conversion and particleenergization are very similar. Figure 2(a) shows the evolutionof magnetic energy EB, electric field energy EE, kinetic energyEk, and energy carried by relativistic particles with g > 4 fromthe 2D and 3D simulations (2D-7 and 3D-7). Note that, in bothof these simulations, the total energy is conserved to within
3
The Astrophysical Journal, 806:167 (17pp), 2015 June 20 Guo et al.

10−4 of the initial value. The evolutions of different forms ofenergies between 2D and 3D simulations are very similar. Inboth the 2D and 3D simulations, about 25% of the magneticenergy is converted into plasma kinetic energy, most of whichis carried by relativistic particles. Figure 2(b) shows the time-integrated energy conversion from magnetic energy into
plasma energy in the simulation ò ò J Edt dV ·t
0and its
contribution from parallel and perpendicular electric field terms J E· and ^ ^J E· , respectively. Here ò ò=dV dxdydz. Thedifference in energy conversion between the 2D and 3Dsimulations can be as large as a factor of 2 at w =t 300pe , but atthe end of the simulations both cases have converted about thesame amount of magnetic energy. This shows that the kinkinstability that may modify the magnetic field does notsignificantly change the overall energy conversion. While the
energy conversion through parallel electric field is importantwhen the thin current layer initially develops, most of theenergy conversion is due to perpendicular electric fieldsinduced by relativistic flows as the system is dominated bysecondary plasmoids/flux ropes. This analysis has been done inall the cases and summarized in Table 1, which shows that theperpendicular electric field typically plays a dominant role inconverting magnetic energy into plasma kinetic energy. Thiscan also be seen in Figure 3, which shows the color-codedintensities of J E· , ^ ^J E· , and J E· from the 2D and 3Dsimulations at w =t 175pe and w =t 375pe , respectively.Figure 2(c) compares the energy spectra from the 2D and 3Dsimulations at various times. The most striking feature is that ahard power-law spectrum gµ - -f ( 1) p with a spectral index~p 1.35 forms in both 2D and 3D runs. Although a fraction of
particles are accelerated in the early phase when the parallel
Table 1List of Simulation Runs with s ⩾ 6
Run σ System Size λ p γmax Ekin% ^J E( · ) % ατinj
2D-1 6 ´d d300 194i i 6di 2.2 45 23% 83% 0.4
2D-2 6 ´d d600 388i i 6di 2.0 56 32% 92% 0.5
2D-3 6 ´d d1200 776i i 6di 1.7 79 34% 93% 0.7
2D-4 25 ´d d300 194i i 6di 1.6 195 28% 85% 1.1
2D-5 25 ´d d600 388i i 6di 1.3 339 37% 90% 1.6
2D-6 25 ´d d1200 776i i 6di 1.2 617 42% 90% 2.0
2D-7 100 ´d d300 194i i 6di 1.35 650 29% 73% 2.0
3D-7 100 ´ ´d d d300 194 300i i i 6di 1.35 617 28% 71% N/A
2D-8 100 ´d d600 388i i 6di 1.25 1148 40% 78% 3.1
2D-9 100 ´d d1200 776i i 6di 1.15 1862 45% 94% 4.3
2D-10 400 ´d d300 194i i 12di 1.25 1514 20% 54% 3.0
2D-11 400 ´d d600 388i i 12di 1.15 3715 31% 75% 4.8
2D-12 400 ´d d1200 776i i 12di 1.1 5495 36% 86% 6.5
2D-13 1600 ´d d300 194i i 24di 1.2 2812 13% 45% N/A
2D-14 1600 ´d d600 388i i 24di 1.1 7913 21% 53% N/A
2D-15 1600 ´d d1200 776i i 24di 1.05 11220 30% 66% N/A
Note. The spectral index p, the maximum energy (100-particle level) at the end of the simulation gmax, the percentage of magnetic energy that is converted into kineticenergy E %kin , the percentage of the conversion of magnetic energy caused by perpendicular electric field ^J E( · ) , and atinj estimated by tracking particles in the
system.
Figure 1. Evolution of 2D and 3D simulations with σ = 100 and domain size ´ = ´L L d d300 194x z i i ( =L d300y i for 3D): (a) color-coded current density fromthe 2D simulation at w =t 175pe and w =t 375pe , respectively; (b) 2D cut of current density and a 3D isosurface of the plasma density colored by the current density atw =t 175pe and w =t 375pe , respectively.
4
The Astrophysical Journal, 806:167 (17pp), 2015 June 20 Guo et al.

electric field is important, most of the particles in the power-law distribution are accelerated when the system is dominatedby plasmoids/flux ropes. As we will discuss below, theformation of the power law is closely related to the motionalelectric field induced by the fast moving plasmoids. In thesubpanel, the energy spectrum for all particles in the 3Dsimulation at w =t 700pe is shown by the red line. The low-energy portion can be fitted by a Maxwellian distribution(black) and the nonthermal part resembles a power-lawdistribution (blue) starting at γ ∼ 2 with an exponential cut-off for γ 100. The nonthermal part contains ∼25% of
particles and ∼95% of the kinetic energy. The maximumparticle energy of the system can be predicted approximatelyusing the reconnecting electric field g - =m c ( 1)e
2max
ò ∣ ∣qE cdtrec until the gyroradius is comparable to the systemsize (see also Figure 6(b)). Although we observe a strong kinkinstability in the 3D simulations, the energy conversion andparticle energy spectra are remarkably similar to the 2D results,indicating that the 3D effects are not crucial for the particleacceleration. The fast acceleration is distinct from that ofnonrelativistic magnetic reconnection, where particles are atmost accelerated to mildly relativistic energy (e.g., Drake et al.2006; Fu et al. 2006; Pritchett 2006; Oka et al. 2010). Thenonthermal-dominated distribution in the simulations is alsoquite different from distributions in the relativistic shockregions (e.g., Spitkovsky 2008), where the particles are heatedat the shock front and form an extended thermal distributioncontaining most of the dissipated energy. The power-lawspectral index p ∼ 1 from relativistic reconnection issignificantly harder than the limit p ∼ 2 predicted bynonrelativistic and relativistic shock acceleration theories(e.g., Blandford & Eichler 1987; Achterberg et al. 2001).
3.2. Particle Acceleration
We now discuss the details of particle acceleration. We willfirst present some analysis of particle trajectories to show theacceleration mechanism. Then the dominant accelerationmechanism is distinguished by tracking all the particles andcalculating the energy gain using the guiding-center driftapproximation. The results demonstrate that the dominantacceleration mechanism is a first-order Fermi accelerationthrough curvature drift motion along the motional electric fieldinduced by the relativistic reconnection flows. We calculate theacceleration rate a e e= D Dt( ) and its time integral for caseswith σ = 6–400, where eD is the averaged energy gain forparticles of energy ò over a period Δt. Finally, we summarizethe character of the energy spectra. These main results will bediscussed and interpreted in detail in Section 4, where wepresent the acceleration model.Figures 4 and 5 present the trajectory analysis for the
motions of accelerated particles in the 2D case with σ = 100and ´ = ´L L d d600 388x z i i. These particles were selectedto show the characteristic trajectories of accelerated particles,which are consistent with the results of the statistical analysis inFigure 6. The first three panels of Figure 4 show (a) thetrajectory of a representative particle close to the central sheetbetween ωpet = 30–300 together with E at w =t 180pe , (b) thetrajectory of the same particle between ωpet = 310–510together with Ey at w =t 400pe , and (c) the trajectory of theparticle between ωpet = 510–720 together with Ey atw =t 640pe . The starting and ending locations of the particleare labeled by “+” and “×” signs, respectively. Note that thefield is highly variable in time and the location of the particle atthe same time step as the field contour is drawn by the “∗” sign.The two bottom panels show the evolution of the particleenergy as a function of time (d) and energy as a function of thexposition (e). Each period corresponding to that in (a)–(c) islabeled by the same color. The green curve represents theenergy gain in the parallel electric field integrated from t = 0.Initially the particle is close to the central layer and gainsenergy by the parallel electric field. It is then stronglyaccelerated by the perpendicular electric field when the
Figure 2. Plasma energetics in 2D and 3D simulations with σ = 100 anddomain size ´ = ´L L d d300 194x z i i ( =L d300y i for 3D): (a) evolution ofmagnetic energy EB, electric field energy EE, plasma kinetic energy Ek, andenergy carried by relativistic particles with Lorentz factor g > 4; (b) energyconversion from magnetic energy into plasma energy integrated over time
ò ò J Edt dV ·t
0and its contribution from parallel and perpendicular electric
fields J E· and ^ ^J E· ; (c) evolution of particle energy spectra from 2D and3D simulations. Subpanel: energy spectrum from the 3D simulations atw =t 700pe . The low energy is fitted with a thermal distribution and the rest ofthe distribution is a nonthermal power law with an exponential cut-off.
5
The Astrophysical Journal, 806:167 (17pp), 2015 June 20 Guo et al.

reconnection region breaks into multiple islands. This electricfield is predominantly due to the motional effect
= - ´E V B c generated by relativistic plasma outflows.The figure also shows that the acceleration by ^E resembles aFermi process as particles bounce back and forth within amagnetic island.
Figure 5 presents another view of the particle accelerationphysics. It is similar to Figure 4, but the field contours show theoutflow speed to highlight the role of Vx in the particle’senergization. This clearly illustrates a relativistic first-orderFermi process by bouncing in outflow regions of thereconnection layer. Note that the energy gain from the parallelelectric field for this sample particle is negligible since itentered the reconnection layer after the development ofmultiple plasmoids.
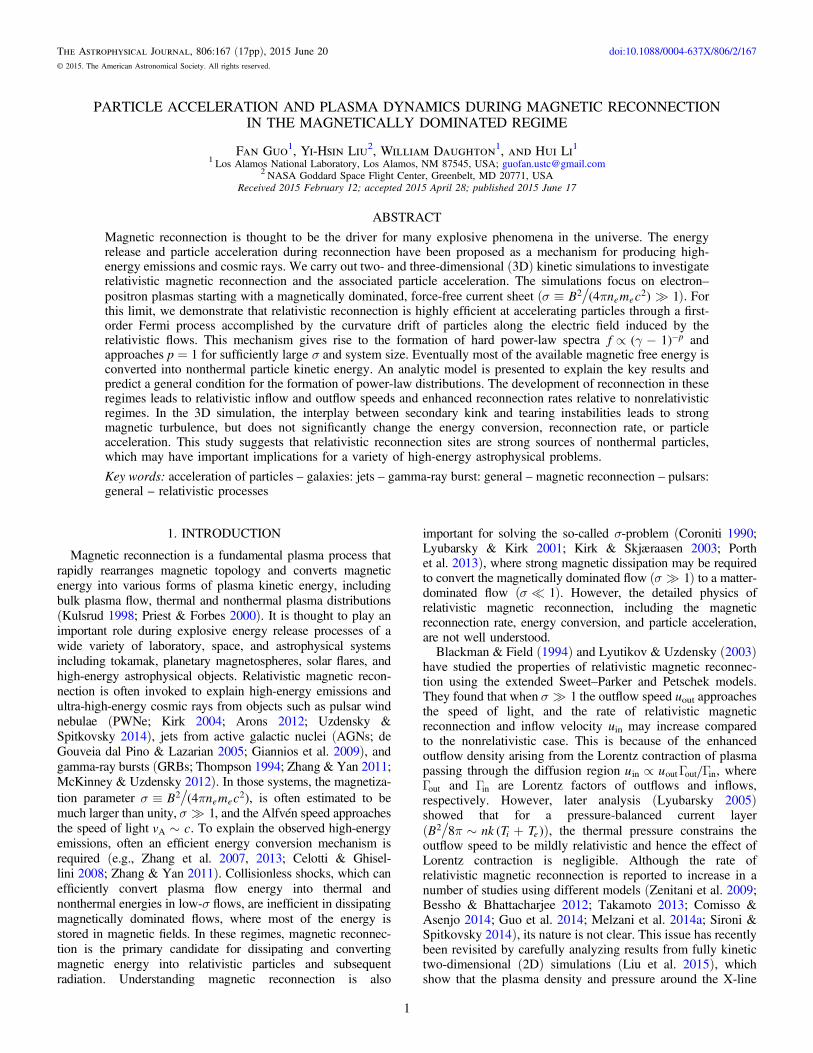
In Figure 6, we present more analysis to illustrate themechanism of the particle acceleration. Panel (a) shows theenergy as a function of the x position of four acceleratedparticles. Similar to Figure 5, the electrons gain energy bybouncing back and forth within the reconnection layer. Inaddition, we have analyzed trajectories of a large number ofparticles and found the energy gain for each cycle is e eD ~ ,which demonstrates that the acceleration mechanism is a first-
order Fermi process (Drake et al. 2006, 2010; Kowalet al. 2011). Panel (b) shows the maximum particle energyin the system as a function of time. This is plotted usingdifferent count levels from the 1-particle level to the 1000-particle level. Also plotted is the estimated maximum energyresulting from the reconnecting electric field by assumingparticles moving along the electric field at the speed of light
ò ∣ ∣qE cdtrec . This shows that the maximum possible energyoccurs for a small number of particles that continuouslysample the reconnection electric field g =m ce
2max
ò ∣ ∣qE cdtrec . At late time, as the particle gyroradius becomeslarge and comparable to the system size, the maximum energysaturates. To show the Fermi process more rigorously, wehave tracked the energy change for all the particles in thesimulation and the relative contributions arising from theparallel electric field ( ògD = m c qv E dte
2 ) and curvature
drift acceleration ( ògD = ^v Em c q dt·e2
curv ) similar to
Dahlin et al. (2014), where g= ´ Wv b b bv ( ( · ) )curv2
ce,v is the particle velocity parallel to the magnetic field, and= ∣ ∣b B B . Panel (c) shows the averaged energy gain and the
contribution from parallel electric field and curvature drift
Figure 3. Color-coded intensity of energy conversion rate J E· normalized using wn m ce02
pe and contributions from ^ ^J E· and J E· for the 2D and 3Dsimulations with σ = 100 at w =t 175pe and w =t 375pe , respectively. In the early stage the conversion by parallel electric field is important and the perpendicularelectric field plays a dominant role when multiple plasmoids (flux ropes in 3D) develop due to the secondary tearing instability.
6
The Astrophysical Journal, 806:167 (17pp), 2015 June 20 Guo et al.

acceleration over an interval of w-25 pe1 as a function of energy
starting at w =t 350pe . The energy gain follows e aeD ~ ,confirming the first-order Fermi process identified fromparticle trajectories. The energy gain from the parallel motiondepends weakly on energy, whereas the energy gain from thecurvature drift acceleration is roughly proportional to energy.In the early phase, the parallel electric field is strong but onlyaccelerates a small portion of particles, and the curvature driftdominates the acceleration starting at about w =t 250pe . Thecontribution from the gradient drift was also evaluated andfound to be negligible in comparison. Panel (d) showsa e e= D D⟨ ⟩ t( ) measured directly from the energy gain ofthe particles in the perpendicular electric field( ògD = ^ ^v Em c q dt·e
2 ) and estimated from the expressionfor the curvature drift acceleration. The close agreementdemonstrates that the curvature drift term dominates theparticle energization.
For higher σ and larger domains, the acceleration is stronger andreconnection is sustained over a longer duration. In Figure 7(a),we present the final energy spectra for a number of cases withdifferent σ and system size ´ = ´L L d d600 388x z i i. A
summary for the spectral index can also be found in Table 1. InFigure 7(b), a summary for the measured spectral index for thepower-law ranges of all the 2D runs shows that the spectrum isharder for higher σ and larger domain sizes, and approaches thelimit p = 1. Note that the spectral indices appear systematicallyharder than in other recent papers (Melzani et al. 2014b; Sironi &Spitkovsky 2014; Werner et al. 2014). However, the energyspectra in these studies are plotted using total relativistic energygmc2 and here we use kinetic energy g - mc( 1) 2. Using totalrelativistic energy in the energy spectra significantly distorts thespectral index in the energy range g< - <0 1 10, which mayalter the interpretation of the results (Melzani et al. 2014b; Sironi& Spitkovsky 2014; Werner et al. 2014).3
Figure 4. Panels (a)–(c) show a particle trajectory in the x–z plane together with the color-coded electric field (a) E , (b) Ey, and (c) Ey. Panels (d) and (e) show theparticle energy as a function of time and energy as a function of the x position, respectively. In (d) and (e), curves with different colors represent the energy evolutionduring time periods in (a)–(c). The green curve shows the integrated energy gain from the parallel electric field.
3 In fact, our simulation results show that the “−1” spectra can be obtained aslong as the magnetic energy dominates over the initial plasma kinetic energyp b= nkT B8 10
2 . An example can be seen in the appendix (Figure 13),which robustly shows that the p = 1 spectrum can be obtained when σ = 25and =kT mc0.010
2. The same spectrum gives a “p ∼ 2” slope when it is plottedas a function of γ, which may explain the different conclusions reported byother papers (Melzani et al. 2014b; Sironi & Spitkovsky 2014; Werneret al. 2014).
7
The Astrophysical Journal, 806:167 (17pp), 2015 June 20 Guo et al.

3.3. Reconnection Rate and Relativistic Flows
Figure 8(a) shows the time-dependent reconnection ratesnormalized using the initial asymptotic magnetic field B0 in 2Dand 3D simulations with σ = 100 (runs 2D-7 and 3D-7). The2D reconnection rate is computed from
y= =
¶¶
RE
B B V t
1,rec
0 0 A0
where y = -A Amax( ) min( )y y along the central layer z = 0,Ay is the vector potential along the y direction, ⟨⟩ represents a timeaverage over d w =t 25pe (Liu et al. 2014), and
s s= + = +V v v c c1 ( ) (2 )A0 A A2 is the relativistic
Alfvén speed in the cold-plasma limit. Herep= +v B n m m4 ( )i eA 0 is the nonrelativistic Alfvén speed
based on B0. The 3D reconnection rate is estimated by using themixing of plasma across the separatrix surfaces (Daughtonet al. 2014). The rate in the 2D simulation is quite variable but therange is within a factor of 2 of the 3D rate. Figure 8(b) shows the
peak reconnection rate for a number of 2D cases with σ from 0.25to 1600 and box size ´d d1200 776i i. The rate is observed toincrease with σ from ~E B0.03rec 0 for σ = 1 to ~E B0.24rec 0
for σ = 1600. These results show that the peak reconnection fieldincreases with σ and starts to saturate around σ = 1000. For low-σ cases with s < 1, the reconnecting electric field is consistentwith previous work for nonrelativistic reconnection (e.g.,Daughton & Karimabadi 2007). More detailed analyses haveshown that for high-σ cases, the reconnection rate normalizedusing the magnetic field Bu upstream of the diffusion regionE Burec is close to 1 for σ 100 (Liu et al. 2015).In Figures 9(a) and (b) we plot the maximum flow velocity
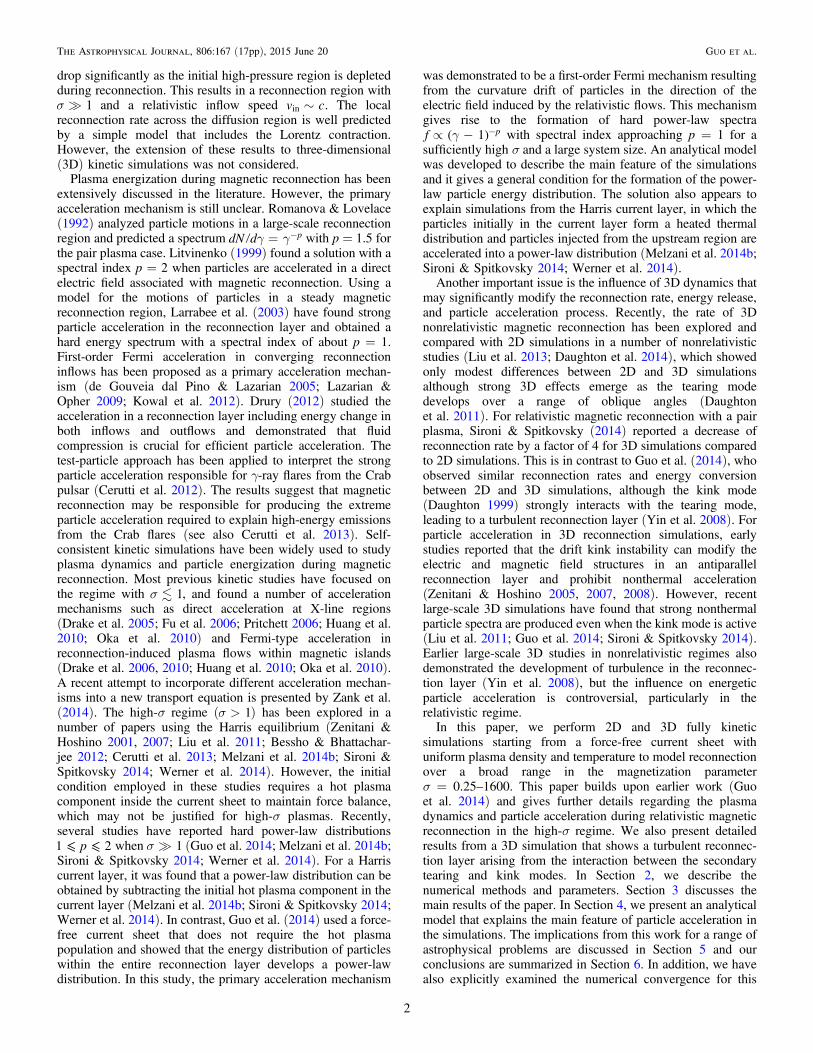
in the x direction (outflow direction) and the correspondingLorentz factor Γx. The 2D results are represented by bluesymbols and the 3D results are in red symbols. Although wehave only used a small simulation domain that may be affectedby counter-streaming particles, a relativistic outflow stilldevelops with Γx of a few. In Figures 9(c) and (d) we plotthe maximum flow velocity in the z direction (inflow direction)and the corresponding Lorentz factor Γz, respectively.
Figure 5. Panels (a)–(d) show a particle trajectory in the x–z plane together with the fluid velocity in the x direction Vx. Panels (e) and (f) show the particle energy as afunction of time and energy as a function of the x position, respectively. Different colored curves represent the energy evolution during time periods in (a)–(d),showing that the particle gains energy by bouncing in the relativistic flow generated by reconnection.
8
The Astrophysical Journal, 806:167 (17pp), 2015 June 20 Guo et al.
Interestingly, the inflow speed can also be relativistic for high-σ cases. Detailed analysis for the diffusion region has beendiscussed in Liu et al. (2015), which shows that the inflowspeed can be predicted by a model based on the Lorentzcontraction of the plasma passing through the diffusion region.
The enhanced reconnection rate and development ofrelativistic inflow/outflow structures are in contrast to earlierresults (Sironi & Spitkovsky 2014), where the observedoutflows were only mildly relativistic and the inflow remainednonrelativistic. Note that Liu et al. (2015) have also reportedthe development of relativistic inflow for both Harris and force-free current sheets, indicating that this property of relativisticmagnetic reconnection does not strongly depend on the initialsetup.
3.4. 3D Dynamics
In our 3D simulation, we also find that relativistic outflowswith Γx ∼ 4 can develop in the system. Figure 10 shows thepower spectrum of magnetic fluctuations with wave numbersperpendicular to the y direction and a volume rendering of thecurrent density in the 3D simulation with σ = 100 atw =t 708pe . The power spectrum shows a clear inertial rangewith a slope of “−2” and steeper slope for higher wavenumbers ^k d 1i . As we have discussed, the 3D simulationallows the development and interaction of secondary tearinginstability and kink instability, leading to a turbulent magneticfield in the reconnection layer. Throughout these simulations,the range of scales for the 2D magnetic islands is similar tothe observed 3D flux ropes. The maximum energy in both 2Dand 3D agrees well with the time integral of energy gain fromthe reconnecting electric field. The energy distributions
reported in this paper are remarkably similar in 2D and 3D,suggesting that the underlying Fermi acceleration is ratherrobust and does not depend on the existence of well-definedmagnetic islands.
4. A SIMPLE MODEL
It is often argued that some loss mechanism is needed toform a power-law distribution (Zenitani & Hoshino 2001;Drake et al. 2010, 2013; Hoshino 2012). However, thesimulation results reported in this paper clearly show power-law distributions in a closed periodic system. Here we present asimple model to explain the power-law energy spectrumobserved in our particle-in-cell (PIC) simulations. The model isillustrated by Figure 11(a). As reconnection proceeds, coldplasma in the upstream region advects into the accelerationzone at a constant velocity that is determined by reconnectionelectric field = ´E BV c Bin rec
2. The process lastst ~ L V2z in, where Lz is the size of the simulation box alongthe z direction. In the acceleration region, our analysis hasshown that a first-order Fermi process dominates the energygain during reconnection. We solve the energy-continuityequation for the energy distribution function ef t( , ) within theacceleration region
ee
¶+
¶¶
æèçç綶
öø÷÷÷ =
f
t tf 0, (1)
with acceleration e ae¶ ¶ =t , where e g= -m c kT( 1)e2 is
the normalized kinetic energy and α is the constant accelerationrate in the first-order Fermi process. We assume that the initialdistribution within the layer f0 is Maxwellian with initial
Figure 6. (a) Energy as a function of x position of four accelerated particles; (b) the maximum energy of particles in the system as a function of time from the1-particle count level to the 1000-particle count level. The red dashed line shows the maximum energy estimated for a particle moving in the direction of thereconnecting electric field at the speed of light òg = ∣ ∣m c qE cdte
2max rec ; (c) averaged energy gain and contributions from parallel electric fields and curvature drift
acceleration over a time interval of w-25 pe1 as a function of particle energy starting at w =t 350pe ; (d) a e e= D D⟨ ⟩ t( ) from energy gain in the perpendicular electric
field and by curvature drift acceleration, and from Equation (6) using the averaged flow speed and island size.
9
The Astrophysical Journal, 806:167 (17pp), 2015 June 20 Guo et al.

temperature <kT m ce2, such that
g g e
e e e
µ - -
Ⱦ
èçççç
+ +ö
ø÷÷÷÷÷
-
( )f
kT
m c
1 exp( )
2 15
4.... exp( ). (2)
e
02 1 2
2
For simplicity, we consider the lowest order (nonrelativistic)
term in this expansion and normalizep
e e= -fN2
exp( )00
by the number of particles N0 within the initial layer. Thedistribution after time t is
ep
e e= -a a- -( )f tN
e e( , )2
exp , (3)t t0 3 2
which remains a thermal distribution with a temperature ae Tt ,consistent with that obtained by Drake et al. (2010). However,since upstream particles enter continuously into the accelera-tion region, the number of particles in the acceleration zoneincreases with time. We consider a particle distribution
pe e= -f
N2exp( )inj
injwith number of particles
tµN Vinj in inj injected from upstream, where tinj is the timescalefor particle injection. To highlight the key role that time-dependent injection plays in setting up the power law, we firstconsider a quick heuristic derivation of the main result. Toproceed, we split finj into N groups and release the jth groupinto the acceleration region at time = Dt j t. Since each groupwill satisfy Equation (3) for a different initial time, after wehave injected the final group at t=t inj, the total distribution (inthe limit ¥N ) is
òept
e e
at
e e
e
p
e
e
~ -
=é
ë
êêê
-
+- - ù
û
úúú
ta a
at
at at e
- -
-
- - -
( ) ( )
( )
( )
f tN
e e dt
N e
e e e
( , )2
exp
erf erf
2 exp. (4)
t tinj
inj 0
3 2
inj
inj
1 2 1 2 2
2
1 2
inj
inj
inj inj
Figure 7. Energy spectra at the end of simulations for a series of 2D runs withsystem size ´ = ´L L d d600 388x z i i and different σ from 6 to 1600. (b)Spectral index for all 2D simulations with σ from 6 to 1600. (c) Time-integrated atinj for cases with σ = 6–400 and different system sizes.
Figure 8. (a) Time-dependent 2D and 3D reconnection electric fieldnormalized by the initial magnetic field E Brec 0. (b) Normalized peak electricfield E Brec 0 as a function of σ in 2D simulations.
10
The Astrophysical Journal, 806:167 (17pp), 2015 June 20 Guo et al.
In the limit of at 1, this gives the relation eµf 1 in theenergy range e< < ate1 inj. Figure 11(b) shows (4) fordifferent atinj. A power-law spectrum with p = 1 emerges asatinj increases at > 1inj . Note that for a closed system, since the
averaged magnetic energy per particle is only sm c 4e2 and the
energy in each energy bin is constant, the maximum energy ofthe power law can only extend to g s~ 4max .
Next, in order to treat the problem more rigorously, andinclude the influence of particle escape, we consider the morecomplete equation
ee
t t¶¶
+¶¶
æèçç綶
öø÷÷÷ = -
f
t tf
f f, (5)
inj
inj esc
where tesc is the escape time for particles. For the initialcurrent-layer distribution f0 and injected particle distribution finjconsidered above, the solution can be written as
ep
e e
p at ee
e
= -
+ éëêG
- G ùû
b a a
b ba
b
- + -
+ +-
+
( )
( )
f tN
e e
Ne
( , )2
exp
2
( )
( ) , (6)
t t
t
0 (3 2 )
inj
inj1 (3 2 )
(3 2 )
where b at= 1 ( )esc and G x( )s is the incomplete Gammafunction. The first term accounts for particles initially in theacceleration region while the second term describes theevolution of injected particles. In the limit of no injection orescape (t ¥esc and t ¥inj ), the first term in (6) remains athermal distribution the same as (3). However, as reconnectionproceeds new particles enter continuously into the accelerationregion and due to the periodic boundary conditions there is noparticle escape. Thus considering the case t ¥esc andassuming N N0 inj, at the time t=t inj when reconnectionsaturates the second term in (6) simplifies to (4). Thus in thelimit ~N N0 inj the first term in (6) should be retained and thepower-law produced is sub-thermal relative to this population.While it is straightforward to obtain the relativistic correctionsarising from the injected distribution (2), we emphasize thatthese terms do not alter the spectral index. This solutionexplains results from our simulations, and also appears toexplain the results from several recent papers, which obtainedpower-law distributions by subtracting the initial hot plasmacomponent in the current layer (Melzani et al. 2014b; Sironi &Spitkovsky 2014; Werner et al. 2014). In particular, Melzaniet al. (2014b) explicitly discussed the evolution of particledistribution initially in the current layer and reported it as aheated Maxwellian distribution.
Figure 9. (a) Maximum flow velocity in the x direction Vx as a function of σ; (b) the maximum flow Lorentz factor in the x direction G = - V c1 (1 )x x2 2 as a
function of σ; (c) the maximum flow velocity in the z direction Vz as a function of σ; (d) the maximum flow Lorentz factor in the z direction G = - V c1 (1 )z z2 2 as a
function of σ.
11
The Astrophysical Journal, 806:167 (17pp), 2015 June 20 Guo et al.

In order to estimate the acceleration rate α, the energychange of each particle can be approximated by a relativisticcollision formula (e.g., Longair 1994)
e eD =æ
èççççG
æ
èçççç
+ +ö
ø÷÷÷÷-
ö
ø÷÷÷÷÷
Vv
c
V
c1
21 , (7)V
x22
2
2
where V is the outflow speed, G = - V c1 (1 )V2 2 2 , and vx is
the particle velocity in the x direction. The time between twocollisions is about L vxis , where Lis is the typical size of themagnetic islands (or flux ropes in 3D). Assuming thatrelativistic particles have a nearly isotropic distribution
~v c 2x , then
ae
e=
DD
~
æ
èççççG
æ
èçççç
+ +ö
ø÷÷÷÷-
ö
ø÷÷÷÷÷
t
cV
c
V
c
L
1 1
2. (8)
V2
2
2
is
Using this expression, we measure the averaged V and Lis fromthe simulations and estimate the time-dependent accelerationrate a t( ). An example is shown in Figure 6(d). This agreesreasonably well with that obtained from perpendicular accel-eration and curvature drift acceleration. Figure 7(c) shows the
time-integrated value of òat a=t
t dt( )inj0
inj
for various
simulations with σ = 6–400. For cases with at > 1inj , a hardpower-law distribution with spectral index p ∼ 1 forms. Forhigher σ and larger system size, the magnitude of atinj
increases approximately as sµ 1 2.Better agreement between the simple model and the PIC
simulations can be reached by considering the time-dependentacceleration rate α(t). As the magnetic reconnection saturates,the acceleration rate decreases. Figure 11(c) shows thesolution that uses the time-dependent acceleration rate α(t)in Figure 6(d) using a stochastic integration techniquedescribed by Guo et al. (2010). The final spectral index isabout p = 1.25, similar to that from the PIC simulation shownin Figure 7(a).
Figure 10. Evidence for turbulence in the 3D simulation. Left: power spectrum of magnetic fluctuations with wave numbers perpendicular to the y direction. Right:volume rendering of the current density J J0 in the 3D simulation at w =t 708pe .
Figure 11. (a) Illustration of the acceleration model for the formation ofpower-law distributions. (b) Analytical results for different atinj obtained fromEquation (4). (c) The solution of Equation (1) using time-dependent α(t) fromFigure 6(d).
12
The Astrophysical Journal, 806:167 (17pp), 2015 June 20 Guo et al.

5. IMPLICATIONS
We discuss the implication of the above conclusions forunderstanding the role of magnetic reconnection in magneti-cally dominated astrophysical systems. Based on the currentunderstanding of magnetic reconnection, multiple X-linereconnection develops when the secondary tearing instabilityis active in a large-scale collisionless plasma system. Thisprocess may also be important when a hierarchy of collisionalplasmoids (Loureiro et al. 2007; Bhattacharjee et al. 2009;Uzdensky et al. 2010) develops kinetic-scale current layers thatmay trigger collisionless reconnection (Daughton et al. 2009; Ji& Daughton 2011). Therefore the collisionless reconnectionprocess discussed here is relevant to a range of high-energyastrophysical problems listed below (see Ji & Daughton 2011,for a comprehensive summary of astrophysical problems withrelevant physics).
5.1. PWNe
In PWN models, magnetic reconnection has been proposedas a mechanism for dissipating magnetic energy in Poynting-flux-dominated flows (Coroniti 1990; Lyubarsky & Kirk 2001;Kirk & Skjæraasen 2003; Porth et al. 2013) and acceleratingparticles to high energies (Kirk 2004). In PWNe, the emissionflux usually has spectral indices αν = 0–0.3 in the radio range,which requires an electron energy distribution g gµ -dN d p
with p = 1–1.6 ( a= +np 2 1), too hard to be explained bydiffusive shock acceleration (Atoyan 1999). The recentlydetected >100MeV Crab flares have photon energies well
above the usually employed upper limit for synchrotronemissions, challenging the traditional acceleration theory(Abdo et al. 2011; Tavani et al. 2011; Bühler & Bland-ford 2014). There are two main possibilities for explaining thephoton energies: (1) a relativistic Doppler boosting of theemitting region (Clausen-Brown & Lyutikov 2012) and/or (2)a strong particle acceleration in a nonideal electric field where> ^E B , where ^B is the magnetic field perpendicular to the
particle velocity (Cerutti et al. 2013; M. Lyutikov et al. 2014,in preparation).These observations suggest that relativistic magnetic recon-
nection may occur in the Crab Nebula. The power law indexrevealed in this study is p = 1–2, consistent with the inferredspectra in the radio range (Atoyan 1999) and in high energyduring the Crab γ-ray flares (Tavani et al. 2011). Explainingthese observations requires a fast and efficient dissipationmechanism that converts a substantial fraction of magneticenergy into relativistic particles (Lyutikov et al. 2014). In theCrab pulsar, magnetic reconnection is estimated to be in theplasmoid-dominated regime and can dissipate a nontrivialfraction of the pulsar spin-down power (Uzdensky &Spitkovsky 2014). Our simulations have shown that for amagnetically dominated reconnection layer with s 1, themagnetic reconnection rate is greatly enhanced by about oneorder of magnitude compared to the nonrelativistic limit (seealso Liu et al. 2015) and a large fraction of magnetic energy inthe system is converted into a nonthermal energy distribution,suggesting an efficient magnetic dissipation and strongnonthermal radiation processes in the Crab wind. Themaximum particle energy increases linearly and can be wellpredicted by assuming particles moving along the reconnectingelectric field at the speed of light. There are also relativisticinflow and outflow structures (Γmax 10) associated withreconnection, which may boost the emission photon energy andhelp to explain the observed Crab flares (Clausen-Brown &Lyutikov 2012). It is interesting to note that the reconnectionacceleration may also explain the pulsed γ-ray emission,although observations at higher energies are required to furtherconstrain the model (Mochol & Pétri 2015).
5.2. AGN Jets
In AGN jets, a number of γ-ray sources have flat radiospectra with indices around αν = 0, meaning the electronenergy distribution index may be close to p = 1 (Abdoet al. 2010; Hayashida et al. 2015). Several blazars have shownextremely fast variability in the TeV range of the order ofseveral minutes (Aharonian et al. 2007; Albert et al. 2007).Hard power laws p ∼ 1 in the TeV range have been inferredafter removing the effect of the extragalactic background lightusing various models (Aharonian et al. 2006; Krennrichet al. 2008). For GeV–TeV flat spectrum radio quasars(FSRQ), high radiation efficiency is reported (Zhanget al. 2013) and the electron σe, which is measured as magneticenergy power to the electron energy power, is very high—up tothe order of 100 (Zhang et al. 2014).Explaining the fast variability requires the relativistic
beaming effect possibly arising from relativistic reconnectionoutflows (Giannios et al. 2009; Deng et al. 2015). Our kineticsimulations have shown that the Lorentz factor of themaximum outflow speed Γx ∼ 10 for σ ∼ 1000. The simulationresults and theoretical model predict a hard particle energydistribution consistent with the hard radio spectra observed in
Figure 12. Several cases with =kT m c0.36 e02 with grid number 2048 × 2048,
Courant number Cr = 0.7 but different numbers of particles per cell from 8to 512.
13
The Astrophysical Journal, 806:167 (17pp), 2015 June 20 Guo et al.

some AGNs (Romanova & Lovelace 1992). Recent advancedAGN emission models have inferred that at least for some typesof blazers, particularly FSRQ, strong particle acceleration and/or strong magnetic field is necessary to explain fast flares, andσ inferred from the model fitting can significantly exceed unity,s 1 (Chen et al. 2014). Magnetic reconnection may offer anexplanation for the simultaneous decrease of magnetic field andincrease in emission during the flare phase of blazar flares andis a promising scenario for modeling AGN emissions (Zhanget al. 2014).
5.3. GRBs
In GRBs, the traditional internal-shock model of promptemission is difficult to reconcile with observations (see Zhang& Yan 2011, and references therein). Magnetic reconnectionand associated particle acceleration have been proposed as akey process in GRB models such as the ICMART model(Zhang & Yan 2011) and reconnection-switch model (McKin-ney & Uzdensky 2012). The efficient magnetic dissipation andparticle acceleration during reconnection may be important tounderstand the emission mechanism in GRBs (Kumar 1999;Spruit et al. 2001; Drenkhahn & Spruit 2002). Gruber et al.(2014) have shown a series of features in GRB promptemission that are not consistent with the simple synchrotronshock model. For example, the hard low-energy spectra, wherethe particle energy spectral index is close to p = 1 assumingsynchrotron radiation (Ghisellini et al. 2000; Preeceet al. 2002), and the thermal emission component predictedin the fireball–internal-shock model has rarely been seen inGRBs (Abdo et al. 2009; Zhang & Pe’er 2009).
From our simulation results and analytical model, theparticle energy spectral index is close to p = 1, consistentwith low-energy photon spectra observed in most GRBs (Bandet al. 1993; Preece et al. 2000; Gruber et al. 2014). Theacceleration in reconnection layers is much faster than theradiation cooling and can maintain the hard spectrum. UsingPIC simulation, Spitkovsky (2008) found that in the down-stream region of highly relativistic shocks the number ofparticles in the nonthermal tail is ∼1% of the entire downstreampopulation, and they carry 10% of the kinetic energy in thedownstream region. In our simulations of relativistic reconnec-tion, the number of nonthermal relativistic particles is ∼25% ofthe total number of particles in the simulation and they carry∼95% of the kinetic energy in the system, meaning relativisticreconnection is much more efficient in producing nonthermalrelativistic particles. This efficient conversion from magneticenergy into kinetic energy of nonthermal particles may helpsolve the efficiency problem in GRB models (Zhanget al. 2007; Deng et al. 2015).
5.4. Nonrelativistic Reconnection Sites
While the primary focus of this paper is relativistic magneticreconnection, the physics of Fermi acceleration and theformation of a power-law distribution is also applicable tothe nonrelativistic regimes previously discussed (Drakeet al. 2006, 2010, 2013). Based on our analytical model, thepower-law distribution forms only when at > 1inj . The resultsin this paper demonstrate that this condition is more easilyachieved in regimes with s 1, but it may also occur withs < 1 in sufficiently large reconnection layers. In severalpreliminary simulations, we have observed the formation of
similar power laws in nonrelativistic proton–electron plasmaand will report elsewhere.X-ray observations of solar flares have shown strong particle
acceleration and energy conversion during magnetic reconnec-tion, and the particle distribution often takes power-lawdistributions, requiring a particle acceleration mechanism thatis dominated by nonthermal acceleration (Kruckeret al. 2008, 2010; Krucker & Battaglia 2014). As we haveshown here, in magnetically dominated regimes, a largefraction of magnetic energy can be converted into particles ina power-law distribution. A similar process is likely to occur insolar flares, where the plasma β = 8πnkT/B2 ∼ 0.001–0.01(s < 1). However, physics such as the influence of m mi e,strong trapping in theX-line region, and particle escape fromthe system need to be investigated further (Egedal & Daughton2015, in preparation).
6. DISCUSSION AND CONCLUSION
The dissipation of magnetic field and particle energization inmagnetically dominated systems is of strong interest in high-energy astrophysics. In this study, we use 2D and 3D fullykinetic simulations that resolve the full range of plasma physicsto investigate the particle acceleration and plasma dynamicsduring collisionless magnetic reconnection in a pair plasmawith magnetization parameter σ varying from 0.25 to 1600. Aforce-free current layer, which does not require a hot plasmapopulation in the current layer, is implemented as the initialcondition.We find that the evolution of the current sheet and
acceleration of particles has two stages. In the early stage, anextended reconnection region forms and generates a parallelelectric field that accelerates particles in the current layer. Astime proceeds, the layer breaks into multiple plasmoids (fluxropes in 3D) due to the secondary tearing instability. Themotional electric field in the reconnection layer stronglyaccelerates energetic particles via a first-order relativistic Fermiprocess leading to the conversion of most of the free energy inthe system. A large fraction of the magnetic energy is quicklyconverted into the kinetic energy of nonthermal relativisticparticles (within a few light-crossing times) and the eventualenergy spectra show a power law gµ - -f ( 1) p, with thespectral index p decreasing with σ and system size andapproaching p = 1. The formation of the power-lawdistribution can be described by a simple model that includesboth inflow and the Fermi acceleration. This model alsoappears to explain recent PIC simulations (Melzaniet al. 2014b; Sironi & Spitkovsky 2014; Werner et al. 2014),which reported hard power-law distributions after subtractingthe initial hot plasma population inside the current layer. Forthe more realistic limit with both particle loss and injection, thespectral index at= +p 1 1 ( )esc , recovering the classicalFermi solution. If the escape is caused by convection out ofthe reconnection region t = L Vx xesc , the spectral index shouldapproach p = 1 when at 1esc in the high-σ regime. Inpreliminary 2D simulations using open boundary conditions,we have confirmed this trend and will report elsewhere. For thenonrelativistic limit, the reconnection needs to be sustainedover a longer time to form a power law.We have also shown that in sufficiently high-σ regimes the
magnetic reconnection rate is enhanced and relativistic inflowand outflow structures develop. The scaling follows theprediction based on the Lorentz contraction of plasma passing
14
The Astrophysical Journal, 806:167 (17pp), 2015 June 20 Guo et al.

through the diffusion region. Although 3D magnetic turbulenceis generated as a consequence of the growth of the secondarytearing instability and kink instability, the particle acceleration,energy release, and reconnection rate in the 3D simulation arecomparable to the corresponding 2D simulation.
Our study has demonstrated that relativistic magneticreconnection is a highly efficient energy-dissipation mechan-ism in the magnetically dominated regimes. The plasmadistribution in the reconnection layer features power-law
energy spectra, which may be important in understanding thenonthermal emissions from objects like pulsars, jets fromblack holes, and GRBs. Both the inflow and outflow speedsapproach the speed of light and have Lorentz factors of afew, which may explain the fast variability and highluminosity observed in those high-energy astrophysicalsystems. These findings on particle acceleration and plasmadynamics during relativistic reconnection substantiate theimportant role of magnetic reconnection in high-energyastrophysical systems.
We gratefully acknowledge useful discussions with andcomments from Andrey Beresnyak, Xuhui Chen, Wei Cui, WeiDeng, Brenda Dingus, Jim Drake, Joe Giacalone, DimitriosGiannios, Serguei Komissarov, Pawan Kumar, Xiaocan Li,Maxim Lyutikov, Rob Preece, Marc Swisdak, AlexanderTchekhovskoy, Dmitri Uzdensky, Yajie Yuan, Gary Zank,Bing Zhang, and Haocheng Zhang. This work is supported bythe DOE through the LDRD program at LANL and DOE/OFES support to LANL in collaboration with CMSO, and byNASA through the Heliospheric Theory Program. The researchis part of the Blue Waters sustained-petascale computingproject, which is supported by the NSF (Grant No. OCI 07-25070) and the state of Illinois. Additional simulations wereperformed at the National Center for Computational Sciences atORNL and with LANL institutional computing.
APPENDIXNUMERICAL CONVERGENCE
The accuracy of PIC kinetic simulations depends on a seriesof numerical parameters such as cell size, time step, and the
Table 2List of Simulation Runs Used to Test Numerical Convergence
Run kT0/mec2 Grid Numbers
TimeStep(Cr) NPC Eerr/Etotal Eerr/Ek0
A-1 0.36 4096 × 4096 0.9 2 10% 159%A-2 0.36 4096 × 4096 0.9 8 2.4% 38%A-3 0.36 4096 × 4096 0.9 32 0.56% 9%A-4 0.36 4096 × 4096 0.9 128 0.084% 1.3%A-5 0.36 2048 × 2048 0.9 8 5% 80%A-6 0.36 2048 × 2048 0.9 32 1.2% 20%A-7 0.36 2048 × 2048 0.9 128 0.3% 5%A-8 0.36 2048 × 2048 0.7 8 1.9% 30%A-9 0.36 2048 × 2048 0.7 32 0.45% 7%A-10 0.36 2048 × 2048 0.7 128 0.12% 1.9%A-11 0.36 2048 × 2048 0.7 512 0.04% 0.6%A-12 0.36 2048 × 2048 0.5 8 0.75% 12%A-13 0.36 2048 × 2048 0.5 32 0.19% 3%A-14 0.36 2048 × 2048 0.5 128 0.05% 0.8%B-1 0.09 4096 × 4096 0.9 2 9% 474%B-2 0.09 4096 × 4096 0.9 8 1.9% 100%B-3 0.09 4096 × 4096 0.9 32 0.42% 22%B-4 0.09 4096 × 4096 0.9 128 0.05% 2.6%B-5 0.09 2048 × 2048 0.9 8 4.2% 212%B-6 0.09 2048 × 2048 0.9 32 0.9% 45%B-7 0.09 2048 × 2048 0.9 128 0.24% 12%B-8 0.09 2048 × 2048 0.7 8 1.6% 80%B-9 0.09 2048 × 2048 0.7 32 0.37% 19%B-10 0.09 2048 × 2048 0.7 128 0.1% 5%B-11 0.09 2048 × 2048 0.5 8 0.6% 30%B-12 0.09 2048 × 2048 0.5 32 0.13% 7%B-13 0.09 2048 × 2048 0.5 128 0.04% 2%C-1 0.01 4096 × 4096 0.9 2 8.5% 3000%C-2 0.01 4096 × 4096 0.9 8 1.7% 595%C-3 0.01 4096 × 4096 0.9 32 0.36% 126%C-4 0.01 4096 × 4096 0.9 128 0.09% 32%C-5 0.01 4096 × 4096 0.9 512 0.03% 10%C-6 0.01 2048 × 2048 0.9 32 0.75% 265%C-7 0.01 2048 × 2048 0.9 128 0.19% 67%C-8 0.01 2048 × 2048 0.9 512 0.08% 29%C-9 0.01 2048 × 2048 0.7 32 0.28% 102%C-10 0.01 2048 × 2048 0.7 128 0.08% 28%C-11 0.01 2048 × 2048 0.7 512 0.044% 15%C-12 0.01 2048 × 2048 0.5 32 0.11% 39%C-13 0.01 2048 × 2048 0.5 128 0.035% 12%C-14 0.01 2048 × 2048 0.5 512 0.014% 5%
Note. All the runs are for σ = 25 and ´ = ´L L d d600 388x z i i and were
performed over a duration w =t 3000pe . Note kT m ce02 is the initial plasma
temperature normalized by rest energy m ce2. Time step is represented by the
dimensionless Courant number = D DC c t rr , where D = D D Dr x y zD D + D D + D Dx y y z x z( ). NPC represents the number of particle pairs percell. E Eerr total represents the ratio between change of total energy and theinitial total energy. E Ekerr 0 represents the ratio between change of total energyand the initial plasma kinetic energy.
Figure 13. Several cases for =kT m c0.01 e02 with grid number 4096 × 4096
and Cr = 0.9 but different numbers of particles per cell from 2 to 512.
15
The Astrophysical Journal, 806:167 (17pp), 2015 June 20 Guo et al.

number of macro-particles per cell (e.g., Birdsall & Lang-don 1991). The numerical convergence of simulation resultshas rarely been explicitly checked when modeling astrophysi-cal problems using PIC simulations, and often a small numberof macro-particles are used. Here we examine the numericalconvergence of our results on these numerical parameters usingVPIC code for different initial temperatures from =kT 0.010 to0.36 m ce
2. Our test case has σ = 25 with box size´ = ´L L d d600 388x z i i and simulation time w =t 3000pe .
We find that numerical heating can become unacceptably largewhen a small number of particles per cell is used. In Table 2 welist the key parameters for the test. Although for most cases theviolation in energy conservation is small (E Eerr tot within 1%),the numerical heating can significantly modify the particledistribution since the initial kinetic energy is a small fraction ofthe total energy. Therefore to obtain trustworthy results that arenumerically converged, the violation of energy conservationshould be much less than the initial kinetic energy
E E 1kerr 0 . Figure 12 shows several cases with=kT m c0.36 e0
2 with grid number 2048 × 2048, Courantnumber Cr = 0.7, and different numbers of particles per cellfrom 8 to 512. Figure 13shows several cases for
=kT m c0.01 e02 with grid number 4096 × 4096 and Cr = 0.9
but different numbers of particles per cell from 2 to 512. Bothfigures show that as the total energy change in the numericalsimulations becomes smaller than the initial kinetic energy
E E 1kerr 0 , the numerical heating has a negligible effect onthe distribution function.
REFERENCES
Abdo, A. A., Ackermann, M., Arimoto, M., et al. 2009, Sci, 323, 1688Abdo, A. A., Ackermann, M., Agudo, I., et al. 2010, ApJ, 716, 30Abdo, A. A., Ackermann, M., Ajello, M., et al. 2011, Sci, 331, 739Achterberg, A., Gallant, Y. A., Kirk, J. G., & Guthmann, A. W. 2001,
MNRAS, 328, 393Aharonian, F., Akhperjanian, A. G., Bazer-Bachi, A. R., et al. 2007, ApJL,
664, L71Aharonian, F., Akhperjanian, A. G., Bazer-Bachi, A. R., et al. 2006, Natur,
440, 1018Albert, J., Aliu, E., Anderhub, H., et al. 2007, ApJ, 669, 862Arons, J. 2012, SSRv, 173, 341Atoyan, A. M. 1999, A&A, 346, L49Band, D., Matteson, J., Ford, L., et al. 1993, ApJ, 413, 281Bessho, N., & Bhattacharjee, A. 2012, ApJ, 750, 129Bhattacharjee, A., Huang, Y.-M., Yang, H., & Rogers, B. 2009, PhPl, 16,
112102Birdsall, C. K., & Langdon, A. B. 1991, in Plasma Physics via Computer
Simulation (New York: Taylor & Francis)Birn, J., Drake, J. F., Shay, M. A., et al. 2001, JGR, 106, 3715Blackman, E. G., & Field, G. B. 1994, PhRvL, 72, 494Blandford, R., & Eichler, D. 1987, PhR, 154, 1Bowers, K. J., Albright, B. J., Yin, L., et al. 2009, JPhCS, 180, 012055Bühler, R., & Blandford, R. 2014, RPPh, 77, 066901Celotti, A., & Ghisellini, G. 2008, MNRAS, 385, 283Cerutti, B., Uzdensky, D. A., & Begelman, M. C. 2012, ApJ, 746, 148Cerutti, B., Werner, G. R., Uzdensky, D. A., & Begelman, M. C. 2013, ApJ,
770, 147Che, H., Drake, J. F., & Swisdak, M. 2011, Natur, 474, 184Chen, X., Chatterjee, R., Zhang, H., et al. 2014, MNRAS, 441, 2188Clausen-Brown, E., & Lyutikov, M. 2012, MNRAS, 426, 1374Comisso, L., & Asenjo, F. A. 2014, PhRvL, 113, 045001Coroniti, F. V. 1990, ApJ, 349, 538Dahlin, J. T., Drake, J. F., & Swisdak, M. 2014, PhPl, 21, 092304Daughton, W. 1999, PhPl, 6, 1329Daughton, W., & Karimabadi, H. 2007, PhPl, 14, 072303Daughton, W., Nakamura, T. K. M., Karimabadi, H., Roytershteyn, V., &
Loring, B. 2014, PhPl, 21, 052307
Daughton, W., Roytershteyn, V., Albright, B. J., et al. 2009, PhRvL, 103,065004
Daughton, W., Roytershteyn, V., Karimabadi, H., et al. 2011, NatPh, 7, 539Daughton, W., Scudder, J., & Karimabadi, H. 2006, PhPl, 13, 072101de Gouveia dal Pino, E. M., & Lazarian, A. 2005, A&A, 441, 845Deng, W., Li, H., Zhang, B., & Li, S. 2015, ApJ, 805, 163Drake, J. F., Opher, M., Swisdak, M., & Chamoun, J. N. 2010, ApJ, 709, 963Drake, J. F., Shay, M. A., Thongthai, W., & Swisdak, M. 2005, PhRvL, 94,
095001Drake, J. F., Swisdak, M., Che, H., & Shay, M. A. 2006, Natur, 443, 553Drake, J. F., Swisdak, M., & Fermo, R. 2013, ApJL, 763, L5Drenkhahn, G., & Spruit, H. C. 2002, A&A, 391, 1141Drury, L. O. 2012, MNRAS, 422, 2474Egedal, J., Daughton, W., Le, A., & Borg, A. L. 2015, arXiv:1504.08045Fu, X. R., Lu, Q. M., & Wang, S. 2006, PhPl, 13, 012309Galsgaard, K., Titov, V. S., & Neukirch, T. 2003, ApJ, 595, 506Ghisellini, G., Celotti, A., & Lazzati, D. 2000, MNRAS, 313, L1Giannios, D., Uzdensky, D. A., & Begelman, M. C. 2009, MNRAS, 395, L29Gruber, D., Goldstein, A., Weller von Ahlefeld, V., et al. 2014, ApJS, 211, 12Guo, F., Jokipii, J. R., & Kota, J. 2010, ApJ, 725, 128Guo, F., Li, H., Daughton, W., & Liu, Y.-H. 2014, PhRvL, 113, 155005Hayashida, M., Nalewajko, K., Madejski, G. M., et al. 2015, arXiv:1502.04699Hoshino, M. 2012, PhRvL, 108, 135003Huang, C., Lu, Q., & Wang, S. 2010, PhPl, 17, 072306Ji, H., & Daughton, W. 2011, PhPl, 18, 111207Kirk, J. G. 2004, PhRvL, 92, 181101Kirk, J. G., & Skjæraasen, O. 2003, ApJ, 591, 366Kowal, G., de Gouveia Dal Pino, E. M., & Lazarian, A. 2011, ApJ, 735, 102Kowal, G., de Gouveia Dal Pino, E. M., & Lazarian, A. 2012, PhRvL, 108,
241102Krennrich, F., Dwek, E., & Imran, A. 2008, ApJL, 689, L93Krucker, S., & Battaglia, M. 2014, ApJ, 780, 107Krucker, S., Hudson, H. S., Glesener, L., et al. 2010, ApJ, 714, 1108Krucker, S., Battaglia, M., Cargill, P. J., et al. 2008, A&ARv, 16, 155Kulsrud, R. M. 1998, PhPl, 5, 1599Kumar, P. 1999, ApJL, 523, L113Larrabee, D. A., Lovelace, R. V. E., & Romanova, M. M. 2003, ApJ, 586, 72Lazarian, A., & Opher, M. 2009, ApJ, 703, 8Litvinenko, Y. E. 1999, A&A, 349, 685Liu, W., Li, H., Yin, L., et al. 2011, PhPl, 18, 052105Liu, Y.-H., Daughton, W., Karimabadi, H., Li, H., & Peter Gary, S. 2014, PhPl,
21, 022113Liu, Y.-H., Daughton, W., Karimabadi, H., Li, H., & Roytershteyn, V. 2013,
PhRvL, 110, 265004Liu, Y.-H., Guo, F., Daughton, W., Li, H., & Hesse, M. 2015, PhRvL, 114, 095002Longair, M. S. 1994, in High Energy Astrophysics, Vol 2, Stars, the Galaxy
and the Interstellar Medium (Cambridge, UK: Cambridge Univ. Press)Loureiro, N. F., Schekochihin, A. A., & Cowley, S. C. 2007, PhPl, 14, 100703Lyubarsky, Y., & Kirk, J. G. 2001, ApJ, 547, 437Lyubarsky, Y. E. 2005, MNRAS, 358, 113Lyutikov, M., & Uzdensky, D. 2003, ApJ, 589, 893McKinney, J. C., & Uzdensky, D. A. 2012, MNRAS, 419, 573Melzani, M., Walder, R., Folini, D., Winisdoerffer, C., & Favre, J. M. 2014a,
A&A, 570, A111Melzani, M., Walder, R., Folini, D., Winisdoerffer, C., & Favre, J. M. 2014b,
A&A, 570, A112Mochol, I., & Pétri, J. 2015, MNRAS, 449, L51Oka, M., Phan, T.-D., Krucker, S., Fujimoto, M., & Shinohara, I. 2010, ApJ,
714, 915Porth, O., Komissarov, S. S., & Keppens, R. 2013, MNRAS, 431, L48Preece, R. D., Briggs, M. S., Giblin, T. W., et al. 2002, ApJ, 581, 1248Preece, R. D., Briggs, M. S., Mallozzi, R. S., et al. 2000, ApJS, 126, 19Priest, E., & Forbes, T. 2000, Magnetic Reconnection (Cambridge, UK:
Cambridge Univ. Press)Pritchett, P. L. 2006, JGRA, 111, 10212Romanova, M. M., & Lovelace, R. V. E. 1992, A&A, 262, 26Sironi, L., & Spitkovsky, A. 2014, ApJL, 783, L21Spitkovsky, A. 2008, ApJL, 682, L5Spruit, H. C., Daigne, F., & Drenkhahn, G. 2001, A&A, 369, 694Takamoto, M. 2013, ApJ, 775, 50Tavani, M., Bulgarelli, A., Vittorini, V., et al. 2011, Sci, 331, 736Thompson, C. 1994, MNRAS, 270, 480Titov, V. S., Galsgaard, K., & Neukirch, T. 2003, ApJ, 582, 1172Uzdensky, D. A., Loureiro, N. F., & Schekochihin, A. A. 2010, PhRvL, 105,
235002Uzdensky, D. A., & Spitkovsky, A. 2014, ApJ, 780, 3
16
The Astrophysical Journal, 806:167 (17pp), 2015 June 20 Guo et al.

Werner, G. R., Uzdensky, D. A., Cerutti, B., Nalewajko, K., &Begelman, M. C. 2014, arXiv:1409.8262
Yin, L., Daughton, W., Karimabadi, H., et al. 2008, PhRvL, 101, 125001Zank, G. P., Le Roux, J. A., Webb, G. M., Dosch, A., & Khabarov, O. 2014,
ApJ, 797, 28Zenitani, S., Hesse, M., & Klimas, A. 2009, ApJ, 696, 1385Zenitani, S., & Hoshino, M. 2001, ApJL, 562, L63Zenitani, S., & Hoshino, M. 2005, PhRvL, 95, 095001
Zenitani, S., & Hoshino, M. 2007, ApJ, 670, 702Zenitani, S., & Hoshino, M. 2008, ApJ, 677, 530Zhang, B., & Pe’er, A. 2009, ApJL, 700, L65Zhang, B., & Yan, H. 2011, ApJ, 726, 90Zhang, B., Liang, E., Page, K. L., et al. 2007, ApJ, 655, 989Zhang, H., Xuhui Chen, Markus Bottcher, Fan Guo, & Hui Li 2015, ApJ,
804, 58Zhang, J., Liang, E.-W., Sun, X.-N., et al. 2013, ApJL, 774, L5
17
The Astrophysical Journal, 806:167 (17pp), 2015 June 20 Guo et al.