participatory - p3dmfordrr.files.wordpress.com · ii asean regional centre for biodiversity...
TRANSCRIPT
Department of Environment
and Natural Resources
European Union Association of Southeast
Asian Nations
ASEAN Regional Centre for Biodiversity Conservation
A joint cooperation project between ASEAN and the European Union
PARTICIPATORY
3-DIMENSIONAL
MODELLING:
GUIDING PRINCIPLES
AND APPLICATIONS
BY GIACOMO RAMBALDI AND
JASMIN CALLOSA-TARR
JULY 2002

ASEAN Regional Centre for Biodiversity Conservationii
Participatory 3-Dimensional Modelling:
Guiding Principles and Applications
By Giacomo Rambaldi
and Jasmin Callosa-Tarr
Published by: ASEAN Regional Centre for Biodiversity Conservation (ARCBC)
Reproduction of this publication and the content of the Companion CD for
educational or other non-commercial purposes is authorized without any prior
written permission from the Publisher provided the source and the authors are
fully acknowledged.
Reproduction of this publication and the content of its Companion CD for sale
or other commercial purposes is prohibited without the written consent of the
Publisher.
Citation: Rambaldi, Giacomo and Callosa-Tarr, Jasmin. 2002. Participatory
3-Dimensional Modelling: Guiding Principles and Applications,
ASEAN Regional Centre for Biodiversity Conservation (ARCBC),
Los Baños, Philippines
ISBN: 971-8986-47-2
Editors: Mike Appleton, Sahlee Bugna and Bridget Botengan
Design: Nanie S. Gonzales
Pictures: Giacomo Rambaldi unless otherwise specified.
Printed by: WordShop Specialists Network, Inc. in the Philippines
Disclaimer: The views expressed are those of the authors and do not necessarily represent
any official view of the European Commission, the ASEAN Secretariat, the
Department of Environment and Natural Resources and the National
Biodiversity Reference Units.
The designation employed and the presentation of material in this publication
do not imply the expression of any opinion whatsoever on the part of the
Publisher and Authors concerning the legal status of any country or territory,
city or area or of its authorities, or concerning the delimitation of its frontiers or
boundaries.
Funding partners: European Commission
Department of Environment and Natural Resources
Available from: ASEAN Regional Centre for Biodiversity Conservation (ARCBC)
P.O. Box 35015
University of the Philippines Los Baños (UPLB)
Los Baños, Laguna 4031, Philippines
Note: This resource book has been published and is distributed together with
a Companion CD containing selected reference documents and an educational
movie on Participatory 3-D Modelling with the title “Giving Voice to the Unspoken”.
Web-based http://www.arcbc.org.ph
reference sites http://www.iapad.org
Participatory 3-Dimensional Modelling: Guiding Principles and Applications iii
The 2000-2005
ASEAN Environ-
mental Education
Action plan is a landmark
effort of ASEAN member-
countries towards achiev-
ing a more secure,
equitable and sustainable
development of the region
through education and public-private partner-
ships.
The Action Plan proposes strategies that trans-
late local and regional issues into environmental
education materials, and encourages greater
participation in undertaking environmental pro-
grams with governments.
This resource book describes in detail an
innovative community-based communication,
research and planning tool as it employs new
technologies to address environmental and social
concerns.
Spatial tools can help reinforce bottom-up
development and collective decision- making. Like
a universal language based on colour, shapes and
dimensions, Participatory 3-Dimensional Modelling
helps in bridging language, education and cultural
barriers, involving different stakeholders, particu-
larly the younger generations, through a collegial
learning process.
Congratulations to the ASEAN Regional Centre
for Biodiversity Conservation (ARCBC) for updating
the earlier version and for translating it into
Vietnamese, Bahasa and Thai.
This document represents a concrete contribu-
tion to the successful implementation of the ASEAN
Environmental Education Action Plan.
HEHERSON T. ALVAREZ
Secretary
Department of Environment and Natural Resources
Philippines
ASEAN Representative to ARCBC
The Sixth Environ-
ment Action
Programme of the
European Community
2001-2010 known as
“Environment 2010: Our
Future, Our Choice” has
four priority areas, namely
Climate Change, Nature
and Biodiversity, Environment and Health, and
Natural Resources and Waste.
The Programme calls for the active involvement
and accountability of all sectors of society in the
search for innovative, workable and sustainable
solutions to environmental problems and sets out
approaches, which emphasize the need for more
effective implementation and more innovative
solutions. The Commission recognizes that a wider
constituency must be addressed.
The Action Programme seeks new and innova-
tive instruments for meeting complex environmen-
tal challenges. Legislation is not abandoned, but its
more effective use is sought together with a more
participatory approach to policy-making.
Well-produced information generated through a
collaborative effort by scientists and members of
the community facilitates communication between
stakeholders and implementing agencies and has
great potential to support sound policy and deci-
sion-making processes. In this respect, Participa-
tory 3-D Modelling may play a substantial role in
institutionalizing “participation” in conservation
and development.
I would like to congratulate the ASEAN Regional
Centre for Biodiversity Conservation for disseminat-
ing the method in the region.
JAN DE KOK
Ambassador
Head of Delegation
Delegation of the European Commission
in the Philippines
FOREWORDS
ASEAN Regional Centre for Biodiversity Conservationiv
comprehensive regional context, by assisting in
setting up a network of institutional links among
ASEAN countries and between ASEAN and EU
partner organizations.
During a regional Training Needs Assessment
Workshop held in Bangkok in April 2001, Participa-
tory 3D Modelling (P3DM) was identified as a way
forward for enhancing collaborative protected area
management and facilitating conflict resolution.
Recommendations were made for its region-wide
adoption through the conduct of training exercises
and the updating and translation of this document in
a number of Southeast Asian languages.
Credits for the fine-tuning of the technique
and the preparation of the “Manual on Participa-
tory 3-D Modelling for Natural Resources Man-
agement” have to be ascribed to the National
Integrated Protected Areas Programme (NIPAP), a
special project (1995-2001) of the Philippine
Department of Environment and Natural Re-
sources (DENR), supported by financial and
technical assistance from the European Commis-
sion. The manual has been published in October
2000 as Volume 7 of the series known as “Essen-
tials of Protected Area Management in the
Philippines”.
This document has been elaborated and
tailored to a wider context. It builds on experi-
ences gained in the Philippines, Vietnam and
Thailand and contains new chapters including
insights on adult learning and spatial cognition
and the analysis of experiences gained in differ-
ent countries and contexts.
The enclosed companion CD provides access
to selected bibliographic references and contains a
21-minute movie with the title “Giving Voice to
the Unspoken”. The video illustrates the hands-on
aspects of 3-D modelling. It has been jointly
produced by the ASEAN Regional Centre for
Biodiversity Conservation (ARCBC), the Social
Forestry Conservation Project in Nghe An Province
- Vietnam, and the Environmental Broadcast Circle
(EBC) – Philippines, affiliated with the Interna-
tional Television Trust for the Environment
(TVE)..
PREFACE
The importance of integrated approaches to
participatory development and management
of natural resources has been emphasized in
many international fora on sustainable develop-
ment. In Rio de Janeiro, the 1992 United Nations
Conference on Environment and Development
(UNCED) devoted Chapter 10 of Agenda 21 to this
topic, and noted:
“Expanding human requirements and economic
activities are placing ever-increasing pressures on
land resources, creating competition and conflicts
and resulting in sub-optimal use of both land and
land resources. If, in the future, human require-
ments are to be met in a sustainable manner, it is
now essential to resolve these conflicts and move
towards more effective and efficient use of land and
its natural resources. Integrated physical and land
use planning and management are an eminently
practical way to achieve this. By examining all uses
of land in an integrated manner, it makes it pos-
sible to minimize conflicts, to make the most
efficient tradeoffs and to link social and economic
development with environmental protection and
enhancement, thus helping to achieve the objec-
tives of sustainable development. The essence of
the integrated approach finds expression in the
coordination of sectoral planning and management
activities concerned with the various aspects of
land use and land resources.”
Chapter 26 of Agenda 21 further addresses the
need for “Recognizing and Strengthening the Role
of Indigenous People and their Communities
through the provision of mechanisms providing
them with the know-how they need to manage their
environment and resources sustainably, applying
traditional and indigenous knowledge and ap-
proaches.”
This manual is intended as a small but signifi-
cant contribution to the desired directions.
The ASEAN Regional Centre for Biodiversity
Conservation (ARCBC) has been established jointly
by the Association of Southeast Asian Nations
(ASEAN) and the European Union (EU). The overall
objective of the Centre is to intensify biodiversity
conservation through improved co-operation in a
Participatory 3-Dimensional Modelling: Guiding Principles and Applications v
ACKNOWLEDGEMENTS
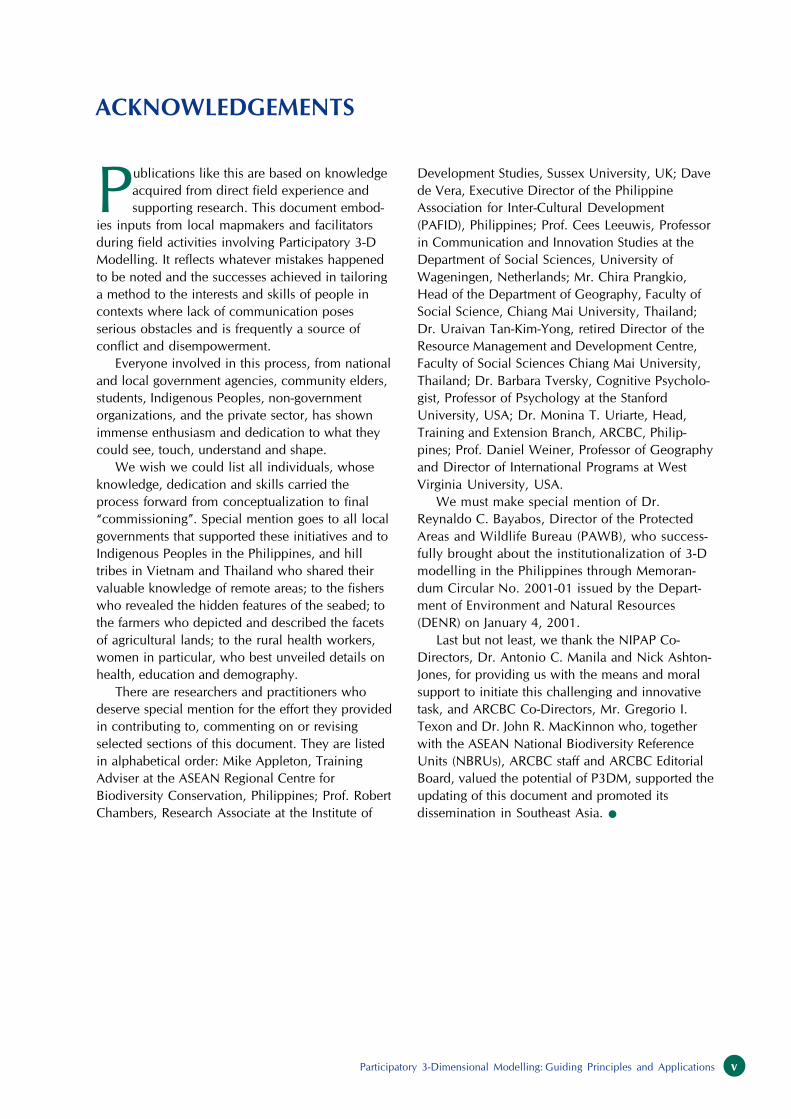
Publications like this are based on knowledge
acquired from direct field experience and
supporting research. This document embod-
ies inputs from local mapmakers and facilitators
during field activities involving Participatory 3-D
Modelling. It reflects whatever mistakes happened
to be noted and the successes achieved in tailoring
a method to the interests and skills of people in
contexts where lack of communication poses
serious obstacles and is frequently a source of
conflict and disempowerment.
Everyone involved in this process, from national
and local government agencies, community elders,
students, Indigenous Peoples, non-government
organizations, and the private sector, has shown
immense enthusiasm and dedication to what they
could see, touch, understand and shape.
We wish we could list all individuals, whose
knowledge, dedication and skills carried the
process forward from conceptualization to final
“commissioning”. Special mention goes to all local
governments that supported these initiatives and to
Indigenous Peoples in the Philippines, and hill
tribes in Vietnam and Thailand who shared their
valuable knowledge of remote areas; to the fishers
who revealed the hidden features of the seabed; to
the farmers who depicted and described the facets
of agricultural lands; to the rural health workers,
women in particular, who best unveiled details on
health, education and demography.
There are researchers and practitioners who
deserve special mention for the effort they provided
in contributing to, commenting on or revising
selected sections of this document. They are listed
in alphabetical order: Mike Appleton, Training
Adviser at the ASEAN Regional Centre for
Biodiversity Conservation, Philippines; Prof. Robert
Chambers, Research Associate at the Institute of
Development Studies, Sussex University, UK; Dave
de Vera, Executive Director of the Philippine
Association for Inter-Cultural Development
(PAFID), Philippines; Prof. Cees Leeuwis, Professor
in Communication and Innovation Studies at the
Department of Social Sciences, University of
Wageningen, Netherlands; Mr. Chira Prangkio,
Head of the Department of Geography, Faculty of
Social Science, Chiang Mai University, Thailand;
Dr. Uraivan Tan-Kim-Yong, retired Director of the
Resource Management and Development Centre,
Faculty of Social Sciences Chiang Mai University,
Thailand; Dr. Barbara Tversky, Cognitive Psycholo-
gist, Professor of Psychology at the Stanford
University, USA; Dr. Monina T. Uriarte, Head,
Training and Extension Branch, ARCBC, Philip-
pines; Prof. Daniel Weiner, Professor of Geography
and Director of International Programs at West
Virginia University, USA.
We must make special mention of Dr.
Reynaldo C. Bayabos, Director of the Protected
Areas and Wildlife Bureau (PAWB), who success-
fully brought about the institutionalization of 3-D
modelling in the Philippines through Memoran-
dum Circular No. 2001-01 issued by the Depart-
ment of Environment and Natural Resources
(DENR) on January 4, 2001.
Last but not least, we thank the NIPAP Co-
Directors, Dr. Antonio C. Manila and Nick Ashton-
Jones, for providing us with the means and moral
support to initiate this challenging and innovative
task, and ARCBC Co-Directors, Mr. Gregorio I.
Texon and Dr. John R. MacKinnon who, together
with the ASEAN National Biodiversity Reference
Units (NBRUs), ARCBC staff and ARCBC Editorial
Board, valued the potential of P3DM, supported the
updating of this document and promoted its
dissemination in Southeast Asia..

ASEAN Regional Centre for Biodiversity Conservationvi
TABLE OF CONTENTS
FOREWORDS ........................................................................................................................................................................................................ iii
PREFACE .................................................................................................................................................................................................................... iv
ACKNOWLEDGEMENTS .................................................................................................................................................................................. v
DEALING WITH SPATIAL INFORMATION AT THE COMMUNITY LEVEL ..................................................................... 1
Geographic Information Technologies ............................................................................................................................................ 1
Participatory 3-D Modelling: a Means, Not an End ................................................................................................................. 1
Spatial Learning and the Vertical Dimension ..............................................................................................................................2
Cross-cutting Functionalities of Participatory 3-D Modelling ............................................................................................ 3
Discovery Learning ............................................................................................................................................................................ 3
Visualizing Knowledge .................................................................................................................................................................... 4
Community Cohesion, Self-actualization and Self-determination .......................................................................... 5
Improving Communication ........................................................................................................................................................... 5
Bridging Isolation and Supporting Change and Innovation ........................................................................................ 6
Specific Applications of Participatory 3-D Modelling ............................................................................................................ 7
Supporting Traditional Knowledge Intellectual Property Rights .............................................................................. 7
Collaborative Planning .................................................................................................................................................................... 7
Collaborative Research ................................................................................................................................................................... 8
Exploring Water Bodies ......................................................................................................................................................... 8
Collaborative Protected Area Management .........................................................................................................................8
Participatory Monitoring and Evaluation ...............................................................................................................................9
Management of Conflicts Bound to the Territory and its Resources ................................................................. 10
Inherent Risks and Mitigating Measures ...................................................................................................................................... 11
SCALED RELIEF MODELS IN HISTORY ............................................................................................................................................... 12
Strategic Planning Instruments .......................................................................................................................................................... 12
From Warfare to Welfare ............................................................................................................................................................ 12
Adding “Participation” to 3-D Mapmaking ................................................................................................................................ 13
The Paradigm Shift .......................................................................................................................................................................... 13
Learning from Practice ........................................................................................................................................................................... 14
Thailand, the Frontrunner ........................................................................................................................................................... 14
Vietnam, a Recent Adopter ........................................................................................................................................................ 16
The Philippine Springboard ........................................................................................................................................................ 17
Cognitive Maps and People’s Rights in Natural Resources Management .............................................. 17
The Third Dimension in Conserving Biodiversity ................................................................................................ 18
Lessons Learned ......................................................................................................................................................................................... 19
PARTICIPATORY 3-D MODELLING, STEP BY STEP .................................................................................................................... 21
Phase One: Preparatory Work ........................................................................................................................................................... 22
Selecting the Area ............................................................................................................................................................................ 22
Understanding Social Dynamics ............................................................................................................................................. 23
Groundwork at Community Level .......................................................................................................................................... 23
Organizing the Logistics .............................................................................................................................................................. 23
Selecting Participants and Making Follow-up Arrangements ................................................................................. 23
Gathering Secondary Information .......................................................................................................................................... 23
The Base Map .................................................................................................................................................................................... 24
A Matter of Scale .................................................................................................................................................................... 24
Preparing a Customized Base Map ............................................................................................................................... 26
The Quick Reference Guide ...................................................................................................................................................... 26
Procuring Materials ........................................................................................................................................................................ 27
Map Symbols ............................................................................................................................................................................ 27
Construction Materials ........................................................................................................................................................ 28

Participatory 3-Dimensional Modelling: Guiding Principles and Applications vii
Phase Two: Assembling the Model ................................................................................................................................................ 29
Orienting Participants ................................................................................................................................................................... 29
Organizing Work ............................................................................................................................................................................. 29
The Base Table .................................................................................................................................................................................. 29
Assembling the Base Maps ........................................................................................................................................................ 29
Tracing, Cutting and Pasting ..................................................................................................................................................... 30
The “Blank” Relief Model ........................................................................................................................................................... 32
Phase Three: Depicting Information .............................................................................................................................................. 32
Composing People’s Knowledge ............................................................................................................................................. 32
Orienting Key Informants and Updating the Legend .......................................................................................... 32
Depicting Mental Maps ...................................................................................................................................................... 34
Adding Secondary Information ................................................................................................................................................ 34
Boundaries and Borders ...................................................................................................................................................... 34
Placing the Grid ...................................................................................................................................................................... 35
Transposing Data .................................................................................................................................................................... 36
Finishing Touches ............................................................................................................................................................................ 36
Phase Four: Handing Over of the Model .................................................................................................................................... 36
Phase Five: Extracting and Digitizing Data ................................................................................................................................ 37
Digital Photography and Onscreen Digitizing ................................................................................................................ 37
Transparent Plastic Sheets for Tablet Digitizing ............................................................................................................ 39
Phase Six: Data Elaboration and Manipulation ........................................................................................................................ 40
Phase Seven: Field Verification ......................................................................................................................................................... 40
FREQUENTLY ASKED QUESTIONS (FAQ) ......................................................................................................................................... 41
GLOSSARY ............................................................................................................................................................................................................. 43
APPENDICES ........................................................................................................................................................................................................ 44
REFERENCES .......................................................................................................................................................................................................... 70
LIST OF TABLES
Table 1 Advantages and disadvantages of small and large models ........................................................................... 22
Table 2 Choice of scale: some examples ................................................................................................................................. 25
Table 3 The choice of the contour interval determines the workload ..................................................................... 26
Table 4 Features and the means to code and display them ........................................................................................... 28
Table 5 Workgroups & facilitators ............................................................................................................................................... 29
Table 6 Cost breakdown – P3DM exercise, Pu Mat National Park, Nghe An, Vietnam.
70,000 ha at 1:10,000 scale - Year 2001 ................................................................................................................ 42
LIST OF FIGURES
Figure 1 The model: a focus for learning and negotiation .................................................................................................. 2
Figure 2 Assembling the cognitive patchwork ...........................................................................................................................3
Figure 3 Bird’s eye view of the Pamitinan Protected Landscape, Rizal, Philippines, 2000. ............................ 4
Figure 4 Information is made tangible ............................................................................................................................................ 4
Figure 5 Indigenous Peoples working on the 1:10,000-scale model of the Mt. Pulag National
Park, Benguet, Ifugao and Nueva Vizcaya, Philippines; 1999 ....................................................................... 5
Figure 6 El Nido-Taytay Managed Resource Protected Area, Philippines, 1999;
1:20,000-scale model and derived maps. ................................................................................................................. 5
Figure 7 Map of the Ancestral Domain of the Tagbanua Peoples, Coron Island, Philippines,
1998 (Source of information: 3-D Model) ................................................................................................................ 6
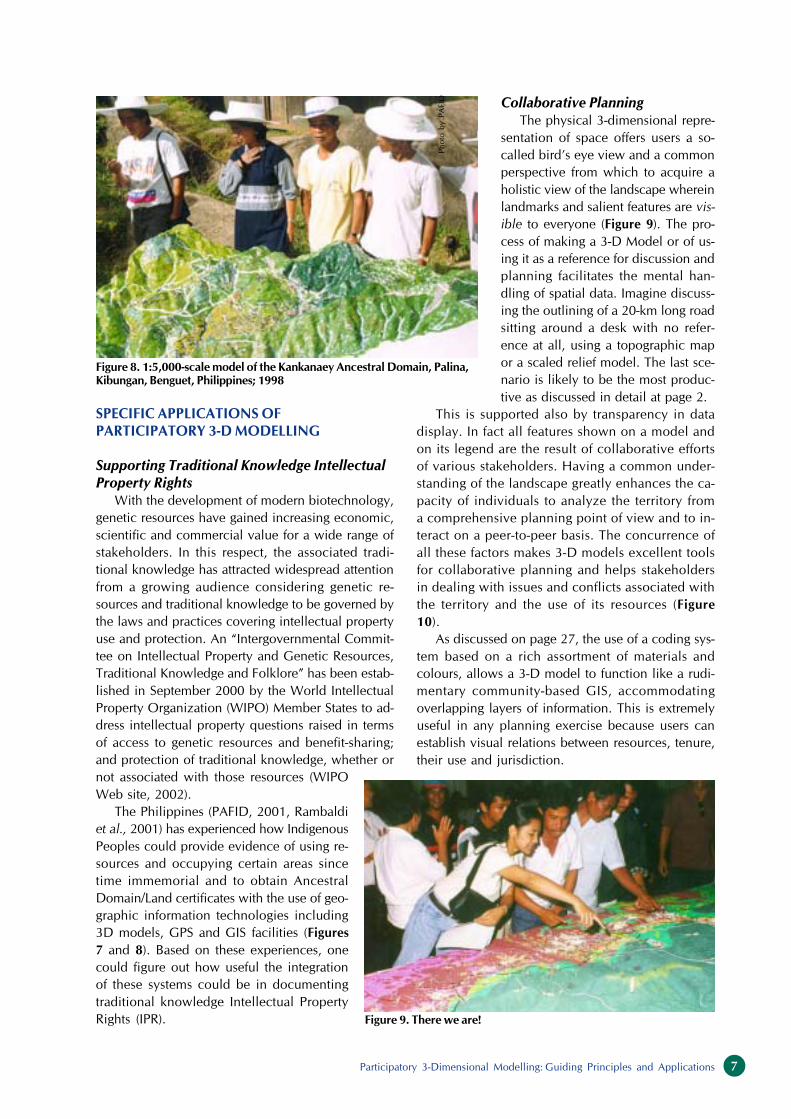
Figure 8 1:5,000-scale model of the Kankanaey Ancestral Domain, Palina, Kibungan,
Benguet, Philippines; 1998 ................................................................................................................................................ 7
Figure 9 There we are! ............................................................................................................................................................................. 7
Figure 10 Indigenous Peoples in Kalinga working on a 1:5,000-scale model, Philippines; 2001 .................. 8
Figure 11 Informants working on the model of the Pu Mat National Park, Nghe An, Vietnam; 2001 ........ 8
Figure 12 1:20,000-scale model of Malampaya Sound Protected Land and Seascape,
Palawan, Philippines; 2000 ............................................................................................................................................... 8

ASEAN Regional Centre for Biodiversity Conservationviii
Figure 13 1:10,000-horizontal and 1:7,500 vertical scale model of the South-western portion
of Pu Mat National Park, Nghe An, Vietnam; 2001 ............................................................................................ 9
Figure 14 The function of P3DM in a participatory M&E context ..................................................................................... 9
Figure 15 Elders warming up “Peace Pacts” in Balbalan Municipality, Kalinga, Cordillera
Administrative Region, Philippines, 2000 ............................................................................................................. 10
Figure 16 Three century-old scaled relief model of the city of Perpignan, France
(year of manufacturing: 1686) ....................................................................................................................................... 12
Figure 17 The Sun King and his advisors consulting 1:600 scale relief models in the
“Galerie du Bord de l’Eau” at the Louvre in Paris; miniature by Nicolas van
Blarenberghe [French, 1716-1794] decorating a tobacco box .................................................................... 13
Figure 18 Village model, Upper Nan Watershed, Pa Nam Yao Lae Pa Nam Suad National
Forest Reserve, Thailand, 1993 .................................................................................................................................... 15
Figure 19 Relief model made in the framework of the Social Forestry Development Project in Na
Nga village, Chieng Hac Commune, Yen Chau district, Son La Province, Vietnam; 1999 ....... 16
Figure 20 Scale model of the Malaylay-Bucayao Watershed in Sangilen and Maltanday,
Baco, Philippines, 1993. Vegetation cover and land use were depicted with the use
of clay, coloured yarns and other natural materials ......................................................................................... 17
Figure 21 Information is transferred from the sketch to the topo map ........................................................................ 19
Figure 22 Fisherman presenting the results of two-stage resource mapping ............................................................ 19
Figure 23 3-D Modelling and its integration with GIS ......................................................................................................... 21
Figure 24 1:10,000-scale (reference) ............................................................................................................................................... 24
Figure 25 The Range of coding Items .............................................................................................................................................. 27
Figure 26 Prepare visual aids to support your presentation ............................................................................................... 29
Figure 27 Details of the base table ................................................................................................................................................... 29
Figure 28 Mapmakers at work ............................................................................................................................................................. 29
Figure 29 The carbon paper is assembled .................................................................................................................................... 30
Figure 30 Drilling landmarks ............................................................................................................................................................... 30
Figure 31 Table with reference nails ............................................................................................................................................... 30
Figure 32 Tracing sandwich ................................................................................................................................................................. 30
Figure 33 Each contour line is traced on a separate carton board ................................................................................. 30
Figure 34 Contour layers are cut ....................................................................................................................................................... 31
Figure 35 Geo-referenced nails are used to properly locate the layers ....................................................................... 31
Figure 36 The single layer is pasted ................................................................................................................................................. 31
Figure 37 Layers are consolidated ..................................................................................................................................................... 31
Figure 38 Different elevation contour are traces sequentially .......................................................................................... 32
Figure 39 A complete hill is joined to the model .................................................................................................................... 32
Figure 40 Alternative geo-referencing method ........................................................................................................................... 32
Figure 41 The “blank” .............................................................................................................................................................................. 32
Figure 42 The legend is updated ........................................................................................................................................................ 33
Figure 43 Coding means are displayed .......................................................................................................................................... 33
Figure 44 Landmarks are identified .................................................................................................................................................. 33
Figure 45 Land uses and land cover are identified .................................................................................................................. 33
Figure 46 Water-based colours are applied after validation .............................................................................................. 34
Figure 47 Point data are located with the use of colour-coded pins ............................................................................. 34
Figure 48 Group dynamics are enhanced ..................................................................................................................................... 34
Figure 49 Boundary negotiation in the Cordillera, Philippines, 2001 ......................................................................... 35
Figure 50 The grid is placed with the use of letter/figures coordinates ...................................................................... 35
Figure 51 Path for marking intervals ............................................................................................................................................... 35
Figure 52 The grid is intertwined ...................................................................................................................................................... 35
Figure 53 Model with 10-cm grid ..................................................................................................................................................... 36
Figure 54 Coordinates are identified on the base map ......................................................................................................... 36
Figure 55 Coordinates are replicated on the relief model .................................................................................................. 36
Figure 56 Model with visible protected area boundary ........................................................................................................ 36
Figure 57 Embedded elements of the map key .......................................................................................................................... 36

Participatory 3-Dimensional Modelling: Guiding Principles and Applications ix
Figure 58 “Aerial photography” .......................................................................................................................................................... 38
Figure 59 Sequential shots are taken ............................................................................................................................................... 38
Figure 60 On-screen digitizing sequence ..................................................................................................................................... 38
Figure 61 Matching grids ....................................................................................................................................................................... 39
Figure 62 Tracing the coastline .......................................................................................................................................................... 39
Figure 63 Looking straight ..................................................................................................................................................................... 40
Figure 64 Data are digitized ................................................................................................................................................................. 40
Figure 65 Colour preparation .............................................................................................................................................................. 45
Figure 66 Sample of contour map ..................................................................................................................................................... 46
Figure 67 Example of base map for 3-D modelling ................................................................................................................ 48
LIST OF APPENDICES
Appendix 1 DENR Memorandum Circular No. 1 Series 2001 ............................................................................................. 44
Appendix 2 Colour Preparation .............................................................................................................................................................. 45
Appendix 3 Reading Maps ......................................................................................................................................................................... 46
Appendix 4 Stakeholder Analysis ........................................................................................................................................................... 47
Appendix 5 How to Prepare a Base Map for 3D Modelling .................................................................................................. 48
Appendix 6 Referencing, measurement and scaling tools ....................................................................................................... 49
Appendix 7 Supply list for the manufacture of the relief model of Pu Mat National Park, Nghe An,
Vietnam. Area coverage 700 km2
; scale 1:10,000; year 2001; Model size: two units
each measuring 1.4 m x 2.5 m. ................................................................................................................................... 49
Appendix 8 Examples of Map Symbols used on Participatory 3-D Models .................................................................. 51
Appendix 9 What 3-D Mapmakers Should Know About Corrugated Carton Board ................................................. 53
Appendix 10 Legend, Directional Arrow and Acknowledgement Plate (3-D model) ................................................. 55
Appendix 11 Land Use and Cover. Mt. Pulag National Park and Environs. Provinces of Benguet,
Ifugao and Nueva Vizcaya, Philippines (Source: P3DM, 1999). ............................................................... 56
Appendix 12 Land Use and Cover. Mt. Pulag National Park and Environs. Provinces of Benguet,
Ifugao and Nueva Vizcaya, Philippines (Source JAFTA-NAMRIA; LandSat TM, 1992). .............. 57
Appendix 13 Land Use and Cover. Mt. Malindang Natural Park and Environs. Provinces of
Misamis Occidental, Zamboanga del Norte and Zamboanga del Sur, Philippines
(Source: P3DM, 1999). ..................................................................................................................................................... 58
Appendix 14 Land Use and Cover. Mt. Malindang Natural Park and Environs. Provinces
of Misamis Occidental, Zamboanga del Norte and Zamboanga del Sur, Philippines
(Source: DENR, undated) ................................................................................................................................................. 59
Appendix 15 Land Use and Cover. Mt. Isarog National Park and Environs. Province of Camarines
Sur, Philippines (Source: P3DM, 1999) ................................................................................................................... 60
Appendix 16 Land Use and Cover. Mt. Isarog National Park and Environs. Province of Camarines
Sur, Philippines (Source: Bureau of Soils and Water Management, date: unknown) .................... 61
Appendix 17 Population Distribution Map. Mt. Pulag National Park and Environs. Provinces
of Benguet, Ifugao and Nueva Vizcaya, Philippines (Source: P3DM, 1999). .................................... 62
Appendix 18 Population Distribution Map. Mt. Malindang Natural Park and Environs. Provinces
of Misamis Occidental, Zamboanga del Norte and Zamboanga del Sur, Philippines
(Source: P3DM, 1999). ..................................................................................................................................................... 63
Appendix 19 Population Distribution Map. Mt. Isarog National Park and Environs. Camarines Sur,
Philippines (Source: P3DM, 1999). ........................................................................................................................... 64
Appendix 20 Social Infrastructure Distribution Map. Mt. Pulag National Park and Environs.
Provinces of Benguet, Ifugao and Nueva Vizcaya, Philippines (Source: P3DM, 1999). ............. 65
Appendix 21 Social Infrastructure Distribution Map. Mt. Malindang Natural Park and Environs.
Provinces of Misamis Occidental, Zamboanga del Norte and Zamboanga del Sur,
Philippines (Source: P3DM, 1999). ........................................................................................................................... 66
Appendix 22 Social Infrastructure Distribution Map. Mt. Isarog National Park and Environs.
Camarines Sur, Philippines (Source: P3DM, 1999). ........................................................................................ 67
Appendix 23 Discussion of discrepancies encountered in comparing collective people’s
knowledge with interpreted satellite imagery and other secondary information ............................ 68

ASEAN Regional Centre for Biodiversity Conservationx
3-D Three-dimensional
ARCBC ASEAN Regional Centre for Biodiversity Conservation
ASEAN Association of Southeast Asian Nations
CADC Certificate of Ancestral Domain Claim
CALC Certificate of Ancestral Land Claim
CADT Certificate of Ancestral Domain Title
CiGIS Community-integrated Geographic Information Systems
CMU Chiang Mai University
CNRM Collaborative Natural Resources Management
DANIDA Danish Agency for Development Assistance
DENR Department of Environment and Natural Resources
EC European Commission
ENTMRPA El Nido-Taytay Managed Resource Protected Area
GIS Geographic Information System(s)
GIT Geographic Information Technologies
GPS Global Positioning System(s)
ICRAF International Centre for Research in Agroforestry
INRCP Integrated Natural Resources Conservation Project
IPR Intellectual Property Rights
IPRA Indigenous Peoples Rights Act
LGU Local Government Unit
MIGIS Mobile, Interactive Geographic Information System
MMNP Mount Malindang Natural Park
MPNP Mount Pulag National Park
NAMRIA National Mapping and Resource Information Authority
NBRU National Biodiversity Reference Unit
NCIP National Commission on Indigenous Peoples
NEA National Environment Agency (Vietnam)
NGO Non-Government Organization
NIPAP National Integrated Protected Areas Programme
NIPAS National Integrated Protected Areas System
NTFP Non-Timber Forest Products
P3DM Participatory 3-Dimensional Modelling
PA Protected Area
PAMB Protected Area Management Board
PAWB Protected Areas and Wildlife Bureau
PLA Participatory Learning and Action
PLUP Participatory Land Use Planning
P-GIS Participatory Geographic Information System
PPGIS Public Participation Geographic Information System
RFD Royal Forest Department
SFDP Social Forestry Development Project
SFNC Social Forestry and Nature Conservation Project
SM-HDP Sam-Mun Highland Development Project
TG-HDP Thai-German Highland Development Programme
TUSFP Thailand Upland Social Forestry Project
TVE Television Environment Trust
VNPPA Vietnam National Parks and Protected Areas Association
WIPO World Intellectual Property Organization
ABBREVIATIONS

Participatory 3-Dimensional Modelling: Guiding Principles and Applications 1
DEALING WITH SPATIAL
INFORMATION
AT COMMUNITY LEVEL
“R
GEOGRAPHIC INFORMATION
TECHNOLOGIES
apid growth of Geographic Information
Technologies (GIT) is transforming how
earth and environment are visualized,
represented and understood. As a result, GIT appli-
cations can alter how people view, exploit and man-
age the physical resource base. Geographic Informa-
tion Systems (GIS) produce representations of nature
that privilege conventional forms of scientific spa-
tial information, including data on the local environ-
ment. As a result, the politics of landscape and the
social production of nature are frequently ignored
and valuable local knowledge marginalized” (Weiner
et al., 1999:18).
In recent years there has been a strong drive to-
wards integrating GIS into community-centred initia-
tives particularly to deal with spatial information- gath-
ering and decision-
making. Researchers
around the world
have been working on
different approaches
known under a variety of abbreviations including,
among others, PPGIS, P-GIS, CiGIS and MIGIS.
All share the assumption that the system would
place ordinary people in the position to generate and
analyse geo-referenced spatial data, integrate multiple
realities and diverse forms of information. This
would in turn enable broader public participation in
environmental and public policy decision-making.
Nonetheless, it has become apparent that, due to
its heavy technological component, the community
use of GIS cannot be divorced from the resource is-
sues necessary to undertake and maintain it. There-
fore, lacking external support, GIS would be outside
the capacity of most marginalised or less-favoured
communities (Weiner et al. 2001; Carver, 2001; Ab-
bot et al., 1998; Dunn et al., 1997)
At the onset of the PPGIS concept, Poiker (1995)
expressed the concern that the nature of and access
to GIS would simultaneously marginalize or em-
power different groups in society having opposing
interests. Abbot et al. (1998) raised the issue on
whether participation and GIS would even be a con-
tradiction in terms.
Within a multi-faceted debate on the role of GIS
in society, PPGIS evolved along different lines and
among diverse interest groups. Currently, the con-
cept embraces a number of applications ranging
“from internet-dependent spatial multimedia used in
metropolitan areas, to field-based participatory re-
search methods with a modest GIS component”
(Weiner et al., 2001:10).
Participatory 3-Dimensional Modelling (P3DM)
has been conceived as a method for bringing GIS
potentials closer to rural communities and for bridg-
ing the gap existing between geographic information
technologies and capacities found among
marginalised, isolated, and frequently natural re-
source-dependent communities. P3DM as such fits
best into what is considered as Community-inte-
grated GIS (CiGIS) as defined by Weiner and Harris
(1999).
This resource book is intended to assist research-
ers, Participatory Learning and Action (PLA) and GIS
practitioners in bringing the power of GIS to the
grassroots level through the use of P3DM.
PARTICIPATORY 3-D MODELLING:
A MEANS, NOT AN END
Participatory 3-D Modelling integrates people’s
knowledge and spatial information (contour lines) to
Community-integrated GIS (CiGIS):• is likely to be agency-driven, but it is not top-down nor
privileged toward traditional scientific knowledge;
• addresses questions that participant communities feelare important;
• assumes that local knowledge is valuable and expert;
• broadens the access base to digital spatial informationtechnology and data;
• incorporates communities in the production of GIS;
• assumes socially differentiated multiple realities oflandscape;
• integrates GIS and multi-media;
• assumes the potential for more democratic spatialdecision-making through greater community participa-tion;
• assumes that spatial decision-making is conflict-ridden,embedded in local politics, and is issue-driven.
Quoted from Weiner D. and Harris T, 1999:8. Community-Integrated GIS for Land Reform in South Africa. ResearchPaper 9907, West Virginia University.
PPGIS: Public Participation GISCiGIS: Community-integrated GISP-GIS: Participatory GISMIGIS: Mobile, Interactive GIS

ASEAN Regional Centre for Biodiversity Conservation2
Figure 1. The model: a focus for learning and negotiation
produce stand-alone scale relief models
(Figure 1) that have proved to be user-
friendly and relatively accurate data stor-
age and analysis devices and at the same
time excellent communication media. Re-
lief models may also contain additional
geo-referenced information obtained from
field surveys, Global Positioning Systems
(GPS) readings and secondary sources. The
latter generally applies to virtual features
like administrative boundaries, watershed
classifications based on scientifically de-
fined parameters, and others.
P3DM is a relatively new communi-
cative facilitation method used in inno-
vation processes related mainly to re-
source use and tenure. The method has
been conceived to support collaborative initiatives
aimed at increasing public participation in prob-
lem analysis and decision-making. The process
within which P3DM is used may unfold at differ-
ent levels involving a variety of stakeholders and
diverse strategies.
The method is generally used within projects or
initiatives designed to address issues bound to the
territory. The process leading to the construction of
the models requires local and external inputs and
skilled support. Once the models are done, their
maintenance and use rest normally within local ca-
pacities. Considering that P3DM is a technology,
which is fundamentally proposed to specific inter-
est groups to address a particular problem, the pro-
ponents should thus have a thorough understanding
of the environmental and socio-economic setting of
the area; they should also have the ability to sup-
port the participating communities in implementing
strategies, plans and actions, and in addressing new
realities, which may emerge from the conduct of
P3DM activities.
In a practical context, the intervention phase
wherein a 3-D model is manufactured, leads partici-
pants through a collective learning process to the vi-
sualization of their economic and cultural domains
in the form of a scaled and geo-referenced relief
model, which can be used subsequently for differ-
ent purposes as discussed on pages 3 to 11.
One major constraint of 3-D models is their lim-
ited mobility as elaborated on page 6. Their use is
therefore confined to those convening around them.
To upscale their utilisation, P3DM should be inte-
grated with GPS and GIS to make their content por-
table and shareable. This allows adding precisely
geo-referenced data, conducting additional analysis
and producing cartographic outputs. The synergies
resulting from the combinations of the three systems
add veracity and authority to community knowledge,
paving the way for more balanced power-sharing in
collaborative processes leading to change and inno-
vation.
SPATIAL LEARNING AND THE
VERTICAL DIMENSION
“Human cognition includes sensation and percep-
tion, thinking, imagery, reasoning and problem solv-
ing, memory, learning and language. Location, size,
distance, direction, shape, pattern, movement and
inter-object relations are part of the spatial world as
we know and conceive it” (Montello, 1997).
Cognitive maps are internal representations of the
world and its spatial properties stored in memory.
Frequently referred to as mental maps, they allow
us to know ‘what is out there, what its attributes are,
where it is and how to get there’. Cognitive maps
are distinctive to individuals. They are not inclusive
like cartographic maps with a constant scale, but
consist of discrete, hierarchically organized pieces
determined by physical, perceptual or conceptual
boundaries (Montello, 1997).
Spatial knowledge develops in humans through
three progressive stages: landmark, route and survey
knowledge. The first refers to the capacity of memo-
rizing places in relation to an event, and the second,
to developing the sense of ordered sequences of land-
marks. The last and more progressed stage (Figure
2) is where the knowledge simultaneously embraces
more locations, their interrelations and allows for de-
touring, shortcutting and creative navigation
(Montello, 1997).
This is the learning itinerary undertaken by infor-
mants confronted with a blank relief model. At first,
they would look for landmarks to establish their

Participatory 3-Dimensional Modelling: Guiding Principles and Applications 3
Figure 2. Assembling the cognitive patchwork
“The usefulness of a visual representation of the land-scape [e.g. map, 3-D models, illustrations, paintings, etc.]originates from the interaction of its physical format withthe way humans process information in their mind.
Whereas the information humans can mentally process islimited, both in number of items (memory) and in numberof operations (processing), external visual representa-tions are virtually unlimited. Whereas mental informationprocessing is fleeting, external representations arepermanent. Whereas human information processing is aprivate, internal event, external representations are public,transportable, and shareable. External representationsenlarge human memory and enhance processing byoffloading those burdens from the mind to inspectible,rearrangeable space. People are limited in the amount ofinformation and mental operations that they can keep trackof, but people are excellent at pattern recognition.
Turning internal information and operations into externalpatterns augments the powers of mind.” (adapted fromTversky and Lee, 1999:1)
tial knowledge in the context of participa-
tory action research.
The difference between a blank contour
map and the corresponding relief model is
the physical vertical dimension that pro-
vides essential cues for stimulating
memory and for establishing spatial asso-
ciations.
Among the different visualising meth-
ods1
used to spatially reproduce people’s
knowledge, Participatory 3-D Modelling
(P3DM) is the one which - by adding the
vertical dimension and using simple com-
munication means like colours, shapes and
dimensions - offers substantial advantages
for depicting cognitive maps.
CROSS-CUTTING FUNCTIONALITIES OF
PARTICIPATORY 3-D MODELLING
Experience gained over a period of 15 years in
Southeast Asia has shown that 3-D models used in-
dependently or integrated with GIS and GPS and
made part of a wider process contribute to a num-
ber of basic functionalities in terms of human de-
velopment and interaction.
Discovery Learning
For the past century, relief models have played
an important role in displaying geographic informa-
tion for educational purposes. Starting in 1987, 3-D
models have been used in an interactive mode as in-
struments through which people could learn by do-
ing. Considering the fact that the act of learning
causes a relatively permanent change in cognition or
behaviour (Montello, 1997), the process of manufac-
turing a relief model represents an important indi-
vidual and collective learning experience. By provid-
ing a “bird’s eye view”, a relief model widens the
participants’ evaluative frame of reference on spa-
tially defined issues like watersheds, linked ecosys-
tems, resource tenure and access, and others, thus
stimulating active learning and analysis. In other
words, it helps the individual to understand the eco-
logical and social dynamics that go beyond his cog-
nitive boundaries.
This method is tailored for areas where poverty,
isolation, marginalization, low literacy and language
barriers frequently shape society. The tendency for
most people residing in these areas is to learn via
concrete sensorial experiences, rather than abstract
concepts. In this respect, practice has shown that vil-
lagers – when properly oriented – could manage the
physical location vis-à-vis the model. In a few min-
utes, they could locate themselves and/or their house-
holds, and establish spatial relationships between
different landmarks. Once this is done, informants
could link the model to the real world and would
now be in the position to precisely depict their men-
tal landscape.
Practitioners using physical 3-D models at the com-
munity level have experienced that when informants
are provided with a blank relief model instead of a
blank contour map or a blank sheet of paper, they can
easily depict their spatial knowledge in a scaled, geo-
referenced manner and add a lot of precise details.
The fact that 3-D models augment the power of
mind (see Box) and facilitate scaling, allows for fill-
ing in information more fully and accurately on a
given area.
Generally this is not the case with sketch map-
ping, which has been widely used to represent spa-
1
e.g. sketch mapping, transect diagramming, participatory aerial photo-
interpretation, relief modelling, mapping, etc.

ASEAN Regional Centre for Biodiversity Conservation4
P3DM process with ease and great enthusiasm, walk-
ing through the various stages of learning. In fact,
the physical nature of the method enhances discov-
ery learning through verbal, visual and tactile expe-
riences, stimulates confrontational feedback, pro-
motes debate and negotiation and generates shared
information in visible and tangible (Figures 3 and 4)
formats.
Thanks to the use of differentiated coding means,
3-D models, like a GIS, accommodate overlapping
information layers, and thus facilitate community-
based analysis and decision-making.
Being important repositories of local knowledge,
relief models are frequently used as displays of the
local landscape and as educational instruments for
teaching local geography and for
enhancing people’s interest in
conserving and restoring natural
resources.
Visualizing Knowledge
“Knowledge can be considered
as the sum of interconnected rules
of interpretation through which
we understand, give meaning,
perceive or interpret the world
around us” (Leeuwis, 2001). Knowledge is what we
store in our mind and what leads us to take deci-
sions, act and react to stimuli received from the ex-
ternal world. Knowledge is very subjective and builds
up in everybody’s mind through a continuous learn-
ing process involving, among others, concrete expe-
riences, observations and reflections, formation of
concepts and their testing.
At one end of the spectrum we find what is con-
sidered as our “unconscious knowledge”, which is
characterized by perceptions and motives that we are
not aware of and which is “sealed off” by psychologi-
cal conditioning. This means that we have to over-
come emotional barriers in order to gain access to it.
Our unconscious fades into what is frequently
referred to as tacit knowledge, which corresponds
to knowledge that we are not immediately aware of
(see Box), on which we base our day-to-day actions,
but which is somehow difficult to articulate. This
type of knowledge can be elicited through in-depth
discussions and interactive exercises (e.g. PRA/PLA
tools) including visualizing methods like P3DM. The
third category is known as explicit. This is knowl-
edge that we are aware of, have reflected upon and
can easily capture in verbal, textual, physical or vi-
sual formats (Leeuwis, 2001), and that transforms
into information.
It is important to appreciate these differentiations
because this book revolves around
a method that facilitates the visu-
alization of mainly tacit (spatial)
knowledge, and increases through
an intensive learning process the
amount of knowledge we are fully
aware of. This enhances our ca-
pacities to analyse, communicate
and interact on specific issues,
which got “much clearer in our
mind”
As discussed in detail on pages 2 and 3, cogni-
tive maps (also known as mental maps) are internal
representations of the world and its spatial proper-
ties stored in memory. They frequently represent por-
tions of our tacit and explicit knowledge and are vi-
sualized with the use of sketch maps, transect dia-
grams, scale maps, drawings and physical or virtual
3-dimensional models.
Compared to technology-dependent Geographic
Information Technologies, Participatory 3-D Model-
ling is a proven method that can be handled in ru-
ral areas within locally available technical capaci-
ties, and can visualize spatial knowledge particularly
Figure 3. Bird’s eye view on the Pamitinan Protected
Landscape, Rizal, Philippines, 2000.
Figure 4. Information is made tangible
Concluding remarks of an Elder after theconduct of a series of PLA exercises:
“At the beginning we thought we wereplaying. Later on we realised that we were
analysing our lives. We knew that weknew, but we were not aware of how
much we knew and how important ourknowledge is to us”.
Captain George, 1997, BarangayTawangan, Kabayan, Philippines
Participatory 3-Dimensional Modelling: Guiding Principles and Applications 5
among communities characterised by low literacy,
language barriers and lack of basic utilities (e.g. elec-
tric power) (Tan-Kim-Yong, 1992 and 1994; Rambaldi
et al. 2000; Hoare et al., 2002). Different from other
visualizing tools (i.e. sketch mapping) characterised
by variable levels of accuracy, 3-D modelling offers
the opportunity to produce relatively precise geo-ref-
erenced and scaled qualitative and quantitative data,
adding substantial value and communication power
to existing local knowledge.
Community Cohesion, Self-actualization and
Self-determination
Experience gained in the Philippines over almost
a decade has shown that 3-D modelling exercises con-
ducted entirely at the community level and as a re-
sponse to local needs versus external threats have
yielded positive effects in terms of community-cohe-
sion and identity building (PAFID, 2001) (Figure 5).
The power of maps resulting from the integration
of community mapping, 3-D modelling (Figure 6 and
Figure 7), GPS and GIS, combined with strong advo-
cacy and an existing legal framework accommodat-
ing the results of such actions, has led the way to-
wards legal recognition of ancestral rights claimed by
Indigenous Peoples as discussed on page 17 and 18.
Manufacturing a relief model has positive effects
in stimulating community cohesion because it gath-
ers people to share information and concerns and fre-
quently reinforces community self-actualisation
through the revival of local knowledge. Old people
share history with young people, passing on legends
and religious beliefs, sacred rites and places so es-
sential to conserving tradition (Alcorn, 2000:1-2).
A well-displayed 3-D model is appealing, fuels
community esteem and sense of intellectual owner-
ship, and becomes part of the local cultural land-
scape. Villagers frequently use these models to in-
troduce visitors to the area. This simple act signi-
fies peer-to-peer information sharing and calls for si-
lent acknowledgment of the existence of local knowl-
edge: “We are on the map. We do exist! We know
where we are, and what surrounds us!”
Improving Communication
Relief models provide local stakeholders with a
powerful medium for easing communication and
overcoming language barriers.
In providing open access to information, 3-D mod-
els add transparency and create common grounds for
discussion. They limit
the distortion2
of mes-
sages between com-
municating parties, by
offering a shared lan-
guage of colours,
shapes and dimen-
sions, and broaden in-
dividual perspectives. In doing this, 3-dimensional
models bridge language barriers and ease communi-
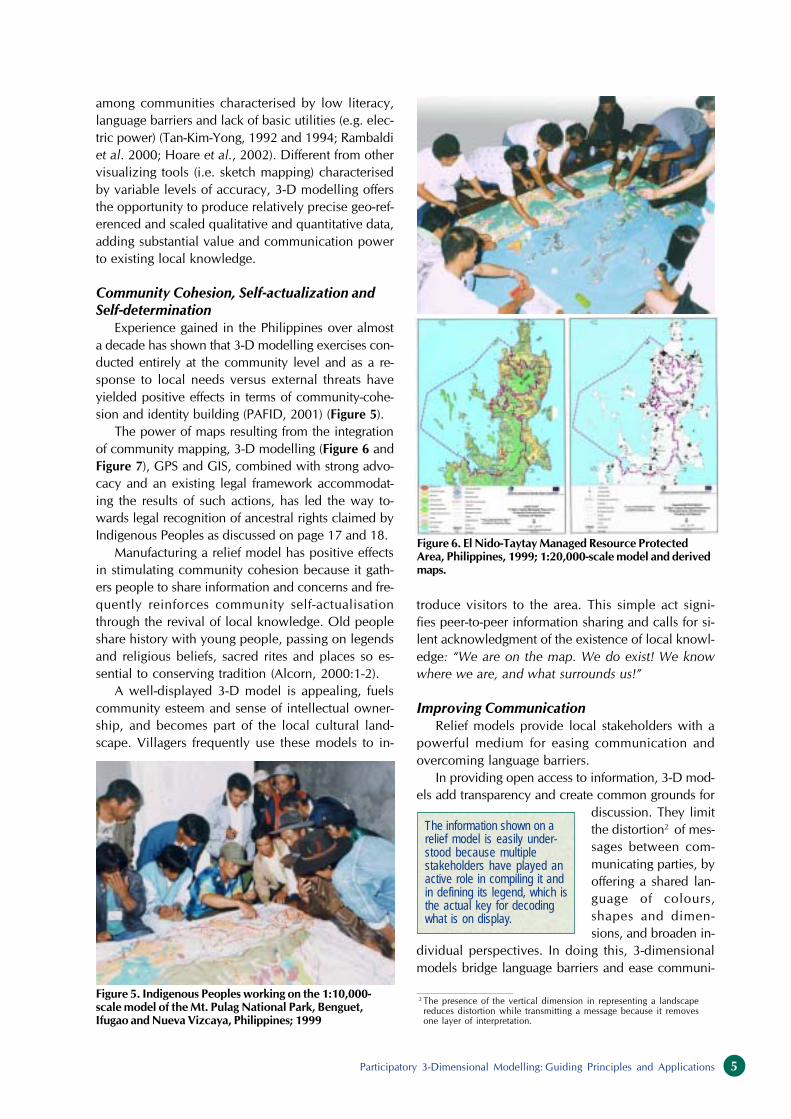
Figure 5. Indigenous Peoples working on the 1:10,000-
scale model of the Mt. Pulag National Park, Benguet,
Ifugao and Nueva Vizcaya, Philippines; 1999
Figure 6. El Nido-Taytay Managed Resource Protected
Area, Philippines, 1999; 1:20,000-scale model and derived
maps.
2
The presence of the vertical dimension in representing a landscape
reduces distortion while transmitting a message because it removes
one layer of interpretation.
The information shown on arelief model is easily under-stood because multiplestakeholders have played anactive role in compiling it andin defining its legend, which isthe actual key for decodingwhat is on display.

ASEAN Regional Centre for Biodiversity Conservation6
cation on issues bound to the territory and its re-
sources. This is particularly relevant for people hav-
ing different education levels, cultural backgrounds
and eventually diverse or conflicting interests.
Reproducing geo-referenced people’s knowledge in
cartographic format thus fitting a “receiver-oriented”
communication model3
has generated information that
could place informal (community) and formal (scien-
tists, government officials, consultants, etc.) knowl-
edge at comparable levels, thus facilitating interaction,
reciprocal learning and negotiation (Alcorn, 2000,
2001; Poole, 1995, 1998; Rambaldi et al., 2002).
Bridging Isolation and Supporting
Change and Innovation
Bringing about change requires the organisation
of an innovation process in which communication
is used primarily to facilitate learning and negotia-
tion (Leeuwis, 2000). Nonetheless innovation has to
rely on the concurrence of both technical and social-
organisational elements. This implies - among oth-
ers - the building of networks of co-ordinated action
supporting the desired change at different institu-
tional levels and the involvement of decision mak-
ers. This exchange process can be facilitated through
the use of communicative strategies. In this context,
community mapping has gained importance since
increased access to modern geographic information
technologies has begun to make the power that
comes from recording and controlling space avail-
able to those who were traditionally disenfranchised
by maps. Hence, maps have been the most com-
monly used reference medium when dealing with
geographically defined issues in a community-led
negotiation process.
While the 3-D model itself (in its making or dis-
play) is an interpersonal communication tool that fa-
cilitates learning and negotiation, its greatest con-
straint lies in its limited mobility. Therefore to in-
teract - using the model as a channel - insiders and
outsiders have to gather around it (e.g. in the village,
protected area or local administration offices, etc.).
This is a severe limitation when considering that cen-
tral, regional and provincial governments are gener-
ally the locus of decision making in terms of
institutionalising change in resource access and ten-
ure. The limited mobility of a relief model hampers
its outreach and mediation function beyond village
boundaries. To reach central institutions, information
displayed on relief models has to be made portable
and widely shareable. This is made possible by fully
integrating P3DM with a GIS. The latter allows for
the conversion of the data depicted on 3-D models
into a cartographic format, which is mobile and re-
producible. A GIS can in turn generate data sets,
which can be fed onto the 3-D Model (see page 36)
to enrich the learning and negotiation process. Pro-
vided adequate linkages and networks are estab-
lished, and depending on the existing regulatory
framework, innovations supported by P3DM outputs
(model, maps, plans, etc.) can reach higher institu-
tional levels (bureaucrats and politicians), and go as
far as influencing national policy making as exem-
plified in the case of the Philippines and discussed
in more detail on page 17 and 18 (e.g. land tenure
rights for ethnic minorities, establishment of pro-
tected areas and watersheds).
Models and maps can be used as part of a larger
communication strategy to foster legal and policy
reform at the national level. Consensus surrounding
a map gives legitimacy in political debates in an open
society (Alcorn, 2000). The combination of P3DM,
GPS and GIS has proven to be quite efficient in in-
creasing the capacity of local stakeholders to inter-
act with national and international institutions. The
P3DM process and its outputs appear to be the foun-
dations upon which Public Participation GIS can re-
lease its full potential.
Figure 7. Map of the Ancestral Domain of the Tagbanua
Peoples, Coron Island, Philippines, 1998
(Source of information: 3-D Model)
3
In other words, packaging a message to meet the frame of mind of the
receiver (scientists, engineers, government officials, politicians, etc.).
Map courtesy of the Tagbanua Foundation and PA
FID
Participatory 3-Dimensional Modelling: Guiding Principles and Applications 7
SPECIFIC APPLICATIONS OF
PARTICIPATORY 3-D MODELLING
Supporting Traditional Knowledge Intellectual
Property Rights
With the development of modern biotechnology,
genetic resources have gained increasing economic,
scientific and commercial value for a wide range of
stakeholders. In this respect, the associated tradi-
tional knowledge has attracted widespread attention
from a growing audience considering genetic re-
sources and traditional knowledge to be governed by
the laws and practices covering intellectual property
use and protection. An “Intergovernmental Commit-
tee on Intellectual Property and Genetic Resources,
Traditional Knowledge and Folklore” has been estab-
lished in September 2000 by the World Intellectual
Property Organization (WIPO) Member States to ad-
dress intellectual property questions raised in terms
of access to genetic resources and benefit-sharing;
and protection of traditional knowledge, whether or
not associated with those resources (WIPO
Web site, 2002).
The Philippines (PAFID, 2001, Rambaldi
et al., 2001) has experienced how Indigenous
Peoples could provide evidence of using re-
sources and occupying certain areas since
time immemorial and to obtain Ancestral
Domain/Land certificates with the use of geo-
graphic information technologies including
3D models, GPS and GIS facilities (Figures
7 and 8). Based on these experiences, one
could figure out how useful the integration
of these systems could be in documenting
traditional knowledge Intellectual Property
Rights (IPR).
Collaborative Planning
The physical 3-dimensional repre-
sentation of space offers users a so-
called bird’s eye view and a common
perspective from which to acquire a
holistic view of the landscape wherein
landmarks and salient features are vis-
ible to everyone (Figure 9). The pro-
cess of making a 3-D Model or of us-
ing it as a reference for discussion and
planning facilitates the mental han-
dling of spatial data. Imagine discuss-
ing the outlining of a 20-km long road
sitting around a desk with no refer-
ence at all, using a topographic map
or a scaled relief model. The last sce-
nario is likely to be the most produc-
tive as discussed in detail at page 2.
This is supported also by transparency in data
display. In fact all features shown on a model and
on its legend are the result of collaborative efforts
of various stakeholders. Having a common under-
standing of the landscape greatly enhances the ca-
pacity of individuals to analyze the territory from
a comprehensive planning point of view and to in-
teract on a peer-to-peer basis. The concurrence of
all these factors makes 3-D models excellent tools
for collaborative planning and helps stakeholders
in dealing with issues and conflicts associated with
the territory and the use of its resources (Figure
10).
As discussed on page 27, the use of a coding sys-
tem based on a rich assortment of materials and
colours, allows a 3-D model to function like a rudi-
mentary community-based GIS, accommodating
overlapping layers of information. This is extremely
useful in any planning exercise because users can
establish visual relations between resources, tenure,
their use and jurisdiction.
Figure 8. 1:5,000-scale model of the Kankanaey Ancestral Domain, Palina,
Kibungan, Benguet, Philippines; 1998
Figure 9. There we are!
Photo by PA
FID

ASEAN Regional Centre for Biodiversity Conservation8
or larger than 1:10,000, facilitate selective pinpoint-
ing of resources, households and other features and
can be used as a valid support for the conduct of
on-field research in various domains including bio-
logical diversity, socio-economics, demography,
health and others. What substantially differentiates
the method from other modern geographic informa-
tion technologies like aerial photography and sat-
ellite imagery is that it can visualize invisible fea-
tures like values, tenure, resource use domains, sa-
cred areas, spatially defined rights, cultural bound-
aries, and others (Figure 11).
If the method is applied in a genuinely partici-
patory manner, it generates relatively accurate quali-
tative and quantitative geo-referenced data (Cham-
bers, 2002) that are intellectually owned and under-
stood by those who have compiled them as discussed
in detail on page 32 and 33.
Exploring Water Bodies
The possibility of using 3-D modelling for map-
ping out water bodies deserves special mention, due
to the partially hidden nature of these environments
and the value of human cognition in its description
and depiction.
Mapping out wetlands and coastal areas
characterised by shallow waters is difficult, because
of their instability and frequent change (e.g. river
deltas). Nonetheless, in cases where the topography
has been stable for a long period and reliable con-
tour and bathymetric lines are available, the produc-
tion of a participatory 3-D model could lead to gen-
erating an extremely rich information base on exist-
ing ecosystems and their interaction with wetland-
dependent communities.
The reproduction of the seabed also depends on
the availability of bathymetric lines. Exercises car-
ried out in northern Palawan in the Philippines
(Figure 12) have demonstrated how well fishermen
could map out the details of their fishing grounds
including the detailed description of coastal and
marine ecosystems.
Collaborative Protected Area
Management
The use of Participatory 3-D Models in the con-
text of protected area management (Figure 13) has
been initiated in the Philippines, as discussed on pages
18 and 19). So far, almost 8% of the 209 (PAWB,
2002) initial components of the National Integrated
Protected Area System (NIPAS) has its own models.
Recorded uses include the following:
• Generating spatial geo-referenced data based
on a community perspective on land use, veg-
Figure 10. Indigenous Peoples in Kalinga working on a
1:5,000-scale model, Philippines; 2001
Figure 11. Informants working on the model of the Pu Mat
National Park, Nghe An, Vietnam; 2001
Figure 12. 1:20,000-scale model of Malampaya Sound
Protected Land and Seascape, Palawan, Philippines; 2000
So far, Participatory 3-D models have been suc-
cessfully used in preparing land and resource use
plans (Tan-Kim-Yong, 1992; Tan-Kim-Yong et al.,
1994; GTZ-HDP, 1998; Jantacad et al., 1998), wa-
tershed management plans (GTZ-HDP, 1998; Hoare
et al., 2002), community-based fire management
plans (Hoare et al., 2002), protected area (Rambaldi
et al., 2002) and ancestral domain management plans
(PAFID, 2001), the last two including both terrestrial
and marine components.
Collaborative Research
Participatory 3-D models made at scales equal
Photo by D
ave de V
era, PA
FID
Photo by R
oyce Eustaquio
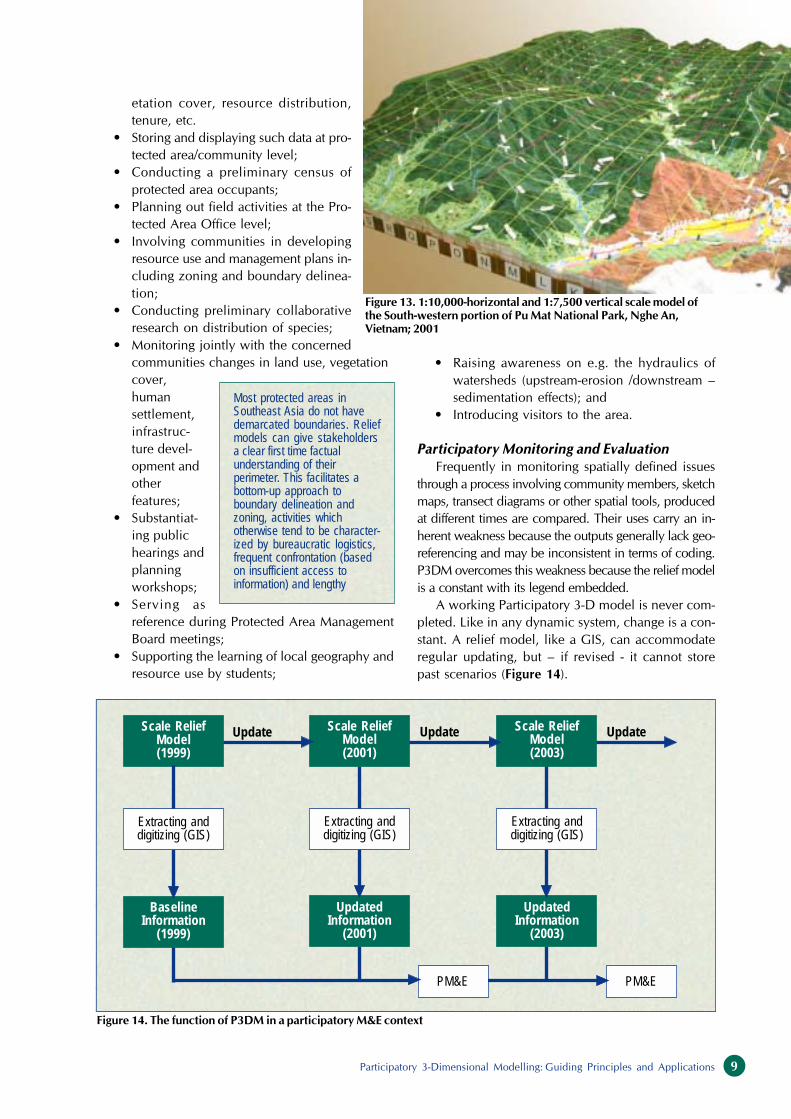
Participatory 3-Dimensional Modelling: Guiding Principles and Applications 9
etation cover, resource distribution,
tenure, etc.
• Storing and displaying such data at pro-
tected area/community level;
• Conducting a preliminary census of
protected area occupants;
• Planning out field activities at the Pro-
tected Area Office level;
• Involving communities in developing
resource use and management plans in-
cluding zoning and boundary delinea-
tion;
• Conducting preliminary collaborative
research on distribution of species;
• Monitoring jointly with the concerned
communities changes in land use, vegetation
cover,
human
settlement,
infrastruc-
ture devel-
opment and
other
features;
• Substantiat-
ing public
hearings and
planning
workshops;
• Serving as
reference during Protected Area Management
Board meetings;
• Supporting the learning of local geography and
resource use by students;
Figure 13. 1:10,000-horizontal and 1:7,500 vertical scale model of
the South-western portion of Pu Mat National Park, Nghe An,
Vietnam; 2001
Most protected areas inSoutheast Asia do not havedemarcated boundaries. Reliefmodels can give stakeholdersa clear first time factualunderstanding of theirperimeter. This facilitates abottom-up approach toboundary delineation andzoning, activities whichotherwise tend to be character-ized by bureaucratic logistics,frequent confrontation (basedon insufficient access toinformation) and lengthy
PM&E
Update Update UpdateScale ReliefModel(1999)
Extracting anddigitizing (GIS)
Scale ReliefModel(2003)
Extracting anddigitizing (GIS)
Scale ReliefModel(2001)
Extracting anddigitizing (GIS)
UpdatedInformation
(2003)
UpdatedInformation
(2001)
PM&E
BaselineInformation
(1999)
• Raising awareness on e.g. the hydraulics of
watersheds (upstream-erosion /downstream –
sedimentation effects); and
• Introducing visitors to the area.
Participatory Monitoring and Evaluation
Frequently in monitoring spatially defined issues
through a process involving community members, sketch
maps, transect diagrams or other spatial tools, produced
at different times are compared. Their uses carry an in-
herent weakness because the outputs generally lack geo-
referencing and may be inconsistent in terms of coding.
P3DM overcomes this weakness because the relief model
is a constant with its legend embedded.
A working Participatory 3-D model is never com-
pleted. Like in any dynamic system, change is a con-
stant. A relief model, like a GIS, can accommodate
regular updating, but – if revised - it cannot store
past scenarios (Figure 14).
Figure 14. The function of P3DM in a participatory M&E context

ASEAN Regional Centre for Biodiversity Conservation10
This is where GIS “adds value” and becomes a
vital ingredient for monitoring change, provided the
data on the 3-D model are updated at given inter-
vals, periodically extracted, digitized, plotted as the-
matic maps and finally returned to the community
for assessing change, and identifying its causes and
effects.
This process adds to the learning aspects dis-
cussed on page 3.
Management of Conflicts Bound to the
Territory and its Resources
Conflict resolution involves area-based mecha-
nisms to prevent, mediate and resolve local disputes
and to strengthen communities in dealing with their
management. Disagreements over boundaries, re-
source use and tenure are often root causes of con-
flicts.
The strategies and processes leading to conflict
resolution are complex and articulated and need the
backing of appropriate institutional, legal and –
where applicable - traditional mechanisms.
At grassroots level, 3-D models can help in deal-
ing with conflicts bound to the territory (e.g. bound-
ary disputes) through the visualization of the land-
scape, and the provision of vantage points shared by
the conflicting parties. In addition, a 3-D model pro-
vides contenders with equitable access to informa-
tion (Figure 15), adding transparency and reducing
the space for subjective interpretations (Rambaldi
et al., 2002).
The use of 3-D models for conflict resolution has
been widespread in Northern Thailand (Tan-Kim-Yong,
1992; Tan-Kim-Yong et al., 1994; Srimongkontip,
2000; Hoare et al., 2002) and is currently ongoing in
Reconciling conflicts through a common perspective
Different opinions are frequently based on differentperspectives and the means of expressions used tocommunicate. A case in point is a long-lasting conflictbetween tribal communities in the northern part of thePhilippines. The origin of the conflict is territorial andrelates specifically to boundaries of tribal domains, whichwere agreed upon by elders a century ago andformalized as written Peace Pacts, passed on fromgeneration to generation. A number of factors have led todiverging interpretations of the scripts and triggeredviolent confrontations.
In 1998, the Office of the Presidential Advisor for thePeace Process (OPAPP) stepped in to facilitate anegotiation process aimed at reconciling the conflicts.The turning point of the process has been the establish-ment of a common ground for understanding theterritory.
Through the use of relief model embracing the entirearea of conflict, it became apparent that diverse ethno-linguistic groups were using different names for naturallandmarks, like creeks andpeaks. Residents of differentlocations would construe “theboundary running along thehighest mountain” dependingon their own viewpoint.Different denominations andinterpretations of naturalfeatures were ineluctablysources of disagreement.
The model is geo-refer-enced, represents at1:5,000-scale, a total area ofapproximately 700 sq. km.and has been constructedwith the active participation ofall parties concerned. Atplanned intervals, theconfronting groups havegathered around the model,learned on a commonground and negotiated. In one year and a half, almost allconflicts have been settled and new peace pactssigned.
In such a context, there is no doubt that the thirddimension and the holistic view offered by the reliefmodel have been key factors in facilitating the consolida-tion of the negotiation process: there were only onehighest mountain and one creek so-and-so to be named,seen, felt and touched by all concerned.
During the construction of the model and follow-upnegotiations, data have been extracted and digitized andfed into a GIS. In support of the data displayed on the 3-D model, the voluminous process documentationincludes the description of the boundary corners and thenames of the individuals who will be responsible for theiridentification during the forthcoming ground survey.
This final act, which will conclude the peace process, willbe conducted with the assistance of a licensed geodeticengineer. The fact that the elders and the barangaycaptains have already defined a survey plan representsa reasonable guarantee for the respect of the right toself-delineation (Rambaldi et al., 2002).
Photo by D
ave de V
era, PA
FID
Figure 15. Elders warming up “Peace Pacts” in Balbalan
Municipality, Kalinga, Cordillera Administrative Region,
Philippines, 2000
Participatory 3-Dimensional Modelling: Guiding Principles and Applications 11
the Philippines under the auspices of the Office of the
Presidential Adviser on the Peace Process (OPAPP)
(PAFID, 2001; Rambaldi et al., 2002).
It is worth recalling that an interactive process
involving 3-D modelling may set the basis for con-
structive action but that it may also be instrumental
in making latent conflicts explicit.
Therefore, it is important that the process be
carefully prepared, well managed and embed-
ded in a long-lasting, articulated (multi-actor)
intervention, which could eventually deal with
follow-up arrangements to accommodate new
realities emerging from the process (Leeuwis,
2001).
INHERENT RISKS AND MITIGATING
MEASURES
Because of their accuracy, relief models may also
have negative implications.
Alone or combined with GIS, Participatory 3-D
models “turn local knowledge into public knowledge
and conceivably out of local control. This can be
used by outsiders to locate resources and meet de-
velopment needs, or merely, to extract more re-
sources, or to increase control from the outside” (Ab-
bot et al., 1999:29).
Some groups haveexpressed concern thatthe mapping processenables outsiders to bein command of informa-tion previously controlledby local communities(Poole, P. 1995).
Researchers, planners and practitioners should be
aware of these possible drawbacks and be careful in
the application of the method.
Being on a map, on one hand, means to exist vis-
à-vis the external world, thus to be in the position to
get or claim services and assistance. On the other hand,
it may carry undesired implications such as being sub-
ject to undesired develop-
ment pressures, particu-
larly for communities
wanting to maintain their
cultural identity and tradi-
tions.
From a biodiversity
point of view, depicting
habitats of endangered species, or rare resources in
demand on the black market, may lead to their fur-
ther depletion.
Therefore, exercises dealing with sensitive is-
sues should be done with caution and behind
closed doors in the course of focus group discus-
sions. Data that are at risk of abuse or culturally
sensitive, should be removed from the model and
eventually stored as confidential GIS layers with
limited or protected access (Harmsworth,
1998)..
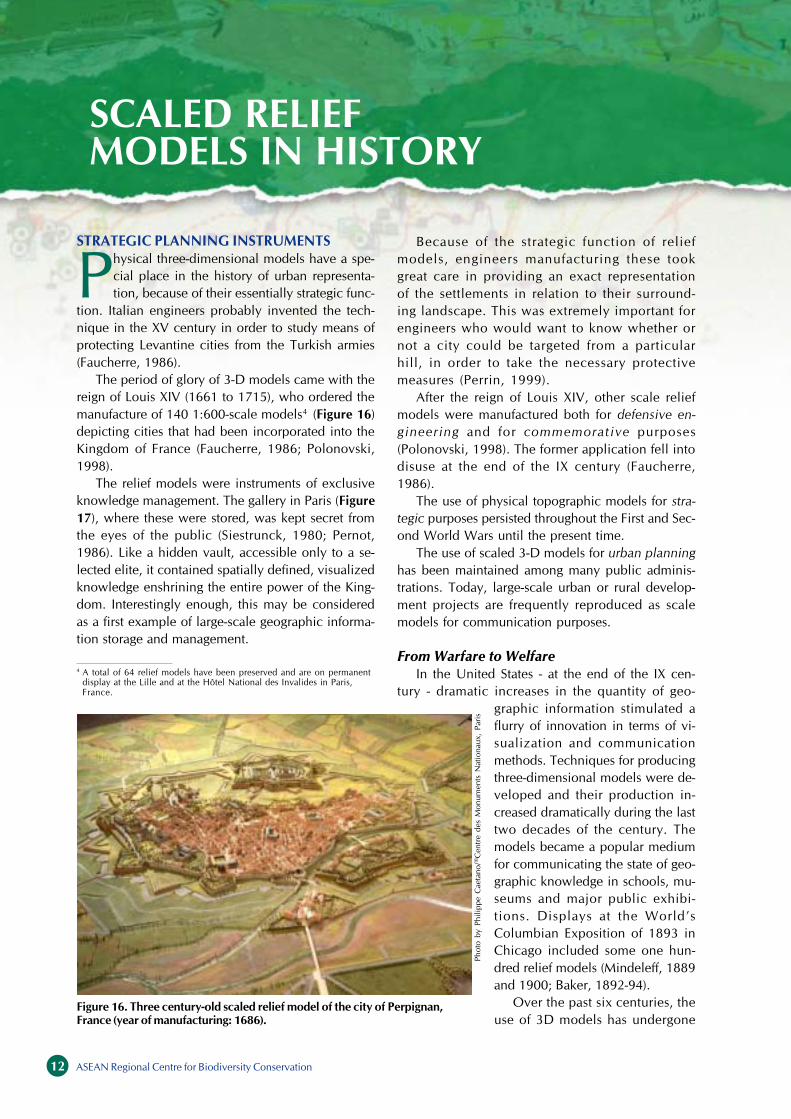
ASEAN Regional Centre for Biodiversity Conservation12
SCALED RELIEF
MODELS IN HISTORY
Because of the strategic function of relief
models, engineers manufacturing these took
great care in providing an exact representation
of the settlements in relation to their surround-
ing landscape. This was extremely important for
engineers who would want to know whether or
not a city could be targeted from a particular
hill, in order to take the necessary protective
measures (Perrin, 1999).
After the reign of Louis XIV, other scale relief
models were manufactured both for defensive en-
gineering and for commemorative purposes
(Polonovski, 1998). The former application fell into
disuse at the end of the IX century (Faucherre,
1986).
The use of physical topographic models for stra-
tegic purposes persisted throughout the First and Sec-
ond World Wars until the present time.
The use of scaled 3-D models for urban planning
has been maintained among many public adminis-
trations. Today, large-scale urban or rural develop-
ment projects are frequently reproduced as scale
models for communication purposes.
From Warfare to Welfare
In the United States - at the end of the IX cen-
tury - dramatic increases in the quantity of geo-
graphic information stimulated a
flurry of innovation in terms of vi-
sualization and communication
methods. Techniques for producing
three-dimensional models were de-
veloped and their production in-
creased dramatically during the last
two decades of the century. The
models became a popular medium
for communicating the state of geo-
graphic knowledge in schools, mu-
seums and major public exhibi-
tions. Displays at the World’s
Columbian Exposition of 1893 in
Chicago included some one hun-
dred relief models (Mindeleff, 1889
and 1900; Baker, 1892-94).
Over the past six centuries, the
use of 3D models has undergone
STRATEGIC PLANNING INSTRUMENTS
Physical three-dimensional models have a spe-
cial place in the history of urban representa-
tion, because of their essentially strategic func-
tion. Italian engineers probably invented the tech-
nique in the XV century in order to study means of
protecting Levantine cities from the Turkish armies
(Faucherre, 1986).
The period of glory of 3-D models came with the
reign of Louis XIV (1661 to 1715), who ordered the
manufacture of 140 1:600-scale models4 (Figure 16)
depicting cities that had been incorporated into the
Kingdom of France (Faucherre, 1986; Polonovski,
1998).
The relief models were instruments of exclusive
knowledge management. The gallery in Paris (Figure
17), where these were stored, was kept secret from
the eyes of the public (Siestrunck, 1980; Pernot,
1986). Like a hidden vault, accessible only to a se-
lected elite, it contained spatially defined, visualized
knowledge enshrining the entire power of the King-
dom. Interestingly enough, this may be considered
as a first example of large-scale geographic informa-
tion storage and management.
Figure 16. Three century-old scaled relief model of the city of Perpignan,
France (year of manufacturing: 1686).
4
A total of 64 relief models have been preserved and are on permanent
display at the Lille and at the Hôtel National des Invalides in Paris,
France.
Photo by Philippe C
aetano
/©C
entre des M
onum
ents N
ationaux, Paris
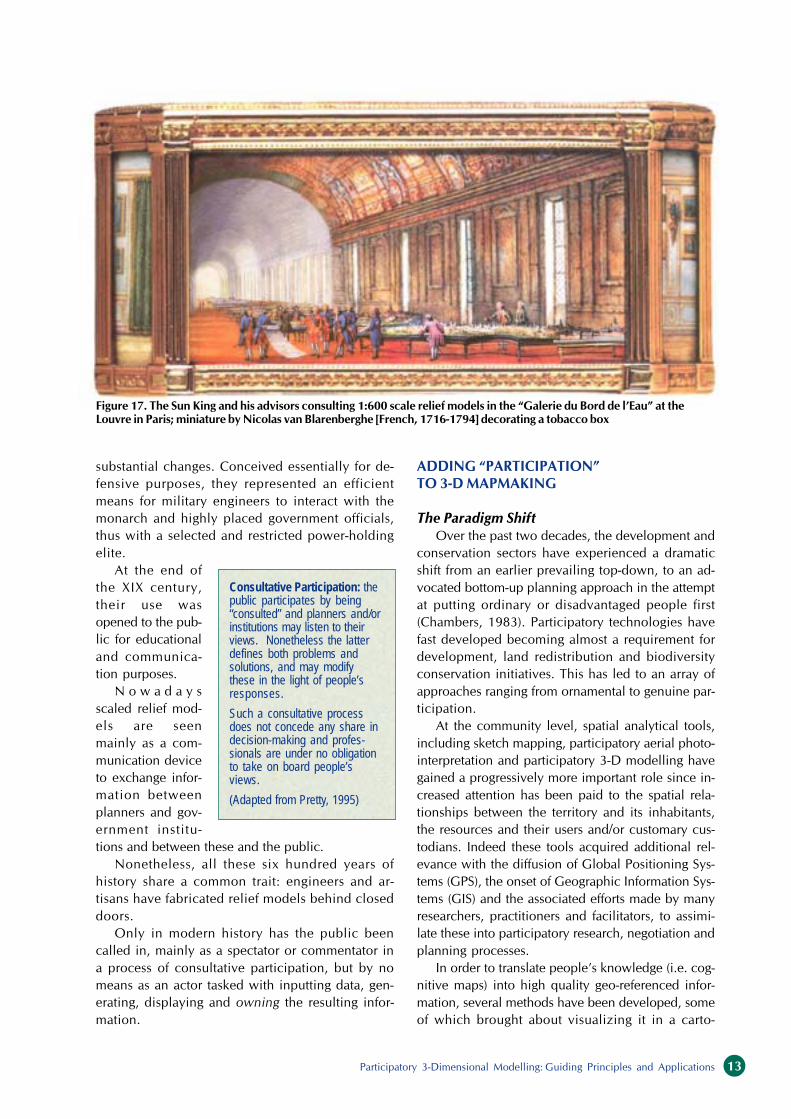
Participatory 3-Dimensional Modelling: Guiding Principles and Applications 13
substantial changes. Conceived essentially for de-
fensive purposes, they represented an efficient
means for military engineers to interact with the
monarch and highly placed government officials,
thus with a selected and restricted power-holding
elite.
At the end of
the XIX century,
their use was
opened to the pub-
lic for educational
and communica-
tion purposes.
N o w a d a y s
scaled relief mod-
els are seen
mainly as a com-
munication device
to exchange infor-
mation between
planners and gov-
ernment institu-
tions and between these and the public.
Nonetheless, all these six hundred years of
history share a common trait: engineers and ar-
tisans have fabricated relief models behind closed
doors.
Only in modern history has the public been
called in, mainly as a spectator or commentator in
a process of consultative participation, but by no
means as an actor tasked with inputting data, gen-
erating, displaying and owning the resulting infor-
mation.
ADDING “PARTICIPATION”
TO 3-D MAPMAKING
The Paradigm Shift
Over the past two decades, the development and
conservation sectors have experienced a dramatic
shift from an earlier prevailing top-down, to an ad-
vocated bottom-up planning approach in the attempt
at putting ordinary or disadvantaged people first
(Chambers, 1983). Participatory technologies have
fast developed becoming almost a requirement for
development, land redistribution and biodiversity
conservation initiatives. This has led to an array of
approaches ranging from ornamental to genuine par-
ticipation.
At the community level, spatial analytical tools,
including sketch mapping, participatory aerial photo-
interpretation and participatory 3-D modelling have
gained a progressively more important role since in-
creased attention has been paid to the spatial rela-
tionships between the territory and its inhabitants,
the resources and their users and/or customary cus-
todians. Indeed these tools acquired additional rel-
evance with the diffusion of Global Positioning Sys-
tems (GPS), the onset of Geographic Information Sys-
tems (GIS) and the associated efforts made by many
researchers, practitioners and facilitators, to assimi-
late these into participatory research, negotiation and
planning processes.
In order to translate people’s knowledge (i.e. cog-
nitive maps) into high quality geo-referenced infor-
mation, several methods have been developed, some
of which brought about visualizing it in a carto-
Figure 17. The Sun King and his advisors consulting 1:600 scale relief models in the “Galerie du Bord de l’Eau” at the
Louvre in Paris; miniature by Nicolas van Blarenberghe [French, 1716-1794] decorating a tobacco box
Consultative Participation: thepublic participates by being“consulted” and planners and/orinstitutions may listen to theirviews. Nonetheless the latterdefines both problems andsolutions, and may modifythese in the light of people’sresponses.
Such a consultative processdoes not concede any share indecision-making and profes-sionals are under no obligationto take on board people’sviews.
(Adapted from Pretty, 1995)

ASEAN Regional Centre for Biodiversity Conservation14
graphic, reproducible format accepted at the insti-
tutional level as part of a negotiation process.
In a recent publication, Janis Alcorn (2000:12)
highlighted the power of maps, “which communicate
information immediately and convey a sense of au-
thority. As a consequence, community-based maps
empower grassroots efforts to hold governments ac-
countable. This mapping is not action research; it’s
political action.”
LEARNING FROM PRACTICE
It is important to recall that a number of exter-
nal factors and conditions determine the contribu-
tion of 3-D models to innovation processes as ex-
emplified by the analysis of different contexts in
which the method has been applied in Thailand, Viet-
nam and the Philippines.
Thailand, the Frontrunner
In Thailand since the early 1960’s, significant
areas of the highlands were declared as national
reserved forests, parks, and wildlife sanctuaries.
A national watershed classification system was in-
troduced in 1986 that imposed additional land use
restrictions and gave the Royal Forest Department
(RFD) a great deal of control over people living in
the uplands of Northern Thailand (SM-HDP, 1998).
As a result, many settlements became illegal re-
gardless of how long they had existed. This was
in conflict with the national policy for social in-
tegration of the hill tribe population (Aguettant,
1996).
Commercial logging concessions in national for-
estlands were all revoked in 1989 (event commonly
known as the ‘logging ban’) to protect the remain-
ing forests. As restrictions grew over human activi-
ties within government forestland, conflict increased
over access and control of natural resources and over
the geographical extent of users’ rights at village and
sub-district levels. Villagers had no legal authority
to control the harvest of timber products by outsid-
ers, or to establish community-accepted by-laws gov-
erning local use and trade of such resources. More-
over, no forum existed to allow village leaders to
exchange opinions and experiences concerning these
problems (Jantakad et al., 1998).
The use of relief models surfaced in this conflict
situation primarily as a facilitating tool for establish-
ing a dialogue on resource use and tenure among
outsiders (government officials) and insiders (hill
tribe people).
Scaled three-dimensional models had been used
by various government agencies, including the Royal
Forest Department, for a number of years, but their
use was usually limited to project management level.
Generally, such models were manufactured at a
small scale covering relatively large areas and dis-
played in government offices.
These models were first used in a proactive mode
by the Royal Forest Department (RFD) in the frame-
work of the Thailand Upland Social Forestry Project
(TUSFP, 1989; Tan-Kim-Yong, 1992; Poffenberger,
1993; Tan-Kim-Yong et al., 1994; TG-HDP, 1998a)
whose pilot sites covered three mini-watersheds
nested within the larger Sam Mun Highland Devel-
opment Project (SM-HDP) (Robert, 1990; Tan-Kim-
Yong et al., 1994).
The Upland Social Forestry Project (1987-1995)
was funded by the Ford Foundation and implemented
by RFD and the Resources Management and Devel-
opment Programme of the Faculty of Social Sciences,
Chiang Mai University (CMU). Project staff jointly
conceived the idea of using relief models as a learn-
ing and communi-
cation tool. CMU
researchers began
using them in the
framework of the
new Participatory
Land Use Planning
(PLUP) approach
they were spear-
heading (Tan-Kim-
Yong et al., 1994).
Although project
staff personally
made the first ex-
perimental 3-D
model, collaborating villagers constructed the follow-
ing ones as part of the collaborative process. As the
devices demonstrated their key role in the PLUP pro-
cess, particularly in providing open access to infor-
mation for learning, discussion and negotiation, they
began to be constructed in many villages within the
wider Sam Mun Highland Development Project area.
After their successful use at the village level, the geo-
graphical scope of the models was extended to in-
clude a number of villages located within entire sub-
watersheds to support multi-stakeholder collabora-
tive planning by newly established watershed man-
agement networks.
Since the PLUP process was geared towards in-
ducing behavioural change both in insiders and out-
siders through a learning, negotiation and conflict
resolution process, information and communication
systems were considered as key ingredients. This in
turn required all parties to gain equal access to in-
formation to develop a common understanding of
“Participatory Land UsePlanning (PLUP) is anoperational tool or processwhich creates conditions offrequent communication andanalytical discussions, hencestrengthening local organizationby generating commonunderstanding and shared rightsand responsibilities amongproject partners who carry outactivities that lead to the solvingof local forest management andother related communityproblems” (Tan-Kim-Yong,1992:9-10

Participatory 3-Dimensional Modelling: Guiding Principles and Applications 15
resource management problems (Tan-Kim-Yong et al.,
1994). It became apparent that in a situation of ex-
isting language barriers5
, information exchange could
best occur via visual communication means like dia-
grams, aerial photographs and 3-D models in par-
ticular. These means provided the focus for organized
discussions and were instrumental in providing par-
ticipants with a clearer understanding of local prob-
lems vis-à-vis a wider social and environmental con-
text. Through a progressive learning and negotiation
process, this led to the settling of disputes among
villagers, between villages, and between villagers and
government officials, thus opening up avenues for
dialogue between people of different ethnic back-
grounds and cultural conditioning (Tan-
Kim-Yong, 1992; Tan-Kim-Yong et al.,
1994).
Recorded results of the PLUP process
have been a more equitable distribution of
farmland among villagers, clearly defined
resource use (i.e. village) boundaries, the
creation of fire protection groups, a notable
decrease in opium cultivation and an im-
proved agency-community dialogue. Added
transparency on actual land use and regu-
lar interactions with government officials
reduced the need for farmers to gain quick
returns from temporary “illegally” occu-
pied land and stimulated their interest in
more long-lasting soil and water conserva-
tion investments. All this resulted in im-
proved land management under the respon-
sibility of the villagers and in co-operation
with the RFD-Sam Mun Highland Devel-
opment Project.
The PLUP experience has since been widely
recognised as an important example of effective lo-
cal resource management by minority groups (TG-
HDP, 1998:27) and has been adopted by other
projects in Thailand and neighbouring countries.
The Thai - German Highland Development
Programme (TG-HDP), which started in 1981 and
went through several phases, adopted relief mapping
in 1990. Three-dimensional polystyrene or cardboard
models were used in meetings between the survey
teams and members of the community as part of a
process called Community-based Land Use Planning
and local Watershed Management (CLM) (TG-HDP,
1998).
In 1995 the project started assisting the villagers
in updating the models and periodically transferring
the information to baseline maps to be used for
monitoring purposes. In their 1998 final review and
“Lessons Learned”, the TG-HDP management stated
that “of the many working tools such as maps, aerial
photographs and GPS that have been used during
CLM, the 3-dimensional model has been found to be
the most useful” (TG-HDP, 1998a:48). This consid-
eration has been reiterated by Jantakad and Carson
(1998) as follows: “During actual implementation of
the CLM process, the three-dimensional topographic
model has been found to be a very effective and use-
ful tool in assisting the community leaders and gov-
ernment officers to assess present land limitations,
problems and conflicts”.
The 1997-2003 Upper Nan Watershed Manage-
ment Project (UNWMP) has been making use of re-
lief models of different scales and sizes (Figure 18)
in its action to develop a partnership between the
Royal Forest Department and local communities liv-
ing within two national forest reserves. The project
involves 45 villages, each provided with its own
model. Acknowledging the limitations of village
models (see Table 1 on page 22), the project made
larger models encompassing 6-8 villages in 1998 to
cater to intra-village dynamics and to support the
development of village watershed network rules and
regulations dealing with fire management, harvest of
Non-Timber Forest Products (NTFP) and livestock
grazing rights (Hoare et al., 2002).
Another project, which has made use of partici-
patory relief models, is the Integrated Natural Re-
sources Conservation Project (INRCP), which has
been operating in the northern provinces of Chiang
5
RFD government officials and TUSF programme staff had a hard time
communicating with the hill tribe communities as spoken languages
differed considerably.
Figure 18. Village model, Upper Nan Watershed, Pa Nam Yao Lae Pa Nam Suad
National Forest Reserve, Thailand, 1998

ASEAN Regional Centre for Biodiversity Conservation16
Mai and Mae Hong from 1994 to 1999. In this con-
text, the devices have been successfully used in ne-
gotiation processes dealing with disputes over re-
source use and access and in favouring the use of
more sustainable natural resource management prac-
tices (Srimongkontip, 2000).
The Collaborative Natural Resources Management
(CNRM) project (2000-2004) evolved from the INRC
Project into an intervention having a wider geographi-
cal scope and focusing - in the light of the 1997 Thai
constitution and associated local governance reforms
- on institutional development for collaborative natu-
ral resource management at village, sub-watershed
network, and sub-district government levels. The use
of 3-D models has been incorporated as an integral
component of more elaborate pilot spatial informa-
tion and environmental monitoring systems owned
and operated by local institutions (Thomas, personal
communication, 2001).
In Thailand, the use of 3-D models is quite com-
mon within activities of the Royal Forest Department;
many research and development workers now believe
that their use, increasingly linked with GIS, will con-
tinue to expand under recent constitutional and lo-
cal governance reforms and community forestry leg-
islation currently pending in the Thai parliament
(Thomas, personal communication, 2001).
Vietnam, a Recent Adopter
Over the past decade, government policy in Viet-
nam has gradually shifted away from a centrally
planned economy with collective land tenure and
resource management, towards a system aimed at
decentralizing the management of natural resources.
The rights of individual households
introduced in 1988, were further se-
cured by the 1993 Land Law, where
the State recognized customary land
use as a prerequisite for issuing
Land Use Right Certificates (LURC)
that entitled the awardees to ex-
change, transfer, lease, inherit and
mortgage such rights. Concurrently,
the duration of land allocation was
extended to 20 and 50 years for land
respectively under annual and pe-
rennial crops, and made renewable
provided careful use was being
made. This new land policy has
since represented a formidable chal-
lenge for the concerned government
agencies, requiring the deployment
of substantial resources and the pro-
mulgation of a supporting legal
framework ensuring policy implementation. In this
respect, the Government issued Decree 64/CP on
Agricultural Land Allocation in September 1993 and
Decree 02/CP on Forest Land Allocation in January
1994. Decree 64 specifies that all agricultural land
except land allocated to organizations and land re-
quired for public needs shall be allocated to house-
holds or individuals for agricultural production. De-
cree 02 provides detailed guidance for the allocation
of forestland and forests in accordance with the For-
est Protection and Development Act and the Land
Law (Christ, 1998).
As a contribution to this effort, in Son La and Lai
Chau provinces, the 1993–2004 Social Forestry De-
velopment Project (SFDP) has been actively in-
volved in Participatory Land Use Planning (PLUP),
land allocation and watershed management. Since
1995, the project has been using relief models (Fig-
ure 19). The technique was imported from Thailand
where it was already in use within GTZ-funded
projects (Forster, personal communication, 2001).
The tool – a simplified relief modelling process
- has been used for addressing conflicts on land use,
facilitating the land allocation, discussing potentials
and constraints and developing land use plans (SFDP,
1999). Seen as low-cost inputs aimed at addressing
specific time-bound situations, most of the models
were produced by villagers using mud, colour pow-
der, tree branches and leaves. Due to their nature
most of them have vanished after being used (Forster,
personal communication, 2001).
In 2001, the Mountain Agrarian Systems Program
produced a first geo-referenced 1:3,000 scale model
in Cho Don, Bac Kan Province as part of the CGIAR-
Figure 19. Relief model made in the framework of the Social Forestry Develop-
ment Project in Na Nga village, Chieng Hac Commune, Yen Chau district, Son
La Province, Vietnam; 1999
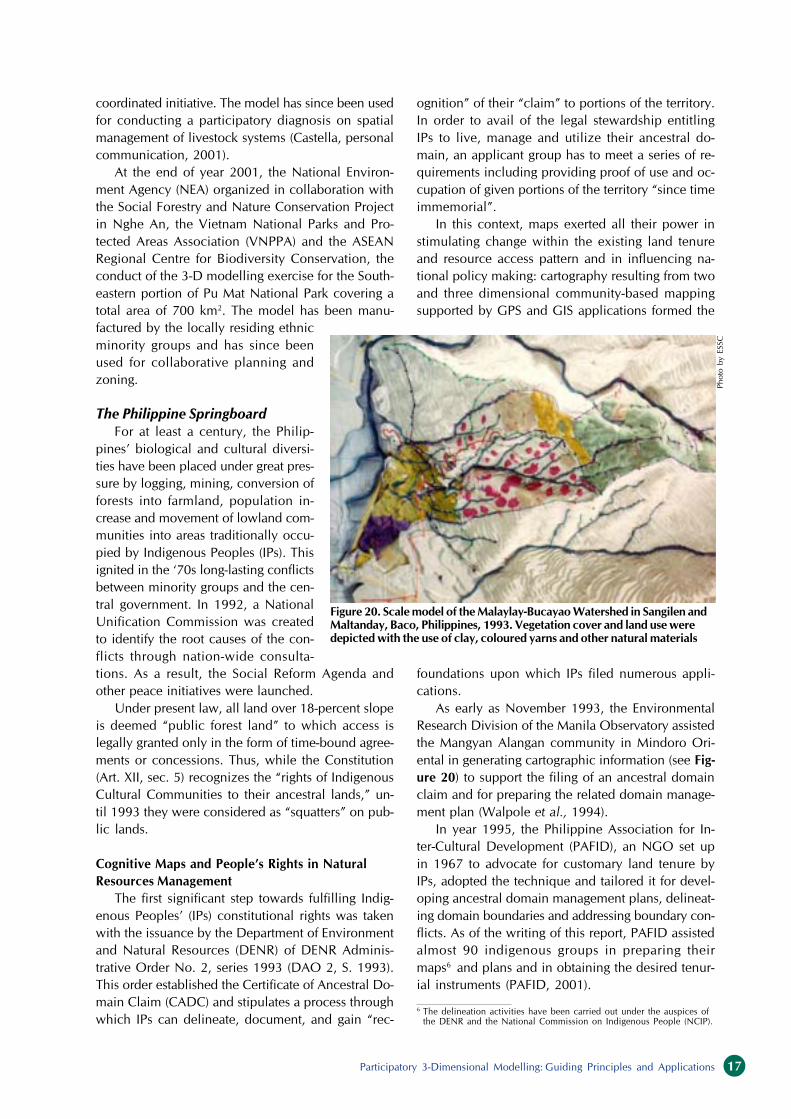
Participatory 3-Dimensional Modelling: Guiding Principles and Applications 17
coordinated initiative. The model has since been used
for conducting a participatory diagnosis on spatial
management of livestock systems (Castella, personal
communication, 2001).
At the end of year 2001, the National Environ-
ment Agency (NEA) organized in collaboration with
the Social Forestry and Nature Conservation Project
in Nghe An, the Vietnam National Parks and Pro-
tected Areas Association (VNPPA) and the ASEAN
Regional Centre for Biodiversity Conservation, the
conduct of the 3-D modelling exercise for the South-
eastern portion of Pu Mat National Park covering a
total area of 700 km2
. The model has been manu-
factured by the locally residing ethnic
minority groups and has since been
used for collaborative planning and
zoning.
The Philippine Springboard
For at least a century, the Philip-
pines’ biological and cultural diversi-
ties have been placed under great pres-
sure by logging, mining, conversion of
forests into farmland, population in-
crease and movement of lowland com-
munities into areas traditionally occu-
pied by Indigenous Peoples (IPs). This
ignited in the ‘70s long-lasting conflicts
between minority groups and the cen-
tral government. In 1992, a National
Unification Commission was created
to identify the root causes of the con-
flicts through nation-wide consulta-
tions. As a result, the Social Reform Agenda and
other peace initiatives were launched.
Under present law, all land over 18-percent slope
is deemed “public forest land” to which access is
legally granted only in the form of time-bound agree-
ments or concessions. Thus, while the Constitution
(Art. XII, sec. 5) recognizes the “rights of Indigenous
Cultural Communities to their ancestral lands,” un-
til 1993 they were considered as “squatters” on pub-
lic lands.
Cognitive Maps and People’s Rights in Natural
Resources Management
The first significant step towards fulfilling Indig-
enous Peoples’ (IPs) constitutional rights was taken
with the issuance by the Department of Environment
and Natural Resources (DENR) of DENR Adminis-
trative Order No. 2, series 1993 (DAO 2, S. 1993).
This order established the Certificate of Ancestral Do-
main Claim (CADC) and stipulates a process through
which IPs can delineate, document, and gain “rec-
ognition” of their “claim” to portions of the territory.
In order to avail of the legal stewardship entitling
IPs to live, manage and utilize their ancestral do-
main, an applicant group has to meet a series of re-
quirements including providing proof of use and oc-
cupation of given portions of the territory “since time
immemorial”.
In this context, maps exerted all their power in
stimulating change within the existing land tenure
and resource access pattern and in influencing na-
tional policy making: cartography resulting from two
and three dimensional community-based mapping
supported by GPS and GIS applications formed the
foundations upon which IPs filed numerous appli-
cations.
As early as November 1993, the Environmental
Research Division of the Manila Observatory assisted
the Mangyan Alangan community in Mindoro Ori-
ental in generating cartographic information (see Fig-
ure 20) to support the filing of an ancestral domain
claim and for preparing the related domain manage-
ment plan (Walpole et al., 1994).
In year 1995, the Philippine Association for In-
ter-Cultural Development (PAFID), an NGO set up
in 1967 to advocate for customary land tenure by
IPs, adopted the technique and tailored it for devel-
oping ancestral domain management plans, delineat-
ing domain boundaries and addressing boundary con-
flicts. As of the writing of this report, PAFID assisted
almost 90 indigenous groups in preparing their
maps6
and plans and in obtaining the desired tenur-
ial instruments (PAFID, 2001).
6
The delineation activities have been carried out under the auspices of
the DENR and the National Commission on Indigenous People (NCIP).
Figure 20. Scale model of the Malaylay-Bucayao Watershed in Sangilen and
Maltanday, Baco, Philippines, 1993. Vegetation cover and land use were
depicted with the use of clay, coloured yarns and other natural materials
Photo by ESSC
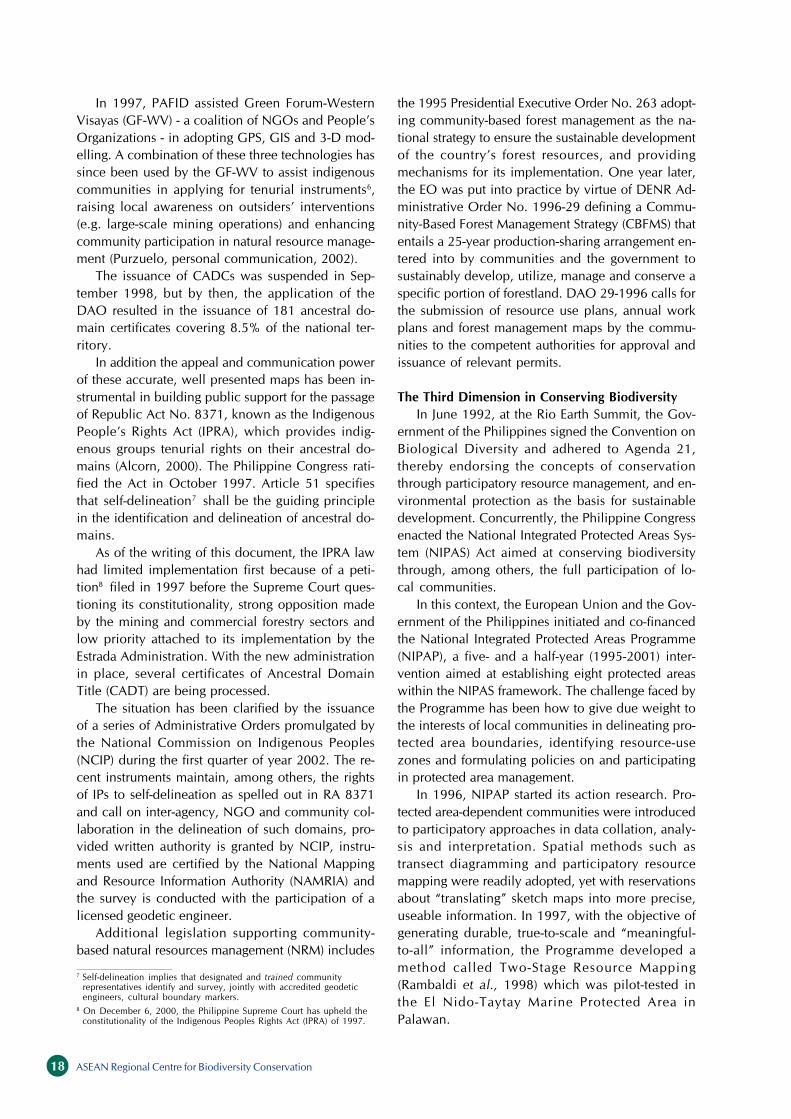
ASEAN Regional Centre for Biodiversity Conservation18
the 1995 Presidential Executive Order No. 263 adopt-
ing community-based forest management as the na-
tional strategy to ensure the sustainable development
of the country’s forest resources, and providing
mechanisms for its implementation. One year later,
the EO was put into practice by virtue of DENR Ad-
ministrative Order No. 1996-29 defining a Commu-
nity-Based Forest Management Strategy (CBFMS) that
entails a 25-year production-sharing arrangement en-
tered into by communities and the government to
sustainably develop, utilize, manage and conserve a
specific portion of forestland. DAO 29-1996 calls for
the submission of resource use plans, annual work
plans and forest management maps by the commu-
nities to the competent authorities for approval and
issuance of relevant permits.
The Third Dimension in Conserving Biodiversity
In June 1992, at the Rio Earth Summit, the Gov-
ernment of the Philippines signed the Convention on
Biological Diversity and adhered to Agenda 21,
thereby endorsing the concepts of conservation
through participatory resource management, and en-
vironmental protection as the basis for sustainable
development. Concurrently, the Philippine Congress
enacted the National Integrated Protected Areas Sys-
tem (NIPAS) Act aimed at conserving biodiversity
through, among others, the full participation of lo-
cal communities.
In this context, the European Union and the Gov-
ernment of the Philippines initiated and co-financed
the National Integrated Protected Areas Programme
(NIPAP), a five- and a half-year (1995-2001) inter-
vention aimed at establishing eight protected areas
within the NIPAS framework. The challenge faced by
the Programme has been how to give due weight to
the interests of local communities in delineating pro-
tected area boundaries, identifying resource-use
zones and formulating policies on and participating
in protected area management.
In 1996, NIPAP started its action research. Pro-
tected area-dependent communities were introduced
to participatory approaches in data collation, analy-
sis and interpretation. Spatial methods such as
transect diagramming and participatory resource
mapping were readily adopted, yet with reservations
about “translating” sketch maps into more precise,
useable information. In 1997, with the objective of
generating durable, true-to-scale and “meaningful-
to-all” information, the Programme developed a
method called Two-Stage Resource Mapping
(Rambaldi et al., 1998) which was pilot-tested in
the El Nido-Taytay Marine Protected Area in
Palawan.
In 1997, PAFID assisted Green Forum-Western
Visayas (GF-WV) - a coalition of NGOs and People’s
Organizations - in adopting GPS, GIS and 3-D mod-
elling. A combination of these three technologies has
since been used by the GF-WV to assist indigenous
communities in applying for tenurial instruments6
,
raising local awareness on outsiders’ interventions
(e.g. large-scale mining operations) and enhancing
community participation in natural resource manage-
ment (Purzuelo, personal communication, 2002).
The issuance of CADCs was suspended in Sep-
tember 1998, but by then, the application of the
DAO resulted in the issuance of 181 ancestral do-
main certificates covering 8.5% of the national ter-
ritory.
In addition the appeal and communication power
of these accurate, well presented maps has been in-
strumental in building public support for the passage
of Republic Act No. 8371, known as the Indigenous
People’s Rights Act (IPRA), which provides indig-
enous groups tenurial rights on their ancestral do-
mains (Alcorn, 2000). The Philippine Congress rati-
fied the Act in October 1997. Article 51 specifies
that self-delineation7
shall be the guiding principle
in the identification and delineation of ancestral do-
mains.
As of the writing of this document, the IPRA law
had limited implementation first because of a peti-
tion8
filed in 1997 before the Supreme Court ques-
tioning its constitutionality, strong opposition made
by the mining and commercial forestry sectors and
low priority attached to its implementation by the
Estrada Administration. With the new administration
in place, several certificates of Ancestral Domain
Title (CADT) are being processed.
The situation has been clarified by the issuance
of a series of Administrative Orders promulgated by
the National Commission on Indigenous Peoples
(NCIP) during the first quarter of year 2002. The re-
cent instruments maintain, among others, the rights
of IPs to self-delineation as spelled out in RA 8371
and call on inter-agency, NGO and community col-
laboration in the delineation of such domains, pro-
vided written authority is granted by NCIP, instru-
ments used are certified by the National Mapping
and Resource Information Authority (NAMRIA) and
the survey is conducted with the participation of a
licensed geodetic engineer.
Additional legislation supporting community-
based natural resources management (NRM) includes
7
Self-delineation implies that designated and trained community
representatives identify and survey, jointly with accredited geodetic
engineers, cultural boundary markers.
8
On December 6, 2000, the Philippine Supreme Court has upheld the
constitutionality of the Indigenous Peoples Rights Act (IPRA) of 1997.
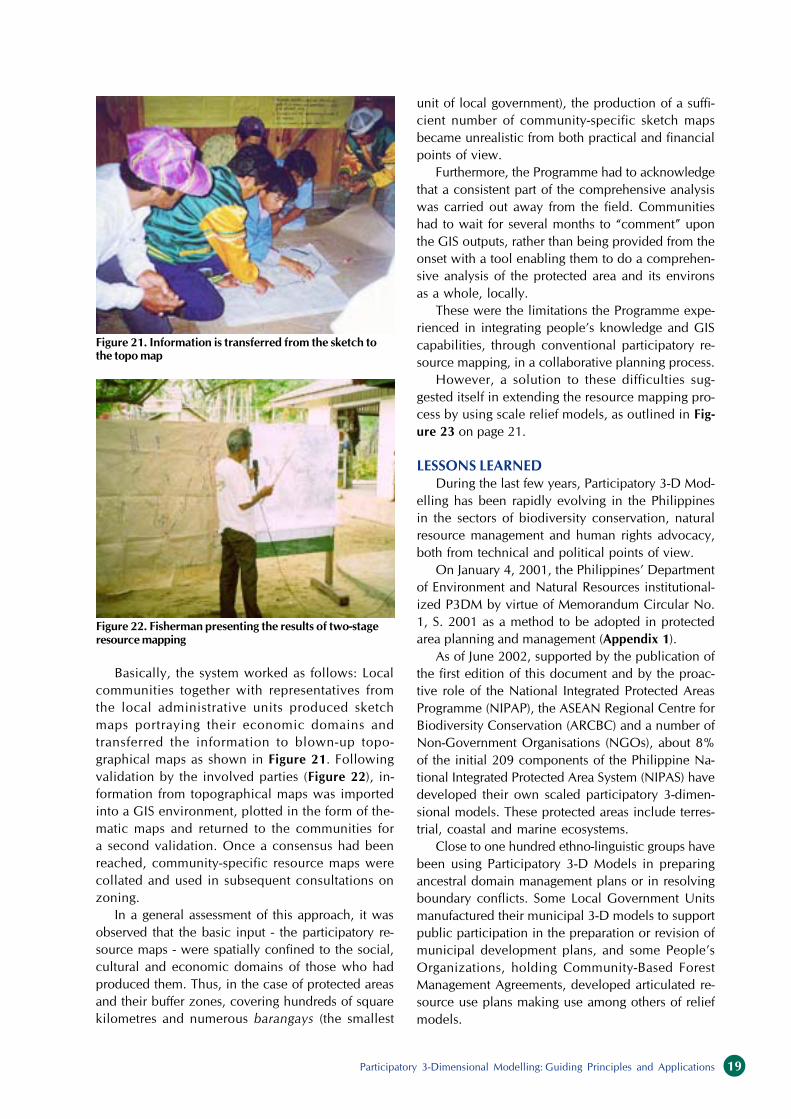
Participatory 3-Dimensional Modelling: Guiding Principles and Applications 19
Basically, the system worked as follows: Local
communities together with representatives from
the local administrative units produced sketch
maps portraying their economic domains and
transferred the information to blown-up topo-
graphical maps as shown in Figure 21. Following
validation by the involved parties (Figure 22), in-
formation from topographical maps was imported
into a GIS environment, plotted in the form of the-
matic maps and returned to the communities for
a second validation. Once a consensus had been
reached, community-specific resource maps were
collated and used in subsequent consultations on
zoning.
In a general assessment of this approach, it was
observed that the basic input - the participatory re-
source maps - were spatially confined to the social,
cultural and economic domains of those who had
produced them. Thus, in the case of protected areas
and their buffer zones, covering hundreds of square
kilometres and numerous barangays (the smallest
unit of local government), the production of a suffi-
cient number of community-specific sketch maps
became unrealistic from both practical and financial
points of view.
Furthermore, the Programme had to acknowledge
that a consistent part of the comprehensive analysis
was carried out away from the field. Communities
had to wait for several months to “comment” upon
the GIS outputs, rather than being provided from the
onset with a tool enabling them to do a comprehen-
sive analysis of the protected area and its environs
as a whole, locally.
These were the limitations the Programme expe-
rienced in integrating people’s knowledge and GIS
capabilities, through conventional participatory re-
source mapping, in a collaborative planning process.
However, a solution to these difficulties sug-
gested itself in extending the resource mapping pro-
cess by using scale relief models, as outlined in Fig-
ure 23 on page 21.
LESSONS LEARNED
During the last few years, Participatory 3-D Mod-
elling has been rapidly evolving in the Philippines
in the sectors of biodiversity conservation, natural
resource management and human rights advocacy,
both from technical and political points of view.
On January 4, 2001, the Philippines’ Department
of Environment and Natural Resources institutional-
ized P3DM by virtue of Memorandum Circular No.
1, S. 2001 as a method to be adopted in protected
area planning and management (Appendix 1).
As of June 2002, supported by the publication of
the first edition of this document and by the proac-
tive role of the National Integrated Protected Areas
Programme (NIPAP), the ASEAN Regional Centre for
Biodiversity Conservation (ARCBC) and a number of
Non-Government Organisations (NGOs), about 8%
of the initial 209 components of the Philippine Na-
tional Integrated Protected Area System (NIPAS) have
developed their own scaled participatory 3-dimen-
sional models. These protected areas include terres-
trial, coastal and marine ecosystems.
Close to one hundred ethno-linguistic groups have
been using Participatory 3-D Models in preparing
ancestral domain management plans or in resolving
boundary conflicts. Some Local Government Units
manufactured their municipal 3-D models to support
public participation in the preparation or revision of
municipal development plans, and some People’s
Organizations, holding Community-Based Forest
Management Agreements, developed articulated re-
source use plans making use among others of relief
models.
Figure 21. Information is transferred from the sketch to
the topo map
Figure 22. Fisherman presenting the results of two-stage
resource mapping

ASEAN Regional Centre for Biodiversity Conservation20
Compared to other ASEAN member countries, the
Philippines has been offering a particularly
favourable legal framework for community mapping,
and 3-D modelling in particular, to take off and to
become key instruments for dialogue between the
public and formal institutions.
In Thailand on the contrary, even though scale
3-D modelling started being used earlier than in the
Philippines, its evolution and impact on natural re-
source governance has been constrained by a num-
ber of factors including the rigid regulatory frame-
work associated with the existing watershed classi-
fications and the absence of a legal basis for com-
munity forestry and land tenure allocation in the
highlands. These factors deeply conditioned the use
to which community-generated maps could be put,
thus narrowing the outreach of Participatory Land
Use Planning (PLUP/P3DM) to localized decision-
making.
Additional factors, which contributed in the
early ‘90s to the stalling of PLUP include limited
access to official large scale (>1:50,000) topo-
graphic maps still under the control of the military
and limited attention paid by the development com-
munity to geo-referenced and scaled people’s
knowledge until the relatively recent spread of Geo-
graphic Information Technologies (GIT), which trig-
gered enormous interest for geo-coded data. In ad-
dition, in the late ‘80s development practitioners
were inclined to adopt PRA sketch mapping tools
rather than venture into more complex and time
consuming scale mapping, particularly because pref-
erence was given to community process and inter-
disciplinary communication, rather than to courses
of action enabling communities to interact effi-
ciently with policy makers.
In recent years, the situation has changed, with
the diffusion of modern Geographic Information
Systems (GIS), low-cost Global Positioning Systems
(GPS) and remote sensing image analysis software,
open access to data via the Internet and steadily de-
creasing cost of hardware. This has resulted in spa-
tial data, previously centrally controlled, becoming
increasingly available on the open market to sec-
tors of society traditionally disenfranchised by
maps.
The situation is likely to rapidly evolve in Thai-
land under recent constitutional and local gover-
nance reforms, and community forestry legislation
currently pending in parliament. Article 46 of the
1997 Constitution recognizes communal rights in
the conservation and use of natural resources, and
spells out that “Communities shall have the right
to preserve and restore the traditional culture,
knowledge and fine arts of the local community and
the nation, and participate in the management,
maintenance, preservation and utilisation of natu-
ral resources and the environment in a balanced
way, as provided by law”. Article 79 further
emphasises the duty of the State to promote and
encourage public participation in the conservation
and use of natural resources.
If enacted, the Community Forestry Bill will trans-
late these articles into practice and give local com-
munities the right to design their own rules govern-
ing the management, use and conservation of por-
tions of forest. In this context, many research and
development workers now believe that the use of 3-
D models, increasingly linked with GIS, will rapidly
expand and gain value in terms of actual natural re-
source governance.
A similar situation is evolving in Vietnam, where
Government is progressively driving towards more
consultative community-based decision-making pro-
cesses and decentralization of powers.
The most important lesson learned with respect
to the analyses done is that the use to which the
physical P3DM outputs can be put, definitely de-
pends on its integration with GIS and GPS facilities
and on the existing regulatory framework. In some
countries, community-mapping initiatives dealing
with land and resource tenure have to be technically
supported by licensed geodetic engineers. Depend-
ing on the purpose of the mapping exercises, these
legal aspects have to be clarified in advance to work
in full respect of the law.
From a technical point of view, the lessons
learned concern the choice of the scale and geo-
graphical scope of the single model as detailed in
Table 1 on page 22 and the necessity to fully inte-
grate Participatory 3-D Modelling with Geographic
Information and Global Positioning Systems to sup-
port initiatives transcending the local contexts and
aiming at establishing a peer-to-peer dialogue among
communities and central institutions, agencies and
projects..

Participatory 3-Dimensional Modelling: Guiding Principles and Applications 21
PARTICIPATORY
3-D MODELLING,
STEP BY STEP
Figure 23. 3-D Modelling and its integration with GIS
Participatory 3-Dimensional Modelling is a pro-
cess that can be used to generate a series of
physical outputs, the information from which
may be stored in a database for use in a Geographic
Information System (GIS).
The basic steps in producing a 3-D model and
derived maps comprise the following:
1. Conducting preparatory work
2. Assembling the blank model
3. Preparing the map key
4. Depicting information
5. Handing over the model
6. Extracting data
7. Digitizing and manipulating data
8. Crosschecking and validating
Each Phase is described in the following sections
of this book.
P3DM’s main function is to generate, through a
collaborative process, spatially defined, geo-refer-
enced and scaled data. This is not the case with most
sketch mapping techniques. Its adoption needs thor-
ough preparation in the procurement of supplies, dis-
cipline in adhering to colour coding and precision
in the conduct of all phases.
Spatial learning, awareness raising; environmental education;negotiation and conflict management, boundary delineation;zoning; land and resource use planning and management;identification of pressure points, resource use pattern; resourcedistribution; etc.
Data storage, PM&E, collaborative land &resource use planning; triangulation withsecondary data from maps, aerialphotographs, satellite imagery, GPS readingsand other sources.
Preparatory Phase
Transposing secondaryinformation
Documentingthe process
Depictingmental maps
Convening and orienting(key) informants
Manufacturing blank3-D Model
Convening & orientingstudent participants
Crosscheckingand validating
Comparing data fromdifferent sources
Plotting thematicmaps
Cartographicprocessing
Digitizing, organizingand editing data
Extracting data fromthe 3-D model
Thematic Maps,GIS and database
information
Thematic Maps,GIS and database
information
ConsultingStakeholders
Sourcing for spatialdata (contours)
Choosingthe Scale
Preparing theBase Map
ProcuringInputs
Mobilizingstakeholders
Preparing thedraft Legend
Preparing theAgenda
PreparingLogistics
Scale 3-Drelief model
P3D
M STEP
B
Y STEP
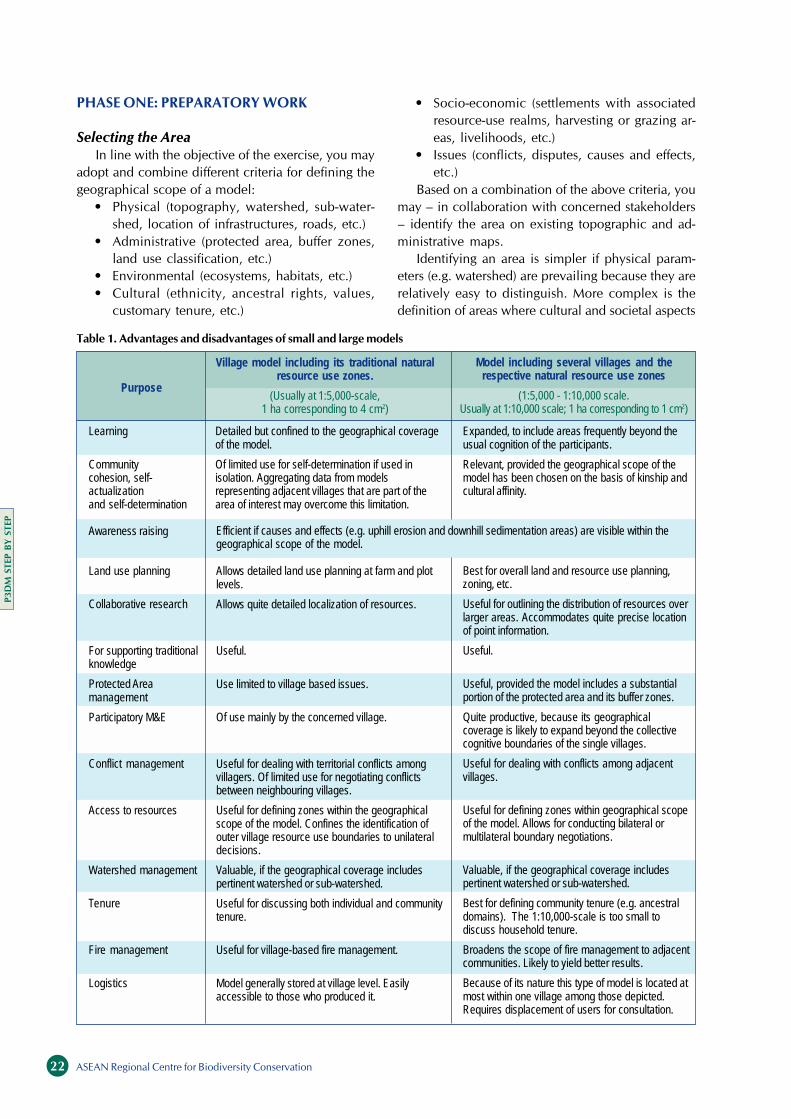
ASEAN Regional Centre for Biodiversity Conservation22
Table 1. Advantages and disadvantages of small and large models
PHASE ONE: PREPARATORY WORK
Selecting the Area
In line with the objective of the exercise, you may
adopt and combine different criteria for defining the
geographical scope of a model:
• Physical (topography, watershed, sub-water-
shed, location of infrastructures, roads, etc.)
• Administrative (protected area, buffer zones,
land use classification, etc.)
• Environmental (ecosystems, habitats, etc.)
• Cultural (ethnicity, ancestral rights, values,
customary tenure, etc.)
• Socio-economic (settlements with associated
resource-use realms, harvesting or grazing ar-
eas, livelihoods, etc.)
• Issues (conflicts, disputes, causes and effects,
etc.)
Based on a combination of the above criteria, you
may – in collaboration with concerned stakeholders
– identify the area on existing topographic and ad-
ministrative maps.
Identifying an area is simpler if physical param-
eters (e.g. watershed) are prevailing because they are
relatively easy to distinguish. More complex is the
definition of areas where cultural and societal aspects
Efficient if causes and effects (e.g. uphill erosion and downhill sedimentation areas) are visible within thegeographical scope of the model.
Village model including its traditional naturalresource use zones.
(Usually at 1:5,000-scale,1 ha corresponding to 4 cm2)
Model including several villages and therespective natural resource use zones
(1:5,000 - 1:10,000 scale.Usually at 1:10,000 scale; 1 ha corresponding to 1 cm2)
Expanded, to include areas frequently beyond theusual cognition of the participants.
Relevant, provided the geographical scope of themodel has been chosen on the basis of kinship andcultural affinity.
Detailed but confined to the geographical coverageof the model.
Of limited use for self-determination if used inisolation. Aggregating data from modelsrepresenting adjacent villages that are part of thearea of interest may overcome this limitation.
Allows detailed land use planning at farm and plotlevels.
Allows quite detailed localization of resources.
Useful.
Use limited to village based issues.
Of use mainly by the concerned village.
Useful for dealing with territorial conflicts amongvillagers. Of limited use for negotiating conflictsbetween neighbouring villages.
Useful for defining zones within the geographicalscope of the model. Confines the identification ofouter village resource use boundaries to unilateraldecisions.
Valuable, if the geographical coverage includespertinent watershed or sub-watershed.
Useful for discussing both individual and communitytenure.
Useful for village-based fire management.
Model generally stored at village level. Easilyaccessible to those who produced it.
Learning
Communitycohesion, self-actualizationand self-determination
Awareness raising
Land use planning
Collaborative research
For supporting traditionalknowledge
Protected Areamanagement
Participatory M&E
Conflict management
Access to resources
Watershed management
Tenure
Fire management
Logistics
Purpose
Best for overall land and resource use planning,zoning, etc.
Useful for outlining the distribution of resources overlarger areas. Accommodates quite precise locationof point information.
Useful.
Useful, provided the model includes a substantialportion of the protected area and its buffer zones.
Quite productive, because its geographicalcoverage is likely to expand beyond the collectivecognitive boundaries of the single villages.
Useful for dealing with conflicts among adjacentvillages.
Useful for defining zones within geographical scopeof the model. Allows for conducting bilateral ormultilateral boundary negotiations.
Valuable, if the geographical coverage includespertinent watershed or sub-watershed.
Best for defining community tenure (e.g. ancestraldomains). The 1:10,000-scale is too small todiscuss household tenure.
Broadens the scope of fire management to adjacentcommunities. Likely to yield better results.
Because of its nature this type of model is located atmost within one village among those depicted.Requires displacement of users for consultation.
P3D
M STEP
B
Y STEP

Participatory 3-Dimensional Modelling: Guiding Principles and Applications 23
are the lead criteria for selection.
As a general rule, all areas that could be the sub-
ject of discussion should be included in the geo-
graphical coverage of the model. This is particularly
relevant where the model is meant to serve defining
or negotiating boundaries. In turn this calls for an
important consideration on the pros and cons (see
Table 1) of expanding the geographical coverage of
the model to include several communities or villages.
Understanding Social Dynamics
As previously stated, you need to have a thorough
understanding of the social dynamics in the area.
When interactive processes bring stakeholders hav-
ing different levels of power and interests together,
both apparent and latent conflicts often become an
issue. Conducting a stakeholders’ analysis (more de-
tails are provided in Appendix 4) and producing a
stakeholders’ map would be of great advantage. The
stakeholder analysis implies doing a preliminary as-
sessment of the different interests at stake and un-
derstanding if these embody latent or open conflicts
and space for mutual cooperation. Such assessment
will guide you in defining the composition of the
groups, which could best collaborate during the pro-
cess.
Groundwork at Community Level
The next step in the Preparatory Phase is to in-
troduce the concept of participatory 3-D modelling
to the various stakeholders as a method that could
help them in implementing actions to address se-
lected problems and aspirations. This interaction
should lead to a consensus on the use to which the
P3DM process is to be put. Particular attention has
to be paid to the existing institutional space, which
would accommodate innovations resulting from the
process. Such decisions should lead to the prepara-
tion of an agenda that will provide the focus for the
P3DM activity. The agenda set for the 3-D model-
ling exercise should be tailored to provide a tangible
contribution to the overall intervention logic.
Organizing the Logistics
Logistical organization includes finding a venue
sufficiently large to allow the community to manu-
facture the model. It may be necessary also to orga-
nize transport, accommodation and catering.
Selecting Participants and Making
Follow-up Arrangements
Essentially there are two types of participants who
can best contribute to the construction of the model.
The first category is made up of students, possi-
bly from locally based institutions dealing with arts
and crafts or sciences. They will be instrumental in
assembling the “blank” model. In doing this, they
will learn a lot about topography and local geogra-
phy.
The second category includes representatives of
those having vested interests in the area, and identi-
fied through the conduct of the stakeholder analysis
as discussed in the section “Understanding Social
Dynamics”. These may include indigenous groups,
various economic sectors (farmers, fishers, tourist op-
erators, etc.), government and non-government
organisations and others. Their participation – par-
ticularly when dealing
with conflicts – may
occur at different stages
of the process.
Each stakeholder
should nominate its
representatives. This is
best done once all
stakeholders have been
thoroughly briefed
about the activity, its
mechanics and poten-
tials in terms of ad-
dressing their problems
or aspirations.
Once the partici-
pants are identified,
you may want to clus-
ter them into smaller
groups on the basis of
residence, economic
endeavour, cultural
affinity, advocacy and
other criteria. Always
ensure that women9
and elders are ad-
equately represented. In order to maximize the
objectivity of the sessions and validity of the out-
put, you have to schedule overlapping sessions.
Gathering Secondary Information
Cheap and easy access to digital contour lines is
a prerequisite for cost-effective Participatory 3-D
Modelling. In the absence of data in this format, con-
tour lines can be digitized from existing maps, but
the costs are relatively high.
An alternative solution, which is a compromise
between cost and quality, is to enlarge topographic
maps by using digital copiers and to eventually
9
Women’s participation may vary, depending on the cultural
background of the participating communities.
Participation is frequently describedas the panacea of all problems, inthe assumption that the mere fact ofpeople getting together wouldgenerate consensus. On thecontrary, enlarged participation maysurface an increased number ofinterests, which may in turn ignitenew conflicts. An inclusiveparticipatory approach (that is theone which brings all relevantstakeholders together) only makessense during the final stages of aconflict cycle (Leeuwis, 2000).
In this respect minority groupsasserting their rights on resources,or struggling for the preservation oftheir cultural identity, may wish tolimit participation in the constructionof the model to participants sharingsimilar concerns and aspirations.This type of focus group action maylead to the preparation of tailoredcommunication means (e.g. maps,written documents, etc.) to be usedfor exerting pressure on or forentering into a dialogue with abroader audience or with selectedinstitutions at a later stage of theprocess.
P3D
M STEP
B
Y STEP

ASEAN Regional Centre for Biodiversity Conservation24
manually re-trace the single contour lines on special
paper. Some practitioners simply use enlarged cop-
ies, a cheaper process done at the expense of accu-
racy.
Additional information that need to be gathered
includes demography, land use, vegetation cover,
resource tenure, existing regulatory framework, and
whatever else might be of relevance to the facilita-
tors to understand the physical, social and economic
characteristics of the area.
The Base Map10
A Matter of Scale
A map or relief model, to be most useful, must
accurately show locations, distances and elevations
on a given base of convenient size. This means that
everything
featured on
the map or
m o d e l
(land area,
distances,
e leva t ion
and so on) must be shown as a proportion to its ac-
tual size. This proportion is the scale of the map (Fig-
ure 24). Scaling exceptions include symbols like lines
and points used to depict e.g. roads, rivers and
households. All these have to be drawn sufficiently
large to be visible.
The scale of a map can be defined simply as the
relationship between distance on the map and the
distance on the ground, expressed as a proportion,
or representative ratio.
This “representative ratio” means that 1 cm on a
map is equivalent to
• 1,000 m on the ground at a 1:100,000-scale
• 500 m on the ground at a 1:50,000-scale
• 200 m on the ground at a 1:20,000-scale
• 100 m on the ground at a 1:10,000-scale
• 50 m on the ground at a 1:5,000-scale
Why do we need to adjust the planimetric scale?
The smaller the scale of a map is, the fewer the
features that can be accommodated. Obviously, there-
fore, the larger the scale the more comprehensive the
map and of more use to the planning process.
Considering that Participatory 3-D Modelling
aims at providing a visual aid capturing the details
of the terrain, the larger11
the scale the better.
The choice of the scale and hence the size of the
model should take account of the need for accuracy
as well as the need for enough space in which to
physically construct and store the model.
The ideal scale for 3-D modelling is 1:10,000 or
larger. If your reference map is at 1:50,000-scale, it
needs to be re-scaled to 1:10,000 to make it suit-
able for the activity. At 1:10,000, one centimetre on
the model corresponds to 100 meters on the ground
- a pretty comfortable scale for people to pinpoint
salient features.
Table 2 demonstrates the simple arithmetic of re-
scaling smaller scale maps (1:50,000, for example),
to larger scale maps (1:10,000), and the relationships
between the physical dimensions of the model to the
geographical area represented by the same.
A number of factors influences the options for re-
scaling.
First, you have to identify and measure the area
you want to reproduce. For your ease, you will se-
lect a rectangular shape. In the case of a protected
area, this will include the core area, the buffer zones
and its environs of ecological, cultural and economic
significance. More details on how to select the geo-
graphical scope of a 3-D model are provided on page
22.
If the core of a protected area is a mountain, the
rectangle will include the downhill catchments and
possibly the settlement areas where most dependent
100 0 100 200 300 400
Meters
Scale 1:10,000
Figure 24. 1:10,000-scale (reference)
10
References on “map reading” are provided in Appendix 3.
11
N.B. 1:10,000 is a larger scale than 1:50,000.
1:50,000 scale 1:25,000 scale 1:10,000 scale
P3D
M STEP
B
Y STEP

Participatory 3-Dimensional Modelling: Guiding Principles and Applications 25
communities reside.
If the core is a lake or coastal area, all catchments
draining into the main water body should be repre-
sented.
This is important for the analytical process, which
usually follows the construction of the model and
whence all those refer-
ring to the model can as-
sess causes and effects.
Having defined the
area of interest, the next
step is to decide on the
scale in which it is to
be reproduced. The
scale should permit the desired level of detail on
a model that is of manageable size.
Scale 1:10,000 is the limit beyond which indi-
viduals start having difficulties in locating point
data (e.g. their household) with precision . This
could be considered as an indicator of the limits
of our mind in establishing spatial relations be-
tween a scaled 3-D model and the real world.
Larger scales (e.g. 1:5,000) allow for quite accu-
rate location and visualization of features. A one-
hectare plot would measure 4 cm2
at a 1:5,000-
scale, a pretty comfortable area to depict single
plots and associated crops. Depending on the pur-
pose of the exercise, 1:20,000 is still manageable,
provided the vertical scale is set at 1:10,000 or
larger to enhance the perception of slope and as-
sist mental data processing by providing better
cues to memory.
The physical size of the model needs to be seri-
ously considered in view of the space needed both
for display, and for storage.
Generally, models are constructed and stored at
the same location. The question of dimension there-
fore, should be defined beforehand with the prospec-
tive caretaker, which could be the local government,
a school, a people’s organisation or others.
Last but by no means least,
the larger the model, the more
time is needed for its manufac-
ture and the more resources
(human and financial) needs to
be mobilised.
The Vertical Scale
For relief models, scaling
has to be applied both horizon-
tally and vertically. The vertical
scale may be the same as the
planimetric one, or differ for the
purpose of exaggerating slopes.
When do we need to adjust the Vertical Scale?
On a 1:10,000-scale relief map, a 1,000-meter
high mountain will be 10 cm tall. To enhance the
visual perception of the ruggedness of the landscape
or to highlight erosion hazards or accessibility, the
vertical scale could be increased, say to 1:5,000, by
maintaining the horizontal.
The concept of vertical scale is closely associ-
ated to the contours because these are the lines
that join points of equal elevation on the earth’s
surface. The smaller the scale, the greater will be
the interval between contours. A 1:1,000,000-scale
map may feature 200-m contour lines, while a
1:10,000-scale map can accommodate up to 4-m
contours. What makes the difference is what we
discussed before: a small-scale map accommodates
less information!
The contour intervals that are shown on maps
depend on the technologies used to generate them.
The closer the intervals, the more accurate the pro-
cess has to be.
Considering the scope of this book, the dis-
cussion will be limited to how to chose the con-
tour interval when manufacturing a scaled relief
model.
What Contour Intervals should we use?
Assuming a 1:10,000 scale (horizontal and verti-
cal), you need to decide what contour interval to use.
Generally, 1:50,000-scale reference maps feature
20-m contours, which conveniently may be applied
to a 1:10,000 model.
If you intend to produce the relief of an island,
which has, for example, the lowest elevation (sea-
bed) at -40 m, and the highest (mountain peak) at
2,400 m above sea level, you would need 122 lay-
ers to reproduce a gradient of 2,440 meters using
20-m contours [(2,440/20)=122]. This would involve
a work group of 12 people to trace, cut and paste
Table 2. Choice of scale: some examples
Make sure that linkedecosystems are visibleon the model (e.g.upland and lowlandtropical forest, man-groves and coral reefs,etc.)
Scale for therefernce map
Total arearepresentedby the model
1:50,000 24 x 48 1:10,000 120 x 240 288 km2
1:50,000 48 x 96 1:10,000 240 x 480 576 km2
1:50,000 40 x 50 1:20,000 100 x 125 450 km2
1:50,000 40 x 50 1:10,000 200 x 250 450 km2
1:50,000 40 x 50 1:5,000 400 x 500 450 km2
1:75,000 40 x 50 1:10,000 300 x 375 1,125 km2
1:100,000 40 x 50 1:10,000 400 x 500 2,000 km2
Size of the selected areaon the reference map
to be represented in theform of a P 3-D Model
(Centimetres)
Selectedscale for theP3-D Model
Size ofP3-D Model(Centimeters)
P3D
M STEP
B
Y STEP
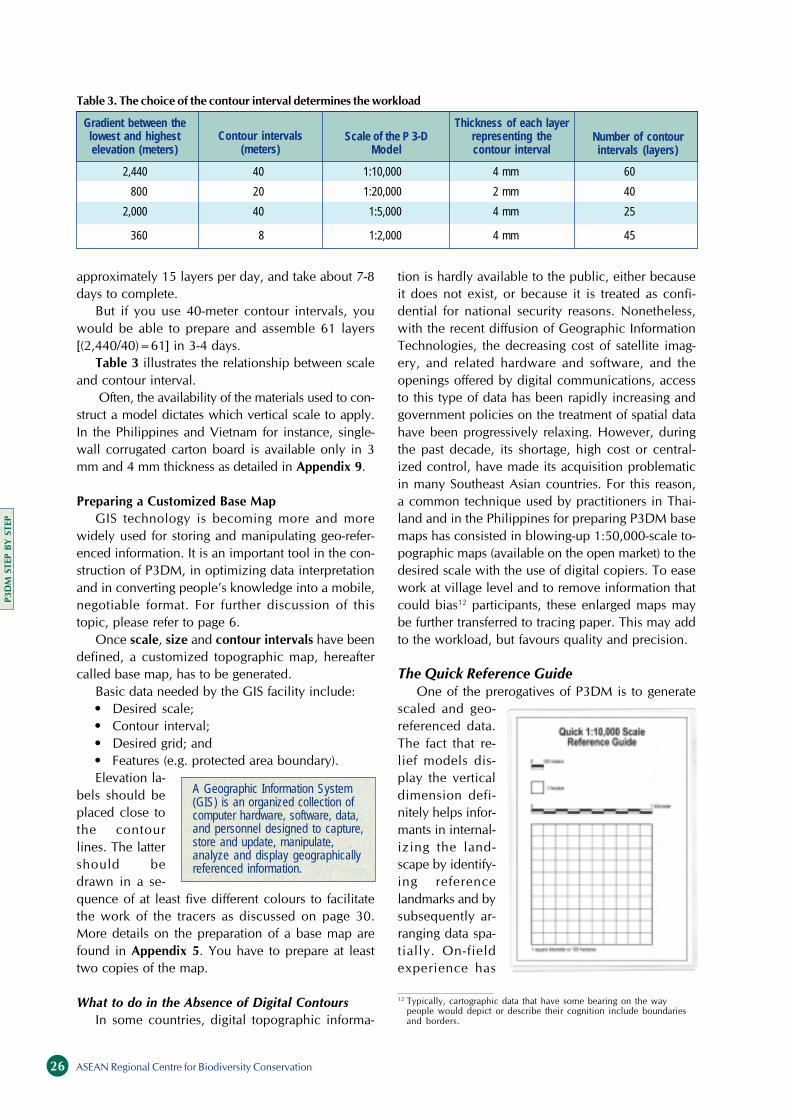
ASEAN Regional Centre for Biodiversity Conservation26
approximately 15 layers per day, and take about 7-8
days to complete.
But if you use 40-meter contour intervals, you
would be able to prepare and assemble 61 layers
[(2,440/40)=61] in 3-4 days.
Table 3 illustrates the relationship between scale
and contour interval.
Often, the availability of the materials used to con-
struct a model dictates which vertical scale to apply.
In the Philippines and Vietnam for instance, single-
wall corrugated carton board is available only in 3
mm and 4 mm thickness as detailed in Appendix 9.
Preparing a Customized Base Map
GIS technology is becoming more and more
widely used for storing and manipulating geo-refer-
enced information. It is an important tool in the con-
struction of P3DM, in optimizing data interpretation
and in converting people’s knowledge into a mobile,
negotiable format. For further discussion of this
topic, please refer to page 6.
Once scale, size and contour intervals have been
defined, a customized topographic map, hereafter
called base map, has to be generated.
Basic data needed by the GIS facility include:
• Desired scale;
• Contour interval;
• Desired grid; and
• Features (e.g. protected area boundary).
Elevation la-
bels should be
placed close to
the contour
lines. The latter
should be
drawn in a se-
quence of at least five different colours to facilitate
the work of the tracers as discussed on page 30.
More details on the preparation of a base map are
found in Appendix 5. You have to prepare at least
two copies of the map.
What to do in the Absence of Digital Contours
In some countries, digital topographic informa-
tion is hardly available to the public, either because
it does not exist, or because it is treated as confi-
dential for national security reasons. Nonetheless,
with the recent diffusion of Geographic Information
Technologies, the decreasing cost of satellite imag-
ery, and related hardware and software, and the
openings offered by digital communications, access
to this type of data has been rapidly increasing and
government policies on the treatment of spatial data
have been progressively relaxing. However, during
the past decade, its shortage, high cost or central-
ized control, have made its acquisition problematic
in many Southeast Asian countries. For this reason,
a common technique used by practitioners in Thai-
land and in the Philippines for preparing P3DM base
maps has consisted in blowing-up 1:50,000-scale to-
pographic maps (available on the open market) to the
desired scale with the use of digital copiers. To ease
work at village level and to remove information that
could bias12
participants, these enlarged maps may
be further transferred to tracing paper. This may add
to the workload, but favours quality and precision.
The Quick Reference Guide
One of the prerogatives of P3DM is to generate
scaled and geo-
referenced data.
The fact that re-
lief models dis-
play the vertical
dimension defi-
nitely helps infor-
mants in internal-
izing the land-
scape by identify-
ing reference
landmarks and by
subsequently ar-
ranging data spa-
tially. On-field
experience has
Table 3. The choice of the contour interval determines the workload
A Geographic Information System(GIS) is an organized collection ofcomputer hardware, software, data,and personnel designed to capture,store and update, manipulate,analyze and display geographicallyreferenced information.
12
Typically, cartographic data that have some bearing on the way
people would depict or describe their cognition include boundaries
and borders.
Gradient between thelowest and highestelevation (meters)
Contour intervals(meters)
Scale of the P 3-DModel
Thickness of each layerrepresenting thecontour interval
Number of contourintervals (layers)
2,440 40 1:10,000 4 mm 60
800 20 1:20,000 2 mm 40
2,000 40 1:5,000 4 mm 25
360 8 1:2,000 4 mm 45
P3D
M STEP
B
Y STEP
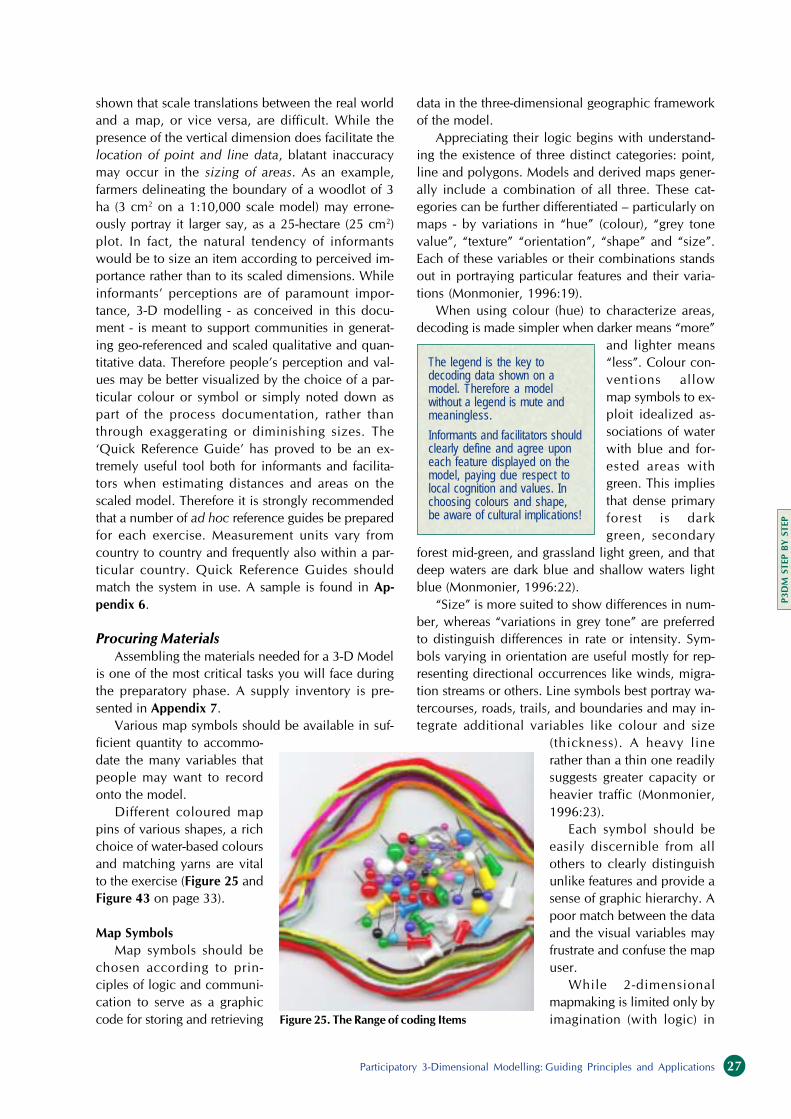
Participatory 3-Dimensional Modelling: Guiding Principles and Applications 27
shown that scale translations between the real world
and a map, or vice versa, are difficult. While the
presence of the vertical dimension does facilitate the
location of point and line data, blatant inaccuracy
may occur in the sizing of areas. As an example,
farmers delineating the boundary of a woodlot of 3
ha (3 cm2
on a 1:10,000 scale model) may errone-
ously portray it larger say, as a 25-hectare (25 cm2
)
plot. In fact, the natural tendency of informants
would be to size an item according to perceived im-
portance rather than to its scaled dimensions. While
informants’ perceptions are of paramount impor-
tance, 3-D modelling - as conceived in this docu-
ment - is meant to support communities in generat-
ing geo-referenced and scaled qualitative and quan-
titative data. Therefore people’s perception and val-
ues may be better visualized by the choice of a par-
ticular colour or symbol or simply noted down as
part of the process documentation, rather than
through exaggerating or diminishing sizes. The
‘Quick Reference Guide’ has proved to be an ex-
tremely useful tool both for informants and facilita-
tors when estimating distances and areas on the
scaled model. Therefore it is strongly recommended
that a number of ad hoc reference guides be prepared
for each exercise. Measurement units vary from
country to country and frequently also within a par-
ticular country. Quick Reference Guides should
match the system in use. A sample is found in Ap-
pendix 6.
Procuring Materials
Assembling the materials needed for a 3-D Model
is one of the most critical tasks you will face during
the preparatory phase. A supply inventory is pre-
sented in Appendix 7.
Various map symbols should be available in suf-
ficient quantity to accommo-
date the many variables that
people may want to record
onto the model.
Different coloured map
pins of various shapes, a rich
choice of water-based colours
and matching yarns are vital
to the exercise (Figure 25 and
Figure 43 on page 33).
Map Symbols
Map symbols should be
chosen according to prin-
ciples of logic and communi-
cation to serve as a graphic
code for storing and retrieving
data in the three-dimensional geographic framework
of the model.
Appreciating their logic begins with understand-
ing the existence of three distinct categories: point,
line and polygons. Models and derived maps gener-
ally include a combination of all three. These cat-
egories can be further differentiated – particularly on
maps - by variations in “hue” (colour), “grey tone
value”, “texture” “orientation”, “shape” and “size”.
Each of these variables or their combinations stands
out in portraying particular features and their varia-
tions (Monmonier, 1996:19).
When using colour (hue) to characterize areas,
decoding is made simpler when darker means “more”
and lighter means
“less”. Colour con-
ventions allow
map symbols to ex-
ploit idealized as-
sociations of water
with blue and for-
ested areas with
green. This implies
that dense primary
forest is dark
green, secondary
forest mid-green, and grassland light green, and that
deep waters are dark blue and shallow waters light
blue (Monmonier, 1996:22).
“Size” is more suited to show differences in num-
ber, whereas “variations in grey tone” are preferred
to distinguish differences in rate or intensity. Sym-
bols varying in orientation are useful mostly for rep-
resenting directional occurrences like winds, migra-
tion streams or others. Line symbols best portray wa-
tercourses, roads, trails, and boundaries and may in-
tegrate additional variables like colour and size
(thickness). A heavy line
rather than a thin one readily
suggests greater capacity or
heavier traffic (Monmonier,
1996:23).
Each symbol should be
easily discernible from all
others to clearly distinguish
unlike features and provide a
sense of graphic hierarchy. A
poor match between the data
and the visual variables may
frustrate and confuse the map
user.
While 2-dimensional
mapmaking is limited only by
imagination (with logic) in
The legend is the key todecoding data shown on amodel. Therefore a modelwithout a legend is mute andmeaningless.
Informants and facilitators shouldclearly define and agree uponeach feature displayed on themodel, paying due respect tolocal cognition and values. Inchoosing colours and shape,be aware of cultural implications!
Figure 25. The Range of coding Items
P3D
M STEP
B
Y STEP

ASEAN Regional Centre for Biodiversity Conservation28
the choice of symbols, 3-D modelling frequently de-
pends on the availability of materials, particularly
push and map pins that generally represent point fea-
tures. Colour-coded yarns and different colour paints
can easily represent lines and polygons.
You have to pay due attention to the cultural and
symbolic language used in the area, including the sig-
nificance of colour and shape. “White” may be as-
sociated with “death” or “purity”; “red” with “dan-
ger” or “happiness”, depending on the cultural back-
ground of the participants.
Once you have properly addressed this prerequi-
site, you should consider that standardization of sym-
bols serves for ready unambiguous recognition of fea-
tures and promotes efficiency in producing and us-
ing 3-D models and maps, and in exchanging and
comparing data. Sometimes 3-D models are manu-
factured at different locations and later on assembled.
In these cases, consistency in the use of codes is es-
sential.
Maps or models sharing a common graphic vo-
cabulary are definitely more powerful in conveying
the intended message and in simplifying decoding.
Appendix 8 provides a guideline for coding data on
participatory 3-D models.
In obtaining materials, you should relate the quan-
tity and shape of pins and other items to the quan-
tity of features that need to be depicted. For example,
you should be aware of the approximate number of
households found in the area. This will guide you
in determining, for example, the number of white
bullet-headed pins required. In the same area, you
may expect to find a number of schools and day care
centres. Make sure that you have enough colour-
coded pins to identify these two items independently.
It is best therefore to make a first assessment of
the features you may encounter in the area of inter-
est before purchasing materials.
To do this, you have to draft a preliminary map
key (legend). This will be revised during the conduct
of the exercise to accommodate additional features
identified by the informants and to fine-tune the defi-
nitions of single items. You will need the draft leg-
end – possibly in collaboration with local stakehold-
ers – as a guide for compiling the procurement list.
Construction Materials
3-D mapmakers around the world have been us-
ing a variety of materials including plywood, corru-
gated or solid carton board, polystyrene sheets and
foam mats to produce scaled relief models. Non-
scaled relief models are frequently made with soil,
sand, concrete, sawdust, papier-mâché and others.
As much as possible, community mapping should
be an environment-friendly exercise. Waste disposal
may become a problem when using non-biodegrad-
able materials like polystyrene or other petroleum
derivates. Both for environmental and handling pur-
poses, corrugated carton board would be the best
solution, provided you could obtain the correct qual-
ity. Ideally, you should avail of either “custom-cut
sheets of single-wall corrugated carton - inner and
Table 4. Features and the means to code and display them
Features
Water bodies (springs and waterfalls); mountain peaks; socialinfrastructures (municipal/district halls, administrative centres, day-carecentres, schools, rural health centres, hospitals, bus stops); culturalplaces (churches, burial caves, cemeteries, sacred areas, etc); touristestablishments; human settlements (households); scenic spots, turtlenesting sites; diving spots; docking sites, and others.
Watercourses; communication ways (roads, bridges, trails); socialinfrastructures (rural water supplies), classifications (e.g. watershedclassifications), boundaries (administrative units, protected area,ancestral domains, land status, areas where destructive methods areemployed, fish breeding and spawning areas; feeding grounds ofendangered species; fishing grounds; features of the seabed like coralreefs differentiated into “intact” and “damaged”, seaweed areas, etc);borders, coordinates (grid).
Water bodies (rivers, creeks, lakes, springs and waterfalls); culturalplaces (cemeteries, sacred areas, etc); tourist establishments; land uses(rice fields, swidden, vegetable gardens, sugarcane and coconutplantations, orchards, reforestation sites, residential areas, resettlementareas, etc.); land covers (different types of forest cover, grassland,brushland, mangrove, etc.); landslides and bare land; and others.
Names, annotations
Displayed by means of
Map and push pins ofdiverse colours, shapes andsizes.
Yarns of different colours.
Acrylic paint – differentcolours.
Text on labels.
Points
Lines
Polygons
Attributes
P3D
M STEP
B
Y STEP
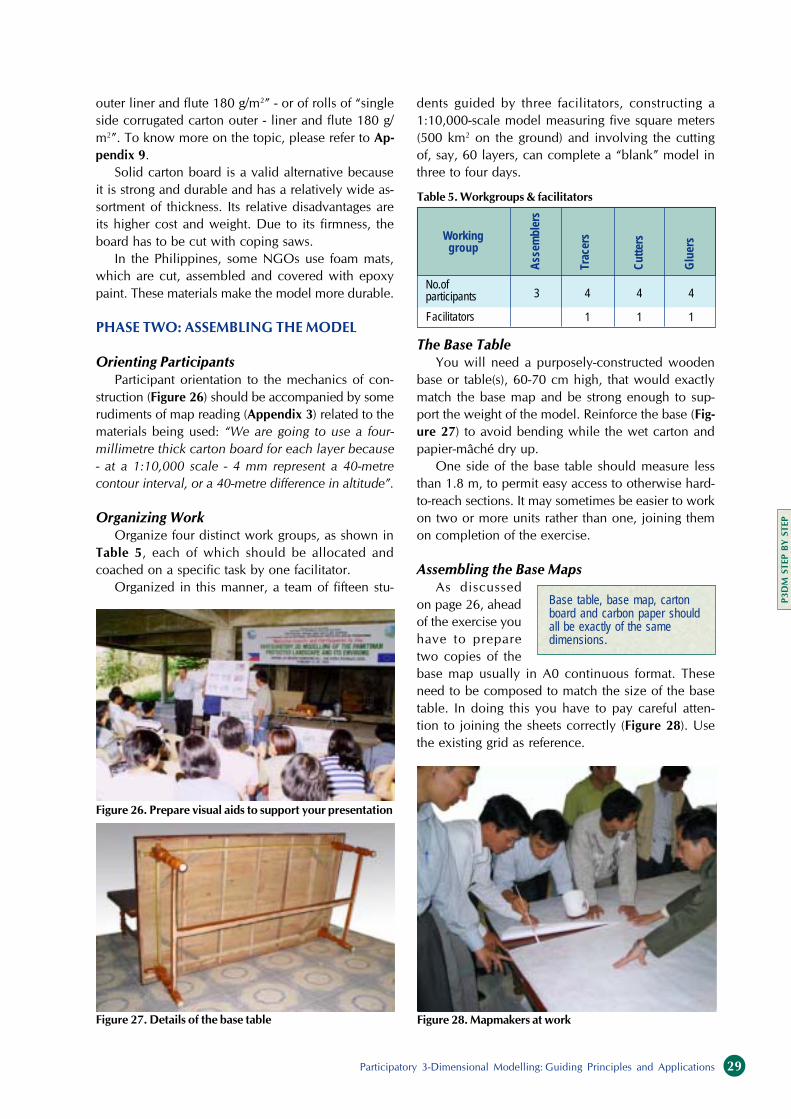
Participatory 3-Dimensional Modelling: Guiding Principles and Applications 29
outer liner and flute 180 g/m2
” - or of rolls of “single
side corrugated carton outer - liner and flute 180 g/
m2
”. To know more on the topic, please refer to Ap-
pendix 9.
Solid carton board is a valid alternative because
it is strong and durable and has a relatively wide as-
sortment of thickness. Its relative disadvantages are
its higher cost and weight. Due to its firmness, the
board has to be cut with coping saws.
In the Philippines, some NGOs use foam mats,
which are cut, assembled and covered with epoxy
paint. These materials make the model more durable.
PHASE TWO: ASSEMBLING THE MODEL
Orienting Participants
Participant orientation to the mechanics of con-
struction (Figure 26) should be accompanied by some
rudiments of map reading (Appendix 3) related to the
materials being used: “We are going to use a four-
millimetre thick carton board for each layer because
- at a 1:10,000 scale - 4 mm represent a 40-metre
contour interval, or a 40-metre difference in altitude”.
Organizing Work
Organize four distinct work groups, as shown in
Table 5, each of which should be allocated and
coached on a specific task by one facilitator.
Organized in this manner, a team of fifteen stu-
dents guided by three facilitators, constructing a
1:10,000-scale model measuring five square meters
(500 km2
on the ground) and involving the cutting
of, say, 60 layers, can complete a “blank” model in
three to four days.
The Base Table
You will need a purposely-constructed wooden
base or table(s), 60-70 cm high, that would exactly
match the base map and be strong enough to sup-
port the weight of the model. Reinforce the base (Fig-
ure 27) to avoid bending while the wet carton and
papier-mâché dry up.
One side of the base table should measure less
than 1.8 m, to permit easy access to otherwise hard-
to-reach sections. It may sometimes be easier to work
on two or more units rather than one, joining them
on completion of the exercise.
Assembling the Base Maps
As discussed
on page 26, ahead
of the exercise you
have to prepare
two copies of the
base map usually in A0 continuous format. These
need to be composed to match the size of the base
table. In doing this you have to pay careful atten-
tion to joining the sheets correctly (Figure 28). Use
the existing grid as reference.
Figure 26. Prepare visual aids to support your presentation
Figure 27. Details of the base table Figure 28. Mapmakers at work
Table 5. Workgroups & facilitators
Base table, base map, cartonboard and carbon paper shouldall be exactly of the samedimensions.
Ass
embl
ers
Trac
ers
Cut
ters
Glu
ersWorking
group
No.ofparticipants
Facilitators
3 4
1
4
1
4
1
P3D
M STEP
B
Y STEP

ASEAN Regional Centre for Biodiversity Conservation30
Once you have completed this exercise, glue
one map on top of the table. The second one is
bonded to a large carbon paper purposely as-
sembled (Figure 29) with the use of staples and
some adhesive tape.
Identify matching landmarks on both maps. Us-
ing a marker, draw a small circle around hills or
mountaintops. Drill holes through the table board,
and punch through the base maps at all selected land-
marks (Figure 30). Hammer the nails or steel bars
of adequate13
length into the holes through the bot-
tom of the table, but allow a maximum protrusion
of 2 cm (Figure 31). This preparatory work is essen-
tial for properly geo-referencing all contour layers.
An alternative method for geo-referencing layers
is discussed on page 32 (Figure 40).
Tracing, Cutting and Pasting
The first group, “the Assemblers”, prepares car-
ton sheets, exactly corresponding to the size of the
Figure 29. The carbon paper is assembled
Figure 30. Drilling landmarks
Figure 31. Table with reference nails
Figure 32. Tracing sandwich
Figure 33. Each contour line is traced on a separate carton
board
13
The length of a nail should be sufficient to guide you until the
placement of the highest elevation contour. Should the length of
available nails be insufficient, than you have to use a steel bar and cut
it at the desired measurement. In other words, for a gradient of 1000
m at 1:10,000-scale you will need a nail of at least 12 cm (10 for the
gradient and 2 for the thickness of the table). For a gradient of 2000
meters at 1:7,500-scale you will need a 30(+2)-cm long steel bar.
P3D
M STEP
B
Y STEP
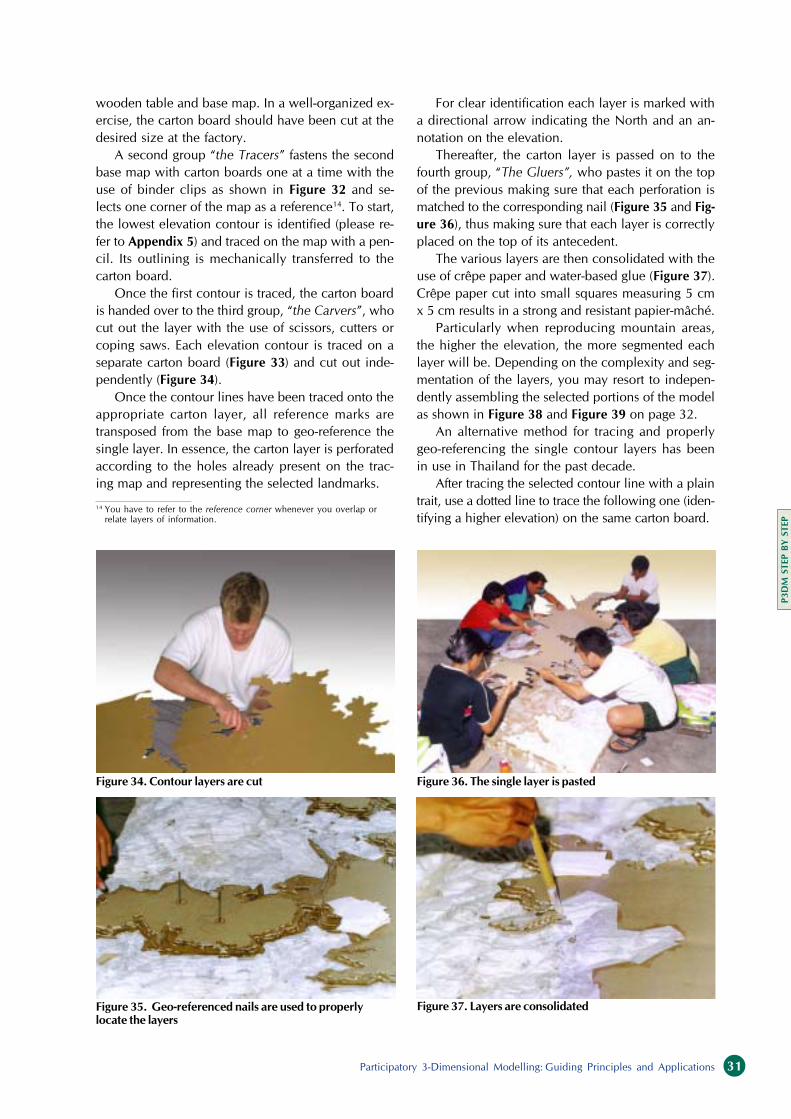
Participatory 3-Dimensional Modelling: Guiding Principles and Applications 31
wooden table and base map. In a well-organized ex-
ercise, the carton board should have been cut at the
desired size at the factory.
A second group “the Tracers” fastens the second
base map with carton boards one at a time with the
use of binder clips as shown in Figure 32 and se-
lects one corner of the map as a reference14
. To start,
the lowest elevation contour is identified (please re-
fer to Appendix 5) and traced on the map with a pen-
cil. Its outlining is mechanically transferred to the
carton board.
Once the first contour is traced, the carton board
is handed over to the third group, “the Carvers”, who
cut out the layer with the use of scissors, cutters or
coping saws. Each elevation contour is traced on a
separate carton board (Figure 33) and cut out inde-
pendently (Figure 34).
Once the contour lines have been traced onto the
appropriate carton layer, all reference marks are
transposed from the base map to geo-reference the
single layer. In essence, the carton layer is perforated
according to the holes already present on the trac-
ing map and representing the selected landmarks.
Figure 34. Contour layers are cut
For clear identification each layer is marked with
a directional arrow indicating the North and an an-
notation on the elevation.
Thereafter, the carton layer is passed on to the
fourth group, “The Gluers”, who pastes it on the top
of the previous making sure that each perforation is
matched to the corresponding nail (Figure 35 and Fig-
ure 36), thus making sure that each layer is correctly
placed on the top of its antecedent.
The various layers are then consolidated with the
use of crêpe paper and water-based glue (Figure 37).
Crêpe paper cut into small squares measuring 5 cm
x 5 cm results in a strong and resistant papier-mâché.
Particularly when reproducing mountain areas,
the higher the elevation, the more segmented each
layer will be. Depending on the complexity and seg-
mentation of the layers, you may resort to indepen-
dently assembling the selected portions of the model
as shown in Figure 38 and Figure 39 on page 32.
An alternative method for tracing and properly
geo-referencing the single contour layers has been
in use in Thailand for the past decade.
After tracing the selected contour line with a plain
trait, use a dotted line to trace the following one (iden-
tifying a higher elevation) on the same carton board.
Figure 35. Geo-referenced nails are used to properly
locate the layers
Figure 36. The single layer is pasted
Figure 37. Layers are consolidated
14
You have to refer to the reference corner whenever you overlap or
relate layers of information.
P3D
M STEP
B
Y STEP
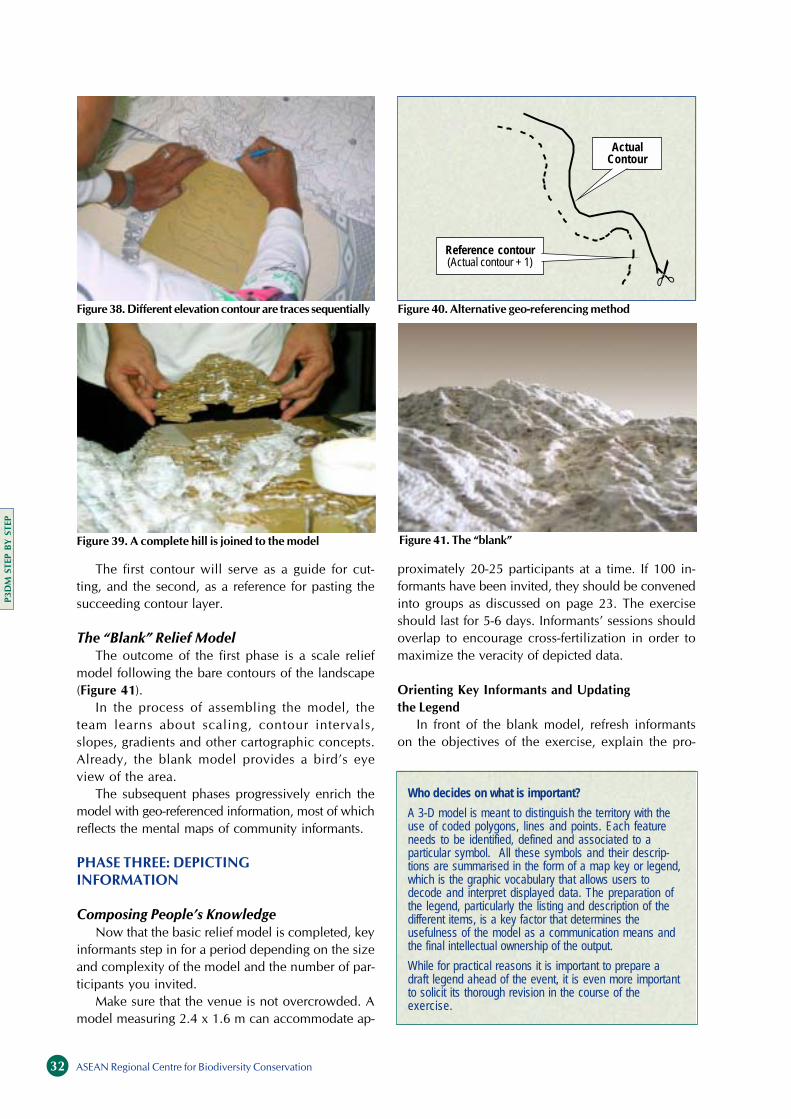
ASEAN Regional Centre for Biodiversity Conservation32
proximately 20-25 participants at a time. If 100 in-
formants have been invited, they should be convened
into groups as discussed on page 23. The exercise
should last for 5-6 days. Informants’ sessions should
overlap to encourage cross-fertilization in order to
maximize the veracity of depicted data.
Orienting Key Informants and Updating
the Legend
In front of the blank model, refresh informants
on the objectives of the exercise, explain the pro-
Figure 40. Alternative geo-referencing methodFigure 38. Different elevation contour are traces sequentially
Figure 41. The “blank”Figure 39. A complete hill is joined to the model
Who decides on what is important?
A 3-D model is meant to distinguish the territory with theuse of coded polygons, lines and points. Each featureneeds to be identified, defined and associated to aparticular symbol. All these symbols and their descrip-tions are summarised in the form of a map key or legend,which is the graphic vocabulary that allows users todecode and interpret displayed data. The preparation ofthe legend, particularly the listing and description of thedifferent items, is a key factor that determines theusefulness of the model as a communication means andthe final intellectual ownership of the output.
While for practical reasons it is important to prepare adraft legend ahead of the event, it is even more importantto solicit its thorough revision in the course of theexercise.
ActualContour
Reference contour(Actual contour + 1)
�
The first contour will serve as a guide for cut-
ting, and the second, as a reference for pasting the
succeeding contour layer.
The “Blank” Relief Model
The outcome of the first phase is a scale relief
model following the bare contours of the landscape
(Figure 41).
In the process of assembling the model, the
team learns about scaling, contour intervals,
slopes, gradients and other cartographic concepts.
Already, the blank model provides a bird’s eye
view of the area.
The subsequent phases progressively enrich the
model with geo-referenced information, most of which
reflects the mental maps of community informants.
PHASE THREE: DEPICTING
INFORMATION
Composing People’s Knowledge
Now that the basic relief model is completed, key
informants step in for a period depending on the size
and complexity of the model and the number of par-
ticipants you invited.
Make sure that the venue is not overcrowded. A
model measuring 2.4 x 1.6 m can accommodate ap-
P3D
M STEP
B
Y STEP

Participatory 3-Dimensional Modelling: Guiding Principles and Applications 33
cess of depicting mental maps and remind them of
the importance of making reference to the legend in
choosing colours and symbols.
Use this opportunity to solicit the revision of
the legend (Figure 42) to include additional fea-
tures relevant to the participants and also to en-
sure that all understand definitions and associated
symbols.
Primary forest is a term that may have a differ-
ent meaning for a scientist, a farmer, or mean noth-
ing at all. You need to establish a common ground
and understanding. Use of local definitions for land
use and land cover and vernacular translations help.
In updating the legend, participants and facilita-
tors have to match the features to be depicted with
the symbols made available (pushpins, yarn and wa-
ter-based paint).
Depicting Mental Maps
A 3-D model offers a convenient scale and for-
mat and users can gain a holistic and shared per-
spective. Maps and models elicit strong alignment
effects and get confusing if improperly oriented. You
thus have to orient the model North-South with the
use of a compass.
As a facilitator, you should arrange and display
all coding means (Figure 43) making sure that each
one is clearly associated with the real-world feature
it is meant to stand for. You may also prepare sev-
eral copies of the legend to be distributed among the
participants.
Recall that in humans, cognitive spatial knowl-
edge is organized and developed through a process
that initially looks for landmarks, thereafter estab-
lishes links between these and, lastly, develops a
broader, encompassing understanding of landforms.
For more details, please refer to page 2. Thereafter
invite informants to locate and name in sequential
order: mountain peaks, islets, water courses, roads,
trails, social infrastructures and other features they
use to orient themselves when moving around
within their domains (Figure 44).
This is a critical process that follows people’s in-
born orientation and learning mechanisms and al-
lows participants to progressively deepen their grasp
of their whereabouts vis-à-vis the model.
Invite informants to delineate with the use of
colour-coded yarns vegetation types, land use, and
other aspects that they consider relevant to their en-
vironment (Figure 45).
Initial contouring of areas using yarn and
dressmaker’s pins instead of immediate painting or
drawing allows informants to negotiate the distribu-
tion, location and extent of any particular feature.
Figure 42. The legend is updated
Figure 43. Coding
means are displayed
Figure 44. Landmarks are identified
Figure 45. Land uses and land cover are identified
P3D
M STEP
B
Y STEP

ASEAN Regional Centre for Biodiversity Conservation34
During this process you should regularly call atten-
tion to the scale of the model. This is best done by
using the Quick Reference Guide as discussed on
page 26.
Once the participants have agreed upon the lo-
cation and extent of single features, they are now
ready to apply wa-
ter-based coloured
paint15
(Figure 46),
according to the
coding system and
remove the corre-
sponding yarns.
After the paint
has dried, invite
the participants to
locate with the use
of colour-coded
pushpins and pa-
per-tags, (Figure
47) the names of locations and administrative units,
households and whatever point data they consider
to be important within their life-world.
This process calls for the concurrent participation
of groups of people from neighbouring locations for
cross-fertilization and data validation.
During the process, participants may add new fea-
tures to the legend. You have to select the appropri-
ate medium (pin, yarn or paint) and colour-code, and
add the definition and the corresponding symbols to
the legend.
The use of a well-articulated coding system al-
lows 3-D models to serve as rudimentary commu-
nity-based Geographic Information Systems (GIS)
accommodating overlapping layers of information
and facilitating analysis of spatially defined data.
Adding Secondary Information
After the informants have completed depicting
their mental maps, crosschecking the data and even-
tually validating them on the field, other features can
be added.
These may include secondary data obtained
through official sources. Boundaries and borders are
cases in point:
Boundaries and Borders
Resource distribution, tenure and access are fo-
cal issues when it comes to management of natural
resources. They are all spatially defined by bound-
aries frequently set (on paper) without undergoing
Figure 46. Water-based colours are applied after validation
Figure 47. Point data are located with the use of colour-
coded pins
Note: Always use lines to depictvirtual and conceptual featureslike national and administrativeboundaries, resource-useareas, zones, tenure, top-downland use classifications andvalues (e.g. sacred forest), andcolour paint to depict real-worldfeatures like land use andvegetation types.Adopting a hierarchicalapproach, participants may usedifferent colour paints todifferentiate crops and onecolour-coded yarn to encom-pass all farmland.
15
In some countries you can buy water-based paint in different colors
off the shelves. Elsewhere, as in Vietnam, you have to buy color
powder and convert it into liquid paint before use. The process is
described in Appendix 2. Figure 48. Group dynamics are enhanced
P3D
M STEP
B
Y STEP

Participatory 3-Dimensional Modelling: Guiding Principles and Applications 35
Figure 49. Boundary negotiation in the Cordillera, Philippines, 2001
Figure 50. The grid is placed with the use of letter/figures
coordinates
Figure 51. Path for marking intervals
Figure 52. The grid is intertwined
proper consultative processes. Adding them to the
model broadens the basis for learning and negotia-
tion making sources of conflicts visible, hence set-
ting the basis to address them (Figure 49).
To add boundaries to the model you have to es-
tablish a spatial relation between reference map (re-
pository of the data) and the relief. This is done by
super-imposing a geo-referenced grid on the top of
the model.
Placing the Grid
For a 1:10,000-scale model it is advisable to use
a 10-cm interval grid, each square corresponding
to 100 hectares or one square kilometre. Grid place-
ment on the model should match the one on the
base map. To ensure correct positioning you have
to measure the intervals starting from the reference
corner shown in Figure 50, proceed as shown in
Figure 51 and use a plumb line where needed. The
grid is intertwined with the use of a strong fine yel-
low thread (Figure 52). The grid should form - as
far as possible - a horizontal plane above the model
by eventually fitting a wooden frame at the edges
of the model.
CorrectIncorrect
Photo by D
ave de V
era, PA
FID
P3D
M STEP
B
Y STEP

ASEAN Regional Centre for Biodiversity Conservation36
Once the grid has been placed (Figure 53), you
can start transferring information from the base
map.
Transposing Data
Latitude and longitude co-ordinates of the
boundary corners are identified on the source
map (Figure 54) making use of its corresponding
grid and transcribed to the relief model (Figure
55).
Each corner is then connected to the next using
a coloured yarn (Figure 55).
Figure 53. Model with 10-cm grid
Figure 54. Coordinates are identified on the base map
Figure 55. Coordinates are replicated on the relief model
Figure 56. Model with visible protected area boundary
Figure 57. Embedded elements of the map key
At the end of this exercise, the boundary is vis-
ible to everyone (Figure 56).
Finishing Touches
The prerequisite of a 3-D Model is that everyone
should understand it.
Therefore once the model is complete, you have
to finalize and layout the legend which should nec-
essarily include both a scale ratio (e.g. 1:10,000)
and a graphic scale. Additional necessary attributes
are a North-labelled arrow and an acknowledge-
ment plate (see Appendix 10). Do not forget to
list the source of information (e.g. origin of the
key informants) and the date at which the model
was last updated. These critical bits of informa-
tion are best printed with the use of a colour
printer, plastic-laminated and later embedded into
the model (Figure 57).
PHASE FOUR: HANDING OVER
OF THE MODEL
A handing over ceremony follows which formally
transfers ownership of this asset to the community.
Unlike other spatial tools, a P3D model is never
completed. Like a living organism, it needs to be nur-
tured by regularly updating and enriching its infor-
mation.
P3D
M STEP
B
Y STEP

Participatory 3-Dimensional Modelling: Guiding Principles and Applications 37
The model has to be entrusted to an entity with
the means and the commitment to safeguard and
maintain it, and to make it accessible to those who
would like to use, update, integrate or correct previ-
ously input data. P3D Models assure that accurate,
meaningful-to-all information is kept among the people
who generated it.
Representatives of concerned stakeholders should
be present at the handing-over ceremony.
For the purpose of monitoring, the custodians of
the model should keep a visitors’ book, where us-
ers would be asked to record their personal particu-
lars, purpose of visit and comments.
PHASE FIVE: EXTRACTING
AND DIGITIZING DATA
Data can now be extracted and entered into a Geo-
graphic Information System. While transferring from
one medium to the other your concern should be mini-
mizing data loss or erroneous geo-referencing.
Those who will be extracting the information
should familiarize themselves with the model as an-
notated in the process documentation. They should
be fully familiar with its attributes summarized in
the legend in the form of scale, symbols and the defi-
nitions used. Stakeholder representatives should par-
ticipate in the extraction process.
So far, two methods have been experimented at
the community level. In both cases, referencing re-
lies on the presence of the grid.
The technique described in the first edition of this
document made use of transparent plastic sheets.
While simple and easily accessible to anybody, the
method carries the risk of generating errors due to
the fact that in most cases the plastic sheets were
not placed on a plane surface, but adhered to the
grid which in turn followed the relief of the model.
Attempts made in placing the grid above the model
on a plane surface by using Plexiglas or a wooden
frame, and later on extracting the information with
the combined use of a laser pen fixed together with
colour-coded markers, proved to be tedious and hurt
the eyes of those involved.
Hence, digital photography combined with on-
screen digitizing has been identified as a promising
way forward.
Digital Photography and
Onscreen Digitizing
To reduce radial and relief displacements, Paral-
lel Camera Movement shooting16
is recommended.
This technique involves moving the camera at a set
distance from an object, such as the 3-D Model, to
capture it in sections.
16
A second technique is called “Panning”. This technique, typically
used to shoot a scenery, involves the camera remaining in one spot
and being panned up or down or left to right to shoot the desired
images.
17
4 meters at a 1:10,000 scale correspond to 40,000 meters. In other
words the model landscape if recorded from a virtual altitude of 40
km. This definitely reduces radial displacement, due to relief to a
minimum.
Each picture should be shot perpendicularly to the
model surface.
A convenient alternative to climbing to the ceil-
ing to take “aerial” photographs is to tilt the model
by 90 degrees.
Place a high-resolution digital camera on a tri-
pod at 4-m distance from the base of the tilted
model17
. Draw lines perpendicular to the model’s
horizontal plane on the floor at 40 cm intervals. Add
a reference line at the end of the orthogonal lines to
serve as guide in moving the camera from one posi-
tion to the following one.
Adjust the focal length setting to capture an
area of approximately 40 cm x 50 cm (see Fig-
Gathering dust?
We came across statements by a few authors that some 3Dmodels were “gathering dust” in a corner of a village withoutbeing used.
A 3-D model is like a book. How many times do we readthe same book? What happens to it after use?
It is shelved and gathers dust until we need it and get backto it.
3-D models are like books, handwritten notes, picturelibraries, maps or even digital files on hard disks. All theseare data repositories and are consulted when the needarises.
What is essential is to be able to decode the displayedgraphic vocabulary, hence the importance ofacknowledgements to know the source of the data, legend,ratio scales, directional arrow and date in order to allowusers to decode and interpret the displayed information andplace it in clearly-identifiable socio-cultural, geographic andhistoric contexts.
P3D
M STEP
B
Y STEP

ASEAN Regional Centre for Biodiversity Conservation38
ure 58). Set the camera to the maximum resolu-
tion (e.g. 2272 x 1704 pixels) and compression ca-
pacity. This setting will provide high quality im-
ages of approximately 2 MB each. The number of
images that can be stored on the Compact Flash-
card depends on its storage capacity. A standard
CF-32M card may contain up to 14 images shot
at these high quality settings. To cover the entire
area of a model measuring 2.5 x 1.2 meters, shoot
at least 24 pictures. Intermediate downloads to a
Figure 60. On-screen digitizing sequence
Figure 59. Sequential shots are takenFigure 58. “Aerial photography”
separate storage device may therefore be necessary.
Position the camera with the use of a plumb line
exactly above the intersection of the orthogonal and
the reference lines. The height of the camera above
ground is chosen and has to be constant throughout
the first passage (Figure 59).
Once you have taken all images and safely stored
them on a computer, you may use them indepen-
dently or merge them using appropriate software.
Merging techniques are generally well described in
�
�
�
�
�
�
P3D
M STEP
B
Y STEP
� �

Participatory 3-Dimensional Modelling: Guiding Principles and Applications 39
the manuals accompanying the software provided to-
gether with professional digital cameras.
The saved image(s) are now in raster18
image for-
mat ready for digital extraction, correction and geo-
referencing. This requires their conversion to vector19
format through onscreen digitizing.
Onscreen digitizing (Figure 60), as opposed to
tablet digitising, is increasingly becoming the
most popular means of creating GIS spatially or-
ganized data. On-screen digitizing captures data
from digital images or scanned maps by using the
mouse instead of the cursor. This allows for cre-
ating map layers by adding labels during tracing.
While the features are still manually traced, and
provided images have been taken at high resolu-
tion, on-screen digitizing grants a higher level of
accuracy because the operator can use the zoom
facility. In addition, on-screen digitizing allows
for editing features when enough information is
available from the image.
Transparent Plastic Sheets for
Tablet Digitizing
In spite of its lower accuracy this basic tech-
nique is still described because it can be of use
to all those who cannot afford to purchase a high-
resolution digital camera and where the relief of
the model is limited. Supplies necessary for this
18
A raster image file is generally defined as a rectangular array of
regularly sampled values, known as pixels. Each pixel (picture
element) has one or more numbers associated with it, generally
specifying a colour, which the pixel should be displayed in.
19
A vector image is generated through a sequence of commands or
mathematical statements that place lines and shapes in a given two-
dimensional or three-dimensional space.
operation include transparent plastic sheets, gen-
erally bought in rolls, overhead marker pens,
scaled ruler, measuring tape, push pins, alcohol,
cotton and one copy of the reference map. The
plastic sheet needs to be cut to a manageable size
(say 0.6-m x 0.6-m). Ahead of actual fieldwork,
a grid matching the one on the base map needs
to be drawn on each sheet using a permanent
marker.
Extraction can start, provided the reference grid
has been placed on the model. Location of the grid
has to be accurate to limit any errors that may be
made in transferring information from one medium
to another. In this process the regular referral to the
base map is helpful.
Place the plastic sheets on top of the model as
shown in Figure 61.
Where islands are concerned, you can trace the
coastline on the plastic sheets directly from the base
map (Figure 62). This eases geo-referencing.
Figure 61. Matching grids
Figure 62. Tracing the coastline
Photo by R
oyce Eustaquio
Photo by R
oyce Eustaquio
P3D
M STEP
B
Y STEP

ASEAN Regional Centre for Biodiversity Conservation40
At least three people are needed for a period of
2-3 days to extract information from a 6-7 m2
model.
Extraction should be done systematically. Points,
lines and polygons are the three features represent-
ing the data. These should be separately transferred
to the plastic sheets.
Accurate documentation is essential. Attributes
(non-graphic information like names, descriptions of
land use and cover, demographic characteristics, etc.)
are associated with single features. An ad-hoc leg-
end is prepared for this.
Those involved in extraction should bear in mind
that the data transferred to the plastic sheets have
to be digitized elsewhere. Therefore, information
contained in the plastic sheets, accompanying anno-
tations and legend must be understandable to other
people as well.
Despite the simplicity of the technology involved
in transferring information from a 3-dimensional to
a 2-dimensional medium, errors and distortions are
inevitable. A major source of error originates from
the perspective of the extractor when tracing infor-
mation onto the plastic sheets. In order to limit dis-
tortions, the extractor should observe perpendicularly
as shown in Figure 63.
Taking pictures of the model still carrying the grid
and the grid references limits errors. Enlarged prints
may serve as visual reference during the tablet-digi-
tizing phase.
The transparent plastic sheets, accompanying leg-
end and colour prints are handed over to the GIS for
digitization (Figure 64), editing, and data storage.
PHASE SIX: DATA ELABORATION
AND MANIPULATION
Information obtained from official and other
sources like administrative and political boundaries,
can be integrated
Attributes are ascribed to points, lines and poly-
gons. The entire output is subjected to cartographic
processing wherein colours, symbols and lines are
chosen to represent the different attributes of the
model.
Customized thematic maps are produced at pre-
determined scales (Appendix 11, 13, 15, 17, 18, 19,
20, 21 and 22).
A legend is prepared and joined to other carto-
graphic information like scale, title, source of infor-
mation (including date), coordinates, directional ar-
row, and others as shown in Appendix 10.
The use of standardized coding in producing the-
matic maps is important for sharing information,
comparing data sets from different sources or data
collected from the same source but at different dates,
especially when 3-D models are used as a means for
conducting Participatory Monitoring and Evaluation
(PM&E).
PHASE SEVEN: FIELD VERIFICATION
GIS translation of the model data can be com-
pared with other existing spatial information, like
maps produced from satellite-interpreted imagery
(Appendix 11 and Appendix 12) or other cartographic
information obtained from institutional sources. Ex-
amples are shown in Appendix 13 vs. Appendix 14
and Appendix 15 vs. Appendix 16.
Inconsistencies between data sets need to be veri-
fied. This should be done by reconvening around the
P3-D Models with a sufficient number of informants
and through community-based on-field investigation.
Philippine experience has shown that cognitive
maps, supplemented by conventional spatial infor-
mation (contours) and some field verification, are not
only accurate but more detailed and more current
than information maintained in official circles as dis-
cussed in Appendix 23..
Figure 63. Looking straight
Figure 64. Data are digitized
Photo by R
oyce Eustaquio
P3D
M STEP
B
Y STEP

Participatory 3-Dimensional Modelling: Guiding Principles and Applications 41
FREQUENTLY ASKED
QUESTIONS (FAQ)
dates a blend of knowledge collated by key infor-
mants. Outsiders may inject additional information
(e.g. aerial photography or satellite imagery) as the
starter for further community-based discussion and
analysis. Field verification done jointly with inter-
ested parties and the use of GPS (in the case of
boundary disputes) may help in resolving disagree-
ments.
How do you deal with the implementation of
the study results?
The purpose of the exercise should be defined
beforehand jointly with the stakeholders’ community.
Participatory 3-D Modelling should not be seen as
an extractive research practice, but as a means to
enhance community-based awareness and develop
analytical skills, by broadening local perspectives.
Therefore - in an ideal world - the outputs (relief
model and thematic maps) should be owned by the
participating stakeholders, who should use them to
fulfil their purpose.
Remember that P3DM has been conceived to be
part of a broader intervention, aimed at full Partici-
pation of people who are in the process of Learning
about their needs and opportunities, and ready to
take Action to address them.
Thus, in order for outsiders to apply this process,
they must fulfil two preconditions: The first is to have
a thorough understanding of the cultural and socio-
economic setting of the area. The second is to have
the ability to support communities in implementing
strategies and actions to follow-up the P3DM pro-
cess.
P3DM has been used so far in Thailand, Vietnam
and the Philippines in the contexts of land use plan-
ning, protected area management and self-determi-
nation. Are there any other situations where relief
modelling has been adopted?
There is worldwide interest in the method.
Updates are available on the Internet at
http://www.iapad.org.
In addition, in order to monitor the adoption of
participatory 3-D modelling and to learn from expe-
rience, a freely accessible web-based database has
been set up for the purpose of sharing experiences
at http://www.iapad.org/database.
Can P3DM be used for reproducing large areas
(e.g. >100,000 km2
)?
Key-informants’ knowledge can be successfully
collated on relief models made at 1:20,000 or bet-
ter at larger scales. It follows that the geographical
coverage of a model is influenced by its final size.
Reducing the scale, to, say 1:50,000, in order to
cover larger areas limits accuracy and the ability of
informants to internalize the model and to transpose
their knowledge. A solution is to produce a series
of models – to be made and displayed at different
locations – each one covering a portion of the de-
sired area. Obviously this process would require
more time and added financial and human resources.
Do participants get paid?
The essence of participatory approaches is the
full participation of people in the processes of learn-
ing about their needs and opportunities, and in the
action required to address them. Informants and
representatives from all stakeholder groups gener-
ally work in a voluntary capacity. Facilitators should
support the costs of transport, lodging and cater-
ing.
How many participants (informants) are
required for a 3-D model?
The number of participants working at one time
should allow everyone to physically access the
model. An overcrowded venue causes distraction and
loss of motivation by the participants. Splitting in-
formants into groups of 20-25 and making provisions
for brief overlapping of groups to allow cross-fertili-
zation and crosschecking would be best.
Who does the community mobilization?
Community mobilizing is one of the most impor-
tant components of the process, which leads to the
construction of a 3-D model. Locally based organi-
zations (NGOs, LGUs, protected area offices, etc.)
best do the job.
How do you deal with conflicting information?
What is the truth? Whose knowledge counts?
These are recurrent questions surfacing while doing
community-based work. A P3D model accommo-

ASEAN Regional Centre for Biodiversity Conservation42
To what extent is P3DM feasible in densely
populated areas?
Densely populated areas can be reproduced in 3-
dimensional format at a scale, which meets the pur-
pose of the exercise. 1:10,000-scale or larger would
suffice to generate household level information.
Densely populated areas are generally located in al-
luvial planes. Small-interval contour lines should be
used to depict as many landmarks as possible. Hori-
zontal and vertical scales should differ to enhance
the perception of slope and evidence landmarks.
How long does it take to complete the process
from community mobilization to the production
of the model and derived digital information?
Depending on available information (including
digital contours, socio-economic, land use, etc.) and
community preparedness: three to four months.
What skills are needed?
The conduct of a Participatory 3-D Modelling ex-
ercise needs the support of a multidisciplinary team
including at least three facilitators covering the fol-
lowing disciplines: geography/cartography/GIS, envi-
ronment, and social sciences.
How much does it cost?
Table 6 summarizes the costs involved in the con-
duct of one P3DM exercise in Vietnam in Novem-
ber 2001. The facilitation cost has not been com-
puted because it varies depending on the resource
persons involved.
Based on the computation, the information
generated in both physical (3-D) and digital for-
mats for a total area of 700 sq. km at 1:10,000-
scale, has cost USD 4.13 USD/km2
or USD 0.04/
hectare.
Other exercises conducted in the Philippines
in 1999 resulted in unitary costs ranging from
2 to 3 USD/km2
due to the fact that neither
pocket money nor translation fees had to be dis-
bursed..Table 6. Cost breakdown – P3DM exercise, Pu Mat National Park, Nghe An, Vietnam.
70,000 ha at 1:10,000 scale - Year 2001
(*) Element of cost not included in the computation because the items are already available as project assets.(**) Element of cost not included in the computation because Project staff conducted the activity as part of the routing project activities (recurrent cost).
Cost ItemP3DM exercise
(USD)
Supplies (including the procurement of digital contours and the preparation of base maps:editing and attributing only) 1,090.00
Transport, 2-day accommodation, food and pocket money for key informants (76 villagers) 800.00
Three days of food for 30 students and teachers 100.00
Translation cost: two interpreters English-Vietnamese and Vietnamese-Thai 500.00
On-screen digitizing and printing of thematic maps (10-14 working days) 400.00
Laptop and Digital Camera (high resolution)(*)
Preparatory activities (procurement, preparation of logistics, meetings, community organizing, etc.)(**)
Facilitation (not included)
TOTAL 2,890.00

Participatory 3-Dimensional Modelling: Guiding Principles and Applications 43
GLOSSARY
Attribute A characteristic of a geographic feature described in numbers or text (e.g. attributes of
a household, represented by a point might include number of household members, age
groups and main source of livelihood).
Base map A map containing geographic features, used for locational reference. Also, the source
map of a P3DM process.
Cognitive maps Cognitive maps are internal representations of the world and its spatial properties stored
in memory (also called mental maps).
Depict Paint or draw, to make a likeness of.
Digitize To encode map features as x, y coordinates in digital form.
Facilitator Someone who brings people together (networking) and catalyzes and/or directs learn-
ing and exchange processes, either in general or around a specific problem area.
Feature classes When referring to map data, feature classes include areas and surfaces (polygons), lines
and points. For example, polygons feature land use and vegetation types; lines roads
and rivers; points households and social infrastructures.
Geo-reference The relationship between page-coordinates on a planar map and known real-world co-
ordinates.
Grid A raster-based data structure composed of cells of equal size arranged in columns and
rows.
Layer A logical set of thematic data described and stored in a map library. Layers organize a
map library by subject matters (e.g. soils, roads, households, land use).
Modelling The act or art of making a model of something; rendering into solid form.
Perception Perception is the active acquisition of knowledge about the self and the world through
the senses.
PLA Participatory Learning and Action (PLA) is an umbrella term for a wide range of similar
approaches and methodologies to involve communities in self-help and development
projects. The common theme to all these approaches is the full participation of people
in the processes of learning about their needs and opportunities, and in the action re-
quired to address them.
Topographic map A map containing contours indicating lines of equal surface elevation (relief) often re-
ferred to as topo maps.
Zoning Dividing an area into zones having different objectives and uses.
GLOSSARY

ASEAN Regional Centre for Biodiversity Conservation44
APPENDICES
Appendix 1. DENR Memorandum Circular No. 1 Series 2001
DENR MEMORANDUM CIRCULAR
NO. 2001- 01
SUBJECT: Participatory 3-Dimensional Modeling as a Strategy in ProtectedArea Planning and Sustainable Natural Resource Management
Pursuant to Chapter IV Section 8 of DAO 25 Series of 1992, DENR CircularNos. 3 and 4 Series of 1993, the Participatory 3-Dimensional Modeling is herebyrecommended as one of the strategies in protected area planning and sustainable naturalresource management.
The Participatory 3-Dimensional Modeling integrates participatory resourcemapping and spatial information to produce a stand-alone and user-friendly scaled reliefmodel which has proven to be relatively accurate for spatial research, planning andmanagement. The model contains information which can be extracted and furtherelaborated by the Geographic Information System.
A Manual on Participatory 3-Dimensional Modeling has been developed forthe guidance of all Regional Executive Directors and concerned Assistant RegionalExecutive Directors.
ANTONIO H. CERILLES
Secretary

Participatory 3-Dimensional Modelling: Guiding Principles and Applications 45
In Vietnam it is hard to find water based acrylic colours. The tendency for artists in general is to use
special power colours and mix them to meet the desired hue.
The following are the necessary ingredients:
Powder glue 115 g
Hot water 500 ml
Colour (in powder) 500 g
Alcohol On demand
Glycerine 75 ml
Mixing equipment 5 litre plastic bucket, egg beater and lidded container.
Preparation:
1. Put the powder glue into the plastic bucket and add hot water. Mix thoroughly.
2. Mix the resulting glue with the colour powder until the colour is completely dissolved. If it is difficult to
dissolve the colour powder or the powder is floating on the top of the glue, add some alcohol. It will
help the ingredients to amalgamate. Alcohol is essential for the preparation of red colour.
3. The consistency of the amalgam is appropriate when white paper is completely covered by a brush
spread of colour.
4. If you plan to keep the colours for a long period you have to store the final colour paint in sealed
containers topped up with glycerine.
Appendix 2. Colour Preparation
Figure 65. Colour preparation
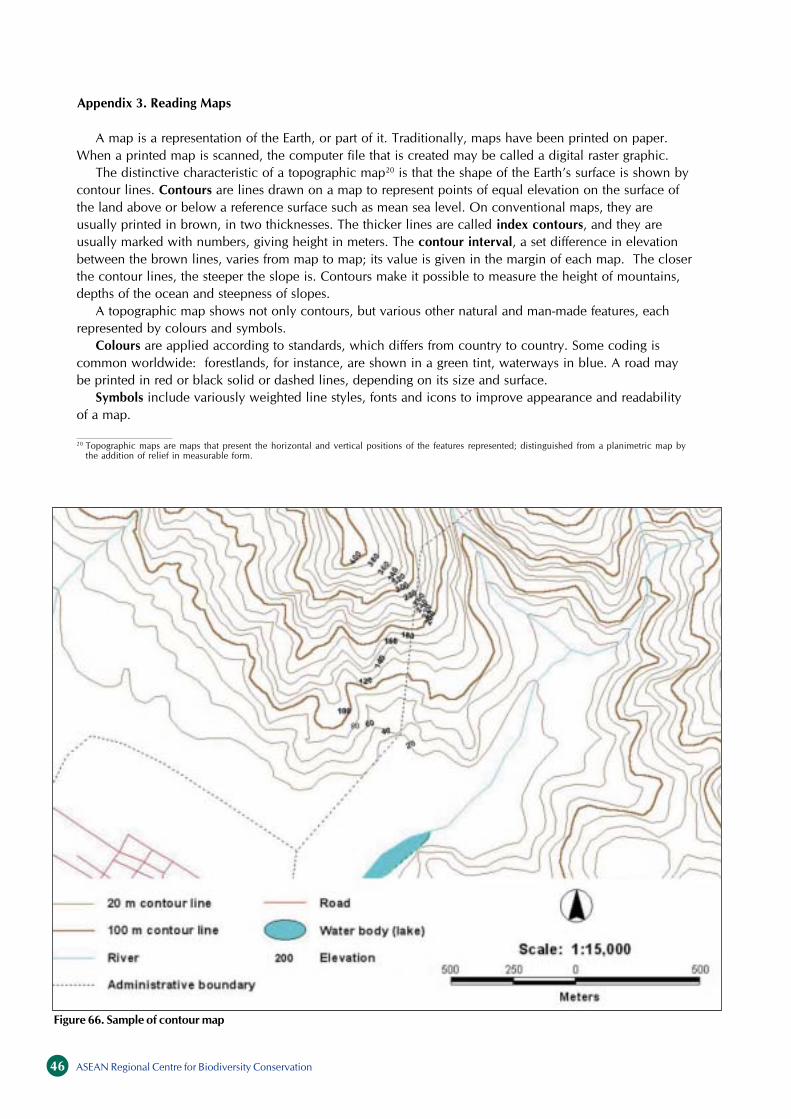
ASEAN Regional Centre for Biodiversity Conservation46
Appendix 3. Reading Maps
Figure 66. Sample of contour map
A map is a representation of the Earth, or part of it. Traditionally, maps have been printed on paper.
When a printed map is scanned, the computer file that is created may be called a digital raster graphic.
The distinctive characteristic of a topographic map20
is that the shape of the Earth’s surface is shown by
contour lines. Contours are lines drawn on a map to represent points of equal elevation on the surface of
the land above or below a reference surface such as mean sea level. On conventional maps, they are
usually printed in brown, in two thicknesses. The thicker lines are called index contours, and they are
usually marked with numbers, giving height in meters. The contour interval, a set difference in elevation
between the brown lines, varies from map to map; its value is given in the margin of each map. The closer
the contour lines, the steeper the slope is. Contours make it possible to measure the height of mountains,
depths of the ocean and steepness of slopes.
A topographic map shows not only contours, but various other natural and man-made features, each
represented by colours and symbols.
Colours are applied according to standards, which differs from country to country. Some coding is
common worldwide: forestlands, for instance, are shown in a green tint, waterways in blue. A road may
be printed in red or black solid or dashed lines, depending on its size and surface.
Symbols include variously weighted line styles, fonts and icons to improve appearance and readability
of a map.
20
Topographic maps are maps that present the horizontal and vertical positions of the features represented; distinguished from a planimetric map by
the addition of relief in measurable form.

Participatory 3-Dimensional Modelling: Guiding Principles and Applications 47
A stakeholder analysis is done to identify all those groups, institutions and individuals having interests
in, control over, derive benefits or suffer consequences from a particular situation which exist or which
may materialize as a consequence of change. The analysis is meant to list these stakeholders, determine
their level of power and relationships. The analysis has to identify local decision-making structures, the
way decisions are made and the holders of relevant specialist knowledge (e.g., resource user groups) and
assess the effects change may have on them.
It could also help identifying those who could help organize P3DM activities and deal with follow-up
arrangements.
A stakeholder analysis is more appropriate than an inventory when the communities affected are
complex and the stakeholders and their relationships to the resources are not easily identifiable. A stake-
holder analysis requires more time and resources than an inventory, since the analysis is usually carried out
in the field and involves participatory exercises (e.g. Venn Diagram) and the collection of new data.
The use of natural resources is typically characterised by diverse and conflicting interests. For instance,
many local communities are socially stratified; knowing the different interests of the various members will
help in organizing their participation in the initiative as well as in developing local resource management
institutions. Undertaking a stakeholder analysis will also provide a frame of reference for further steps in
the initiative and for dealing with various consequences and conflicts which may emerge.
A possible constraint to this exercise is that it requires expertise in social analysis and community
consultation techniques. Undertaking an analysis can also be costly and time-consuming and, as with
inventories, the end product will need to be updated to maintain its relevance to the initiative.
References and recommended readings:
Overseas Development Administration. July 1995. Guidance Note on How to Do Stakeholder Analysis
of Aid Projects and Programmes. Social Development Department Mimeo. London: ODA.
http://www.dfid.gov.uk/AboutDFID/files/sdd/pdf/sddstak1.pdf
Borrini-Feyerabend, 1997. Beyond Fences: Seeking Social Sustainability in Conservation, IUCN, Gland
(Switzerland), 1997. http://www.iucn.org/themes/spg/beyond_fences/beyond_fences.html
Appendix 4. Stakeholder Analysis

ASEAN Regional Centre for Biodiversity Conservation48
Provided digital contours are available the recommended format for the base maps is the following:
• Scale 1:5,000 to 1:10,000
• 20-m contour lines coloured in a recurrent sequence: e.g. brown (100m), blue (120m), green (140m),
purple (160m), black (180m); brown (200m), blue (220m), green (240m), purple (260m), etc.
• Format of the contour lines: 1 pt., except for the “index contours” (100m, 200m, 300m, 400m, etc.),
which should be 2 pt. thick.
• 40-m contours are a valid alternative. The colour sequence could be the following: e.g. brown (0m),
blue (40m), green (80m), purple (120m), black (160m); brown (200m), blue (240m), green (280m),
purple (320m), etc.
• Elevation labels: many, to facilitate the identification the elevation of each contour during tracing. In
addition elevation labels should be placed at all hill- and mountaintops or bottoms of depressions.
• Grid (10 cm = 1 km on the ground for a 1:10,000 scale model). Format: Solid line, black, 1 pt.
• Contour line expressing the lowest elevation: to be identified with a mark, e.g. an arrow. This allows
locating the first contour line to be traced and cut out.
• Administrative boundaries (e.g. national boundary. Format: dashed line - black, 2 pt.)
• Protected Area Boundary. Format: solid line - red, 2 pt.
• Buffer Zone Boundary. Format: solid line - orange, 2 pt.
Appendix 5. How to Prepare a Base Map for 3D Modelling
Figure 67. Example of base map for 3-D modelling
Sample Base Map20 meter Contour Interval Scale 1:10,000
100 0 100 200 300 meters
Start tracingat the lowestelevation
Buffer ZoneBoundary
Protected AreaBoundary
AdministrativeBoundary

Participatory 3-Dimensional Modelling: Guiding Principles and Applications 49
Appendix 6. Referencing, measurement and scaling tools
Appendix 7. Supply list for the manufacture of the relief model of Pu Mat National Park,
Nghe An, Vietnam. Area coverage 700 km2
; scale 1:10,000; year 2001
Model size: two units each measuring 1.4 m x 2.5 m.
2 lit Alcohol 0.67 1.33200 pc Attendance certificates 0.07 13.33
1 pc Banner 32.00 32.001 set Base maps: Editing and attributing contour lines 333.33 333.33
(700 sq km, 1:10,000 scale; 20 m contour interval)4 pc Base maps: Plotting base map on A0 paper (2 copies each) 26.67 106.672 unit Base table (1.4m x 2.5m x 0.6m) plywood (1/4") with reinforcements 26.67 53.333 pc Blade cutter 0.43 1.305 pc Blade for coping saw (steel) 0.33 1.675 pc Blade for coping saw (wood) 0.33 1.67
20 box Blades for above cutters 0.47 9.338 pc Bucket (1 litre capacity) 0.20 1.601 pc Bucket (10 litre) 0.47 0.472 box Carbon paper (hand writing) 2.67 5.336 pc Colour marker, black, blue and red 1.33 8.001 no. Compass 1.33 1.334 pc Coping saw 13.33 53.331 bag Cotton 0.33 0.331 roll Cotton yarn (fine); yellow 0.80 0.80
40 rim Crepe paper (white) 0.50 20.0024 pc Double clip (25 mm) 0.07 1.60
5 box Dressmaker pins 0.67 3.331 pc Egg beater 3.33 3.334 roll Film Kodak ASA 200 (36p) 2.40 9.60
QTYUnit ofmeasure Article Specification
Unit cost(USD)
Total Cost(USD)

ASEAN Regional Centre for Biodiversity Conservation50
4 kg Glue powder 2.67 10.671 pc Hammer 0.60 0.601 kg Hand-knitting yarn no. 8; 18 colours 4.00 4.001 pc Labels (craft paper) 1.67 1.678 no. Laminated north arrow 0.13 1.071 no. Laminated plate (commemorative) 0.13 0.131 no. Laminated plate (legend) 0.13 0.134 series Letters (alphabet) font 72 0.00 0.001 no. Logbook 1.60 1.601 bag (100 pc) Pins (map pins) (13 mm long; 10 mm head; white) 5.00 5.004 bag (50 pc) Pins (map pins) (13 mm long; 10 mm head; yellow, red, green, blue) 2.23 8.932 bag (1000 pc) Pins (map pins) (13 mm long; 4 mm head; white) 5.00 10.001 bag (1000 pc) Pins (map pins) (13 mm long; 4 mm head; yellow, blue, black, red,
violet, white, orange) 5.00 5.000 bag (1000 pc) Pins (map pins) (13 mm long; 6 mm head, white) 7.00 0.00
10 pc Masking tape (2") 0.93 9.333 pc Measuring tape (3 meter long) 1.00 3.001 kg Nails (0.5") 0.67 0.671 kg Nails (2.5") 0.53 0.531 kg Nails (5") 0.53 0.534 series Numbers (1 to 35) Font 72 0.00 0.00
24 kg Office Glue (water based) 1.20 28.802 set Overhead projection markers (six colours) 4.67 9.333 pc Packing tape (2’) 0.33 1.004 pc Painting brush # 0 0.27 1.07
20 pc Painting brush # 10 0.13 2.6720 pc Painting brush # 12 0.20 4.0020 pc Painting brush # 2 0.07 1.3320 pc Painting brush # 7 0.10 2.0020 pc Painting brush 25 mm 0.07 1.33
2 pc Painting brush 63,5 mm 0.27 0.5336 pc Pencil mongol # 2 0.17 6.00
1 pc Pencil sharpener 4.33 4.3350 pc Plastic jar (1 litre capacity) 0.10 5.0010 pc Plastic jar (3 litre capacity) 0.33 3.33
8 pc Plastic-laminated Quick Reference Guide 0.33 2.671 pc Pliers 1.33 1.332 pc Plumb line weight 0.67 1.331 kg Powder colour (black) 1.00 1.001 kg Powder colour (blue) 2.33 2.331 kg Powder colour (brown) 1.00 1.004 kg Powder colour (green) 2.33 9.331 kg Powder colour (light brown) 1.00 1.00
0.5 kg Powder colour (red) 6.67 3.333 kg Powder colour (white) 1.00 3.002 kg Powder colour (yellow-lemon) 2.33 4.671 kg Powder colour (yellow-orange) 2.33 2.331 bag (100 pc) Pins (push pins), (flat head; white) 5.00 5.004 box (100 pc) Pins (push pins), (white) 1.00 4.002 box (100 pc) Pins (push pins), (yellow, blue, black, green, red) 1.00 2.002 pc Scaled ruler 8.33 16.67
10 pc Scissors (for hair cutting) 0.53 5.3318 pc Scissors (small) 0.27 4.80
3 pc Scotch tape (2') 0.33 1.00150 sheet Single-wall corrugated carton (1.4m x 2.5m) sheets. Inner and outer liner 1.30 195.00
175 g/m2, B flute 175 g/m21 box Staple wire #35 0.13 0.131 pc Stapler 1.93 1.93
50 m Transparent plastic sheet (1.2 m wide) 0.50 25.0040 pc Weights (bricks, rims of paper, tiles, pieces of lumber, etc.) 0.00 0.00
TOTAL 1090.77
QTYUnit ofmeasure Article Specification
Unit cost(USD)
Total Cost(USD)

Participatory 3-Dimensional Modelling: Guiding Principles and Applications 51
Appendix 8. Examples of Map Symbols used on Participatory 3-D Models
Point data
Map Pin(head diameter: 5mm)
Feature Push Pin Feature
Single Household
Elementary School
Water Source (1)
Water Source (2)
Forest-related data
Ranger Station
Religious Establishment
Cave
Place name (with label)
Sports field
e.g. wildlife species
Unallocated
e.g. fish species
Unallocated
Unallocated
e.g. plant species
10 Households
High School
Docking Site
Burial ground
Tree Nursery
Protected Area Office
Feature
Unallocated
Unallocated
Diving Site
Unallocated
Unallocated
Scientific research station
Extension station
Market
Unallocated
Map Pin(head diameter: 10mm)
FeaturePush Pin(Flower)
FeatureFlat Pinsaccomodate text
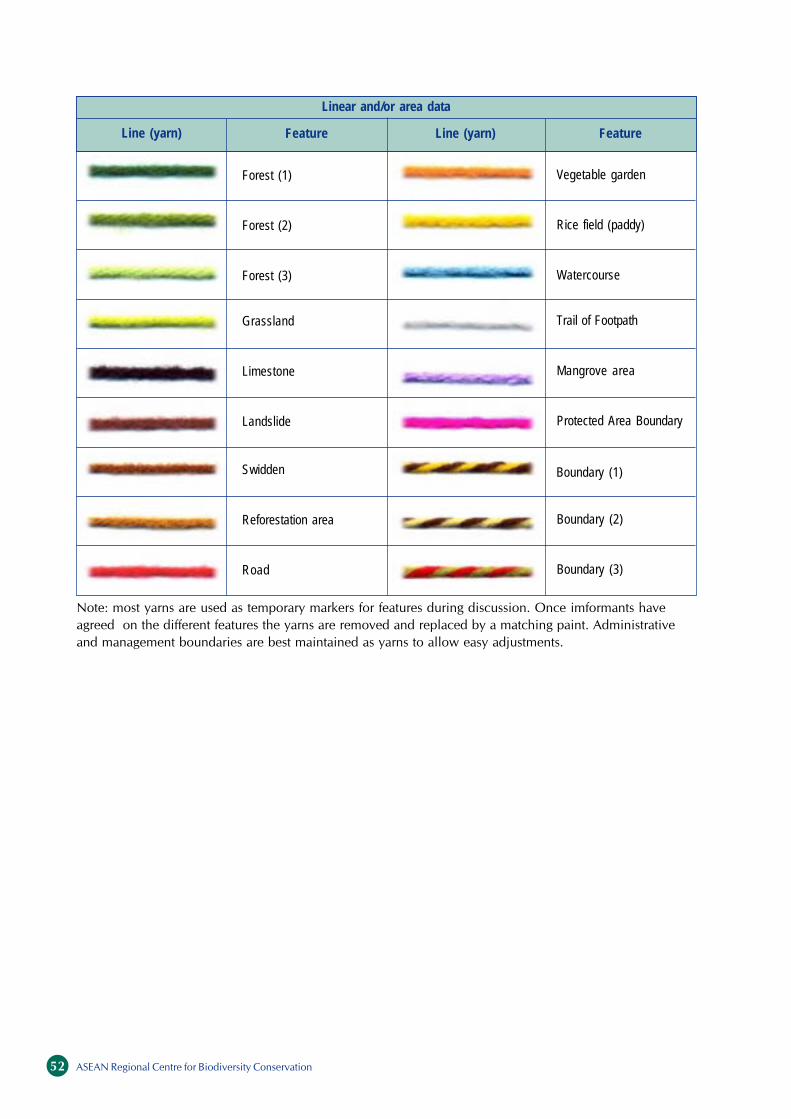
ASEAN Regional Centre for Biodiversity Conservation52
Linear and/or area data
Feature Line (yarn) Feature
Forest (1)
Forest (2)
Forest (3)
Grassland
Limestone
Landslide
Swidden
Reforestation area
Road
Vegetable garden
Rice field (paddy)
Watercourse
Trail of Footpath
Mangrove area
Protected Area Boundary
Boundary (2)
Boundary (3)
Line (yarn)
Boundary (1)
Note: most yarns are used as temporary markers for features during discussion. Once imformants have
agreed on the different features the yarns are removed and replaced by a matching paint. Administrative
and management boundaries are best maintained as yarns to allow easy adjustments.

Participatory 3-Dimensional Modelling: Guiding Principles and Applications 53
Corrugated board is made largely of recycled paper and most commonly comprises three components:
an outer and inner “liner”, (the flat, surface components), and a “corrugating medium”, the “fluting”, which
is glued between the liners. It is this sandwich-type construction that gives corrugated board its excellent
rigidity and structural strength as well as its unique cushioning characteristics.
Over the decades, corrugated board has evolved and developed to provide a wide range of products for
different applications. Standard and non-standard categories of corrugated board are based on the type of
flute, whether coarse, fine or extra fine and the number of fluted walls whether single, double or triple
layered.
For the purpose of 3-D modelling, options include single face-, single wall – and double wall corrugated
board, each of which can be made in a variety of weights and thicknesses.
The standard range includes the coarse ‘A’ and ‘C’ flute, fine ‘B’ and extra fine ‘E’ and ‘F’ flutes. The ‘B’
flute is the most widely used. It is very robust (difficult to crush) and has good compression strength. The
‘C’ flute is larger with greater compression strength but offers less crush resistance and requires more
space.
Single face corrugated board is manufactured in standard widths ranging from 56” to 36”. It is easily
transported in rolls. Its ability to withstand compression (an important factor for the stability of a 3-D
model) is determined by the quality and thickness of the liner and the
corrugating medium. For 3-D modelling, the liner and the corrugating
medium should be at least 185 g/m2
and 150 g/m2
respectively. The best
solution is to request a specially manufactured corrugated board making use of a liner (175 - 185 g/m2
) and
a kraft liner (175 –185 g/m2
).
The thickness of corrugated board (an important dimension in respect to scaling 3-D models) is conven-
tionally measured as detailed in the following Table.
If transport is not a constraint, you may wish to consider procuring single or double wall corrugated
board, making sure that you get the best possible quality in terms of strengths as discussed above.
Provided you order a minimum quantity, depending on the goodwill
of the manufacturer, corrugated board sheets can be cut to the desired
size ahead of the modelling exercise.
In this case, the size of the board should possibly match that of the base table and the base map (see
page 29)
Single and double-wall corrugated boards are classified as detailed in
the following Table and offer additional resistance to compression.
The choice between the various media will depend on their availabil-
ity or the readiness of manufacturers to produce them according to the
desired specifications and to the transport facilities available to haul the material to where the model will
be assembled. Rolls of board are easier to transport, as they can easily fit into the back of a pick up. Large
carton board sheets are necessarily placed on the roof of a vehicle or in a truck you may want to get for this
purpose.
Appendix 9. What 3-D Mapmakers Should Know About Corrugated Carton Board21
tip radius
valleyradius flute
height
pitch
Flute Profile
liner
fluting medium
21
This Appendix has been prepared with the assistance of Dr Martin Oldman, Director, Corrugated Packaging Association Northampton, United
Kingdom. http://www.corrugated.org.uk

ASEAN Regional Centre for Biodiversity Conservation54
Typical Calliper (mm)Standards (i.e. Thickness)
Single-face corrugated board
E Flute 1.1 – 1.8
B Flute 2.1 – 3.0
C Flute 3.2 - 3.9
A Flute 4.0 - 4.8
Single-wall corrugated board
B Flute 2.95
C Flute 3.78
Double-wall corrugated board
EB flute 4.06
BC flute 6.50
CC flute 7.33
Compared to other supplies used for making 3-D models, like polystyrene or other petroleum-derived
materials, corrugated board is environment-friendly, being recyclable and ultimately biodegradable. As a
matter of fact 70% of the board produced each year is made from recycled fibres.
Corrugated board is not made from paper derived from tropical forest hardwoods - they are entirely un-
suitable for the process. In fact the paper industry uses fast-growing softwoods, which are being replanted
faster than they are being used.
Different types of corrugated carton board
Corrugated carton
is a reusable material
made from a renewable
resource.
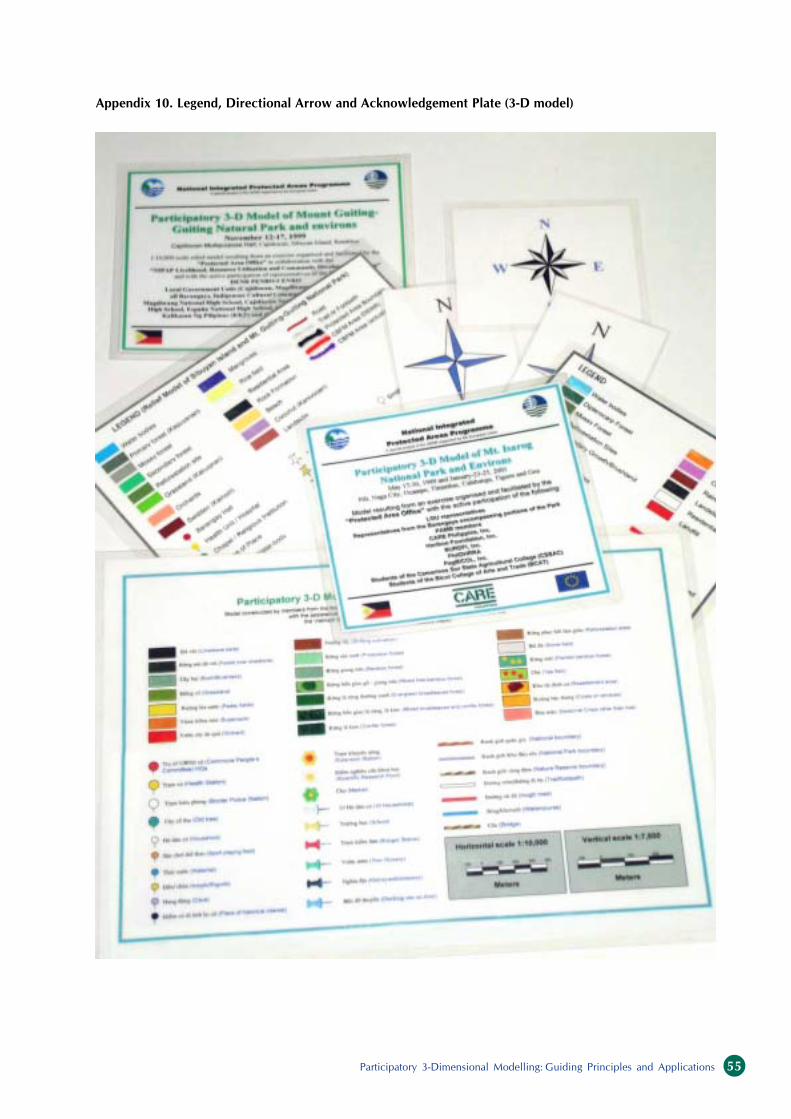
Participatory 3-Dimensional Modelling: Guiding Principles and Applications 55
Appendix 10. Legend, Directional Arrow and Acknowledgement Plate (3-D model)
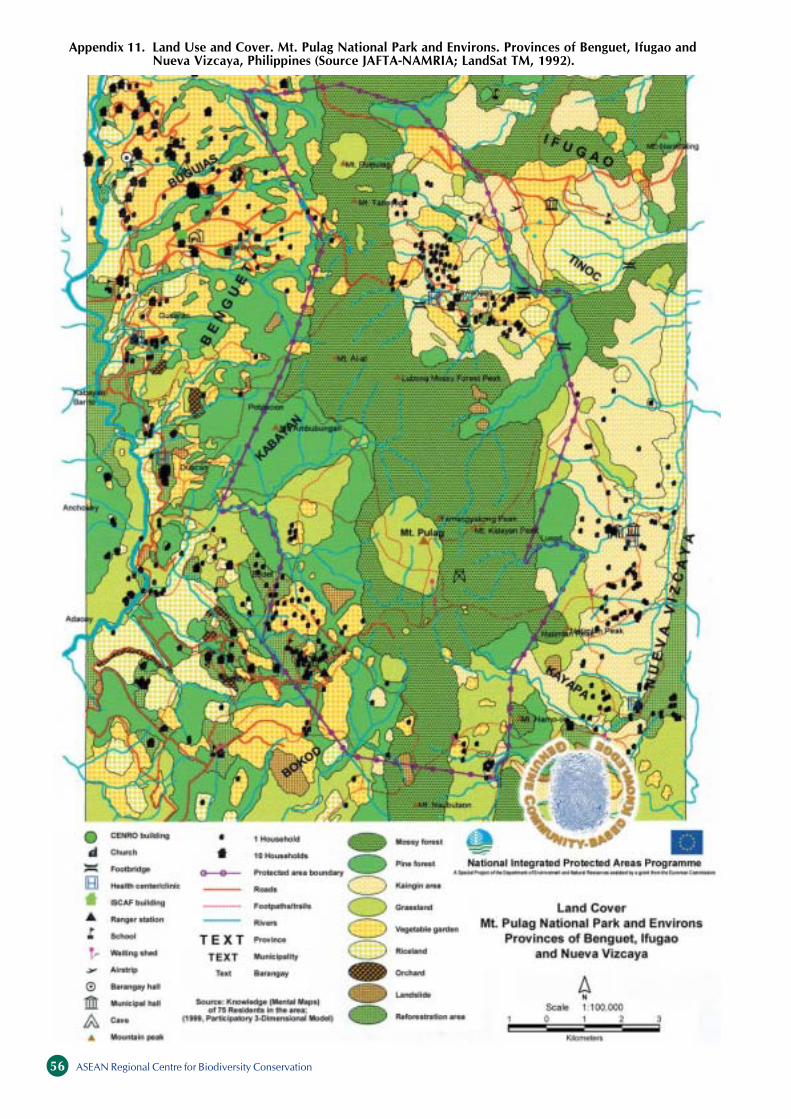
ASEAN Regional Centre for Biodiversity Conservation56
Appendix 11. Land Use and Cover. Mt. Pulag National Park and Environs. Provinces of Benguet, Ifugao and
Nueva Vizcaya, Philippines (Source JAFTA-NAMRIA; LandSat TM, 1992).
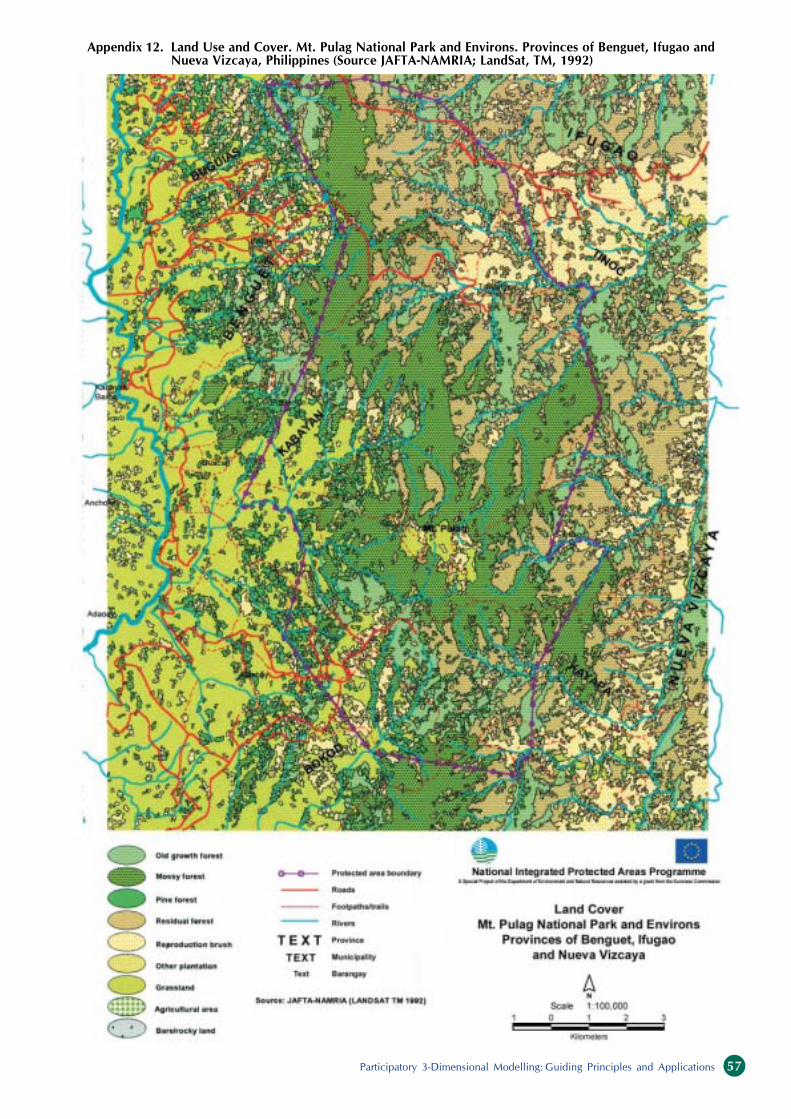
Participatory 3-Dimensional Modelling: Guiding Principles and Applications 57
Appendix 12. Land Use and Cover. Mt. Pulag National Park and Environs. Provinces of Benguet, Ifugao and
Nueva Vizcaya, Philippines (Source JAFTA-NAMRIA; LandSat, TM, 1992)

ASEAN Regional Centre for Biodiversity Conservation58
Appendix 13. Land Use and Cover. Mt. Malindang Natural Park and Environs. Provinces of Misamis Occi-
dental, Zamboanga del Norte and Zamboanga del Sur, Philippines (Source: P3DM 1999)

Participatory 3-Dimensional Modelling: Guiding Principles and Applications 59
Appendix 14. Land Use and Cover. Mt. Malindang Natural Park and Environs. Provinces of Misamis
Occidental, Zamboanga del Norte and Zamboanga del Sur, Philippines (Source: DENR, undated)

ASEAN Regional Centre for Biodiversity Conservation60
Appendix 15. Land Use and Cover. Mt. Isarog National Park and Environs. Province of Camarines Sur,
Philippines (Source: P3DM, 1999)

Participatory 3-Dimensional Modelling: Guiding Principles and Applications 61
Appendix 16. Land Use and Cover. Mt. Isarog National Park and Environs. Province of Camarines Sur,
Philippines (Source: Bureau of Soils and Water Management, date: unknown)
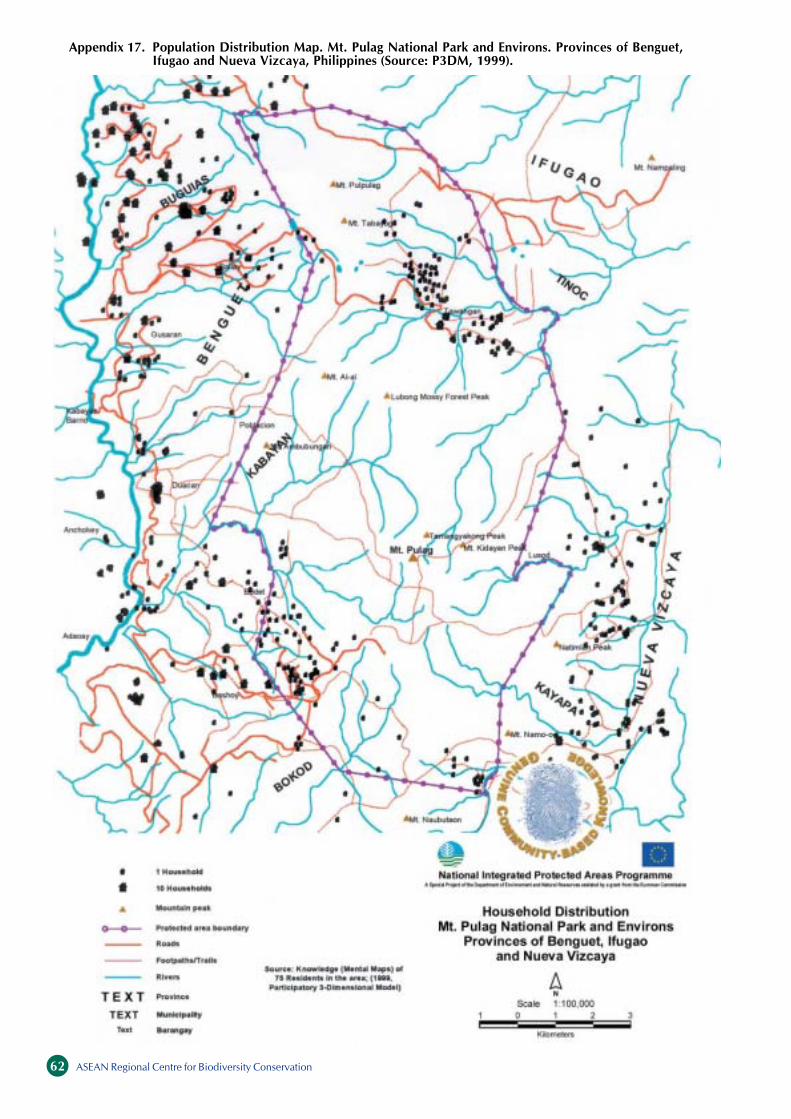
ASEAN Regional Centre for Biodiversity Conservation62
Appendix 17. Population Distribution Map. Mt. Pulag National Park and Environs. Provinces of Benguet,
Ifugao and Nueva Vizcaya, Philippines (Source: P3DM, 1999).
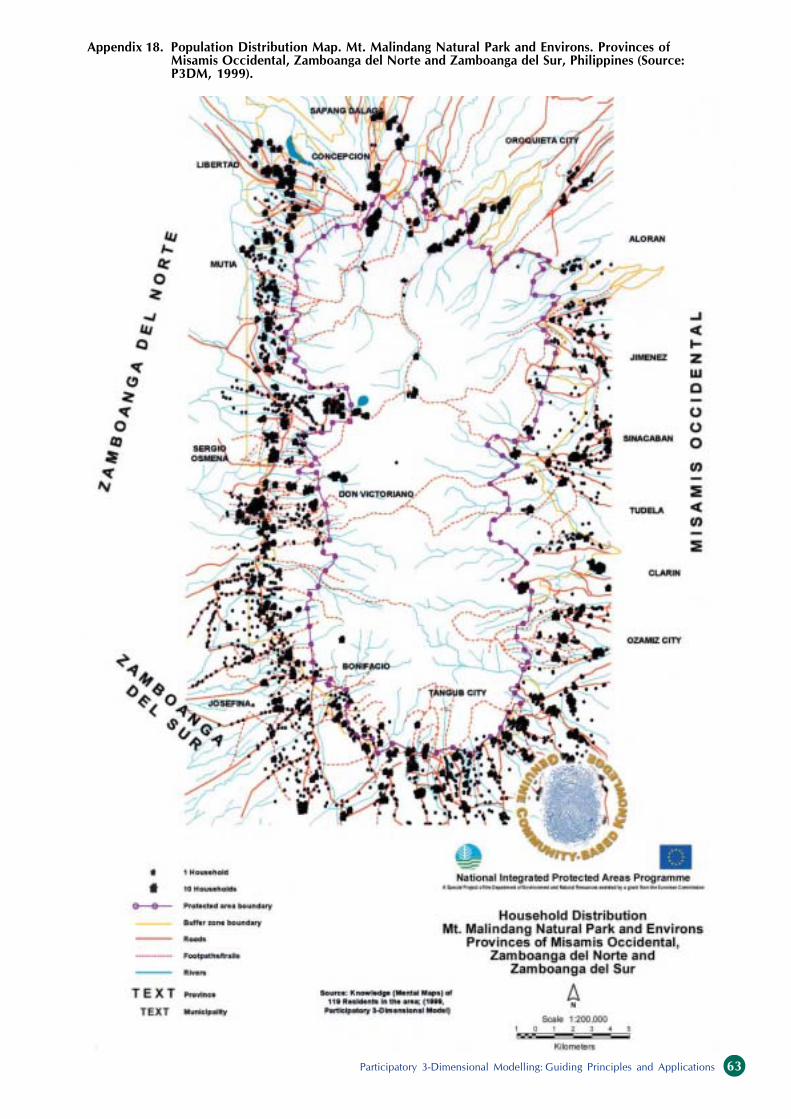
Participatory 3-Dimensional Modelling: Guiding Principles and Applications 63
Appendix 18. Population Distribution Map. Mt. Malindang Natural Park and Environs. Provinces of
Misamis Occidental, Zamboanga del Norte and Zamboanga del Sur, Philippines (Source:
P3DM, 1999).

ASEAN Regional Centre for Biodiversity Conservation64
Appendix 19. Population Distribution Map. Mt. Isarog National Park and Environs. Camarines Sur,
Philippines (Source: P3DM, 1999).

Participatory 3-Dimensional Modelling: Guiding Principles and Applications 65
Appendix 20. Social Infrastructure Distribution Map. Mt. Pulag National Park and Environs. Provinces
of Benguet, Ifugao and Nueva Vizcaya, Philippines (Source: P3DM, 1999).

ASEAN Regional Centre for Biodiversity Conservation66
Appendix 21. Social Infrastructure Distribution Map. Mt. Malindang Natural Park and Environs. Provinces
of Misamis Occidental, Zamboanga del Norte and Zamboanga del Sur, Philippines (Source:
P3DM, 1999).

Participatory 3-Dimensional Modelling: Guiding Principles and Applications 67
Appendix 22. Social Infrastructure Distribution Map. Mt. Isarog National Park and Environs. Camarines
Sur, Philippines (Source: P3DM, 1999).

ASEAN Regional Centre for Biodiversity Conservation68
Appendix 23. Discussion of discrepancies encountered in comparing collective people’s knowledge with
interpreted satellite imagery and other secondary information
Appendices 10-17 show a series of maps of different origin. As part of the validation mechanism, we
compared them using simple means accessible to field staff. The outcome is summarized in two case
studies.
Case 1: Appendix 11, 15 and 17 reflect information extracted from the 1:10,000-scale 3-D model (Yr
1999) of Mt. Pulag National Park. The model (i.e. the map) covers a total area of 360 km2
or 36,000
hectares. Appendix 12 is a land cover map of the same area based on 1992 interpreted satellite imagery.
Case 2: Appendix 13, 16 and 18 represent thematic maps produced on the basis of data contained in a
1:10,000-scale model (Yr 1999) covering an area of 1,176 km2
or 117,600 hectares, including Mt.
Malindang Natural Park. Appendix 14 shows a corresponding map, which has been regularly used by the
Department of Environment and Natural Resources. The source of these data is unknown.
Case 1: Mt. Pulag National Park and Environs
The 3-D model contains 10 different categories of land cover compared to 9 of the satellite-interpreted
information set.
Comparing these categories as a percentage of the total area (360 km2
) yields a remarkable number of
differences. In terms of land use for agricultural purposes, the discrepancy is striking: The JAFTA/NAMRIA
map portrays only 0.4% of the total area as farmland against the 27% provided by people’s knowledge.
This 27% is composed mainly of vegetable farms (67.4%) and rice paddies (32.4%). People’s knowledge is
definitely closer to reality according to ground verification. The inconsistency cannot be explained by
changes in land use that occurred over a period of seven years (1992-1999), because the areas classified as
“grassland” by JAFTA/NAMRIA on the western portion of the map are mainly terraces where rice and
vegetables have been grown since time immemorial. The incorrect classification is probably due to lack of
ground truthing.
Where forest cover is concerned, The JAFTA/NAMRIA derived map (Appendix 12) shows a total forest
cover (mossy, pine, old growth, residual forests) of 56%, compared to a lower percentage (40% including
mossy and pine forests) depicted by key-informants (Appendix 11). Interestingly – in an area known for its
pine forests – JAFTA/NAMRIA identifies only 3.1% of the area as covered with Benguet Pine, compared to
19.2% resulting from the 3-D model.
The people’s perspective has also been extremely useful in providing insights on economic trends. In
fact the description of land use (Appendix 11) instead of land cover (Appendix 12) provides a scenario of
increasing pressure put on the western side of the protected area, due to capital intensive irrigated farming
(rice paddies and vegetable gardens). On the eastern side, slash and burn subsistence farming appears to be
prevailing, representing 11.7% of the whole area (see chart no. 2 “other”). According to people’s knowl-
edge, aside from slash and burn farms, ”other” land uses (17.2%) include landslides (1.1%), orchards
(0.3%) and reforestation areas (4.3%).
JAFTA/NAMRIA attributes 17.6% of the total area to “reproduction brush”, a land cover classification
comparable to slash and burn in terms of land use.

Participatory 3-Dimensional Modelling: Guiding Principles and Applications 69
Comments to Case 1: People’s knowledge appears to be more accurate and useful for collaborative
planning purposes, because it portrays land use rather than land cover. JAFTA /NAMRIA interpretation of
satellite imagery definitely lacks field verification. Therefore, large areas of farmland have been classified as
grassland and existing pine forest more generally as “old growth forest”.
Information extracted from the 3-D model includes household distribution, trails, social infrastructure
(Appendix 17 and 20) and names of landmarks (rivers and mountain peaks), either absent or inaccurately
defined on the JAFTA/NAMRIA or on other ”official maps”.
Pressure points (hot spots) are easily detected on Appendix 11, simply taking into account the protected
area boundary, communication ways, land use and household distribution. The first hot spot is located in
the south-western and the second in the north-eastern corners of the park.
Experience acquired in Mt. Pulag has shown that “pooled people’s knowledge” supplemented by con-
ventional spatial information is more accurate and useful for community-based analysis than information
maintained in official circles.
Case 2: Mt. Malindang Natural Park and Environs
The DENR map (Appendix 14) contains six categories of land cover, half of those (12) contained in the
map produced on the basis of the 3-D model (Appendix 13). Both maps reproduce a total area of 117,600
hectares. In terms of percentage distribution, there is little difference between “forest” cover: 32.5% on the
DENR map and 34.8% on the P3DM map. The latter is more specific in differentiating among Dipterocarp
(25.7%), mossy (0.4%) and secondary forests (8.7%).
However, there are remarkable differences in the quantification of other land use and land cover:
agricultural areas cover 4.1% and 16.1% on the DENR and P3DM maps respectively. Areas described as
coconut plantations amount to 14.5% (DENR map) and 39.8% (P3DM map).
According to the DENR map, shrubs cover 33.4% and grassland 15.5% of the area. These are the areas
of dubious interpretation. Key informants described these as coconut plantations (shrubs on the DENR map)
and rainfed crops (grassland and shrubs on the DENR map).
Appendix 13 and 18 describe the distribution of households. The first one combines different layers of
information and shows an on-going settlement trend (i.e. trail and households) in the north-western portion
of the protected area which could lead, in the short term, to the “ecological” separation of approximately
20% of the protected area. This hot spot is by no means detectable from the map shown in Appendix 14.
The map shown in Appendix 21 shows the distribution of social infrastructures - differentiated by type -
within the protected area and its buffer zones. This precious information - existing only on the P3DM map
– is extremely important when analyzing socio-economic aspects of rural development and inherently
management of the environment.
Comments to Case 2: As in the first case, “pooled people’s knowledge” provides a comprehensive
picture of both the land cover and use. The combination of these features with distribution of settle-
ments, communication ways and social infrastructure provides excellent insights useful for grassroots
planning, awareness raising and participatory monitoring purposes. Also in this case, people’s knowledge
appears to be more useful than what has been used as a reference within Government circles for a long
period of time.
ASEAN Regional Centre for Biodiversity Conservation70
REFERENCES
Abbot, J., et al. 1999. Participatory GIS: Opportunity or Oxymoron? PLA Notes 33: 27-33.
Aguettant, L. J. 1996. Impact of Population Registration on Hilltribe Development in Thailand. Asia-Pacific
Population Journal, Vol. 11, No. 4 (1996), pp. 47-72.
Alcorn, J.B., 2000. Borders, Rules and Governance: Mapping to Catalyze Changes in Policy and Management.
Gatekeeper Series No. 91. IIED.
Anonymous. 1999. National Mapping Division, U.S. Geological Survey.
Baker, M. 1892-94. Relief Maps. Bulletin of the Philosophical Society of Washington 12: 349-367.
Borrini-Feyerabend, G. 1997. Beyond Fences: Seeking Social Sustainability in Conservation, IUCN, Gland (Switzer-
land).
CARE Thailand. 2002. Local Participation in Highland Forest Conservation Project (LAMPOON), Thailand.
Carver, S. 2001. Participation and Geographical Information: a position paper. Position paper presented at the ESF-
NSF Workshop on Access to Geographic Information and Participatory Approaches Using Geographic
Information, Spoleto, 6-8 December 2001.
Castella, J. C. 2001. Mountain Agrarian Systems Program; Bac Kan, Cho Don Province. Personal communication.
Chambers R. 2002. Participatory Numbers: Experience, Questions and the Future. Paper presented at the Confer-
ence on Combining Qualitative and Quantitative Methods in Development Research, Centre for Develop-
ment Studies, University of Wales Swansea, UK. July 1-2, 2002.
Chambers, R. 1983. Rural Development: Putting the First Last. Essex: Longman Scientific & Technical.
Christ, H. and Kloss, D. 1998. Land Use Planning and Land Allocation in Vietnam with Particular Reference to
Improvement of Its Process in SFDP. May 1998. Consultancy Report No. 16. Social Forestry and Develop-
ment Project (SFDP), MARD and GTZ.
Dunn, C. E.; Atkins, J. P. and Townsend G. J. 1997. GIS for Development: a Contradiction in Terms? Area Vol. 29,
No. 2, 151-159.
ESRI. 1995. Understanding GIS, the ARC/INFO Method. Self Study Workbook, Version 7 for Unix and Open VMS,
Environmental System Research Institute, Inc. NY.
Faucherre, N. 1986. Outil Strategique ou Jouet Princier. Monuments Historiques no. 148 (38-44).
GoP.1992. NIPAS Act, (Republic Act No. 7586) and Implementing Rules and Regulations, (DAO 25, S 1992).
Harmsworth, G. 1998. Indigenous Values and GIS: a Method and a Framework. Indigenous Knowledge and
Development Monitor Vol. 6 (3) December 1998.
Imhof, E., Cartographic Relief Presentation, H. J. Steward, (ed.), Berlin and New York: Walter de Gruyter, 1982.
Jantakad, P. and Carson, S. 1998. Community-Based Natural Resource Management from Villages to an Inter-
Village Network: A Case Study in Pang Ma Pha District, Mae Hong Son Province, Northern Thailand.
Paper presented at the International Workshop on Community-Based Natural Resource Management,
World Bank, Washington, USA, May 10-14, 1998.
Leeuwis, C. and Van de Ban, A.W. 2001. Agricultural Extension. Communication for Innovation in Agriculture
and Resource Management. Blackwell Publishers. Oxford. (in print)
Leeuwis, C. 2000. Reconceptualizing Participation for Sustainable Rural Development: Towards a Negotiation
Approach. Development and Change. Vol. 31, 931-957. Institute of Social Studies.
McKinnon, J.M.; Kui, C.; McConchie, J.A.; Ma, H.C.; McKinnon, J.M. 2000: MIGIS -Mobile Interactive GIS [Online]
Available at http://www.geo.vuw.ac.nz/ geography/projects/migis
Mindeleff, C. 1900. Geographical Relief Maps: Their Use and Manufacture. Bulletin of the American Geographical
Society 32:367-380.
Mindeleff, C. 1889. Topographic Models. National Geographic Magazine (July 1889): 254-270.
Monmonier, M. 1996. How to Lie with Maps, second edition. Chicago and London: University of Chicago Press.

Participatory 3-Dimensional Modelling: Guiding Principles and Applications 71
Montello, D. 1997. NCGIA Core Curriculum in GIS, National Center for Geographic Information and Analysis,
University of California, Santa Barbara, USA.
NCIP. 2002. Administrative Order No. 1, 2 and 3. Series of 2002, National Commission on Indigenous People,
Philippines.
Overseas Development Administration. 1995. Guidance Note on How to Do Stakeholder Analysis of Aid Projects
and Programmes. Social Development Department Mimeo. London: ODA.
PAFID. 2001. National Land Tenure for Indigenous People in the Philippines. Terminal Report, PAFID, MISEREOR.
PAWB. 2002. Statistics on Plilippine Protected Areas and Wildlife resources, Protected Areas and Wildlife Bureau
(PAWB).
Pernot, J.F. 1986. L’Histoire des Plans-reliefs. Monuments Historiques No. 148:(24-36).
Perrin, L., La Ville Panoramique, Evolution des Regards Aeriens sur Paris et sa Banlieue. Les Cahiers de l’Laurif n°
120. Imago Metropolis.
Poffenberger, M and McGean B. 1993. Community Allies: Forest Co-Management in Thailand. 62 pp. Berkeley,
CA: Center for Southeast Asia Studies, University of California.
Poiker, T. and Sheppard E. 1995. GIS and Society. Cartography and Geographic Information Systems, special issue 22 (1).
Polonovski M. 1998. Les Plans-relief entre Perfectionisme et Imprecision. Monumental No. 21:(33-39).
Poole, P.1995. Indigenous Peoples, Mapping and Biodiversity Conservation: An Analysis of Current Activities and
Opportunities for Applying Geomatics Technologies. Biodiversity Support Program (BSP). Reference No.:
15. Corporate Press.
Pretty, J. N.1995. Regenerating Agriculture. Policies and Practice for Sustainability and Self-Reliance. London:
Earthscan Publications Ltd.
Rambaldi, G.; Bugna, S.; Tiangco A. and de Vera D. 2002. Bringing the Vertical Dimension to the Negotiating
Table. Preliminary Assessment of a Conflict Resolution Case in the Philippines. ASEAN Biodiversity, Vol.
2 No. 1
Rambaldi, G and Callosa-Tarr, J. 2001. Participatory 3-D Modelling: Bridging the Gap between Communities and
GIS Technology. Paper presented at the International Workshop “Participatory Technology Development
and Local Knowledge for Sustainable Land Use in Southeast Asia”, 6-7 June 2001, Chiang Mai, Thailand
Rambaldi, G. and Callosa-Tarr, J. 2000. Manual on Participatory 3-D Modeling for Natural Resource Management.
Essentials of Protected Area Management: Vol. 7. National Integrated Protected Areas Programme.
European Commission, DENR, Quezon City, Philippines.
Rambaldi, G.; Mendoza, M. and Ramirez, F. 2000. Adding the Fourth Dimension to Participatory 3-D Modelling,
PLA Note 39:19-24, IIED, London, UK.
Rambaldi, G.; Fernan, M.L. and Siar, S. 1998. Resource Mapping in Participatory Methods in Community-based
Coastal Resource Management, Vol. 2: 222-235. International Institute of Rural Reconstruction, Silang,
Cavite, Philippines.
Robert, G.L.; Carson, S.P.; Karnchanomai, P. and Chamchong, C. 1990. Sam Mun Highland Development Project
AD/THA/86/334. Report of the Evaluation Mission. UNDP and UNFDAC.
SFDP-GTZ. 1999. Guidelines on Participatory Land use Planning and Land Allocation Applied at Commune Level
in Son La Province, Vietnam. GTZ / GFA Social Forestry Development Project Song Da.
Siestrunck, R. 1980. Plans Reliefs at Aquarelles; in Cartes et Figures de la Terre. Pages 275-277. Paris, Centre
Georges Pompidou.
SM-HDP. 1998. Final Report, Doi Sam Mun Highland Development Project, AD/THAI 86/334-335, 1987-1994,
Chiang Mai, Thailand.
Srimongkontip, S. 2000. Building the Capacity of Watershed Networks to Resolve Natural Resource Conflicts:
Field experiences from the CARE Thailand Project, Asia-Pacific Community Forestry Newsletter, Vol. 13:2.
Tan-Kim-Yong, U.; Limchoowong S. and Gillogly K. 1994. Participatory Land Use Planning: A Method of Imple-
menting Natural Resource Management. Paper presented at the UNDCP-ONCB Seminar “Two Decades
of Thai-UN Cooperation in Highland Development and Drug Control: Lessons Learned-Outstanding
Issues-Future Directions”. Chiang Mai, 1994.

ASEAN Regional Centre for Biodiversity Conservation72
Tan-Kim-Yong, U. 1992. Participatory Land Use Planning for Natural Resource Management in Northern Thailand,
Rural Development Forestry Network. Network Paper 14b.
TG-HDP. 1998a. Review of TG-HDP’s Agricultural and Forestry Programmes with Special Reference to Commu-
nity Based Land Use Planning and Local Watershed Management (CLM), Internal Paper No. 212, Vol. 1.
TG-HDP. 1998b. Case Studies of Experiences in Implementing Community-based Land Use Planning and Local
Watershed Management and Sustainable Farming Systems (1984-1998). Internal Paper No. 212, Vol. 2.
TUSFP. 1989. Thailand Upland Social Forestry Project, Phase I, 1 July 1987-31 December 1989; Final Report.
RFD, Ford Foundation.
Tversky, B. and Lee, P.U. 1999. Pictorial and Verbal Tools for Conveying Routes. Conference on Spatial Informa-
tion Theory (COSIT) 1999:(51-64).
UNWMP. 1998. Project Implementation Plan Upper Nan Watershed Management Project; Royal Forest Depart-
ment, Nan, Thailand.
Walpole, P., Braganza G., Ong J., Vicente C. 1994. Upland Philippine Communities: Securing Cultural and
Environmental Stability. Environmental Research Division, Manila Observatory.
Weiner, D.; Harris, T. and Craig, J.W. 2001. Community Participation and Geographic Systems. Paper presented at
the “ESF-NSF Workshop on Access to Geographic Information and Participatory Approaches Using
Geographic Information”, Spoleto, 6-8 December 2001.
Weiner, D and Harris, T. 1999. Community-Integrated GIS for Land Reform in South Africa. Research Paper 9907,
West Virginia University. http://www.rri.wvu.edu/wpapers/1999wp.htm
ISSN: 1655-0471 9 [Adobe Portable Document
Format (PDF) format]
• Manual: Manual on Participatory 3-D Modelling for
Natural Resource Management, September 2000.
ISBN: 971-8986-21-9 [Adobe Portable Document
Format (PDF) format]
• Movie: “Giving Voice to the Unspoken”: a 20-minute
video production showing the hands-on aspects of
3-D modelling. [MPEG format]
• P3DM Tools: A selection of ready to use scaling and
referencing tools. [JPG and PDF formats]
• Image Collection: carefully selected images of coding
means (pins and yarns), which will help you in
preparing the legend of your 3-D models. [JPG
format]
Instruction for Use
Insert the disk in the CD Drive of your PC. If the auto-
run feature of your system is disabled, you can launch
the CD by double-clicking on the “autorun.exe”
application.
Best Viewed with
200 MHz Pentium Pro®
CPU or faster.
32 MB RAM.
Windows®
95/98 or higher.
An active Internet connection would allow you to
fully access all functionalities (optional).
Note for viewing the movie: Once Windows Media
Player®
has been launched, select [View] and from the
drop-down menu [Full screen].
Note for opening Adobe PDF files you need Adobe
Acrobat Reader®
version 3.0x or higher. At your discretion
you may install version 5 directly from the CD.
Your Companion CD
The accompanying CD-ROM contains a Multimedia
P3DM Resource Kit, which can support you in
organising and implementing Participatory 3-D
Modelling exercises.
The CD includes the following:
• Resource Book: Participatory 3-D Modelling:
Guiding Principles and Applications, July 2002;
ISBN: 971-8986-47-2. [Adobe Portable Document
Format (PDF) format]
• Magazine: GIS and the Fingertips; ASEAN
Biodiversity Vo. 2, No. 1, March 2002
ASEAN Regional Centre
for Biodiversity Conservation
(ARCBC)
P.O. Box 35015 College, Laguna 4031
Philippines
www.arcbc.org.ph