participatory digital map- making in arid areas of …pubs.iied.org/pdfs/g03659.pdf · l...
TRANSCRIPT

5151
Background and contextPastoralists have long used their extensiveand detailed knowledge of arid and semi-arid environments to maximise livestockproductivity and minimise asset loss(Krätli and Schareika, 2010). Scatteredand variable rainfall, characteristic of aridand semi-arid lands (ASALs), means thatpasture, particularly grasses, are availablein different places at different times.Because the nutritional quality of plantschanges during their growing cycle, theavailability of nutritious pastures in theASALs is also variable and constantlychanging because of the uneven rainfall.Different soil types with different fertilitycharacteristics, different plants specieswith different nutritional qualities, anddifferent topographical features, such asgullies and depressions where water mayconcentrate, add further complexity. Thenutritional profile of ASAL rangelands –particularly in the rainy season – is highlyvariable and ever changing.Yet this is not a constraint for pastoral-
ists. Indeed, it is a resource. Pastoralists
positively exploit the ever-changingconcentration of nutrients in ASAL range-lands, particularly during the rainy season,by moving their animals to those areaswhere the pastures are at their ‘nutritionalheight’. They provide a higher nutritionaldiet to their animals than if they remainedin one area. Livestock mobility is the prin-cipal strategy used by pastoralists tomaximise livestock productivity underconditions of environmental variability. Livestock mobility and secure access to
a wide range of pastures are, however,increasingly threatened by a range of othercompeting activities including the spreadof arable farming, conservation enclosures,new settlements, population growth,mining and trophy hunting. This steadyencroachment and alienation of pastoralresources over much of East Africa has seri-ously undermined pastoralism as alivelihood and economic system, contribut-ing to increasing poverty, land degradationand conflict in many pastoral areas.Poor understanding by policy makers
and planners of pastoral production strate-
by TOM ROWLEY
Participatory digital map-making in arid areas ofKenya and Tanzania 4
66 Tom Rowley52
1 The projects were: Mainstreaming climate change adaptation in drylands developmentplanning in Tanzania (2010-12). Funded by DFID, CORDAID and GORTA; Supporting local climateresilience through innovative district funding and social protection mechanisms in the drylands ofKenya (2012-13). Funded by DFID and CORDAID. See: www.iied.org/drylands-pastoralism
gies and how pastoralism (compared toother land uses) contributes to local liveli-hoods and the wider economy partlyexplains the failure of policy and planningto enhance pastoral mobility and protectthe rangelands. The inability of pastoraliststo articulate the deep knowledge they haveof their environment and how they carefullymanage natural resources to generatewealth and prosperity in a sustainablemanner compounds the problem. The mapping processes discussed here
help to close this communication gap byenabling pastoralists to demonstrate – ina ‘language’ understood by policy makersand planners – their extensive under-standing of ecological processes and theirimpacts on livestock and people, and thusthe logic behind their livelihood strate-gies. With this improved understanding,there is the potential for governments to
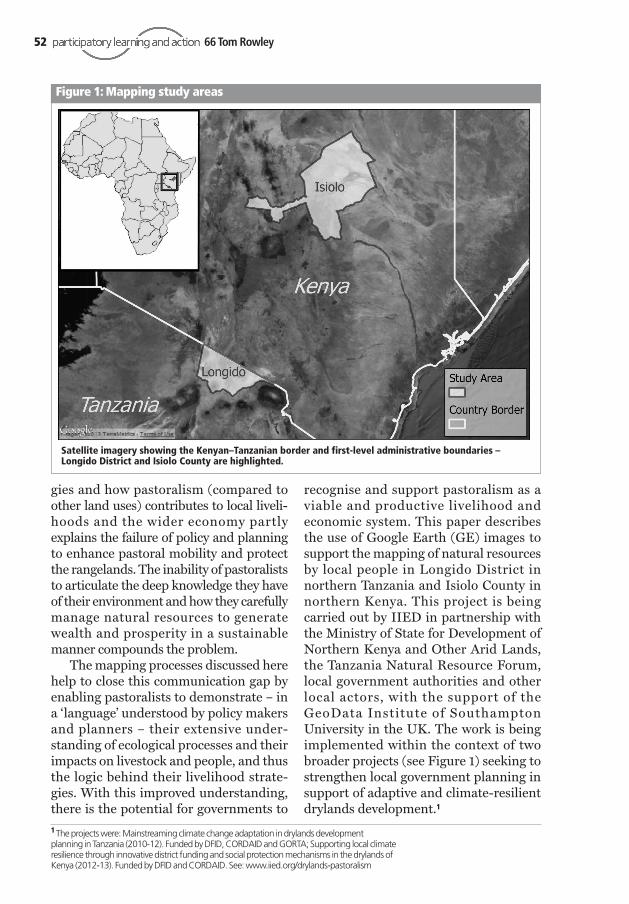
recognise and support pastoralism as aviable and productive livelihood andeconomic system. This paper describesthe use of Google Earth (GE) images tosupport the mapping of natural resourcesby local people in Longido District innorthern Tanzania and Isiolo County innorthern Kenya. This project is beingcarried out by IIED in partnership withthe Ministry of State for Development ofNorthern Kenya and Other Arid Lands,the Tanzania Natural Resource Forum,local government authorities and otherlocal actors, with the support of theGeoData Institute of SouthamptonUniversity in the UK. The work is beingimplemented within the context of twobroader projects (see Figure 1) seeking tostrengthen local government planning insupport of adaptive and climate-resilientdrylands development.1
Figure 1: Mapping study areas
Satellite imagery showing the Kenyan–Tanzanian border and first-level administrative boundaries –Longido District and Isiolo County are highlighted.

53l Participatory digital map-making in arid areas of Kenya and Tanzania
2 A map drawn from people’s perceptions, without coordinate data and therefore not necessarilyto scale.
The need for accurate mappingPastoralist’s tenure of land and resourcesin ASALs depends on being able to definethem accurately. Traditional livestockroutes, water resources and pastures arenot officially described or recognised inmaps or spatial planning. These resourcesare vulnerable to loss or fragmentationbecause of competing activities. Participatory mapping has long been
used to consult the knowledge and percep-tions of community groups (see e.g.Rambaldi et al., 2006). But it oftenproduces perception maps,2 where mapscaling and styles are inconsistently impro-vised during the consultation process. Forthis reason, transferring results to othercontexts outside the workshop setting isdifficult, as the scale and style are incom-patible. Perception maps often requireexplanation before they can be understoodby those who did not produce them. Any
comparison with other maps is inherentlyqualitative and vague as no distances orpositions can be objectively measured with-out accurate scaling.Specifically, one key limitation of
participatory mapping is transferringperception maps (often drawn on theground or paper and not necessarily toscale) into formal decision-makingprocesses where accurate maps arerequired, for example to pass a byelaw.Paper maps may be very powerful in theirimmediate setting – but it is very hard touse such maps in other contexts. Differ-ent contributors may use different iconsto describe the same type of feature andno objective verification of map featureson the ground can be performed withoutthe scaling and accuracy provided by thegrid systems used in formal maps.Digital maps have a built-in coordinate
system, referencing locations which corre-
A group of men explore the distribution of key resources for livestock rearing in Longido. The perception mapis made on the ground using marks in the dust and stones.
Photo: Alais M
orinda
t

spond to a global reference grid, so theycan be linked to maps used in other formalsystems. This provides a means to definethe absolute positions and importance ofkey natural resources which can moreprecisely inform management decisions. Acoordinate system also provides ageographically precise basis from which todiscuss natural resource management.This makes the outputs of participation inmapping more universally useable anduser-friendly. Making local knowledgemore useable can result in better manage-ment outcomes, for example land-usebyelaws that refer unambiguously tospecific locations that were pinpointed bythe resource users themselves.
The need to make maps at anappropriate scale and focusPastoralists use resources which arespread over vast areas that vary in produc-tivity and value within and between years.Depending on the type of pastoral system,
and the prevailing conditions with respectto pastures, security or market opportu-nities, pastoralists may travel considerabledistances with their livestock to accesspasture and water. Pastoralism thereforerequires mapping on a range of differentscales ranging from a settlement-levelscale for the planning of domestic waterto a wider ecosystem scale for the plan-ning of livestock mobility corridorsbetween wet and dry seasons. Conven-tional planning in the ASALs, particularlyat local government level, usually occurswithin specific administrative and/orpolitical jurisdictions such as a village or adistrict and usually does not extend tocapture the full spatial extent of pastorallivelihood strategies and movements thatmay cross numerous political and ecolog-ical boundaries. Unlike farming, the transient use of
resources by pastoralists, which often leaveno physical mark on the environment (e.g.the seasonal use of different pastoral
66 Tom Rowley5454
Using paper flipcharts to create a perception map in Kinna ward, Isiolo.
Photo: Tom
Row
ley

55l Participatory digital map-making in arid areas of Kenya and Tanzania 55
areas), makes it hard for outsiders to iden-tify specific pastoral land-use strategies. Itinvolves no habitat conversion, no hardboundaries or any privatisation of theland. It is far easier, and possibly politicallyexpedient, to identify and therefore mapprivate land holdings within well-definedpolitical boundaries than it is to recognisethe more diffuse and ever-changing usageof the Commons. To identify pastoralistresources, maps must be made at theecosystem scale, at which this system oper-ates. This could also help support themanagement of mobile grazing wildlifepopulations, which could make it easier toobtain political support for such planningtools.
Project workshopsDuring the project, several large workshopswere held to discuss natural resources andland management with a range of stake-holders in both Isiolo and Longido. Theworkshops both introduced the project and
identified important issues and features toinclude in the resource maps.Following a quick exploration of the
satellite imagery to orientate participantsand pinpoint the location of the workshop,participants led the collection of digital datafrom the satellite images from Google Earth(see Figure 2, step 2). Google Earth wasprojected onto a large wall with the origi-nal paper perception maps hung next tothem. Participants could navigate theimagery and indicate key resources, or theirindicators, with a long stick. For eachfeature a digital marker – an icon, a line ora polygon – was used to show the correctposition and extent. Placing these digitalmarkers allowed us to transfer points ofinterest from the paper maps into ageographic information system (GIS),producing coordinates that pinpoint thelocations in a way that can be independ-ently and objectively verified (see photosand Figures 3 and 4). This process of geo-referencing local knowledge to a coordinate
Participants geo-referencing key natural resources in Longido.
Photo: Alais Nda
ngoy
a

66 Tom Rowley56
Figure 2: The mapping cycle
Step 1. Participants begin with exercises listing the kinds of resources to map out and why. The chosentypes of features are mapped out on sketch maps.
This produces perception maps showing the relative positions of natural resources usingpen on paper or marks and objects on the ground.
Step 2. Google Earth is projected onto a wall next to the perception maps from step 1. Participants locatekey resources or their indicators from the satellite imagery and place an icon to show their precise location.
This produces the coordinates that pinpoint the locations of natural resources in a mannerthat can be independently and objectively verified.
Step 5. Feedback of the map to groups who provided data, local government and other interest groups.Data is returned for participants to evaluate and validate the maps and to reach consensus between thevarious groups.
This allows the maps to be returned for validation, cross-checking and styling according tothe wishes of those who provided the data, building trust as well as more refined, readableand validated maps.
Step 6. Cycles of learning and feeding back results (repeat steps 1–6) are used to refine the maps,broaden participation and reach consensus, to a point of diminishing returns where no more is addedand participants are satisfied that the maps are complete.
Repeated cycles of learning can build richer maps, trust, and be used to refine the mappingprocess, evolve priorities for the usage of the maps and discuss underlying natural resourcemanagement issues.
Step 7. GPS marks for contentious features, those undiscernable from, or newer than, the satelliteimagery and those which demonstrate the accuracy of the map must be collected on the ground.
This provides specific troubleshooting for hard to find points of interest along with a moregeneral validation of the maps accuracy by checking and marking the locations of keyfeatures on the ground.
Step 4. Spatial data from Google Earth is merged with the attribute data recorded in Excel. GIS maps ofthe study area are produced with the attributes embedded and participants' choices of basemap, iconsand colour schemes.
This transformation allows all the data collected to be shown on a single, easy to interpretplatform that allows processing, printing, sharing and analysis.
Step 3. Participants add attributes to the different types of natural resources that have been mapped outso that they can be more fully described.
This allows fuller descriptions and analysis of natural resources and management issues.Spatial and attribute data can be added by several groups and pooled on one map,allowing more cross checking, detail and area coverage.
NB, this is an idealised sequence. In reality it is useful to remain flexible.For example, collecting GPS marks for key features before a feedbacksession, and using feedback workshops to gather and standardiseattribute data were found to be helpful.

57l Participatory digital map-making in arid areas of Kenya and Tanzania
Figure 3: Overview of Longido District, showing pastoralist dynamics, naturalresources and infrastructure.
system is what allows the resource maps tobe produced to scale.Qualitative and quantitative data
describing the attributes of these keyresources was also collected, for examplethe capacity of water sources and the plantspecies characterising different grazingareas (see Figure 2, step 3). This wascompiled in an Excel spreadsheet using anID numbering system that corresponded tothe features mapped out in Google Earth.The two data sources were later mergedinto file formats for use in a GIS, with theattributes of natural resources embeddedinto the spatial data describing their loca-tions. We chose to use Quantum GIS(QGIS) for this post-processing, as it is afree, open source platform that is far easierto share and handover than a commercialpackage requiring thousands of dollars peryear to use.Data showing the different seasons in
which pastures are grazed and the majorlivestock routes connecting them was also
collected to allow the maps to reflect thepatterns of access to these resources. Thesedynamics are important as they reflect themobility that generates resilience in mobileresource tracking across ASAL regions. Cycles of learning about the study area
from community groups, digitally captur-ing local knowledge and feeding back theresults were used to more exhaustivelyexplore the potential of the satellite images,GIS and local knowledge (see Figure 2,steps 4–6). The workshops included regularfeedback sessions to return the data tothose who provided it and to thoroughlycross check the results as they were pooledtogether from different groups. Regularcycles of contact and learning also helpedto build trust and encouraged the sharingof information on sacred sites and previ-ously unknown gemstones, for example.These feedback sessions were also used todevelop better methods, discuss the impli-cations and usage of the map, and toevaluate the project.
66 Tom Rowley58
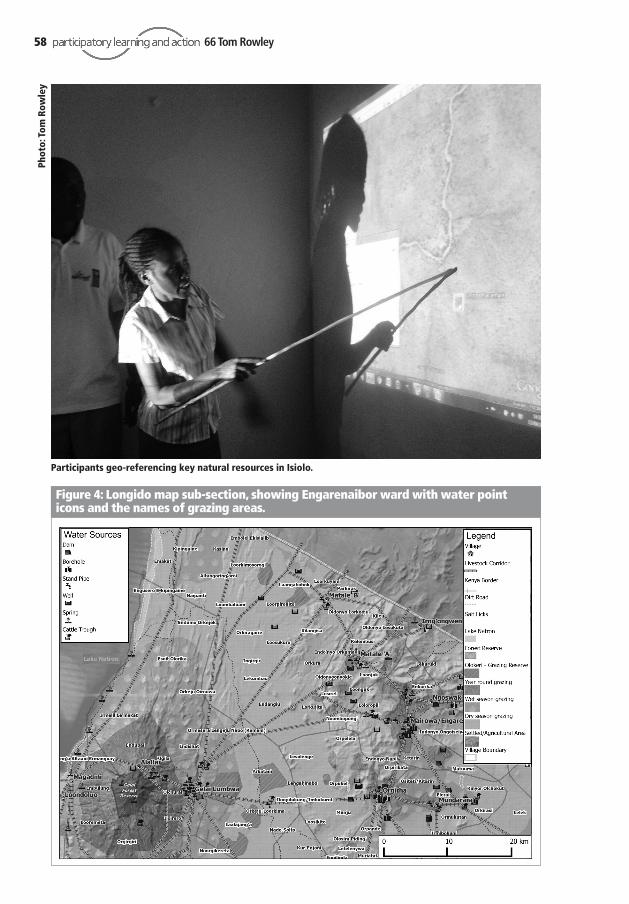
Figure 4: Longido map sub-section, showing Engarenaibor ward with water pointicons and the names of grazing areas.
Participants geo-referencing key natural resources in Isiolo.
Photo: Tom
Row
ley

59l Participatory digital map-making in arid areas of Kenya and Tanzania
Digital markers taken with handheldGPS on the ground were used to verify themap accuracy and pinpoint hard-to-findlocations, for example those under cloudson the satellite imagery (see Figure 2, step7). This verifies the location of anyoutstanding contentious features and moregenerally the precision of the map and theknowledge used to make it. It is worthnoting that this is a fairly idealised cycleand that in reality it is useful to remain flex-ible, for example, collecting GPS marks forkey features prior to feedback sessions andusing feedback sessions to gather and stan-dardise attribute data.
Geo-referencing for objectively verifiablemapsPhysical maps have been extensively usedto support community group consultationand development planning (see e.g. PLA 54Rambaldi et al., 2006). However, percep-tion maps that are not to scale tend to havelimited power when transferred out of thecontext in which they were created.Making maps that describe the dynamicsof nomadic lifestyles, and which remainapplicable in other contexts, is difficult.Google Earth provides an important‘bridge’ that can allow local people to makemaps in an objectively verifiable coordinatesystem. This helps to overcome the diffi-culties of using the results of participatoryinformation-sharing by making theoutputs more useable and transferrable. Itis also worth mentioning that bringinglocal knowledge to bear on digital mappingin fact also brings significant advantages inthe cost, speed and relevance of digital datacollection.
Using imagery to build richer maps andrecord attributesExploring local knowledge on land andnatural resources in a workshop setting canbe more stimulating, non linear and
productive with satellite imagery and aterrain model available for the participantsto explore (Figures 3 and 4). Using GEprojected onto a large wall allows morestimulating and interactive approaches thatlead to richer maps with more features anddetail. In Longido ward, Longido district,36 water points became 142 water pointsduring the digitisation process. This explo-sion of observations and available detailrequires some careful facilitation. Forexample, this apparent abundance of wateris misleading as further questioningrevealed that at any given time a largeproportion of them (28.5% of all Longido’swater points at the last workshop) were notworking. This was due to a range of factors,for example the reliance on rainwaterrecharge, broken pumps or disturbance byroad building or elephants. Watching thefeatures build up on the satellite imagery asthey are pointed out gives some instantfeedback which provides some immediatecross-checking of inputs within the groupand the means to explore issues as theyemerge.
Box 1: Using mobile phones forparticipatory data collection
In one ward, a notable improvement to participationand the quality of data collection was employed byparticipants. Several features important to livelihoodswere newer than the satellite imagery and could notbe located. Participants found they could map theseprecisely by quickly visiting them by motorbike andobtaining coordinates with GPRS-enabled mobilephones they were carrying.3These were then enteredinto the computer so the features could be displayedin their correct locations. This was exciting in terms ofthe level of uptake and commitment to the mappingprocess it indicated, the precision it allowed and themanner in which it demonstrated the strength of localknowledge. When the coordinates were enteredmanually, the points of interest did not jump far fromtheir previously estimated positions. The steadyuptake of this kind of technology and the possibilitiesit offers could have exciting implications forownership, monitoring changes and building morerobust, ground-truthed maps.
3General packet radio service (GPRS) technology is integrated into certain mobile phones.GPRS is a cellular networking service that supports WAP, SMS text messaging, and other datacommunications.
66 Tom Rowley60
The digital platform being used tocapture data also allowed observations onthe attributes of features being mapping tobe recorded and embedded. As people putfeatures onto the map they also describedthe characteristics of these features. Forexample, a water point would be mentionedalong with its capacity, the water quality,extraction method, access conditions andwhether or not it currently functioned. Simi-larly, different types of grazing area weredescribed according to the seasons they areused in, their physical features, and thespecies of plant that are usually present. InIsiolo, different soil types were used to differ-entiate pasture types, for example chalk(boji) and black cotton (malbe) that wereclearly distinct in the satellite imagery. Aninventory of plant species totalling over 200was given to further describe different graz-ing areas along with data on wildlifeconcentrations. These descriptions and datacan be captured during the mapping processadding considerable richness to the mapand allowing deeper analyses of the systemsthey describe.As the map develops in front of the
group, it tends to bring about a sense ofownership and pride in the map that isproduced. This was often seen to encour-age further participation.
Strengthening community voice at local,national and international scaleMaking more accurate maps for strongeradvocacyAccurate digital maps can be independentlyverified and therefore gain more traction.This can allow them to act as a more effec-tive ‘loudhailer’ – amplifying the impact ofcommunity voices at all levels. Using argu-ments referenced to a coordinate systemcan bring evidence-based local knowledgeto bear on planning and decision-makingin a way which is much more difficult todiscredit and ignore.
Pooling local knowledge onto a single platformCapturing information onto a digital plat-
form allows several groups to contributeindependently to the same map. This allowscumulative improvements to be made tothe level of detail and cross-checking in themap, and to the extent of its coverage. Thedigital platform allows different groups toadd information concerning the areas theyare interested in and easily make sense ofone another’s contributions. This is notalways the case for paper maps where moreexplanation is usually required. Some papermaps produced in a specific context can bedifficult to understand and virtually impos-sible to use when taken out of context.Mapping based on GE images still
requires the facilitator to be proactivelyinclusive and take account of who has takenpart in the process and seek out those havenot yet been able to contribute. However,the images and data are readily understoodand this makes it much easier to include theviews of different groups as they take theirturn to add their observations.
Making maps with flexible scalePooling local knowledge also allows anappropriate scale for examining naturalresources to be evolved as the patterns ofusage emerge. As well as building a grandoverview, digital mapping allows zoominginto specific areas and selective presenta-tion of data so that participants can workon small subsections of an area, or onspecific issues. Currently our maps areconstrained by political boundaries but wecan clearly see cross-border issues emerg-ing. For example, the water made availableat the foot of Kilimanjaro clearly has asphere of influence covering a large portionof Amboseli and many major cattle routesconnect these areas across the Kenya–Tanzania border (Figure 5).
Demonstrating the power of local knowledgeAs mentioned previously, the robustness ofcommunity perceptions can be demon-strated using digital maps. This can beachieved by directly measuring the accu-racy of perceptions against the imagery, by

61l Participatory digital map-making in arid areas of Kenya and Tanzania
ground-truthing with handheld GPS andalso by simply comparing the paper mapsfrom early in the mapping process with thedigital maps they later produced (Figure 6).This, along with the detailed attributesdescribing features of the map, can be usedto evidence how highly developed andnecessary this knowledge is for survival.Maps made in this way are very swiftly andaccurately produced in a manner that iscompatible with other spatial planning.This allows comparison of different plan-ning efforts, the overlaying of differentmaps and potentially, where appropriate,the formation of arguments that reconcilemainstream planning with customary land-use reasoning and priorities (Figure 6).
Critical reflectionHanding over of maps and mapping toolsIt is critical to return the maps to those whoparticipated in building them. However, theintroduction of technology such as laptopsand GIS makes this harder to achieve.
Some local actors were able to take data setsfor Google Earth and portable documentfiles (pdf) maps onto their laptops. Localgovernments also have capacity to takecustody of, and in some cases use, the digi-tal data. Leaving maps at the village levelcurrently relies on the ability to print papermaps. In Longido, 33 A3 sheets wereprinted, cropped and stuck together toachieve this. In Isiolo, six A0 sheets wereused. A greater reliance on technologymeans that the facilitator’s paradox of beingin control of something that needs handingover is intensified by this increased relianceon technology.
Technology and developing mapping styles It may seem unexpected that people withlittle or no experience of digital technolo-gies can make use of GE images but uptakeand use was very quick. This is particularlydue to the ability to explore a 3D terrainmodel which provides a side-on view show-ing elevation of familiar features, helping
Figure 5: Fifteen-kilometre buffer zones around cattle troughs in Longido, showingtheir influence on pastures in Kenya.

66 Tom Rowley62
participants to orientate themselves.4 Wefound that all groups would respond veryquickly to a warm-up exercise finding andmarking their current location in the work-shop. Once this ‘we are here’ point had beenzeroed in on, participants rapidly orientedthemselves and began to take control of theinteractive exploration of the study area.Most groups started by adding major land-marks before fleshing out the details inbetween. Some groups used mountains,some rivers and some roads as referencepoints for doing this. Other groups addedall levels of detail, methodically movingaway from the starting point, the locationof the workshop. Allowing participants todrive exploration of the areas was veryimportant but slightly different mappingstyles emerged as a result. Some groups were also vocal on how
they wanted the maps to look. Fortunately,we came across no conflicting opinions andwere able to use the styles of the groups thatwere vocal on this issue e.g. blue for live-stock routes, red for arable farming areasand so on.The management of the process by
which the images are projected and manip-ulated is crucial to the success of themapping exercises and a great deal dependson the quality of the facilitation. As with all
participatory methods, the tools are not asimportant as the approach and principlesbeing followed in the facilitation. Digitalmapping is just a recent addition to theprocesses which contain something of aparadox for the facilitator who has controlof a process that they in turn want to handover to other people.
Making use of mapsMapping itself does not infer or affectpastoral community group resilience.Rather it is a tool for communicating thelocal knowledge that, when given room tobe applied, can engender resilience inpastoralist communities. It is hoped that thebenefits of mapping local knowledge can bebrought to bear on the activities of otherrangeland users who would otherwisedisplace and disregard the dynamics ofpastoral land use. However, the productionof a map is several steps away from its use bypoliticians to mediate competitions overland and resource access. Validation of mapsby community groups and local govern-ment, empowering local government andcustomary institutions to make use of themto form appropriate planning and publicgood-type investments, seeking legal adviceand legal action over gazettements toprotect key areas, and generating will at the
Figure 6: Comparison of perception maps and geo-referenced digital maps shows theaccuracy of local knowledge in terms of distance and direction.
4 See also Piccolella et al. (this issue) for a discussion on how the third (vertical) dimensionstimulates memory. ‘A two-dimensional map looks the same from any direction. With athree-dimensional model, what you see varies according to your position.’
63l Participatory digital map-making in arid areas of Kenya and Tanzania
national level not to override local gover-nance are required for mapping to haveimpacts on livelihoods on the ground.
Gender The pastoralist societies we worked withwere quite male dominated, especially inrelation to issues of long-distance herdingand territory. In all but the locations andattributes of domestic water sources, men’scontributions were overriding. However, weobserved that in workshops that were facil-itated or attended by powerful women, allthe women present contributed more.Collecting separate data for men andwomen’s groups and using a digital plat-form to later overlay them would beinteresting. This conforms to findings inother forms of mapping where men andwomen often produce quite different mapswhen working separately. However, mapsbased on Google Earth images can easily beused to re-combine different maps, and themaps of one group can easily be shown tothe other on the same background.
Valuable lessonsCross-checking throughoutAs the data was built up on the projectorscreen it allowed participants to see themap emerging from their individual contri-butions. This allowed instantaneouscross-checking throughout the collection ofdata. It was also helpful to use the measur-ing tool, a flexible scale bar that canmeasure distances from the image in kilo-metres, particularly when zooming in andout, to keep participants orientated andallow better cross-checking within eachgroup. Measuring distances, for example totriangulate the location of a new point inrelation to other known points or to meas-ure the breadth of a grazing area helpedgenerate accurate data. Also, participantsoften became interested in checking theaccuracy of their knowledge against theruler tool and seemed to enjoy verifyingtheir knowledge of distance and directionusing the satellite imagery.
Cycles of learningAs well as feeding back results within work-shops, returning the data once it had beenprocessed in a GIS allowed participants toimprove the maps considerably. Presentingthe data over a different base-map and withclear icons helped participants to reinter-pret their maps and provide amendmentsand additions. Some groups preferred abase-map made from the original satelliteimage but in black and white to allow thedata in colour to stand out. Otherspreferred solely using elevation data with ashading effect to highlight the topographi-cal relief of familiar features. Cycles ofconsulting local knowledge and thenprocessing and presenting the data builttrust as well as richer maps. Having gonethrough three cycles of collecting mappingdata and feeding back the results inLongido, a piece of paper describing asacred site and two important gemstoneseams was given to the facilitators. Thishighlights the importance of returning datato the groups that provided it and cross-checking the digitisation process bothwithin and between groups.
The emergence of power issues – LongidoWe found during the cyclic learning andfeedback sessions that community groupshad limited knowledge of certain types offeatures that were only partially or incon-sistently added to the maps. When tryingto prompt participants to offer better datafor these areas of interest it became clearthat we had stumbled across an area wherelocal knowledge was inadequate. The typesof features that could not be reliablymapped from local knowledge were allland-use gazettements designed to supportforeign interest in the study area, specifi-cally activities focused on wildlife and raremineral resources.There were four distinct categories of
land-use planning in which local people andinstitutions had limited knowledge andinvolvement: tourism, hunting, conservationenclosures and mining for gems and other

66 Tom Rowley64
rare earth minerals. Planning around thesetypes of features occurs at the national leveland is often at odds with planning at thedistrict level. This could be due to the moreinternational stakeholders invested in thesetypes of land use, their interactions withnational-level actors, and a difference infocus between government planning levelsconcerned with national versus local-leveleconomic performance. Promotion oftourism and mineral exploration can supportformal commercial economic processes atthe national level, though this is at theexpense of performance in the local econ-omy. This is exemplified by the risk that, inthis context, creating mining towns, lodges,farms, hunting blocks and reserves that limitor disrupt mobility (though beneficial tohigh-end, national/international-leveleconomic processes) will seriously under-mine resilience in the local economy, causinghardship, conflict and land degradation.This highlights a paradoxical tension
between bottom-up and top-down plan-ning which results in incoherent,duplicated and often inappropriate spatialplanning. Local government in the ASALswho are more directly accountable to localpeople aim to support stable and produc-tive livestock-keeping as the dominanteconomy and welfare support to their mostnumerous and most vulnerableconstituents (United Republic of Tanzania,2009). This requires protecting theintegrity of the Commons and empoweringcustomary institutions to continue to prac-tice sustainable, dynamic natural resourcemanagement on a large scale. However,overriding planning at the national leveltends to cater for those invested in the frag-mentation (e.g. conservation enclosures,villagisation5, or privatisation) and liquida-tion (hunting, mining, full-scale habitatconversion) of natural resources (Figure 7).While this paradoxical promotion ofwelfare at the district level and commerceat the national level remains politically and
logistically expedient in terms of spatialplanning, local governments and custom-ary institutions will remain subjected togazettements under their feet resultingfrom decisions made over their heads, andwhich they have little information on. Commerce and welfare need not be
diametrically opposed as there are manyparallels between livestock-raising andrangelands wildlife management. Assets inboth sectors are characterised by the breed-ing and predation of large, grazingherbivores and that need to migrate in orderto optimise their access to water and nutri-ment. Some of the disparity in local- tonational-level government agendas could bereconciled somewhat by acceptance of thecommon dynamics of pastoralism and theecology that supports wildlife conservationand tourism, both major drivers of foreigninvestment in the study areas. Wildlife-focused activities could also in the long termbe supported by appropriately defined,ecosystem-scale rangelands managementdesigned to preserve dynamic stability inlarge, resilient and flexible ecosystems.However, this will only be possible if stake-holders in tourism can be persuaded thatpreservation of ecosystem integrity andcomplexity rather than the isolation andmonopolisation of small, valuable areas isthe way forward in the long term.
ConclusionsMapping using digital technology inconjunction with local knowledge is stillrelatively new in East Africa. But it is show-ing early promise – not only from atechnical perspective (e.g. accurate, effi-cient, cheap and transferrable) – but also asa tool to empower communities and bridgecommunication gaps between citizens andtheir government. Participation in mappingthe land generates some ownership of themaps and the land management issues theydescribe, mobilising community groupengagement in these issues. The process
5Villagisation is the (usually compulsory) resettlement of people into designated villages bygovernment or military authorities.

65l Participatory digital map-making in arid areas of Kenya and Tanzania
also can encourage government agencies tovisit and engage with their constituentswho can now use maps to provide morecommunicable and coherent ways of artic-ulating their land-management knowledgeand priorities. Maps in a digital platformcan also be directly compared, allowingplanning and management issues to beclearly crystallised, and perhaps more easilyresolved.At the time of writing, work is on-going
in Longido and Isiolo, where the mapsdescribed in this paper will be used tosupport decision-making on public good-type investments to build local adaptivecapacity to climate variability and change.Plans are being finalised to extend and up-scale the work to neighbouring countiesand districts in Kenya and Tanzania respec-tively. As the size of the area mappedincreases towards the landscape scale, amore comprehensive overview of pastoraldynamics, cross-border effects and naturalresources distributions can be provided,
resulting in an increasingly powerful tool.Monitoring systems for updating the mapsand handing over of ownership are beingput in place with some capacity-buildingrequired to support this. Legal advice is alsobeing sought on how to use maps to passbyelaws protecting key resources andpreserve the mobility required to accessthem.We plan to make the maps available
online as well as disseminating printed‘atlas’ type maps where electricity andcomputing do not allow the data to beshared directly. To achieve better hand-over,uptake of ownership and ongoing monitor-ing of changes we must further explore howto make the maps into interactive tools tosupport adaptive management and deci-sion-making by using techniques such ascrowdsourcing data to develop a commu-nity of users and contributors around thedata, adding and using updates in real time.Some challenges stem from the need to
hand over digital technology, though
Figure 7: Pastoralist dynamics with a sample of hunting, mining and villagisationgazettements overlaid.

66 Tom Rowley66
CONTACT DETAILSTom RowleyBox 11598ArushaTanzaniaPhone: +255 764 930 588Email: [email protected]
ACKNOWLEDGEMENTSThe author would like to thank Ced Hesse, Principal Researcher –Drylands, Climate Change Group at IIED, for his valuable commentson earlier drafts of this article.
REFERENCESKrätli, S. and N. Schareika (2010) ‘Living off uncertainty: the intelligent
animal production of drylands pastoralists.’ European Journal ofDevelopment Research22:5, pp. 605–622.
Rambaldi, G., J. Corbett, M. McCall, R. Olson, J. Muchemi, P.A. KwakuKyem, D. Wiener and R. Chambers (eds) (2006) ParticipatoryLearning and Action54 Mapping for change: practice,technologies and communication. IIED and CTA. Online:pubs.iied.org/14507IIED.html
United Republic of Tanzania (2009) Longido district council strategicplan. Prime Minister’s Office, Regional Administration and LocalGovernment, Tanzania.
uptake is advancing rapidly e.g. the spreadof GPRS-enabled mobile phones (Box 1).Another challenge will be harmonisingspatial planning activities between differ-ent stakeholder groups and local- andnational-level government planningdepartments. The communications gapbetween pastoralists and other stakeholdergroups and managers can be bridged using
maps to convey the copious and pertinentdata contained in local knowledge in aprecisely verifiable and more widely appli-cable form. However, the capacity and willof government to accommodate pastoralistknowledge and reasoning in the mediationof land management issues will determinethe success of landscape-scale rangelandsmanagement in the long term.