partial oxidation of gasoline in - open...
TRANSCRIPT

Partial oxidation of gasoline in a packed bedreactor
Item Type text; Thesis-Reproduction (electronic)
Authors Kratzke, Robert Thomas, 1951-
Publisher The University of Arizona.
Rights Copyright © is held by the author. Digital access to this materialis made possible by the University Libraries, University of Arizona.Further transmission, reproduction or presentation (such aspublic display or performance) of protected items is prohibitedexcept with permission of the author.
Download date 27/05/2018 12:29:19
Link to Item http://hdl.handle.net/10150/347843

PARTIAL OXIDATION OF GASOLINE INA PACKED BED REACTOR
Robert Thomas Kratzke
A Thesis Submitted to the Faculty of theDEPARTMENT OF CHEMICAL ENGINEERING
In Partial Fulfillment of the Requirements for the Degree ofMASTER OF SCIENCE
In the Graduate CollegeTHE UNIVERSITY OF ARIZONA
1 9 7 5

STATEMENT BY AUTHOR
This thesis has been submitted in partial fulfillment of requirements for an advanced degree at The University of Arizona and is deposited in the University Library to be made available to borrowers under rules of the Library.
Brief quotations from this thesis are allowable without special permission, provided that accurate acknowledgment of source is made. Requests for permission for extended quotation from or reproduction of this manuscript in whole or in part may be granted by the head of the major department or the Dean of the Graduate College when in his judgment the proposed use of the material is in the interests of scholarship. In all other instances, however, permission must be obtained from the author. y
SIGNED^
APPROVAL BY THESIS DIRECTOR This thesis has been approved on the date shown below:
DateRICHARD.D . WIL LIAMS Assistant Professor of Chemical Engineering

ACKNOWLEDGMENTSl
The author expresses his gratification to the faculty and staff of the Department of Chemical Engineering of The University of Arizona. Special thanks go to Dr. Richard D. Williams, the Research Director, for his valuable assistance and suggestions during this project; to Dr.1 J. 0. L. Wendt; Dr. J. W. White; James R. Beckman; and David Pershing for interesting discussion sessions dealing with the melting reactor phenomenon, and to the College of Mines Machinist, Charles Long, and Electronic Technician, Sal Gonzales.
This work was supported by California Institute of Technology, Jet Propulsion Laboratory (JPL), at Pasadena, California, under contract number 953942. Computer simulation was performed on The University of Arizona CDC 6400 digital computer.
Finally, the author wishes to express his deepest appreciation to his wife, Anita, for her unselfish assistance and understanding in the past six years and to his son Robbie just because h e ’s Robbie.

TABLE OF CONTENTS
PageLIST OF ILLUSTRATIONS . . . . . . . . . . . v , . viLIST OF TABLES . . . . . . . . . . . . . . . . . . . . viiiABSTRACT . . . . . . . . . . . . . . . . . . . . . . . ix
INTRODUCTION . . . . . . . . . . . . . . . . . . . . . 1Reduction of NOx Emissions . . . . . . . . . . 2Chemistry of Partial Oxidation . . . . . . . . 3JPL's System . . . . . . . . . . . . . . . . . 4Previous Work . . . . . . . . . . . . . . . . . 6Original Study Objective . . . . . . . . . . . 1 1
EXPERIMENTAL APPARATUS AND PROCEDURE . . . . . . . . 13Apparatus . . . . . . . . . . . ......... . . . 13Procedure . . . . . . . . . . . . . . . . . . . 24
DISCUSSION OF EXPERIMENTAL RESULTS . . . . . . . . .. . 28Summary of Results . . . » . . . . . . . . . . . . 28Flame Front. Theory . . . . . . . . ■. . . . . . 33Pin-Hole Leak Theory . . . . . . . . . . . . . 35Hot Spot Theory . . . . . . . . . . . . . . . . 38Surface Combustion Theory . . . . . . . 40Test of the Surface Combustion Theory . . . . . 44
PACKED BED SURFACE COMBUSTION COMPUTER MODEL . . . . . 50Theory . . . . . . . . • . . . . . . . . . . . . 50Computer Model . . . . . . . . . . . . . . . . 51Computer Simulation Results . . . . . . . . . . 59
CONCLUSIONS AND RECOMMENDATIONS . . . . . .... . . . . . 69
iv

TABLE OF CONTENTS--Continuedv
PageAPPENDIX A: COMPUTER SIMULATION 72
Method of Solution: Implicit Technique . . . . 72Computer Input . . . . . . . . . . . . . . . . . 76Computer Output . . . . . . ' . ........... 77Computer Listing . . . . . . . . . . . 77
APPENDIX B: GAS CHROMATOGRAPH CALIBRATION ANDDATA REDUCTION ................ . . . . . . 88
APPENDIX C: CALIBRATION CURVES . . . . . . . . . . . .. 92REFERENCES CITED . . . . . . . . . . . . . . . . . . . . 95

LIST OF ILLUSTRATIONS
Figure Page1. JPL System . . . . . . . . . . . . . . . . . . . . 52. Theoretical equilibrium, adiabatic combustion of
Indolene (CHj 92) - Air at 80°F, 44 psia . . . 73. Experimental apparatus flow diagram . . . . . . . 144. Overall view of the experimental apparatus . . . . 155. Gas chromatograph . . . . . . . . . . . . . . . . 156. Reactor and heaters . . . . . . . . . . . . . . . 167. Dual column system with switching valve .......... 198. Schematic of Reactor I . . . . . . . . . . . . . . 209. Schematic of Reactor II . . . . . . .'. . . . . . 22
10. Schematic of Reactor III . . . . . . . . . . . . . 2311. Destruction of Reactor I . . . . . . . . . . . . 2912. Interior destruction of Reactor II . . . . . . . . 3013. Exterior destruction of Reactor I I . . , . . . . * . . 3014. Flame Front Theory ............... 3415. Pin-Hole Leak Theory . . . . . . . . . . . . . . . 3616. Hot Spot Theory . . . . t . . . . . . . . . . . . 3917. Surface Combustion Theory . . . . . . . . . . . . 4118. Typical temperature history of Reactor III . . . 4319. Temperature history of Reactor I . . . . . . . . . 4720. Temperature history of Reactor II . . . . . . . . 48
Vi

LIST OF ILLUSTRATIONS --Continuedvxi
Figure Page21. Computer simulation model . . . . . . . . . . . . 5722. Initial condition and the three stages in the
, computer simulation . . . . . . . . . . . . . . 5823. Computer simulation results „ . . . . . . . . . . 6024. Sample computer output: Preignition temperature
profile . . . . . . . . . . . . . . . . . . . . 8125. Sample computer output: Reaction ignition . . . 8226. Sample computer output: 20 minutes after
reaction ignition . ............ . . . . . . . . 8327. Sample chromatogram . . . . . . . . . . . . . . . 9128. Helium rotameter calibration curve . . . . . . . 93.29. Gasoline rotameter calibration curve . . . . . . 94

LIST OF TABLES
Table Page1. Effect of Preheat Temperature on Theoretical
Product Compositionj Air/Indolene MassRatio = 5.5 . . . . o . . . . . . . . . . . . 9
2. Operating Conditions of the Three Reactors . . . 313. Theoretical and Experimental Product Composition 314. Reaction Zone Movement (Obtained from Reactor
.Ill Data) . . . . . ......... . . . . . . . . . 3 25. JPL Catalytic Hydrogen Generator Output
Composition . . . . . . . . . . . . . . . . . 456. 23 Factorial Designs . . . . . . . . . . . . . . 637. Design for Seven Factors in Eight Observations . 648. Computer Model Sensitivity Study Results . . . . 669. Computer Program Input Data . . . . . . . . . . 78
10. Sample Computer Input . . . . . . . . . . . . . 8011. Sample Gas Composition Data . . . . . . . . . . 8912. Gas Chromatograph Correction Factors . . . . . . 89
viii

ABSTRACT
The initial objective of this study, to determine the poisoning effect of fuel lead additives on nickel oxide catalyst during partial oxidation (POX) reactions, has resulted in the discovery of another important phenomenon, surface combustion, which appears to be the dominant mechanism in action. During the initial portion of the study, two different reactors melted in their "inert" porcelain packing sections near the reactant feed entrance. Four theories were developed to explain the reactor melt phenomenon. From the four theories, the Surface Combustion Theory emerged as being the most feasible. Experimental results from a third reactor filled only with 0.5 inch porcelain Raschig rings, exhibited reaction zone movement upstream through the porcelain bed to the reactant feed entrance and then an increasing temperature in the feed entrance area. This lends strong support to the Surface Combustion Theory.A digital computer simulation of the surface combustion phenomenon has satisfactorily reproduced the experimental data, supporting the surface combustion mechanism as being responsible for the failure of the first two experimental reactors. If surface combustion is the dominant mechanism in action, then the activity of the packing material may not be influenced at all by gasoline additives.
ix

INTRODUCTION
Hydrogen is looked upon as a possible means of reducing NO^ emissions from the conventional automobile engine exhaust. The Jet Propulsion Laboratory (JPL) of Pasadena, California, is currently developing a system which will use small amounts of hydrogen to allow the burning of gasoline at ultra-lean conditions (1). Since N0x formation is strongly temperature dependent, the ultra-lean conditions will lower the combustion temperature within the engine thus lowering the amount of NO formed. Similar concepts have been under study by International Materials Corporation (2) of Boston, Massachusetts, Siemens (3) of Germany, Mobil Oil Corporation (4), and The University of Arizona (5). In each of these studies, the heart of the system is the hydrogen generator. The generation of hydrogen on board the vehicle allows for the convenience of 'conventional high energy density liquid hydrocarbon fuels while simultaneously allowing for the special burning characteristics obtained with hydrogen. In the JPL approach, hydrogen is generated through the partial oxidation of gasoline with air. This study deals directly with the partial oxidation reaction in a packed bed reactor.
1

Reduction of N0X Emissions
The formation of NO^, which is exponentially related to the combustion temperature, can be reduced substantially by lowering this temperature. Operation of the engine at fuel lean conditions will result in this desired end. To decrease NO . emissions to the order of 0.46 mg/mile (EPA's current 19 77 automobile NO emission standard) while burning gasoline, it has been projected that an air/fuel mass ratio of approximately 30 would be required (6). However, with the current fuels used in conventional engines, misfiring starts at air/fuel mass ratios above about 18, (1). This figure varies considerably from engine to engine depending on the uniformity of the air/fuel mass ratio from cylinder to cylinder. Misfiring is due to the relatively narrow flammability range of liquid hydrocarbon fuels.
To utilize the concept of operating the conventional automobile engine at ultra-lean conditions in order to achieve low NO emissions, the flammability range of theX . :gasoline must be increased. A solution to this problem would be to mix small amounts of hydrogen with the gasoline. Hydrogen has an extremely low lean flammability limit at an air/fuel mass ratio of approximately 340. Thus with the addition of hydrogen, the flammability range of the fuel can

be extended from an air/fuel mass ratio of 18 to 340, depending upon the hydrogen/fuel, ratio.
In an unpublished work, Hoehn and Dowdy (7) have demonstrated the feasibility of using hydrogen/gasoline mixtures in a single cylinder CFR engine, a 350 cubic inch V8 on a dynamometer, and in an automobile.
Chemistry of Partial Oxidation Hydrocarbons can be converted to fuel gases by a
process called partial oxidation. In partial oxidation, oxygen (or air) is reacted with hydrocarbons to form a hydrogen rich fuel gas. During partial oxidation, extensive compositional changes occur, but not enough to completely transform the hydrocarbons to CO 2 and H 20. This is because air is present in quantities considerably below the stoichiometric air/fuel ratio. The basic decomposition reactions for saturated hydrocarbons are given below.
CnH 2n+2 + ! ° 2 - nC0'*,Cn*l)H.
CnH 2n+2 +3n+l 0 2 — nCO 2 (n+l)H20
The above two reactions are highly exothermic and the equilibrium product composition at low pressures has been
found to be rather temperature insensitive (8). A typical product, produced in the temperature range of 1750°F to 2920°F consists of H 2 (22%), CO (23%), C02 (1%), H 20 (2%) . and N2 (52%) .
JPL's SystemJPL is currently developing a system which will
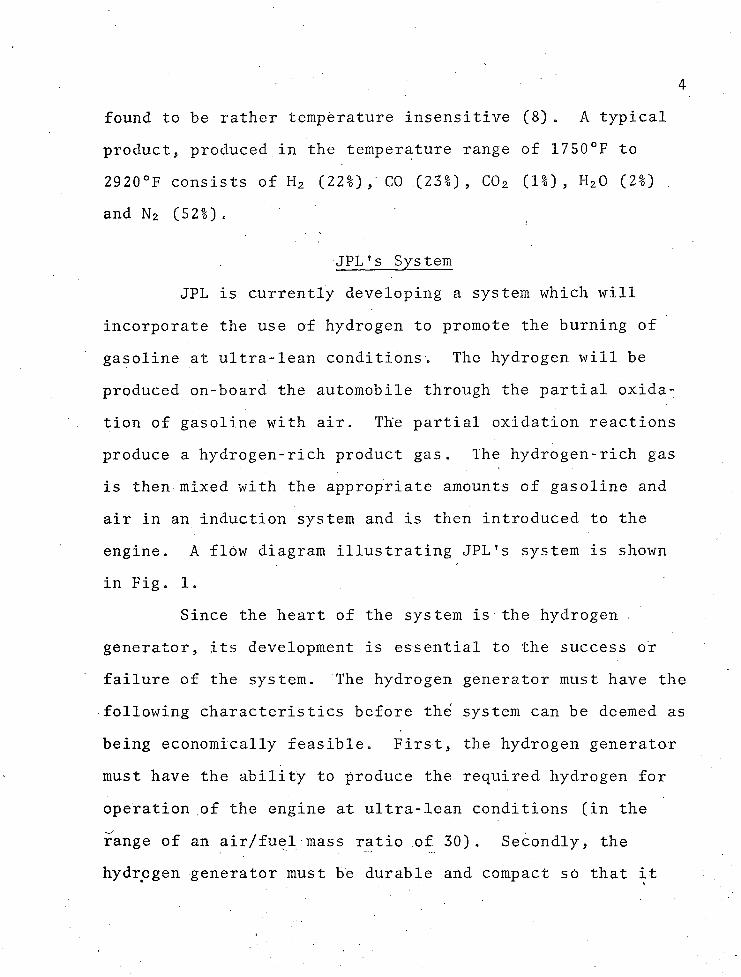
incorporate the use of hydrogen to promote the burning of gasoline at ultra-lean conditions. The hydrogen will be produced on-board the automobile through the partial oxidation of gasoline with air. The partial oxidation reactions produce a hydrogen-rich product gas. The hydrogen-rich gas is then mixed with the appropriate amounts of gasoline and air in an induction system and is then introduced to the engine. A flow diagram illustrating JPL’s system is shown in Fig. 1.
Since the heart of the system is the hydrogen generator, its development is essential to the success of failure of the system. The hydrogen generator must have the ■following characteristics before the system can be deemed as being economically feasible. First, the hydrogen generator must have the ability to produce the required hydrogen for operation of the engine at ultra-lean conditions (in the range of an air/fuel mass ratio of 30). Secondly, the hydrogen generator must be durable and compact so that it
FLOW CONTROL VALVE
GASOLINE
AIR
Hg +■ CO
ACCELERATOR
CONVENTIONALENGINE
INDUCTION SYSTEM
GASOLINE
H2 GENERATOR
Fig. 1. JPL System.

1
6can be incorporated into an automobile. Finally, the cost of the system must be reasonable.
Previous WorkPreliminary studies concerning the theoretical
aspects and experimental performance of the hydrogen generator have been carried out at JPL„ Through equilibrium calculations on the partial oxidation reactions, JPL found that maximum hydrogen yield without carbon formation occurs at an air/fuel mass ratio of 5.15 (1)„ Although the true maximum hydrogen yield occurs at an air/fuel mass ratio of 1.9, carbon formation also occurs; As the air/fuel mass ratio is increased, the hydrogen yield decreases. These points are illustrated in Fig. 2. From this it can be seen that the optimum point to operate the hydrogen generator is at an air/fuel mass ratio of 5.15 if equilibrium values are obtainable. In the theoretical equilibrium calculations, an atomic hydrogen to carbon ratio of 1.92 was used for the , liquid hydrocarbon feed. This is about the same value as for Indolene (Federal test gasoline). Diagrams for other hydrocarbon fuels are very similar.
At this point it must be noted that equilibrium values represent only the ultimate end point of the reaction. The rate at which one approaches the equilibrium condition is another factor to be determined. For the partial

PRO
DU
CT
CO
MP
OS
ITIO
N,
VO
LUM
E
%(W
ET
) 40C(s)
30
CO20
CO2
C(s) CO
CO 2151050
AIR F U E L MASS RATIO
Fig. 2. Theoretical equilibrium, adiabatic combustion of Indolene (CH1 ) - Air at 80°F, 44 psia.

oxidation of hydrocarbons, since the reaction rate increases exponentially with temperature, one method of increasing the reaction rate is to increase the preheat temperature of the reactants. The preheat temperature of the reactants has little effect on the theoretical product composition as illustrated in Table 1 (1). Thus, increasing the preheat temperature of the reactants will increase the rate of reaction without sacrificing the hydrogen content of the product gas.
• Two types of hydrogen generators were developed and tested at JPL (1). Both will be discussed. The first reactor, which shall be designated as the thermal reactor, was essentially a ceramic lined tube through which the preheated reactants passed"and reacted. The results obtained from the thermal reactor were as follows. It was found that preheating of the reactants to a temperature of 1200°F was required for 80% of the theoretical equilibrium hydrogen yield to be obtained. The reaction rate was too low to obtain the equilibrium yield even with high preheat temperatures. Also, soot formation tended to be a problem. J PL.experienced soot formation up to an air/fuel mass ratio of 6.
The second reactor, which shall be designated as the catalytic reactor, was essentially the same ceramic tube packed with a nickel reforming catalyst. Note that by the term catalytic generator, it is meant that the reactor

9Table 1. Effect of Preheat Temperature on
Theoretical Product Composition, Air/Indolene Mass Ratio = 5.5
Inlet Temperature 00 o 0 bd 980 °F 2060°F
Outlet Temperature 1750°F 2260°F 2920°F
Product Composition, Mole PercentCombustibles
h 2 22.0 21.8 21.5CO 23.4 23.8 24.1
InertsCO 2 1.2 0.8 . 0.6h 2° 1.7 2.0 2.1n 2 . 51.7 51.6 51.7
TOTAL 100.0 100.0 100.0

10contained a nickel reforming catalyst, but not that the catalyst necessarily induced a catalytic reaction. It should also be noted that in JPL's study, it was assumed that a catalytic reaction took place in the catalytic reactor„ The results of the catalytic reactor were as follows. It was found that preheat of reactants to a temperature of 400°F was required for 96% of the theoretical hydrogen yield. As compared to the thermal reactor results, the nickel catalyst increased the rate of the partial oxidation reactions. The nickel oxide catalyst also had a strong soot suppressing action. JPL experienced no soot formation down to an air/fuel mass ratio of about 4.
Comparing the thermal generator and the catalytic generator, it can be seen that the catalytic generator has clear-cut advantages. The results obtained from the two reactors have shown the catalytic reactor suppresses soot formation and increases the reaction rate sufficiently to be incorporated into the automobile, whereas soot formation and low reaction rates tend to be a problem in the thermal reactor. ,

Original Study ObjectiveFrom a comparison of the two reactors developed at
JPL, the catalytic reactor has the most promise. However, assuming that the effect is catalytic and involves active sites on the nickel surface, lead compounds which are currently added to the fuel may have adverse poisoning effects on the catalyst. The reactivity of many catalyst types is known to be adversely affected by the presence of heavy metal compounds and sulfur. Since sulfur is commonly found in hydrocarbon fuels which are industrially reformed to methane or hydrogen, a substantial body of literature exists as to its effect on the reactivity of the nickel catalysts used in reforming. Furthermore, standard refinery techniques have been, developed for its removal. Normally, for industrial practice, feedstocks for such reforming units contain no lead compounds and thus there has been little interest in the effect of lead on such catalysts.
The initial objective of this study was to determine the effect of fuel lead additives on the catalytic partial oxidation of hydrocarbon fuels to produce hydrogen rich fuel gas. In this phase of the study it was assumed that the reaction was catalytic in the sense that active sites on the surface of the catalyst played a major role in the reaction. However, as shown later in this study, this may not be the case. Results of this study have indicated that the

' 12enhancement of reaction rate may not be a surface specific phenomenon but rather may depend only upon the presence of any surface in order to support surface combustion.

EXPERIMENTAL APPARATUS AND PROCEDURE
ApparatusThe basic function of the experimental apparatus
built for this study was to monitor the partial oxidation of gasoline in a packed bed reactor. The apparatus had the following characteristics:
1) Steady flow of vaporized gasoline and preheated air,
2) Accurate control of inlet reactant feed temperature,
3) Product gas analysis system,4) Reactor pressure control.
A flow diagram of the system is shown in Fig. 3. Photographs showing an overall view of the apparatus, the gas chromatograph, and the reactor are shown in Figs. 4 , 5 and 6, respectively.
The heart of the system is the reactor. Three reactors of different design were used in the study. A description of each reactor design will follow later. The reactor was fed a superheated mixture of air and fully leaded Union Oil Supreme gasoline. The mixture superheat was controlled by regulating the heat input to the superheat
' 13 ■

Back Pressure Valve
Reactor Condenser
HgO Coolant
Temp.Control
Suoerheatto GC
Rotameters
Preheat 8 Vaporizat ion
Water Collection
Gas Sampling Valve
> Vent
Wet Test Meter
— Air Supply Regulator
Fig. 3. Experimental apparatus flow diagram.

. . x . : 'fm4-rr''-— .v^v,. w . •. wiXivX-.w^s...w. .jjiMMODDIMIlOB] ••• —' '-v
Fig. 4. Overall view of the experimental a p p a ratus.
Fig. 5. Gas chromatograph.

16
Fig. 6. Reactor and heaters .

17coiled tube, using an electrical resistance Linberg radiant heating element which was manually controlled by a Variac- type transformer. Air flow rate was controlled by a needle valve with flow detection by three Dryer rotameters set up in parallel. Each rotameter could monitor the air flow up to 100 scf/hr so that the three in parallel could monitor 300 scf/hr of air entering the system. Inlet air pressure was controlled with a two-stage regulator. Gasoline was pumped into the system using a positive displacement pump or nitrogen overpressure. Fuel flow rate was monitored by use of a calibrated rotameter. In addition to the feed mixture temperature, temperatures directly associated with the reactor were recorded on a Speedomax G Multichannel Temperature Recorder. The positions of the temperature probes varied with each reactor and will be discussed later. A safety system was installed to prevent reactor destruction in the following way. The temperature was monitored in the center of the catalytic bed. If this temperature reached' 2100°F, an alarm would go off to aler^t the operator. If no corrective action had taken place within 30 seconds, the gasoline feed pump' would automatically be turned off. Reactor pressure was measured by a Bourdon gauge and was manually controlled by use of a back pressure needle valve. The reactor was capable of operation at pressures of 35 psig at

18
entering feed temperatures corresponding to 1000°F superheat over an air/fuel mass ratio of 4 to 6. Reactor effluent was cooled and water was condensed out and collected. The remaining gases were then vented with a portion passing through a gas chromatograph gas sampling valve.
Gas analysis was accomplished using a Perkin-Elmer Model 820 Gas Chromatograph with Porapak Q and molecular sieve dual column capability. The dual column system (9) with switching valve is shown in Fig. 7. The two columns, a porous polymer, and a molecular sieve were combined by a 6-port linear column switching valve. The 6-port valveallowed carrier gas to flow through both columns to thedetector or only through the porous polymer column to the detector. During the latter mode, the molecular sieve column was in a closed loop with no flow.
Three reactors were used in the study. The firstreactor as shown in Fig. 8 was made of 2.38 inch diameter stainless steel tubing, 8 inches long. The bottom of the reactor was filled with a 6-inch bed of 0.5 inch porcelain Raschig rings. The remaining volume of the reactor was filled with 0.5 inch nickel catalyst pellets. The temperature of the catalyst bed and the surface of the reactor were monitored with chromel-alumel thermocouples.

INJECTOR I
/
COLUMN SWITCHING VALVE
CARRIER GAS IN
VEN T
PORAPAK C)
HOT WIREDETECTOR
>r
MOLECULARSIE V E
Fig. 7. Dual column system with switching valve.

20
PRODUCT GAS CATALYST BED. / t h e r m o c o u p l eCATALYST BED
(.5 IN. NICKEL ' CATALYST PELLETS)
INERT BED — (.5" PORCELAIN RASCHIG RINGS)
REACTOR . SURFACE
THERMOCOUPLE
REACTANTFEEDTHERMO
COUPLEPREHEATED GASOLINE-AIR MIXTURE
Fig. 8. Schematic of Reactor I.

21
The second reactor as shown in Fig. 9 was composed of two concentric stainless steel tubes. The reaction chamber tube was 2 inches in diameter and 6 inches long.The shell tube was 2f inches in diameter and 6 V 16 inches long. Spiral tubing flow guides were placed in the annular space between the inner and outer walls. Cooling air was admitted at the top of the reactor.in the annulat space and ejected into the atmosphere at the bottom of the reactor.The bottom of the reaction chamber was filled with a 4 inch bed of 0.5 inch porcelain Raschig rings. The remainder of the reaction chamber was filled with 0.5 inch nickel .catalyst pellets. The temperature of the catalyst bed was monitored with a chromel-alumel thermocouple.
The third reactor as shown in Fig. 10 was made of 1§ inch stainless steel pipe, 1 2 inches long and with an internal diameter of 1.61 inches. The reactor was filled . with 0.5 inch porcelain Raschig rings. No catalyst bed was present. Chromel-alumel thermocouples were appropriately placed in the reactor as to measure the temperature profile in the axial direction.
The nickel catalyst used in the first two reactors was obtained from the Catalyst Division of Chemetron Corporation. The particular designation is Girdler G-90-C1 nickel reforming catalyst. "The G-90-C catalyst contains 15% nickel coated on a high temperature porous refractory carrier.

22PRODUCT GAS
COOL AIR
THERMOCOUPLE
CATALYSTBED
SPIRAL FINS " AND FLOW GUIDES
INERT BED
PREHEATED GASOLINE-AIR MIXTURE
Fig. 9. Schematic of Reactor II.

4 PRODUCT GAS23
.61
PORCELAIN 0 .5 " RASCHIG RINGS
REACTANT FEED THERMOCOUPLE
PREHEATED GASOLINE-AIR MIXTURE
Fig. 10. Schematic of Reactor III.
REAC
TOR
BED
THE
RM
OC
OU
PLE
S

ProcedureProper start-up of the experimental apparatus for
the partial oxidation of gasoline with air must avoid the formation of carbon within the reactor. Theoretically, carbon formation will occur for air/fuel mass ratios of 5.15 and lower. Soot formation can plug the apparatus terminating the experimental run. The basic procedure used in order to avoid carbon formation was to initially maintain the air/fuel mass ratio well above 6 . This proved to be successful. '
The first step in the experimental procedure was the. warm-up of the gas chromatograph. The gas chromatograph was allowed a minimum of 4 hours for warm-up to insure accurate gas analysis. The standard recommended gas chromatograph start-up procedure was used (10).. The conditions at which the gas chromatograph operated were:
1) The carrier gas (helium) flow rate through the column was 20 ml/min,
2) The temperatures of the oven and the detector were 110°F and 125°F, respectively.
After the gas chromatograph was allowed to equilibrate j the main body of the experimental apparatus was ready for start-up. The four heaters and the temperature recorder as well as the air flow through the product gas heat

exchanger and water flow through the condenser were turned on. Through experience in operating the apparatus, the four powerstat transformers used as power sources for the heaters were set at the appropriate power input settings in order to obtain the approximate desired temperatures of the system. Final adjustment of the power input settings were made later. The system was then allowed to heat up until the temperature of the reactor reached 1600°F. At that point, air and gasoline were introduced to the system at an air/fuel mass ratio well above 6 .
As soon as the reaction initiated, as indicated by a sharp rise in the reactor bed temperature, the reactor heater w a s .shut off and the air/fuel mass ratio was slowly reduced to 6 . During this period, final adjustments to the powerstat transformer settings were made in order to obtain the proper reactant feed temperature. The reactant feed temperature was set at 425, 500 and 600°F, depending upon the run. Temperature of the gasoline-air mixture entering the superheater was maintained around 40 0°F to prevent condensation of gasoline within the system.
Once the reaction initiated and the air/fuel massratio was reduced to 6 , gas samples were periodically in-
ljected into the gas chromatograph for product gas analysis. Sample injection was accomplished by use of an 8 -port linear

26
gas sampling valve. The gas chromatograph was initially in the dual column mode. After 5^ minutes, the column was switched to the single column mode, dead ending the molecular sieve column. After the components CHi*, C02 , and C 2H 4
were recorded on the chromatogram or after a period of 2
minutes, the column was switched back to the dual column mode. The remaining components Hz, N 2 and CO, which were trapped in the dead ended column, were then recorded. The dual column system’s flow diagram is illustrated in Fig. 7. The dual column system was necessary for complete separation of the gaseous mixture since CO 2 would have irreversibly adsorbed on the molecular sieve column, thus deactivating it. The molecular sieve column was needed for the separation of N 2 and H 2 since these two components do not separate in the Porapack Q column. During the entire run, the temperature of the reactor bed, reactant feed, preheated air, and gasoline were monitored and recorded.
For the first two reactors used, termination of the experimental runs occurred after the reactors melted near their bottoms. (This will be discussed in more detail in the discussion of results section.)i After reactor failure, immediate shutdown of all electrical equipment was accomplished by switching off the master electrical switch. This included shutdown df all heaters, and most importantly,

27
shutting off the gasoline feed. The third reactor runs did not have capability of shutting off the gasoline feed by a master electrical switch since the gasoline flow was induced by nitrogen overpressure rather than an electrical pump.The air flow was not affected by the shutdown procedure since it was manually controlled by a needle valve. The air flow was maintained until the system was purged of all hydrocarbons.
The third reactor was built such that the axial temperature of the reactor at four different positions could be monitored. When the maximum temperature within the reactor reached 2 1 0 0 °F at any point, the gasoline flow was manually shut off and the reactor was allowed to cool to 1300 - 1600°F. Once the reactor was cooled to the prescribed temperature, the gasoline was again introduced to the system and the reaction reignited. At temperatures below 1300°F, reactor heating was necessary to initiate the reaction.This was done several times at different initial reactor bed temperatures. After demonstrating that the reaction would occur at a rapid rate with a reactant feed temperature of 425°F and without catalyst, the third reactor system was shut down. Shutdown consisted of turning off all electrical equipment and the gasoline feed. Air flow was maintained until the system was purged of all hydrocarbons.

DISCUSSION OF EXPERIMENTAL RESULTS
The failure of the first two reactors during the initial portion of this study to determine the effect of fuel lead additives on the catalytic activity of nickel oxide has lead to the discovery that surface combusion may be the predominant mechanism in action. The first two.reactors melted in the porcelain packing section near their bottoms. Figures 11, 12 and 13 illustrate the extent of destruction. For reactor melt to occur, the temperature associated with the melted portion of the reactor must reach about 2600°F (the melting point of 304 Stainless Steel).Four theories were developed to explain the reactor melt phenomenon. In the first three theories proposed, it was assumed that the nickel oxide catalyst promoted a catalytic reaction and the porcelain Raschig rings were inert and had no effect on the reaction rate.
Summary of Results Tables 2, 3, and 4 list the important experimental
results and the conditions prevailing when they were obtained. The operating conditions of each reactor are listed in Table 2. No reactor melt occurred for Reactor III since the axial temperature profile of the reactor was monitored
28

29
Fig. 11. Destruction of Reactor I.

Fig. 12 . Interior destruction of Reactor II.
■ ! :
Fig. 13. Exterior destruction of Reactor II.

31Table 2. Operating Conditions of the
Three Reactors
Operating Conditions ReactorI I I . III
Air/fuel mass ratio 7.4Feed rate (lb/hr) 8.4Time between reaction ignition q gy
and reactor melt (hr)Reactor operating mode adiabaticNickel oxide catalyst
present yInlet temperature of the Ann
feed (°F) . bUU
6.37.35.0
air-cooled yes -
500
5.156.15
no melt* adiabatic
no
425
*Runs of 27 minutes after ignition were achieved before dangerous temperatures were obtained and the reactor was shut down.
Table 3. Theoretical and Experimental Product Composition
Product composition data was not obtained for Reactor I. -
Composition - Mole % (dry BasisJComponent Reactor II Reactor III
Theoretical Actual Theoretical ActualHydrogen 2 0 . 0 16.5 23.0 21.4Methane --- ---" 0 . 1 1.5Ethene --- --- --•“ 0 . 6Carbon Monoxide 23.7 23.8 24.5 2 2 . 8Carbon Dioxide 2 . 6 6.3 0 . 8 5.4Nitrogen 53.7 53.4 51.6 48.3
1 0 0 . 0 1 0 0 . 0 1 0 0 . 0 1 0 0 . 0

Table 4. Reaction Zone Movement (Obtained from Reactor III Data)
Reaction zone movement is described by the time required for the reactor bed, one inch from feed port,, to attain a temperature of approximately 2100°F versus maximum monitored pre- ignition bed temperature.
Initial Maximum Bed . Temperature (°F)
Time Required (minutes)
1 2 0 0 271250 231350 161500 4

33
enabling shutdown of the reactor when dangerous temperatures were approached. This was not the case for the first two reactors. Details of the cause of the two reactor melts and the reasons why they were not prevented are discussed later. The product compositions obtained compare favorably with the theoretical equilibrium product composition mentioned in Table 3. It should be noted that Reactor III resulted in a high hydrogen yield without the presence of the nickel oxide catalyst. The product composition data was not obtained for Reactor I since it failed before a sample of the gaseous product could be taken. Table 4 relates the maximum bed temperature just before ignition occurs to the time required for the bottom portion of the reactor to reach a temperature of approximately 2100°F. This shows that increasing the bed temperature results in accelerating the rate at which the reaction front reaches the bottom portion of the reactor and increases in temperature.
Flame Front Theory The first reactor failure theory was the Flame Front
Theory. Figure 14 illustrates the basic thought behind the theory. Initially, the hot gasoline-air mixture enters the bottom of the reactor and passes through the porcelain bed.A uniform flow pattern is established and the reactants then enter the catalyst bed. A catalytic reaction takes place

PRODUCT GAS
CATALYTIC REACTION INITIATES FLAME
FLAME FRONT TRAVELS DOWN REACTOR
FLAME FRONT STABILIZED AT BOTTOM MELTS REACTOR
CATALYSTBED
O tsWI/INERT
BED
\HOT G ASO LIN E-A IR MIXTURE
Fig. 14. Flame Front Theory.

35and the temperature of the bed increases. When the catalyst bed temperature is sufficiently high to ignite the homogeneous gasoline oxidation reactions, a flame front develops. The homogeneous flame front then travels down the reactor until it stabilizes at the bottom, increasing in temperature until reactor melt occurs.
The basic idea behind the theory is that the catalytic bed triggers the flame front. The flame, front then travels through the gas phase, virtually independently of the packing characteristics. However, the downfall of the Flame Front Theory is that typical flame propagation velocities for hydrocarbons are in the neighborhood of 1 - 2 ft/sec. The velocity of the reactants within the reactor was in the range of 16-20 ft/sec. If a flame front did develop within the reactor, it would have been immediately blown out of the reactor bed. The reactor did not have the ability to maintain a flame front. Thus the Flame Front Theory was dropped.
Pin-Hole Leak TheoryThe second theory proposed was the Pin-Hole Leak
Theory. The basic thought behind the Pin-Hole Leak Theory is illustrated in Fig. 15. Again the hot gasoline mixture enters the bottom of the reactor and passes through the packed bed. No reaction at any time occurs in the porcelain bed. A flow pattern is established and the gasoline-air

PRODUCT GAS
REACTION OCCURS IN CATALYST BED
CATALYST BED
INERT BEDNO REACTION OCCURS IN INERT BED
LEAK DEVELOPS GASOLINE -A IR MIXTURE ENTERS ATMOSPHERE AND IGNITES
HOT GASOLINE -A IR MIXTURE
Fig. 15. Pin-Hole Leak Theory .

37
mixture enters the catalytic bed where the partial oxidation reactions take place. The temperature of the catalytic bed increases, heating up the stainless steel walls resulting in a pin-hole leak. Small amounts of hot gasoline leak to the atmosphere and react in a localized area around the leak.The leak increases in size due to the localized burning of gasoline until reactor failure occurs. (The adiabatic flame temperature for the stoichiometric combustion of hydrocarbons in the gasoline range is about 4000°F.)
According to the Pin-Hole Leak Theory, the basic cause for reactor failure is the development of a leak in the wall of the reactor. The second reactor was designed to prevent the pin-hole leak phenomenon from occurring. Cooling air blown through a reactor jacket was used to reduce the surface temperature of the reactor and, if a leak did develop, to sweep out any hydrocarbons in order to prevent localized burning near the leak. In spite of these precautions, the second reactor melted in the same general area as the first. The Pin-Hole Leak Theory was discarded on the basis that, first, the second reactor was designed to prevent the occurrence and development of the pin-hole leak, and secondly, because of the improbability of such an occurrence happening twice in the same portion of the reactor.

Hot Spot TheoryThe third theory was the Hot Spot Theory which is
illustrated in Fig. 16. Again a hot gasoline-air mixture enters the bottom of the reactor and passes through the porcelain b ed. The flow patterns are established and the reactants enter the catalytic bed. The reaction occurs and a hot spot develops in the catalyst bed. Through heat conduction, the hot spot moves down the reactor until it reaches the catalyst bed-porcelain bed interface. At this point, the hot spot increases in temperature so as to promote the occurrence of the homogeneous partial oxidation reaction. The porcelain packing, through heat conduction, would be hot enough to support the homogeneous reaction.The hot spot moves out of the catalyst bed into the porcelain bed and travels to the bottom of the reactor. The hot spot stabilizes at the bottom of the reactor and increases in temperature until reactor failure occurs.
The basic mechanism for the hot spot to travel is by heat conduction through the solid packing. The solid packing then has enough energy associated with it to promote the occurrence of a homogeneous reaction. The catalyst bed acts as a trigger for the development of the hot spot. The third reactor results (to be discussed) indicated that no catalyst was required in order to induce the partial oxidation

PRODUCT GAS
HOT SPOT DEVELOPS IN CATALYST BED
MOVES OUT OF CATALYST BED, TEMPERATURES SUFFICIENT ENOUGH TO SUPPORT THERMAL RACTION
HOT SPOT STABILIZED MELTS SIDE OF REACTOR
CATALYSTBED
NERTBED
I
*
HOT GASOLINE -A IR MIXTURE
Fig. 16. Hot Spot Theory.

40
reaction to occur at a temperature lower than required for a thermal reaction. In the third reactor, the partial oxidation reactions were supported solely by porcelain packing. The Hot Spot Theory was then ruled out since it required the presence of a catalyst to initiate the formation of the hot spot.
Surface Combustion Theory The fourth and final theory proposed was the Surface
Combustion Theory which is illustrated in Fig. 17. Surface combustion is the promotion of gas-phase oxidation and reduction reactions between fuel and air in close proximity with a solid surface (11). The reactant mixture enters the bottom of the reactor and travels through the porcelain bed until it reaches a point at which the temperature of the porcelain or catalytic surface is sufficiently high to induce the occurrence of the partial oxidation reactions. A reaction zone develops for which the reaction goes to completion or close to completion. A fraction of the energy released in the reaction zone is transported by conduction to the packing upstream from the zone, raising the temperature sufficiently to promote movement of the reaction zone down the reactor. The reaction zone stabilizes at the bottom, increasing in temperature until reactor melt occurs. According to the Surface Combustion Theory, no nickel oxide

REACTION ZONE MOVING DOWN REACTOR
a PRODUCT GAS
CATALYST BED
INERT BED.
/////////77
HOT GASOLINE -A IR MIXTURE
Fig. 17. Surface Combustion Theory.

• ■ v 42catalyst is necessary to induce the occurrence of the partial oxidation reaction; any surface may do just as well.
The third reactor was designed to test the Surface Combustion Theory. In the third reactor, the axial temperature profile was monitored and no catalyst (only porcelain Raschig rings) was present. The reaction initially occurred at the top of the reactor and the resulting reaction zone moved toward the bottom, increasing in temperature. Experimental temperaturertime reaction zone movement is illustrated in Fig. 18. The fact that the partial oxidation reaction occurred without the nickel oxide catalyst under the same conditions as JPL operated their catalytic reactor indicates that the enhanced reaction rate may have been due to the catalyst substrate rather than to nickel oxide activation sites. The composition of the product gas, as shown in the summary of results from the third reactor without the catalyst, were comparable to JPL’s product gas composition from their catalytic reactor. Another point in favor of the surface combustion explanation is that JPL conducted an experimental run of about 100 hours with leaded Indolene (Federal government standard test gasoline) fed to their catalytic reactor. This test resulted in no catalyst deactivation, not a totally expected result if the reactions were indeed catalytic.

TEM
PE
RA
TU
RE
(°
F)
2500
2000 -O 0
1500REACTANT FEED TEMPERATURE
BOTTOM PORTION OF REACTOR BED TEMPERATURE
MIDDLE PORTION OF REACTOR BED TEM P E R A TU R E
TOP PORTION OF REACTOR BED T E M P E R A T U R E
1000
500
REACTOR SHUTDOWN
3020 25 35TIM E AFTER IGNITION (MINUTES)
Fig. 18. Typical temperature history of Reactor III.

44
A computer simulation was made to show whether a reaction zone induced by surface combustion in the downstream position of the reactor would then migrate upstream to the bottom of the reactor and stabilize under the operating conditions of the third reactor (details of the computer simulation will be discussed later). The model behaved in essentially the same way as did the third reactor. These facts lend strong support to surface combustion as being the mechanism responsible for the reactor failures.
Test of the Surface Combustion Theory
As discussed earlier, the third reactor data has shown that the partial oxidation of gasoline will occur at an increased reaction rate in the presence of ceramic packing material as well as in the presence of nickel oxide catalyst. The composition data of the product gas and operating conditions were comparable to JPL's catalytic reactor results as shown in Table 5 (1 ).
The results from the third reactor also clarified the probable cause of the first two reactor melts. It was initially thought that the maximum bed temperature would be in the catalyst portion of the reactor since it was assumed that a catalytic reaction was Occurring. If this had occurred, an excessive temperature in this zone would have

45Table 5. JPL Catalytic Hydrogen
Generator Output CompositionFeed: Indolene and Air
Volume %Component :-----
Theoretical Actual
H 2 22.8 21.60CH4 0.1 1.03CgHi* 0.09CO 24.3 23.06C02 0.8 1.23H 20 0.8 1.20N 2 51.2 51.25
100.00 100.00

46
resulted in the immediate shutdown of the system and the reactor would have been saved. However, when reactor failure occurred, the temperature of the catalyst bed was considerably below the melting temperature of the reactor. Figures 19 and 20 show the temperatures recorded previous to and during reactor failure. As it turned out, the hottest point in the reactor was not in the catalyst bed but near the bottom of the reactor, whereas temperature probes in the first two reactors were placed in the middle of the catalyst bed near the top of the reactor. As indicated in Fig. 18, the temperature in the upper portion of the third reactor was fairly constant as the reaction zone moved upstream even though the bottom portion of the reactor showed a marked increase in temperature. This illustrates how the failure could occur without indication of a significant rise in the temperature of the catalyst bed.
The data obtained from the third reactor also showed that the preignition maximum bed temperature influenced the rate at which the reaction zone moved down the reactor and the resulting magnitude of the temperature in the bottom portion of the reactor. For instance, the maximum bed temperature monitored for one run was 1200°F (near the top of the reactor), and the time required for the bottom portion of the reactor to reach 2100°F after reaction ignition

TE
MP
ER
AT
UR
E
(°F
)
2500REACTOR MELT OCCURRED
2000REACTOR SURFACE TEMPERATURE
REACTOR BED TEMPERATURE
REACTANT FEED TEMPERATURE1500
1000
500
REACTORSHUTDOWN
10 5020 40 60 7030TIME AFTER IGNITION (MINUTES)
" v l
Fig. 19. Temperature history of Reactor I.

TE
MP
ER
AT
UR
E
(°F)
2500
2000 -
1500 -
REACTOR MELT OCCURRED
X REACTOR SURFACE TEM PER A TU RE
O REACTOR BED TEM PER A TU RE
© REACTANT FEED TEMPERATURE/REACTOR
COOLER TURNED UP
tREACTOR
SHUTDOWN
K-O-
1000 -
20 30 40 50 60 70 80 90 100 110 120 130TIME AFTER REACTOR STABILIZED (MINUTES)Fig. 20. Temperature history of Reactor II.

was approximately 27 minutes. But with an initial bed temperature of 1500°F, the time required for the bottom portion of the reactor to reach 2100°F was only 4 minutes. The reaction zone movement results are tabulated in Table

PACKED BED SURFACE COMBUSTION COMPUTER MODEL
Surface combustion apparently is the controlling reaction meachanism associated with the partial oxidation of gasoline in a packed bed reactor. A computer simulation was performed to demonstrate that a moving reaction zone induced by the presence of a hot surface can move to the inlet portion of the reactor and stabilize there. Details of the theoretical aspects of surface combustion and the computer model used to describe the surface combustion phenomenon are discussed in the next two sections. The results of the computer simulation are discussed in the final section.
TheorySurface combustion is the promotion of gas-phase
oxidation and reduction reactions between fuel and air in close proximity with a solid surface. Exploratory work dealing with the inducement of air-gas mixtures to react below their homogeneous ignition point on the surfaces of solids was performed as early as 1820. In 1902, W. A. Bone began systematic investigations of the effect of hot surfaces on combustion (12). By 1907, he had concluded that:
1) Hot surfaces accelerate combustion of gaseous fuel-air mixtures,
50

512) The chemical reactions are confined to the
boundary layer region between the gaseous and solid phases,
3) The accelerating effect of a hot surface on combustion increases with increasing temperature,
4) Surface combustion depends upon absorption of the combustible mixture on the surface whereby it becomes "activated" by association with the surface.
Although such surface combustion phenomena have been recognized for the past 154 years, theoretical evaluation of the role which a hot surface plays in the reduction and oxidation reaction mechanism and the appropriate experiments to verify the reaction mechanism have not been performed. A p plications utilizing surface combustion since its discovery have accepted the fact that it exists rather than to theoretically analyze the phenomenon.
i Computer ModelA computer model was developed to test the feasi
bility of a reaction zone moving down the reactor and stabilizing near the inlet feed portion of the reactor. The reaction zone model was developed to have the same basic

52characteristics as surface combustion. These characteristics are:
1) Higher reaction rate than normally obtained without the presence of a solid surface, and
2) Reaction ignition below the normal ignition point associated with the combustible mixture.
The basic concept behind the computer model was that the reaction zone would have the capability of moving up or down the reactor depending upon the energy transport mechanisms in action and the energy release associated with the reaction zone.
Chen and Churchill (13.14) have done a similar study dealing with combustion in an unpacked tube. The study involved the development of a theoretical model for stable combustion inside a refractory tube to match previously obtained experimental results. The model was developed for steady-state operation rather than for transient behavior. Through their work, it was found that a rapid reaction takes place in a very narrow zone and the overall process was apparently insensitive to the details of the kinetics and mixing. Energy transfer upstream by radiation to promote reaction zone movement and stabilization was found to be important for their particular geometry. The temperature of the wall rather than of the gas stream

' 53was arbitrarily used in the reaction rate expression since ignition was presumed to start at the hotter wall.
Vortmeyer and Jahnel (15) have developed a generalized mathematical model for moving reaction zones in fixed bed reactors. Moving reaction zones were obtained by the solution of the interdependent and unsteady state, one . dimensional energy, and material balance differential equations for a fixed bed catalytic reactor with a fast, exothermic reaction. They found that energy transfer by radiation in a packed bed reactor was relatively unimportant. Energy radiation effects increased the transient velocity of the reaction zone by only a few percent.
Vortmeyer and Jahnel had developed an earlier model (16) which is strikingly similar to the model developed independently in this study (to be described later).The basic concept behind their first generation model was to utilize the one dimensional unsteady state energy balance to track the movement of a reaction zone. This model (and the one developed in this study) had a simplified rate term and deleted such phenomena as radiation heat transfer and mass diffusion which were included in their latest model. They found that the earlier, simpler version was adequate to represent the basic elements of the moving zone behavior.

54The energy equation used in the packed bed surface
combustion model in this study is shown below.
*HRr - »sCps £ - kEFF l£ + gVCPg E + <T " TA)In this model, energy transfer upstream was assumed due to thermal conduction alone. All other energy feedback mechanisms were considered negligible. For simplicity, in this work, zero order kinetics were assumed. The reaction rate was assumed to be not only concentration, but also temperature, independent. This concept was incorporated into the energy balance by defining a reaction zone within which the reaction goes to completion. This eliminates the need for the mass balance. Using this concept, the effective rate of reaction was determined by the zone length.
Three other assumptions were made in the computer model. First, the temperature profile in the radial direction was assumed flat. The Peclet number (Pez = p VC D/k)
8 Pgwhich is the dimensionless group indicating the ratio of energy convection to energy conduction for the computer
' ' _ i
model was 80.6, indicating the validity of the first assumption. The next assumption was that the gas phase was in thermal equilibrium with the solid phase at each position in the reactor. Although reactors with fast exothermic

55
reactions exhibit substantial differences in temperature between solid and gas in the range of the reaction zone where the reaction rate is very high, the one dimensional homogeneous model was applied. Since the movement of the reaction zone depends on the conductive heat flux from the reaction zone to the no-reaction parts of the bed, the application of the method appears to be appropriate with only minor temperature differences between solid and gas everywhere but within the reaction zone. The final assumption was to neglect radiative energy transport within the packed bed.
An initial condition and two boundary conditions were necessary for the solution of the energy equation used in the model. The conditions used are as follows:
I. C. T = T 00 for all z when t = 0 ,B. C. 1 T = T 0 at z = 0 ,B. C. 2 9T/9z = 0 as z oo ,
where T 0° is the initial feed temperature and T Q is the feedtemperature at any particular time during the run. The computer program had the ability to solve the equation with a linear increase or decrease in the feed temperature. A no- reaction zone was added to the end of the hypothetical computer reactor and the second boundary condition was used at the end of this zone. The purpose of this zone was to

56
establish a boundary condition at the exit of the reactor so that the Thomas implicit numerical technique (17) could be used to solve the differential equation. Details of the implicit technique are discussed in Appendix A.
The hypothetical reactor used in the computer simulation had essentially four zones. The descriptions and the corresponding mathematical equations associated with each zone are shown in Fig. 21. The position of the reaction zone depended on the temperature profile of the reactor.When the temperature of the reactants reached the ignition temperature, the initial front of the reaction zone would be established at that point providing that it was outside the bounds of the no-reaction zone (Zone IV).„ The no-reaction zone was the only fixed zone in the model.
In the computer simulation, the system went throughthree stages: reactor heat-up, reaction ignition, and fullydeveloped reaction zone movement. These three stages are illustrated in Fig. 22 along with the initial temperature profile. The reactor bed is heated up by energy transfer through the walls of the reactor until reaction ignition occurs. After ignition, the location of the reaction zone was continually adjusted to match the point at which the temperature of the reactants reached the ignition temperature. If part of the reaction zone is in the no-reaction zone", incomplete reaction of the reactants occurs and energy

>
57
ZONE I ZONE ZONE 12
REACTION ZONE
ZONE I -P R E -R E A C T IO N ZONE. TEMPERATURES IN SU FFIC IENT TO INDUCE SURFACE COMBUSTION.
0 = C PS f i " K E F F y + z° g v C Pg W + ^ (t - t a )
REACTION Z O N E -R E A C T IO N OCCURS AND GOES TO COMPLETION. ZERO ORDER K INETICS ASSUMED.
2H Rr =/°G C Ps T T ■ KEFF 7 ^ + ^ 3 v C PG + ( T - T A )
W H E R E r ~ MA SS FLOW RATE wnc.nL r - R E A C T |0 N 2 0 N E VOLUME
ZONE H T -P O S T -R E A C T IO N ZONE. REACTION COMPLETED IN REACTION ZONE. THUS NO REACTION OCCURING IN ZONE H I . SAME EQUATION AS IN ZONE I .
ZONE H - N O - R E A C T I O N ZONE. NO REACTION OCCURING AT ANY TIME DURING THE COMPUTER SIMULATION. SAME EQUATION AS IN ZONE I .
Fig. 21. Computer simulation model.

IN IT IAL CONDITION
58
11
ZONE I 1 ZONE H1t
I
1 ZONE m\-----------IJ____________Y
REACTION IG N IT IT IO NREACTION TAKING • PLACE
NO REACTIONKICK
T ZONE HZONE I
FULLY DEVELOPED REACTION ZO N E
T
T - TE M P E R A T U R E W IT H IN THE REACTOR
X - D ISTANCE FROM T H E BOTTOM OF T H E REACTOR
T KICK ~ REACTION IG N IT IO N T E M P E R A T U R E
L - REACTION ZO NE L E N G T H
^ t KICK
ZONE 1
ZONE H I
REACTION ZONE Iz o n e nr
REACTOR H E A T - U P
ZONE I
Fig. 22. Initial condition and the three stages in the computer simulation.

59is still transported in through the walls of the reactor.As soon as the reaction zone moves completely out of the no - reaction zone, the reaction goes to completion and the reactor is switched to an adiabatic or an air-cooled mode. This switch was irreversible so that the reaction zone had the possibility of being blown out of the reactor. The specific case used in this simulation was the adiabatic one making Zone IV an adiabatic no-reaction zone, thus strengthening the validity of the second boundary condition. This condition closely approximates the actual conditions under which the experimental reactor was operated.
Computer Simulation Results The results of the simulation to test the feasilibity
of the Surface Combustion Reactor Melt Theory and to simulate the results from the third experimental reactor are summarized in Fig. 23 which gives temperature versus axial position at various time intervals. The experimental points match the computer simulated curves quite well for a first generation computer program. Details of the computer program are given in Appendix A, including parameter values used.The computer simulation shows that a reaction zone can travel down the reactor and stabilize at the bottom under the operating conditions of the third reactor. It should be noted that when fitting the computer results with the

TE
MP
ER
AT
UR
E
(eF
)
2500
2000
1500 - 2 0 Minute/s
8 Minutes
IG N IT IO N1000 E X P E R IM E N T A L POINTS
0 IG N IT IO N
A 8 M IN U T E S
O 2 0 M IN U T E S
— S IM U L A T IO N
5 0 0
2 4 6 8 10 12POSITION R E L A T IV E TO REACTOR I N L E T ( IN C H E S )
Fig. 23. Computer simulation results.

61experimental data, only the reaction zone length was varied as a fitting parameter. The thermochemical properties of the system were obtained from the literature and held con-
Istant. The computer simulation shows that with a constant reaction rate (i.e., constant reaction zone length), the temperature of the zone increases as the zone moves down the reactor; however, a major limitation of the computer simulation was that it did not predict temperatures sufficient for reactor failure. The steady state maximum temperature never exceeded 2600°F. This was due to the fact that the reaction zone length, which in reality is intrinsically related to the reaction rate, in the computer program was assumed to be independent of temperature. More realistically, an increase in the temperature within the reaction zone increases the reaction rate, thus causing the reaction zone to decrease in length and to move down the reactor at an increased rate. Experimental results bear this out (as illustrated in the reaction zone movement results listed in Table 4). A self-feeding effect is observed whereby:the reaction zone increases in temperature as it moves down the reactor thus causing an increase in reaction rate and an a additional increase in temperature. When the zone, reaches the bottom, temperatures of the zone will continue to increase until failure of the reactor wall occurs.

62
A fractional factorial experiment Was performed on the computer model to test its sensitivity with respect to seven parameters. A 23 factorial design as shown in Table 6 may be used to estimate the effects of seven factors utilizing Yates algorithm (18) „ If the interactions A B , AC, B C , and ABC may be assumed zero or negligible, other major effects may be substituted in their place. Thus, factors D , E, F , and G may be "equated" to A B , AC, BC, and ABC of Table 6, respectively. The + and - signs of the appropriate column then give the levels of the corresponding factor in each treatment combination. The design for this study is given in Table 7.
The basic assumption associated with a design of eight observations used to estimate the effects of seven factors is that all interactions are zero or negligible. However, this was not the case and compounding factors played a role in the analysis (this will be discussed later). The seven parameters varied in the sensitivity experiment were: (1) the effective thermal conductivity, k ^ p p (2)the energy release per standard cubic foot of reactants, Q; (3) the heat capacity of the solid, C ; (4) the heat capac-
Psity of the gas, C ; (5) the reaction zone length, Zone;
g '(6) the inlet reactant feed temperature, T 0°; and (7) thereactant feed rate, Wgas. The parameters were varied ± 10%

63
Table 6. 23 Factorial Designs
Observation A B C AB AC BC ABC TreatmentCombination
Xiy 2y 3y 4y5y6y 7y8
+ - -
- + -
+ - +- + +
+ + +
+
+
+
+ +
+
+
(1)ab
abc
acbeabc

64Table 7. Design for Seven Factors in
Eight ObservationsWhere in this study:
A = Effective thermal conductivity (k^pp)B = Energy release per standard cubic foot of
reactants (Q)C = Heat capacity of the gas (Cp^)D = Heat capacity of the solid (Cp )E = Reaction zone length (Zone)F = Inlet reactant feed temperature (T0°)G = Reactant feed rate (Wgas)
Observation A B C D E F G TreatmentCombination
y j - - — + + + - (1)y 2 "fr* “ - - + + 3.y 3 by + + - + • ■ - - - dy 5 - - 4" + - - 4- cy 6 + - + -' + - 6y y - + + - f
y g + + + + + + + g

65
of the values used to simulate the third reactor experi-r ■ y. W
mental results.The results of the sensitivity study are listed in
Table 8. The analysis of the factorial design experiment were based on three characteristics of the computer simulation which are:
1) The time, after ignition, required for the reaction zone to reach its final position at the bottom of the reactor,
2) The final position, measured from the bottom of the reactor to the bottom of the reaction zone, and
3) The maximum temperature attained in the reaction zone. ■ ~ .
The sensitivity study had shown that an increase inC was the strongest factor in retarding reaction zone Ps
movement whereas an increase in Q was the strongest parameter for the promotion of zone movement. The other parameters appeared to have a sizable effect on the reaction zone transient velocity. The importance of the effect of each parameter on the reaction zone position appears to berelatively uniform. Increases in Q, C , T , and Wgas tend
Psto cause the reaction zone to stabilize closer to the bottomof the reactor, whereas increases in , C , and Zone
pg

Table 8. Computer Model Sensitivity Study ResultsTime: The time, after ignition, required for the reaction zone to reach its final
position at the bottom of the reactor.Position: The final position, measured from the bottom of the reactor to the bottom
of the reaction zone.Maximum Temperature: The maximum temperature attained in the reaction zone.
Parameter*Time Position Maximum Temperature
Results(seconds)
MeanEffect
Results(inches)
MeanEffect
Results (°F)
MeanEffect
Overall Mean 32 25.5 0.60 0.57 1859.3 1880.1VEFF 20 - 5 0.48 0.06 1764.8 -108.4
Q 24 - 7 0.48 - 0.06 2099.6 108.9Cp c 20 9 0.60 - 0.06 1781.8 -25.5
cPz 40 ' 4 0.60 0.06 1849.8 7.4Zone 24 4 0.72 0.06 1778.6 97.8rp 0 0 16 - - 4 0.48 . - 0.06 1927.2 5.2Wgas 28 - 5 0.60 ■ - 0.06 1979.3 86.2
*In the sensitivity study the + and - levels for each parameter were obtained by varying the values of the parameters used to match the third reactor experimental results by ± 10%.
OxOx

67
have the reverse effect. Four parameters, ^ppp» Q , Zone, and Wgas have a strong effect on the maximum temperature obtained in the reaction zone. Increasing ^gpp was the strongest factor in lowering the maximum temperature, while an increase in Q was the strongest factor in increasing themaximum temperature. The other three parameters, C , C ,
Pg P sand T q 0 apparently play a relatively minor role in this effect.
The results of the sensitivity study were physically reasonable except for one, the reaction zone length’s effect on the maximum temperature attained within the reactor.When varying the reaction zone length to match the data obtained from the third reactor, it was found that the maximum temperature of the zone increased with decreasing length, But the results of the sensitivity study had shown the reverse effect for this particular parameter. In the fractional factorial experiment, interactions were considered negligible. However, in this case, the assumption was incorrect. Compounding factors buried the true effect of the zone length on maximum temperature. The mean effect calculated for this factor was actually the summation of the effects dictated by the reaction zone length and two interaction factors, Q - Wgas and kgpp - . From a physicalpoint of view, one can see that the Q - Wgas interaction is

68
strong since both terms involve the amount of energy that would be released in the zone. The other interaction, kgpp - , would tend to extract energy from the zone thusdecreasing the maximum temperature of the zone when the two values are increased. It is most likely that the Q - Wgas interaction has buried the true effect of zone length on maximum temperature within the zone since the two effects are opposite in nature.
Needless to say, other interactions could have had an adverse role in the determination of other parameters’ mean effect on the computer simulation's results. However, the determination of the interactions of various parameters was beyond the scope of this study and is left for future investigation.

CONCLUSIONS AND RECOMMENDATIONS
As seen from the results of the study, surface combustion appears to be the controlling mechanism for the partial oxidation of gasoline with air in a packed bed reactor. The third reactor results have demonstrated that the presence of nickel oxide catalyst is not necessary to increase the reaction rate for the partial oxidation reaction. A ceramic packing can apparently be used to obtain essentially the same results as those of J PL’s catalytic reactor. This conclusion is admittedly based on a small amount of data but could result in a significant cost saving for the development of a practical hydrogen generator and also may eliminate concern for the possibility of catalyst deactivation due to fuel lead additives and sulfur contained in commercial gasoline.
Needless to say, further work must be done to more fully characterize the reaction mechanism before a useful hydrogen generator can be developed. For instance, it is essential to investigate the relationship between the reaction rate and various types of packing material in order to determine for sure whether the effect is non-catalytic (not surface specific). The particular porcelain packing used in the study could have had catalytic properties and a
69

70
catalytic reaction (surface specific) could have resulted rather than a surface combustion phenomenon. In order to test the Surface Combustion Theory, an experiment using different types of packing should be performed. Previous work (11) has shown that different types of surfaces affect differently the rate of the gas-phase reactions between fuel and air due to the absorptivity of the reactants to the particular surface. Whether the molecules become activated by association with the surface and then react in the gas phase or whether they are activated by radiative heat transfer from the hot surface or by some other mechanism is also an open question. The relationship between the reaction • rate and the surface area to volume ratio should also be investigated since this characteristic of the packing may provide a means of controlling the runaway reaction which resulted in failures in this study.
As in most first generation computer programs, improvements can also be made in this area. One obvious improvement would be the insertion, of a temperature dependent reaction zone length. With this improvement, one should be able to track experimental data quite well. The computer program could then be used to correlate reaction zone length which is intrinsically related to the rate of reaction, to the packing material, and to the surface to volume ratio within the reactor.

. 71' After characterization of the reaction mechanism has
taken place, further development of a practical hydrogen generator is in order. Information obtained from the previously recommended studies should aid in the development of appropriate methods of controlling energy release while maintaining a compact hydrogen generator.
The conclusions reached to describe the reactor failures were based on a minimal, amount of data since the experimental runs were so short and were reached without the benefit of supportive information found later in the literature (12 - 15). This supportive information adds considerable credence to the conclusions which were largely the result of engineering judgment.

APPENDIX A
COMPUTER SIMULATION
A computer program was developed to test the feasibility of a reaction zone moving down the reactor and stabilizing near the feed inlet. The program numerically solves the energy equation:
- >sCps H - kEFF B r + PgVCpg g ♦ ^ CT - V
where______ mass flow rate______volume of the reaction zone
and calculates the velocity and temperature of the gas at various positions and time intervals. These values are printed in tabular form along with a graphical temperature profile within the hypothetical reactor.
Method of Solution:Implicit Technique
As a matter of preference, the energy equation wasput into dimensionless form as shown below:

73
where the dimensionless variables were defined a s :
T - ta8 = — T- A1 o
C = x/L
and the dimensionless constants are:
AHLr LAK =
P_VC_ T /g P g
kEFFa = PgVV6 = 2UL
PgVCpgR
The Thomas Implicit Numerical Method was used to solve the partial differential equation. This method incorporates the interdependence of the temperature at all points within the system at a particular time level. It is also unconditionally stable eliminating any restriction imposed by a At - Ax relationship required for stability of certain numerical techniques. Further discussion of this implicit method can be found in the literature (17).

74
The energy equation was discretized with respect to time and the partial differential equation was transformed to a finite difference equation using the appropriate relationships associated with the implicit technique. These derived relationships are listed below.
8 = ei
9_6_3t
6,iA t
3_63C
6i+l ~ 9i-l 2AC
3 2 8 6i + l 26i + 6i-lAC:
Rearrangement of the difference equation yielded:
A6i„1 ♦ B8. 4- ce.tl = D.
where
A = - 01 + 1AC 2 AC
B =
C = - AC^ 2AC

The n linear equations which result at each time step are listed below.
B91 + C@2 = D 1
A 92 + B93 + C94 = D3
A 6 i _ l + B 8 i '-+ C 9 1 + 1 - D j
Aen-2 + B8n-1 + C6n = Dn-1
A9n-1 + B6n * Dn
The matrix of coefficients A, B , and C alone is called a tridiagonal matrix. The system of equations for each time step can be solved by a Gaussian, elimination method. With a maximum of three variables per equation, the solution can be expressed very concisely. In short, the complete algorithm for the solution of the tridiagonal system is:

where the 3's and y 1s are determined from the recursion formulas.
31 B Yi - D1/61
n
i = 2. 3 n
A more complete discussion of the method of solutionfor a tridiagonal matrix and a generalized computer subroutine (TRIDAG) used to solve the system of equations is available (17).
simulation were calculated based on averages. The temperature range 600 - 1800°F was used as a basis for the averaging. The effective thermal conductivity of the system was based on an arithmetic average of values for the solid packing and the gas. Heat capacity was defined in the usual way
Computer Input All thermo-physical properties used in the computer

77
C
-T2C dT
_ •'T1 P pm CT2 - T O
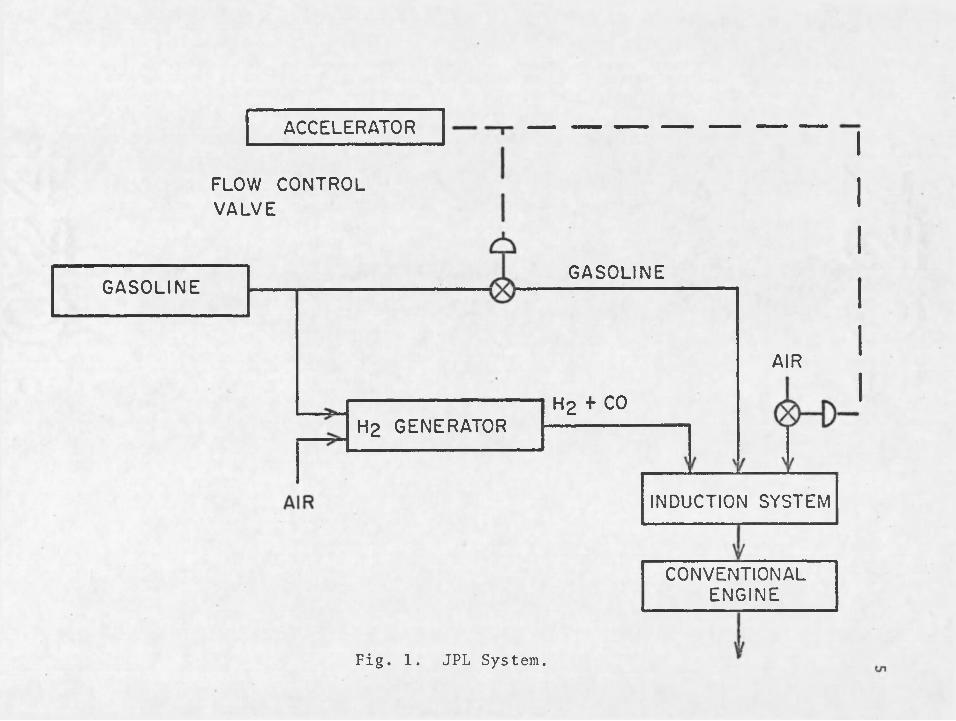
was used for the heat capacity of the various components.All the physical properties, except for the overall heat- transfer coefficient and the reaction rate, were found in the literature (19 - 22). The overall heat-transfer coefficient was selected to match the experimental temperature profile of the reactor before reaction, ignition, whereas the reaction zone length, which is intrinsically related to the reaction rate, was varied to match the experimental data after ignition. These were the only physical properties varied in the computer simulation. Table 9 lists the computer input variables and Table 10 gives a sample input listing.
Computer Output Figures 24, 25, and 26 give sample computer outputs
based on the values listed in the sample input section.
Computer Listing The computer listing is given in the following pages
after the sample computer output.

78
Table 9. Computer Program Input Data
ComputerCoded
VariableUnits Definition
NCASEMW
ZCPC
PROD
WGAS
RHOSCPS
VOIDKEFF
RU1
U2
TA1
TA2
TOOTGRAD
PQ
IntegerIb/lb-mole
dimensionlessBtu/lb0F
dimensionless
scf/min
lb/ft3 - Btu/lb°F
dimensionless Btu/ft hr°F
inBtu/ft2hr°F
Btu/ft2hr°F
°F
°F
°F/min
psiaBtu/scf
Number of cases to be runAverage mole weight of reactant
feedCompressibility factorMean mass heat capacity of the
gasRatio of the moles of product
after the reaction goes to completion to the moles of feed
Standard volume feed rate of the reactants
Density of the packing materialMean mass heat capacity of the
packingVoid fraction of the packingEffective thermal conductivity
of the packingInner radius of the reactorOverall start-up heat transfer
coefficientOverall reaction heat transfer
coefficientStart-up ambient heater temper
atureReaction ambient atmosphere
temperatureInitial feed temperatureFeed temperature change with
respect to timeReactor pressureEnergy release density per
standard cubic feet of entering feed

Table 9, Continued 79
ComputerCoded
VariableUnits Definition
TKICK • °F Ignition temperature of the reactants
LA in Actual reactor lengthL in Hypothetical computer reactor
lengthZONE in Reaction zone lengthBELT min Numerical time stepsI TOP Integer Number of sections in which the
hypothetical reactor is divided by
IPRITT Integer Number of time jumps required before output data is printed
TIMLIM min Time at which the computer simulation run is terminated
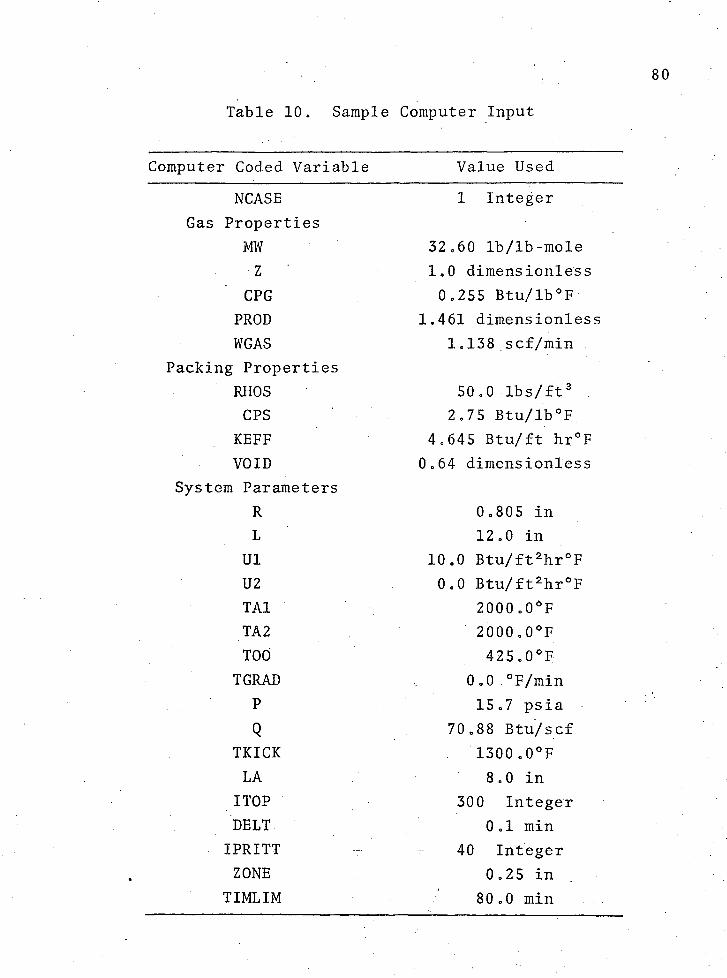
Table 10. Sample Computer Input
Computer Coded Variable Value UsedNCASE 1 Integer
Gas PropertiesMW 32.60 lb/lb-moleZ 1.0 dimens ionless
CPG 0.255 Btu/lb°FPROD 1.461 dimensionlessWGAS 1.138 scf/min .
Packing PropertiesRHOS 50.0 lbs/ft3 .CPS 2.75 Btu/lb°F
KEFF 4.645 Btu/ft hr°FVOID 0.64 dimensionless
System ParametersR 0.805 inL 12.0 in
U1 10.0 Btu/ft2hr°FU2 0.0 Btu/ft2hr°FTA1 2000.0°FTA2 2000 „0°FTOO 425.0°F
TGRAD 0.0 °F/minP 15.7 psiaQ 70,88 Btu/scf
TKICK 1300 .0°FLA 8.0 in
I TOP 300 IntegerDELT 0.1 minIPRITT - 40 IntegerZONE 0.25 in
TIMLIM 80.0 min

—— — — m— — — WWI1 mw I . I wwi— —TTff • 1 0 . 0 0 F|f.UfC$
. C t t Tikd f'CM TIM6I641U*! tXIf'l? ACTU I CAS .
.•flCTre ecTTC" tofGpfcs r> cr Vfl c 7V , Ttf6FfATU»E VEXSUS MII6NTt c aniCN ir / cc» .
r.cc 473.0 0.00 . *. . ?t 499.9 0.03 . X. .*e 56". 6 o.oc • X
.7? 634.9 0.00 X. .96 (97.1 c.co X. 1.Z0 755.4 C.00 X. 1.46 609.9 C.00 X. 1 .69 BcO. 5 c.co X. 1 .93 907. 3 C.00 X. 7.17 9i( . 4 0.00 X. ?.<! 9o9.e c.co X. 7.6? 1073.1 c.co X. 7.19 1557.0 C.00 X. 3.13 10'5.4 0.00 X
1.37 1110.4 C.00 X. 3.(1 1117.7 c.co X. ?.fS 1131.0 0.00 X. 4.0« 1 U 7 . 1 0.00 X. 4.33 1160.6 0.00 X. 4.S6 1191.9 c .00 X
4. »Z 1701.3 C.C1 X. 5.(6 17:4.6 c.:: X
5. 30 1714.9 c.co X. 3.14 1719.7 o.co X. 5.76 1273.3 0.00 X. ( .07 1776.4 0.00 X
6.76 1776.6 C.00 X. 6.50 1733.1 o.oo X. 6.74 1731.3 o.co X. 6.96 1237.4 0.00 X
7.77 1733.0 0.00 X. 7.46 1732.5 0.00 X. 1.71 1233.a 0.00 X. 7.9s 1734.0 0.00 X
".19 1734.7 C.00 X. 6.43 17 34.3 o.oc X. 6.67 1234.4 o.co X. ".91 1734.4 c.co X. 9.13 •1234. 4 c.co X
9.39 1234.4 c.00 X9.63 1234.5 o.co X9.67 173'.. 5 o.co X10.11 1x34.5 c.cc X
1C.35 1234.5 0.00 X. 1C.60 1234.3 c .50 X. 10.64 1734.5 0.00 X. 11.06 1234.3 0.00 X. 11.37 17 34.5 o.co X
11.56 1234.5 0.00 X. u . tc 1234.3 0.30 X
mmrnmm aw — wa— q —— i rnmmmmmmm i ■ m wmmmmmmmmammmmmmmmmmtasm
Fig. 24. Sample computer output: Preignition temperature profile. 00H

• Z«.00 *>INOTES
. OMliNCE f#cm IfN7l66lU*E EME d l ACTUA I GAS .
.•F*CTn» C CT TON cotcefr $ FI C( VEIC CITY . TENFC9ATU9E VERSUS HEIGHT FROFIIEITnfHfSJ •E4CTI0N (FT /SEC) .
• o.co 421.0 0.00 5 . . *. .?* 461.1 O.CO 7 . *. .IF 117.7 0.00 9 . • X• .72 177.1 o.co 1 . X• .96 639. 6 o.co 4 . . X. 1.70 7(0.7 o.co t . X. 1.44 710. 3 c.oc 9 . . X. 1 .69 (.14.6 0.13 . X. 1 .43 666.1 o.co 3 . X
7.17 91*.0 c.oo 5 . X .2.41 9 0 . 1 o.cc 7 . • X
. 7.66 1001.7 0.00 8 . • X2,69 1039.9 o.co 0 . . X
. 3.13 1074.9 0.00 1 • X
. 3.37 1106.6 0.00 2 . . X
. 3.(1 1131.2 c.oc 4 . • X
. 3. *5 iibC.e o.co 1 . . X4.(9 1163.4 0.00 5 . X4.13 120 3.4 c.co 6 • . X
. 4.16 ir.’c.i o.co 7 . X
. 4,62 1221.9 o.co 8 . . X
. 3.C6 1149.2 0.00 8 # • X
. 3.31 17(3.9 c.oo 9 . • X
. 1.14 1313.7 0.00 0 . X
. 1.71 1412.4 .64 8 . X
. f .07 167*.e 1 .CO 12 4 . X
. t. 76 162 9.6 l.CO 17 3 X
. F. 11 1 b 2 (- • 9 1 .CO 17 I X6.74 116 9.2 1.00 11 9 . X
. (.46 1147.7 l.CO 11 7 . X7.72 I S O . 7 l.CO 11 4 . X
. 7.46 14SC.6 1.00 11 1 X7.71 14(3.4 l.CO 10 8 . X
. 7.91 1364.0 1.00 10 6 * X1.19 1331.9 1.00 10 4 .
. F.43 1316.6 1 .00 10 3
. '.67 1310.4 1.00 10 3".41 13:6.9 l.CO 10 3 .9.11 1301.7 1.00 10 3 .
. 9. 39 1301.4 1.00 1C 3 »
. 4.43 1*01.4 1.00 10 3
. 9.67 1301.4 l.CO 10 3
. 10.11 1301.4 1.00 1C 3• 10.31 1301.1 l.CO 10 3 .. 10.(0 13:1.1 l.CO 10 3 .. 10.64 1 301.1 1.00 10 3
11.Cb 1301.5 1.00 10 311.22 1 101.5 1.00 10 3 .
. ll.lo 1101.1 1.00 1C 3 .11.»0 1305.5 l.CO 1C 3
Fig. 25. Sample computer output: Reaction ignition. 00ro

M P F • 44.00 UlNUItS
.»f*rtr»FRCm
M T C H11
TCi'ei e*tu*lIDIM-Kt r 1
i*iritLr
R C A b M C N*C1U*l Vll cc IF 1/
CAS . TV .t o .
. 0. 0 424.0 0.70 3.4 (41.3 0.00 4;t U C l . O 0.00 6.z 1644.4 if. 4 11.t 19)4.1 i.oo 13.
i! 14)4.5 1.00 13.i. 4 14)4.0 1.00 13.
. i . 9 14)4.4 1.C0 13.i. J 19)3.6 l.CC 13.r. 7 1*32.4 1.00 13.
. ? . 1 1923.Z 1.00 13.
. ?. 4 14)2.9 i.oo 13.
. z . 4 14)2.6 1.C0 13.3 1932.Z l.CO 13.7 14)1.5 1.00 13.
. 3. I 1430.6 1.00 13.4 1429.3 1.00 1 3.
. 4 . 9 1427.6 1.00 13.
. 4 . 1 1425.3 1.00 13.
. ». e 1922.3 1 .CO 13.
. 4 . z 1916.6 1.00 13.
. 3. 6 1413.9 1.00 13.
. >. 140?.3 1.00 13.4 1921.7 l.CO 13.
3. e I**'.). 9 1.00 13.. f . l 1(45.0 1.00 13.. #. t 1474.6 1.00 13.• t . 1763.4 1.00 13.• < . 4 1 f •. C . 6 1.00 13.. f . 4 1(36.9 l.CO 13.. T. 2 1*21.7 1.00 13.. 7. 11C5.2 l.CO 13.
7. 1 17(7.3 1 .00 13.. 7. 1 1746.5 1.00 12.. «. 9 174?.3 1 .CO 12.
3 1726.9 1 .31 12.. f . 7 1714.6 l.CO 12.
1 16 71.3 1.03 • 12.1437.2 l.CO 12.9 13)2.6 l.CO
• 4. 3 1107.7 1.00 12.• e . 7 15‘2.6 1.00 11.. 10. 1 1357.6 1.90 11.
1C. 4 15 3 3.2 l.CO 11.. 10. 1509.5 l.CO 11.. 10. 4 1467.0 l.CO 11.
11. 6 1466.2 1.00 11.11. z 1447.7 1.00 11.11. 6 143Z.5 1.00 11.
. 11. 0 1422.) 1.00 10.
Fig. 26. Sample computer output
T t r M » * T U * t VCRSUl H E I G H T PROFILE
20 minutes after reaction ignition03Lti

84
PRCGPAr MUT. ( INPUT, OUTPUT, r APT V INPUT, 1 APbb«:;'vT PUT )COM.". ON 1MC TA (1 CCO ),CTHCTA ( 1C 00 ), P E AC I (1 COO ) , V( L ( 1000 ) , EXTENT (1000)
1, (jot ) 000 ) , GA,“PA ( 1C00 ), 0( 1CC0 ), I TOP, I E NO, TGRAO, TOO, OT AU, T IME, L, TA DIMENSION X(ICOO)REAL KEEP, I, MW, LA
C H:ILL CAT\REAO(V,lOlNCASE
10 FORMAT(110)DO 9C0 ICASE‘1,NCASE
C READ IN GAS PPEFERTIFS1 READ (D, 100),“ W, Z,CPG, PR CD, WG AS
100 FORMAT(bFlO.3)C READ If. PACKING PROPERTIES
READ(5,100)PHDS,CPS,KPFF,VOID C READ IN SYSTEM PAPA.METERS
READ(S,100)R,L,L1,U2,TA1,TA2,T00,TCRAC,P,0,TKJCK,LA REA0(‘y,200) ITOP ,(-EL T , I PR T T , ZONE , T I ML I M
200 FORMAT(I10,F10.3,I10,2F10.3)C ITS ALL IN SO LETS PRINT IT CUT
WRITE(6, 300) MW,Z,CPC 300 FORMAT(1K1,XGAS PPCPERTIES ARE, MW■K,F10.2,K, Z■K,F1C.5,K,HE AT CAP
1ACITY-*,F10.3,KBTU/LR F K)WRITE(6,310)RH0S,CPS,KEFF,VOID
310 FORMAT (1 HO, 4'X, /PACKING PROPERTIES APEX/5X, A DENSITY »X, F10. 3, XLB/FT 13K/5X,/HEAT CAPACITY «^,F10.3,kOTU/L3 FK/5X,,EFFECTIVE THERMAL CCN 2DUCTIVITY '/,F10.G,KBTU/FT-HR-FK/5X,xv01D FRACTION -X,F10.3)WRITE(0, 320)R,L,U1»U2,TA1,TA2,TOO,TGRAO,P,0, TKICK
320 FORMAT(1 HO,4 X,XPE ACTOR SYSTEM PARAMETERS AREX/5X,XRAD I US »X,F10.4, 1XINCHESX/5X, XLENGTH -X,F10.3,/INCHESX/GX,X START-UP HEAT TRANSFER C 20EFF « X , F10.4,X3TU/FT2-HR-FX/GX,XRE ACTION HEAT TRANSFER COEFF «x,F 310.4, xnTU/FT2-HR-FX/5X, HEATER TEMPERATURE «X,F10.I,xFx/5X,XAf.PIEN 4 T HOOD TEMPERATURE « X , F 10. 1, X F X /5 X. X IN T I TI aL REACTOR FED TEMPER AT'J 5RE •X,no.l,XFx/5X, x TEMPERATURE GRADIENT x X, F10. 3 , x F /1 N X / 5X, xPR E SS 6URE OF SYSTEM -X,F10.I,XPSIAX/5X,xENERGY RELEASE DENSITY «x,F10.2# 7XBTU/SCFX/5X,XRFACTION START-OFF TEMPERATURE =X,F10.1# XFX)TIME-0.TA-TA1THET A(1)-1-TA1/TOO U-Ul
C PRE-CALCULATIONSVELS«V:'GAS*144. / (60.*3. 14159*R*R) GASK-WGAS*MW+CPG+144./(359.*60.*3.141G9+R*R)ALPHA»-KEFF*12./(GASK*3 6C0.<'L)BETA - 2.<U*L/(CASK*R*3600.)XTOP- IT L P-l IEND-LA*XTCP/L*1 DETA-1,/XTOPHEAT »0*L/(TCG*ZONE*GASK)IKICK-1T0P+1 ISTOf-I KICKVEL0-Wf’AS*Z*lC.7*144. / (359.*60. *3. 14159*P*R*P*V0ID) DTAU«GASK*0ELT*1?.*bO. /(RHCS*CPS*L )A » - ( ALPHA/(DFTA*DETA)*O.G/CCTA) B-1./DTAU*3ETA*(2.-ALPHA)/((;ETA*DETA)C«-AlPHA/(DFTA-CCTA)*C.S/OETAWRITE(6,G02)GASK,ALPHA,BETA,OETA,HEAT,DTAU,A,B,C
502 FORMAT(1HC,4X,XGASK.X,F15.10, /5X,XALPHA■x,F15.10, /5X,XB5TA - X,F15

85
1.10, /SX, ifOETA«i<,ri 5.1 0, /5X,«HCAT-X,F15.10, /5X, X01 AU'X, F15.10, / 25X, KA.K, FIS’. 10, /5x,fB.#,FlD.10, / 5X, fC ■ f, F 15.10 )DC 3 21 k - 1 , I TCP 1HETA(h)■1 — T A/ICC
321 07HE1A(K)-THETA (K)THFTAK«(TKIC<-1A)/TG0NCCUhT-CISIGK'C
C 1NITALI7E X,EXTENT,PEACT00 20 1-1,ITCP X(I)-0.EXTCN1(I)«0.
20 REACT! !)*1.C CALCULATE VELOCITY
30 DO 265 I-1,I TOP265 VE K I) «VELC* (TCO*THETA( D + TA + 460. )*REACT( I)
C C ALC IL ATE D11«ITOP-1 DO 282 1*3,11
282 D( I)-HEAT*VELS*X(I)♦OTHETACI)/DTAUD(2)«HEAT*VELS*X(2)*0THE7A(2)/DTAU-A*THETA(1)
C TRIDAG INVERTS TR IDI AGOf.AL NATRIX TC SOLVE FCP THE T ASB B (2 ) « RGAMMA(2)“0{2)/BB(2)NECUAT-I TOP-1 NSTOP- ITCP-2 DO 600 I«3,flSTCP BE( I ) cE-A-frC/BB ( 1-1)
800 GAMMACI)■(DC 1)-A*GAMMA(1-1))/BB(I)BB(HE0UAT)sB*C-(A*C)/e3(NST0PlGAMMA (l:E CUAT >» (0 ( ME CL'A T ) - A * G AMM A ( NS TOP ) )/BD(NEOUAT)THETA( NECUAT 1 «GAMMA { ME C'JAT )LAST-ITOP-3 DO 002 K«1,LAST I»N£ CUAT-K
602 THETA( 1)=GAMMA(I)-C*THETA( I U >/RB( I )IHETAtITOP )» THE T A{NtQUA 1)TIME-TIME+DELT C RESET X,EXTENT,REACTIF(IKICK.GT.TEND) GO TO 860 JKICK-IKICK-1 DO 652 I-l,JKICK X(I)-0.EXTENT(I)-0.
852 REACT!I)-1.DO 654 I-IK1CK,ISTCP 1FCI.GT.IE NO)GO TO 360 X(I)»1.EXTENT(1)*(I-IXICK)*L*DETA/ZONE
654 REACT ( 11 • 1. ♦ 1 FP.CO-1. )*EXTENT (I)DO 856 1 -ISTCP,ITOPxm-o.EXTENT<I>-1.
856 REACT(I)'PROD 860 CONTINUE
.THETAll)"(TCO+TGRAD+TIME-TA J/TOO NCCUM'NCOUNT + l

86
C S A VC O l C V A L U E S OF THE TAD O 2 G O I • ! > I T CP
2 6 0 O T H E T A ( I ) ■ THf; T A ( I )C C H E C K TC SEE IF THE R E A C T I O N H A S K I C K E O - C F F . R E S E T U# TA IF SOI F ( I S I G M . G E . l ) GO TO rAl I F t I S T U P . G T . I F N D ) G O TO 841 I S I G N - 1 T A - T A 2 U - U 2T H E T A K - T H E T A K * C T A 1 - T A 2 ) / T 0 0B E T A - 2 . * U * L /(CASK*R*36 0 0 . )e«l./ O T A U » e f T A *(2.* A L P H A)/ ( D E T A * D E T A )D O 2 6 6 I - 1 # I T OPO T H E T A 1 1 ) - C T H E T A ( I ) ♦ ( T A 1 - T A 2 ) /T O O
2 66 T H E T A l D - T H E T A ( I ) * ( T A 1 - T A 2 ) / T 0 C6 4 1 C O N T I N U EC R E S E T I K I C K A N D I S T O P
D O 8 4 2 1 -1, 1 ENDI F C T H E T A t D . G E . T H E T A K ) G O TC 844
6 4 2 C O N T I N U E I K I C K * I T O P + l I S T O P - I K I C KD O 25 1 * 1 , IT OPxcn*o.E X T E N T ( I )=0.
2 5 R E A C T t I ) -1.G O TO 6 4 6
6 4 4 I K I C K - II S T O F * I K I C K + Z O N E / ( L * O E T A )
6 4 6 C O N T I N U EIF C N C C U h T .EO. I P P T T ) GO TO 8 5 0 G O TO 30
8 5 0 C A L L S h O W K E N C O U N T - C C C H E C K S T OP R O U T I N EI F ( T J N E . L E . T I M L I M ) G O TO 30
9 0 0 C O N T I N U E S T O P E N D

87
SUBROUTINE SHCkMECCrMCN THETA(1CCO),UTHFTA(1OCO),REACT(10C0)#VfL(1CCO),EX TENT(1030)
1»BBC 1CC0) »GA«yA(lCCC)»!}( 1COO* ITCP» IEND»TGOAC»T0!?,0TAU>TI^r,L,TA Olr.GNS !CN T(1CCC)>GISI(13C0)#PLCT(60)REAL LDATA BLANK,DCT# X/y If(ITCF.LE.SC.O) GO TO 1C IPR1 M-IT0P/50.GO TO 11
10 IPRINT-111 CONTINUE
WRITL(t,ICO) TIME 100 FORMAT(1H1,AX,X TIME • X,F10.?,* MINUTESX)
WRITE(6,110)110 FORMAT(1H0#AX,55(X.X)/5X,X.x,X DISTANCE FROM . TEMPERATURE . EXTE
1NT . ACTUAL GAS .X / 5X,f .»EACTOR BOTTOM . (DEGREES F) . OF 2 .VELOCITY .f,9X,XTEMPERA7UPE VERSUS HEIGHT PROF ILFX/5X,x. (INC 3HES) . . REACTION . (FT/SEC) .X/5X,55(X.X ),9X,60(AX.X) )DITOPeITCP DO A00 J«l,fcO
400 PLOT(Jl-BLANKDO 500 I=1,ITOP,I PR I NT T(1)«TA+THETA( I )<■ ( TCO+TGRAO*TIME )DI-IDIST(I)«l*(DI-l.)/(CITGP-l.)
C INITIALIZE PLOT wITH BLANKSC PUT A DOT ON PLOT A3CISSA
PLOT(1 ) “DOTC DETERMINE CPDIANTC POSITION OF TEMPERATUREIPLACE* T( I)Z6G.IF(1 PL ACE.GT.60 ) IPLACE-60 C PUT AN X INTO THE PLOT POSITIONPLOT(IPLACE)-X C WRITE CUT TABLE AND TEMPERATURE PROFILEWRITE(6,2 0C)0IST(I),T(I),EXTENT(I),VEL(I),PLCT
200 FORMAT(1H ,4X,f .X,F10.2,X .X,F9.1,X .X,F9.2,X .X,F8.1,X1 ,X,9X,60A1 )C REMOVE THE XPLOT(IPLACE)-ELANK C PUT A DOT BACK INTO ABCISSA JUST INCASE IT WAS REMOVED
500 PLOT(1)«DOT WRITE(6,120)
120 FORMAT(1H ,4X,55(X.X),9X,60(X.f ))RETURNEND

APPENDIX B
GAS CHROMATOGRAPH CALIBRATION AND DATA REDUCTION
Gas analysis was accomplished using a Perkin-Elmer Model 820 Gas Chromatograph with Porapak Q and molecular sieve dual column capability. For experimental compositional. data reduction, it was necessary to calibrate the chromatograph because of the different thermal responses of each component in the product gas. Three different sample mixtures representative of the expected product gas composition range were used to calibrate the gas chromatograph.The composition of each sample mixture is shown in Table 11.
A correction factor, which was defined as mole-to- area ratio normalized with respect to the mole-to-area ratio of carbon monoxide, was calculated for each component, the area being the area under peak of that particular component in the chromatogram multiplied by the attenuation factor. Although one gas mixture sample is enough to obtain the correction factor for each component, three different sample gas mixtures were used in the calibration and the average value of the correction factors was used to determine the experimental product gas composition. The average correction factors calculated are listed in Table 12.
88

Table 11. Sample Gas Composition Data
ComponentGas Analysis - Volume Percent
Sample #1 Sample #2 Sample #3
Carbon Dioxide 2.03 8.49 1.29Hydrogen 12.44 29.41 21.87Carbon Monoxide 34.48 14.61 24.67Methane 10 .65 4.56 1.13Ethene 3.01 0.81 0.116Nitrogen Balance Balance Balance
Table 12. Gas Chromatograph Correction Factors
Component Correction Factor
Hydrogen 30 .10Nitrogen 1.013Carbon Monoxide 1 . 0 0 0
Methane 1.459Carbon Dioxide 1.409Rf B ATI A T i n a

90The relative position of the appropriate component
and the time at which the column mode was switched are illustrated is a representative chromatogram shown in Fig. 27. To determine the product gas composition, the area under each of the peaks was obtained by multiplying the height of the peak by the width at one-half the peak height. The areas were then multiplied by the respective correction factors and the attenuation factor to give the corrected areas. The mole percent of each component was obtained by dividing each corrected area by the summation of the corrected areas.

PEAK
H
EIG
HT
(IN
CH
ES
)I T T
8
i i t i i i i i iGAS CHROMATOGRAPH CONDITIONS
OVEN TEM PER A TU R E - I I O ° F DETECTOR TEM PER A TU R E - I 2 5 ° F CARRIER GAS (H E L IU M ) FLOW RATE - 2 0 M L / M I N S A M P L E GAS N U M B E R 2
J_ _ L
SWITCHED TO SINGLE COLUMN MODE _ L = _ L
COg t/ATT. 8
.C2 H4 ^ ATT. I
SWITCHED TO DUALCOLUMN Hg
M0DE /VATT-2JL
ATT. 16
5 10 15
TIME AFTER SAMPLE GAS INJECTION (MINUTES)
Fig. 27. Sample chromatogram.
j
io

APPENDIX C
CALIBRATION CURVES
The following figures are the calibration curves for helium and gasoline flow meters.
92

HE
LIU
M
FLOW
RA
TE
(STA
ND
AR
D
CUBI
C C
EN
TIM
ET
ER
/MIN
UT
E)
9370
5 0
4 0
3 0
20
A - STEEL BALL
0 - GLASS B A L L
0 2 4 6 8 10
R O T A M E T E R R E A D IN G
Fig. 28. Helium rotameter calibration curve.

GAS
OLI
NE
FLOW
RA
TE
(LB
/HR
)947
6
5
4
3
2
0 20 4 0 6 0 8 0 100R O T A M E T E R R E A D IN G
Fig. 29. Gasoline rotameter calibration curve.

REFERENCES CITED
1„ Houseman, John and Cerini, D . J ., "On-Board HydrogenGenerator for a Partial Hydrogen Injection I. C . Engine," Paper prepared for 1974 SAE National West Coast Meeting, Anaheim, California, August 12-14, 1974.
2. Newkirk, M. S. and Abel, J . L ., "The Boston ReformedFuel Car," Society of Automotive Engines, New England Section, November 2, 1971.
3. Norbye, Jon P., "Siemens Catalytic Carburetor GivesCleaner Exhaust," Popular Science, December 19 73.
4. Chen, N. Y. and Lucki, S. J., "Pre-Engine Converter," Mobil Research and Development Corporation, Princeton and Paulsbord Laboratories, Princeton and Paulsboro,N. J . , April 1974.
5. William, R. D. and Lorton, G. A., "The Autogenous Hydrogen Automobile," Journal of Environmental Systems,Volume 3, Number 4, Winter 19 73 .
• i
6. Breshears, R . , Cotrill, H ., and Rupe, J., "Partial Hydrogen Injection into Internal Combustion Engines - Effect on Emissions and Fuel Economy," Presented at the First Symposium on Low Pollution Power Systems Development, Ann Arbor, Michigan, October 14-19, 1973.
7. Hoehn, F . W. and Dowdy, M. W . , "Feasibility Demonstration of a Road Vehicle Fueled with Hydrogen-Enriched Gasoline," Paper presented at the 9th Intersociety Energy Conversion Engineering Conference, San Francisco, California, August 26-30, 1974.
8. Houseman, John and Cerni, D . J., "Hydrogen-Enriched Gasoline for Autos," Automotive Engineering, November 1974.
9. Hammerstrand, Kent, "Gas Analysis," ,Varian Gas Chromatography Applications Note.
95

96
10. Perkin-Elmer, "Instructions for Model 820 Gas Chromatograph," The Perkin-Elmer Corp., Norwalk, ■ Connecticut, Copyright 1964.
11. Roessler, W.-U,, Weinberg, E. K . , Drake, J. A., White,H. M., and lura, T ., "Investigation of Surface Combustion Concepts for NO Control in Utility Boilers and Stationary Gas Turbines," Environmental Protection Technology Series, EPA-650/2-73-014, Office of Research and Development, U. S. Environmental Protection Agency, Washington, D. 0. 20460, August 1973.
12. Bone, W„ A . , "Surface Combustion with Special Reference to Recent Developments in Radiophragm Heating," Gas Journal, May 16, 19 23.
13. Chen, Joseph L.-P. and Churchill, Stuart W . , "A Theoretical Model for Stable Combustion inside a Refractory Tube," Combustion and Flame 18, 19 72.
14. Chen, Joseph L.-P. and Churchill, Stuart W., "Stabilization of Flames in Refractory Tubes," Combustion and Flame 18, 1972.
15. Vortmeyer, D. and Jahnel, W . , "Moving Reaction Zones in Fixed Bed Reactors under the Influence of Various Parameters," Chemical Engineering Science, Volume 27, Number 8-A, 1972.
16. Vortmeyer D. and Jahnel, W„, Chem. Inger. Tech., (CIT) 43, 1971.
17. Carnahan, Brice, Luther, H. A., and Wilkes, James 0., Applied Numerical Methods, John Wiley § Sons, Inc.,New York, London, Sydney, Toronto, 1968.
18. Davies, Owen C. (Editor), The Design and Analysis ofIndustrial Experiments, Hafner Publishing Company, New York, 1963. ~
19. Touloukian, Y. S. (Series Editor) and Ho, C . Y. (SeriesTechnical Editor), Thermophysical Properties of Matter, The TPRC Data Series! IFI/Plenum, New York and —Washington, 1970.

9720. Hougen, Olaf A., Watson, Kenneth M . , and Ragatz,
Roland A., Chemical Process P r i n c i p l e s , Part I:Material and Energy B a l a n c e s , John Wiley § Sons, Inc., New York, Second Edition, 37956 .
21. M c C a b e , Warren G. and Smith, Julian C ., Unit Operations of Chemical E n g i n e e r i n g , McGraw-Hill Book C o m p a n y , New Y o r k , S t . L o u i s , San Francisco, Toronto, London, Sydney, Second Edition, 1967.
22. Weast, Robert C. (Editor-in-Chief) and Selby, Samuel M. (Editor-in-Chief of M a t h e m a t i c s ) , Handbook of Chemistry and P h y s i c s , The Chemical Rubber Co., 18901 Cranwood P a r k w a y , Cleveland, Ohio 44128, 48th Edition, 1967-68.
