part six data collection for intensive mortality ... · data collection for intensive mortality...
TRANSCRIPT

Part Six
DATA COLLECTION FOR INTENSIVEMORTALITY STUDIES

XII, EXPERIENCES IN ESTIMATING DIFFERENTIALS IN MORTALITY IN DEVEL- OPED COUNTRIES-ACHIEVEMENTS AND SHORTCOMINGS OF THE VARIOUS APPROACHES"
Elsebeth Lynge * *
In recent years, interest in mortality differentials in developed countries has revived. There are two main reasons for this concern. The first reason is the obser- vation in the post-war period in some developed coun- tries of a stagnation or even an increase in male mortality. This unfavourable change has taken place simultaneously with an expansion in health care expenditures and has led to such concepts as "the diminishing return from health investments"' and "the medical nemesis".' The second reason is the general threat of ecological catastrophes caused by side- effects of technological innovations, especially from new chemicals and atomic energy.
The study of mortality differentials in developed countries today therefore serves to identify high-risk groups or unfavourable trends, which in turn indicate areas in which preventive interventions are likely to be fruitful. Valuable supplements to such mortality stud- ies are studies of health factors other than mortality, such as cancer incidence, sterility, spontaneous abor- tions and congenital malformations, and studies of the effectiveness of treatment and prevention strategies.
All mortality studies share certain traditional ele- ments, and well-tried techniques still have a role to play; but during the 1970s important methodological innovations were introduced into epidemiological studies of occupational risks, smoking, side-effects of drugs etc. This chapter gives a short description, illus- trated with examples, of each of the methods currently available for the study of mortality differentials.
A. DETECTION OF MORTALITY DIFFERENTIALS BY PLACE AND TIME FOR POPULATION GROUPS
First indications of areas where health intervention may be fruitful can often be obtained through the com- parison of mortality rates, particularly if specific by age, sex and cause, for different geographical areas and different times. The data for such comparisons are generally readily available and involve large numbers of events.
The study of the geographical variations in mortality
'The original version of this chapter appeared as document IESA/ PIAC. 1715.
**Danish Cancer Registry, Copenhagen, Denmark.
is relatively simple, requiring only consistency in data quality, the definitions used and the calculations. Con- sistent calculations of life expectancy for different countries are published by the World Health Organiza- tion (WHO).' In Europe, the highest levels of life expectancy for men are observed in the Scandinavian countries and in Greece, showing that there is no sim- ple geographical gradient in the mortality in Europe. Similarly, the study of time trends in mortality rates requires only consistency in data quality, definitions and calculations.
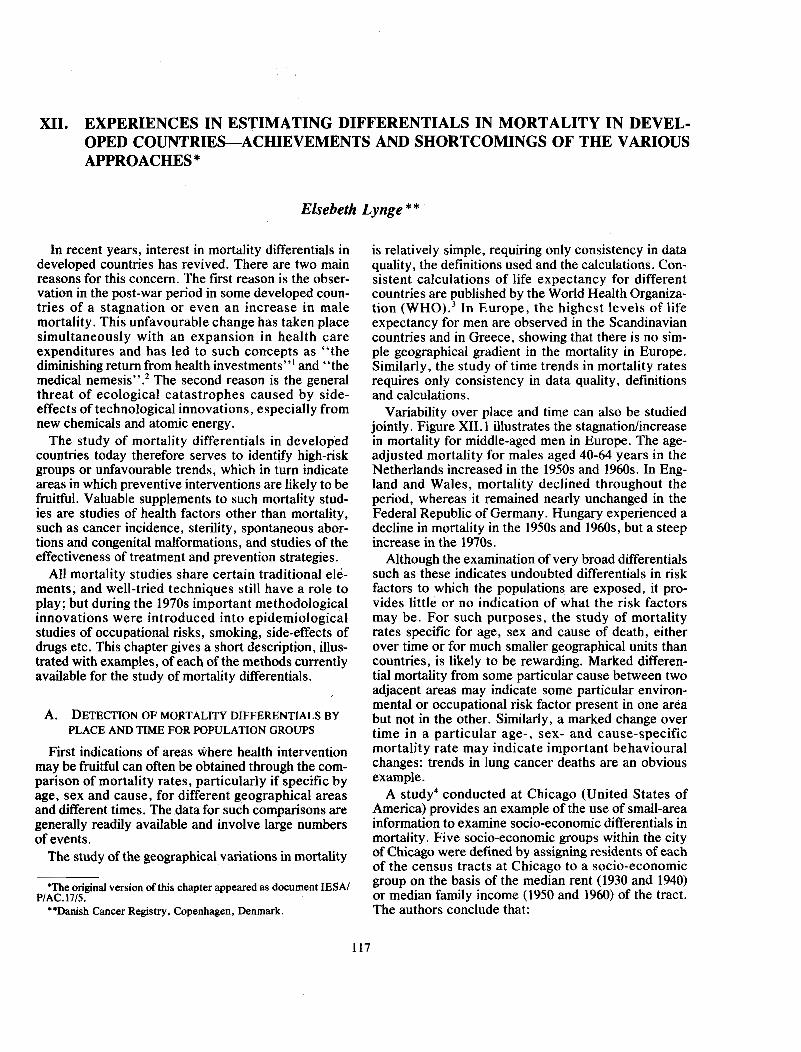
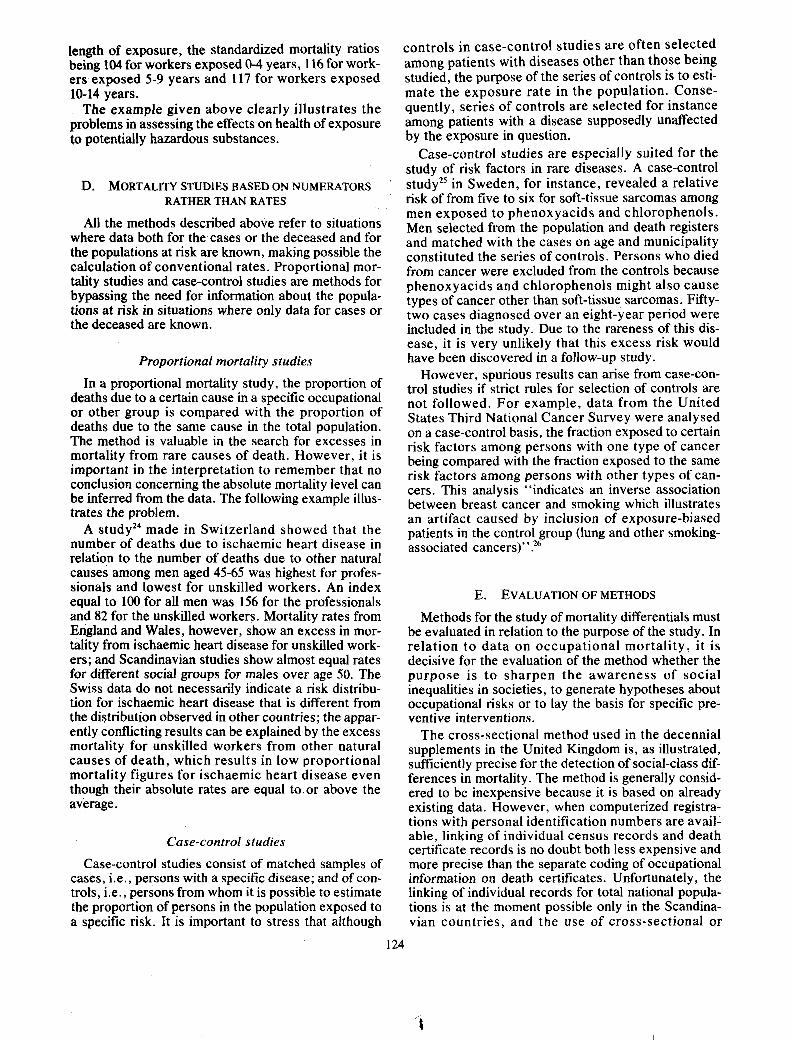
Variability over place and time can also be studied jointly. Figure XII. 1 illustrates the stagnatiodincrease in mortality for middle-aged men in Europe. The age- adjusted mortality for males aged 40-64 years in the Netherlands increased in the 1950s and 1960s. In Eng- land and Wales, mortality declined throughout the period, whereas it remained nearly unchanged in the Federal Republic of Germany. Hungary experienced a decline in mortality in the 1950s and 1960s, but a steep increase in the 1970s.
Although the examination of very broad differentials such as these indicates undoubted differentials in risk factors to which the populations are exposed, it pro- vides little or no indication of what the risk factors may be. For such purposes, the study of mortality rates specific for age, sex and cause of death, either over time or for much smaller geographical units than countries, is likely to be rewarding. Marked differen- tial mortality from some particular cause between two adjacent areas may indicate some particular environ- mental or occupational risk factor present in one area but not in the other. Similarly, a marked change over time in a particular age-, sex- and cause-specific mortality rate may indicate important behavioural changes: trends in lung cancer deaths are an obvious example.
A study4 conducted at Chicago (United States of America) provides an example of the use of small-area information to examine socio-economic differentials in mortality. Five socio-economic groups within the city of Chicago were defined by assigning residents of each of the census tracts at Chicago to a socio-economic group on the basis of the median rent (1930 and 1940) or median family income (1950 and 1960) of the tract. The authors conclude that:
"In general, despite the limitation of this approach which attributes to each individual resid- ing in a given census tract the average charac- teristics for the tract as a whole, it has demonstrated that there are wide variations in mortality by socio- economic status within metropolitan areas. These studies, as those based on individual characteristics, reveal an inverse relationship between mortality and socio-economic tatu us."^ The possible pitfalls of examining small-area differ-
entials are illustrated by a report6 from Finland on cancer incidence in relation to socio-economic charac- teristics of municipalities. This study found an increas- ing incidence of cervical cancer with increasing average income and percentage in the two highest social classes. This result is not in accordance with earlier studies, and the authors comment:
Figure XII.1. Age-adjusted mortality for males aged 40-64 years, England and Wales, Federal Republic of Germany, Hungary and the Netherlands
Number of deaths 40-64 years"
9 1950 1960 1970 1980
Year
Key: .. .......-... . England end Wales - - - - Federal Republic of Germany
Hungary -..-..- Netherlands
aAge-standardized number of deaths in a world standard popula- tion of 100,000.
"The apparently conflicting results with regard to cancer o f . . . the cervix uteri might be explained simply by the fact that, in the main, the population of the municipalities are heterogeneous, i.e., high- risk sections with a low standard of living are found even in modern industrialized environments. This also shows the problems involved in the interpreta- tion of the results of studies like this."' The detection of differentials is only a first step in
identifying the health problems involved. The second step in the process is to associate the observed differ- entials over place or time with behavioural or environ- mental differences or changes. Such studies are sometimes called "correlation studies". However, detailed individual-level studies have not always con- firmed the apparent link between excess mortality and environmental or behavioural factors found in correla- tion studies. There are several examples of apparent relationships which it has not been possible to confirm at the individual level. One such example is a positive correlation at the national level between the incidence of cancer of the rectum, and to some extent also colon cancer, and beer consumption per capita; this rela- tionship could not be confirmed in a follow-up studya of brewery workers in Denmark having a beer con- sumption above the average.
B. CROSS-SECTIONAL STUDIES OF MORTALITY DIFFERENTIALS BY INDIVIDUAL CHARACTERISTICS
Mortality differentials between areas and time peri- ods have proved very useful for suggesting the existence of specific health problems but, as has been demonstrated by the examples in the previous section, the possible confounding effects of uncontrolled fac- tors on such differentials limits their value in establish- ing causal links. For such purposes, individual-level studies with more elaborate experimental designs are essential. This section and that which follows it describe and illustrate the principal approaches in cur- rent use. Their main characteristics are summarized in table XII. 1.
Conventional cross-sectional studies
The cross-sectional study uses information on deaths and population for a particular point in time to examine mortality differentials by individual charac- teristics. The typical data sources are registered deaths to provide numerators and a population census to provide denominators. The decennial studies on occupational mortality for England and Wales provide typical examples. They are based on census data and data from death certificates. The population distribu- tion by sex, age and occupation is known from the cen- sus and is used as the denominator in the calculations. The distribution by sex, age and occupation of persons dying in a period of three or five years around the cen- sus date is taken from the death certificates and is used as the numerator in the calculations. William Farr9 pioneered this type of study, first applied using the
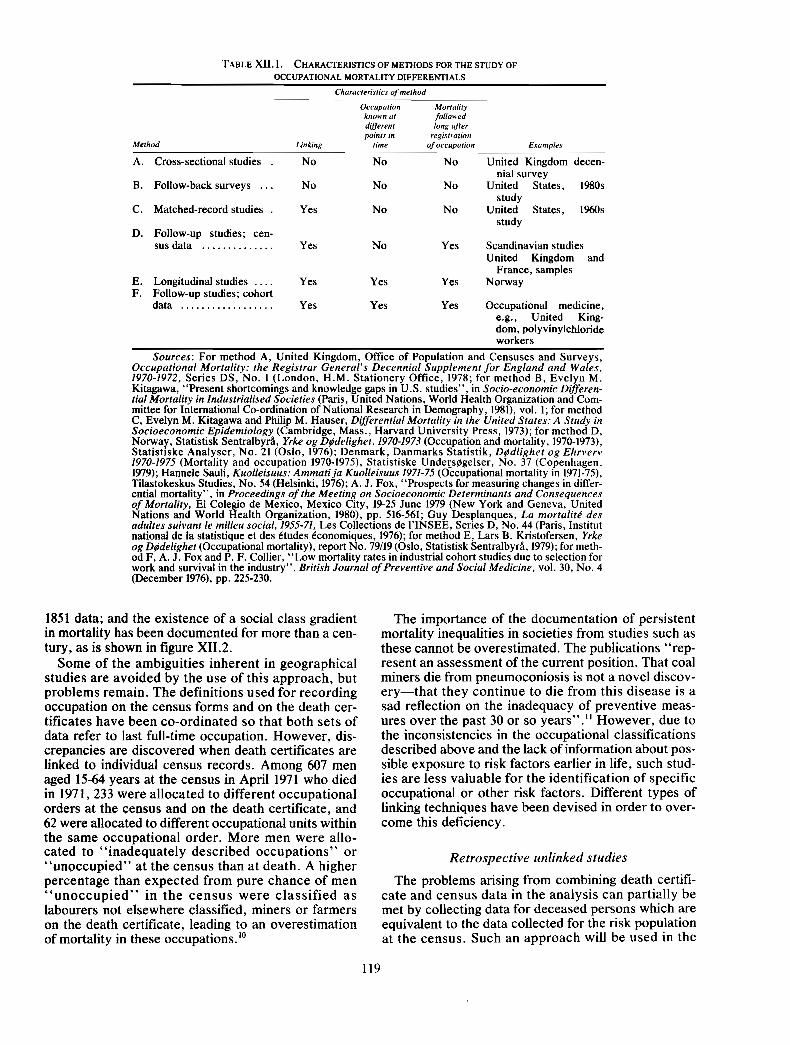
TABLE XII. I. CHARACTERISTICS OF METHODS FOR THE STUDY OF
OCCUPATIONAL MORTALITY DIFFERENTIALS
Characteristics of method
Occupation Mortality known at foNowed diff,,,: long offer pornts in registration
Method Linking rime of occupation Examples
A. Cross-sectional studies . No No No United Kingdom decen- nial survey
B. Follow-back surveys . . . No No No United States, 1980s study
C. Matched-record studies . Yes No No United States, 1960s study
D. Follow-up studies; cen- sus data .............. Yes No Yes Scandinavian studies
United Kingdom and France, samples
E. Longitudinal studies .... Yes Yes Yes Norway F. Follow-up studies; cohort
data .................. Yes Yes Yes Occupational medicine, e.g., United King- dom, polyvinylchloride workers
Sources: For method A, United Kingdom, Off~ce of Population and Censuses and Surveys, Occupational Mortality: the Registrar General's Decennial Supplement for England and Wales, 1970-1972, Series DS, No. 1 (London, H.M. Stationery Office, 1978; for method B, Evelyn M. Kitagawa, "Present shortcomings and knowledge gaps in U.S. studies", in Socio-economic Differen- tial Mortality in lndustrialised Societies (Paris, United Nations, World Health Organization and Com- mittee for International Co-ordination of National Research in Demography, 1981), vol. 1; for method C, Evelyn M. Kitagawa and Philip M. Hauser, Differential Mortality in the United States: A Study in Socioeconomic Epidemiology (Cambridge, Mass., Harvard University Press, 1973); for method D, Norway, Statistisk Sentralbyri, Yrke og Dldelighet, 1970-1973 (Occupation and mortality, 1970-1973), Statistiske Analyser, No. 21 (Oslo, 1976); Denmark, Danmarks Statistik, Dldlighet og Ehrverv 1970-1975 (Mortality and occupation 1970-1975), Statistiske Undeys@gelser, No. 37 (Copenhagen, 1979); Hannele Sauli, Kuolleisuus: Ammati ja Kuolleisuus 1971-75 (Occupational mortality in 1971-75), Tilastokeskus Studies, No. 54 (Helsinki, 1976); A. J. Fox, "Prospects for measuring changes in differ- ential mortality", in Proceedings of the Meeting on Socioeconomic Determinants and Consequences of Mortality, El Colegio de Mexico, Mexico City, 19-25 June 1979 (New York and Geneva, United Nations and World Health Organization, 1980), pp. 516-561; Guy Desplanques, La mortalit6 des adultes suivant le milieu social, 1955-71, Les Collections de I'INSEE, Series D, No. 44 (Paris, Institut national de la statistique et des Ctudes Cconomiques, 1976); for method E, Lars B. Kristofersen, Yrke og Dldelighet (Occupational mortality), report No. 79/19 (Oslo, Statistisk Sentralbyri, 1979); for meth- od F, A. J. Fox and P. F. Collier, "Low mortality rates in industrial cohort studies due to selection for work and survival in the industry", British Journal of Preventive and Social Medicine, vol. 30, No. 4 (December 1976), pp. 225-230.
1851 data; and the existence of a social class gradient in mortality has been documented for more than a cen- tury, as is shown in figure XII.2.
Some of the ambiguities inherent in geographical studies are avoided by the use of this approach, but problems remain. The definitions used for recording occupation on the census forms and on the death cer- tificates have been co-ordinated so that both sets of data refer to last full-time occupation. However, dis- crepancies are discovered when death certificates are linked to individual census records. Among 607 men aged 15-64 years at the census in April 1971 who died in 1971,233 were allocated to different occupational orders at the census and on the death certificate, and 62 were allocated to different occupational units within the same occupational order. More men were allo- cated to "inadequately described occupations" or "unoccupied" at the census than at death. A higher percentage than expected from pure chance of men "unoccupied" in the census were classified as labourers not elsewhere classified, miners or farmers on the death certificate, leading to an overestimation of mortality in these occupation^.'^
The importance of the documentation of persistent mortality inequalities in societies from studies such as these cannot be overestimated. The publications "rep- resent an assessment of the current position. That coal miners die from pneumoconiosis is not a novel discov- ery-that they continue to die from this disease is a sad reflection on the inadequacy of preventive meas- ures over the past 30 or so years"." However, due to the inconsistencies in the occupational classifications described above and the lack of information about pos- sible exposure to risk factors earlier in life, such stud- ies are less valuable for the identification of specific occupational or other risk factors. Different types of linking techniques have been devised in order to over- come this deficiency.
Retrospective unlinked studies
The problems arising from combining death certifi- cate and census data in the analysis can partially be met by collecting data for deceased persons which are equivalent to the data collected for the risk population at the census. Such an approach will be used in the
Figure XII.2. MorWity for males aged 15-64, by social dess, Eagland d WPles, 1930-1970
Standard mortality ratio
150
Social class 5 4 3 2 1 5 4 3 2 1 5 4 3 2 1 5 4 3 2 1
(Standard mortaiiiy ratio = standard all men)
United States of America for the study of mortality dif- linking of death certificates to the general census rec- ferentials in the early 1980s. A mail questionnaire will ords; and in the subsequent linking to socio-economic be sent to relatives of a sample of 50,000-70,000 records for the deceased persons supposed to be deceased persons. The occupational data for these included in the 25 per cent coded sample. Conse- deceased persons will be coded according to the 1980 quently, only 75 per cent of the death certificates were census classifications, and the census data from a Sam- ultimately matched. ple of 69,000 households will be used to provide denominators . I 2
C. FOLLOW-UP STUDIES If this approach is extended to include information on exposuie to risks earlier in life both for the Cross-sectional studies suffer from a limitation in deceased and for the household sample, the design is that they provide little information about the earlier equivalent to a case-control study with population experience of the deceased. If death is regarded as the controls (see section D). culmination of continuous exposure to various risks,
such information is clearly of value. The follow-up Matched-record studies study, whereby a population is defined by a census or
baseline survey and then followed up for a period of The approaches described above are not true indi- time, provides such information and avoids biases
vidual-level studies, but rather attempts to classify introduced by, for example, disease-related changes in events and exPo ure for relatively homogeneous PoPu- occupation prior to death. However, the costs of these I lation subgroup As such, they benefit fmm large advantages are long delays before results can be ~ ~ m b e r s of captured events, given the simple design, obtained and relatively small numbers of events to but suffer from the small number of factors that can be work with. allowed for. The matched-record study, whereby the census records for a sample of persons dying in a par- Follow-up studies based on census data ticular period are linked to the death records, provides greater scope for disaggregation, although still on a censuses can be used to identify the base population cross-sectional basis. A study undertaken in the Uni- to be followed up. The central technical problem in ted States in 1960 provides an example. l 3 Deaths such a case is the matching of subsequent deaths to the occurring in the United States during the period from initial study population. Personal identification num- May to August 1960 were manually matched to the bers facilitate this process. In France, the RCpertoire individual census records from April 1960, using national d'identification des personnes-which is a addresses. However, the census data on socio-eco- manual register-has been used for a 17-year follow- nomic characteristics were coded for only 25 per cent UP study of mortality in a sample of 5*9*0 men from of the census population and mismatching therefore the 1954 ~ ~ n s u s . ' ~ occurred at two stages in the mortality study: in the The Central Population Registers in the Scandina-
120
vian countries have been used for mortality follow-up studies of the total 1970 census populations, three-year follow-up studies in Norway1' and five-year follow-up studies in Denmark16 and Finland.17
The National Health Service Central Register for England and Wales-which is a manual register like that in France-has been used for a five-year follow- up study of mortality in a sample of 500,000 persons from the 1971 census.18
In the Federal Republic of Germany, a one-year fol- low-up study of mortality is based on data collected from a sample of 181,000 households included in two successive labour force sample surveys, also called micro-censuses. l9
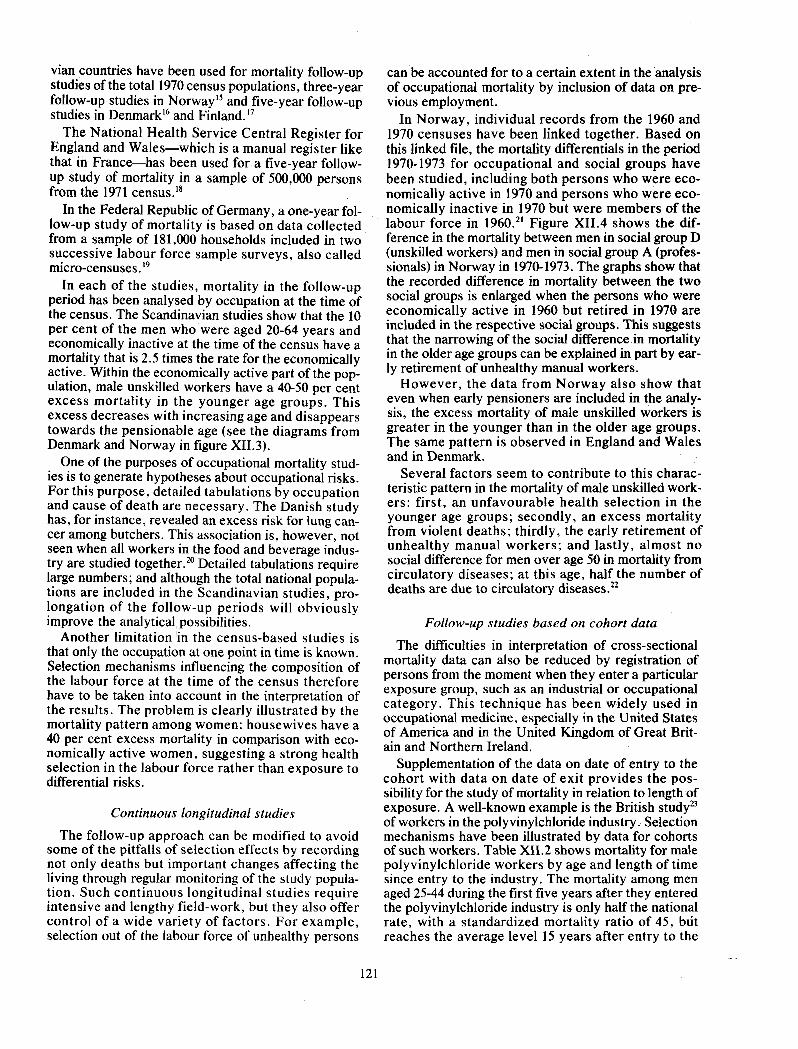
In each of the studies, mortality in the follow-up period has been analysed by occupation at the time of the census. The Scandinavian studies show that the 10 per cent of the men who were aged 20-64 years and economically inactive at the time of the census have a mortality that is 2.5 times the rate for the economically active. Within the economically active part of the pop- ulation, male unskilled workers have a 40-50 per cent excess mortality in the younger age groups. This excess decreases with increasing age and disappears towards the pensionable age (see the diagrams from Denmark and Norway in figure XII.3).
One of the purposes of occupational mortality stud- ies is to generate hypotheses about occupational risks. For this purpose, detailed tabulations by occupation and cause of death are necessary. The Danish study has, for instance, revealed an excess risk for lung can- cer among butchers. This association is, however, not seen when all workers in the food and beverage indus- try are studied together." Detailed tabulations require large numbers; and although the total national popula- tions are included in the Scandinavian studies, pro- longation of the follow-up periods will obviously improve the analytical possibilities.
Another limitation in the census-based studies is that only the occupation at one point in time is known. Selection mechanisms influencing the composition of the labour force at the time of the census therefore have to be taken into account in the interpretation of the results. The problem is clearly illustrated by the mortality pattern among women: housewives have a 40 per cent excess mortality in comparison with eco- nomically active women, suggesting a strong health selection in the labour force rather than exposure to differential risks.
Continuous longitudinal studies
The follow-up approach can be modified to avoid some of the pitfalls of selection effects by recording not only deaths but important changes affecting the living through regular monitoring of the study popula- tion. Such continuous longitudinal studies require intensive and lengthy field-work, but they also offer control of a wide variety of factors. For example, selection out of the labour force of unhealthy persons
can be accounted for to a certain extent in the analysis of occupational mortality by inclusion of data on pre- vious employment.
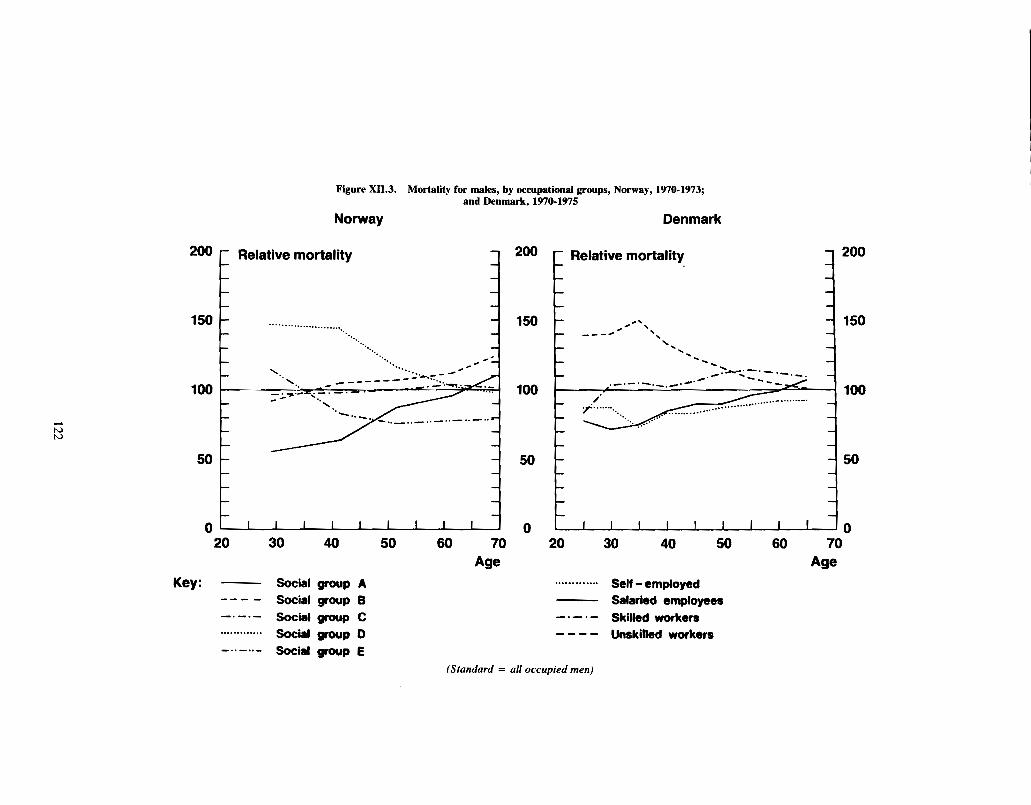
In Norway, individual records from the 1960 and 1970 censuses have been linked together. Based on this linked file, the mortality differentials in the period 1970-1973 for occupational and social groups have been studied, including both persons who were eco- nomically active in 1970 and persons who were eco- nomically inactive in 1970 but were members of the labour force in 1960.'' Figure XII.4 shows the dif- ference in the mortality between men in social group D (unskilled workers) and men in social group A (profes- sionals) in Norway in 1970-1973. The graphs show that the recorded difference in mortality between the two social groups is enlarged when the persons who were economically active in 1960 but retired in 1970 are included in the respective social groups. This suggests that the narrowing of the social difference in mortality in the older age groups can be explained in part by ear- ly retirement of unhealthy manual workers.
However, the data from Norway also show that even when early pensioners are included in the analy- sis, the excess mortality of male unskilled workers is greater in the younger than in the older age groups. The same pattern is observed in England and Wales and in Denmark.
Several factors seem to contribute to this charac- teristic pattern in the mortality of male unskilled work- ers: first, an unfavourable health selection in the younger age groups; secondly, an excess mortality from violent deaths; thirdly, the early retirement of unhealthy manual workers; and lastly, almost no social difference for men over age 50 in mortality from circulatory diseases; at this age, half the number of deaths are due to circulatory diseases.22
Follow-up studies based on cohort data
The difficulties in interpretation of cross-sectional mortality data can also be reduced by registration of persons from the moment when they enter a particular exposure group, such as an industrial or occupational category. This technique has been widely used in occupational medicine, especially in the United States of America and in the United Kingdom of Great Brit- ain and Northern Ireland.
Supplementation of the data on date of entry to the cohort with data on date of exit provides the pos- sibility for the study of mortality in relation to length of exposure. A well-known example is the British of workers in the polyvinylchloride industry. Selection mechanisms have been illustrated by data for cohorts of such workers. Table XII.2 shows mortality for male polyvinylchloride workers by age and length of time since entry to the industry. The mortality among men aged 25-44 during the first five years after they entered the polyvinylchloride industry is only half the national rate, with a standardized mortality ratio of 45, but reaches the average level 15 years after entry to the
200 c Relative mortality
Figure X11.3. Mortality for males, by occupational groups, Norway, 1970-1973; and Denmark, 1970-1975
Norway Denmark
Key: - Social group A --- - Social group 6 -.-.- Social group C ............. Soci group 0
C Relative mortality
............. Self -employed - Salaried employees -.-.- Skilled workers ---- Unskilled workers
-..-..- Social group E (Standard = all occupied men)
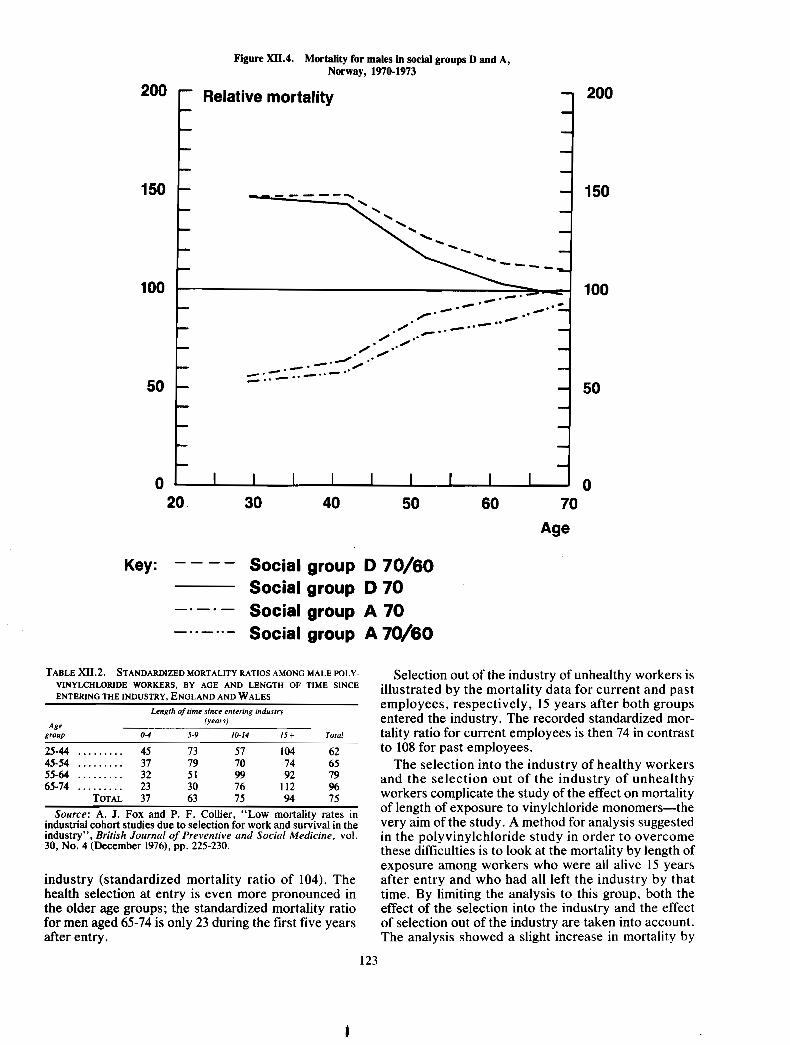
Figure XII.4. Mortality for males in social groups D and A, Norway, 1970-1973
200 1 200
Key: ---- Social group D 70/60 Social group D 70
-.-. - Social group A 70 -..-..- Social group A 70/60
TABLE X11.2. STANDARDIZED MORTALITY RATIOS AMONG MALE POLY- Selection out of the industry of unhealthy workers is VINYLCHLORIDE BY AGE AND LENGTH OF 'INCE illustrated by the mortality data for current and past ENTERING THE INDUSTRY. ENGLAND AND WALES
Length of rrme since enrerrng rndusrry employees, respectively, 15 years after both groups
(years) entered the industry. The recorded standardized mor- Age
group 0-4 5-9 10.14 IS + Total tality ratio for current employees is then 74 in contrast 25-44 ......... 45 73 57 104 62 to 108 for past employees. 45-54 ......... 37 79 70 74 65 The selection into the industry of healthy workers 55-64 ......... 32 51 99 92 79 65-74 ......... 23 30 76 112 %
and the selection out of the industry of unhealthy TOTAL 37 63 75 94 75 workers complicate the study of the effect on mortality
Source: A. J . Fox and P. F. Collier, "Low mortality rates in of length of exposure to vinylchloride monomers-the industrial cohort studies due to selection for work and survival in the very aim of the study - A method for analysis suggested industry", British Journal of Preventive and Social Medicine, vol. in the polyvinylchloride study in order to overcome 30, No. 4 (December 1976), pp. 225-230. these difficulties is to look at the mortality by length of
exposure among workers who were all alive 15 years industry (standardized mortality ratio of 104). The after entry and who had all left the industry by that health selection at entry is even more pronounced in time. By limiting the analysis to this group, both the the older age groups; the standardized mortality ratio effect of the selection into the industry and the effect for men aged 65-74 is only 23 during the first five years of selection out of the industry are taken into account. after entry. The analysis showed a slight increase in mortality by
I 123
length of exposure, the standardized mortality ratios being 104 for workers exposed 0-4 years, 116 for work- ers exposed 5-9 years and 117 for workers exposed 10-14 years.
The example given above clearly illustrates the problems in assessing the effects on health of exposure to potentially hazardous substances.
D. MORTALITY STUDIES BASED ON NUMERATORS RATHER THAN RATES
All the methods described above refer to situations where data both for the cases or the deceased and for the populations at risk are known, making possible the calculation of conventional rates. Proportional mor- tality studies and case-control studies are methods for bypassing the need for information about the popula- tions at risk in situations where only data for cases or the deceased are known.
Proportional mortality studies
In a proportional mortality study, the proportion of deaths due to a certain cause in a specific occupational or other group is compared with the proportion of deaths due to the same cause in the total population. The method is valuable in the search for excesses in mortality from rare causes of death. However, it is important in the interpretation to remember that no conclusion concerning the absolute mortality level can be inferred from the data. The following example illus- trates the problem.
A studyz4 made in Switzerland showed that the number of deaths due to ischaemic heart disease in relation to the number of deaths due to other natural causes among men aged 45-65 was highest for profes- sionals and lowest for unskilled workers. An index equal to 100 for all men was 156 for the professionals and 82 for the unskilled workers. Mortality rates from England and Wales, however, show an excess in mor- tality from ischaemic heart disease for unskilled work- ers; and Scandinavian studies show almost equal rates for different social groups for males over age 50. The Swiss data do not necessarily indicate a risk distribu- tion for ischaemic heart disease that is different from the distribution observed in other countries; the appar- ently conflicting results can be explained by the excess mortality for unskilled workers from other natural causes of death, which results in low proportional mortality figures for ischaemic heart disease even though their absolute rates are equal to.or above the average.
Case-control studies
Case-control studies consist of matched samples of cases, i.e., persons with a specific disease; and of con- trols, i.e., persons from whom it is possible to estimate the proportion of persons in the population exposed to a specific risk. It is important to stress that although
controls in case-control studies are often selected among patients with diseases other than those being studied, the purpose of the series of controls is to esti- mate the exposure rate in the population. Conse- quently, series of controls are selected for instance among patients with a disease supposedly unaffected by the exposure in question.
Case-control studies are especially suited for the study of risk factors in rare diseases. A case-control study2' in Sweden, for instance, revealed a relative risk of from five to six for soft-tissue sarcomas among men exposed to phenoxyacids and chlorophenols. Men selected from the population and death registers and matched with the cases on age and municipality constituted the series of controls. Persons who died from cancer were excluded from the controls because phenoxyacids and chlorophenols might also cause types of cancer other than soft-tissue sarcomas. Fifty- two cases diagnosed over an eight-year period were included in the study. Due to the rareness of this dis- ease, it is very unlikely that this excess risk would have been discovered in a follow-up study.
However, spurious results can arise from case-con- trol studies if strict rules for selection of controls are not followed. For example, data from the United States Third National Cancer Survey were analysed on a case-control basis, the fraction exposed to certain risk factors among persons with one type of cancer being compared with the fraction exposed to the same risk factors among persons with other types of can- cers. This analysis "indicates an inverse association between breast cancer and smoking which illustrates an artifact caused by inclusion of exposure-biased patients in the control group (lung and other smoking- associated cancers)" .26
E. EVALUATION OF METHODS
Methods for the study of mortality differentials must be evaluated in relation to the purpose of the study. In relation to data on occupational mortality, it is decisive for the evaluation of the method whether the purpose is to sharpen the awareness of social inequalities in societies, to generate hypotheses about occupational risks or to lay the basis for specific pre- ventive interventions.
The cross-sectional method used in the decennial supplements in the United Kingdom is, as illustrated, sufficiently precise for the detection of social-class dif- ferences in mortality. The method is generally consid- ered to be inexpensive because it is based on already existing data. However, when computerized registra- tions with personal identification numbers are avail- able, linking of individual census records and death certificate records is no doubt both less expensive and more precise than the separate coding of occupational information on death certificates. Unfortunately, the linking of individual records for total national popula- tions is at the moment possible only in the Scandina- vian countries, and the use of cross-sectional or
sample-based linking studies should therefore be rec- criteria is the association between cigarette smoking ommended in other countries. and lung cancer. The relationship between lung cancer
The generation of hypotheses about occupational mortality and smoking habits among British doctors risk has normally been stated as the main purpose of studied by Doll and Peto3' can be explained by neither information systems on occupational mortality. The confounding nor chance biases. Additionally, several experience from the United Kingdom decennial sup- other studies+.g., of veterans and volunteers in the plement is, however, short of examples and-in United States of America-have shown the same asso- tion to the documentation of the social-class ciation. The association is strong, and the risk for differences-the supplements have mainly functioned smokers in relation to that for non-smokers increases as a monitoring system for already established or sus- with the number of cigarettes Sn~oked. Lastly, when pected associations between occupational exposures the British doctors stopped smoking, their lung cancer and specific disease^.^' rate approached the rate for non-smokers.
It may be reasonable to expect a broader field of However, few studies of the relationship between applications for studies of the linked type where there specific exposures and the development of human can- is no problem concerning misclassifications ofoccupa- cer fulfil all the criteria listed above. It is also impor- tions at death and where the calculations are demo- tant to remember that although true negative studies graphically more exact. exist, epidemiological studies often have an inherent
The Danish occupational mortality study, which is a biad towards a negative result, primarily due to the five-year follow-up study of mortality in the 1970 ten- selection mechanisms On the labour market as dis-
sus population, has revealed an excess lung cancer cussed above in section C.
risk in, e.g., butchers (standard mortality ratio, I%), Concerning decisions on preventive interventions, bakers (209), plumbers (1 80), cooks (234) and dental therefore, mortality studies have to be supplemented mechanics (741). These observations are clues that mainly with experimental data and with data for earlier should be followed up by studies in these industries. detectable human reactions through mortality studies.
However, the linked census-based studies are gen- Subsequently, mortality data are needed in order to erally not specific enough to form the basis for stand- monitor the effect of interventions. ards, norms or other preventive interventions. In AS discussed in the foregoing sections, it is possible studies where the occupation is only known at one to overcome some of the shortcomings in studies of point in time, caution is needed in interpretation of mortality differentials by the use of record linkage, mortality figures for certain occupations. Elevated registration of 0cc~pation at different points in time, lung cancer figures in Denmark for taxi-drivers (stand- prolongation of follow-up periods, etc. Therefore, it is ard mortality ratio of 272) and caretakers (158) are strongly mxmmended that occu~ational data from probably due to a selection of health-disadvantaged censuses, unions, industries, etc., should be collected persons into these relatively protected jobs, which are and stored in ways which would make it possible to often used for rehabilitati~n.~~ meet these methodological demands.
Methodological demands on epidemiological studies , in relation to decisions on preventive interventions
have been especially pronounced in relation to cancer. SUMMARY A recent review in the journal Cancer Mortality studies in developed countries serve to
states that sufficient evidence of carcinogenicity is a identify high-risk groups and unfavourable trends. causal association between exposure and human can- During the 1970s, important methodological innova- cer: tions have come from studies of occupational risks,
''Three criteria must be met to infer a causal smoking, side-effects of drugs, etc. Advantages and association between exposure and human cancer: shortcomings of the different methods must be evalu- (a) there is no identified bias which could explain ated in relation to the purpose of the study. Meth- the association; (h) the possibility has been ruled odological demands of mortality studies in relation to out that the association is due to another uncon- decisions on preventive interventions have especially trolled variable (often called a confounding vari- been discussed within the field of cancer. It is strongly able) that is associated with both the cancer and recommended that occupational data should be col- the presumed causal agent; (c) the association is lected and stored in ways which would make it pas- unlikely to be due to chance. sible to overcome shortcomings in the design of
"In general, while a single study may be indica- mortality studies. tive of a cause-effect relationship, confidence in inferring a causal association is increased when several independent studies all show the associa- tion, when the association is strong, when there is NOTES a dose-response relationship, or when a reduction in exposure is followed by a in the inti- 'J. Powels, "On the limitations of modem medicine", Science of
dence of cancer."29 Medical Management, vol. 1 (1973), pp. 1-30. 2~van D. Illich, Limits to Medicine: Medical Nemesis (New York
The classic example of an association fulfilling these and Harmondsworth, Penguin, 1977).
125
I
3 ~ o r l d Health Organization, World Health Statistics Annual, 1978 (Geneva, 1979); World Health Statistics Annual, 1979 (Geneva, 1980).
4 ~ v e l y n M. Kitagawa and Philip M. Hauser, Differential Mor- tality in the United States: A Study in Socioeconomic Epidemiology (Cambridge, Mass., Harvard University Press, 1973).
'lbid. 6 ~ . Teppo and others, "Way of life and cancer incidence in
Finland: a municipality-based ecological analysis", Scandinavian Journal of Social Medicine, Supp. 19 (1980), pp. 1-84.
71bid., p. 68. M@ller Jensen, Cancer Morbidity and Causes of Death
among Danish Brewery Workers (Lyon, International Agency for Research on Cancer, 1980).
9~i l l i am Farr, Vital Statistics: A Memorial Volume of Selections from the Reports and Writings of William Farr, introduction by Mervyn Susser and Abraham Adelstein (Metuchen, N.J., Scare- crow Press, 1975), History of Medicine Series, No. 46, published under the auspices of the Library of the New York Academy of Medicine. Reprint of the 1885 edition edited by Noel A. Humphreys and published by the Offices of the Sanitary Institute of Great Brit- ain.
lounited Kingdom, Ofice of Population Censuses and Surveys, Occupational Mortality: the Registrar General's Decennial Supple- ment for Englandand Wales, 1970-1972, Series DS, No. 1 (London, H.M. Stationery Office, 1978).
"lbid. I 2 ~ v e l y n M. Kitagawa, "Present shortcomings and knowledge
gaps in U.S. studies", in Socio-economic Differential Mortality in Industrialised Societies (Paris, United Nations, World Health Organization, and Committee for International Co-ordination of National Research on Demography, 1981), vol. 1 .
I3See E. M. Kitagdwa and P. M. Hauser, op. cit. I4Guy Desplanques, La mortalit6 des adultes suivant le milieu
social, 1955-71, Collections de I'INSEE, No. 195; Series D, No. 44 (Paris, lnstitut national de la statistique et des Ctudes economiques, 1976).
I5Norway, Statistisk Sentralbyrl, Yrke og D@delighet 1970-1973 (Occupation and mortality 1970-1973), Statistiske analyser, No. 21 (Oslo, 1976); and Lars B. Kristofersen, Yrke og D(de1ighet (Occupational mortality), Report No. 79119 (Oslo, Statistisk Sentralbyrl, 1979).
"kenmark, Danmarks Statistik, DCdlighet og Ehrverv 1970-1975
(Mortality and occupation 1970-1975, Statistiske ~nders@gelser, No. 37 (Copenhagen, 1979).
l7 ~ a n n e l e Sauli, Kuolleisuus: Ammatti ja Kuolleisuus 1971 -75 (Occupational mortality in 1971-75), Tilastokeskus Studies, No. 54 (Helsinki, 1979).
'*A. J. FOX, "Prospects for measuring changes in differential mor- tality", in Proceedings of the Meeting on Socioeconomic Determi- nants and Consequences of Mortality, El Colegio de Mexico, Mexico City, 19-25 June 1979 (New York and Geneva, United Nations, and World Health Organization, 1980), pp. 516-561.
19w. Linke, Statistisches Bundesamt, Wiesbaden, personal com- munication, 1981.
20~lsebe th Lynge, "The Danish occupational cancer study", paper prepared for the International Symposium on Prevention of Occupational Cancer, Helsinki, 1981.
21L. B. Kristofersen, op. cit. 2 2 ~ . Lynge and B. Jeune, "Mortality among unskilled workers in
Denmark 1970-75", manuscript, 1981; to be published. 2 3 ~ . J. FOX and P. F. Collier, "Low mortality rates in industrial
cohort studies due to selection for work and survival in the indus- try", British Journal of Preventive and Social Medicine, vol. 30, No. 4 (December 1976), pp. 225-230.
2 4 ~ . Gass, "L'influence des facteurs geographiques, demog- raphiques et socio-economiques sur la mortalit6 par cardiopathies ischemiques en Suisse", Revue d'epide'miologie et de sante' publi- que, vol. 27, No. 4 (1979), pp. 315-329.
2 S ~ . Hardell and A. Sandstrom, "Case-control study: soft-tissue sarcomas and exposure to phenoxyacetic acids or chlorophenols", British Journal of Cancer, vol. 39, No. 6 (June 1979), pp. 711-717.
2 6 ~ o g e r R. Williams, Nancy L. Stegens and John W. Horm, "Patient interview study from the third National Cancer Survey: overview of problems and potentials of these data", Journal of National Cancer Institute, vol. 58, No. 3 (March 1977), p. 522.
2 7 ~ . M. Adelstein, "Occupational mortality: cancer", Annals of Occupational Hygiene, vol. 15, No. 1 (1972), pp. 53-57.
2 8 ~ . Lynge, op. cit. 2 9 " ~ n evaluation of chemicals and industrial processes associated
with cancer in humans and animal data; IARC monographs volumes 1 to 20" (report of an IARC working group)", Cancer Research, vol. 40, No. 1 (January 1980), p.2.
30~ichard Doll and Richard Peto, "Mortality in relation to smok- ing: 20 years' observations on male British doctors", British Medi- cal Journal, vol. 2, No. 6051 (25 December 1956), pp. 1525-1536.