part one: basic information
TRANSCRIPT
1
PART ONE: BASIC INFORMATION
INTRODUCTORY MATERIALS
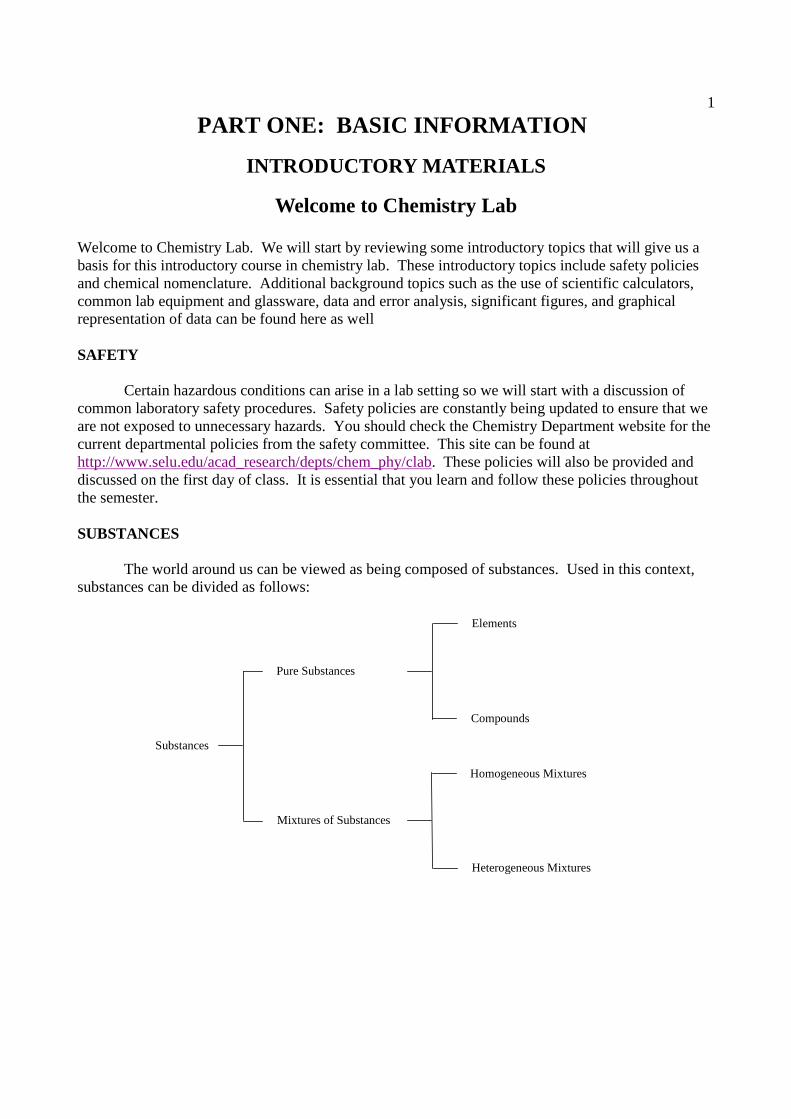
Welcome to Chemistry Lab Welcome to Chemistry Lab. We will start by reviewing some introductory topics that will give us a basis for this introductory course in chemistry lab. These introductory topics include safety policies and chemical nomenclature. Additional background topics such as the use of scientific calculators, common lab equipment and glassware, data and error analysis, significant figures, and graphical representation of data can be found here as well SAFETY Certain hazardous conditions can arise in a lab setting so we will start with a discussion of common laboratory safety procedures. Safety policies are constantly being updated to ensure that we are not exposed to unnecessary hazards. You should check the Chemistry Department website for the current departmental policies from the safety committee. This site can be found at http://www.selu.edu/acad_research/depts/chem_phy/clab. These policies will also be provided and discussed on the first day of class. It is essential that you learn and follow these policies throughout the semester. SUBSTANCES The world around us can be viewed as being composed of substances. Used in this context, substances can be divided as follows:
Pure Substances
Mixtures of Substances
Elements
Compounds
Homogeneous Mixtures
Substances
Heterogeneous Mixtures
2 Elements
An element is a substance than cannot be divided into two or more (simpler) substances using chemical means. See Dalton’s atomic theory for more details. There are about 112 elements known at present. Of these there are only about 85 to 90 found in nature on the earth; these are called the naturally occurring elements. If the others existed on the earth in the past they do not at present. However, they have been “man-made” using the procedures of nuclear physics. Each element is assigned a name such as oxygen, carbon, chlorine, chromium, etc. Each is also assigned a symbol that is derived from its name. The symbol for oxygen is O, for carbon is C, for nitrogen is N, the capitalized first letter of their names. Some elements have a symbol that is two letters (since there are more elements than letters in the alphabet) such as Cr for chromium, Cl for chlorine, Al for aluminum, etc. In all cases, the first letter of the symbol is capitalized and the second is lower case. The second letter is often the second letter in the name but it may be any letter in the name after the first: Cl for chlorine, Pm for promethium, Cm for curium, etc.. The symbol for potassium is K, for sodium is Na, and these symbols (as do a few others) follow the rule above except that the symbol is derived from the name of the element in a language other than English. The latin name for sodium is natrium and for potassium is kalium from which the symbols are derived. The German name of tungsten is Wolfram from which the symbol W is derived. Compounds It is believed by chemists that all the substances around us are composed of elements or compounds (pure or in mixtures). The compounds are each formed by chemically combining together two or more elements. See below for more discussion. Compounds are formed from elements in an analogous way that words are formed from the 26 letters of the alphabet. Thus the three letters d,g and o can form the words dog or god which have distinctly different meanings. While carbon, C, hydrogen, H, and nitrogen, N are contained in the compounds necessary for maintaining life, in the form of HCN (hydrogen cyanide), they are a deadly poison. There are at present about 10 million known compounds; amazingly, over 9 million of them contain carbon. Chemists write symbols (called formulas) for compounds that are formed by using the symbols of the elements from which the compound is formed. Thus ZnO is the formula for the compound formed by zinc and oxygen and NH3 is the formula for ammonia, which is composed of nitrogen and hydrogen as indicated by the formula. Atoms It is also believed that elements are composed of tiny particles called atoms, a concept that started with the Greeks over 2000 years ago but was only given experimental proof around 1800. The atoms of an element were originally believed to be identical in all respects but now this is known to be not exactly true. Atoms of an element are very much alike chemically except for mass. In this context, the symbol N would not only stand for the element nitrogen but also for one atom of the element nitrogen. C would stand for the element carbon and for one atom of carbon and similarly for the other elements. The symbol for an element also stands for one mole (defined later) of the element. Thus, the symbol for an element has three meanings attached to it. Atoms of elements connect together (become attached to one another) in whole number ratios to form groups of atoms called molecules. Just as an atom is the simplest part of an element a molecule is the simplest part of a compound. The symbols (called formulae) for compounds are written in terms of the symbols of the elements that make up the compound. See below in the formula writing and nomenclature section for more discussion.
3 Molecules, Chemical Bonds, and Chemical Reactions If elements are chemically combined, the process is called a chemical reaction. Chemical reactions can also occur between compounds. A chemical reaction is highly likely to have occurred if one or more of the following things happen when substances are mixed: 1. The properties (color, density, etc) change when a chemical reaction occurs. 2. Heat is absorbed (endothermic reaction) or evolved (exothermic reaction). 3. Sometimes light is evolved. 4. A gas is evolved. 5. A precipitate is formed When elements are mixed and chemically react to form compounds, the characteristics (properties) of the elements disappear and the properties of the compound appear. In fact, this is one of the criteria by which chemists determine if a chemical reaction of any kind has occurred. The compound between hydrogen and fluorine would be represented by HF, which indicates that in a molecule of this compound there is one atom of hydrogen and one atom of fluorine. The formula H2O indicates that water contains hydrogen and oxygen and a molecule of water contains 2 atoms of hydrogen and 1 atom of oxygen. The force that holds the hydrogen atom to the oxygen atom is called a chemical bond. In general the force that holds atoms together in compounds is called a chemical bond.
2 H2 + O2 → 2 H2O
The above is an example of a chemical equation that represents a chemical reaction that takes place in the laboratory. In order for the hydrogen and the oxygen to form water, the chemical bond between hydrogen atoms must be broken as well as the chemical bond between oxygen atoms. The hydrogen atoms then form chemical bonds to the oxygen to form a water molecule. A chemical reaction is the process of rearranging which atoms are bonded to which atoms. If no chemical bonds are broken or formed, then no chemical reaction has occurred. It is not always easy to determine or decide if bonds have been broken and/or formed. Mixtures and Compounds Most substances around us are mixtures of compounds and/or elements. Some mixtures are called solutions and will be discussed later in the second semester lecture course. Mixtures are composed of atoms of elements and/or molecules of compounds simply mixed together. In the formation of a mixture no chemical bonds are rearranged (for the most part). No matter what the source of a sample of water (river, well, ocean, teardrop) it can be purified by various techniques until it has a definite set of properties that are characteristic of the pure substance known as water. Samples of milk, however, from the same cow on different days may differ in taste, butterfat, etc. and it cannot be purified to obtain a pure substance that is milk. Milk is a mixture whose composition can vary over a reasonable range and it will still be milk. Mixtures have variable composition but compounds have a specific composition that is characteristic of that compound (they have a definite composition).
4 Metals and Non-Metals
If one observes the periodic table of elements, the elements can be divided into two groups. Those on the left side of the table are metals and those on the upper right side are non-metals. The dividing line is a zig-zag line starting between boron and aluminum (Al is on the left of the line) and ending between bismuth and polonium. The elements near this line are called metalloids. These are elements such as germanium, Ge, and antimony, Sb. The simple compounds found in the world can be divided roughly into two groups: 1. Compounds formed between metals and non-metals. This group is called ionic compounds. 2. Compounds formed between non-metals and non-metals. This group is called covalent
compounds. In this course, only relatively simple compounds will be considered. The compounds will contain two or three (or sometimes four) different elements. There is a systematic method for naming these types of compounds and if one knows the formula for the compound, the name can be determined using the rules outlined in the following pages. There are some similarities and some differences in the naming of ionic and covalent compounds. Following the discussion on how to name compounds from their formulae is a section on how to write the formula of a compound from its name. This is relatively easy for covalent compounds but requires more information for the ionic compounds. NOMENCLATURE (An Introduction) Literally hundreds of thousands (actually millions) of chemical compounds are known. In fact, in every day situations one frequently encounters many different chemical compounds. Examples are foods, medications, clothing, sports equipment, and automobile components. Essentially everything around us is made up of chemicals. How do chemists name the individual compounds of which things are composed? Surely they would quickly run out of names such as Joe, Fred, Mary Jane, oil of vitriol, muratic acid and such, and these types of common names would give no hint about the chemical composition. However, some compounds are often called (for convenience or by convention) by common names as, for example, vitamin A and water. Chemists have invented a systematic approach to naming all compounds (even vitamin A and water) that is more advantageous than using common names. Nomenclature is the general term chemists use for the various systems of naming chemical compounds. In the first semester of freshman chemistry, focus is placed on naming simple compounds containing two, three or possibly four elements, mostly of elements other than carbon. The reason for introducing nomenclature at this point is that knowledge of the names of chemical compounds will be useful as you work in the laboratory associated with this course. As you study the following examples, note the rules given in each section.
5 I. Binary Compounds - Compounds with Only Two Elements In Them
Binary compounds in which one element is a metal and one is a non-metal (mostly ionic
compounds). Some of these are also referred to as salts.
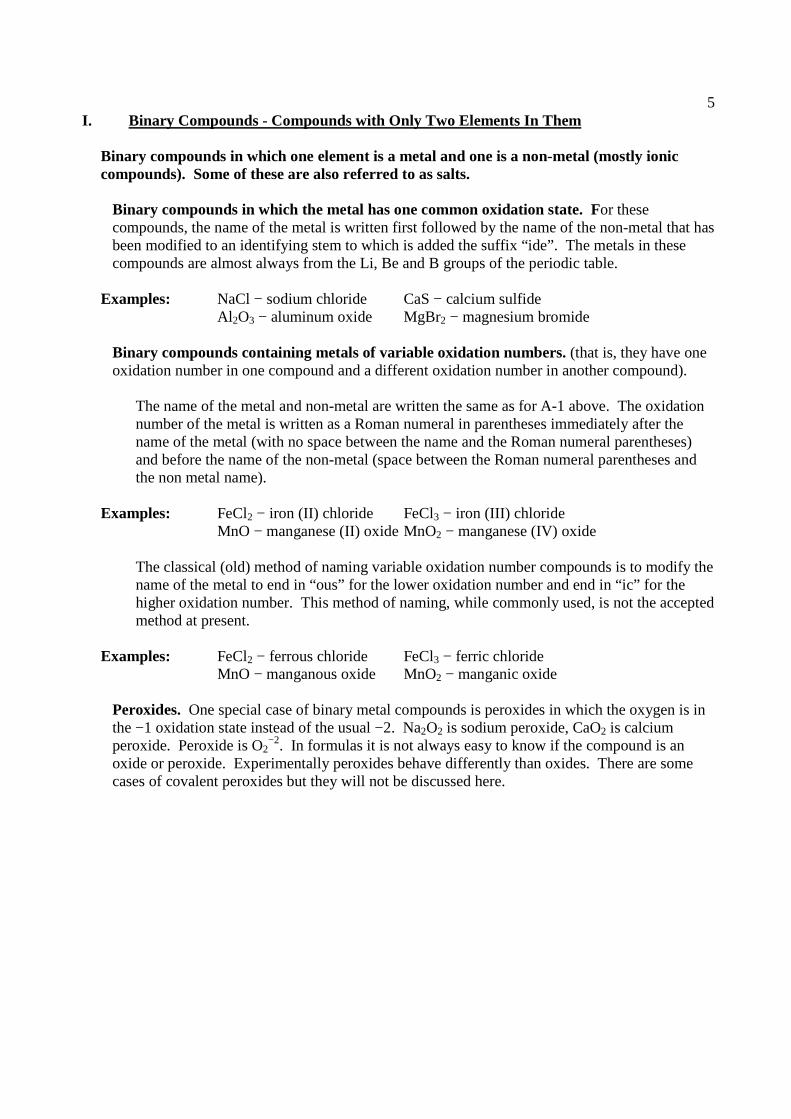
Binary compounds in which the metal has one common oxidation state. For these compounds, the name of the metal is written first followed by the name of the non-metal that has been modified to an identifying stem to which is added the suffix “ide”. The metals in these compounds are almost always from the Li, Be and B groups of the periodic table.
Examples: NaCl − sodium chloride CaS − calcium sulfide Al2O3 − aluminum oxide MgBr2 − magnesium bromide
Binary compounds containing metals of variable oxidation numbers. (that is, they have one oxidation number in one compound and a different oxidation number in another compound).
The name of the metal and non-metal are written the same as for A-1 above. The oxidation number of the metal is written as a Roman numeral in parentheses immediately after the name of the metal (with no space between the name and the Roman numeral parentheses) and before the name of the non-metal (space between the Roman numeral parentheses and the non metal name).
Examples: FeCl2 − iron (II) chloride FeCl3 − iron (III) chloride MnO − manganese (II) oxide MnO2 − manganese (IV) oxide
The classical (old) method of naming variable oxidation number compounds is to modify the name of the metal to end in “ous” for the lower oxidation number and end in “ic” for the higher oxidation number. This method of naming, while commonly used, is not the accepted method at present.
Examples: FeCl2 − ferrous chloride FeCl3 − ferric chloride MnO − manganous oxide MnO2 − manganic oxide
Peroxides. One special case of binary metal compounds is peroxides in which the oxygen is in the −1 oxidation state instead of the usual −2. Na2O2 is sodium peroxide, CaO2 is calcium peroxide. Peroxide is O2
−2. In formulas it is not always easy to know if the compound is an oxide or peroxide. Experimentally peroxides behave differently than oxides. There are some cases of covalent peroxides but they will not be discussed here.
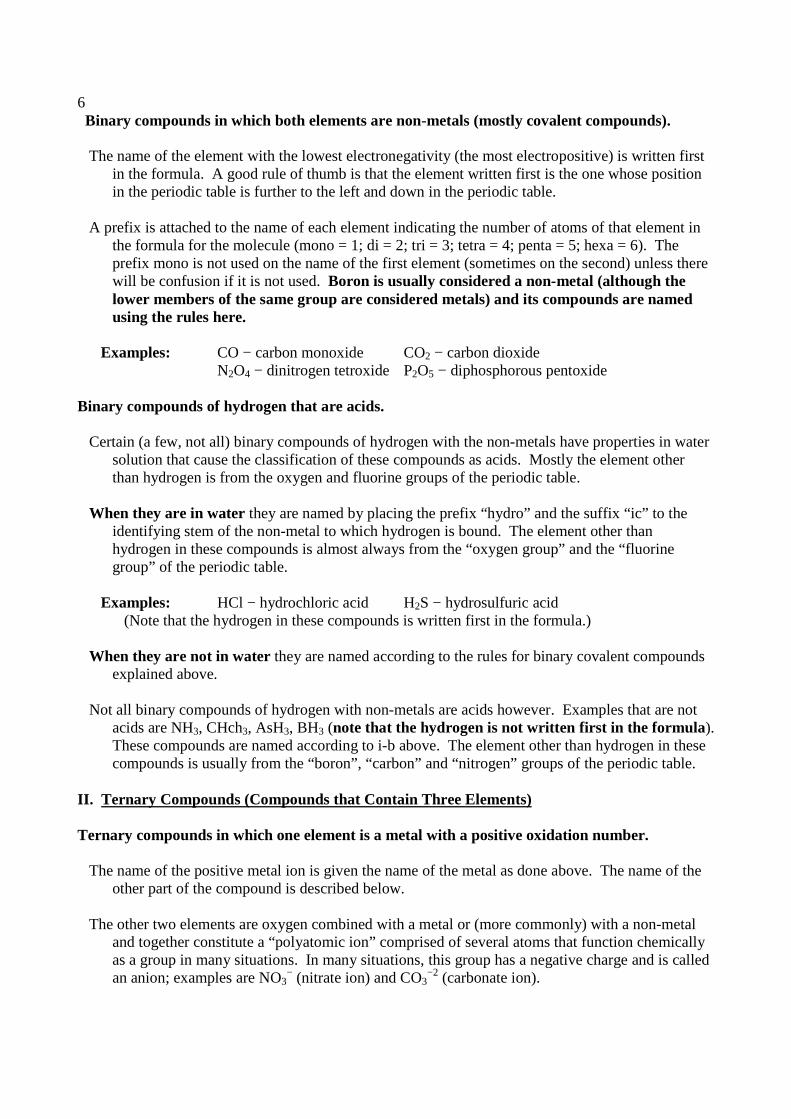
6 Binary compounds in which both elements are non-metals (mostly covalent compounds). The name of the element with the lowest electronegativity (the most electropositive) is written first
in the formula. A good rule of thumb is that the element written first is the one whose position in the periodic table is further to the left and down in the periodic table.
A prefix is attached to the name of each element indicating the number of atoms of that element in
the formula for the molecule (mono = 1; di = 2; tri = 3; tetra = 4; penta = 5; hexa = 6). The prefix mono is not used on the name of the first element (sometimes on the second) unless there will be confusion if it is not used. Boron is usually considered a non-metal (although the lower members of the same group are considered metals) and its compounds are named using the rules here.
Examples: CO − carbon monoxide CO2 − carbon dioxide N2O4 − dinitrogen tetroxide P2O5 − diphosphorous pentoxide
Binary compounds of hydrogen that are acids. Certain (a few, not all) binary compounds of hydrogen with the non-metals have properties in water
solution that cause the classification of these compounds as acids. Mostly the element other than hydrogen is from the oxygen and fluorine groups of the periodic table.
When they are in water they are named by placing the prefix “hydro” and the suffix “ic” to the
identifying stem of the non-metal to which hydrogen is bound. The element other than hydrogen in these compounds is almost always from the “oxygen group” and the “fluorine group” of the periodic table.
Examples: HCl − hydrochloric acid H2S − hydrosulfuric acid (Note that the hydrogen in these compounds is written first in the formula.)
When they are not in water they are named according to the rules for binary covalent compounds explained above.
Not all binary compounds of hydrogen with non-metals are acids however. Examples that are not
acids are NH3, CHch3, AsH3, BH3 (note that the hydrogen is not written first in the formula ). These compounds are named according to i-b above. The element other than hydrogen in these compounds is usually from the “boron”, “carbon” and “nitrogen” groups of the periodic table.
II. Ternary Compounds (Compounds that Contain Three Elements) Ternary compounds in which one element is a metal with a positive oxidation number.
The name of the positive metal ion is given the name of the metal as done above. The name of the
other part of the compound is described below. The other two elements are oxygen combined with a metal or (more commonly) with a non-metal
and together constitute a “polyatomic ion” comprised of several atoms that function chemically as a group in many situations. In many situations, this group has a negative charge and is called an anion; examples are NO3
− (nitrate ion) and CO3−2 (carbonate ion).
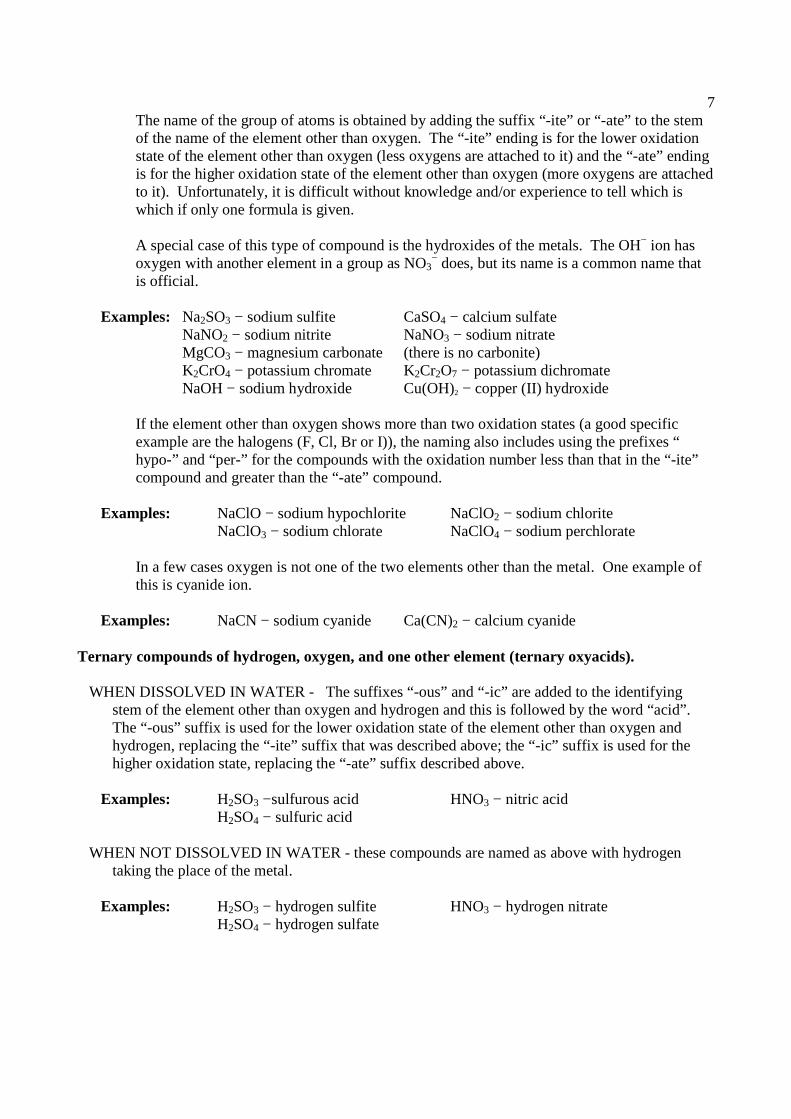
7 The name of the group of atoms is obtained by adding the suffix “-ite” or “-ate” to the stem of the name of the element other than oxygen. The “-ite” ending is for the lower oxidation state of the element other than oxygen (less oxygens are attached to it) and the “-ate” ending is for the higher oxidation state of the element other than oxygen (more oxygens are attached to it). Unfortunately, it is difficult without knowledge and/or experience to tell which is which if only one formula is given.
A special case of this type of compound is the hydroxides of the metals. The OH− ion has oxygen with another element in a group as NO3
− does, but its name is a common name that is official.
Examples: Na2SO3 − sodium sulfite CaSO4 − calcium sulfate NaNO2 − sodium nitrite NaNO3 − sodium nitrate MgCO3 − magnesium carbonate (there is no carbonite) K2CrO4 − potassium chromate K2Cr2O7 − potassium dichromate NaOH − sodium hydroxide Cu(OH)2 − copper (II) hydroxide
If the element other than oxygen shows more than two oxidation states (a good specific example are the halogens (F, Cl, Br or I)), the naming also includes using the prefixes “ hypo-” and “per-” for the compounds with the oxidation number less than that in the “-ite” compound and greater than the “-ate” compound.
Examples: NaClO − sodium hypochlorite NaClO2 − sodium chlorite NaClO3 − sodium chlorate NaClO4 − sodium perchlorate
In a few cases oxygen is not one of the two elements other than the metal. One example of this is cyanide ion.
Examples: NaCN − sodium cyanide Ca(CN)2 − calcium cyanide
Ternary compounds of hydrogen, oxygen, and one other element (ternary oxyacids). WHEN DISSOLVED IN WATER - The suffixes “-ous” and “-ic” are added to the identifying
stem of the element other than oxygen and hydrogen and this is followed by the word “acid”. The “-ous” suffix is used for the lower oxidation state of the element other than oxygen and hydrogen, replacing the “-ite” suffix that was described above; the “-ic” suffix is used for the higher oxidation state, replacing the “-ate” suffix described above.
Examples: H2SO3 −sulfurous acid HNO3 − nitric acid H2SO4 − sulfuric acid
WHEN NOT DISSOLVED IN WATER - these compounds are named as above with hydrogen taking the place of the metal.
Examples: H2SO3 − hydrogen sulfite HNO3 − hydrogen nitrate H2SO4 − hydrogen sulfate
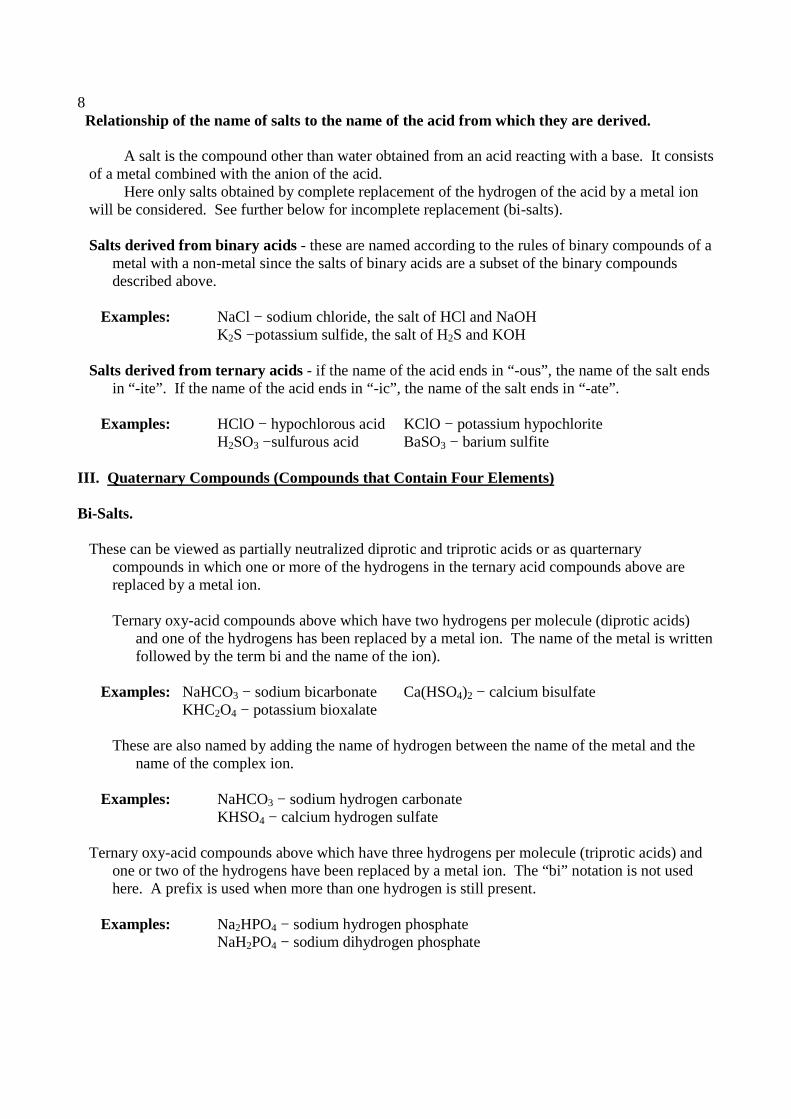
8 Relationship of the name of salts to the name of the acid from which they are derived. A salt is the compound other than water obtained from an acid reacting with a base. It consists of a metal combined with the anion of the acid. Here only salts obtained by complete replacement of the hydrogen of the acid by a metal ion will be considered. See further below for incomplete replacement (bi-salts). Salts derived from binary acids - these are named according to the rules of binary compounds of a
metal with a non-metal since the salts of binary acids are a subset of the binary compounds described above.
Examples: NaCl − sodium chloride, the salt of HCl and NaOH K2S −potassium sulfide, the salt of H2S and KOH
Salts derived from ternary acids - if the name of the acid ends in “-ous”, the name of the salt ends in “-ite”. If the name of the acid ends in “-ic”, the name of the salt ends in “-ate”.
Examples: HClO − hypochlorous acid KClO − potassium hypochlorite H2SO3 −sulfurous acid BaSO3 − barium sulfite
III. Quaternary Compounds (Compounds that Contain Four Elements) Bi-Salts.
These can be viewed as partially neutralized diprotic and triprotic acids or as quarternary
compounds in which one or more of the hydrogens in the ternary acid compounds above are replaced by a metal ion.
Ternary oxy-acid compounds above which have two hydrogens per molecule (diprotic acids)
and one of the hydrogens has been replaced by a metal ion. The name of the metal is written followed by the term bi and the name of the ion).
Examples: NaHCO3 − sodium bicarbonate Ca(HSO4)2 − calcium bisulfate KHC2O4 − potassium bioxalate
These are also named by adding the name of hydrogen between the name of the metal and the name of the complex ion.
Examples: NaHCO3 − sodium hydrogen carbonate KHSO4 − calcium hydrogen sulfate
Ternary oxy-acid compounds above which have three hydrogens per molecule (triprotic acids) and one or two of the hydrogens have been replaced by a metal ion. The “bi” notation is not used here. A prefix is used when more than one hydrogen is still present.
Examples: Na2HPO4 − sodium hydrogen phosphate NaH2PO4 − sodium dihydrogen phosphate
9 Other quaternary compounds.
Ammonium compounds - these are compounds that contain the ammonium ion, NH4
+. They can contain only three different atoms but often have four different atoms. They are named by writing the name ammonium followed by the name of the negative ion.
Examples: NH4Cl − ammonium chloride NH4NO3 − ammonium nitrate
Other quaternary compounds exist that do not follow the rules described above. These include the following and other similar compounds.
Examples: KCNS − potassium thiocyanate KCNOS − potassium cyanate Ca(C2H3O2)2 − calcium acetate
IV. Common Names
In addition to the ones above, some compounds have common names that have been used historically and do not follow the systematic approach above. This is true of some of all types of compounds and these names will continue to be used by certain groups in certain applications. Examples are water for H2O, ammonia for NH3, salt for NaCl, muriatic acid for HCl (in the building trades), phosphine for PH3, epsom salts for MgSO4·7 H2O.
V. Organic Nomenclature
The name of CH4 is officially methane, not carbon tetrahydride and this is not an example of a common name. Also officially the name of CCl4 is tetrachloromethane and not carbon tetrachloride even though the name carbon tetrachloride is commonly used. There is a systematic naming system for compounds of carbon that is separate from the systems given above. This will be covered in an organic chemistry course.
FORMULA WRITING
I. Ionic Compounds – Those Between Metals and Non-metals
The formula for a compound is written using the symbols of the constituent elements. The formula Al2O3 indicates that the compound is composed of the element aluminum (Al) and the element oxygen (O). Further, the subscripts indicate that there are 2 aluminum atoms for every 3 oxygen atoms in the compound. Any actual sample of the compound will have trillions of trillions of atoms of both aluminum and oxygen; the actual number depends on the sample size. The formula Al2O3 indicates only that they will always be in the ratio of 2 aluminum atoms to 3 oxygen atoms. The practical problem of ascertaining the subscripts for the symbols in a chemical formula from laboratory data amounts to attempting the feat of determining how many atoms of each element are in a sample of a compound. This problem took over 50 years to solve in the period between 1800 and 1860. Here the results of the labors of many persons will be used to write the formulae of ionic compounds.
10 On a following page is a table of symbols and charges of common simple and polyatomic ions. A polyatomic ion is a group of elements that exist as a group in the compound. Charges can be thought of as a positive or a negative number assigned to each element (or to a group of elements - a polyatomic ion) to help in writing formulas of ionic compounds between the elements. The rules for writing formulae (using charges) will be:
1. Compounds are formed between elements or polyatomic ions with positive charges (cations) and elements or polyatomic ions with negative charges (anions).
2. The sum of all of the charges in a compound must add up to zero.
In general, metals (left side of the periodic table) have positive charges and non-metals (upper right side of the table) have negative charges although there are a number of exceptions. When more than one atom is present in a group such as (CrO4)
−2 (chromate ion), the −2 charge on the chromate is for the whole group of one chromium and 4 oxygens. Examples: 1. The compound formed between sodium (Na) and chlorine (Cl) Sodium Na Charge is +1 Chlorine Cl Charge is −1 Formula: NaCl
Note that Na10Cl10 (or any other equal numbers) would satisfy the electrical neutrality (the sum of the charges is zero). However, by convention, in writing the formula for ionic compounds, the simplest possible ratio of atoms is chosen. For covalent compounds, (see above in nomenclature) the actual number of atoms in the molecule is used. For instance, H2O2 is the formula for hydrogen peroxide, not HO.

11
SYMBOLS AND CHARGES
Elements With A Charge Of +1 Lithium Li+ Sodium Na+ Potassium K+ Silver Ag+ Hydrogen H+ Elements With A Charge Of +2 Magnesium Mg+2 Calcium Ca+2 Strontium Sr+2 Barium Ba+2 Iron(II) Fe+2 Cobalt(II) Co+2 Nickel Ni+2 Copper(II) Cu+2 Zinc Zn+2 Cadmium Cd+2 Mercury(II) Hg+2 Tin(II) Sn+2 Lead(II) Pb+2 Manganese(II) Mn+2 Chromium(II) Cr+2 Elements With A Charge Of +3 Boron B+3 Aluminum Al+3 Gold(III) Au+3 Antimony (III) Sb+3 Bismuth(III) Bi+3 Iron(III) Fe+3 Chromium(III) Cr+3 Cobalt(III) Co+3
Elements With A Charge Of +4 Tin(IV) Sn+4 Lead (IV) Pb+4 Manganese(IV) Mn+4 Polyatomic Ions With A Charge Of +1 Ammonium NH4+ Polyatomic Ions With A Charge Of +2 Mercury(I) (Hg2)+2 Elements With A Charge Of –1 Fluoride F-1 Chloride Cl-1 Bromide Br-1 Iodide I-1 Elements With A Charge Of –2 Oxide O-2 Sulfide S-2
Polyatomic Ions With A Charge Of –1 Hypochlorite (ClO)-1 Chlorite (ClO2)-1 Chlorate (ClO3)-1 Perchlorate (ClO4)-1 Nitrate (NO3)-1 Nitrite (NO2)-1 Bicarbonate (HCO3)-1 Bisulfate (HSO4)-1 Bisulfite (HSO3)-1 Hydroxide (OH)-1 Acetate (C2H3O2)-1 Permanganate (MnO4)-1 Thiocyanate (SCN)- Cyanide (CN)-
1 Polyatomic Ions With A Charge Of –2 Sulfate (SO4)-2 Sulfite (SO3)-2 Carbonate (CO3)-2 Chromate (CrO4)-2 Dichromate (Cr2O7)-2 Molybdate (MoO4)-2 Oxalate (C2O4)
-2 Polyatomic Ions With A Charge Of –3 Phosphate (PO4)-
3
12 2. The compound formed between calcium (Ca) and iodine (I) Calcium Ca Charge is +2 Iodine I Charge is −1 Formula: CaI cannot be right because (+2) + (–1) ≠ 0 Ca2I cannot be right because 2 (+2) + (–1) ≠ 0 CaI2 must be right because (+2) + 2 (–1) = 0
The name for CaI2 is calcium iodide.
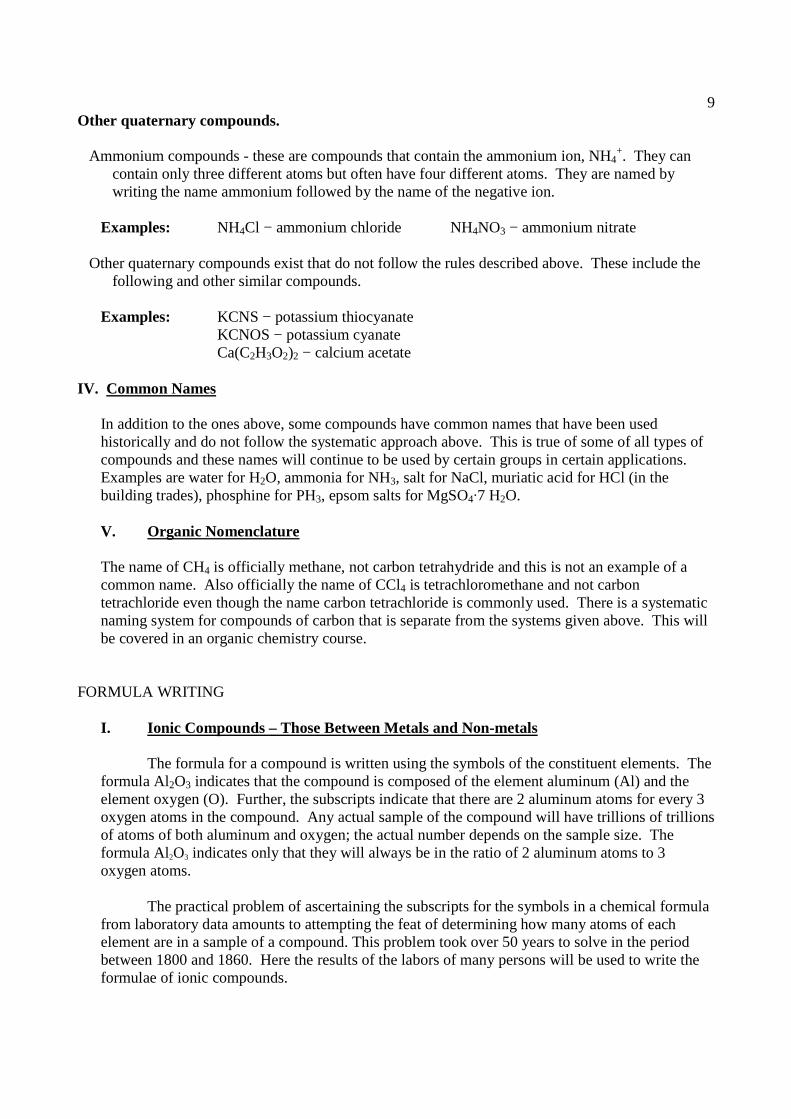
3. compound between aluminum(Al) and oxygen(O); (its name is aluminum oxide) Element Symbol Charge aluminum Al +3 oxygen O –2 Notice the following:
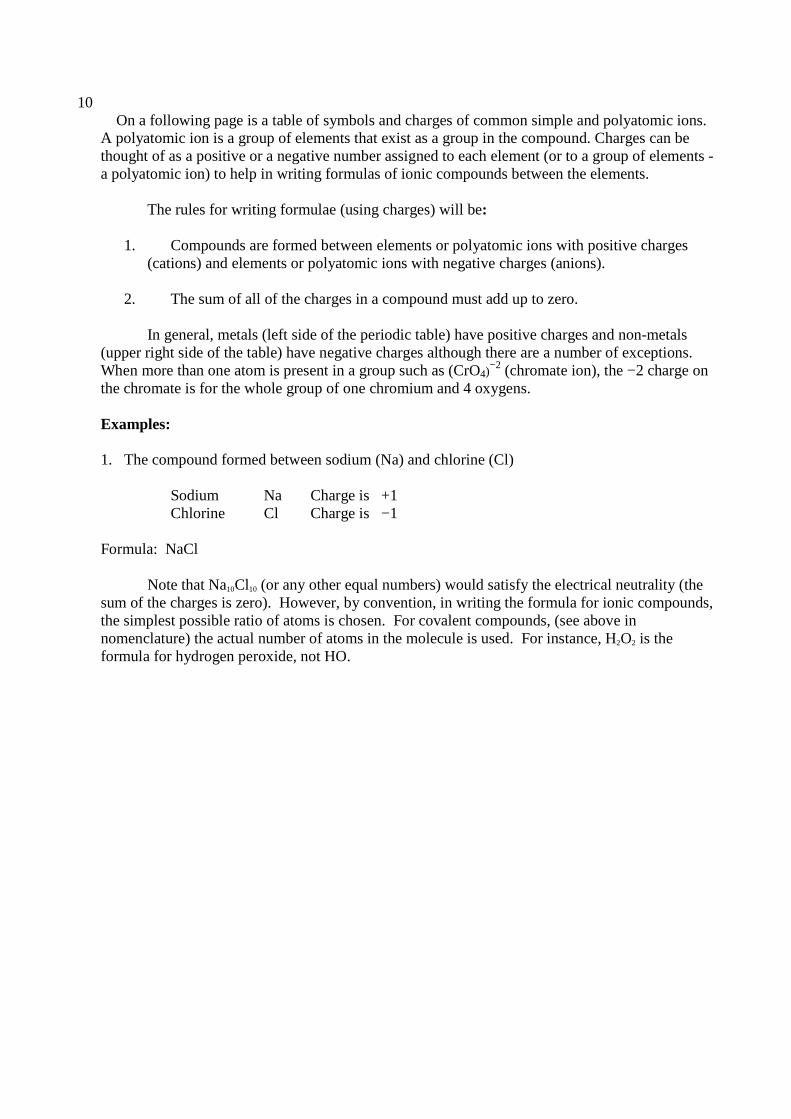
This is sometimes called the criss-cross method. 4. Iron (III) sulfate iron Fe +3 sulfate (SO4) –2 The sulfate group is a polyatomic ion or group and the –2 charge is for the whole group. Note the parentheses around the sulfate in the formula below and compare where parentheses are in # 5 below.
13 5. Ammonium phosphate ammonium (NH4) +1 phosphate (PO4) –3 (NH4)3PO4 3(+1) + (–3) = 0 Note the parentheses around the ammonium ion and around the sulfate ion above. Parentheses are used when there are more than one of the ions in the formula and a subscript must be used. When no subscript is used (the same as a subscript of one) then no parentheses are use (the phosphate ion is an example). No parentheses are used for a single element symbol even if more than one is present - note the iron, aluminum, and iodine in the formulae above II. Formulae for covalent compounds (non- metals with non- metals) The charges in the table are for ionic compounds of the elements and polyatomic ions involved. Phosphorous, arsenic and antimony form covalent compounds and the +3 state and the +5 state for these elements listed in the table are extremely rare. Boron also tends to form covalent rather than ionic bonds and so the B+3 given in the table is also quite rare The name of a covalent compound in most cases indicates the number of atoms of each element in the name of the compound. 1.diphosphorous tri oxide has two phosphorous and three oxygens and the formula is P2O3. 2. carbon dioxide has one carbon (usually, no prefix means one atom) and two oxygen atoms and the formula is CO2.
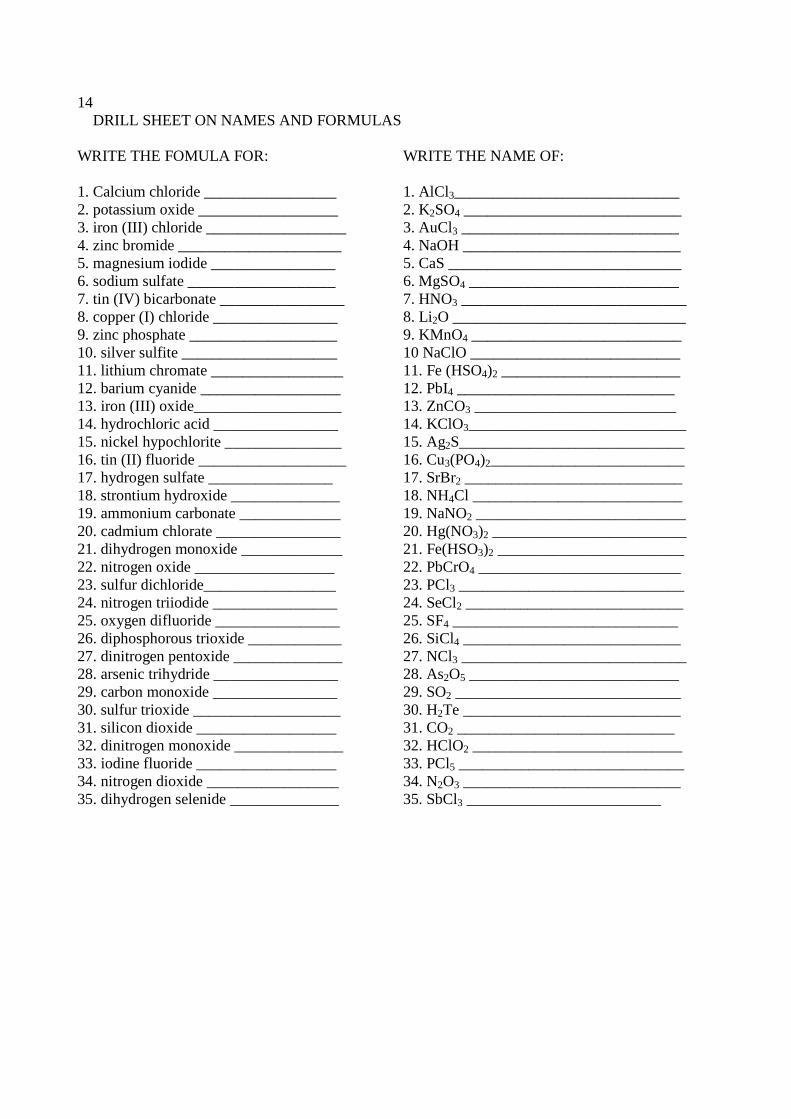
14 DRILL SHEET ON NAMES AND FORMULAS
WRITE THE FOMULA FOR: 1. Calcium chloride _________________ 2. potassium oxide __________________ 3. iron (III) chloride __________________ 4. zinc bromide _____________________ 5. magnesium iodide ________________ 6. sodium sulfate ___________________ 7. tin (IV) bicarbonate ________________ 8. copper (I) chloride ________________ 9. zinc phosphate ___________________ 10. silver sulfite ____________________ 11. lithium chromate _________________ 12. barium cyanide __________________ 13. iron (III) oxide___________________ 14. hydrochloric acid ________________ 15. nickel hypochlorite _______________ 16. tin (II) fluoride ___________________ 17. hydrogen sulfate ________________ 18. strontium hydroxide ______________ 19. ammonium carbonate _____________ 20. cadmium chlorate ________________ 21. dihydrogen monoxide _____________ 22. nitrogen oxide __________________ 23. sulfur dichloride_________________ 24. nitrogen triiodide ________________ 25. oxygen difluoride ________________ 26. diphosphorous trioxide ____________ 27. dinitrogen pentoxide ______________ 28. arsenic trihydride ________________ 29. carbon monoxide ________________ 30. sulfur trioxide ___________________ 31. silicon dioxide __________________ 32. dinitrogen monoxide ______________ 33. iodine fluoride __________________ 34. nitrogen dioxide _________________ 35. dihydrogen selenide ______________
WRITE THE NAME OF: 1. AlCl3_____________________________ 2. K2SO4 ____________________________ 3. AuCl3 ____________________________ 4. NaOH ____________________________ 5. CaS ______________________________ 6. MgSO4 ___________________________ 7. HNO3 _____________________________ 8. Li2O ______________________________ 9. KMnO4 ___________________________ 10 NaClO ___________________________ 11. Fe (HSO4)2 _______________________ 12. PbI4 ____________________________ 13. ZnCO3 __________________________ 14. KClO3____________________________ 15. Ag2S_____________________________ 16. Cu3(PO4)2_________________________ 17. SrBr2 ____________________________ 18. NH4Cl ___________________________ 19. NaNO2 ___________________________ 20. Hg(NO3)2 _________________________ 21. Fe(HSO3)2 ________________________ 22. PbCrO4 __________________________ 23. PCl3 _____________________________ 24. SeCl2 ____________________________ 25. SF4 _____________________________ 26. SiCl4 ____________________________ 27. NCl3 _____________________________ 28. As2O5 ___________________________ 29. SO2 _____________________________ 30. H2Te ____________________________ 31. CO2 ____________________________ 32. HClO2 ___________________________ 33. PCl5 _____________________________ 34. N2O3 ____________________________ 35. SbCl3 _________________________
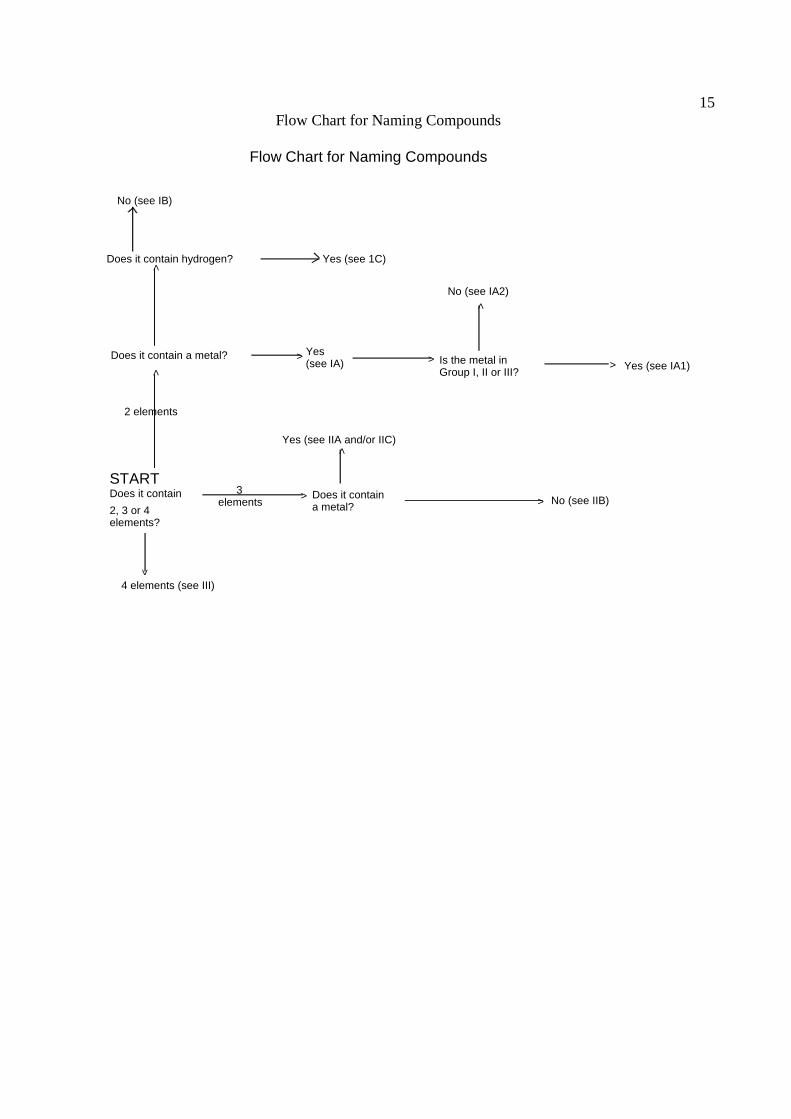
15 Flow Chart for Naming Compounds
Flow Chart for Naming Compounds
No (see IB)
Does it contain hydrogen? Yes (see 1C)
Does it contain a metal? Yes(see IA) Is the metal in
Group I, II or III?> Yes (see IA1)
>
No (see IA2)
>>
>>
2 elements
STARTDoes it contain
2, 3 or 4elements?
3elements
> Does it containa metal?
>
Yes (see IIA and/or IIC)
> No (see IIB)
>
4 elements (see III)
16 DETERMINATION OF OXIDATION NUMBERS
The charges in the table on page 12 are similar to oxidation numbers. In some cases such as phosphorous, arsenic and antimony covalent compounds in the +3 state and the +5 state are formed and the oxidation numbers for these elements listed in the table occur in covalent compounds. Boron also tends to form covalent rather than ionic bonds and so the B+3 given in the table is more for covalent bonding than ionic. The oxidation number of an atom in a covalent molecule is obtained by playing a game of “let’s pretend”. In any covalent bond between atoms the electrons involved in the bond are counted totally with the element with the higher electronegativity (pretend they are completely transferred).. For instance in HCl the electrons in the bond are counted with the chlorine and therefore the chlorine has a -1 (pretend) charge on it. Its oxidation number is taken to be the pretend charge of -1. The hydrogen then has a +1 oxidation number since it has a pretend +1 charge. Rather than having to check on electronegativities for each situation for simple well known molecules and ions, there has been devised a set of rules to determine the oxidation numbers for atoms in covalent molecules and in ions with internal covalent bonding (such as NH4+ and NO3
-). These rules allow the calculation of oxidation numbers without checking the electronegativity each time. The rules given below cover both ionic and covalent bonding. RULES FOR ASSIGNING OXIDATION NUMBERS 1. All elements when not combined chemically with another element (that is, in the free state) have an oxidation of zero. Thus in H2 and Cl2, the oxidation number of H and Cl are zero. 2. The oxidation numbers of the complex ions such as sulfate, nitrate, etc. are taken to be the charges on the ions which are the values given in the table on page 12. 3. The oxidation numbers of the metals in compounds are the charges on the metal ions which are the values in the table on page 12. There are some consistent things in this area that help one to remember some of these: (a) The oxidation number of all the atoms in the lithium group is always +1. (b) The oxidation number of all the atoms in the beryllium group is always +2. (c) The oxidation number of all the atoms in the boron group is always +3 (Tl is an exception) 4. The oxidation number of hydrogen is +1 except when it is combined as a binary compound with metals from the lithium, beryllium and boron groups where it has a -1 oxidation number. 5. (a) The oxidation number of fluorine is always -1 (it is the most electronegative element) (b)The oxidation number of chlorine, bromine and iodine is -1 when they are combined with another atom (except oxygen and fluorine) in a binary compound. A binary compound contains only two elements. 6. The oxidation number of oxygen is -2 except (1) when oxygen is combined with fluorine (in OF2, the oxygen has a +2 oxidation number). (2) when in peroxides which have an O-O bond (such as H2O2) where oxygen is -1.
17 7. (a) The oxidation number of sulfur, selenium, tellurium is -2 when they are combined with another atom in a binary compound except when the other atom is oxygen or one of the halogens (fluorine, chlorine, bromine or iodine), in which case rules 5 (a), 5(b) and 6 apply consistent with rules 8(a) and 8(b) below. THE ATOMS IN THE CARBON AND NITROGEN GROUPS DO NOT FORM MANY, IF ANY, SIMPLE BINARY COMPOUNDS WITH EACH OTHER . THEY FORM BINARY COMPOUNDS WITH THE OXYGEN GROUP AND THE HALOGENS (SiO2 AND PCl3) AND ARE OFTEN THE CENTRAL ATOM IN TERNARY COMPOUNDS WITH THESE SAME ELEMENTS (Na2CO3, K3PO4). THEIR OXIDATION NUMBERS ARE USUALLY CALCULATED USING THE RULES GIVEN HERE IN THESE CIRCUMSTANCES. 8. The oxidation numbers of other atoms in compounds are calculated using the rules above and the following (a) The sum of the oxidation numbers of the atoms in a neutral molecule (no electrical charge) must be zero. Example: In AsCl3, the oxidation number of chlorine is -1 (each atom) by rule5(b). The total oxidation number for three chlorines is -3 and therefore the oxidation number of arsenic is +3 so that -3 +3 = 0. In KClO the oxidation number of oxygen is -2 by rule 6 and of potassium is +1 by rule 3(a). The oxidation number of chlorine is not necessarily -1 here since it is not in a binary compound and is combined with oxygen. Its oxidation number is +1 so that +1 + 1 - 2 = 0. (b) The sum of the oxidation numbers of the atoms in an electrically charged ion must be the charge on the ion. Examples: In NO3
-, the oxygen is -2 (each atom) by rule 6. The total oxidation number of three oxygen atoms is -6 so that the nitrogen is +5 in order that +5 - 6 = -1, the charge on nitrate ion. In AsO4
-3, the oxygen is -2 each by rule 6. The total oxidation number of four oxygens is -8 and so the arsenic is +5 so that -8 + 5 = -3, the charge on the arsenate ion.. USING AN ELECTRONIC CALCULATOR (SCIENTIFIC TYPE) A scientific calculator has keys that will do the arithmetic functions of add, subtract, divide and multiply but also has keys that carry out many other functions. Here a short discussion of how to do certain operations will be presented. There are slight differences between calculators so if the procedures below do not work then refer to your calculator manual. The order in which quantities are entered are different on some Hewlett-Packard calculators and on the graphing calculators. Calculator keys often serve more than one function. For keys that have two functions, the key will perform the function written on it directly if it is touched. The second function is written above or below the key and to activate this function, one must touch a key labeled usually 2nd or inv before touching the key with the desired function. HOW TO ENTER A NUMBER THAT IS IN SCIENTIFIC NOTATION To enter 5.46 x 10⁻³ : (NOTE THAT THE TIMES SIGN, X, IS NOT USED.)
18 1 Enter the 5.46 part of the number in the usual manner of entering numbers.
2. Touch the key labeled “EE” or “EXP”. To the right of the 5.46 there should appear two zeroes; they may be full size or smaller than full size. The exponent of the 10 will go into these places. 3. Enter the number 3. The 3 will go into the place of the right most zero form step 2. 4. Touch the +/- key. A negative sign will appear to the left of the two zeroes from step 2. This changes the sign of the exponent. The display should now be 5.46 -03, which is the way calculators display a number in scientific notation. The -03 may be full size on some calculators. LOGARITHMS USING THE CALCULATOR The logarithm of a number is the power to which the base of the logarithm must be raised in order to obtain the number. The base of a logarithm can be any number in general. However, two bases are mostly used for logarithms. These are 10 and e. The number e is irrational and e = 2.712828........ . To find the value of e, enter a 1 in the display of the calculator and touch the key ex; the display is then e to the first power, which is e. Logarithms with base 10 are called common logarithms and logarithms with base e are called natural logarithms. Generally the symbol used for common (base 10) logarithms is log and for natural (base e) logarithms is ln. For base 10 logarithms: 100 = 102 and therefore log 100 = 2 , the power to which 10 must be raised to get 100 1000 = 103 and therefore log 1000 = 3, the power to which 10 must be raised to get 1000. The numbers between 100 and 1000 have logarithms between 2 and 3. For base e logarithms: 7.389056099... = e2 and therefore ln 7.389056099... = 2, the power to which e must be raised to get 7.389056099. TO OBTAIN THE LOGARITHM OF 83.45: 1. Enter the number 83.45 in the display of the calculator. 2. If the common logarithm is desired, touch the log key; and the first 5 digits of the display are 1.9214, which is the common logarithm of 83.45 to four decimal places. 3. If the natural logarithm is desired, touch the key labeled ln; and the first 5 digits of the display are 4.4242, which is the natural logarithm of 83.45 to four decimal places. 4. Note that 4.4242 = ln 83.45 = 2.30258... = 2.303 = ln 10 [this is true for any number] 1.9214 log 83.45 ln x = ln 10 log x INVERSE FUNCTIONS: Enter the number 25 in the display and touch the key labeled x2; the display is 625 which is the square of 25. Now touch the square root key and the display is 25 which is the square root of 625. The square of and the square root of are inverse operations. Inverse functions are such that if one
19 operates on a number with one of them and then operates on this result with the other, the original number is obtained. There are other inverse functions than the square and square root. The ones on most calculators are (1) the log and 10x (or ln and ex) and (2) the trigonometric functions of sine and arcsin, cosine and arccosine, tangent and arctangent, etc., and (3) exponentiation and roots key (which includes the square and square root). (1) If the number 100 is entered into the display and the log key is touched, one gets 2. This is the common logarithm of 100 (102 = 100). With the number 2 still in the display one touches the 2nd (or inv) key and then the log key (which actually calculates the function 10x which is written above or below the log key). The result 100 is in the display. log and 10x are inverse functions which means 10log x = x. The power to which 10 must be raised to get x is the logarithm of x, by definition. (2) Enter the number 28 in the display. It represents the angle 28o in this case. Be sure the calculator is in the mode to take angles in degrees and not radians which will often be indicated by a small “deg” in the display somewhere. Touch the key labeled sin and the result (first 4 digits) in the display is 0.4694 which is the sine of 28 degrees. Leaving the display the same touch the 2nd (or inv) key and then the sin key (which calculates the inverse of the sine (symbolized by sin-1 or arcsine) as indicated by what is written above or below the sin key. The display is now 28 again. The sin and sin-1 are inverse functions. Sin-1 calculates the angle which has a sine value that is in the display. The other trigonometric functions behave similarly. (3) Enter the number 3.5 in the display. Touch the key labeled yx (it may have different symbols than y and x here but in the same positions). Now enter 2.3 in the display followed by the = key. The first five digits of the display will be 17.838 which (to five digits) is the value of 3.52.3. This is called exponentiation. Any number can be raised to any power with this key. The second function on this key is often x√y , which symbolizes the xth root of y. If the value of 3.52.3 (17.838.... ) is left in the display above, then it represents the y in the root formula. Touch the 2nd (or inv) key, then enter 2.3 and touch the = key. This display is 3.5, which is the 2.3th root of 17.838... (17.838... = 3.52.3). These two operations are inverses of each other. The x√y key takes any root of any number. It should be noted that the square root is the ½ (= 0.5) root and that the cube root is the 1/3 (= 0.3333...) root and so forth. Enter 625 in the display, then touch the x√y key. Enter 0.5 in the display and touch the = key. The display is 25 which is the square root of 625, the same result as obtained in this case by simply using the square root key. However, for other roots, usually no special key exists so the x√y or the yx key must be used.

20 ERROR IN EXPERIMENTAL DETERMINATIONS
Errors are usually divided into two classes: CLASS I. DETERMINATE (OR SYSTEMATIC) ERRORS These are errors which can be identified and eliminated either by modifications in the instruments and/or procedures used or by application of correction terms. This type of error can be such that the amount of error is constant (constant error) for a variety of conditions or the error will vary if the conditions of measurement are changed (systematic error). Common sources of Determinate errors: A. Instruments and reagents - an instrument may give a constant high reading or a solution may have the incorrect concentration. B. Operative errors - objects are weighed when hot or material is lost due to spillage. C. Personal errors - color blind people have trouble making color comparisons in endpoints in titrations. Making estimates (decimal places, color changes, etc.) that force agreement with some pre-conceived number. This may be intentional (which is dishonest) or unintentional. For instance, it has been found that some people have a preference for even or odd numbers. D. Errors of method - these errors, inherent in the actual experimental procedure, are often the most serious cause of inaccuracy, because it is frequently very difficult to modify the method so as to eliminate them. CLASS II - INDETERMINATE (OR RANDOM OR ACCIDENTAL) ERRORS These errors are small fluctuations in the values obtained from successive measurements made under the same conditions by the same experimenter. They cannot be accounted for nor can they be eliminated by modification of the instruments or procedures. (See experiment # 2 for more on this and the discussion of uncertainty in reading an instrument). In the table above are listed several pressures measured on the same barometer by the same person. The values are slightly different due to indeterminate errors. One of the main objectives of statistical theory is to provide mathematical procedures for selecting the most probable value from a set of values exhibiting random fluctuations. The simple arithmetic is often used as the most probable value and will be used as such in this course. These random fluctuations are called errors in measurement but a more accurate description would be that they are uncertainties in the measurement. This meaning would reserve the word error for those things that one can correct with sufficient diligence. ERROR The uncertainty of measurements was discussed above. What is called uncertainty above is mostly referred to as indeterminate error.
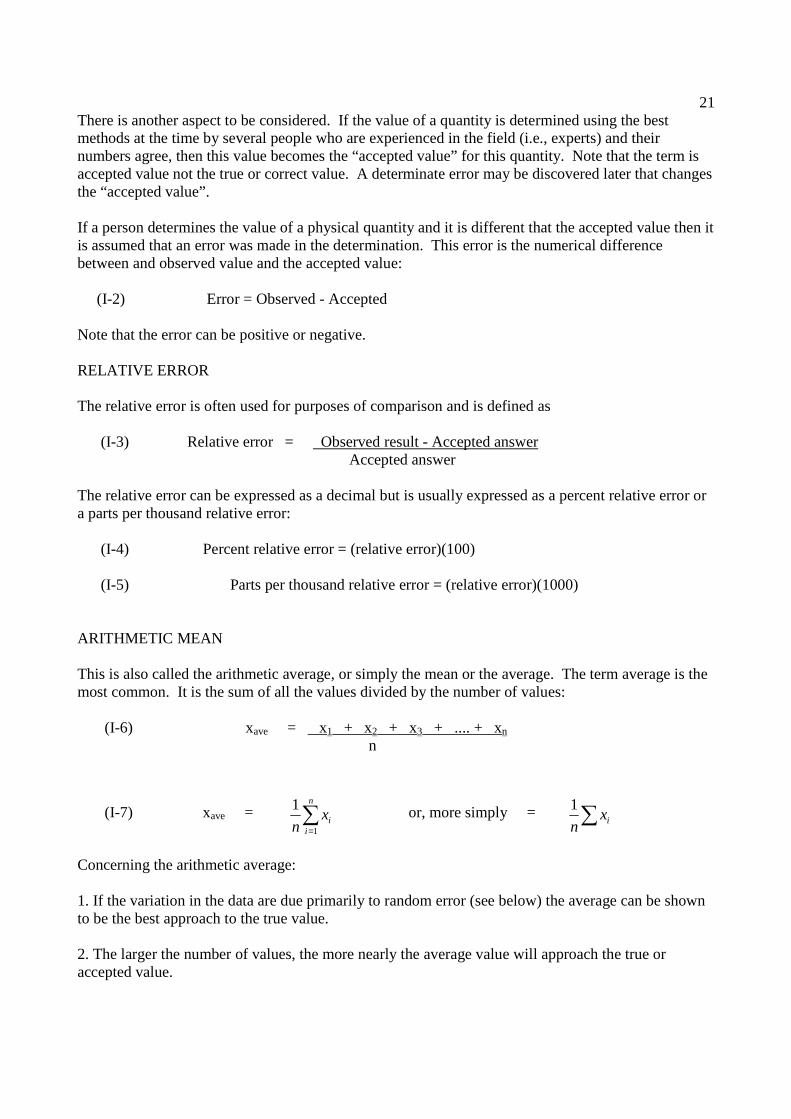
21 There is another aspect to be considered. If the value of a quantity is determined using the best methods at the time by several people who are experienced in the field (i.e., experts) and their numbers agree, then this value becomes the “accepted value” for this quantity. Note that the term is accepted value not the true or correct value. A determinate error may be discovered later that changes the “accepted value”. If a person determines the value of a physical quantity and it is different that the accepted value then it is assumed that an error was made in the determination. This error is the numerical difference between and observed value and the accepted value: (I-2) Error = Observed - Accepted Note that the error can be positive or negative. RELATIVE ERROR The relative error is often used for purposes of comparison and is defined as (I-3) Relative error = Observed result - Accepted answer Accepted answer The relative error can be expressed as a decimal but is usually expressed as a percent relative error or a parts per thousand relative error: (I-4) Percent relative error = (relative error)(100) (I-5) Parts per thousand relative error = (relative error)(1000) ARITHMETIC MEAN This is also called the arithmetic average, or simply the mean or the average. The term average is the most common. It is the sum of all the values divided by the number of values: (I-6) xave = x1 + x2 + x3 + .... + xn n
(I-7) xave = ∑=
n
iix
n 1
1 or, more simply = ∑ ixn
1
Concerning the arithmetic average: 1. If the variation in the data are due primarily to random error (see below) the average can be shown to be the best approach to the true value. 2. The larger the number of values, the more nearly the average value will approach the true or accepted value.
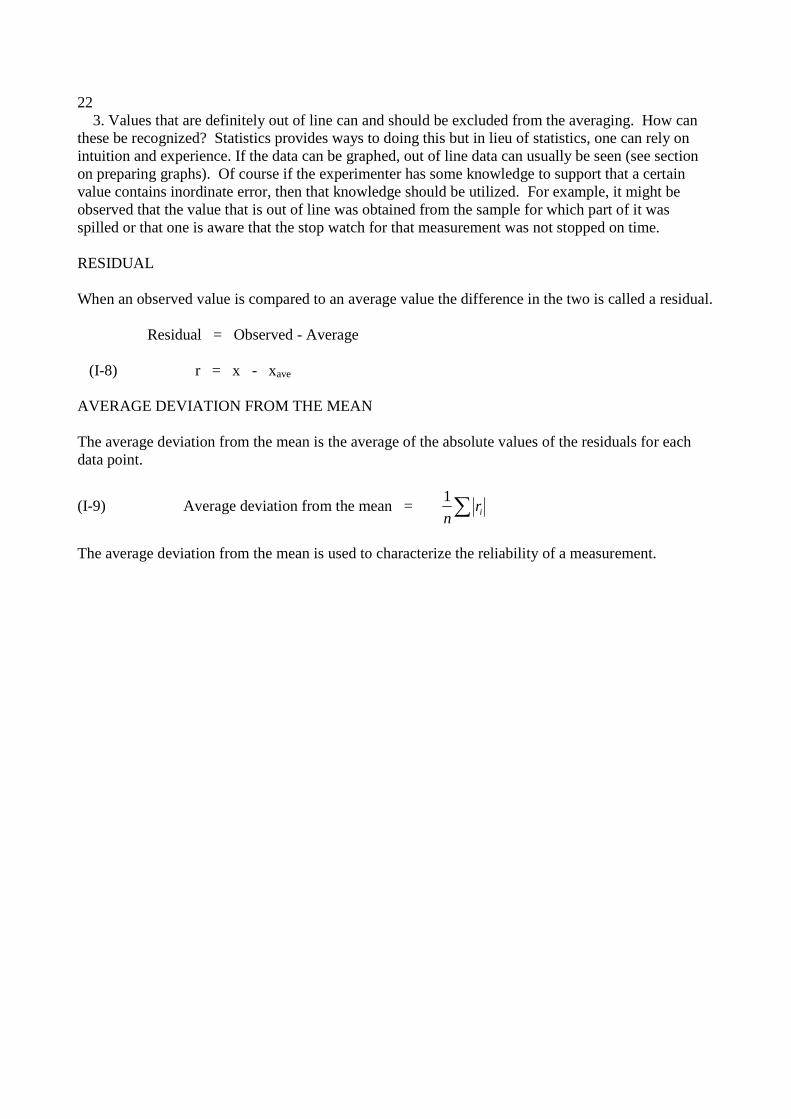
22 3. Values that are definitely out of line can and should be excluded from the averaging. How can
these be recognized? Statistics provides ways to doing this but in lieu of statistics, one can rely on intuition and experience. If the data can be graphed, out of line data can usually be seen (see section on preparing graphs). Of course if the experimenter has some knowledge to support that a certain value contains inordinate error, then that knowledge should be utilized. For example, it might be observed that the value that is out of line was obtained from the sample for which part of it was spilled or that one is aware that the stop watch for that measurement was not stopped on time. RESIDUAL When an observed value is compared to an average value the difference in the two is called a residual. Residual = Observed - Average (I-8) r = x - xave AVERAGE DEVIATION FROM THE MEAN The average deviation from the mean is the average of the absolute values of the residuals for each data point.
(I-9) Average deviation from the mean = ∑ irn
1
The average deviation from the mean is used to characterize the reliability of a measurement.
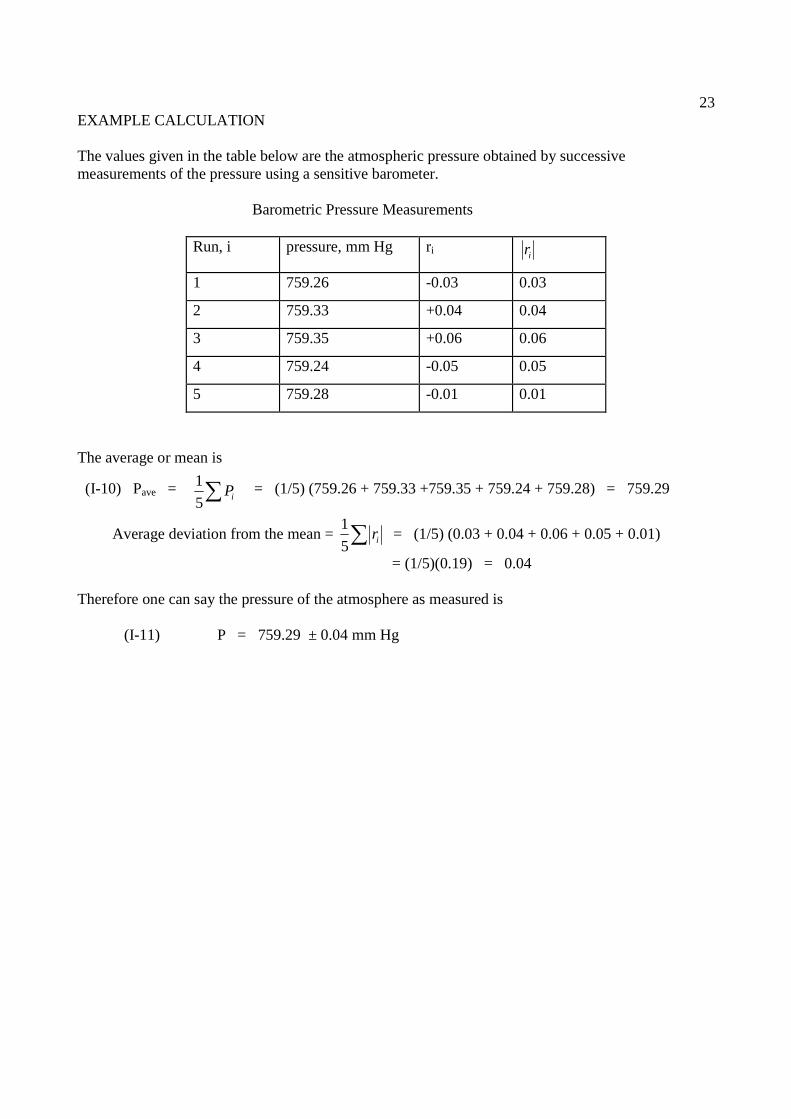
23 EXAMPLE CALCULATION The values given in the table below are the atmospheric pressure obtained by successive measurements of the pressure using a sensitive barometer. Barometric Pressure Measurements
Run, i pressure, mm Hg ri ir
1 759.26 -0.03 0.03
2 759.33 +0.04 0.04
3 759.35 +0.06 0.06
4 759.24 -0.05 0.05
5 759.28 -0.01 0.01
The average or mean is
(I-10) Pave = ∑ iP5
1 = (1/5) (759.26 + 759.33 +759.35 + 759.24 + 759.28) = 759.29
Average deviation from the mean = ∑ ir5
1 = (1/5) (0.03 + 0.04 + 0.06 + 0.05 + 0.01)
= (1/5)(0.19) = 0.04 Therefore one can say the pressure of the atmosphere as measured is
(I-11) P = 759.29 ± 0.04 mm Hg
24 GRAPHS
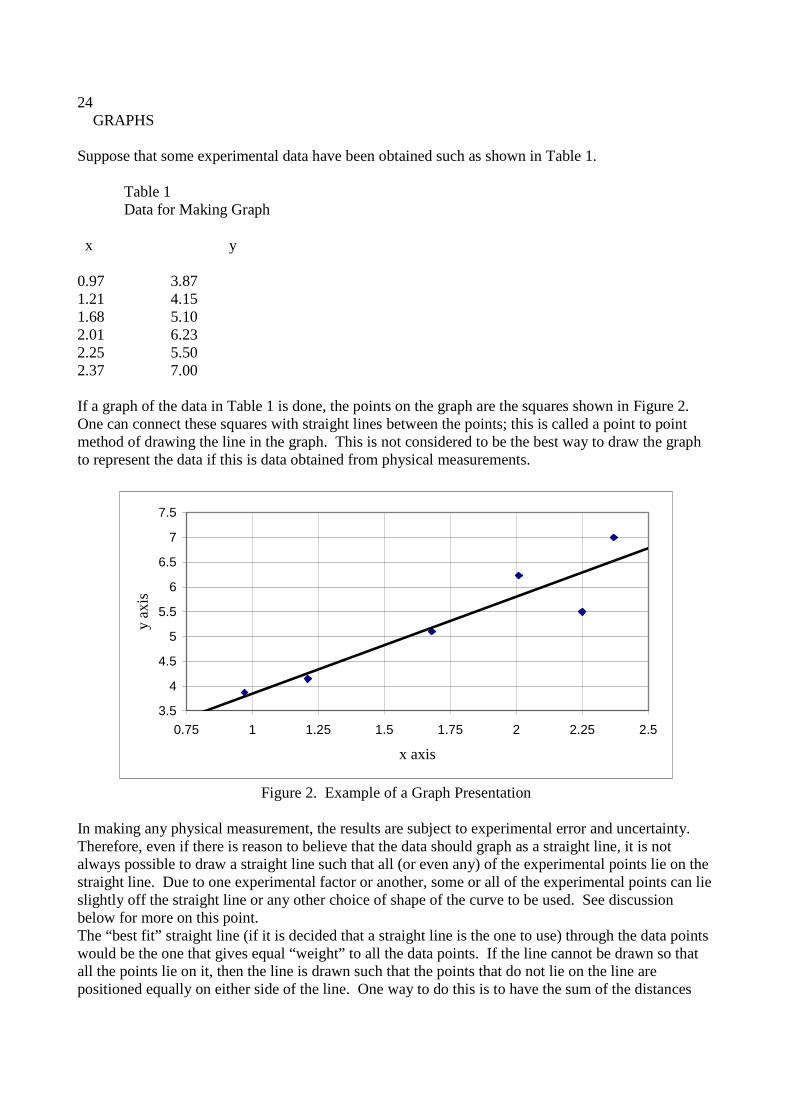
Suppose that some experimental data have been obtained such as shown in Table 1. Table 1 Data for Making Graph x y 0.97 3.87 1.21 4.15 1.68 5.10 2.01 6.23 2.25 5.50 2.37 7.00 If a graph of the data in Table 1 is done, the points on the graph are the squares shown in Figure 2. One can connect these squares with straight lines between the points; this is called a point to point method of drawing the line in the graph. This is not considered to be the best way to draw the graph to represent the data if this is data obtained from physical measurements.
3.5
4
4.5
5
5.5
6
6.5
7
7.5
0.75 1 1.25 1.5 1.75 2 2.25 2.5
x axis
y ax
is
Figure 2. Example of a Graph Presentation
In making any physical measurement, the results are subject to experimental error and uncertainty. Therefore, even if there is reason to believe that the data should graph as a straight line, it is not always possible to draw a straight line such that all (or even any) of the experimental points lie on the straight line. Due to one experimental factor or another, some or all of the experimental points can lie slightly off the straight line or any other choice of shape of the curve to be used. See discussion below for more on this point. The “best fit” straight line (if it is decided that a straight line is the one to use) through the data points would be the one that gives equal “weight” to all the data points. If the line cannot be drawn so that all the points lie on it, then the line is drawn such that the points that do not lie on the line are positioned equally on either side of the line. One way to do this is to have the sum of the distances

25 from the points to the line be a minimum. This can be done mathematically to give what is called the least squares best line. It is also possible to draw in the line by “eye” to give a reasonable fit to the data and this is what is often done. The best fit straight line for the data in Table 1 is also shown in Figure 2. Notice that it does not go through any of the data points. It is assumed that if the data being measured do fit a straight line, the most likely position for that line is the best fit line. In drawing the best fit line in Figure 2, the data point (2.25, 5.50) is ignored. This value, as seen in Fig. 2, does not appear to fit reasonably with the other data. If one has the opportunity, the experiment would be done again to ascertain if the data is valid. If it cannot be checked, generally it is assumed that it is a bad data point. The basic premise here is that “blips” in the values of physical quantities as indicated by the point (2.25, 5.50) do not generally occur. Physical quantities are assumed to change continuously and do not usually make abrupt changes in value (it does happen however). What measured quantities have been doing is likely to be what they will continue to do and changes occur mostly gradually. It is generally assumed that points such as (2.25, 5.50) are more likely bad data points than a true picture of the phenomenon being measured. It should be realized, however, that this is not always the case. The more experience one has with the situation at hand the easier it is to decide whether a point is a bad data point or not. The curve should go through the maximum number of points and the points not on the line should be evenly distributed on either side of the curve. In drawing the “best fit” curve, one is trying to guess where the curve would go if such a large number of experiments were done that each point was a really good average value. The point to point graph in Figure 2 was done using computer software, specifically Lotus here. If a computer is used, some of the decisions about preparing a graph can be made by the computer program although things such as scales and upper and lower limits can be (and sometimes should be) set manually. However, it is still possible to prepare a graph “by hand” and doing that is a rewarding experience for the novice. HOW TO MAKE A GRAPH “BY HAND” 1. Use 8.5" by 11" paper with pre-drawn grids on it (not necessarily expensive graph paper). DO NOT MAKE THE GRIDS BY MARKING A PIECE OF PAPER WITH A PEN. 2. Graphs should be ultimately done in ink. The whole process can be done in pencil lightly (a # 3 maybe) and when it is complete, an ink pen can be used to write in the numbers and lines. After the ink dries, the lightly drawn pencil values and lines can be erased. 3. Orient the paper so that any punched holes are on the left or at the top of the page. 4. Label the axes with the name and units of the quantity being graphed along that axis. For instance, an axis may be labeled time, seconds or density, lbs/ft3. 5. Choose a scale for each axis. The means choosing how much the distance between two lines on the axis will represent; that is, if a line represents 5 inches, does the next line represent 5.01, 5.1, 5.5, 6, 10, etc.. Also, as much as possible of the distance of the page should be used. If a good scale cannot be obtained if the whole width or length of the paper is used, the complete use of the page is secondary to having a convenient scale.

26 It is convenient and useful to have the distance between lines represent as small a value as possible
so that making and reading the values on the graph can be done accurately and easily. On the other hand, one should avoid an awkward scale that makes preparing and reading the graph difficult and slow and may lead to error. For instance, scale (a) and (b) below are better to use than scale (c) because it is easier to position data on a scale with five spaces (each space is 0.2 units) or ten spaces (each space is 0.1 units) than on a scale with seven spaces (each space is 0.1428... units). For instance compare the difficulty in graphing the value 4.48 on each of the scales below. | | | | | | | | | | | | | | | | | | | | | | | | | | | | 4 5 4 5 4 5 (a) (b) (c) Some points to remember about constructing a graph: (a) The distance between lines must be the same distance at all points on the graph. This distance can be different for the x axis than the y axis but must be the same everywhere on the x axis and the y axis. (b) The point where the axes cross on a particular graph does not have to the point (0, 0). Each axis can start at any value. To help in scaling, the lowest value on an axis is slightly smaller than the lowest value of the data to be graphed on the axis. The scale on the axis is adjusted so that the greatest value of the data to be graphed on the axis can be placed on the axis. (c) Do not write too many numbers along the axis of the graph. It takes only a few to indicate the scale and the others can be interpolated. Too many numbers clutter the graph. 6. Make a period to indicate the point that is graphed. Enclose the point in a small circle, triangle or square, etc. 7. Draw a curve through the points that will give the “best fit” to the points. See the discussion above. Draw the curve which will generally represent the trend in the data. 8. Place a title on the graph that is explicit but concise. Anyone reading the title should know what the graph is but it should not take up a lot of space. There is no specific position for a title but usually at the top of the graph is best if possible. 9. If two or more curves are drawn on the same page, they may be distinguished by different colored lines or by different enclosures around the graphed points (circles, squares, triangles, etc). Use a legend or simple direct labels adjacent to the curves to indicate which is which. THE VALUE OF GRAPHS 1. Graphs are pictorial (a picture is worth a thousand words). A graph shows in a glance the trends in data and helps a person retain the picture of how the data are related. A long list of numbers cannot do the same thing as easily or quickly. 2. Graphs provide means for prediction. A carefully drawn graph will allow at least two methods of prediction to be used: (a) interpolation - this is the process of estimating the value of a quantity that lies between two measured values of the quantity. If a graph of experimental data has been carefully drawn and the line
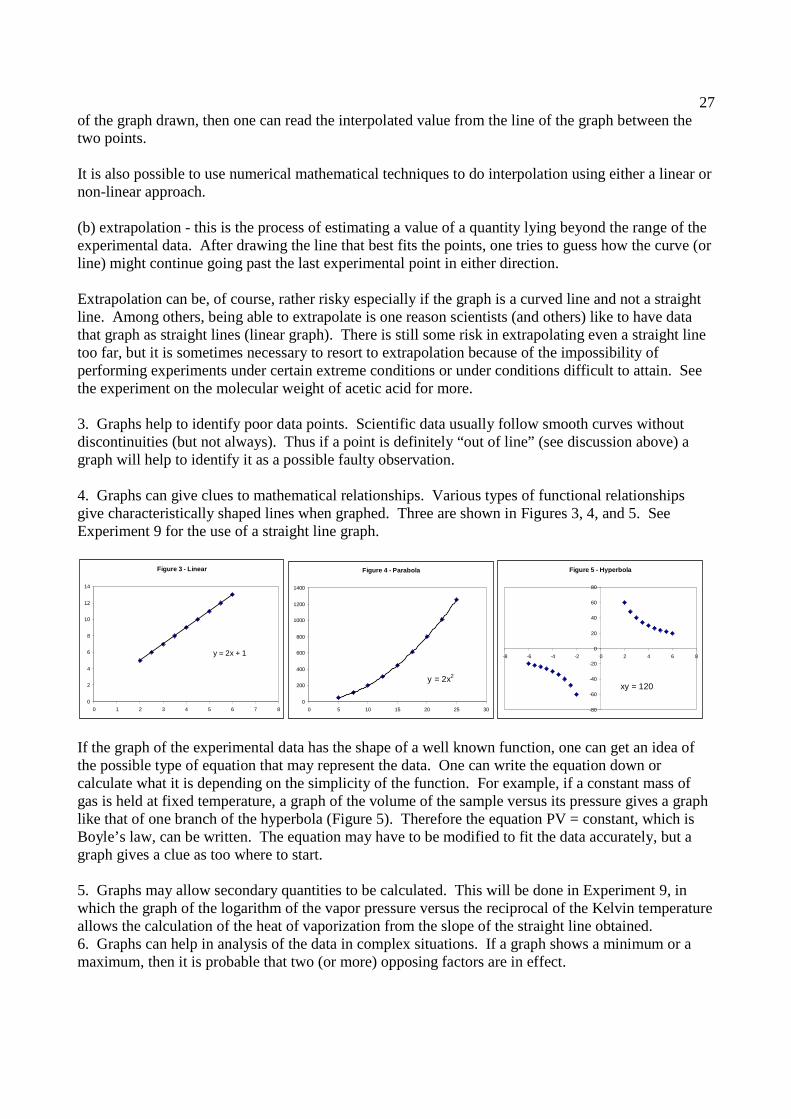
27 of the graph drawn, then one can read the interpolated value from the line of the graph between the two points. It is also possible to use numerical mathematical techniques to do interpolation using either a linear or non-linear approach. (b) extrapolation - this is the process of estimating a value of a quantity lying beyond the range of the experimental data. After drawing the line that best fits the points, one tries to guess how the curve (or line) might continue going past the last experimental point in either direction. Extrapolation can be, of course, rather risky especially if the graph is a curved line and not a straight line. Among others, being able to extrapolate is one reason scientists (and others) like to have data that graph as straight lines (linear graph). There is still some risk in extrapolating even a straight line too far, but it is sometimes necessary to resort to extrapolation because of the impossibility of performing experiments under certain extreme conditions or under conditions difficult to attain. See the experiment on the molecular weight of acetic acid for more. 3. Graphs help to identify poor data points. Scientific data usually follow smooth curves without discontinuities (but not always). Thus if a point is definitely “out of line” (see discussion above) a graph will help to identify it as a possible faulty observation. 4. Graphs can give clues to mathematical relationships. Various types of functional relationships give characteristically shaped lines when graphed. Three are shown in Figures 3, 4, and 5. See Experiment 9 for the use of a straight line graph.
Figure 3 - Linear
y = 2x + 1
0
2
4
6
8
10
12
14
0 1 2 3 4 5 6 7 8
Figure 4 - Parabola
y = 2x2
0
200
400
600
800
1000
1200
1400
0 5 10 15 20 25 30
Figure 5 - Hyperbola
-80
-60
-40
-20
0
20
40
60
80
-8 -6 -4 -2 0 2 4 6 8
xy = 120
If the graph of the experimental data has the shape of a well known function, one can get an idea of the possible type of equation that may represent the data. One can write the equation down or calculate what it is depending on the simplicity of the function. For example, if a constant mass of gas is held at fixed temperature, a graph of the volume of the sample versus its pressure gives a graph like that of one branch of the hyperbola (Figure 5). Therefore the equation PV = constant, which is Boyle’s law, can be written. The equation may have to be modified to fit the data accurately, but a graph gives a clue as too where to start. 5. Graphs may allow secondary quantities to be calculated. This will be done in Experiment 9, in which the graph of the logarithm of the vapor pressure versus the reciprocal of the Kelvin temperature allows the calculation of the heat of vaporization from the slope of the straight line obtained. 6. Graphs can help in analysis of the data in complex situations. If a graph shows a minimum or a maximum, then it is probable that two (or more) opposing factors are in effect.
28 DISCONTINUOUS AND CONTINUOUS GRAPHS
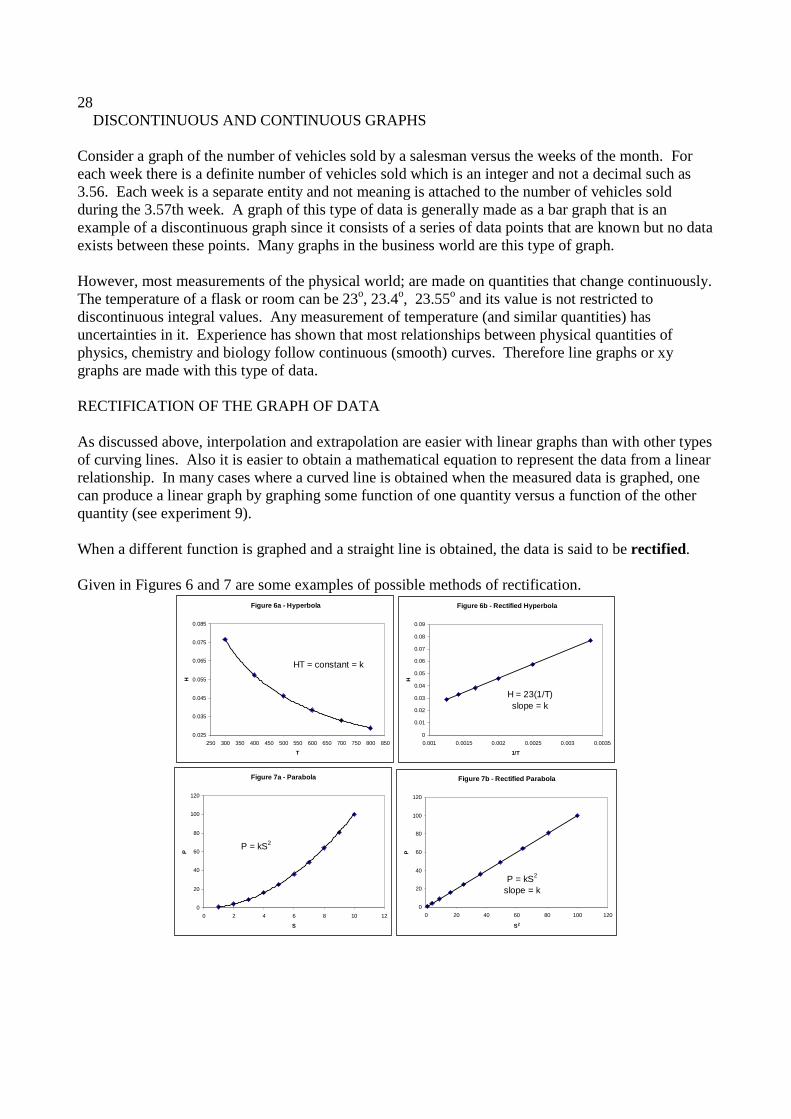
Consider a graph of the number of vehicles sold by a salesman versus the weeks of the month. For each week there is a definite number of vehicles sold which is an integer and not a decimal such as 3.56. Each week is a separate entity and not meaning is attached to the number of vehicles sold during the 3.57th week. A graph of this type of data is generally made as a bar graph that is an example of a discontinuous graph since it consists of a series of data points that are known but no data exists between these points. Many graphs in the business world are this type of graph. However, most measurements of the physical world; are made on quantities that change continuously. The temperature of a flask or room can be 23o, 23.4o, 23.55o and its value is not restricted to discontinuous integral values. Any measurement of temperature (and similar quantities) has uncertainties in it. Experience has shown that most relationships between physical quantities of physics, chemistry and biology follow continuous (smooth) curves. Therefore line graphs or xy graphs are made with this type of data. RECTIFICATION OF THE GRAPH OF DATA As discussed above, interpolation and extrapolation are easier with linear graphs than with other types of curving lines. Also it is easier to obtain a mathematical equation to represent the data from a linear relationship. In many cases where a curved line is obtained when the measured data is graphed, one can produce a linear graph by graphing some function of one quantity versus a function of the other quantity (see experiment 9). When a different function is graphed and a straight line is obtained, the data is said to be rectified. Given in Figures 6 and 7 are some examples of possible methods of rectification.
Figure 6a - Hyperbola
HT = constant = k
0.025
0.035
0.045
0.055
0.065
0.075
0.085
250 300 350 400 450 500 550 600 650 700 750 800 850
T
H
Figure 6b - Rectified Hyperbola
H = 23(1/T)slope = k
0
0.01
0.02
0.03
0.04
0.05
0.06
0.07
0.08
0.09
0.001 0.0015 0.002 0.0025 0.003 0.0035
1/T
H
Figure 7a - Parabola
0
20
40
60
80
100
120
0 2 4 6 8 10 12
S
P
P = kS2
Figure 7b - Rectified Parabola
P = kS2
slope = k
0
20
40
60
80
100
120
0 20 40 60 80 100 120
S2
P