part ii: ms office excel. introduction easy to use a spreadsheet program is a super calculator that...
TRANSCRIPT

Part II: MS Office
Excel

Introduction
• Easy to Use
• A spreadsheet program is a super calculator that provides you with a giant grid upon which you can enter numbers or words.
• Learn on a “need to know” basis
• “What” if scenarios
• Templates may be created
• Interaction

• The spreadsheet program is an extremely flexible tool that can be applied to a wide range of common problems. – Financial planners - to make forecasts.
• (e.g. a manager could enter this year’s sales figures and a formula for projected growth over the next five years. The program could then compute the sales forecast and adjust figures accordingly).
– Managers - to help prepare budgets. • (e.g. Alternative budgets can be analysed by simply changing budget
values).
– Accountants - to perform tax planning and prepare income statements, profit-and-loss statements and balance sheets.

Advantages of spreadsheets
• Spreadsheets make doing most calculations a great deal easier than doing them on a calculator.
• Spreadsheets lets you visually organise your data into rows and columns.
• Spreadsheets can be used for simple lists and collections of data.
• Formulae and Functions• Finally, spreadsheets can turn your data into a chart.

• Some of the things you can do with a spreadsheet are:• Add columns of numbers.• Add rows of numbers.• Compute averages, standard deviations, and other statistics on
rows and columns of numbers.• Find the maximum or minimum value in a set of
values.• Compute the number of days between two dates.• Sort lists alphabetically or numerically.
• In general, spreadsheets are used for creating tables, making charts, doing calculations, or keeping short lists of things.

Interface


Workbook
• A Workbook is made up of a number of Worksheets
• A Worksheet is made up of the rows and columns into which information is entered
• 65,536 rows allowed in each worksheet
• Columns in spreadsheets are identified with letters of the alphabet, i.e. A, B, C, … Z, AA, AB, AC,

• Cell:– This is the space that occurs at the intersection between a
row and a column.
• Cell address or cell reference: – This is the combination of letter and number that
identifies the intersection between a specified row and column.
• It specifies the cell’s exact position within the worksheet. Cells are generally addressed as ColumnLetterRowNumber. For example, a cell in column B and row 18 has the cell reference B18, likewise a cell in column ED and row 650 is referenced ED650.

Worksheets • The essence of the worksheet is that each cell can, at
the same time, contain two different types of entry.– The entry that is visible when you look at the worksheet
on the screen. This is a number or a piece of text and this might be typed into place as you enter data, or it might arise as a result of some earlier action.
– The other type, invisible entry, can be a formula of some type, which will decide what the visible entry shall be. This formula entry can be typed, displayed and edited, but is never visible during your normal use of the worksheet.

Example

Creating and opening Workbooks
• To create a new default workbook– click on the new icon located within the
standard rule bar
• Using a standard template– Click on the file drop down menu, click on the
new command
• Open an existing Workbook– From the File menu choose open

Spreadsheet Design• Spreadsheets help solve problems that can be represented with
numbers and formulae.• The first step in step in solving a problem, is to structure the
problem and its solution. In the case of number-based problems, this involves building a numeric model of the problem.
• This means we need to identify the entities or objects of the problem and items relating to the objects (attributes).
• The entities or objects of the problem will form the columns while the attributes or items relating to the objects will form the rows.

• For example, say you want to work out the balance of your January account. You need to gather the existing data for this:
• Deposit cheques and Spending cheques.• These are the entities.• The attributes for the deposit cheques could be:• grant cheque, parents contribution, part time
job• and those for the spending cheques could be:• rents, bills {heating, telephone}, food, drink.

Example
• Then you add the amount of the deposit cheques and subtract the amount of the spending cheques.
• Most people do this in a chequebook register, which consists of vertical columns for addition, subtraction, and the balance and horizontal rows for listing each cheque received and paid.


Data Types• Numbers
– Entering number into a spreadsheet creates static values. In other words, the values do not change unless you manually enter a new number.
• Text– text is used for labelling and annotating the numbers
• Formulae– Formulae allow you to perform arithmetic operations
on numbers and compare the contents of one cell to another.

Formulae• When a formula is entered into a cell then the
result of the formula is displayed rather than the content.
• In Microsoft Works, a formula must always begin with an equal sign “=” followed by a mathematical expression.
• Consider this example for a formula “=A1+B3”.• The mathematical expression is A1+B3,

• A1 and B3 are the operands.• The plus “+” sign is the arithmetic operator.• Suppose this formula is entered in cell D5, then this means• “Add the contents of cell A1 to the contents of cell B3 and show
the result in cell D5”.• If the contents in one (or both) of the cells A1 and B3 were to be
changed, then the numerical value in cell D5 will change correspondingly.
• Entering formulae into spreadsheets therefore creates dynamic values.
• Dynamic values change automatically if the values that created them change.

Operators• Operator Action
Example
+ Plus A1+B1
- Minus A1-B1
* Multiply A1*B1
/ Divide A1/B1
^ Raise to A1^3the power
% Divide by A1%B1

Functions• Functions enhanced the calculations that
spreadsheets can perform.• These functions often work on a number of cells
together to produce a single figure result.• A typical example is the SUM function that adds up
all the cell in the range you specify.• For example, we can used this formula:• =B4+B5+B6+B7+B8+B9• to add the column of figures in, say, a shopping list.


• Instead of writing that formula in the above format, we could equally well use this function:
• SUM(B4:B9).• This would produce the same result and it is a lot
easier to write.• The function SUM(B4:B9) means:• the sum of the contents of cells B4,B5,B6,B7,B8
and B9.
• The term B4:B9 is called the range.

Mathematical Functions
• Mathematical functions provides the user with the ability to calculate arithmetic and trigonometric functions quickly.
• Examples:• SUM(B4:B9)• SQRT(F4*B5)• ROUND(G3,3)
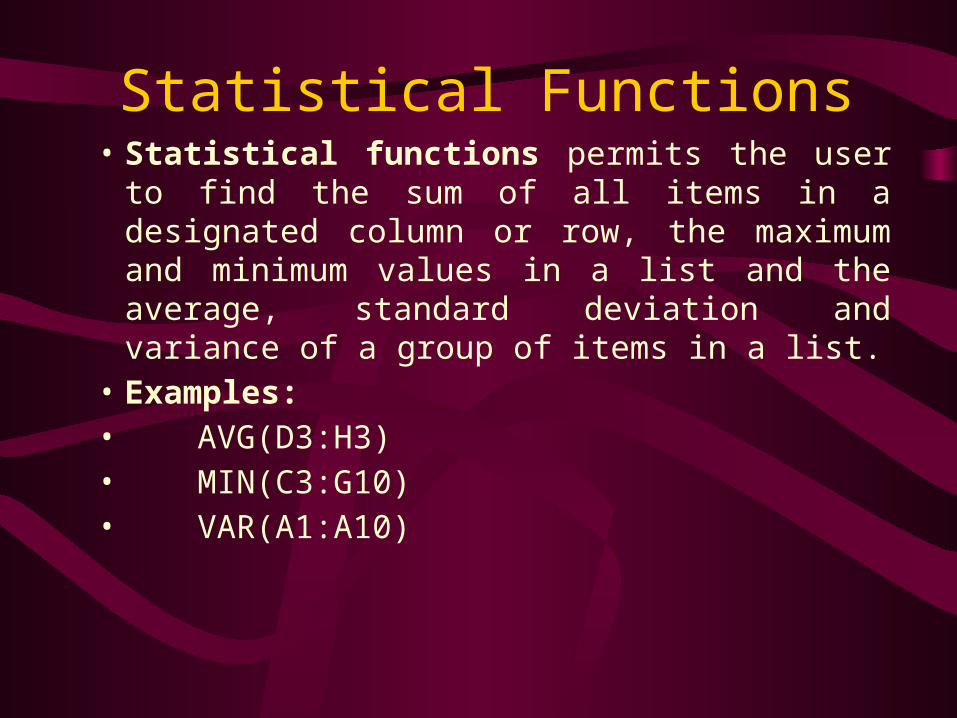
Statistical Functions• Statistical functions permits the user to find the
sum of all items in a designated column or row, the maximum and minimum values in a list and the average, standard deviation and variance of a group of items in a list.
• Examples:• AVG(D3:H3)• MIN(C3:G10)• VAR(A1:A10)

Logical Functions
• Logical functions allow the user to specify the action that is to be taken based on the value of a logical expression. A logical expression is a mathematical expression and logical operators that can take on a “true” or a “false” value only.
• Example:• IF (14>B6,5,10)

Editing the Worksheet
• With any computing program it is important to be able to edit the information easily.
• The spreadsheet program will allow you to:• change the numbers in a cell.
• alter a formula.
• edit a piece of text.
• alter the display format of any of the cells.
• insert or delete columns and rows.

To insert a blank row
– highlight the row where the new row is to be inserted
– then perform the Insert Row/Column command in the Insert Menu.
• Note:• The row that initially occupied this location and all
of the rows beneath it will be “pushed down”.
• Cell addresses appearing in formulae will automatically be adjusted for this new location.

To insert a blank column
– highlight the column where the new column is to be inserted
– then perform the Insert Row/Column command in the Insert Menu.
• Note:• The column that initially occupied this location and all
of the columns to its right will be “pushed to the right”.
• All cell addresses appearing in formulae will automatically be adjusted as required.

To delete a row or column– highlight the row or column– then perform the Cut command from the Edit menu.
• Alternatively:• perform the Delete Row/Column command from the Insert
Menu.
• Note:• When you delete a row or column, other cells shift to fill in the
gap.• The Clear command in the Edit menu will only remove all the
cell contents within that row or column.• You can recover the deleted information by performing the
Undo command from the Edit menu.

Copying Cells– Spreadsheet editing abilities cover more than just
altering what is already in the spreadsheet.
– Excel allows you to copy a cell or a range of cells using the Copy and Paste command in the Edit Menu.
• Note:
• If the destination cells contain information, Excel overwrites them without warning you.
• The spreadsheet program provides other editing functions that speed up the entry of information or the setting up of formulae in a worksheet.

• For example, consider this table shown above. Suppose we want to calculate the total sales of the products over three months.
• To total up all the months sales, you might have to write the following formulae in column F:• cell F2 =SUM(B2:E2)• cell F3 =SUM(B3:E3)• cell F4 =SUM(B4:E4)

Autofill
• Excel has an autofill procedure that saves you typing all these formulae:– Enter the formula into one cell, say F2.– Select the cells you want to copy the formula– then perform the Fill Down command in the
Edit Menu.
• How Excel copies the formula depends on the kinds of references used within it.

Cell References
• There are three types of Cell References– Relative– Absolute– Mixed

Relative Reference
• A relative cell reference is the address of a cell relative to the cell the reference is in.
• Relative references are useful when you want to copy a formula to several columns or rows.
• What about the situation where you want the cell reference to stay the same?
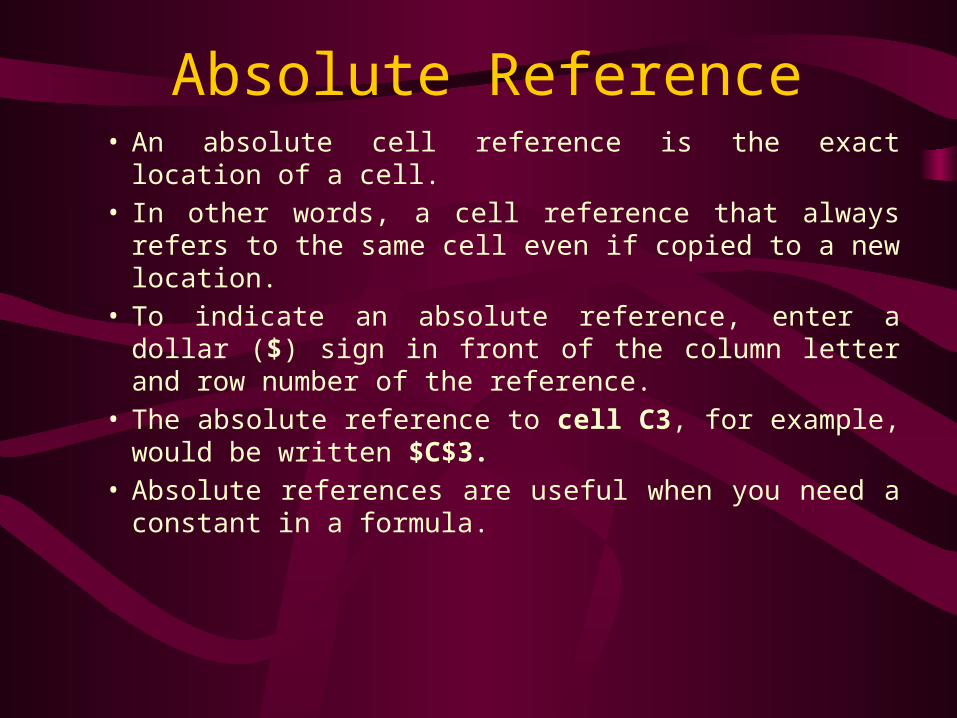
Absolute Reference• An absolute cell reference is the exact location of a cell.• In other words, a cell reference that always refers to the
same cell even if copied to a new location.• To indicate an absolute reference, enter a dollar ($) sign
in front of the column letter and row number of the reference.
• The absolute reference to cell C3, for example, would be written $C$3.
• Absolute references are useful when you need a constant in a formula.
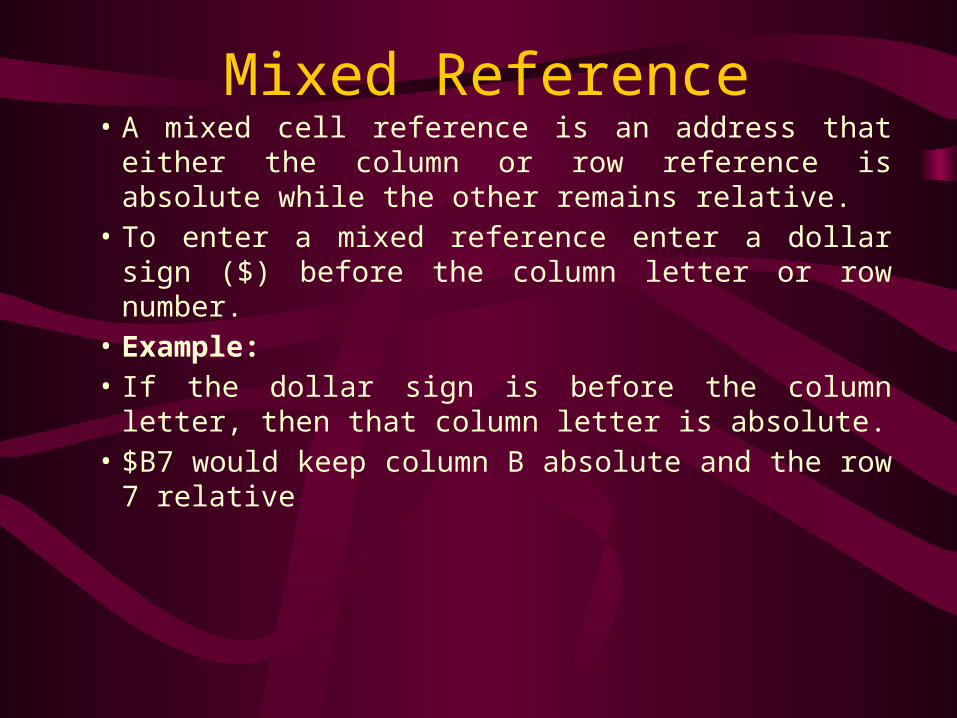
Mixed Reference• A mixed cell reference is an address that either the
column or row reference is absolute while the other remains relative.
• To enter a mixed reference enter a dollar sign ($) before the column letter or row number.
• Example:• If the dollar sign is before the column letter, then that
column letter is absolute.• $B7 would keep column B absolute and the row 7
relative

Charts• Usefulness of charts:
• Charts provide instant visual overview of your data.
• Charts are valuable when complex numeric data need to be communicated quickly and effectively. In the business world, charts are used in presentations, technical literature, and financial reports.
• Charts help you spot differences in a set of values.
• When numbers are properly charted, the unusual numbers or relationships will stand out.
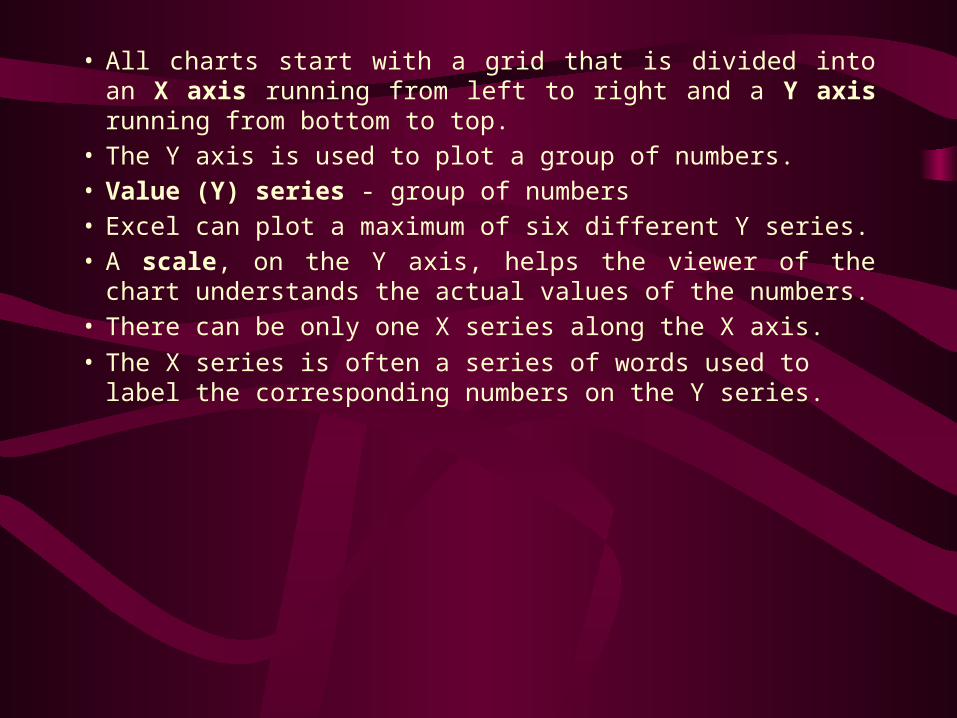
• All charts start with a grid that is divided into an X axis running from left to right and a Y axis running from bottom to top.
• The Y axis is used to plot a group of numbers.• Value (Y) series - group of numbers• Excel can plot a maximum of six different Y series.• A scale, on the Y axis, helps the viewer of the chart
understands the actual values of the numbers.• There can be only one X series along the X axis.• The X series is often a series of words used to label the
corresponding numbers on the Y series.

Types of Charts
• Bar chart• This is a type of chart in which numerical data
are represented by vertical bars.• Most simple charting needs are met nicely with
the bar chart.• Types of Bar charts:• When there is more than one Y series, you can
get bar charts of this type:• Side-by-side bar chart

Example

Side-by-side bar chart

Stacked Bar Chart

Pie Chart

Line Chart