part ii: market analysis - daff.gov.za · iv list of figures figure 1. provincial share in total...
TRANSCRIPT

Part II: Market analysis Final report: 29 June 2005

29/06/2005: VERSION 2.5
Author: Doubell Chamberlain
Hassan Essop
Christine Hougaard
Stephan Malherbe
Richard Walker
The following papers were prepared as inputs into this project and are available on request:
• Environmental impacts of the forestry industry value chain – CSIR Environmentek
• The social impacts of the forestry and pulp and paper industry in South Africa – Morabo Morajele
We would further like to acknowledge the inputs provided by Mike Howard from Fractal Forests Africa.
Genesis Analytics (Pty) Ltd 2nd Floor, No 4 High Street, Melrose Arch, Johannesburg South Africa, 2196. Post to: Suite 3, Private Bag X1, Melrose Arch, Johannesburg, South Africa, 2076. Tel: +27 11 214 4080, Fax: +27 11 214 4099 www.genesis-analytics.com


i
TABLE OF CONTENTS
List of Figures iv
List of Tables iv
List of Boxes v
1. INTRODUCTION 1
2. PLANTATION FORESTRY 2
2.1. Basic description 2
2.2. Market players 4
2.3. Production and products 6
2.4. Market definition, structure and conduct 8
2.5. Salient features 11
3. PULP, PAPER AND RECYCLING 20
3.1. Overview of the pulp market 20
3.2. Overview of the paper market 37
3.3. OVerview of waste paper recovery market 51
3.4. Salient features of the pulp, paper and recycling industries 59
4. WOOD CHIP EXPORTS 69
4.1. Basic description 69

ii
4.2. Market players 71
4.3. Fibre inputs 72
4.4. Market definition, structure and concentration 73
4.5. Salient features 81
5. SAWMILLING 84
5.1. Basic description 84
5.2. Market players 85
5.3. Production and products 87
5.4. Market definition, structure and conduct 88
5.5. Salient features 98
6. CHARCOAL 101
6.1. Basic description 101
6.2. Market players 101
6.3. Production and products 102
6.4. Market definition, structure and conduct 103
6.5. Salient features 104
7. TIMBER BOARD 107
7.1. Basic description 107
7.2. Market players 107

iii
7.3. Production and products 108
7.4. Market definition, structure and conduct 109
7.5. Salient features 114
8. MINING TIMBER 116
8.1. Basic Description 116
8.2. Market players 116
8.3. Products and production 117
8.4. Market definition, structure and conduct 118
8.5. Salient features 119
9. TREATED POLES 120
9.1. Basic description 120
9.2. Market players 120
9.3. Production and products 120
9.4. Market definition, structure and conduct 121
9.5. Salient features 124

iv
LIST OF FIGURES
Figure 1. Provincial share in total plantation area. 3 Figure 2. Plantation area as a percentage of provincial land area. 3 Figure 3. Distribution of plantation ownership by area: 2003. 5 Figure 4. Production of sawn wood vs. pulpwood over the past two decades 7 Figure 5. Value of pulp trade: 1992-2003 (in real 2003 values). 33 Figure 6. Schematic representation of major paper product grades. 41 Figure 7. Proportions of various grades of printing and writing paper and packaging
paper. 47 Figure 8. Recycling market players’ waste paper usage, 2003 57 Figure 9: End-users according to sawn timber sales 2001 to 2004 94 Figure 10: Sales volume and log intake of mining timber mills 117 Figure 11: Supply of pole timber according to region 122
LIST OF TABLES
Table 1. Pulp production by grade, 2003. 22 Table 2. Energy use proportions of Sappi pulp and paper mills, 2004. 26 Table 3. Skills distribution of the pulp and paper industry, 2004. 27 Table 4. Input cost structure for hardwood bleached kraft pulp ($ per ton) for selected
countries. 29 Table 5. Calculation of the traded component of the chemical pulp market. 31 Table 6. NBSK prices over the past five years. 37 Table 7. Capacity shares: paper manufacturing in SA, 2003. 38 Table 8. Smaller paper mills and their capacities, 2003 39 Table 9. Smaller mills’ capacities after expected expansions (2005) 40 Table 10. Volume of paper production by major grade categories, 2001 to 2003. 42 Table 11. Paper exports by major category, 2001 to 2003 46 Table 12. Total paper imports, 2001 to 2003 46 Table 13. International paper prices over the past five years. 50 Table 14. Paper available for recovery and recovery rates in South Africa, 2003 52 Table 15. Pre- and post-consumer recovery of paper in South Africa, 2003 54 Table 16. Chipping plants, ownership and capacity (2003) 71 Table 17: Trading Companies Share of South African Woodchip exports 75 Table 18. Woodchip Mills and Buyers of woodchips for 2003 (BDT quantities) 76 Table 19. Cost Structure of Japanese Paper Mills that require woodchips as input 80 Table 20. Major players and market shares for the large sawmills 86 Table 21 : Geographical Distribution of Production by Sawmill Category in 2003 90 Table 22: Regional Sawn Timber Sale Market shares based on volumes 92 Table 23: Export volumes per annum 93 Table 24: Cost structure (R per m3) according to sawmill size based on log intake 95 Table 25: Market for Particle Board, including upgraded Particle Board (2004) 111 Table 26: Market for Medium Density Fibre Board, including upgraded MDF (2004) 111 Table 27: Manufacturers of timber board products and location of their timber board
mills 112

v
Table 28: Regional pole supply figures according to specie 122 Table 29: Annual pole treatment market volumes according to application 123 Table 30: Pole treatment plant cost structure 124
LIST OF BOXES
Box 1. The pulp manufacturing process 22 Box 2. The paper manufacturing process 44 Box 3. BEE opportunities in recycling: waste paper entrepreneur A.B. Cheche 66 Box 4. The global market for wood chips 76 Box 5. The Japanese paper market and the Japanese demand for woodchips 79 Box 6. Note on accuracy of sawmilling data 84
1
1. INTRODUCTION This document is Part II of the review of the economics of the forestry, timber, pulp and paper industry in South Africa and provides a detailed market analysis of the various components of the forestry value chain included in this analysis.
For each component of the value chain an overview will be provided of the market definition, players, products and conduct. In addition, the salient features of the market components will be highlighted and their relevance to this analysis discussed.

2
2. PLANTATION FORESTRY 2.1. BASIC DESCRIPTION
Plantation forestry provides the raw material for downstream activities such as pulpmilling, paper manufacturing, sawmilling and some furniture manufacturing1 and can thus be regarded as the root of the value chain under consideration. Indeed, in considering the other components of the value chain, an important aim will be to investigate to what extent downstream activities are dependent upon the local plantation industry.
Plantation area. Plantations covered 1.372m hectares of the South African surface in 2002/03 (FES, 2004a). During 2002/03, reported conversions amounted to 8,241 ha from one timber species to another (mostly from softwood to eucalyptus), and 4,971 ha from timber to other land uses, but new plantings increased total plantation area by 10,227 ha from the 1.351m ha under plantations in 2001/02 (FES, 2004a). An estimated 32,748 ha of plantations were lost or severely damaged due to fire and weather damage in 2002/2003 (FES, 2004a). Since 2004, a phase-out of some 73,000 ha of Safcol pine plantations deemed to be economically or environmentally unviable has started.
The current afforested area accounts for 1.1% of the country’s total surface, compared to the 0.3% comprised by natural forests, and the respective 13.7% and 68.6% land use of agricultural crops and grazing (Mayers et al, 2001; Godsmark, 2004). Though plantations have a legacy of state ownership, less than 30% of the total plantation area is currently under government control, with privatisation of this area pending2 (Godsmark, 2004). Figure 1 shows the regional distribution of plantations in South Africa. Kwazulu-Natal and Mpumalanga together contain about 80% of the total plantation area.
1 Additionally, plantations also provide the inputs required for e.g. mining timber, pole manufacturing, fibreboard manufacture, charcoal and wood chip production. 2 This is in line with government’s privatisation drive since the 1990s. See section 1 in the Technical volume for discussion.

3
Figure 1. Provincial share in total plantation area. Source: Godsmark, 2004.
As shown in Figure 2, the importance of plantation forestry to KZN and Mpumalanga is confirmed when plantation area, as a proportion of total provincial area, is considered.
Figure 2. Plantation area as a percentage of provincial land area. Source: Godsmark, 2004.
Limpopo, 4.7%
Mpumalanga, 40.3%
KZN, 39.6%
Eastern Cape, 11.0%
Western Cape, 4.4%
6.76%
5.94%
0.88%0.54% 0.47%
0.00%
1.00%
2.00%
3.00%
4.00%
5.00%
6.00%
7.00%
8.00%
Mpumalanga KZN Eastern Cape Limpopo Western Cape

4
Plantation types. Using the characteristics of the fibre produced, plantations can be classified into two main categories: hardwood and softwood. Eucalyptus (mainly Eucalyptus grandis) and wattle (Acacia mearnsii) are the main hardwood species grown in South Africa. Pine (of which Pinus patula is the most common species) accounts for all South African softwood plantations.
Depending on the eventual use of the wood, softwood and hardwood can be grown on either short or long rotations. For pulping purposes, softwood is grown on a short rotation of about 12 to 15 years. Softwood for sawlogs has a long rotation of between 27 and 30 years. Hardwood (eucalyptus) for pulping purposes usually has a short rotation of about 6 to 10 years (Edwards, 2004). Sawlog eucalyptus has a 20 to 25 year rotation (Van Zyl, 2004).
Sawmilling mainly requires softwood – only approximately 3.7% of all sawlogs are produced from eucalyptus (FSA, 2004). Both softwood and hardwood can be used for pulping purposes, but they are used in different processes and for different types of outputs3. Regionally, hardwood (eucalyptus) is the main species planted in Kwazulu-Natal (52.3% of all eucalyptus are planted in KZN), with softwood being more prominent in Mpumalanga, Limpopo, and the Western and Eastern Cape (50.2% of all pine plantations are located in Mpumalanga and Limpopo) (Godsmark, 2004).
In 2003, softwood (pine) accounted for 51.7% of plantations, with hardwood (of which 82.7% is eucalyptus and 17.3% is wattle) comprising 48.3% of all plantations4 (Godsmark, 2004; FSA, 2004). This does not represent a radical change from the status quo of 20 years ago: in 1982/83 the corresponding figures were 55.3% and 44.7%. Due to sample changes in the survey covering plantation area, it is, however, difficult to make this comparison (Edwards, 2005).
2.2. MARKET PLAYERS
As is evident from Figure 3, plantation ownership is distributed in terms of total area. Plantation owners can be grouped into three categories: small (or emerging), medium and large growers.
3 The different pulping processes and their products will be discussed in Section 3. 4 As discussed in the history section (see Section 1 in the Technical volume), this composition is mostly due to historical factors.

5
Figure 3. Distribution of plantation ownership by area: 2003. Source: PAMSA, 2004a
The large grower category is highly concentrated, with the two biggest players owning 40.6% (22.3% Mondi, 18.3% Sappi) of the total plantation area in 2003 (PAMSA, 2004a). Global Forest Products owns a further 5% of plantations and other corporate growers about 3%. Two black economic empowerment consortiums (Singisi Forest Products and the Siyaqhubeka Consortium5) recently signed lease agreements for respectively 3.2% and 1.2% of the total planted area with Safcol6. The large growers thus accounted for approximately 53.1% of plantations in 2003, with a further 26.2% still publicly owned, but expected to be privatised in the near future (PAMSA, 2004a).
The medium growers, namely private timber growers/farmers, owned 17.6% of all plantations in 2003, with small growers owning the remaining 3.2%. There are approximately 31,500 (Ngobane, 2005) small growers, of which about 24,000 belong to Sappi and Mondi’s outgrower schemes, as well as smaller schemes by SAWGU (SA Wattle Growers’ Union – project Phezukomkhono) and NCT
5 Both of these involve large corporates as major partners in the deal: Hans Merensky Holdings in the case of Singisi, and Mondi in the case of Siyaqhubeka. 6 The areas used for these proportions are as quoted in Pamsa (2004a) and differ significantly from the areas quoted by Dlomo & Pritcher (2003).
State, 26.15%
Large growers, 53.11%
Medium growers, 17.55%
Small growers, 3.19%

6
Plantation forestry Co-operative Ltd. In Sappi’s Project Grow, initiated in 1983 and Mondi’s Khulanathi, initiated in the 1988, the companies provide independent smallgrowers with seedlings, advice, and organisational support to plant small woodlots (the national average size is about 2.3ha per woodlot) on their individual or community property (FSA, 2000; Cairns, 2000). Over the rotation period, the company provides them with interest free loans (or simple interest of 10% in Khulanathi’s case) to cover operational costs and, upon maturity, these growers are contractually bound to sell their timber to the “sponsoring” company for one or two rotations (depending on the specific contract)7 (Cairns, 2000). Of these small growers (of which some 80% are female), about 65% are located in the Zululand region (FSA, 2000).
The large and medium growers are well-organised in industry bodies such as PAMSA and FSA. The interests of about 1500 medium growers are represented by NCT. NCT represents a further 500 small grower members (Kime, 2004). FSA represents about 2500 growers, including all registered small growers. Nonetheless, it is still felt that small growers lack organisation and the institutional structure to give them a “coherent voice” (Mack, 2004; Ngubane, 2005).
2.3. PRODUCTION AND PRODUCTS
Due to its shorter rotation and higher yield, annual hardwood production outstrips that of softwood. Of the approximately 19.2m m3 of wood produced in SA in 2002/03, hardwood comprised 10.8m m3 (about 56%) while softwood accounted for only 8.4m m3 (FSA, 2004; Godsmark, 2004).
In terms of pulpwood and sawlogs produced, the 2002/03 demarcation was as follows: 12.35m m3 of pulpwood and 5.24m m3 of sawlogs, with the rest of the 19.2m m3 allocated to mining timber, poles, charcoal and other uses. Thus 64% of all timber produced in 2002/03 was pulpwood, 27% was sawlogs, and the remaining 9% of production was split between other uses, such as mining timber (4.1%) and poles (4.3%). Generally, though not exclusively, the sawlogs are long 7 Sappi (2004) estimates that net income per ha, should all inputs be outsourced to contractors, will vary between R3,420 and R11,278 over the rotation period in the different KZN regions and the Eastern Cape. Forest management inputs amount to an average of 16.3 man-days per hectare per annum. Should growers do all the work themselves, this increases to a range of R15,600 to R20,112 per ha over the rotation period. Even though the income generated generally does not lift the affected households out of poverty, it is nevertheless an important contributor to their livelihoods. Cairns (2000) estimates the schemes to contribute between 12% and 45% of the income needed to lift households above a poverty line of R750 per month. Incomes may be affected if growers fell too early, in order to meet cash flow needs.

7
rotation softwood, while pulpwood is sourced from short rotation softwood or hardwood plantations8. The desired output (or management objective) determines the type of plantation and the silviculture and maintenance practices implemented.
The production of pulpwood relative to sawlogs has increased markedly over the past two decades. This is indicative of the fact that new afforestation over the past two decades has been mainly for pulp production purposes (FSA, 2004; Godsmark, 2004).
Figure 4. Production of sawn wood vs. pulpwood over the past two decades Source: FSA, 20049
The growth in pulpwood area can be ascribed to the strong demand for paper and paper products on local and international markets. Furthermore, the shorter required rotation provides growers with the incentive of a more regular cash flow.
8 In long rotation (sawlog) plantations, all the thinnings, apart from the first round of thinnings, also go to pulpmills, should the plantation be close enough to a pulpmill to make it economically viable. 9 Pulpwood production data is provided in tons. To convert to m3, a weighted average pulpwood conversion factor is calculated for each year, using the relative contributions of each species to total pulpwood production. Data source: FSA (2004). Conversion factors are however rather controversial, and it may skew results to some extent if such an average conversion factor is applied.
0
2
4
6
8
10
12
14
1982
/83
1983
/84
1984
/85
1985
/86
1986
/87
1987
/88
1988
/89
1989
/90
1990
/91
1991
/92
1992
/93
1993
/94
1994
/95
1995
/96
1996
/97
1997
/98
1998
/99
1999
/00
2000
/01
2001
/02
2002
/03
Mill
ion
m3
Sawlogs
Pulpwood

8
2.4. MARKET DEFINITION, STRUCTURE AND CONDUCT
Vertical integration and buyer concentration. The plantation market is defined by a large degree of vertical integration with downstream activities for both the solid wood and pulpwood components. The major plantation owners (to be discussed in Section 3) are also the major processors, and thus buyers, of wood (e.g. Mondi and Sappi for pulp and paper, Masonite for fibreboard, or Global Forest Products and Hans Merensky for sawmilling). This implies that large quantities of wood produced are effectively removed from the open market and supplied directly to a company’s own processing plants. If integrated companies decide to take more profit on the processing than on the growing side, this may have implications for assessing the pricing mechanism, as a proportion of timber may then be sold at below market prices.
Market geographics. Due to the low value addition in the primary extraction phase and the cost of transport, wood processing plants need to be close to plantations. One current estimate suggests that this means a maximum of 75km for sawlogs and 300km for pulpwood (Howard, 2004). Such an estimate is, however, based on the availability and quality of road infrastructure and applies to larger plantations with some scale benefits. For small growers in areas such as the Eastern Cape, with limited infrastructure, the potential supply area could be limited to as little as 90km from the pulp mill (Mack, 2004). This implies that the market for raw wood is essentially a regional rather than a national market (and is concentrated in key provinces such as KZN and Mpumalanga). In later stages of processing, the market becomes national and indeed global in nature.
Trade. Plantation forestry in South Africa is characterised by a trade surplus. In 2003, a solid wood trade balance to the value of R1.941m was achieved. The value of imports amounted to R1.371m and R3.312m worth of solid wood was exported. This implies that the timber-producing industry (excluding any downstream activities) was a net generator of foreign exchange to the value of almost R2bn10.
Barriers to entry and expansion. A number of potential barriers exist to entry into (or expansion of) the plantation forestry market. Beyond the natural limits to
10 In gross terms, the value of exports, namely R3.3bn, can be seen as foreign exchange generated (that is, money not previously available in the South African economy). R 1.4bn was however “leaked” from the SA economy to pay for imports, bringing the net foreign exchange generation to about R1.9bn.
9
afforestation and cash flow issues, the major barriers seem to be of a regulatory nature.
• Natural limits on land suitable to plantation forestry. Due to soil quality, water availability and general climatic conditions, there are limited areas suitable for plantation forestry. In some cases it also depends on the state of the market, as land with lower yield opportunities becomes viable under conditions of sustained higher market prices11.
• Water and environmental regulation. Plantation forestry is classified as a Stream Flow Reduction Activity (SFRA) under the National Water Act (the only activity to have been classified as such), as well as an alien invasive species under the Conservation of Agricultural Resources Act. The implication of this is, (i) it is the only water use activity that is subjected to a cooperative governance-based application system (i.e. through the LAACs), which includes, (ii) a more comprehensive environmental assessment relative to other land use changes (due to the ‘alien invasive species’ classification). The result of this is that an application to develop a plantation currently takes about two years to process, which presents a substantial barrier to entry (the issues of water licensing are discussed in more detail in Part I of this study, Section 13)12.
• Communal nature of potential plantation forestry land. Developing plantation forests on communal land and in partnership with communities requires negotiations, which are often management intensive and time consuming. As most of the remaining land suitable to plantation forestry is in communal areas, this may be a barrier that the industry has to cross in order to secure further areas for the development of the fibre base. This issue is discussed in more detail in the main document (Part I), Section 14.
• Uncertainty over land rights. Under conditions of uncertainty over land rights (such as may be the case in certain areas due to the land reform process), private investors would be unwilling to enter into long-term investments such as plantation forestry (and particularly long rotation plantations). The relevance and impact of this issue is assessed in more detail in Part I, Section 14.
11 This could possibly apply to the currently marginal plantation areas in the Western Cape. The decision has however been taken to phase these plantations out. 12 This delay becomes more problematic in the development of small growers on communal land, as this in itself requires certain time consuming processes. In the experience of developers, communities that they approached for plantation development often lose interest due to the long delay in getting authorisation to launch the project. In such cases the communities’ perception is often that the developers are not fulfilling their promises, whereas the developers argue that their hands are tied.

10
• Cash flow. The rotation period associated with plantation forestry implies that potential players need to make large initial investments, without the immediate promise of income and with potential risks (e.g. fire). Given the legacy of artificially low state-determined log prices, this has challenged private sector entry into especially the softwood market and, to some extent, explains the apparent preference for hardwood production in South Africa13. With prices currently being market-determined and on the rise, and given projections that demand for roundwood is likely to outstrip supply into the future (LHA, 2004), the cash flow barrier to entry may be reduced.
• Lack of finance for independent plantation owners. This is particularly an issue for small growers, as it prevents them from dealing with cash flow problems. Smallgrowers on communal land face particular challenges, as it is generally more difficult to secure finance for the development of land where individual ownership cannot be used as collateral. The implication is that small growers have little option but to join larger corporate schemes through which they become contractually bound to a single buyer (for the first one or two rotations).
Pricing mechanism. The markets for softwood and hardwood operate as separate markets with different pricing mechanisms and dynamics. Softwood plantations in South Africa were traditionally largely state-owned. In order to promote the use of domestic rather than imported timber, government entered into so-called “evergreen”/long term contracts with saw millers, in which the millers were ensured favourable prices. Such contracts served to keep the sawlog price artificially low. With the expansion of the private sector and formation of Safcol in 1992, to manage and privatise the state’s plantations according to sound business principles, prices have, however, risen significantly in line with international benchmark prices (Edwards, 2004). Recent restructuring in the timber industry also saw an end to the subsidies received (i.e. mainly by Safcol). It is estimated that the log price has since adjusted to reach an internationally competitive level (Mayers et al, 2001) and that short term supply and demand imbalances do not interact to cause price variations (Pamsa, 2004a).
For pulpwood, the duopsonistic market structure kept log prices down historically. Since the middle of the 1970s, however, the export of wood chips (mainly organised by NCT in reaction to the pricing power of the domestic buyers of wood)
13 Plantations for pulping purposes have shorter rotations, which render them more desirable.

11
ensures that domestic market prices are on par with prices that can be attained on the export market, as independent suppliers to large buyers have the option to switch to export, should they be unhappy with domestic prices.
Although the ability to export fibre may counteract the concentrated nature of the plantation forestry market, it does not mean that concentration and vertical integration will not lead to uncompetitive pricing practices. In strong Rand situations, such as we currently experience, the profitability of exports may deteriorate and the only alternative to exporting will be selling to one of the two South African buyers.
2.5. SALIENT FEATURES
A number of salient features of the plantation forestry industry have emerged that will inform and determine the development of this sector going forward.
2.5.1. MORE THAN 80% OF SA PLANTATIONS HAVE ATTAINED FSC CERTIFICATION
More than 80% of South Africa’s plantations have attained FSC certification (PAMSA, 2004a). This means that plantation management is governed by certain principles regarding the environmental impact, land-use and labour practices of plantation forestry, as laid down by the Forestry Stewardship Council. South Africa can be regarded as a world leader in this regard, as it is the country from which the highest proportion of wood bears the FSC stamp of approval (PAMSA, 2004a).
Globally, the trend towards certification emerged since the early 1990s (FSC was formed in 1993) in reaction to environmental concerns by consumers of wood. It is a market-driven way of ensuring (and reassuring consumers) that plantations are sustainably managed. The high level of certification places South Africa in a good position to tap into the increased world demand for fibre from certified plantations.

12
2.5.2. THE GRADUAL CHANGE FROM SOFTWOOD TO HARDWOOD IS EXPECTED TO CONTINUE AND POSSIBLY INCREASE OVER THE NEXT DECADE
There is an indication of a tendency to convert pulpwood pine plantations into eucalypts. It is likely that this trend will continue due to the strong demand for pulp fibre and the shorter investment period for pulpwood. For example, the planned expansion of Sappi’s Ngodwana mill will entail the conversion of some 25,000 ha of pine pulpwood into eucalyptus (Sappi, 2004).
The phase out of some Safcol plantations will also impact the area under sawnwood pine plantations. For example, a total of 57,000 ha of sawlog pine plantations in the Western and Southern Cape is to be phased out over a 15 year period that started in 2004, and some 16,000 ha (9,000 ha in the Sand River catchment and 7,000 ha in the St. Lucia area) is to be phased out between 2004 and the end of 2006 (Crickmay, 2004a:23). This conversion trend may be offset by shortages of (and subsequent price increases for) solid wood that is expected to emerge in the near future.
2.5.3. THERE ARE CONSTRAINED OPPORTUNITIES FOR NEW AFFORESTATION
It is commonly accepted that, although plantation forestry has grown rapidly in South Africa in the past, land availability for further afforestation is limited. Though the industry might argue that this is due to the SFRA water use licensing requirements placed on them, the fact remains that, even without such licensing requirements, economically viable plantation expansions would ultimately be constrained by South Africa’s water-scarcity. Only 16% of South Africa’s surface is climatically suitable for plantation forestry (Van der Zel, 1989:14)14. Of this possible area, large parts are, topographically speaking, not viable for plantation purposes, due to the steep gradient and the associated high costs of planting and harvesting.
The only provinces identified for further new afforestation are Kwazulu-Natal and the Eastern Cape. Current estimates suggest that approximately 60,000 ha is available for afforestation in the Eastern Cape and the conservative estimate of
14 Where the conditions in terms of rainfall, soil quality and temperature are however right, South Africa has a very high yield in plantations, much higher than that of natural forests in Europe and North America, thus making South African plantations two to three times more productive than natural forests of the same species in Europe and North America (Van der Zel, 1989:14).

13
total land available for new afforestation in KZN is 40,000 ha15 (Perkins, 2005). It can thus conservatively be estimated that 100,000 ha is still available countrywide for new afforestation, but utilising this land will require some effort as, (i) most of it falls within communal areas and, (ii) new afforestation is subject to time consuming licensing procedures. The fact that land has been “identified” for new afforestation does not mean that the infrastructure or beneficiation exists to support the afforestation in these areas, but simply that, in terms of water availability, soil quality and environmental concerns, these areas would be suitable for plantation forestry.
2.5.4. SOME OUTPUT GROWTH IS POSSIBLE THROUGH INCREASED PRODUCTIVITY
South African plantation management practices and research are on par with the best in the world and as a result yields continue to increase through better site species matching, advances in cloning techniques and more general application of cloning, better silvicultural practices and planning, and increased efficiency in processing (Hinze, 2004). It is thus possible that, even given limited new afforestation, there is still some scope to expand wood production in South Africa.
Given South Africa’s climate and water scarcity, yields can however not be increased indefinitely. For eucalyptus species, major clonal and other improvements have taken place since the early 1990s. Thus the “easiest” improvements have now been achieved, and intensive research and application thereof in management would be needed to increase yields further. The general industry impression is that it will only be possible to increase MAI by a further 5% to 10% (Howard, 2005). The same holds for pine species. For long rotation pine, the effects of past improvements are now being felt in production as trees reach maturity. Although specific case studies might suggest much higher possible yields, it is unlikely, once again, that the average national yield will increase by more than 5% to 10%. Wattle is largely unresponsive to silvicultural practices in its yield. Site species matching is however crucial, as wattle is highly sensitive to climatic and soil conditions (Howard, 2005).
15 DWAF’s KZN Afforestation Map (in an effort to streamline the SFRA licensing process by identifying land with the potential for afforestation), identifies 61,000 ha to be available in open catchments and 77,000 ha in restricted catchments. Of this, the map conservatively estimates that 25,000 ha will be planted in the open catchments, and a further 15,000ha in restricted catchments (after allowing for alternative land uses, settlements, etc).

14
Under an optimistic scenario where yields increase by 10%, this would result in an additional 2.2m m3 of roundwood per year16.
2.5.5. SMALLGROWERS REPRESENT THE BULK OF NEW AFFORESTATION OPPORTUNITIES
The bulk of remaining land suitable for afforestation falls within communal areas in the Eastern Cape and Kwazulu-Natal. Developing plantations on community land requires dedicated management capacity in order to promote/market plantation forestry to the communities, facilitate interaction with the community, provide the necessary forestry management skills and to help the community manage the plantations (at least until they are in a position to do so themselves) (See Part I – main document, Sections 10 and Section 11).
2.5.6. THE BULK OF LOW-SKILLED POSITIONS HAVE BEEN CONTRACTED OUT, CREATING CONCERNS IN THE INDUSTRY
The bulk of low-skilled jobs have been moved to contractors. Plantation forestry companies have, over the past two decades, contracted out the bulk of their low-skilled labour requirements. This was done mainly to reduce costs, but also to reduce their exposure to a large unionised labour force. By contracting labour and operational issues out to independent parties, companies feel that they can focus on their core business activities. It is estimated that independent plantation forestry contractors have a workforce of up to 35,000 and that they have a combined annual turnover of R600m (HSRC, 2004). Three categories of contractors can be identified:
• Commercial (more than 50 employees)
• Emerging (between 10 and 50 permanent employees)
• Small contractors (less than 10 employees)
Commercial and emerging contractors generally service the formal plantations, while small contractors provide silviculture and harvesting services to small growers. Due to the informal nature of small contractors, only the first two categories are currently represented by the South African Forestry Contractors Association (SAFCA), which has 253 members. SAFCA estimates the number of
16 See Appendix G in the technical appendices.

15
workers to have dropped to 30,000, largely due to mechanisation17. In addition, SAFCA (2004) estimates that contract labourers earn an average of R40 per day. SAFCA aims to share information, train members in financial and business management and assist with budgeting/tendering for contracts. Fire protection and access to fire-specific liability cover is also included in monthly membership fees of R510. The protection afforded by such insurance contracts has resulted in a preference for SAFCA members in the awarding of contracts.
Contracting labour in this way has become a point of concern in the industry. Although it is often argued that efficiency gains can be made in this way, concerns have been raised over the conditions of employment for contract labour and the power balance between large forestry companies and small contractors in negotiating terms of contracts. A number of issues have been raised:
• Labour conditions have deteriorated under contracting. FSC certification stipulates that labour conditions in outsourced operations should be exactly the same as previously applied by companies. In reality, this aspect of certification is not effectively monitored and the impression is that the move to outsourcing has led to a deterioration in labour conditions, as labour legislation requirements (i.e. in terms of health and safety, working hours and wage levels) are not as effectively enforced on the larger number of small contractor firms. In addition, the often unionised wage levels paid by large companies are no longer applicable to the smaller contractor firms where unions currently do not have a presence. Forestry companies also provided housing and other benefits to employees that do not necessarily accrue to contractor employees. Although some of this is made available to contractor labour for a minimal rent, it does not provide the same security as was implicit for permanent employees. In addition, the low claims against Sector Education and Training Authority (SETA) skills development allocations may suggest that contractors do not engage in valuable training of their employees.
• The nature of contracts may impact efficiency and productivity. Contractors ascribe the poor labour conditions to the nature of the contracts with forestry companies, which are claimed to be rigid, non-negotiable, too short to allow for capital building and provide few opportunities for sustainability. With contractor margins under pressure, the only expenditure that can be reduced is the labour component. It is also claimed that contracting has led to the “de-
17 One harvester machine can replace more than 200 labourers, as can a mechanical debarker. Companies regard this trend as necessary in order to increase productivity, but have up to now been reluctant to do so, due to the possible social impacts thereof. Greater mechanisation seems inevitable in the future, though.

16
professionalisation” of forestry and that many former foresters currently engaged as contractors intend to leave the industry due to difficult conditions and relations with forestry companies. In addition, the low margins on contracts have resulted in a gradual deterioration of capital, with contractors unable to maintain or replace older equipment, and a general informalisation of the contracting industry (particularly labour conditions). This, in turn, directly impacts on the levels of efficiency and productivity. Both of these trends should be of concern to forestry companies as it will be very difficult and costly to reverse at a later stage. On the informal side, contractors serving the small grower section of the industry also operate in highly competitive markets without access to finance and training (Morajele, 2004), which leaves little room for development or appropriate labour conditions.
• Tasks set may be questionable. Contractors are generally paid by task and in turn pay their employees per task (a minimum percentage of their fee is stipulated in the contract to be payable to labour for every task). Concerns have, however, been raised that the standards applied to set the time-frame for a specific task and, thus what is expected of each worker, may not be realistic anymore. These standards date back to company employment days where companies facilitated productivity by providing labour feeding schemes, health and safety arrangements and, as a result of more attention being given to road maintenance, employees spent less time waiting for, for example, transport vehicles to arrive. Contractors claim that they cannot afford such measures, given the nature of their contracts (Hlengwa, 2005).
• The introduction of a minimum wage may not serve to improve baseline conditions for employees. As the minimum wage is likely to be set on a task-basis, independent of a time-frame, it implies that workers will not benefit from the minimum wage if the time allocated for a specific task remains unrealistic (Hlengwa, 2005). According to SAFCA (Hlengwa, 2005) it is unlikely that the system will revert back to one of daily wages. As contractors do not have the resources to constantly monitor workers’ productivity, they regard the per-task payments as the only viable system. It also grants contractors with more flexibility to adapt their workforce to the labour-intensity of the task at hand. Once again, the interests of the labourers are, however, not the first priority. It, therefore, seems as if a revision in workers’ task-standards would need to go hand in hand with a revision of the terms on which contracts are granted.
• Access to finance. Access to finance (for capital) is regarded as a hurdle by contractors, especially the smaller, more informal contractors. These

17
contractors operate under informal sector conditions, with poor access to finance and training. All the contractors interviewed used their own funds to start their enterprises and had no assistance from the forestry companies, government or other agencies in establishing and maintaining their businesses. Contracts with small growers are informal and too small to serve as the basis for acquiring loans. A larger contractor also claimed that due to the nature of their contracts (maximum three years duration); banks have become reluctant to grant them financing.
Industry’s view. Industry role players acknowledge that the move to outsourcing was not managed optimally and has led to a “hands-off” situation by plantation forestry companies and what is perceived as a “rip-off” by contractors. It is also acknowledged that the situation is unsustainable and needs to be rectified, with some compromises being necessary on the side of forestry companies. It is also clear that ignoring the current problems may result in substantial problems and costs to the industry in the longer term. Apart from managing contracts better and ensuring (and monitoring for) proper labour conditions and safety, industry needs to rethink the term and size of the contracts.
2.5.7. SAFCOL PLANTATIONS PROVIDE OPPORTUNITIES FOR DEVELOPMENT
The South African Forestry Company Limited (SAFCOL) was formed in 1992 as a vehicle to manage state-owned forests and facilitate the privatisation thereof. For privatisation purposes, state-owned (largely pine) forests were divided into three categories: A, B and C (see Part I, Section 14). In the past few years, the privatisation of Category A plantations has been initiated and two successful transactions (with Singisi Forest Products in the Eastern Cape and with Siyaquebeka in KZN) have been concluded. Two more are likely to be finalised by April 2005 and the final transaction, that of Komatiland, has been stalled due to competition concerns.
Category B and C plantations have recently (October 2004) been reclassified and combined into logical business units. The plan is to organise, in conjunction with community input (i.e. resolutions), leasing agreements on behalf of communities and/or land claimants (see Part I, Section 14). In areas such as the Eastern Cape, these plantations provide an existing fibre base on which further developments can be based. This opportunity will be discussed in more detail in Part I, Section 10.

18
2.5.8. WOODCHIP EXPORTS HAVE CAUSED DOMESTIC HARDWOOD PRICE INCREASES
Section 2.4 mentioned that woodchip exports (which essentially started with the registration of CTC in 1970) served as a disciplining action on the duopsonistic domestic buyers of pulpwood (Sappi and Mondi). As a result, the market prices for hardwood have risen significantly since then to the present level, which is on par with North American prices.
Pulping companies are however concerned that the high price paid by the Japanese for woodchips is an anomaly and that it makes South African pulp uncompetitive due to the high input costs. They feel that their profit margin does not allow them to match the prices paid by the Japanese for the wood they need to buy on the open market. The only way for them to overcome this is through vertical integration. This however means that the wood currently dedicated to chip exports is unlikely to be switched to domestic pulping, implying that it will not be possible for Mondi or Sappi to build another big pulp mill in South Africa (Rossi, 2005). The industry’s view of Japan as an anomaly is based on allegations of subsidies provided to the Japanese pulp industry. Within the scope of this project no evidence was, however, found to confirm this allegation.
From a non-integrated timber grower’s perspective, the woodchip phenomenon has made pulpwood tree-farming a profitable exercise. Given the relatively long-term nature of contracts with Japanese buyers, as well as views expressed by Japanese buyers, the conclusion is that this “anomaly” is likely to continue to influence pricing in the traded pulpwood market for the foreseeable future (Ishikawa, 2004). In addition, preliminary research has shown that China may potentially emerge as an additional buyer of South African fibre18.
2.5.9. FIRE DAMAGE AND ARSON RESULTS IN LARGE SCALE DAMAGE TO PLANTATIONS
During the 2002/2003 year, 28,983 ha of plantations were burnt down or damaged by fire, of which 12,753 ha was hardwood and 16,230 ha softwood. Arson by aggrieved employees or communities or, in some cases, bush millers wanting to secure trees to be felled (if the age class of the trees does not allow felling at the moment) is considered a significant problem. The National Veld and Forest Fire Act 18 See Section 5.4 in the technical appendices (Part III of this report).

19
(Act 101 of 1998) tries to address this through the formation of Fire Protection Associations (FPAs) and imposing certain preventative measures to be taken (such as fire breaks). Assisting small growers is a specific aim, but it is not yet clear how this will be achieved. To date, 22 such FPAs have been formed (Malatji, 2004).
20
3. PULP, PAPER AND RECYCLING The pulp and paper industry in South Africa originated in the first half of the twentieth century in reaction to large-scale afforestation projects by government and encouraged by a regulatory environment in which domestic manufacturing was promoted. The first pulp and paper company to be formed was the “South African Pulp and Paper Industries” (Sappi) in 1936, followed by the incorporation of Mondi in 1967.
The pulp and paper industries (including recycling) are highly integrated and their contribution to the economy will, therefore, be discussed as a whole in this section. Due to the complexity of the respective markets for pulp and paper, the discussion will commence with a separate review of each market.
3.1. OVERVIEW OF THE PULP MARKET
3.1.1. MARKET PLAYERS
The industry is dominated by two players (Mondi and Sappi) who are the only producers of virgin fibre pulp in South Africa and who are both highly integrated with their own paper and plantation operations19. Sappi has a 62% share of the pulp production capacity (5 mills), with Mondi comprising the remaining 38% (4 mills) (Pamsa, 2004a). Both have developed into global role players20 and are internationally listed (Mondi as part of its owner-company – Anglo American). According to PWC’s Global Forest and Paper Industry Survey (2004) Mondi (Anglo American) ranked the 15th largest forestry, pulp and paper producer in 2003, with Sappi achieving the 20th place (PWC, 2004). Within the various submarkets the positions are as follows:
• Mondi dominates the production of mechanical pulp – its Merebank mill has a production capacity of 286,000 tonnes per annum of mechanical pulp, whereas
19 Planning for another pulp mill in Richards Bay is in the pipeline: NCT has signed an agreement with Swedish firm SodraCell to form a jointly-owned project company, Pulp United, to perform a feasibility study and an environmental impact assessment for a 300,000 tonne capacity eucalyptus-based BCTM (bleached, chemical, thermo, mechanical) pulp mill that will be largely focused on the export market. A go-ahead is expected by December 2005, with the envisioned completion of the mill scheduled for the end of 2007 (SRK, 2004; NCT, 2004b). NCT states that the new mill will have a guaranteed fibre supply due to the almost 300,000 ha of plantations owned by NCT members. 20 South Africa accounted for only 24% of Sappi’s global sales in 2003, whereas 33% of Mondi’s total sales were made in South Africa in 2002 (Pamsa, 2004a).

21
Sappi’s Ngodwana mill runs a mechanical process with an output of 100,000 tonnes per annum.
• Sappi is the only producer of dissolving pulp. All Saiccor’s production is however exported. Thus Sappi operates in an international market in this regard, characterised by a high level of competition.
• In the chemically produced segment of the market, Sappi is currently the biggest producer, with a total capacity of 910,000 tonnes per annum. Mondi has a capacity of 705,000 tonnes per annum, expected to rise to 850,000 tonnes per annum once the expansion of its Richards Bay mill is completed. Should NCT’s Pulp United project go ahead, an additional player will enter the market by the end of 2007, with a capacity of 300,000 tonnes per annum. It is expected that most of this will be exported.
With the exception of Sappi Saiccor, the pulping operations described above are all integrated with paper production operations. The integrated paper operations focus on packaging, high value printing and writing paper and newsprint products. The printing and writing category of paper is mostly reliant on virgin fibre as an input. A small amount of virgin pulp is also sold to third-party paper mills, which do not have their own raw fibre pulping operations. These mills mostly use recycled fibre for production but combine this with some virgin fibre pulp to improve the quality and characteristics of some of their products21. The relevance of the distinction between integrated and non-integrated operations for market operation will be discussed in more detail in sections 3.1.4 and 3.2.4.
3.1.2. PRODUCTION AND PRODUCTS
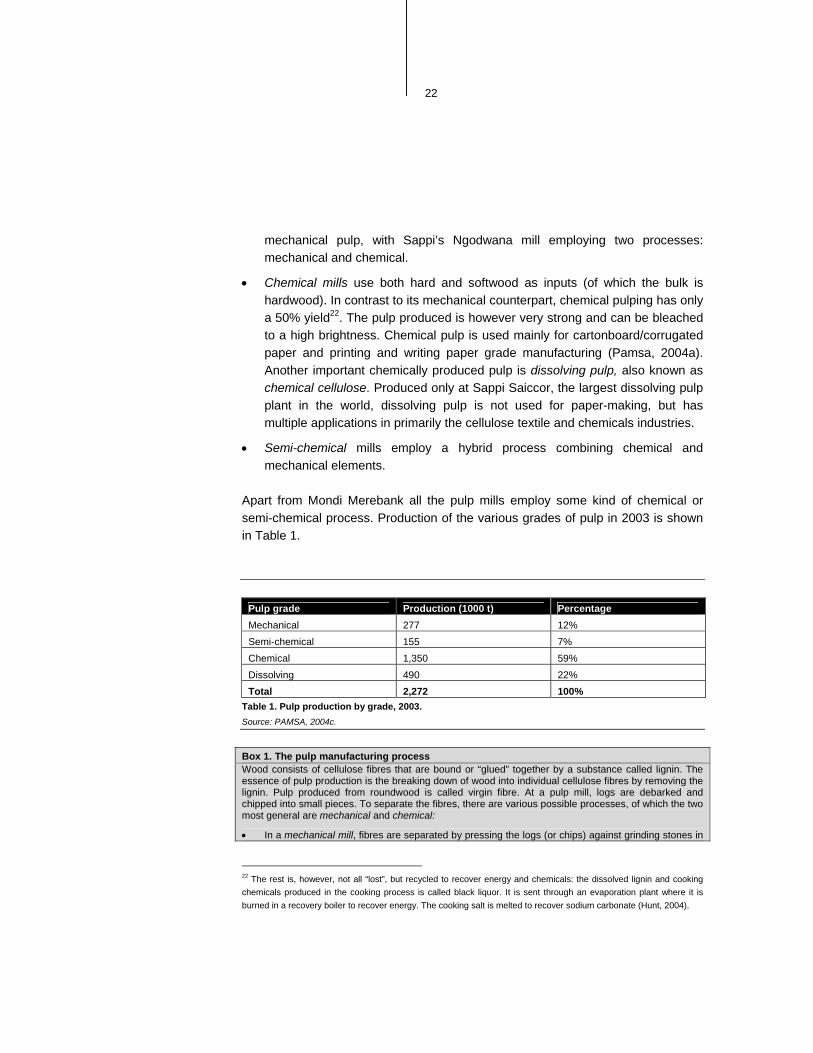
South Africa has nine pulp mills which, in 2003, produced 2.3m tonnes of pulp, making South Africa the 18th largest producer of pulp internationally (Pamsa, 2004b, PWC, 2004). In general there are three types of production processes: mechanical, chemical and semi-chemical.
• Mechanical mills use only softwood and employ mechanical force to isolate the fibres. These mills have a 90% yield (i.e. only 10% of the dry wood inputs are not converted into pulp) (Pamsa, 2004a), but the produced pulp is weaker than chemical pulp and yellows with age. It is used predominantly for newsprint and magazine grades. Mondi’s Merebank mill is the most prominent producer of
21 Paper producers in the hygiene and personal care market segment (i.e. Nampak and Kimberly-Clark) also import small quantities of specialty types of fluff pulp not produced in South Africa.
22
mechanical pulp, with Sappi’s Ngodwana mill employing two processes: mechanical and chemical.
• Chemical mills use both hard and softwood as inputs (of which the bulk is hardwood). In contrast to its mechanical counterpart, chemical pulping has only a 50% yield22. The pulp produced is however very strong and can be bleached to a high brightness. Chemical pulp is used mainly for cartonboard/corrugated paper and printing and writing paper grade manufacturing (Pamsa, 2004a). Another important chemically produced pulp is dissolving pulp, also known as chemical cellulose. Produced only at Sappi Saiccor, the largest dissolving pulp plant in the world, dissolving pulp is not used for paper-making, but has multiple applications in primarily the cellulose textile and chemicals industries.
• Semi-chemical mills employ a hybrid process combining chemical and mechanical elements.
Apart from Mondi Merebank all the pulp mills employ some kind of chemical or semi-chemical process. Production of the various grades of pulp in 2003 is shown in Table 1.
Pulp grade Production (1000 t) Percentage Mechanical 277 12% Semi-chemical 155 7% Chemical 1,350 59% Dissolving 490 22% Total 2,272 100%
Table 1. Pulp production by grade, 2003. Source: PAMSA, 2004c.
Box 1. The pulp manufacturing process Wood consists of cellulose fibres that are bound or “glued” together by a substance called lignin. The essence of pulp production is the breaking down of wood into individual cellulose fibres by removing the lignin. Pulp produced from roundwood is called virgin fibre. At a pulp mill, logs are debarked and chipped into small pieces. To separate the fibres, there are various possible processes, of which the two most general are mechanical and chemical:
• In a mechanical mill, fibres are separated by pressing the logs (or chips) against grinding stones in
22 The rest is, however, not all “lost”, but recycled to recover energy and chemicals: the dissolved lignin and cooking chemicals produced in the cooking process is called black liquor. It is sent through an evaporation plant where it is burned in a recovery boiler to recover energy. The cooking salt is melted to recover sodium carbonate (Hunt, 2004).

23
the presence of water (or steam), to get thermomechanical pulp.
• In a chemical mill (of which the most common process is the kraft process, deriving its name from the German word for strong) chips are pressure-cooked with water and chemicals in a digester. The combination of heat and chemicals then dissolve the lignin. The kraft process is favoured inter alia for the fact that all pulping chemicals (namely sodium hydroxide and sodium sulphide) can be recycled and re-used. The two pulp mills that use bagasse as a resource also apply a chemical process.
The resultant pulp is washed, screened and bleached according to the requirements of the paper to be made from it. If necessary, additives such as colour dyes or coatings are mixed into the pulp, after which it is pumped onto a moving wire screen for the paper manufacturing process to begin. At this stage, the water content of the pulp is still about 97%. If the pulp is not produced in an integrated pulp and paper mill, but sold to separate paper mills or exported, it is dried and pressed into bales.
Three pulp mills also recycle waste paper, for which a different, less energy-intensive process is required. Though the breaking down of recovered paper into a usable pulp is strictly speaking a “pulping” exercise, it is however not a chemical or mechanical pulp process in the conventional sense of the word and is mainly practiced in tissue and other non-integrated mills that do not classify as pulp mills. Consequently, it will be discussed as a paper manufacturing process in Box 2.
*Source: Mondi and Sappi websites, www.paperonline.com, as well as personal communications from other role players. More detailed information on the various processes involved can be obtained from: www.sappi.co.za and www.mondi.co.za
Irrespective of the production process followed, the mills require both fibre and non-fibre inputs. A detailed table summarising information regarding the processes, inputs, outputs, capacity and employment of all the mills is contained in Appendix H of the technical notes and appendices (Part III of this report).
3.1.3. FIBRE INPUTS
The type of fibre input used to produce pulp depends on the characteristics and quality of pulp required. Though bagasse and recycled fibre is used to complement virgin fibre in some pulp mills, mills for the most part use soft and hardwood (both on short rotation) as inputs23.
Roundwood. Virgin fibre from plantation forestry remains the single most important input into the pulp industry. In 2003, a total of 12.0m tonnes of pulpwood were bought by primary processors (that is, pulp mills, mining timber mills, chipping plants, etc), of which 29.2% was pine (softwood) and 70.8% hardwood (mostly eucalyptus) (FES, 2004a). Of the total amount of pulpwood consumed by primary
23 Refer to Section 5.9 of the technical appendices (Part III of this report) to see which mills use only softwood or hardwood or a combination of the two.
24
processes, 7.5m tonnes (or 9.4m m3) of roundwood was consumed by pulp mills24, of which approximately 44.4% was pine (softwood) and 54.6% was hardwood (mostly eucalyptus) (Pamsa, 2004b). Waste products (off-cuts) from sawmilling are often also pulped if there is a pulp mill within an acceptable distance from the saw mill and are included in the softwood figure25.
The preference of pulp mills for soft or hardwood is determined by the type of product to be produced. Softwood fibres are longer and stronger and thus used for cartonboard and other applications where strength is required, as well as for newsprint and magazine grades of paper. It however gives paper a mottled appearance. For pulp to produce paper grades that require a good surface finish, hardwood is thus the preferred fibre (Hunt, 2004.). Technological advances in the industry and globally are, however, beginning to make the difference less pronounced.
Bagasse. Bagasse represents an alternative fibre input into the pulp industry. In combination with virgin fibre, two mills (Mondi Felixton and Sappi Stanger) use bagasse – a residue from the crushing of cane sugar that is otherwise used as an energy source in the sugar industry. In 2003, about 230,000 tonnes of bagasse were consumed (Pamsa, 2004b). The use of bagasse as an input is constrained by the fact that the pulp mill needs to be close to a sugar mill and that such a sugar mill needs to adjust its production process and use an alternative energy generating process that is more coal-intensive (Pamsa, 2004a). Furthermore, sugarcane is a seasonal crop and a special process (the Ritter process) had to be developed to allow the storage of bagasse in order to ensure uninterrupted pulp production throughout the year (Pamsa, 2004c).
Recovered paper. Three pulp mills also use waste fibre to supplement virgin fibre in the pulp that they produce. The majority of the waste paper collected annually is, however, used directly in paper production (particularly in tissue and corrugated paper mills), rather than in the pulp industry. Integrated pulp and paper mills26 use
24 The remainder was mainly exported in the form of wood chips. Depending on the moisture level of the wood (which affects weight), between 3m and 5m tonnes of pulpwood chips are exported annually. 25 In 2003, waste products from saw mills contributed approximately 500,000 tons of pulp wood. 26 Integrated pulp and paper mills are mills that produce both pulp and paper, and combine the two production processes to have one final output, namely paper. A non-integrated pulp mill (of which Saiccor is the only South African example) produces pulp as a final output, while non-integrated paper mills produce paper without producing pulp (relying on recycled fibre or purchased pulp).
25
approximately 100,000 tonnes27 of waste paper per annum, with the remaining 822,000 tonnes of waste paper collected in 2003 being consumed in the non-integrated paper industry.
3.1.3.1. NON-FIBRE INPUTS
Although many potential non-fibre inputs can be identified (such as chemicals, consumables and maintenance materials), the present section focuses on a few main inputs, namely water, energy, capital (machinery) and labour.
Water. The pulp industry is a large consumer of water (both direct use of water in production as well as using bodies of water as a pollution sink). In a water-scarce country such as South Africa, it is important that water-use be minimised. Consequently, water consumption rates in mills are closely monitored and companies strive to increase water use efficiency in line with the South African water resource strategy (Mondi, 2003).
Water use is furthermore strictly regulated and pulp mills have to obtain water licenses for both the extraction of water for use in production as well as the discharge of pollutants into rivers and other bodies of water. Increasingly strict requirements are being placed on the level of discharge allowed for pulp mills. These requirements include, forcing mills to treat water before discharge, as well as moves to charge for the externality cost of releasing pollutants into the river system. The allowable levels are set relative to the existing condition of the resource as well as community preferences for the quality of the resource (see Section 13 of Part I of this report for details on water regulation).
Separate water use and charges figures are not available for the pulp industry but it is estimated that integrated pulp and paper mills consume on average about 229,260 m3 of water per day. This translates to 72 m3 of water for every ton of paper produced (calculated by CSIR Environmentek from Steffen et al, 1991). The water use of the integrated pulp and paper industry will be discussed in more detail Section 3.2.3.2, while Appendix J in the Technical notes and appendices (Part III of
27 This figure was calculated as follows from Mondi’s Sustainable Development Report (2003): (i) Felixton uses 50,000 tonnes per annum. (ii) Waste fibre comprises 30% of Piet Retief’s inputs. Piet Retief has an annual production capacity of 60,000 tonnes. A chemical pulp yield rate of 50% yield rate implies that 120,000 tonnes per annum of inputs need to be consumed in order to deliver 60,000 tonnes of output. 30% of this is 36,000 tonnes. Thus we estimate the Piet Retief mill to consume 36,000 tonnes of waste paper per annum. (iii) A very small proportion of Richards Bay’s inputs are waste paper. For the purpose of this analysis, it is assumed to be 14,000 tonnes.
26
this report) provides an overview of the regulations pertaining to the pulp and paper industry.
Energy. The pulp industry requires large amounts of energy in its operations. The relative importance of various energy sources depends on the process employed. Mechanical mills have extremely high energy demands, which are sourced from fossil fuels or off the national grid. Chemical (kraft) mills, on the other hand, generate a large stream of waste material (called black liquor) consisting of the wood residue from the pulping process. Black liquor is burned to recover the pulping chemicals and the energy content of the wood residue (Pamsa, 2004a).
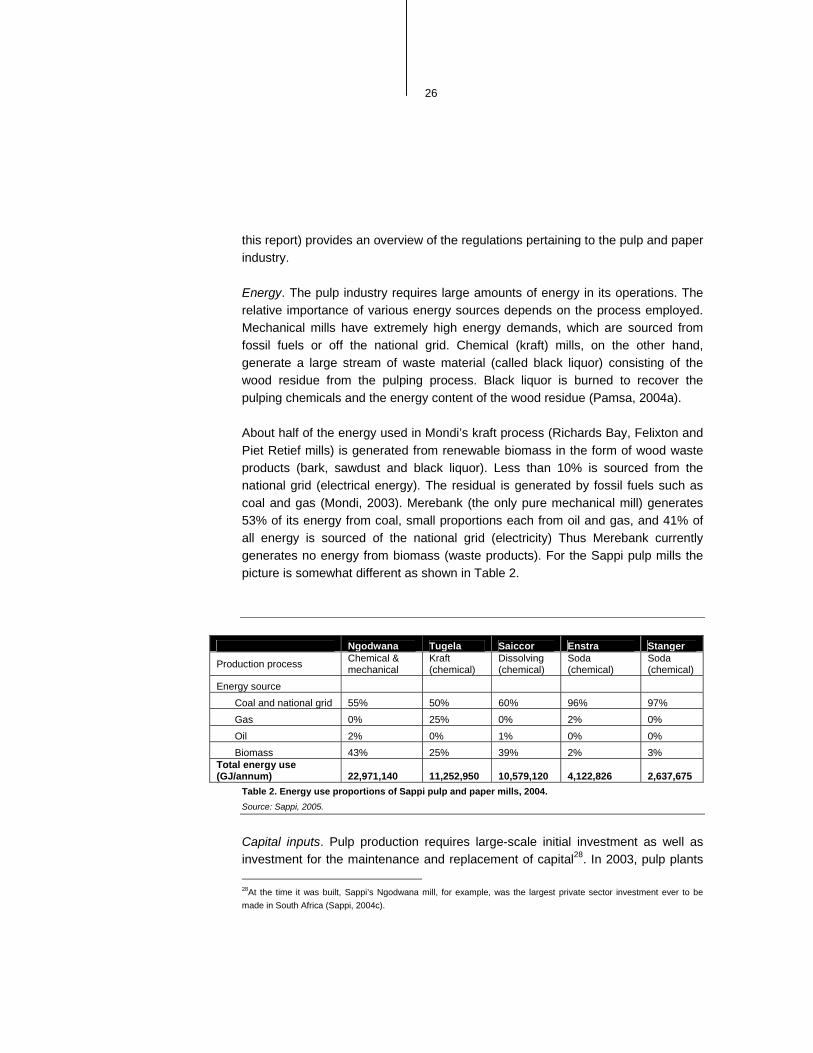
About half of the energy used in Mondi’s kraft process (Richards Bay, Felixton and Piet Retief mills) is generated from renewable biomass in the form of wood waste products (bark, sawdust and black liquor). Less than 10% is sourced from the national grid (electrical energy). The residual is generated by fossil fuels such as coal and gas (Mondi, 2003). Merebank (the only pure mechanical mill) generates 53% of its energy from coal, small proportions each from oil and gas, and 41% of all energy is sourced of the national grid (electricity) Thus Merebank currently generates no energy from biomass (waste products). For the Sappi pulp mills the picture is somewhat different as shown in Table 2.
Ngodwana Tugela Saiccor Enstra Stanger
Production process Chemical & mechanical
Kraft (chemical)
Dissolving (chemical)
Soda (chemical)
Soda (chemical)
Energy source Coal and national grid 55% 50% 60% 96% 97% Gas 0% 25% 0% 2% 0% Oil 2% 0% 1% 0% 0% Biomass 43% 25% 39% 2% 3%
Total energy use (GJ/annum) 22,971,140 11,252,950 10,579,120 4,122,826 2,637,675
Table 2. Energy use proportions of Sappi pulp and paper mills, 2004. Source: Sappi, 2005.
Capital inputs. Pulp production requires large-scale initial investment as well as investment for the maintenance and replacement of capital28. In 2003, pulp plants 28At the time it was built, Sappi’s Ngodwana mill, for example, was the largest private sector investment ever to be made in South Africa (Sappi, 2004c).

27
in South Africa had fixed assets to the value of R17.2bn, of which R15.8bn (about 92%) was allocated to machinery and equipment, versus only R1.0bn (approximately 0.06%) to land, buildings and housing, and R319m (0.02%) allocated to vehicles and other fixed assets (FES, 2004).
Labour. Pulp and paper companies directly employ about 13,20029 people, but due to the integrated nature of operations it is difficult to estimate the proportion thereof dedicated to pulp production (Hunt, 2004). In 2004, the pulp and paper industry as a whole paid a salary bill (including benefits and PAYE payments) of R3bn (Pamsa, 2005). Due to the capital intensive and technical nature of the processes involved, pulp mills require skilled labour to manage and monitor the pulping processes, with a limited requirement for semi-skilled and unskilled labour.
Skills distribution Senior management 1% Middle management 12% Junior management and skilled 42% Semi-skilled 42% Unskilled 3%
Table 3. Skills distribution of the pulp and paper industry, 2004. Source: Pamsa, 2005.
Some of the lower skill operations are also contracted out, making contracting services an important input. Thus the unskilled component of Table 3 is probably underestimated. As companies count contracting as a service rather than as a labour cost and contractors can offer their services to other pulp mills or even other industries (e.g. cleaning staff), it is not possible, on the basis of pulp company records, to ascertain an accurate figure of how many people are employed in the contractor-part of the industry. In addition, very little information is available on the contracting companies themselves. It can however be assumed that contracting represents a large chunk of low-skilled employees.
29 This figure excludes contractor employees.

28
Cost structure. Due to restrictions on information that could be disclosed by the internationally listed companies, it was not possible to obtain detailed cost structure information for the South African pulp industry. According to an international benchmarking study, however, South African bleached hardwood kraft pulp manufacturing costs amounted to $275/tonne in 199830 - the second lowest figure (see Figure 4) of the countries included in the study (which covered both developed and developing pulp-producing countries). These costs were broken down into five components, of which roundwood inputs was the largest ($101/tonne, 37% of total cost) for South Africa, followed by distribution31 ($74/tonne, 27% of total cost), other costs32 ($47/tonne, 17.1% of total cost), chemicals ($30/tonne, 10.9% of total cost) and personnel ($23/tonne, 8.4% of total cost) (Grafstrom, 1998).
It is interesting to note that the differences in cost structures were mainly driven by differences in wood input costs and distribution costs. South Africa was shown to have the third lowest wood input costs with Brazil having slightly lower wood input costs and Canada, surprising, with the lowest. In terms of distribution costs, South Africa (closely followed by Indonesia) was found to have the second highest transport cost per tonne with only Canada being higher. The study further showed that South Africa has the second lowest labour input cost per ton of production, with only Indonesia being lower.
30 Though the data is rather outdated, the idea is to give an indication of the relative proportion of various cost elements in total costs. It is assumed that these proportions will still be applicable. 31 Though it is not clear what is meant with “distribution”, we take it to be the costs incurred by companies in distributing their products to other parts of the business, or to the relevant markets. 32 Costs associated with e.g. capital depreciation, consumables, contractor services, etc.

29
% of input cost Country
Wood Chemicals Personnel Other costs Distribution Total ($ per ton)
Brazil 85 29 31 53 48 246
% of total 34.6 11.8 12.6 21.5 19.5 100.0
South Africa 101 30 23 47 74 275
% of total 36.7 10.9 8.4 17.1 26.9 100.0
Indonesia 121 38 16 62 73 310 % of total 39.0 12.3 5.2 20.0 23.5 100.0
USA 110 46 44 59 55 314 % of total 35.0 14.6 14.0 18.8 17.5 100.0
Canada 79 44 44 43 105 315 % of total 25.1 14.0 14.0 13.7 33.3 100.0
Scandinavia 206 45 36 23 28 338 % of total 60.9 13.3 10.7 6.8 8.3 100.0
Portugal 199 43 40 27 29 338 % of total 58.9 12.7 11.8 8.0 8.6 100.0
Spain 197 42 32 50 27 348 % of total 56.6 12.1 9.2 14.4 7.8 100.0
Chile 164 32 34 70 49 349 % of total 47.0 9.2 9.7 20.1 14.0 100.0
Table 4. Input cost structure for hardwood bleached kraft pulp ($ per ton) for selected countries. Source: Grafstrom, 1998
3.1.4. MARKET DEFINTION, STRUCTURE AND CONCENTRATION
In this section, the functioning of the pulp market will be discussed according to sub-markets, concentration amongst buyers and sellers of pulp products, international trade, barriers to entry faced within the market and the pricing mechanism operating in the market.
Market definition. The three main production processes described above produce pulp products with different characteristics and applications that are traded in differentiated markets. Three distinct product markets can, therefore, be defined for mechanical, chemical (including semi-chemical) and dissolving pulp. Dissolving pulp is sold exclusively on the international market. The other two markets are mostly domestic in nature. In fact, no mechanical pulp was traded on the open
30
market at all in 200333, and less than 40% of chemical pulp (excluding dissolving pulp) was traded.
Vertical integration. As mentioned, pulp production (i.e. excluding dissolving pulp) is highly integrated with upstream and downstream activities. The biggest proportion of annual production is not sold on the market, but is used in integrated paper production operations. In turn, pulp operations own a substantial proportion of plantation area in South Africa through which fibre supply to their mills is secured (see discussion in Section 2). This means that the pulp market in South Africa is more limited than aggregate production figures suggest. In 2003 only about 26% of total chemical (including semi-chemical, but excluding dissolving) pulp production was traded within South Africa (i.e. sold to other pulp mills or to non-integrated paper mills) and this increases to 38% if exports are included. Including the export figure may, however, be misleading as exports are mostly destined for own overseas paper operations. These figures were derived by excluding dissolving pulp trade from the analysis (it falls in a market of its own and is wholly exported) as shown in Table 5.
33 The two mills that produce mechanical pulp apply it in their own integrated paper production, as it would be inefficient (its strength would be lost) and expensive to dry mechanical pulp and sell it.

31
Traded pulp (‘000 tons)34 2001 2002 2003
Purchases of locally produced pulp ('000 tonnes)
Bleached softwood 114 112 97
Unbleached softwood 14 37 21
Bleached hardwood 227 291 316
Unbleached hardwood 18 18 17
Total: locally traded pulp 373 458 451
Total pulp exports 583 597 744
Dissolving 400 413 538
Other 183 184 206
Total: locally and internationally traded pulp 556 642 657 Total pulp production 2138 2183 1734
Locally traded pulp as proportion of total production 17.4% 21% 26 % All traded pulp as proportion of total production 26% 29.4% 37.9%
Table 5. Calculation of the traded component of the chemical pulp market. Source: Genesis calculations based on input data from Pamsa (2004 Industry Survey).
The proportion of pulp traded versus employed for own use depends on the type of pulp produced and (as Table 5 shows) currently ranges from “none” (mechanical pulp) to “about 20%” (chemical pulp), to “all exported” (dissolving pulp). Domestic paper and tissue mills thus buy about 20% of all chemically produced pulp, and international buyers a further 9%, with the rest used in integrated domestic paper production. Interestingly, Mondi and Sappi each represent the other’s biggest pulp customer. The major international buyers of South African pulp are: Germany, the UK, Indonesia, India and Thailand. Together, these countries accounted for almost 51% of South Africa’s pulp exports in 2002 (Pamsa, 2004a).
The integrated nature of the industry is partly explained by the necessity of a secure raw fibre supply and the capital intensive nature of pulping. This phenomenon and its impact on the market will be discussed in more detail in Section 3.4.2.
34 As all dissolving pulp is exported and thus per definition traded, dissolving pulp is excluded from all production and trade figures quoted in this table.
32
Market geographics. Due to the cost and inefficiencies of transporting raw material, pulp mills are located close to the fibre resource they utilise. In addition, the large quantities of water required means that mills also need to be on or near a major river. A further consideration for location would be easy access to their market through either direct linkages (i.e. being integrated or near to a paper manufacturing facility) or access to transport hubs (e.g. harbours through which pulp can be exported).
In South Africa, the mills are mostly concentrated along the North Eastern coast (Kwazulu-Natal) where they are close to fibre sources and have access to the harbours at Richards Bay and Durban for exports. The three exceptions are the Mondi Piet Retief mill, the Sappi Ngodwana mill near Nelspruit and the Sappi Enstra mill in Springs. These mills are all close to their sources of fibre (with the exception of Enstra) and are integrated with paper production facilities.
Trade. Of total pulp production (including all categories), 32% (744,000 tonnes) was exported at a value of R2.6bn in 2003 (PAMSA, 2004b). This implies an average exporting value of R3,450 per tonne. Of this, 538,000 tonnes were dissolving pulp and the remaining 206,000 tonnes (chemical pulp) were exported for paper production elsewhere
In contrast, only about 71,000 tonnes of pulp were imported in 2003 (about 3% of the total volume of production) (Pamsa, 2004b). Pulp imports mainly consist of specialty types of pulp that are not produced domestically. South Africa is not unique in its low level of pulp trade: only about 30% of all international pulp production is traded, as companies mostly use pulp for own integrated paper production (PAMSA, 2004a). In order for pulp to be traded, it not only needs to be transported, but also needs to be dried and baled. This unnecessarily increases production costs, as pulp can be used in an integrated mill without drying.
The trend in pulp trade by South Africa over the last decade is shown in Figure 5.

33
Figure 5. Value of pulp trade: 1992-2003 (in real 2003 values). Source: FSA, 2004.
From Figure 5 it is evident that a large positive trade balance is the norm. The two marked spikes in the value of exports can be ascribed to peaks in the international pulp price in the relevant years.
Barriers to entry and expansion. The pulp industry is characterised by high barriers to entry and some of these barriers also apply to potential expansion of existing capacity. The barriers stem from the inherent characteristics of the market (so-called ‘natural barriers’) as well as particular features of how the market is structured (behavioural barriers).
• Capital intensity, domestic fibre supply and upstream integration. In terms of market characteristics, the pulp market is extremely capital intensive, which implies that substantial scale is required for efficient production. This, in turn, implies that a substantial, secure and continuous supply of fibre is required in order to fully utilise the capital investment. Throughout the history of the South African pulp industry fibre supply security was mostly achieved through ownership of the plantations by pulp and paper companies and the situation remains fairly unchanged today. The effect of this is that the pulp companies have secured a substantial proportion of their required fibre supply but, in
0
500
1000
1500
2000
2500
3000
3500
4000
4500
1992 1993 1994 1995 1996 1997 1998 1999 2000 2001 2002 2003
R m
illio
n ImportsExportsTrade balance
Trade balance
Imports
Exports

34
addition, have made it difficult for other companies (and in particular potential new entrants) to compete for the already limited fibre supply. This will substantially increase the fibre supply barrier to entry. The barrier is, therefore, two-fold. Firstly, the amount of capital required to establish a mill will, in itself, present a major barrier to entry and, secondly, the critical need for sufficient and secure fibre supply means that there will be a natural limit to the number of pulp mills that the South African fibre base can support. This ‘natural’ limit may change with the emergence of new technologies that can operate effectively at lower volumes of production.
• Downstream vertical integration, market domination and buyer concentration. Mondi and Sappi are the only producers of virgin fibre pulp in South Africa and, incidentally, also each other’s single biggest pulp buying clients as there are a limited number of buyers of pulp in South Africa and the bulk is consumed in integrated paper mills owned by these two companies. This is particularly true in the printing and writing paper and newsprint markets where Sappi and Mondi are the only two players. A new entrant, if not integrated on the paper production side, will, therefore, have to rely on exporting or selling pulp to the non-integrated paper mills in the market. These mills require a substantially lower volume of virgin fibre pulp as production is mostly based on recycled fibre. The domestic market may, therefore, not provide sufficient opportunities to justify the scale of investment required for new pulp entrants. In turn, the export market is dependent on the movements of the currency, which have recently moved against exporters, illustrating the risk faced by large capital investments purely focused on the export market.
• Location restrictions. Due to the costs and inefficiencies of transporting roundwood, pulp mills are restricted in the distance that they can be located from the fibre base. In addition, a mill requires a substantial water resource in the form of a river. The combination of these characteristics with fibre constraints means that there are limited locations in which pulp mills can feasibly be established. As there is also a limit to the number of pulp mills that a particular area can carry (due to pollution, water availability, fibre supply, etc.), this suggests that there are limited (if any) opportunities for new mills to be established. These factors play a significant role in the potential role of plantation forestry and beneficiation in the development of the Eastern Cape and are discussed in more detail in Part I, Section 10.
• Water regulation and community preference. The allocation of a water licence to a pulp mill is dependent on a number of factors including the current

35
condition of the water resource, the preference of the community for the quality of the water resource and the nature of the pulping operation (in terms of its polluting impact). In some areas, the requirements set by environmental regulations and the preferences exercised by the community will prevent pulp mills from being established even if financially viable. It must be noted that this is not considered to be a primary barrier, as the feasibility of a plant will be determined by other barriers and dynamics even before it gets to the point of environmental assessment and community interaction.
• Lack of appropriately skilled labour. Pulp mills require skilled labour to manage and operate the various production processes (more than 50% of the pulp and paper industry’s employees are skilled). No skills-breakdown is however available for pulp alone (Hunt, 2005). The absence of sufficient skilled labour has been flagged as a potential constraint to expansion by existing players in the market and will be a substantial constraint to a new entrant35.
• Uncertainty about security of investment. Due to the large investment required, investors need to have certainty that they will be able to operate their mill for a sufficient period of time in a consistent regulatory environment in order to recover the investment. This environment is to a large extent influenced by Government’s expressed views of and interaction with the industry and the direction (or perceived direction) and predictability/consistency of regulation. In South Africa, the regulatory burden on the forestry value chain (including pulp mills) is increasing and the views of the industry communicated by government and regulators are ambivalent at best. This is not a judgement on the appropriateness of the current regulations, but on the manner in which the regulation is conducted, as it creates uncertainty (or perceptions of non-desirability of forestry and its downstream activities) for the current industry as well as any potential entrants. This uncertainty is compounded by movements in the currency.
At the same time as acknowledging the above-mentioned barriers, the plans to establish an additional pulp mill at Richards Bay must be noted. This project is still at an early stage of assessing viability and it is not clear whether it will, in fact, go ahead. However, a number of characteristics make this potential venture unique and explain why it could possibly get around the above-mentioned barriers:
• It is driven by owners of existing fibre resources that are currently exported as wood chips (thus vertical integration will take place).
35 See Section 3.4.4 for a discussion of the skills-related challenges faced by the industry.

36
• It has international partners through which a market for the product can be secured. NCT is pursuing this venture in partnership with SodraCell (a Swedish plantation and pulp cooperative). SodraCell owns a number of pulping operations internationally and will, therefore, be able to support the new venture in securing international markets for its pulp.
• It will combine chemical with mechanical elements in a BCTMP process. This proposed technology allows it to operate on a smaller scale and, therefore, on lower fibre inputs.
The success or failure of this venture, especially as it will not be integrated on the downstream side, but aims to focus exclusively on the export market, will provide insight into the current market conditions in South Africa.
Pricing mechanism. Pulp is a tradable commodity and prices (determined by global demand and supply trends) are published internationally and directly applied in South Africa (Pamsa, 2004a). As with a commodity such as gold, which also has an international price, this essentially implies pricing at import parity. As prices are set in Rand, domestic prices are sensitive to exchange rate movements and subject to fluctuations. Even though it is not as entrenched as the 6-month contract system for paper prices (see Section 3.2.4), pulp buyers and sellers also tend to hedge against exchange rate fluctuations by means of 3-month forward contracts. In this way, they are covered against exchange rate risk, but are not tied in contracts for too long, should the international pulp price change. Generally, domestic prices are benchmarked on the NBSK (Northern Bleached Softwood Kraft) price listed internationally. During 2004, the NBSK price fluctuated between $580 per ton and $640 per ton (Purchasing.com, 2004). The dissolving pulp price is set at a premium to the NBSK price (e.g. NBSK plus 30%) (Wagenaar, 2004 ). Table 6 shows the fluctuating nature of the international pulp price when considering price movements over the past five years.

37
NBSK pulp price trends $/ton Nov 2000 710 Nov 2001 465-480 Nov 2002 460 Nov 2003 540-550 Nov 2004 580-590 Feb 2005 630-645
Table 6. NBSK prices over the past five years. Source: Provided by Hunt, 2005, upon request.
3.2. OVERVIEW OF THE PAPER MARKET
3.2.1. BASIC DESCRIPTION
Although more diversified than the pulp component in terms of the products and players operating in the market, the paper industry is dominated by the same two players (Mondi and Sappi) who are the only producers of printing and writing paper in South Africa. The four main categories of paper produced are printing and writing, newsprint, packaging and tissue paper. In the sections to follow, the structure of the market will be unpacked by looking inter alia at the market players, their market power, production, inputs and trade.
3.2.2. MARKET PLAYERS36
The five largest paper producers in South Africa are: Sappi; Mondi; Nampak; Kimberly-Clark (of which 51% is owned by Kimberly-Clark International and 49% by First Asian Investment, a local black-owned company); and Gayatri (previously known as Unicell) (Pamsa, 2004a).
36 Summary tables of the pulp and paper mills in South Africa, their inputs, outputs and capacity, are contained in Section 5.9 of the Technical appendices.

38
Company Capacity (000 t/a) Share of total capacity
Mondi 1,166 44% Sappi 1,158 44% Nampak 112 4% Kimberly-Clark 52 2% Gayatri 50 2% Other (smaller paper mills) 116 4% Total capacity 2,654
Table 7. Capacity shares: paper manufacturing in SA, 2003. Source: Pamsa, 2004a
Together, the various mills owned by the biggest five companies accounted for 96% of the total paper production capacity in South Africa in 2003. The remaining 4% is produced by a number of smaller companies (with a capacity of 3 000 to 15 000 t/a). These smaller producers largely (or often completely) depend on recycled paper for raw material and produce mainly tissue paper products.

39
Smaller Paper Mills Capacity (t/a) Products
Central Tissue 4,000 Recycled tissue
Crystal Papers (3 mills) 15,000 Recycled tissue
Dynamic Fibre Moulding 10,000 Moulded packaging
Expert Tissue 4,000 Recycled tissue
Gardenia Paper Products 7,000 Recycled tissue
Goodview investments (Status/Crown) 3,000 Recycled tissue
Hygenic Paper 15,000 Recycled tissue
Jankirkar Paper Mills 5,000 Recycled tissue
Ligia Paper Industries 4,000 Recycled tissue
Lothlorien 15,000 Corrugated paper
Rafalo/Correll 8,000 Recycled tissue
SA Paper Mills 8,000 Corrugated paper
SA Tissue 4,000 Recycled tissue
Tongaat Paper Company 8,000 Recycled tissue
Waldens Paper Mill 6,000 Recycled tissue
Total capacity 116,000
Table 8. Smaller paper mills and their capacities, 2003 Source: Pamsa, 2004.
Table 7 and Table 8 however do not reflect the structure of the various submarkets:
• Where players such as Nampak and Kimberly-Clark have small market shares if one looks at total paper production capacity, their combined market share in the tissue paper market is much higher (about 50%). The remaining 50% is comprised of the smaller tissue paper mills shown in Table 8.
• Within the printing and writing paper market, Sappi and Mondi are the sole producers of A4-type office paper.
• In the newsprint market, Mondi has a 62% and Sappi the remaining 38% market share. Mondi Merebank furthermore produces 98% of all mechanical magazine paper.
• The packaging paper market is dominated by Sappi and Mondi, with Nampak and Gayatri each running a single corrugated paper mill (each with a 50,000 tonne per annum capacity), in addition to at least two small players (Lothlorien: 15,000 tonnes per annum and SA Paper Mills: 8,000 tonnes per annum).

40
Nampak is the country’s largest supplier of multiwall paper sacks and bags and is the most significant converter of packaging.
The outlook for 2005 (Paperloop.com, 2005) is that many of the smaller independent mills will upgrade their capacity. When capacity expansions to be implemented during 2005 are taken into account, the capacity of the smaller players almost doubles (see Table 8 and Table 9). Following these expansions, the market share (in terms of production capacity) controlled by Kimberly Clark and Nampak and, in some cases, Sappi and Mondi, is expected to fall. It is not clear what the change is that led to the expansion drive by smaller players, but it is clearly based on an optimistic market assessment.
Company Products Post-exp capacity (t/a)
Central Tissue Recycled tissue 6,000 Crystal Paper Group Recycled tissue 20,000 Dynamic Fibre Moulding Moulded packaging 10,000 Expert Tissue Recycled tissue 4,000 Gardenia Paper Products Recycled tissue 14,000 Good View Investments Recycled tissue 3,500 Hygienic Tissue Mills Recycled tissue 20,000 Janjirker Paper Mill Recycled tissue 4,000 Ligia Paper Industries Recycled tissue 3,500 Lothlorien Testliner and recycled fluting 70,000 Rafalo/Correll Recycled tissue 11,000 SA Paper Mills Kraft paper, testliner & recycled fluting 24,000 SA Tissue Recycled tissue 4,250 Tongaat Tissue Recycled tissue 6,000 Waldens Paper Mill Recycled tissue 6,000 Total 206,250
Table 9. Smaller mills’ capacities after expected expansions (2005) Source: Paperloop.com - PPI This Week/January 31 - February 4, 2005 .
According to Table 9, Lothlorien will become one of the larger players and its paper producing capacity will exceed that of Gayatri and Kimberly-Clark.
Conversion market players. It is estimated that there are about 250 paper converters operating in South Africa. 54% of the operations are dedicated to packaging, 25% to printing and publishing, 14% to newsprint and tissue, and 7% to

41
disposable products (IDC, 2004). In addition, a number of micro converters are active in the tissue market. These producers do not have any paper milling capacity, but buy paper inputs which they then convert on a small scale to mostly tissue paper products37.
3.2.3. PRODUCTION AND PRODUCTS
Product grades. There are 30 paper and paper-product (most notably tissue) mills in South Africa (including the eight pulp mills that also produce paper). As mentioned, the main categories of paper produced in South Africa are: printing and writing grades, newsprint, tissue and packaging papers. Within the printing and writing category, coated and uncoated fine (also known as woodfree) papers are the most prominent grades. For packaging, the main products are linerboard and fluting (containerboard) for corrugated cartons, as well as paper bags (called sack kraft) and carton board. Once again, refer to the mill summary table in Appendix H of the Technical notes and appendices (Part III of this report) for more detail on the products produced by the various mills.
Printing, writing and packaging paper grades use chemical pulp (bleached in the case of fine paper), while newsprint is produced from mechanical pulp and tissue uses mainly recycled fibre. Figure 6 provides an overview.
Figure 6. Schematic representation of major paper product grades. Source: Genesis representation, based on information provided by Pamsa (2004)
37 The lack of regulation of these informal small players is of some concern to larger industry players, for example with regard to the enforcement of the Trade Metrology Amendment Act of 2000. It is argued that the lack of proper enforcement of regulation leads to a situation of “regulating what is within reach”, in turn resulting in unfair labour conditions and competitive advantages for informal players. The Trade Metrology Act is discussed in more detail in Part II of this study, Table 53.
chemical pulping
mechanical pulping
printing and writing papers
tissue
packaging papers
newsprint and magazine grades
coated fineuncoated fine
linerboardflutingcartonboardpaper bags
waste paper

42
In 2003, South Africa was the 24th largest paper and cartonboard producer in the world, with paper production totalling 2.3m tonnes, to the value of R11.7bn and translating into R5,440 per tonne (Pamsa, 2004b). Production for 2001 to 2003 by major categories is shown in Table 10.
Paper production (000 tonnes) 2001 2002 2003 Printing & writing grades 535 566 580 Newsprint & telephone directory paper 328 338 336 Packaging grades 1,245 1,265 1,265 Tissue grades 150 154 152 Total paper 2,257 2,324 2,332
Table 10. Volume of paper production by major grade categories, 2001 to 2003. Source: Pamsa, 2004b
Over the past three years, all major categories have witnessed a slight increase in production, with packaging grades being the most prominent category (54% of total paper production)38.
3.2.3.1. FIBRE INPUTS
Wood pulp (produced in an integrated pulp mill, or sourced externally) and, in two cases, bagasse pulp, are the only virgin fibre inputs in for paper mills.
Recovered paper also represents an important input into the paper manufacturing process. In 2003, it was responsible for about 39% of paper manufacturing’s fibre inputs. The relative proportion used by each mill depends on the grade of paper produced:
• Printing and writing grades require mostly virgin fibre. White A4 office paper, for example, is manufactured from 100% virgin fibre. It can be expected that
38 Though printing and writing paper is the core business internationally of both Sappi and Mondi, packaging papers still dominate production in South Africa, especially in the case of Sappi. This is largely due to historical factors: packaging paper (and kraft pulp) had been convenient, less expensive entry level activities at the time that most of the mills were built. With the investments now made, the pattern of production has become entrenched. Enough printing and writing paper is however being produced to serve the domestic market. It is to be expected that the focus of future expansion will fall more on the “core business” side of these companies’ operations, namely high quality printing and writing grades (Hunt, 2005).

43
technological advancements will change the furnish39 in the future, and enable A4 paper to have some waste paper content.
• Packaging paper. Corrugated papers generally require a combination (depending on the grade of paper to be produced) of virgin and recovered pulp. The proportion can vary from 100% virgin (kraft liner) to 100% waste (test liner).
• For newsprint the quality of the product can be improved by using recycled inputs, but softwood pulp is at the moment still the dominant input. Moving more towards recycled fibre would however require substantial technology changes, as the two mechanical mills were built on a virgin-fibre basis.
• For tissue the market drives the proportions (e.g. more virgin fibre for bleached, soft, high quality tissue products, versus recovered inputs for less expensive tissue products). As a rule, tissue mills however run on more than 50% recovered paper, and the proportion can be as high as 90% (Weisz, 2004; Davison, 2004).
It can be expected that the recycled component of fibre inputs will increase in the future. This will particularly be the case as virgin fibre becomes a constraint and the furnish of paper changes to accommodate more recycled fibre. The growth in the non-integrated tissue paper mills will also facilitate an increased use of recycled fibre. The waste paper market is discussed in more detail in Section 3.3.
3.2.3.2. NON-FIBRE INPUTS
Though more can be identified, the present analysis focuses only on a few prominent non-fibre inputs into paper manufacturing.
Water. As is the case in pulp mills, paper mills closely monitor their water consumption rates and try to increase water use efficiency (Mondi, 2003). The industry will however always remains a large water user. Non-integrated paper mills consume about 27 m3 of water for every tonne of paper produced, whereas integrated pulp and paper mills consume as much as 72 m3 per tonne. The average water intake of non-integrated paper mills in South Africa is 37,515 m3 per day, versus a figure of 229,260 m3 per day for integrated pulp and paper mills.
39 “Furnish” is the industry term used to denote the composition of paper, or the “recipe” of e.g. virgin vs recycled fibre content.

44
Energy. Non-integrated paper mills cannot generate energy from biomass as integrated pulp and paper mills do and are thus reliant on fossil fuels and electricity off the national grid. The energy use of the integrated pulp and paper industry will be discussed in Appendix B of the Technical notes and appendices (Part III of this report). No disaggregated data is however available for non-integrated paper mills.
Capital inputs. Though less so than in pulp production, paper manufacturing is capital intensive and building a paper manufacturing plant is a venture that requires large investment.
Labour. As was mentioned in Section 3.1.3.1, about 13,200 people are directly employed in the pulp and paper industry (Hunt, 2004), the majority of whom are skilled and semi-skilled. This figure may be under-estimating the total employment impact of the industry, as it does not take account of employment in the paper conversion industry, or the indirect employment represented by out-sourcing. The employment figures for the various paper mills are contained in the summary tables in Appendix H of the Technical notes and appendices (Part III of this report). Section 2 of the main document (Part I of this report) discusses the pulp and paper industry’s impact on the South African economy via employment.
Box 2. The paper manufacturing process Although some variation is possible, the most common procedure for making paper is to spray a pulp mixture onto a moving screen (called a wire). Through the removal of most of the water content (by the wire, in combination with a vacuum system), a sheet is formed, which is then pressed between rolls to remove more water, after which it passes through a dryer section (where the steam-heated cylinders that the sheet comes in contact with cause the remaining water to evaporate). Further refinement and processing depend on the grade of paper/board to be manufactured. Once finished, the paper will be converted into a usable format in the conversion step of the value chain. Conversion operations are often integrated with paper production in the same factory.
All non-integrated mills, and some integrated ones, also have recycling processes. Waste paper and board is collected, mixed with water and disintegrated in a pulper, after which non-recyclable substances such as glass, metal (staples) or polystyrene are removed by means of screens and cleaners. The recycled pulp then undergoes several cleaning processes and, if necessary for the specifications of the paper to be produced, is de-inked. De-inking basically implies a “washing machine” process in which chemicals, water and heat are used to lift the ink out of the pulp. Depending on the specifications of the paper to be made, the pulp may then need to be bleached before being mixed with virgin fibre pulp or used on its own for the manufacturing of various grades of paper and cartonboard.
*Source: Mondi and Sappi websites, www.paperonline.com, as well as personal communications from other role players. More detailed information on the various processes involved can be obtained from: www.sappi.co.za and www.mondi.co.za
45
3.2.4. MARKET DEFINITION, STRUCTURE AND CONDUCT
Market definition. As with pulp, the paper market cannot be seen as a homogenous market, but consists of a few submarkets, each with its own players, substitutes, buyers, cost structures and pricing mechanisms. In this analysis, four distinct paper markets are identified (in line with the major product groups discussed earlier): printing and writing, newsprint, packaging and tissue paper. From the above analysis, it is clear that the first three markets are dominated by Mondi and Sappi, with the tissue paper market currently dominated by Nampak and Kimberly Clark. The latter two markets are also the only ones in which an additional number of smaller firms operate, albeit restricted to lower quality products.
Market geographics. South Africa’s paper mills are concentrated along the north coast of Kwazulu-Natal and in Gauteng, with two mills also located in Mpumalanga and three in Cape Town. The general principle seems to be that the mills need to be close to the fibre source, be it virgin fibre (in the case of the pulp mills) or recycled fibre (in the case of the non-integrated paper mills). Those mills located in Gauteng and the Western Cape (that is not in the vicinity of roundwood resources) are typically the non-integrated paper mills that rely mostly on recovered paper. Such mills tend to be situated near or in urban areas, where inputs can be sourced easily and without incurring great transport costs (Pamsa, 2004a). Once beneficiation has taken place to produce paper, location is however not a binding factor any more, and distribution takes place nationally or indeed globally through exports.
Trade. With the exception of packaging paper, the markets for other paper products are mostly domestic, with limited exports of newsprint and coated and uncoated printing and writing papers. In 2003, 692,000 tonnes (almost 30%) of paper production was exported (to the value of R2.75bn), while imports amounted to 16% of production (371,000 tonnes) (Pamsa, 2004b).
Table 11 shows that packaging grades accounted for the largest proportion of exports in 2003 (59%), followed by printing and writing papers (about 25%), newsprint (approximately 13%) and tissue paper (2.6%). Added to this, can be an estimated 112,000 tonnes of corrugated paper exported in 2003 in the form of packaging for fruit, wine, or other products (PRASA, 2004).

46
Exports (000 tonnes) 2001 2002 2003
Printing and writing papers 128 149 176
Uncoated papers 87 101 132
Coated paper 5 5 6
SC mechanical & lightweight coated paper 36 43 38
Newsprint & telephone directory paper 89 98 89
Packaging papers 410 375 408
Liner board 361 341 363
Fluting 26 21 29
Other kraft, paperboard & fibreboard 23 13 15
Tissue paper 13 16 18
Total Paper and Board 640 639 692 Table 11. Paper exports by major category, 2001 to 2003 Source: Pamsa, 2004b
Imports (000 tons) 2001 2002 2003 Newsprint 0.6 0.6 0.8 Tissue 3.8 1.0 2.0 Printing and writing grades 204.7 216.0 294.1
Uncoated paper & paperboard 9.5 15.8 40.0 Other uncoated paper & paperboard 20.4 18.8 23.8 Paper & paperboard coated with kaolin 131.8 137.5 186.1 Printed/impregnated paper & paperboard 43.0 44.0 44.1
Packaging grades 22.1 22.8 47.5 Uncoated kraft & paperboard 20.3 21.3 45.2 Corrugated paper & paperboard 1.8 1.5 2.2
Other 22.9 25.0 26.8 Greaseproof/tracing papers 6.7 12.6 9.5 Composite paper 4.2 4.2 4.9 Carbon paper 4.6 2.8 6.5 Filter blocks & plates of paper pulp 0.2 0.2 0.2 Cigarette paper 3.2 3.1 3.3 Wallpaper 0.4 0.3 0.3 Floor coverings on a base of paper or paperboard 0.0 0.0 0.0 Carbon & self-copy paper 3.5 1.7 2.1
Table 12. Total paper imports, 2001 to 2003 Source: Customs & Excise data, StatsSA, categories 4801-4816 as used in Pamsa, 2004b.
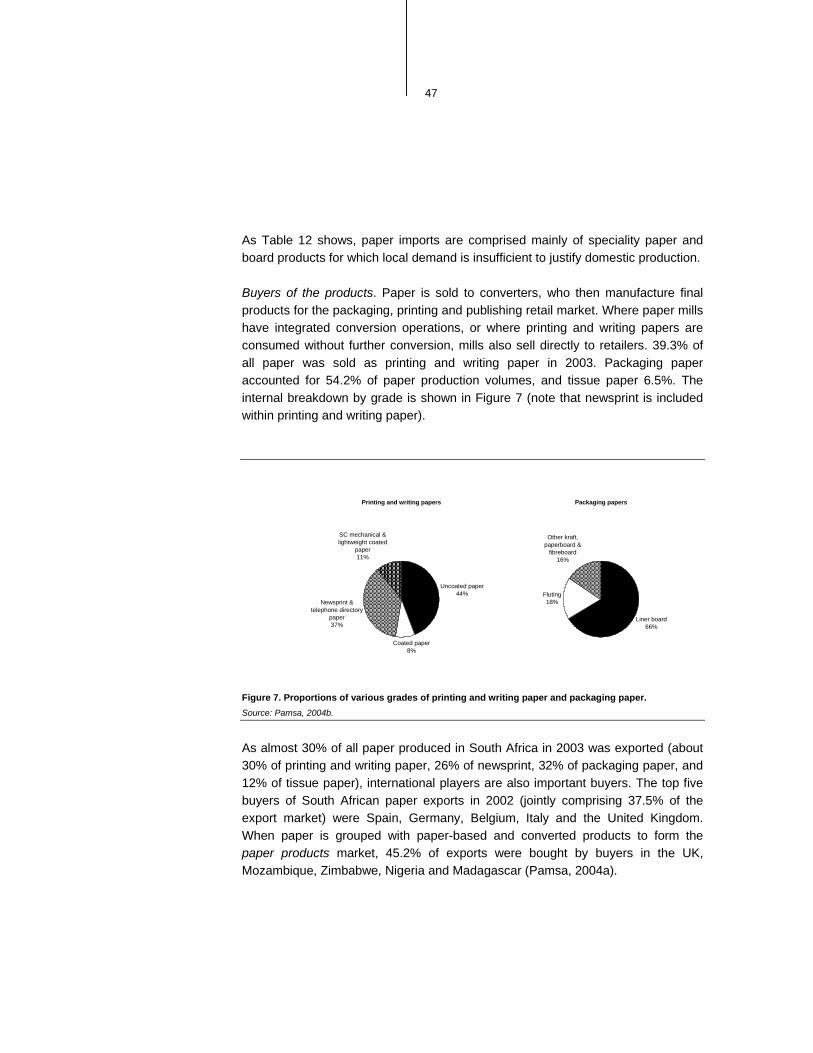
47
As Table 12 shows, paper imports are comprised mainly of speciality paper and board products for which local demand is insufficient to justify domestic production.
Buyers of the products. Paper is sold to converters, who then manufacture final products for the packaging, printing and publishing retail market. Where paper mills have integrated conversion operations, or where printing and writing papers are consumed without further conversion, mills also sell directly to retailers. 39.3% of all paper was sold as printing and writing paper in 2003. Packaging paper accounted for 54.2% of paper production volumes, and tissue paper 6.5%. The internal breakdown by grade is shown in Figure 7 (note that newsprint is included within printing and writing paper).
Figure 7. Proportions of various grades of printing and writing paper and packaging paper. Source: Pamsa, 2004b.
As almost 30% of all paper produced in South Africa in 2003 was exported (about 30% of printing and writing paper, 26% of newsprint, 32% of packaging paper, and 12% of tissue paper), international players are also important buyers. The top five buyers of South African paper exports in 2002 (jointly comprising 37.5% of the export market) were Spain, Germany, Belgium, Italy and the United Kingdom. When paper is grouped with paper-based and converted products to form the paper products market, 45.2% of exports were bought by buyers in the UK, Mozambique, Zimbabwe, Nigeria and Madagascar (Pamsa, 2004a).
Printing and writing papers
Coated paper8%
Newsprint & telephone directory
paper37%
Uncoated paper 44%
SC mechanical & lightweight coated
paper11%
Packaging papers
Liner board66%
Fluting18%
Other kraft, paperboard &
fibreboard16%

48
Cost structure. Due to policies of firms listed abroad and requirements of the countries in which they are listed, it was not possible to obtain cost structure data that is representative of the whole industry.
Barriers to entry and expansion. The paper industry is also characterised by high barriers to entry and expansion, which stem from inherent characteristics of the market as well as the behaviour of market players. These barriers are also specific to particular paper markets.
• Capital intensity. As with the pulp industry, paper mills also require substantial capital investments. The type of operation however plays a role – tissue paper machines, for example, can be bought second hand on the international market at prices low enough so as not to serve as a barrier to entry (Davison, 2004). Capital intensity is more relevant for, for example, printing and writing as well as newsprint markets due to the scale of production involved.
• Vertical integration and fibre supply. As with the pulp industry, entry into the paper industry for products that require a substantial proportion of virgin fibre inputs (i.e. printing and writing, newsprint and some categories of packaging) are restricted by the level of vertical integration in the market. Mondi and Sappi are the only producers of virgin pulp in South Africa and own a substantial proportion of plantations as well as their own paper manufacturing operations. This would suggest that a new entrant may have difficulty in securing a sufficient and secure supply of fibre. If it were to enter in both the pulp and paper markets, this would significantly increase the capital requirement and it would still be faced by all the barriers mentioned for the pulp industry. For non-integrated paper production (that is more reliant on recycled fibre, namely tissue and corrugated paper production) this is not perceived as a barrier to entry. In this market, unconverted paper availability is rather regarded as a barrier to entry on the conversion side.
• Market concentration. In addition to the level of vertical integration, the various paper markets are characterised by high levels of concentration. Mondi and Sappi are the only players in the paper and writing and newsprint markets, Mondi, Nampak, Lothlorien and Gayatri dominate the packaging market and Kimberly Clark and Nampak control about 50% of the tissue paper market. The tissue paper market is the least concentrated, but even here the competition by smaller firms is restricted to the lower quality products. However, expansion plans in this market my change the scenario going forward, with smaller firms expected to become more prominent

49
• Lack of appropriately skilled labour. As with pulp mills, paper production also requires skilled labour to manage and operate the various production processes. No skills-breakdown is however available for paper alone (Hunt, 2005). The lack of appropriately skilled labour is discussed in Section 3.4.4 .
Demand trends. In South Africa, it is to be expected that per capita consumption of paper will increase in line with economic growth and development. Internationally, the rule of thumb is that paper demand is expected to grow at roughly 3% per annum. With economic growth in South East Asia, most notably China, far exceeding that, it is to be expected that, in spite of a current slump in the global paper market due to oversupply (Industry Role Players, 2004, 2005), the demand for paper will continue to grow. Whether the demand for specifically South African paper will grow, will possibly depend on SA producers’ ability to find niche markets where they cannot compete with large scale producers from Brazil.
• Of the various submarkets, the corrugated paper market is currently the strongest in South Africa (as discussed, this is the market characterised by the highest production and trade figures). Whereas SA produced pine is, for example, not of a high enough quality to ensure a competitive advantage internationally in newsprint production, the quality is sufficient for the competitive production of corrugating paper (Hunt, 2005). Corrugated paper production also does not require a bleach plant as is the case with printing and writing paper production and lends itself more to waste paper use as a fibre input. The corrugated market is furthermore linked to the export market through the packaging industry. Thus the exchange rate and production and export trends in, especially, the agriculture industry, affect the demand for corrugated paper.
• Demand for tissue paper is linked to economic development and population growth and South African tissue manufacturers are confident that domestic demand will show a positive trend into the future. According to the latest world and regional tissue forecasts by Risi (2005), worldwide tissue consumption growth reached a trough of 2.8% in 2003. They estimated that demand subsequently recovered to 3.3% in 2005, and predict a growth rate of 3.9% in 2005 (which is more typical for the market). Due to the bulkiness of tissue relative to its value, export is however not considered a growth priority in South Africa. The planned and current capacity expansions of the smaller South African tissue mills creates the impression that neither capital requirements, nor environmental legislation, the high degree of integration, or waste fibre availability serve as barriers to entry/expansion in the non-integrated part of the

50
market. In addition, producers seem confident that demand is sufficient and growing. It also points to positive competition in the market.
• The domestic demand for printing and writing paper is expected to grow in line with economic growth. It is to be expected that, in order to increase exports and to grow, South African paper producers will need to pro-actively seek niche markets internationally.
Pricing mechanism. Paper prices in the domestic market are fixed in Rand and determined through negotiations around short term (six months to one year) supply contracts. At the time of negotiation, world market prices are used as a benchmark and prices are set at import parity (Pamsa, 2004a; Industry role players, 2004/2005). As contracts are fixed for at least 6 months, with reigning prices at the beginning of the period taken as indicators, a lead-or-lag situation however arises when international price fluctuations happen over the 6 month period.
Prices in the paper market have varied substantially over the last decade in Dollar and in Rand terms. The price of fine paper was, for example, R6,919 per tonne during the last quarter of 2003, which is significantly lower than the R7,999 per tonne price of 2002. However, in dollar terms the price rose from $763 per tonne to $937 per tonne (JP Morgan, quoted in IDC, 2004). This reflects the importance of the exchange rate in local price determination, and the influence it can have on trade propensities. Over the past five years, the average Euro (EUR) prices of the various paper grades are shown in Table 13.
Paper grade 2001 2002 2003 2004 2005
Newsprint Range (EUR) 617-678 565-590 500-525 470-500 450-500 Average (EUR) 647.5 577.5 512.5 485 475 Uncoated A4 copy Range (EUR) 976-1037 945-1037 940-1020 840-890 730-810 Average (EUR) 1006.5 991 980 915 770 Virgin kraftliner Range (EUR) 534-572 574-612 547-612 400-470 400-470 Average (EUR) 553 593 579.5 435 435
Table 13. International paper prices over the past five years. Source: Provided by Hunt, 2005, upon request40.
40 Note that these are the only grades for which prices were available. No South African prices were available. The large jump for virgin kraftliner between 2003 and 2004 is ascribed to “a restating of 2004 figures”.

51
3.3. OVERVIEW OF WASTE PAPER RECOVERY MARKET
3.3.1. BASIC DESCRIPTION
As mentioned in Section 3.2, recycled paper is one of the inputs into the paper production process. A number of paper production processes, most notably tissue and corrugated papers, are heavily dependent on waste paper inputs, and increased waste paper usage can be seen as one of the opportunities for the development of especially the independent or non-integrated part of the industry. The discussion below aims to cast light on the extent, collection process and economic impact of the recycling industry.
3.3.2. THE EXTENT OF RECYCLING
According to the Paper Recyclers’ Association of SA (PRASA, 2004), recovered paper as a percentage of paper consumption was 51% in 2003, up significantly from recovery rates of 32% in 1992. Recycled paper was the basis for 39% of all paper produced in SA, while recovered paper comprised 65% of all recoverable paper in 200341. Recycling as proportion of paper consumption (51%) is what is commonly referred to as the national recycling rate. It compares favourably to those of developed countries such as the USA (50%) and the UK (49%) and outstrips the world-wide average of 48% (Hunter, 2004). The European average was however 53% in 2003 (CEPI, 2004), with countries like Germany, the Netherlands, and Switzerland achieving recycling rates in excess of 60%. Japan and Korea are also significant recyclers at more than 55% and 65% respectively (Jaakko Poyry, 2004).
41 Not all paper consumed/produced is available for recycling, as some get exported in the form of packaging and some (e.g. bathroom tissue) is not suitable for recovery. See Table 14.

52
Recoverable paper Tonnes Paper consumption (tonne) 1 906 849 Less paper exported as packaging of export products (tonne) 112 000 Less paper unsuitable for recovery (tonne) 305 096 Total recoverable paper 1 489 753 Recycling rates % Recyclable paper recovered as % of paper consumption 50.87% Recyclable paper used in paper produced in SA 38.58% Recovered paper as % of recoverable paper 65.11%
Table 14. Paper available for recovery and recovery rates in South Africa, 2003 Source: PRASA, 2004
3.3.3. THE RECYCLING PROCESS
As is evident from the above tables, “recycling” essentially consists of two phases: a recovery phase and a recycling phase. Recycling entails the conversion, in a paper mill, of recovered paper into other forms of paper/cardboard. Recovery, in turn, consists of collecting waste paper and then sorting, baling and transporting it to paper mills (Hunter, 2004).
Once at the mill, the recovered paper is cleaned (non-recyclable components are removed) and de-inked (some grades of recycled paper, e.g. cardboard, do not require de-inking). De-inking can be regarded as a “washing machine” process with repeated cycles to remove as much ink as possible42. Following de-inking, the recovered paper goes through a pulping process and is, according to the specifications of the paper grades to be manufactured, enhanced with “virgin fibre43”.
Recycled fibres are utilised in various intensities (from a few percent to 100%) in the manufacturing of tissue paper, newsprint, corrugating box papers and various other packaging grades. The paper properties of some grades (e.g. photocopy paper) dictate that they cannot use recycled fibre. Sappi’s total recycled paper
42 For de-inking, “fresh” paper is preferred as the ink is easier to remove. Thus unsold newspapers from the day before would be the first to be transported to the mills (Hunter, 2004). 43 Virgin fibre denotes any fibre that does not contain recycled fibre. That means that white recovered paper going into a pulp mill is also considered to be virgin fibre. Once processed into products that contain recycled fibre and then recovered again, it becomes recycled fibre (Hunter, 2004). For the purpose of this analysis, however, virgin fibre is considered to be only fibre stemming from logs.
53
intake, for example, is only about 10% to 20% of total fibre inputs at the moment. Although there is some room for increasing this rate, it is expected that the ratio will reach a ceiling at about 20% to 25% in terms of the specifications of the paper that they manufacture, as well as current technologies employed (De Jongh, 2004).
Depending on the process employed and the type of paper-output desired, wood fibres can be recycled between three and six times before they lose their strength and become unsuitable for recycling. The yield derived from recycled fibre depends on the grade of paper required and the production process used. According to the Sappi website (2004), 100 tonnes of waste paper is required to produce approximately 93 tonnes of recycled paper. Mondi Recycling, in turn, estimates 100 tonnes of recovered paper to deliver 87 tonnes of recycled paper (Hunter, 2004). The price paid for collected paper is determined by its quality and type (Pamsa, 2004a). Prices are subject to substantial fluctuations.
3.3.4. WASTE PAPER COLLECTION
Collection of recoverable paper takes place at two levels: pre-consumer and post-consumer. Pre-consumer recovered paper is collected from converters44 where waste paper is generated as part of the conversion process. Such off-cuts, trimmings and other uncontaminated waste from converting plants are highly valued as recovered paper (Pamsa, 2004). Added to that are inter alia unsold newspapers and magazines returned from outlets, as well as paper used for trial runs in newspaper and magazine printing.
Nationally, 202,000 tonnes (98%) out of the 207,000 tonnes potentially recoverable pre-consumer paper were recovered in 2003 (PRASA, 2004). Thus pre-consumer paper represents about 22% of total recovered paper. The high level of recovery can be ascribed to the compensation these converters receive for their waste paper.
The opportunity for expansion of the recovery rate thus lies at the post-consumer level. Post-consumer paper is collected via a number of channels. Firstly, businesses are signed up and provided by bins and waste paper is then collected from them by waste collecting agents or companies’ owner-truck-drivers45. Paper recovered from businesses (retail or wholesale outlets) totalled 513,000 tonnes in 44 Those manufacturers that convert “raw” paper rolls into sheets for newsprint, boxes for packaging, etc. 45 These operations are “outsourced” to previous employees as a means of empowerment, but also for cost-cutting purposes on the companies’ side. Generally, such truck-drivers now earn more than previously (Hunter, 2004).

54
2003 (55.6% of total paper recovery) and from offices the amount was 157,000 tonnes (about 17% of total recovery). There are also some paper banks, where large bins are provided to community institutions such as schools or charities. 2390 schools and charities participated in 2003 (PRASA, 2004).
Mondi is the only paper company that has a kerbside paper pick-up programme. Over the past eleven years, some 400,000 households in Gauteng and Durban have been provided with “Ronnie bags” and calendars of collection times. Owner-drivers then collect waste paper directly from households. The participation rate in this scheme is, however, only 4%, making it more a social responsibility initiative than an economically viable one. In 2003, some 50,000 tonnes of waste paper (or 5.4% of total recovered paper) were collected at the domestic level and it is evident from Table 15 that this is where the most room for improvement lies.
Category Total
consumption (tonne)
Collected (tonne)
% of total consumption
collected
Share in total
recovery
% of total consumption not collected
Pre-consumer Converters & allied industries 207,000 202,000 97.6% 21.9% 2.4%
Business (retail/wholesale) 628,000 513,000 81.7% 55.6% 18.3%
Offices 303,000 157,000 51.8% 17.0% 48.2% Post-consumer
Homes 243,000 50,000 20.6% 5.4% 79.4%
Table 15. Pre- and post-consumer recovery of paper in South Africa, 2003 Source: PRASA, 2004.
The most important post-consumer collection scheme is via so-called buy-back centres or depots, with informal hawkers supplying paper to these centres. Countrywide, there are 280 such centres in operation and this is the method through which most retail recovery takes place (PRASA, 2004).
Cardboard from retail outlets represent the biggest recovery source for these centres. Sites are identified that are in close proximity to recoverable paper supplies. The sponsoring company typically approaches the authorities to rent the land and then identifies an entrepreneur to run it. Depending on the company sponsoring the scheme, the entrepreneur is supplied with starting-up capital, bins, barrows for “loyal hawkers”, a scale, and a container-office. The hawkers collect paper and board and sell it to the entrepreneur, who, in turn, sells it to the company. The company then collects the recovered paper. Given the general trend

55
towards outsourcing, the tendency is for collection trucks to be owner-driven (Industry role players 2004, 2005).
Even though waste paper collection companies may advise the entrepreneur on suitable prices to pay hawkers, no price is enforced. The price paid tends to fluctuate in line with the fluctuating prices paid by the company to the entrepreneur, which, in turn, is determined by the supply and demand balance of waste paper. The entrepreneur has no contract to sell solely to a specific company, but is generally loyal in fear of losing his/her guaranteed market (Industry role players, 2004, 2005).
This informal collection system is unique internationally and to a large extent serves the same purpose as the more formal/institutionalised collection schemes in developed countries. Companies realise the social impact of the scheme and have no intention of discontinuing it in favour of more formal schemes. Indeed, there may be opportunities for expansion into the suburbs – to harness hawkers to collect paper from households where other initiatives fail. They could also be incorporated into envisioned schemes to involve municipalities in order to increase the household collection rate.
It thus seems that the market mechanism effectively regulates waste paper collection in South Africa to the benefit of the environment (less land fill) as well as society (schools and charities through paper banks and entrepreneurs and hawkers who would not otherwise have had a livelihood).
3.3.5. INPUTS
Labour is the largest input into the recovery of paper. Labour is however indirectly rewarded, rather than directly, as the collectors are paid for the paper they collect. Thus recycling companies’ biggest input cost is, actually, the cost of purchasing waste paper. Additionally, labour input is required for sorting and baling collected paper. There are also some direct transport costs involved. Even though much of transport costs have been converted into paper-purchasing costs by outsourcing transport operations to owner-drivers and then remunerating them per ton of paper provided, baled paper still needs to be transported to mills for recycling. Capital and overhead costs are also accounted for in the cost of sorting and baling.

56
Once at the mill, the recovered paper is the main input into the recycling process. To facilitate recycling, capital investment is required, as recycling calls for different technologies than the pulping of virgin fibre. Most pulp and paper mills were initially built to process virgin fibre, thus capital inputs are required to (partially) switch to recycled fibre and the cost of doing so to a large extent influences the capacity available for recycling. Once these technologies are in place, pulp manufacturing becomes much less costly from recycled fibre than from virgin fibre. The initial investment to establish a recycling-based mill is also much lower than that of a virgin fibre-based mill. The independent paper and tissue mills were built to accommodate recycling.
3.3.6. MARKET STRUCTURE AND CONDUCT
Market players. The recycling market is dominated by the buyers of recycled fibre. The main paper manufacturers (Sappi, Mondi, Kimberly-Clark, and Nampak) are, therefore, also the main recycling market players. In addition, a number of independent waste paper collection agents operate in the market, of which Remade is the biggest (they collect about 100,000 tonnes of waste paper per annum). In most cases paper manufacturers use the paper they recovered in their own integrated operations and sell excess capacity in the market (to paper mills without their own collection schemes). These integrated operations source their waste paper from entrepreneurs (who run collection centres) and who, in turn, are supplied by paper-collecting. The consumption of waste paper by various companies in 2003 is shown in Figure 3.
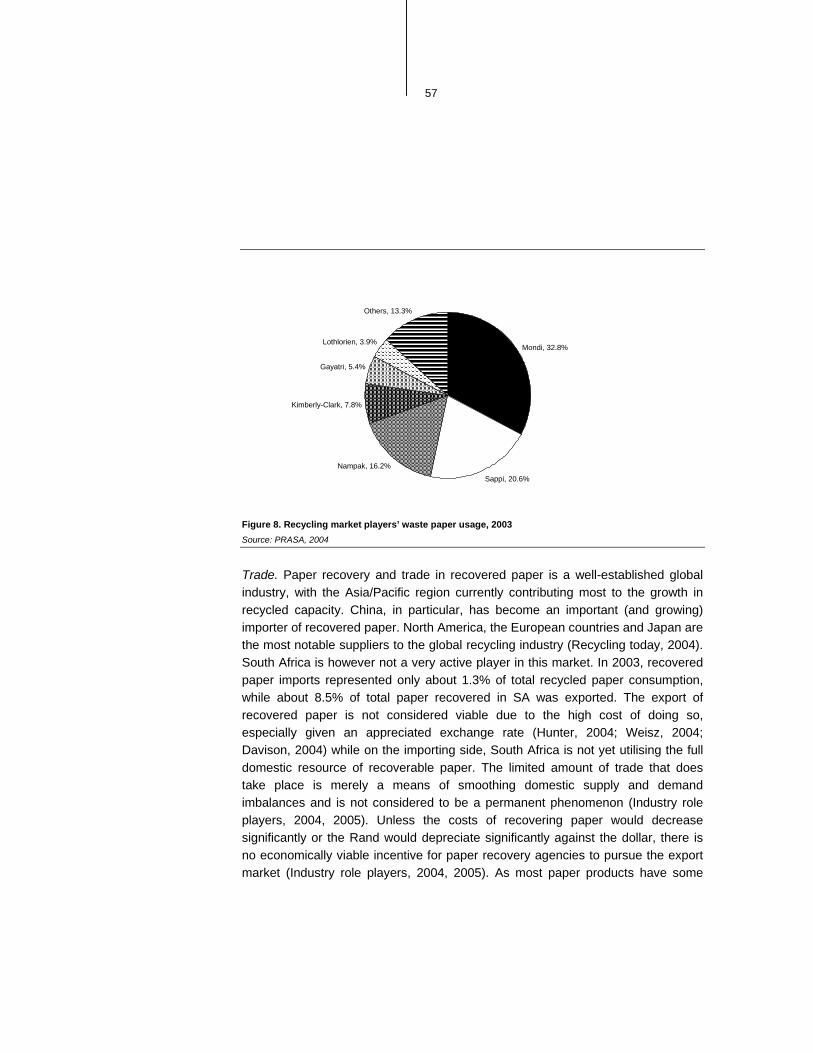
57
Figure 8. Recycling market players’ waste paper usage, 2003 Source: PRASA, 2004
Trade. Paper recovery and trade in recovered paper is a well-established global industry, with the Asia/Pacific region currently contributing most to the growth in recycled capacity. China, in particular, has become an important (and growing) importer of recovered paper. North America, the European countries and Japan are the most notable suppliers to the global recycling industry (Recycling today, 2004). South Africa is however not a very active player in this market. In 2003, recovered paper imports represented only about 1.3% of total recycled paper consumption, while about 8.5% of total paper recovered in SA was exported. The export of recovered paper is not considered viable due to the high cost of doing so, especially given an appreciated exchange rate (Hunter, 2004; Weisz, 2004; Davison, 2004) while on the importing side, South Africa is not yet utilising the full domestic resource of recoverable paper. The limited amount of trade that does take place is merely a means of smoothing domestic supply and demand imbalances and is not considered to be a permanent phenomenon (Industry role players, 2004, 2005). Unless the costs of recovering paper would decrease significantly or the Rand would depreciate significantly against the dollar, there is no economically viable incentive for paper recovery agencies to pursue the export market (Industry role players, 2004, 2005). As most paper products have some
Mondi, 32.8%
Sappi, 20.6%
Nampak, 16.2%
Kimberly-Clark, 7.8%
Gayatri, 5.4%
Lothlorien, 3.9%
Others, 13.3%

58
recycled fibre component, the present analysis will not attempt to separate trade in recycled paper from paper trade more generally, as discussed in Section 3.2.
Pricing mechanism. The price of recovered paper is determined by the buyers based on the demand for different grades of paper, versus the supply thereof. Thus, if paper production capacities remain constant (that is, demand for waste paper does not increase), but there is an increase in the amount of paper that is brought to depots by e.g. hawkers, the price thereof will decrease. Estimates of prices currently paid to collecting agencies range between R100 per tonne for mixed or “common” paper and R600 per tonne for white paper46, to R270 per tonne for corrugated containers and R250 per tonne for common mixed paper (Industry role players, 2004, 2005). As paper collecting agencies set the price in reaction to anticipated demand (in order to influence supply accordingly), prices can fluctuate considerably. From 2003 to mid-2004, for example, the price for recovered white paper increased from R800 per tonne to R2,300 per tonne (in reaction to anticipated increases in demand), before plummeting to about R600 per tonne (when these demand increases were not realised).
Cost structure. For a paper recovery plant, an estimate of the approximate average cost structure (per ton), given an average selling price to mills of R1000 per tonne, is as follows (Hunter, 2004):
• paper input cost: R500 • collection: R200 • sorting: R50 • baling: R100 • transport: R50 • overheads: R75
The residual is thus a small profit of R25 per tonne (about 2.5%). The relatively small profit margin can be explained by the fact that waste paper recovery is usually an integrated operation that is not run with the aim of making large profits47.
Within the pulp/paper mill, additional recycling-related costs are incurred. The recycling costs associated with the unique technologies and processes (e.g. de-inking) that are required, are, however, cancelled out by the fact that recycling
46 This is the price paid by collecting agencies to paper collectors (Industry role players, 2005). 47 Note that there are also a number of non-integrated, profit driven, waste paper collection companies. The above mentioned costs do not necessarily reflect their cost structures.

59
reduces the necessity to buy and process logs. Generally speaking, recycling costs are lower than the costs associated with manufacturing paper from virgin fibre. By 2003, capital investment to a total of R28 billion had been made in pulp and paper mills that are, to some extent (or fully), dependent on recycled fibre as an input (PRASA, 2004).
3.4. SALIENT FEATURES OF THE PULP, PAPER AND RECYCLING INDUSTRIES
This section will highlight the salient features of the pulp and paper industries that drive current market dynamics and are expected to shape the development of the industry going forward.
3.4.1. THE CONCERNS OVER THE INDUSTRY ARE NOT UNIQUE TO SOUTH AFRICA
The global pulp and paper markets are highly cyclical (moving from over-supply to under-supply) and vertical integration has been a successful protection measure against market volatility. Indeed, some analysts regard vertical integration as the single most pronounced characteristic of the industry. The cyclical downturn leads to “ever-tighter market control by the corporations large enough to survive the recession”, or, in other words, the consolidation of the industry (Jaakko Poyry, 2003)48. Volatility will thus impact on non-integrated operations (independent farmers, small growers). This raises caution over using plantations as a development option for small growers, as they will be exposed to price fluctuations.
Furthermore, the international pulp and paper market has a number of characteristics also witnessed in South Africa (Paperloop.com, 2005):
• The industry is characterised by increased job shedding due to automation.
• Increased regulation is increasing the cost of timber from developed countries and is fuelling the search for cheaper (and less regulated) international destinations.
• Internationally, the industry is characterised by out-contracting of labour.
The salient features of the global pulp and paper industries are discussed in Appendix H of the Technical notes and appendices (Part III of this report). 48 See Appendix I of the Technical notes and appendices (Part III of this report).

60
3.4.2. VERTICAL INTEGRATION AND HIGH BARRIERS TO ENTRY IMAPCTS ON COMPETITION IN THE PULP AND PAPER MARKET
One of the clear findings of this analysis is the fact that the pulp and paper industry is characterised by vertical integration, substantial barriers to entry and import parity pricing. Although the issue of import parity pricing has been raised as a competitive concern, this analysis suggests that import parity pricing is not a problem in itself but that high barriers to entry combined with vertical integration may impact on the competitiveness of the market, which then allows for impact parity pricing. This corresponds with the findings of the Competition Commission. In an analysis conducted in 2004, the Commission found that although import parity pricing may contribute to anti-competitive behaviour49, it is not a problem in itself as there is no predictable link between these behaviours.
The information available and the scope of this study did not allow for a complete analysis of competitive dynamics but the following can be noted.
Pulp and paper firms are integrated from nurseries and plantations to final paper production. Although to a lesser degree, vertical integration is also a feature on the solid wood processing side of the value chain. These two components of the value chain, however, operate differently and considering these differences provides insight into the functioning of each market and the impact of vertical integration and barriers to entry on competition.
Pulp and paper. As illustrated in the analysis, the pulp and paper component is dominated throughout all components of the value chain by two firms resulting in substantial buyer concentration in the various components. In addition, the pulp and paper market is characterised by high barriers to entry due to the capital intensive nature of the industry (and, therefore, the scale of production required), limited fibre inputs available (particularly on the open traded market), the extent of vertical integration and outputs are explicitly priced at import parity.
With the opening up of export markets for fibre, the power resulting from the above characteristics were substantially undermined, but is still dominant in the domestic market (as is clear from the fact that output parity pricing can be practiced). In explaining why domestic pulp producers cannot compete with the prices offered,
49 According to the South African Competition Commission (2004), import parity pricing may affect competitiveness in three ways: collusion to fix a price, excessive pricing, or prohibited price discrimination.

61
the industry argument is that the Japanese export market is an anomaly and the high prices paid for fibre is ascribed to implicit subsidies provided by their government. Although a full analysis of the Japanese situation was not possible in this analysis, our preliminary analysis could not uncover any evidence of such subsidies. In addition, it was revealed that chip imports are not unique to the Japanese market and that several countries supplement their own fibre supply through chip imports. The argument that Japanese buyers can only recover transport costs because they are subsidised does, therefore, not hold unless all chip import countries subsidise pulp production. The tentative conclusion (pending further evidence on the functioning of this market) is that the market price offered by the Japanese buyers is a reasonable measure of the international market price of the fibre.
In addition, if the Japanese price was, in fact, as high as suggested, this would suggest that even the pulp and paper producers (who are integrated with their plantations) would benefit from exporting some of their fibre (beyond what is necessary to maintain the capital investment) rather than expand their domestic production capacity. From 1992 this was the case for Mondi through the Silvacel chipping mill, but only a small proportion of fibre was exported. It was, therefore, part of an expansion strategy (building up plantations before expanding pulp capacity and exporting excess fibre in the mean time) than an explicit strategy to utilise the high Japanese price (although the price was certainly a bonus). In addition, Mondi is in the process of expanding their domestic pulp production capacity and will redirect any chip exports to supply the additional capacity. Internally, therefore, Mondi has made the decision that the international prices are not high enough and that they can ‘afford’ to direct the fibre to domestic pulp production.
Solid wood processing. The solid wood processing side of the value chain is also categorised by vertical integration between plantations and timber board plants or sawmills. However, the extent of market concentration is much lower and import parity pricing is not achieved.
Even though timber board firms may have market power for particular product categories, these products are quite substitutable (with, for example, other timber board products) and the firm in question does, therefore, not have pricing power. In addition, the barriers to entry are not near that observed in the pulp industry (lower capital investments are required, fibre is sourced from plantations as well as waste

62
from other wood processing operations, plants can be operated efficiently at lower levels of production, etc.). In the case of sawmilling, the concentration levels are substantially lower.
The conclusion drawn from the above is that vertical integration per se is not a problem for competition but, if combined with market concentration in particular sectors, it enforces the market power of the integrated firm. Furthermore, it confirms that the ability to price at import parity is simply a symptom of the underlying competitive dynamics in the market. It must be noted that although the above illustrates possible market power issues, it is not sufficient to justify anti-competitive concerns. Based on a review of the international market, it is clear that vertical integration is not unique to South Africa and is one of the most important characteristics of the international market. In addition, the market is quite volatile and vertical integration has been one of the few successful strategies for firms to protect themselves against the impact of such volatility. A more detailed analysis will be required to conclude on the competitive dynamics.
3.4.3. THERE ARE LIMITED OPPORTUNITIES FOR NEW ENTRY/EXPANSION REQUIRING VIRGIN FIBRE
Even in the absence of the above-mentioned issues around vertical integration, natural barriers in the form of a limited virgin fibre base may only allow a limited number of pulp and paper (particularly virgin fibre-based paper) operations in South Africa.
It is estimated that at least 60,000 to 70,000 ha of pulpwood plantations would be needed to make the assembly of a new pulp mill viable (Industry expert, 2005). As current estimates are that about 40,000 ha will be available for new pulpwood afforestation in KwaZulu-Natal, and about 60,000 ha in the Eastern Cape, of which DWAF (2004f) estimates that only 25,000 ha will be pulpwood, it is thus unlikely50 that there will be enough fibre resources to make a new pulp mill feasible.
It is however expected that new afforestation, as well as yield improvements, may enable existing mills (such as Sappi Saiccor) to expand production. Though no concrete steps have been taken, companies have indicated that they are considering plantation expansion in SADC and that such plantations could be a
50 Because all of these fibre sources are unlikely to be within the acceptable distance of a single pulp mill site, it is unrealistic to expect that there will be sufficient fibre for a new pulp mill.

63
source of fibre for expansion in South African mills. This issue is discussed as a growth opportunity in Section 12 of the main document (Part I of this report).
3.4.4. LIMITED AVAILABILITY OF SKILLED LABOUR WILL HINDER GROWTH
Scarcity of skilled labour is an issue in both the pulp and the paper manufacturing sphere. Though government’s SETA (Sector Education and Training Authority) system tries to address the general skills shortages characterising the South African economy, industry feels that the SETA system is sometimes undermined by its bureaucratic nature. The pulp and paper industry is one of the chambers represented by FIETA (Forestry Industry Education and Training Authority). As no national qualification is applicable specifically to the pulp and paper industry, it is difficult to register “learnerships” (a learnership is an in-service training programme that, according to its official definition, needs to lead to the attainment of a qualification). The pulp and paper industry, under the auspices of Pamsa, has thus made a unique initiative in which it developed a Ladder of Education and a manufacturing-specific national certificate qualification that is registered with the Department of Education. A five-year project has now been launched to train 500 non-employees and 300 to 400 current employees on pulp and paper plants in South Africa. Though it has taken the industry two years to design this system, they feel satisfied that they are being pro-active in addressing the skills scarcity problem (Truelock, 2005).
3.4.5. COMPLIANCE TO WATER QUALITY REGULATION IS A PREREQUISITE TO GROWTH
An overview of the various pieces of legislation impacting the pulp and paper industry, such as environmental legislation on air emissions and solid waste disposal, as well as labour-related legislation, is given in Appendix J of the Technical notes and appendices (Part III of this report). Though all of these regulations in some way impact the policies, procedures and finances of the industry, discussions with industry role players and DWAF officials have revealed that the single biggest regulatory issue facing the pulp and paper industry and informing its future is that of water quality.

64
Under the National Water Act of 1998, a pulp or paper mill is a listed activity that requires an integrated licence for water abstraction, storage, and discharge51. The rationale for the latter comes from Section 21(g) of the NWA, as pulp and paper mills can be regarded as “disposing of waste in a manner which may detrimentally impact on a water resource”. DWAF aims to implement (within the next three years) a waste discharge charge consisting of a basic monitoring charge, as well as a mitigating charge and an effluent-quality related charge. Such a quality-based charge will serve as an incentive for companies to reduce effluent discharges by as much as possible. As effluent is the pulp and paper industry’s most significant environmental impact, standards are likely to become stricter into the future. Waste discharge charges have not been implemented yet, as they are still under revision by the Waste Discharge Charge Steering Committee (on which industry is also represented). The aim is to set charges that will not be high enough to make a company bankrupt, but will nevertheless be harsh enough to change waste disposal behaviour (Herbst, 2004; Scotcher, 2004).
The contested issue does, however, not lie with the charges paid by industry, but with compliance to standards. According to DWAF (Herbst, 2005), there have been certain water quality standards in place since the National Water Act of 1956, but industry has always been issued with exemptions to these standards, based on certain conditionalities52, and has thus never complied. As international market and certification pressures mount for companies to comply with national environmental and water laws and standards, South African industry has come under pressure to achieve cleaner production. DWAF has also, since the National Water Act, taken the stance that it will no longer tolerate non-compliance, and will discontinue issuing exemptions. In this regard, each mill now has an “Integrated Water Management Plan”, in which the water quality impact of the mill is made explicit, and mitigatory measures, associated with a specific implementation time frame, must be stated. As mills’ water licences come up for renewal for the first time since 1998, the issue of compliance and standards is becoming highly contested.
Industry argues that the standards set, in some cases requiring zero effluent, are too strict and that the technologies do not exist, locally or internationally, to achieve these standards. Furthermore, it is argued that government does not take the
51 If a mill does not source its water from a river, it pays municipal charges for its water use, as regulated under the Water Services Act (Act 108 of 1997). It will also pay the municipality to remove its effluent. The worse the quality of the effluent, the higher the charges will be – which also serves as an incentive for mills to reduce their environmental impact. 52 DWAF claims that these conditionalities (e.g. permission to irrigate effluent, provided that it is a temporary solution until effluent can be treated in such a way as to remove all pollution) have not been met by the industry (Herbst, 2005).
65
trade-off between development (and associated job creation and social impacts) into account when setting its environmental standards and that the industry plays an important economic role in poor communities. It is also argued that the South African industry compares favourably with the effluent levels of even industrialised countries (Industry role players, 2004, 2005).
DWAF, however, stands firm that they are not willing to compromise the environment by considering any type of trade-off and that, if the industry cannot find a solution to its current pollution problems, government cannot allow it to expand. It is also not impossible that existing mills will be forced to shut down, should they be unable to show how they will, within a reasonable time frame, achieve the environmental standards set (Herbst, 2005). With regard to the comparative level of international standards, the argument is that, as a semi-arid country (concentration of pollution in a river is higher than in a water abundant country), South Africa cannot be compared with other, more water-abundant countries such as those in Europe (Herbst, 2005).
As an integrated water licence is needed for any expansion, industry and government have reached an impasse regarding the water quality issue. Without going further into the details of the debate (see Appendix J of the Technical notes and appendices - Part III of this report - for a more in-depth discussion of industry’s objections to the regulations), or attempting to take a view on the matter, the aim of this analysis is to highlight the issue as one of the most pressing salient features of the industry. Even given fibre availability, efficient production and ample skilled labour, the industry will not grow, and may even be forced to scale down, if a solution is not found or some compromise is not reached on this matter.
3.4.6. RECYCLING IS THE BASIS OF ALMOST 40% OF PAPER PRODUCTION’S CONTRIBUTION TO GDP
The 922,000 tonnes of paper recovered in South Africa in 2003 represented 39% of total paper production. Thus the revenue, remuneration of labour and taxes stemming from about 39% of paper production can be deemed recycling-related, rather than virgin fibre related. As fibre can only be recycled a few times, and most paper is made with some virgin fibre component, the recovery of paper itself is however indirectly dependent on virgin fibre. The contribution of recycling to the economy will be included in the assessment of the pulp and paper industry.

66
3.4.7. PAPER RECOVERY REDUCES THE ENVIRONMENTAL IMPACT OF PAPER PRODUCTION
The air emissions of a recycling based paper manufacturing process is up to 70% lower than that of a purely virgin fibre based pulp and paper production process. Additionally, it consumes 50% less water and 40% less energy. Every tonne of paper recovered is also said to reduce land fill space by 3 m3 and to replace 17 trees in paper production53 (PRASA, 2004).
3.4.8. WASTE PAPER COLLECTION AS A STEPPING STONE TO VALUE ADDED PRODUCTION
An interesting phenomenon world-wide is that many companies that started out as waste paper collectors have progressed up the value chain to pulping of waste paper and, ultimately, paper production. This implies that waste paper collection, apart from the social and environmental benefits associated with it, can also be regarded as a relatively low-investment entrant activity that can over time become a stepping stone to industrial expansion and beneficiation and provide opportunities for empowerment. The two most prominent examples of this phenomenon in South Africa are Lothlorien and SA Paper, both of which started as waste paper collectors and now run paper mills with capacities of respectively 15,000 and 8,000 tonnes per annum.
Collecting about 100,000 tonnes of waste paper per annum (mostly old corrugated boxes) Remade is currently the largest non-integrated waste paper collector in South Africa and is the sole supplier to Sappi Waste Paper in Gauteng. They are in the process of initiating a capital investment of several hundred million Rand in order to start pulping waste paper into a “ready to use” format for paper mills, with a long term vision to move into paper manufacturing themselves.
Box 3. BEE opportunities in recycling: waste paper entrepreneur A.B. Cheche A.B. Cheche lost his job in 1988. After searching without success for more than a month for a new job, he decided that he needed to generate his own income. He had a (very old) bakkie and decided to use it to start collecting waste paper.
53 If the 922,000 tonnes per year of recovered paper is multiplied by 17, it seems that an additional 15.67m trees would have been needed to be harvested annually to meet paper demand, had there been no recycling. Assuming an average stand density of 1200 trees per hectare (Van Zyl, 2005), this translates into 13,062 ha per annum that would have needed to be harvested in the absence of recycling. For that area to be harvested, an area about 8 times that size needs to be planted. Should the 17 trees per tonne estimate be correct, it thus means that recycling seriously impacts on the scarcity (or lack thereof) of wood.

67
16 years later, he now has three bakkies and employs 10 people. He has agreements with shops and collects paper on a weekly or twice-weekly basis from his “regular suppliers”. He has since registered his business and expanded it to scrap metal as well. It is now known as A. Cheche & Sons Waste Paper and Scrap Metal.
A.B. feels that an informal collector (or he as a now-formalised, ex-informal collector) is very vulnerable to price fluctuations in the waste paper market (caused by supply and demand imbalances). He currently supplies to PC Waste, as he regards them as paying the highest price. He stays informed about the prices offered by e.g. Mondi, Nampak and Kimberly-Clark. He collects mainly old corrugated boxes, for which he can currently get 15 cents per kilogram (or R150 per tonne). For (white) office paper he currently gets 70 cents per kilogram (about R700 per tonne). (This roughly corresponds to the prices quoted by the industry). Before the slump he however received up to R2/kg (R2000 per tonne) for white paper. The fall in prices has left its mark on his business: he used to employ 25 people, but was forced to let 15 employees go.
3.4.9. INCREASED UTILISATION OF WASTE PAPER PRESENT OPPORTUNITIES FOR GROWTH
Under the conditions of limited opportunities of expansion in virgin fibre base mentioned above, the use of recycled fibre provides increasingly viable opportunities for expansion. Current information suggests that particularly independent paper manufacturers will continue to exploit the production of brown paper and tissue grades as a growth vector and will tend to become more integrated with conversion activities. The expansion of the recycling rate can, therefore, positively influence the growth path of the industry even in the absence of significant virgin fibre supply growth.
The recycling rate, and the growth thereof, is dependent on the balance between supply and demand of recovered paper. The supply of recovered paper is embodied in the collection rate (that is, the percentage of used paper collected for recycling each year). The real room for improvement in collection lies at the household and office level, and there is also still some scope for increasing recovery from retail and wholesale businesses. Currently, the market is however characterised by an over-supply.
There are also demand-dynamics influencing the rate of paper recovery in South Africa. The demand for recycled fibre is directly linked to the demand for paper. It seems that, given current technologies employed in mills, there is not much scope for increasing the recycled component of paper, as the “recipes” for various grades of paper are determined by the type of output required. For the demand for recycled fibre to increase, the number of mills utilizing waste paper or the capacity of existing mills thus needs to increase (that is, more paper needs to be produced
68
annually), which in turn is dependent on the per capita consumption of paper in South Africa.
As the interaction between demand and supply determines price, there is a perception in the industry that, should demand for recovered paper increase, pushing up the price, the supply thereof will increase accordingly (Interviews with industry players, 2004, 2005).
The role of the state in an improved recycling rate, if it is at all necessary, will be on the supply side. There is no government legislation/regulation pertaining to recycling and no municipality initiatives on the post-consumer side (with regard to e.g. separation at source) as yet. The industry however feels that there is room for cooperation with government/local authorities in order to promote recycling, should the demand for recovered paper increase. Rather than legislation per se, PRASA (Hunter, 2004) regards the targeting model employed in the UK as a possible solution to the low household recovery rate. In such a model, government would engage with the recycling sector (rather than trying to operate recovery itself) and set targets for reductions in land-fill to municipal collection authorities who already have the infrastructure for collection. The achievement of such targets will then be tied to financial rewards, thereby creating the incentive to organise households, at local level, to separate waste at source, which can then be supplied to waste paper collectors. The paper thus collected will be cheaper, and export could become more of a reality.
Should such regulations however cover the part of the market currently serviced by informal hawkers, the social impact of formalising the waste paper collection industry can be severe and it could be a case of unnecessary intervention where there had previously been no market failure. Some industry players feel that the current system of privately managed monetary incentives for recycling is working well, and that it would lead to unnecessary administrative costs and social inefficiencies if the state were to try and take over this role. Rather, they foresee a continuation of the current market-driven system, but with the waste paper collecting industry benefiting from some kind of minor consumer or industry tax in order to better enable them to absorb the fluctuations in the market and bring stability to the industry and the people deriving their incomes from it. Alternatively, on the demand side, the state could bring more stability to the market by encouraging the manufacturing industry that uses waste paper.

69
4. WOOD CHIP EXPORTS
4.1. BASIC DESCRIPTION
The export of wood chips is a controversial market in South Africa. On the one hand it has successfully broken the pricing oligopsony of the large pulp plants in South Africa and by doing this has achieved higher prices for plantation owners. On the other hand, however, it represents the export of a primary commodity where little beneficiation has taken place. It, therefore, represents a loss of value to the country in terms of the potential additional beneficiation that may have taken place.
In addition, the circumstance of this market is also quite unusual. To date, its existence has been based on a single international buyer market, Japan, which has created a very efficient shipping transport system through which it can transport wood chips over large distances cost effectively. Japan is the largest importer of wood chips internationally and source imports from various countries.
The result of this is that non-integrated54 South African plantation owners can obtain greater benefits by selling their products to Japan than by selling to domestic pulp and paper companies. Domestic pulp and paper companies suggest that woodchip trade with Japan makes sourcing additional fibre too expensive for them and that they are unable to match the price paid by the Japanese mills. Of course, this is influenced by numerous factors such as the exchange rate and the price of paper.
In this section, the wood chip sector’s contribution to the South African economy is evaluated quantitatively and qualitatively. The above contradictions and trade-offs are evaluated in the context of the existing fibre market in South Africa. Although the overall context of chipping will be discussed as a basis, the discussion will focus on the wood chips that are exported or sold in the open market (i.e. not those that are part of integrated pulp and paper operations). This also applies to the quantification of value added. The value generated by the integrated chipping operations is included in the discussion of the pulp sector.
Wood chipping is the first stage of processing in both mechanical and chemical pulping in South Africa, but also exists in a separate capacity for the export market.
54 Not tied to one of the processing companies.

70
Wood chip exports are often used as part of an expansion process. Due to the large capital requirements of pulp and paper mills, the wood resources (plantations) are established first, followed by some beneficiation through chipping for export. This allows time for the plantations to come to sufficient scale before capital intensive beneficiation plants such as pulp mills are constructed.
This process can, for example, be seen in the development of NCT’s local chipping mills and the subsequent feasibility study being done to set up a pulp mill at Richards Bay. In NCT’s case, chipping was, in the first instance, used to secure higher returns for the fibre55 produced by members, but also formed part of a larger plan of extending beneficiation (which, of course, will also be used to increase returns to members, but it will also reduce the risk for members). Before chips were exported, the only buyers of hardwood fibre were the large pulp and paper mills, which owned substantial plantations of their own and could, therefore, dictate the price paid for additional fibre required (over and above their own fibre production). In addition, the plantation owners did not benefit from profits made on beneficiation by pulp and paper mills. Through the export of chips and the cooperative nature of NCT, plantation owners receive a higher price for their fibre (exports) and benefit from limited beneficiation (share in profits as chipping plant is owned by members). The first mill (CTC) was established in 1970.
Woodchip trade, however, is not restricted to non-integrated organisations in South Africa. Mondi uses the Silvacel chipping plant as an outlet for excess (over its pulping capacity) roundwood while it is expanding pulp processing capacity. Chip exports are attractive due to the high dollar prices paid for chips by the Japanese market and the relative weakness of the Rand against major currencies over the last decade. It is expected that the current strength of the Rand, as well as the internal re-organisation of Mondi and Sappi, will result in a potential diversion away from exports to local beneficiation.
Although it is intended to form part of a medium term beneficiation expansion strategy, the particular characteristics of the main buyer, Japan, and the resultant high price paid for chips may result in the extension of domestic beneficiation being postponed longer in favour of chip exports. This may to some extent be offset if the recent strength of the Rand persists.
55 In the late sixties differences developed between private timber growers and processors. This led to discussions with the Japanese, and CTC was established in 1970.

71
4.2. MARKET PLAYERS
There are: one mechanical, seven chemical and one dual mechanical and chemical virgin fibre pulp mills in South Africa; all with their own chipping facilities. All of the wood chips produced by these chipping operations are used solely by the mills and are not sold or exported on the open market. In addition to these vertically integrated chipping operations, there are four chipping operations that are not directly tied (although some of them are owned) to pulp mills and are currently exporting their full production. These mills are shown in Table 16 and will be the focus of the discussion.
Chipping plant Location Ownership Capacity (BDT p.a.)56
Share of RSA exports
Silvacel Richards Bay Mondi: 100% >1,240,000 43.0% ShinCel Richards Bay NCT: 45%; ShinCel Directors: 55% 434,000 14.2% CTC Richards Bay NCT: 74%; TWK: 26% 1,488,000 42.7%
NCT Durban Wood Chips Durban NCT: 75%; Zululand Chip Manufacturing Consortium: 25% 223,200 -57
Table 16. Chipping plants, ownership and capacity (2003) Source: Genesis Analytics research
The above ownership details provide an interesting picture. The dominance of Sappi and Mondi does not extend into the chipping market. The timber co-operative NCT is the largest player and has shares in three chipping plants and through these plants secures competitive prices for its members. The second largest chipping plant (Silvacel) is owned by Mondi. However, Mondi is in the process of expanding its pulping capacity and will in future increasingly divert fibre from exports through Silvacel to its pulp mills in South Africa58.
56 BDT stands for bone dry metric tonne, and is equivalent to air dry tonnes (ADT) minus moisture contained in the wood. BDT is used as the unit for trade transactions, whilst ADT is normally used for commercial purposes in South Africa. Conversions from ADT to BDT were made using the eucalyptus conversion ratio and not a weighted average of the wattle and eucalyptus conversion ratio. The weighted average could not be used since the proper proportions of timber specie inputs were unknown. Consequently, the conversion ratio of the assumed dominant input, eucalyptus, was used. 57 NCT Durban Wood Chips exported their first shipment (30,000 ADT) to Japan at the start of 2005. 58 See Mondi (2005).
72
4.3. FIBRE INPUTS
The major inputs into the chipping process are timber, electricity and machinery. Timber, exported as woodchips, is obtained from a number of sources:
• NCT members: NCT produced 1.48m BDT of wood in 2003; of which 75% was exported (70% through the CTC and ShinCel59 chipping plants and 5% as unprocessed roundwood to various international destinations60). The remaining 25% is either sold to domestic pulp plants or to the pole, mining timber and other markets61.
• Mondi: Mondi provided roundwood in excess of 1.24m BDT for wood chipping operations at Silvacel in 200362.
• TWK: If it is assumed that TWK provides the remainder of the roundwood required at CTC63 (of which it is part owner), the firm provided approximately 576,600 BDT of roundwood for woodchip production in 2003.
• Other sources of timber inputs could include independent medium-sized and small grower farmers. Limited information is available on these farmers as source of timber inputs (their position in terms of plantations and estimated production was discussed in Section 2.2). In terms of wood chips, they could possibly supply the various woodchip plants with up to 210,800 BDT of roundwood for the export market64. However, it is more likely that the independent farmers provide less than this figure, and that TWK and possible Mondi and Sappi account for some of the remaining roundwood inputs.
59 NCT Durban Wood Chips processed their first shipment to Japan in early 2005. Since most of the data was obtained for 2003, NCT Durban Wood Chips were not included in most of the analysis. 60 This is surprising, given the impact of the appreciation of the currency on the rest of the industry. 61 NCT 2003b. 62 According to Mondi’s website, this will change with the capacity expansion currently implemented at the Felixton and Meerbank mills. Following the expansion, Mondi will move to integrate the resources of the chipping mill with its pulp and paper mills, which means diverting it away from exports to local use. 63 The proportion of wood provided through independent farmers is unknown; the figure presented here is based on assumptions discussed in this section. 64 This figure was calculated by subtracting the overall roundwood inputs with the known sources of origin, coupled with the assumption that TWK provides the remaining roundwood for the CTC plant. For instance, CTC produced 1.4million BDT in 2003. Of this, NCT provided 818,400 BDT of fibre. If it is assumed that TWK provides the only other inputs; the remaining inputs amount to 576,600 BDT. The figure reports the difference between the production figures and the known inputs. In other words, it presents the unknown sources of timber inputs.

73
4.4. MARKET DEFINITION, STRUCTURE AND CONCENTRATION
In this section the market is defined and discussed in terms of the domestic and international markets. Further, the structure and level of concentration is also evaluated in an attempt to provide a background and understanding of how the woodchip market functions and the impact thereof on South Africa.
Market definition: Considering the market for exported hardwood chips only, may be artificial and misleading, as it forms part of the broader market for pulp fibre. It can, furthermore, be argued that pulp fibre, in turn, forms part of the broader fibre market (including sawn timber) as fibre is, to a limited extent, tradable between the two management objectives. For the purpose of this discussion, however, it is assumed that the market for sawn timber and pulp fibre are separate and that, due to the time taken to switch between these two objectives, production cannot be easily switched. In addition, South Africa does not currently export softwood chips65 (i.e. softwood is used in integrated operations of pulp and paper mills and are only traded when sawmill softwood waste is sold to pulp and paper mills), and as such the focus of this section is on hardwood chips.
Two distinct markets for hardwood chips/fibre, that contradict each other in terms of their operation and structure, can be defined.
Domestic market: Mondi and Sappi are the only domestic buyers of virgin fibre for pulping in South Africa. As the domestic pulp mills have their own integrated chipping operations in the pulp production process and do not purchase any hardwood chips66 on the open market (domestic or international), there is no explicit domestic price or market for hardwood chips. This; however, may change if the current currency trend (appreciating Rand) continues, which erodes the profitability of the dollar denominated chip export market. If the currency appreciates to such an extent that exports become unprofitable, chip mills may sell their produce in the domestic pulp market. As with other forms of wood production, transport is a major cost factor setting the distance limits over which roundwood or chips can be transported for further processing.
65 Woodchip exporters noted that softwood is not exported since a secure and sufficient supply of softwood to chip cannot be procured. 66 These firms do purchase hardwood in the open market but not in chipped form. As noted earlier, some softwood chips are purchased from domestic sawmills.
74
International market: Contradictory to the transport cost constraints mentioned for the domestic market, South Africa exports wood chips to Japan and a small amount to other nations in the Pacific Rim (Mondi 2003:10). Japan has limited local hardwood fibre resources and imports approximately 88% of its hardwood fibre requirements67 (Flynn 2004). In order to do this cost effectively, a large fleet (100) of specialized freight ships have been developed that specialise in the transport of wood chips. These ships have been customised to allow highly efficient transport of chips. The mechanisation of loading and unloading woodchips has also reduced costs. In addition, Japanese pulp mills had to improve efficiency to absorb the transport cost, which means that the cost of paper produced out of this process is not substantially higher than imported paper. Allegations have been made of implicit government subsidies provided to the Japanese pulp sector. This study could not find any specific evidence of such subsidies.
Trade: South Africa exported approximately 3m BDT of hardwood chips in 2003, with approximately 98% going to the Japanese market (Japanese Import Statistics, August 2004 and Mr. Satoshi Ishikawa, 2004). This consisted of both wattle and eucalyptus, with a split of 30% wattle and 70% eucalyptus (LHA, 2004:13 and Mondi 2003:18). No softwood chips are exported to Japan from South Africa68, however, Japan purchases softwood chips from countries such as Australia, USA and New Zealand. Additionally, the domestic Japanese plantation market provides approximately half of Japan’s softwood chip requirements (Flynn, 2003, 2004). Only a limited amount of hardwood chips are produced in Japan and Flynn noted that the hardwood chips produced in Japan are declining.
Hardwood chips from South Africa have to match Japanese standards, and are screened to ensure that the chips conform to the dimensions required by the Japanese pulp mills. Woodchips that do not conform to the Japanese standards are still exported; however, lower prices are paid to producers for woodchips of a lesser quality.
Buyers of South African Woodchips: Japanese buyer groups in South Africa are represented by three trading houses that buy chips directly from the four chipping 67 This calculation is based on hardwood chip supply data given in cubic meters. 68 The reason for this is that a secure and sufficient supply of softwood to chip cannot be procured. Contradictorily, Crickmay and Associates (2004b:3) reports that South Africa has an excess supply of short rotation softwood pine. Unfortunately, this contradiction could not be resolved due to the timeframe of the study.

75
plants. In total, four buyers of South African woodchips, including the Koreans, have been identified. They are:
• Sumitomo Corporation: Purchase woodchips from CTC. Sumitomo Corporation will also be the sole purchaser of the woodchips produced by NCT Durban Woodchips.
• Itochu Corporation: Purchases woodchips from SilvaCel.
• Marubeni Corporation: Purchases woodchips from SilvaCel and ShinCel.
• Korean firms: Purchases woodchips from Silvacel.
From Table 17, it is clear that the Japanese firms purchase most (98%) of the woodchips produced in South Africa.
Trading Company Share of RSA Woodchip Exports Sumitomo Corporation 42.7% Marubeni Corporation 40.7% Itochu Corporation 14.2%
Korean Firms 2.3% Table 17: Trading Companies Share of South African Woodchip exports Source: Genesis Analytics research
The South African supplier/Japanese buyer relationship appears to be close knit, with three out of four mills69 only supplying woodchips to a single Japanese trading house (see Table 18). This relationship may become a short term hurdle if re-allocation of export woodchips to South African pulping operations is viewed as a priority. These relationships are cemented with three year contracts, which are often extended for longer periods. This is reflected in the long-term relationships between firms such as NCT and the Sumitomo Corporation, which commenced in 197070. Another driver of the supplier/buyer relationship may be the need of the independent South African fibre producers to remain unconnected from the local buyers. At the same time, however, the longevity of current agreements has primarily been a factor of pricing rather than particular loyalties or contractual
69 Note that NCT Durban Woodchips will be selling 100% of woodchips produced to Sumitomo Corporation. 70 See NCT 2005.

76
arrangements. If other buyers are willing or able to compete on prices paid by the Japanese market, they will be able to gain access to these resources.
Woodchip Mills Buyer Quantity (BDT)
CTC Sumitomo 1,302,000
Shincel Marubeni 434,000
Silvacel Itochu 434,000
Silvacel Marubeni 806,000
Silvacel Korean Firm 70,000
Total 3,046,000
Table 18. Woodchip Mills and Buyers of woodchips for 2003 (BDT quantities) Source: Genesis Analytics Research
In addition to Japan, it is expected that China may emerge as a potential buyer of South African wood chips in the future. Although China may not emerge as a substantial buyer in the near future71, it is unlikely that the international demand for wood chips will decrease. In addition, an increased demand for South African fibre may also be driven by the high level of certification achieved and the fact that all South African fibre is sourced from plantations rather than natural forests. The extent of the demand for South African fibre will depend on the amount of pressure placed by international pressure groups, on paper producers, insisting on sustainable fibre source production and certification. The impact on domestic prices and demand for fibre is, therefore, expected to continue and, possibly, to increase.
Box 4. The global market for wood chips Flynn (2003, 2004) identifies a number of woodchip import nations who can be said to comprise the global market for woodchips, both softwood and hardwood. In the Pacific Rim, woodchip import nations include Japan, Taiwan, Korea, China and Indonesia. Additionally, European nations such as Spain are expected to increase their demand for woodchips, and the USA also imports hardwood chips.
Japan is currently the major buyer of wood chips internationally. Various trading houses buy fibre for Japanese pulp production from a number of international sources. Based on the latest import statistics to Japan, some of these sources are (transport time to Japan in brackets):
• South Africa (25 days) • Brazil (37 days)
71 Some local chip exporters have investigated the Chinese market and have indicated a willingness to export chips to China if it became financially feasible.

77
• Chile (33 days) • United States (33 days) • Australia (Tasmania: 16 days, Western Australia: 14 days) • South East Asia (6 to 7 days)
South African wood chip operations, therefore, compete with these nations. Due to increased pressure on pulp mills to source fibre from plantation forests (rather than natural forests), it is expected that the demand for South African wood will persist. In 1990, approximately 15% of Japanese hardwood chips were sourced from plantations; however, this increased to approximately 55% in 2002. It is estimated that by 2010, only 10% of Japanese hardwood chips will be sourced from natural forests (Flynn 2004). Despite the apparent efficiencies developed through specialised wood chip transport ships, transport remains a major component (30% to 40%) of the price at mill of imported fibre. Prices are set at shipping port in order to achieve the same price at mill. This means that destinations that are further away from Japan, will receive a lower price for their fibre. Note that, even with the transport costs involved, Japanese buyers pay more for woodchips than the domestic market is willing or able to pay.
China as the emerging buyer. In future, competing demand for fibre is expected to arise from countries such as China and Thailand. China is in the process of constructing a number of pulp and paper mills, but do not have sufficient fibre sources domestically (Flynn 2004, Xu & Hyde 2003 and others). The total forest area (both natural and plantation) in China stands at 154m ha, yet it is small relative to China’s population and relative to the economic demands placed on it. The global forest area average is 0.6 ha per capita, whilst China has a forest per capita area of 0.1 ha. As stated by Xu and Hyde (2003:3) “China’s forests have not been able to keep pace with the expansion in manufactured wood products…”. Xu and Hyde (2003) also report that the State Forestry Association found that China is the second largest importer of timber in the world, and that forest products are China’s largest import commodity group.
Finding a sufficient fibre supply for the Chinese mills may, therefore, be a problem. According to Flynn (2004), the new Chinese mills will reduce the amount of woodchips that are currently exported by China itself. If the Chinese plantations cannot provide sufficient fibre for the Chinese mills, China may have to import woodchips. Australia already exports a small volume of woodchips to China. However, the importation of wood chips by Chinese firms may be complicated by the fact that the Renminbi is tied to the US dollar. If the Dollar continues to weaken, this will reduce the viability of imported fibre. Several firms, such as Stora-Enso, UPM and Oji, are evaluating the prospect of creating plantations in China, which may prove to be an alternative solution. Due to the time taken to establish a plantation, the shortage of fibre experienced by the Chinese is expected to persist for some time. See Appendix G in the Technical notes and appendices (Part III of this document) for information on the Chinese market.
Buyer concentration was broken by the opening up of the Japanese wood chip market. In the absence of the wood chip export market to Japan, the domestic producers of pulp fibre can only sell to the two major buyers of pulping fibre, Sappi and Mondi, as was the case prior to 1970. With the opening up of the Japanese export market this has changed substantially. In 2003, approximately 39% of South African pulp fibre was exported, with 98% of this exported to Japan.
Japan is offering a price for wood chips that domestic pulp and paper mills in South Africa is unable or unwilling to compete with under current market conditions. This is partly explained by the fact that Japan is almost completely reliant on imported

78
fibre and has to ensure that the price offered is sufficient to ensure security of supply. As the price for exported wood chips are set in Dollar, the market benefits from a weak Rand. The recent strength of the Rand has, therefore, reduced profitability in this market substantially. It is not clear at what point exported wood chips will be diverted to local production if the current Rand strength continues.
Vertical integration overrides supplier concentration. Although pulp plantation ownership is concentrated in the hands of a few large firms, this does not contribute to supplier concentration and the ability to set price from the supply side. In the case of these large firms, plantation operations are vertically integrated with production operations and, therefore, in fact contribute to buyer concentration and pricing power as it reduces their dependency on other providers of fibre. Current market information suggests that these large producers have limited opportunities to expand their own fibre supply. It is, therefore, expected that they will in future become increasingly dependent on other providers of fibre for expansion. In addition, they are vulnerable, as it is not feasible for them to import fibre under current market conditions and the areas that can feasibly supply South African mills have not been developed yet (see discussion on plantation forestry in SADC in Section 12 of the main document – Part I of this report).
Barriers to entry into the wood chip market. The major barriers to entry identified in this study are securing a sufficient supply of fibre for the mill, the capital required to set up a mill and limited viable locations for chipping mills.
• Gaining access to a sufficient and secure supply of timber can be regarded as the biggest stumbling block in entering the woodchip market and the reason why chip mills have, to date, been established by owners of fibre resources (e.g. NCT on behalf of its members) rather than as stand-alone investments. Due to the size of the capital investment and the size and nature of contracts (e.g. needing to complete orders in ship loads), a lack of timber would scupper any chance of financial viability
• The capital outlay required to build a chip mill with a capacity of 360,000 tonnes amounts to about R80m. This is substantially lower than the capital required in setting up a pulp mill (Pulp United72 is estimated to cost R2bn to R3bn), but is still significant. In addition, uncertainty about the effective Rand price (and, therefore, profitability) due to exchange rate movement may increase the risk and deter investors if it does not form part of a longer term
72 The NCT/SodraCell pulp mill development
79
domestic beneficiation expansion programme (e.g. NCT planning to set up its own mill eventually). A certain degree of exchange rate risk lies with the supplier of the woodchips, as contracts are signed for three year periods and specified in dollar terms. Exchange rate risk is, however, not so much a barrier to entry, but a market risk faced by any export business.
• For a chipping operation to be efficient it must either be located close to a domestic buyer of pulp (i.e. local pulp mill) or to a transport hub (mostly ports) that can provide cost effective access to domestic or international buyers of fibre. In most cases, the latter location criteria would dominate as non-integrated chip mills target the export market73. This means that potential chipping operations are limited to coastal cities with sufficient port facilities or to places that can cost effectively be linked to such ports (e.g. through rail transport). At the same time, chipping plants must be within cost effective reach of the plantations as the transport costs are substantial relative to the value of unprocessed wood (particularly if the fibre sources are not integrated with the chipping operations and, therefore, will not profit out of the overall operation). Once again, effective rail transport can expand the potential serving area of a chipping mill.
Pricing mechanism: Woodchip prices are driven by Japanese demand. Japan pays higher prices for fibre than the domestic producers of pulp are currently willing or able to pay. Flynn (2004) notes, however, that Japanese woodchip buyers have been successful in reducing international woodchip prices in recent times. This may be due to an increase in suppliers of woodchips worldwide. Prices are negotiated between the Japanese trading house and the woodchip plant operators, with the Australian woodchip price used as a guideline since they are the largest exporter of woodchips to Japan. In South Africa, Mondi and Sappi pulp log prices are sometimes used as a guide, with contracts binding parties for 3 years.
Box 5. The Japanese paper market and the Japanese demand for woodchips The Japanese paper market appears to be an anomaly when compared to other paper markets. Firstly, the Japanese import woodchips over long distances in an industry where transportation costs are crucial. Secondly, even though tariffs on paper imports are relatively low, the Japanese paper market is still considered to be a closed market. We present some reasons below for these anomalies, but these issues were not completely resolved and may require further research. However, it is not foreseen that Japanese demand for South African woodchips will decline as discussed below.
73 Being within cost effective reach of domestic pulp production will, however, substantially reduce the risk for a chipping operation, as it means that, in conditions of adverse currency movements, fibre can be supplied to domestic pulping operations.
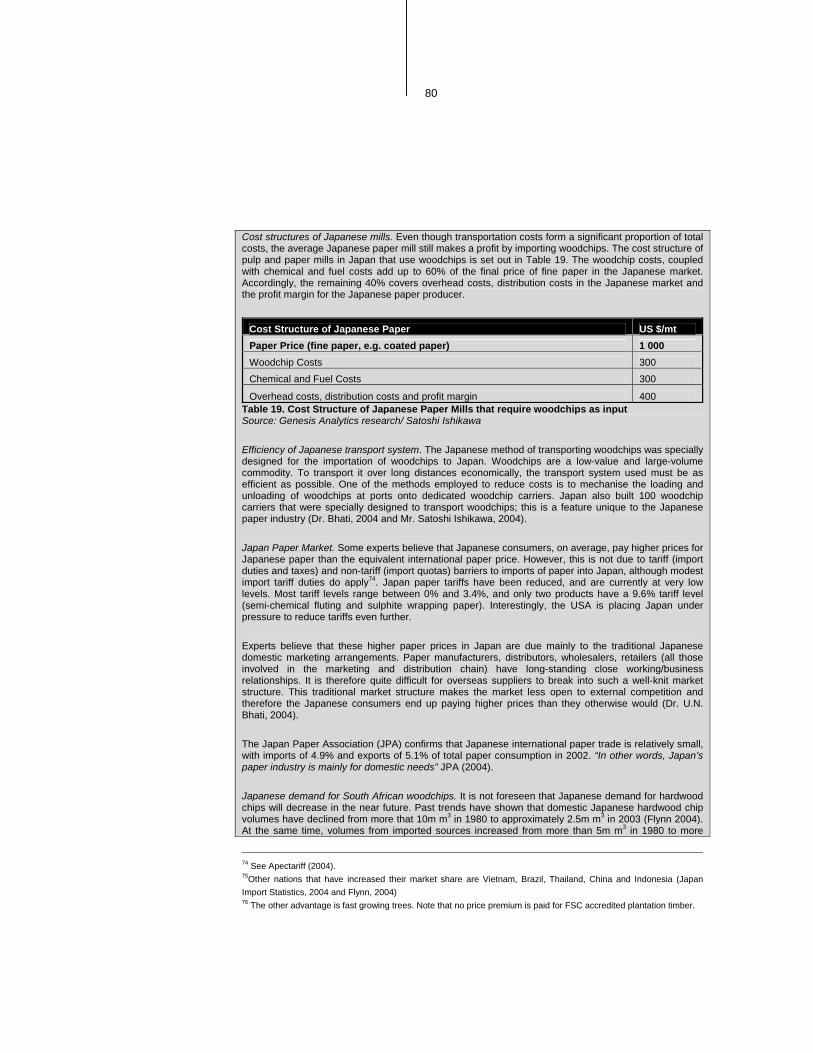
80
Cost structures of Japanese mills. Even though transportation costs form a significant proportion of total costs, the average Japanese paper mill still makes a profit by importing woodchips. The cost structure of pulp and paper mills in Japan that use woodchips is set out in Table 19. The woodchip costs, coupled with chemical and fuel costs add up to 60% of the final price of fine paper in the Japanese market. Accordingly, the remaining 40% covers overhead costs, distribution costs in the Japanese market and the profit margin for the Japanese paper producer.
Cost Structure of Japanese Paper US $/mt Paper Price (fine paper, e.g. coated paper) 1 000 Woodchip Costs 300 Chemical and Fuel Costs 300
Overhead costs, distribution costs and profit margin 400 Table 19. Cost Structure of Japanese Paper Mills that require woodchips as input Source: Genesis Analytics research/ Satoshi Ishikawa
Efficiency of Japanese transport system. The Japanese method of transporting woodchips was specially designed for the importation of woodchips to Japan. Woodchips are a low-value and large-volume commodity. To transport it over long distances economically, the transport system used must be as efficient as possible. One of the methods employed to reduce costs is to mechanise the loading and unloading of woodchips at ports onto dedicated woodchip carriers. Japan also built 100 woodchip carriers that were specially designed to transport woodchips; this is a feature unique to the Japanese paper industry (Dr. Bhati, 2004 and Mr. Satoshi Ishikawa, 2004).
Japan Paper Market. Some experts believe that Japanese consumers, on average, pay higher prices for Japanese paper than the equivalent international paper price. However, this is not due to tariff (import duties and taxes) and non-tariff (import quotas) barriers to imports of paper into Japan, although modest import tariff duties do apply74. Japan paper tariffs have been reduced, and are currently at very low levels. Most tariff levels range between 0% and 3.4%, and only two products have a 9.6% tariff level (semi-chemical fluting and sulphite wrapping paper). Interestingly, the USA is placing Japan under pressure to reduce tariffs even further.
Experts believe that these higher paper prices in Japan are due mainly to the traditional Japanese domestic marketing arrangements. Paper manufacturers, distributors, wholesalers, retailers (all those involved in the marketing and distribution chain) have long-standing close working/business relationships. It is therefore quite difficult for overseas suppliers to break into such a well-knit market structure. This traditional market structure makes the market less open to external competition and therefore the Japanese consumers end up paying higher prices than they otherwise would (Dr. U.N. Bhati, 2004).
The Japan Paper Association (JPA) confirms that Japanese international paper trade is relatively small, with imports of 4.9% and exports of 5.1% of total paper consumption in 2002. “In other words, Japan’s paper industry is mainly for domestic needs” JPA (2004).
Japanese demand for South African woodchips. It is not foreseen that Japanese demand for hardwood chips will decrease in the near future. Past trends have shown that domestic Japanese hardwood chip volumes have declined from more that 10m m3 in 1980 to approximately 2.5m m3 in 2003 (Flynn 2004). At the same time, volumes from imported sources increased from more than 5m m3 in 1980 to more
74 See Apectariff (2004). 75Other nations that have increased their market share are Vietnam, Brazil, Thailand, China and Indonesia (Japan Import Statistics, 2004 and Flynn, 2004) 76 The other advantage is fast growing trees. Note that no price premium is paid for FSC accredited plantation timber.

81
than 18m m3 in 2003. South Africa’s share in the Japanese hardwood woodchip market has been rising steadily, up from 13.7% in 2000 to 26.9% in 2003 (Japan Import Statistics August 2004). South Africa has expanded its share of the Japanese market at the expense of the USA, with USA market share dropping from 22% in 2000 to less than 1% in 200375.
Furthermore, Japanese firms are under increasing pressure to source wood from FSC approved plantations and not natural forests (Greenpeace 2004). Plantation forests are already the dominant source of fibre for Japanese hardwood chip imports, with approximately 65% of hardwood chips coming from plantations in 2002. This is expected to increase to 90% by 2010 (Flynn 2004). Additionally, local woodchip producers have indicated that Japanese trading houses require that a third of the timber used to produce woodchips have to be FSC accredited, with the aim of increasing this percentage to 50% in the near future. South Africa is well-prepared for such a change since more than 80% of South African plantations are already FSC approved (PAMSA 2004a:9). This is one of the advantages that South Africa is seen to have with Japanese buyers76.
4.5. SALIENT FEATURES
This section will highlight the salient features of the wood chip industry that drive current market dynamics and are expected to shape the development of the industry going forward.
4.5.1. INTERNATIONAL DEMAND FOR WOOD CHIPS IS EXPECTED TO CONTINUE AND MAY INCREASE
Japan will remain the dominant market, with demand for imported woodchips expected to remain stable since the Japanese paper market has matured (Flynn, 2004). Also, plantation fibre usage in Japan will be increased in future due to pressure from environmentalists and consumer groups. This suggests that international demand for wood chips is unlikely to decrease in the near future. In fact, the emergence of new potential markets and the increased demand for certified fibre suggests that the demand may increase.
China’s demand for wood pulp has increased dramatically since 1993, when imports of wood pulp reached levels of approximately 500,000 BDT. Flynn (2004) reports that China imports of pulp wood in 2003, were slightly less than 6m BDT. China has also been establishing new mills, which suggests that the Chinese demand for fibre will increase. Currently, a small volume of chips are imported from Australia. At this stage, China exports 633,000 BDT to Japan. However, new Chinese mills are likely to absorb China’s surplus wood chips, which means that export of woodchips will be reduced; a possible opening for South Africa to increase its market share in the Japanese woodchip market (which will no longer

82
be provided by China). In addition, China may have to import woodchips to supply its growing production capacity77, but this is complicated by the fact that the Renminbi is tied to the weakening US dollar78.
In addition, Europe has been increasing imports of southern hemisphere fibre for pulp and energy use, whilst USA imports of hardwood chips will exceed exports for the first time this year (Flynn, 2004). Although USA demand will likely be filled by South American countries such as Brazil and Chile, this may create an opportunity for South African suppliers in the Japanese market as Brazil and Chile may have to divert supply from Japan if they do not have enough excess stocks of fibre.
4.5.2. CONTINUED RAND STRENGTH REDUCES PROFITABILITY OF EXPORTS AND MAY HASTEN DEVELOPMENT OF DOMESTIC BENEFICIATION
As wood chip contracts are denominated in Dollar, the current strong Rand substantially reduces the Rand earnings on these exports. However, exports started in 1970 with a much stronger Rand and have continued (although at varying levels) until now. The recent period of Rand weakness was, therefore, a boom period for the industry, but the feasibility of the export model is not necessarily destroyed by the return to pre-1998 exchange rate trend levels. This is particularly the case, as the Rand is not expected to maintain its current levels in the long run. Even at current Rand levels, the value received by exporting fibre is similar or better than that which can be attained in the local market.
It can furthermore be argued that wood chip exports broke the buyer concentration and power that existed prior to 1970. It is, therefore, unlikely that non-integrated domestic producers of fibre will sacrifice this competitive power in return for short-term price advantages. If anything, continued Rand strength will hasten the development of local beneficiation models of current fibre exporters (most notably NCT). Although the proposed NCT/SodraCell mill at Richards Bay is also targeted at the export market and will, therefore, also be negatively affected by the current currency strength, it is expected that the returns to member farmers may still exceed that obtained from selling to local pulp mills and will further diversify their risk of buyer dominance. 77 As discussed earlier, it is expected that China’s need for fibre will increase and some experts predict that Chinese plantations will not be able to satisfy this need. 78 The weakening of the dollar may continue due to current macroeconomic policy in the USA. However, the study did not attempt to find out whether this weakness will remain in the medium term, nor did the study analyze Chinese exchange rate policy to determine whether the Renminbi will be devalued.
83
4.5.3. WOOD CHIP EXPORTS FACILITATE LOCAL PLANTATION EXPANSION IN AREAS WHERE FURTHER DOMESTIC PROCESSING DOES NOT EXIST
In contrast to pulp mills, establishing a chipping mill requires a much lower capital investment (R80m vs. R2bn), can operate on much lower input volumes (360,000 ADT vs. ± 900,000 ADT79) and does not require a major water source as pulp mills do. This means that chipping mills could quite feasibly form part of an interim (or even permanent) strategy to develop fibre sources outside of the supply radius of current beneficiation facilities. This may be of particular interest in the Eastern Cape, where no pulp or chipping beneficiation currently exists and where it may take some time to build up sufficient fibre supplies to justify high capital beneficiation.
The Eastern Cape may be particularly interesting due to the planned conversion of wattle ‘jungles’ into managed plantations (under the yield enhancement programme80) as wattle is sought after in the international wood chip market. This development strategy is not limited to hardwood plantations, but can also be used to facilitate the development of the current softwood resource in the Eastern Cape. Lower quality softwood from DWAF Category B plantations can, for example, be chipped for export in order to fund rehabilitation. This possibility requires further investigation. No softwood is currently chipped for export by South Africa, but Japan do source softwood chips from other countries.
If water and fibre resources do not allow the establishment of pulping plants in the Eastern Cape, the chipped fibre can still be shipped, for example, to Richards Bay for further processing. The various opportunities in the Eastern Cape are explored in more detail in Section 10 of Part I.
79 The figures above are based on NCT Durban Woodchips and the proposed NCT/SodraCel pulp mill. The NCT/SodraCel pulp mill is proposed to have a capacity of 300,000 tonnes. Based on industry averages, it is assumed that three times the output will be required as inputs. 80 See DWAF (2005d).

84
5. SAWMILLING
5.1. BASIC DESCRIPTION
The sawmilling segment of the value chain is geared towards manufacturing of sawn timber, which is used in the production of solid wood products, such as lumber for construction purposes (roof timbers, flooring, etc.) and consumer products (furniture and DIY). In order to produce sawn timber planks of appropriate dimensions and to obtain sufficient yield from timber inputs, sawmilling firms require timber with a wider diameter and, therefore, grown over longer rotation periods (usually between 27 and 30 years). The timber required is grown on specialised sawlog plantations81, with the main species being pine (96%) and eucalyptus (3.7%). A number of different categories of sawmills can be identified in South Africa, ranging from large mills with substantial capital investments to small mobile mills. Due to government intervention in the industry, log inputs prices were quite low historically, which led to disincentives to invest in new capital equipment and technology. The result is outdated equipment in the industry, which, in turn, leads to lower recovery rates than what is currently possible.
Box 6. Note on accuracy of sawmilling data Various sources of data were obtained on the sawmilling industry. LHA, Crickmay and Associates, FES, sawmilling industry articles and DWAF sources were obtained for data ranging from production to employment and wages. However, the data sources do differ substantially in some instances. For example, DWAF reports employment at 30,000, whilst the South African Lumber Index by Crickmay and Associates reports employment of more than 20,000. Additionally, the study by LHA (2004) finds that the big 5 sawmilling firms (Global Forest Products, Hans Merensky, Safcol (mainly through Komatiland), Yorkcor and Steinhoff) account for more than 70% of sawn timber production. However, Crickmay and Associates find that the big 5 sawmilling firms account for 51% of market share in terms of production82.
The reasons for the variations are unclear. However, Crickmay and Associates data was used as far as possible, given their intimacy and ongoing relationship with the sawmilling industry through the monthly Lumber Mill Index and other publications. Furthermore, the Lumber Mill Index is derived from 70% of the firms in the sawmilling industry and should present accurate data. The only deviation from the Lumber Mill Index data set occurs when the Index does not provide the required information.
81 The silviculture process for sawn timber plantations is quite different to that of pulp plantations (e.g. pruning to prevent knots). 82 Crickmay and Associates (2004a:18); with input from Dave Crickmay.

85
5.2. MARKET PLAYERS
For the purpose of this analysis, three categories of players83 can be identified in the sawmilling market:
• Large mills84 account for 68% of sawn timber production in volume terms. Such mills can be defined as mills with a log intake of at least 15,000 m3 per year, with the largest mill (located in Sabie and operated by Global Forest Products/GFP85) having an intake of 250,000 m3 per year. There are 45 large softwood sawmills and two large hardwood sawmills in South Africa. Production occurs throughout the year.
• Small mills86 account for 25% of sawn timber production in volume terms. Small scale mills typically have a log intake of less than 15,000 m3 per year. Production occurs throughout the year and some small mills do have drying facilities, which implies the ability to produce sawn timber with a higher value add than simply wet-of saw sawn timber.
• Micro mills87 account for 7% of the sawn timber production in volume terms. Such mills are small scale mills that are mobile and operate with low cost structures. The low cost structure is due to lower wages, lower capital costs and lower maintenance costs.
Major players: Unlike the rest of the value chain, the South African sawmill market is categorised by a large number of market players. In addition, none of the individual market players have a market share in excess of 20% and the biggest 5 players in the industry (GFP, Hans Merensky, Safcol, Yorkcor and Steinhoff) have a joint market share of 51% (see Table 20). Safcol is the only government controlled company in the sector and has traditionally owned both plantation and sawmilling concerns. As part of the privatisation process that commenced in 1996, Safcol has leased the plantations under its control with Komatiland being the only remaining state owned forestry entity. The Komatiland privatisation process has been problematic with the first deal cancelled due to allegations of corruption and the second blocked by the Competition Tribunal due to market dominance concerns. A current restructured version of the second bid is currently being considered but the expectations of its success are mixed at best. 83 From Crickmay and Associates (2004a). 84 Also referred to as formal sawmills 85 The second biggest sawmill is the Hans Merensky sawmill in Tweefontein 86 Also referred to as low cost mills (LCMs) 87 Also referred to as bush mills

86
In Table 20 the production share, in volume terms, for large sawmills are presented88. The two largest players, Hans Merensky and GFP, accounted for respectively 16% and 15% of market share in terms of production. A significant proportion of production is spread across individual sawmills who, as a group, account for 46% of total production in volume terms (identified as other in Table 20). From Table 20 it is clear that the sawmilling sector is not as highly concentrated as other sectors in the commercial plantation value chain.
Sawmill Ownership No of Mills Market production share in volume Steinhoff 4 8% Yorkcor 5 7% Komatiland 2 5% MTO Forestry 2 3% Hans Merensky 4 16% Global Forest Products 3 15% Other 27 46%
Total 47 100% Table 20. Major players and market shares for the large sawmills Source: Crickmay and Associates 2004a:18
Number of market players: Current estimates place the total number of mills across the different categories (Large, Small and Micro) at 381 in 2003 (Crickmay and Associates 2004a:15)89. There are 45 large mills, 106 small mills and 230 mobile mills. A decline in the number of large and small mills has reportedly occurred over the past decade. One of the reasons for this may be that inefficient sawmills, who relied on low input prices from government plantations to survive, came undone when Safcol started to charge higher prices. Alternatively, the reduction in the number of mills may simply reflect a consolidation trend in a more competitive industry.
88 Table 20 does not include the small and micro mills. Given that these two groups generate 32% of total output, the production shares indicated in table 38 is an overestimation if homogeneity of output is assumed. 89 According to Crickmay and Associates (2004a:14-15), there are 45 large softwood sawmills and 2 large hardwood sawmills in South Africa, as well as 106 small mills and 230 micro mills. On the other hand, LHA (2004:11) estimates that there are approximately 320 sawmills in South Africa of which an estimated 240 are small mills producing less than 10,000m3 of sawn timber per annum. LHA does not distinguish between small and micro mills, and lump them together. As noted earlier, the Crickmay and Associates data is used.

87
Another factor contributing to the reduction in mills may be the effect of privatisation of SAFCOL plantations. As a major owner of sawmilling plantations, the sawmilling sector (including some of the large mills such as Yorkcor) is heavily dependent on DWAF/SAFCOL plantations for its inputs. For various historic reasons, these inputs have been priced at below market prices and have sustained a number of inefficient sawmills. The privatisation process and consequent transfer of SAFCOL plantations to major players is, therefore, expected to impact on this sector90. The privatisation process and subsequent price increases may explain the exit of some mills from the market.
5.3. PRODUCTION AND PRODUCTS
Annual domestic production for 2003 was approximately 2.4m m3 of sawn timber, with an additional 85,000 m3 imported from Zimbabwe; as well as 200,000 m3 of exotic hardwood (such as meranti and oak) imported from other destinations mainly for use in the furniture industry.
Inputs: The non-timber inputs include labour, sawmilling machinery, electricity, and water91. Different sawmills have different labour requirements with regard to overall numbers and skill levels, depending on the mill category, log intake and capital intensity. Specialised equipment used in sawmills are imported, but maintenance occurs in South Africa. Industry experts estimate that large mills spend 80% of maintenance costs locally, whilst the remaining 20% are spent on imported products. In order to increase the recovery rate in sawmills, sawmilling companies are investing in new technology and are in the process of modernizing the sawmill equipment at their disposal (see Wood Southern Africa and Timber Times 2004 publications).
The timber input component comprise of two main species, pine (96%) and eucalyptus (3.7%)92. Timber from pine has numerous applications, ranging from sawn timber for furniture to industrial products such as crates (usually the lower quality sawn timber). Eucalyptus is currently mainly used for outdoor furniture93. 90 This is reflected in the Competition Commission’s decision to block the transfer of Komatiland to the Bonheur Consortium. If the transaction were completed, Bonheur would have been in a position of market dominance. 91 The water is used in the production processes. For instance, water is poured over the sawmill blades to cool the blades. 92 FSA 2003. 93 Current eucalyptus characteristics do not lend itself to a wider application of uses; however, if different techniques are applied during the growth phase additional uses are possible. Nevertheless, a change in eucalyptus quality is only achievable over the long term.

88
Some of the bigger sawmilling concerns such as Hans Merensky and Global Forest Products source their timber from their own plantations and are relatively self-sufficient of Safcol plantations. Other sawmills, however, are very dependent on timber inputs from the government owned plantations. This includes large sawmilling concerns such as Yorkcor and smaller sawmills in the vicinity of the government owned plantations.
Outputs: In essence, the output from sawmills are a number of categories of sawn timber, which can be subdivided according to the dimensions of the sawn timber into different log classes. The log classes are divided according to size, with the smaller log classes mainly used for furniture and the larger log classes used for construction. Lower quality wood is normally used for packaging products, such as cable drums, pallets, etc. Interestingly, the South African standard log dimensions do not conform to world standards and any imported94 sawn timber has to be re-cut to match the conventional South African standards. Subsequently, additional costs would be incurred to cut imported timber to the appropriate dimensions for South Africa.
In addition, sawmills also supply woodchips (from the waste generated by the sawmilling process) to pulp and paper mills. Using estimates obtained from industry experts, it is estimated that the supply of woodchips amount to approximately 525,000m3 95. The total value of this is estimated between R80m and R96m per annum96.
5.4. MARKET DEFINITION, STRUCTURE AND CONDUCT
Market definition. A number of distinct markets can be identified, which mostly follows the delineation of mill categories. The three main categories of sawmills found in the South African sawmill industry (Crickmay and Associates 2004a:14-15; Dunne 2000:2) each produce different quality and types of products that serve different markets:
• Large sawmills produce both high quality sawn timber (used for furniture) as well as low quality sawn timber, which is used for crates, cable drums and
94 Consequently, exported timber would have to be sawn according to international conventions. This implies that sawmills have to adjust their processes to accommodate the new dimensions, which may have cost implications in terms of set-up time. 95 LHA (2004:10) places annual woodchip volumes provided to pulp and paper mills from sawmills at 500,000 tonnes. 96 Genesis estimates based on Crickmay volumes and prices obtained from other industry sources.

89
other industrial applications. Large sawmills have drying facilities that allow the mill to produce wood that is more durable and easier to work with (does not warp). Drying facilities are quite expensive to set up and maintain and they are, therefore, generally only found in large mills. These mills tend to charge higher prices than small and micro mills due to the better quality sawn timber produced.
• Small mills generally produce sawn timber of lesser quality than the large mills, although some small mills do have drying facilities. Prices charged tend to be lower than that of large sawmills, this is probably due to quality differences.
• Micro mills typically produce low cost wet or air dried timber and pallets and cable drum timber. Micro mills tend to charge less for timber, and are seen to be more flexible where price negotiations are concerned (Dunne, 2000:12). It is estimated that the price that mobile mills obtain for their products may be as much as 30% lower than the average sawn timber prices in the more formal industry (Louis Heyl, 2004).
Vertical integration and concentration: As seen in Table 20, concentration levels in the sawmilling industry are less than in other segments of the commercial plantation value chain. However, the top 5 sawmilling concerns still account for close to 51% of total production. One of the reasons for this is that four of the five top firms (Hans Merensky, Safcol, Global Forest Products and Steinhoff) have their own plantations97. Vertical integration does therefore play an important role in the industry since it allows a firm to control the inputs in the sawmilling process. Being vertically integrated affords them a secure source of inputs, which supports expansion.
97 The only exception is Yorkcor, who is constantly engaged in legal battles with Safcol in order to obtain timber.
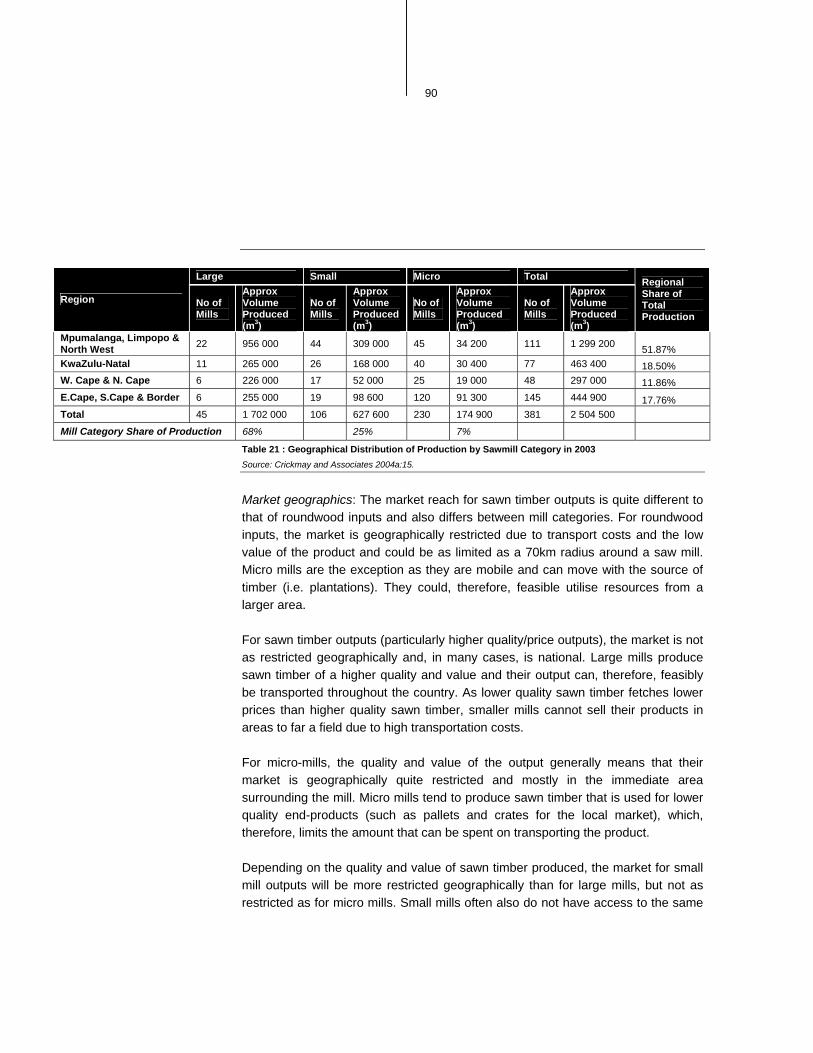
90
Large Small Micro Total
Region No of Mills
Approx Volume Produced (m3)
No of Mills
Approx Volume Produced (m3)
No of Mills
Approx Volume Produced (m3)
No of Mills
Approx Volume Produced (m3)
Regional Share of Total Production
Mpumalanga, Limpopo & North West 22 956 000 44 309 000 45 34 200 111 1 299 200 51.87% KwaZulu-Natal 11 265 000 26 168 000 40 30 400 77 463 400 18.50% W. Cape & N. Cape 6 226 000 17 52 000 25 19 000 48 297 000 11.86% E.Cape, S.Cape & Border 6 255 000 19 98 600 120 91 300 145 444 900 17.76% Total 45 1 702 000 106 627 600 230 174 900 381 2 504 500
Mill Category Share of Production 68% 25% 7%
Table 21 : Geographical Distribution of Production by Sawmill Category in 2003 Source: Crickmay and Associates 2004a:15.
Market geographics: The market reach for sawn timber outputs is quite different to that of roundwood inputs and also differs between mill categories. For roundwood inputs, the market is geographically restricted due to transport costs and the low value of the product and could be as limited as a 70km radius around a saw mill. Micro mills are the exception as they are mobile and can move with the source of timber (i.e. plantations). They could, therefore, feasible utilise resources from a larger area.
For sawn timber outputs (particularly higher quality/price outputs), the market is not as restricted geographically and, in many cases, is national. Large mills produce sawn timber of a higher quality and value and their output can, therefore, feasibly be transported throughout the country. As lower quality sawn timber fetches lower prices than higher quality sawn timber, smaller mills cannot sell their products in areas to far a field due to high transportation costs.
For micro-mills, the quality and value of the output generally means that their market is geographically quite restricted and mostly in the immediate area surrounding the mill. Micro mills tend to produce sawn timber that is used for lower quality end-products (such as pallets and crates for the local market), which, therefore, limits the amount that can be spent on transporting the product.
Depending on the quality and value of sawn timber produced, the market for small mill outputs will be more restricted geographically than for large mills, but not as restricted as for micro mills. Small mills often also do not have access to the same

91
distribution network as large mills. The result is that the sawn timber market served by the larger mills is national, whilst the market served by the smaller and micro mills tends to be more regionally focussed.
From Table 21 the current geographical distribution of production can be seen across the different sawmill categories. Regionally, Mpumalanga contributes close to 51.87% of the overall total volume produced, with KwaZulu-Natal the next biggest regional producer of sawn timber with 18.5% of overall production. Large mills in the Mpumalanga region are the mainstay of sawn timber production in South Africa, and account for 38% of the overall volume produced in the whole country. Both Large and Small mill categories are most active in the Mpumalanga region. Micro mills, on the other hand, are most active in the Eastern Cape, with more than 52% of all micro mill production occurring in this region98.
It is also important to note that the regional production shares are not static over time, nor do they reflect regional sales market shares. Regional production will shift as developments occur within regions, such as changes in fibre availability and improvements in technology. Table 22 shows the sales market shares by region for 2003/4 and 2002. Apart from a 4.5% shift in exports, regional sales market shares only experienced minor shifts.
Additionally, little local beneficiation takes place in the Mpumalanga, Limpopo and North West region. This is reflected by the difference in production share versus sales market share. Even though the Mpumalanga, Limpopo and North West region produced 51.87% of sawn timber in 2003, the same region has less than 11% of the sales market share; whereas Gauteng, where no production occurs, is the dominant province in terms of sales market share at 32%. Gauteng has a larger retail and secondary processing market than Mpumalanga, which implies a greater demand for sawn timber (see Steinhoff 2003:30). KwaZulu-Natal’s production share is less than their regional sales market share, but the region also has a larger retail and secondary processing market than its neighbouring provinces and may, therefore, attract sawn timber from these provinces.
98 This implies potential benefits for micro mills in the Eastern Cape once DWAF plantations are privatised. See Section 10 in Part 1 of this study.

92
Sales market99 share in % Region
2003/4100 2002101 Gauteng 32.0% 30.6% Mpumalanga, Limpopo & NW 10.8% 9.7% KZN 27.5% 25.6% W Cape & N Cape 12.6% 13.6% E Cape, S Cape & Border 7.6% 7.5% OFS & Lesotho 2.0% 1.5% Namibia & Neighbours 2.7% 2.3%
Overseas Export 4.7% 9.2%
Table 22: Regional Sawn Timber Sale Market shares based on volumes Source: Crickmay and Associates 2004:15, South African Lumber Index August 2004
Trade: Apart from the importing of exotic woods such as meranti and oak (200,000 m3 per annum), sawn timber is not imported to South Africa. This is due to the high transportation costs and the cost to re-cut the wood to conform to domestic standards. Crickmay and Associates (2004a:35) estimate that the cost to cut the timber would be in the order of R600/m3. Sawn timber can be imported to Cape Town or Durban at between R1200/m3 and R1400/m3; adding transportation cost of R150/m3 brings the total costs of importing sawn timber to Gauteng to between R1950/m3 and R2150/m3. This compares unfavourably with the domestic price of ±R1250/m3. Possible source countries for imports include South America, Latvia, and the Baltic states.
Table 23 shows export volumes since 1995. Exports increased from 1995 to 1999 as South Africa became more integrated with the world economy. With the currency depreciation in 2002, exports improved dramatically by doubling from its 2001 levels in 2002. However, with the appreciation of the currency it became less profitable to export, and export volumes declined thereafter in 2003. It is interesting to note, however, that the export volumes for 2003 are still higher than at any time for the pass decade bar 2002.
99 This refers to the destination market of the sawn timber produced. 100 This data was obtained from the South African Lumber Mill Index, August 2004. Data from the Lumber Mill Index overlaps years. 101 The data for 2002 was obtained from Crickmay and Associates (2004a:15). However, the authors did not state the year in which the data was obtained in their document. It was assumed that the data referred to either 2002 or 2003, with 2002 being the likely option given the level of exports.

93
Year Export Volumes (m3) 1995 49 675 1996 47 276 1997 51 610 1998 66 441 1999 121 828 2000 105 748 2001 115 349 2002 238 159 2003 163 088
Table 23: Export volumes per annum Source: Crickmay and Associates (2004a:10),
Buyers of sawn timber. Four groups can be identified102:
• Building and construction materials: roof timbers, mouldings, flooring, shelving, doors, etc.
• Local packaging: pallets, crates, cable drums, mining applications, etc.
• Local furniture: furniture, DIY products, etc.
• Lumber exports
As seen in Figure 9, demand by the various end-users has changed over the past few years. Overall, sawn timber sales have increased from 1.5m m3 to more than 1.7m m3, reflecting an increased demand for sawn timber. Lumber exports have declined as the rand appreciated against other currencies. In turn, the stronger Rand has also favoured wood imports with imported sawn timber, from countries in South America and the Baltic region, being regarded as the main competition to the domestic industry. However, the current price of domestic sawn timber has not reached import parity levels (discussed further on) and imports are, therefore, still minimal and focused on niche products not available in South Africa.
102 LHA (2004:12). Crickmay and Associates (2004a:7) makes use of similar categories.

94
Figure 9: End-users according to sawn timber sales 2001 to 2004103 Source: SA Wood and Timber Times, April 2004 and information from confidential source
A declining trend is also shown for the purchases of sawn timber by domestic furniture production. In addition to making exported furniture less competitive, the stronger Rand has also made imported furniture more competitive. Both of these factors would have contributed to the decline in domestic furniture production. However, this does not fully explain the trend as furniture’s share of total sawn timber sales (as well as actual levels of sales) has declined even during periods when the currency was depreciating, such as 2002/2003104. The demand for local packaging and building and construction materials has increased, with demand for local building and construction material doubling since 2001. This is driven by an increased demand for building materials, which is partially due to the decrease in interest rates (Crickmay and Associates 2004a:6).
Cost structure: Cost structures vary across the different mill categories and sizes. The South African average costs for mills of varying sizes are shown in the table 103 Note that the 2004 data does not include data for December, and hence undercounts actual sales.
104 More research will be required to account for this decline.
0%
10%
20%
30%
40%
50%
60%
70%
80%
90%
100%
2001 2002 2003 2004
Local building
Percentage of Volume Sold
Local packaging
Furniture
Exports

95
below. These costs were determined using a 30km transportation radius from plantation to sawmill and will increase as the transportation radius increases. In terms of total costs per cubic metre of log intake, mills with an intake larger than 90,000m3 have the highest costs (R1,028 per m3 log intake), whereas sawmills with an intake of between 60,000 m3 and 90,000 m3 have the lowest costs (R908 per m3 log intake). However, profitability will also be determined by the value of products and industry participants note that the most profitable sawmills are those with a log intake of between 30,000 m3 to 60,000 m3. Table 24 provides the costs incurred by the various large mill types for variable costs (all costs that can vary per unit of production), fixed costs (medium to long term costs), and administrative costs.
Sawmill size (log intake in m3) Variable Costs Fixed costs Admin Costs Total < 30 000 488 422 77 987 30 000 - 60 000 510 413 57 980 60 000 - 90 000 483 365 60 908
> 90 000 501 457 70 1 028
Table 24: Cost structure (R per m3) according to sawmill size based on log intake Source: Confidential Source
Distribution of sawn timber occurs mainly via road transport, even though sawmills have a preference for rail transport since it is believed to be more efficient. However, rail is not used due to inefficiencies such as long delays and limited capacity. Note that the cost of transportation of the sawlog is the responsibility of sawmills.
The cost of transport determines the maximum range sawlogs can be sourced for a mill, which is currently estimated to be no more than 120km105. Beyond this range the cost to transport the logs to the sawmill increases to more than R100 per m3, which makes it unviable.
Barriers to entry and expansion. The biggest potential barriers to entry or expansion are the capital cost of setting up (or expanding) a sawmill and access to a secure and continuous supply of wood.
105 This would depend on the transport infrastructure and can be as low as 70km in some cases.

96
• Capital. Industry estimates suggest that a capital investment of at least R10m will be required to set up a large mill106. This is substantially lower than the investment required in setting up a wood chip operation or pulp mill and should not present a major barrier to entry.
• Wood supply. Secure access to a source of wood can, however, be a major barrier to entry and expansion. Some of the major players have established their own plantations in order to ensure a sufficient supply of wood to their mills. However, even these mills, are to some extent dependent on outside suppliers of wood and, in particular, government (Safcol) plantations. The recent privatisation of Safcol plantations and resultant transfer of plantations to larger players may result in many other players being cut-off from their supply of wood. This will result in further reductions in the sawmill sector.
Pricing Mechanism. Two historic developments have dramatically impacted on the level of prices and development in the sawmilling sector. The first related to the price for inputs and the second to the price for sawn timber.
• Commercialisation of Safcol plantations. From around 1952 sawn timber prices were driven by government through DWAF. As the only supplier of wood to sawmills at the time, DWAF entered into long-term ever-green contracts with private sawmills, where the prices were determined through an agreed formula and negotiated between DWAF and the sawmills collectively. In addition, log supply volumes were guaranteed107. The purpose of these contracts was to encourage investment into the sawmilling industry and prices were, therefore, kept artificially low by DWAF. Although this did stimulate the development of the sawmilling industry, it also led to (and sustained) inefficient sawmilling operations and prevented private sector plantations from supplying wood to this sector as they could not compete on the price.
In 1993 Safcol took over management of the bulk of government’s sawlog assets and thereby inherited the long-term contracts as created by DWAF. As Safcol’s mandate required its plantations to be run on a commercial basis, it was decided to change the previous agreements, by limiting the tenure period of the contracts to three years108.
106It is unclear whether this figure includes all costs such as machinery. 107 Competition Tribunal (2001). 108 Adjustments were again made to contracts in 1998 and, in 2000, further price increases were agreed on between Safcol and most sawmills – Yorkcor being a notable exception.

97
Due to this process of commercialisation, log class prices have increased. This has been met with some resistance from certain sawmillers, who have initiated court action to prevent Safcol from increasing their prices. Additionally, the past three years have seen some sawmills pay higher log prices than the industry norm in order to secure a supply of wood.
• Before it was disbanded in the late 1980’s, the Timber Market Agreement (TMA) impacted on prices of sawn timber. This agreement functioned similarly to a cartel where sawmills set the price for sawn timber. Hence, a closed market was created that did not allow for price competition or imports. This benefited sawmills as competition was limited, but the lack of competitive pressure also meant that little innovation took place and firms did not adjust to technological advances. One of the most important impacts of this is the current average industry recovery rate of 47% due to the use of outdated equipment. Crickmay and Associates (2004a) recommend that the recovery rate should be improved to 54% by 2033 for the industry to use the timber resources more efficiently109.
However, with the TMA not in force anymore, due to its anti-competitive measures, prices for sawn timber are based on market factors. Another factor that impacts on the pricing mechanism is the extent of vertical integration of sawmilling firms. Firms that have their own plantations are able to reduce costs at a plantation level and face less insecurity about timber supply.
Reliance on local forestry. The sawmilling industry is heavily reliant on sawlogs from domestic plantations, as it is not economically viable to import sawlogs, due to high transportation costs relative to the value of the product. Almost all the raw materials used by sawmills are from local forests, with the exception of imports from neighbouring countries, such as Zimbabwe, and imports of exotic timbers such as meranti and oak. This timber is not available in South Africa and attracts a high premium.
109 However, it should be noted that not all mills have such a low recovery rate (some having recovery rates as high as 55%) and that the recovery rate is dependent on the quality of the sawn timber required

98
5.5. SALIENT FEATURES
This section will highlight the salient features of the sawmilling industry that drive current market dynamics and are expected to shape the development of the industry going forward.
5.5.1. EFFICIENCY LEVELS WILL HAVE TO CONTINUE TO IMPROVE DUE TO MARKET PRESSURES
Due to inefficiencies in the past caused by the market distortions of the “evergreen” timber supply agreements with Government, the sawmilling industry in South Africa, by the early 1990s, had become something of a “poor relative” to the more profitable, more efficient and more capital intensive pulp and paper industry. It has also spent much of its time and energy locked in acrimonious disputes with the government over the supply of logs.
Because South African saw millers traditionally purchased their logs at below export parity prices, there was no incentive to maximise efficiency in order to be profitable. Sawmills in other wood-producing countries have consistently had recoveries of 10% to 15% better than those achieved by their South African counterparts. However, following the creation of SAFCOL in 1992 with its commercial orientation, and the introduction of the Forest Act in 1998 (including a clause prohibiting any log supply agreements with more than a five year notice), most of these evergreen contracts have gradually been renegotiated into a more commercially realistic format. Some are, however, still being challenged in court.
Log prices and labour costs represent up to 80% of sawmilling costs. As a result of the renegotiation of the evergreen contracts, log prices from Government forests have risen from well below world parity to parity level. In reaction to increased log prices the following efficiency improvements have occurred to maintain profitability:
• Improved recovery within sawmilling operations. Sawmilling companies are investing in higher levels of technology to extract maximum value from increasingly expensive logs. These investments are commensurate with the scale of operations in South Africa, which tend to be small compared to international standards.
• Vertical integration between plantation management and sawmilling. The privatisation process has facilitated this in terms of State-owned plantations, however similar trends have been observed within the private sector.

99
Integration enables reduced costs of production at plantation level to be passed on to sawmilling companies.
• Contracting-out of forestry functions. Contractors are now involved in transport, harvesting and routine silvicultural operations. Contracting out is significantly cheaper, with workers being paid an estimated 60% of the rates previously paid by the corporate sector and 25% of the amount paid by government plantations. Companies also enjoy reduced exposure to labour unions and no longer need to provide infrastructure and services traditionally associated with “worker villages” – such as housing, schools, clinics and transport (Dlomo and Pitcher 2003:13).
5.5.2. THE DOMESTIC DEMAND FOR SAWN TIMBER WILL INCREASE AND THE INDUSTRY MAY FACE SHORTAGES
Reports by Crickmay and Associates (2004a) and LHA (2004) both indicate that the demand for sawn timber will increase and that South Africa will experience a shortage of sawn timber. This could curtail development in the building and construction, furniture and other industries and increase sawn timber prices. If further afforestation of long rotation plantations does not occur, either the timber products or the raw materials will have to be imported.
If the market is not fully supplied, import of sawn timber will have to occur. Chile or Brazil would be the likely suppliers. However, South African dimensions (as noted earlier) would be problematic. Wood would have to be re-cut to conform to South African standards, which will add (together with transportation costs) ±R750/m3 to the landed price of ±R1400/m3. This would bring the imported sawn timber price to ±R2150/m3, which is significantly higher than the domestic price of less than R1300/m3 (Crickmay and Associates 2004a).
Clearly, if South Africa were to conform to international dimensions of sawn timber, the cost to import sawn timber would be reduced, thus placing less cost pressure on downstream activities such as construction. However, the impact (including cost implications), of changing the current dimensions, on the industry and downstream activities requires further investigation.
5.5.3. PRIVATISATION OF SAFCOL/DWAF FORESTS WILL RESULT IN FURTHER CONSOLIDATION IN THE INDUSTRY

100
It is likely that larger players will lease SAFCOL plantations and thereby impact on the supply of timber to smaller mills, especially in the Eastern Cape, that used to source inputs from these plantations. In the case of Komatiland, the Competition Commission is concerned that the new owner of Komatiland will be a dominant supplier of timber and could possibly reduce sawmilling competitors, by refraining from supplying them with timber inputs. Similar concerns, albeit on a smaller scale, will arise with the privatisation of other DWAF plantations and further consolidation in the industry can be expected.
5.5.4. DWAF CATEGORY B AND C PLANTATIONS MAY PRESENT OPPORTUNITIES FOR THE DEVELOPMENT OF MICRO AND SMALL MILLS
Given the concerns raised in Section 5.5.3, it is encouraging to note that DWAF plantations may still present opportunities for small and micro mills. In the Eastern Cape, for example, some of DWAF’s plantations are situated in areas that are difficult to reach. Subsequently, it is not possible to transport roundwood cost-effectively to saw mills. Since micro mills can produce sawn timber on site, they can process timber within the plantation and, thereby, fulfil a specific niche.

101
6. CHARCOAL
6.1. BASIC DESCRIPTION
Charcoal is produced when materials containing carbon, such as wood, bamboo and bagasse, are partially burnt or heated while airflow to the charcoal is controlled, to prevent the charcoal itself from burning. Although the charcoal market is minor in comparison with other segments of the commercial plantation value chain, it does hold potential since it is ideal for SME development. Low levels of capital inputs, limited technical knowledge and the use of unskilled labour requirements make it possible that charcoal can be produced in rural areas. Furthermore, timber inputs can be sourced from non-commercial plantations and waste timber, from activities such as sawmilling, can also be used to make charcoal. Subsequently, charcoal production places further pressure on the commercial plantations for inputs.
The charcoal industry is characterised by numerous small scale producers, a few brand name producers of household charcoal and a dominant industrial user of charcoal. Although current industry estimates suggest that charcoal contributes only 1.6% to the GDP generated by the Forest Products industry110, it could potentially become a source of income for low skilled, unemployed individuals in areas with high unemployment.
6.2. MARKET PLAYERS
Two main categories of players can be identified in the market:
• Major Players/Branded producers of household charcoal: According to LHA (2004), there are four main producers of branded household charcoal in South Africa. They are Suiderland Charka Ltd in Piet Retief (35%)111, E&C Charcoal in Pietermaritzburg (25%), Braai & Barbeque International in Pretoria (15%) and Mondi Black Gold in Richards Bay (10%). These players also supply various retail outlets. Furthermore, these producers also supply 41% of the industrial charcoal markets needs.
110 Pamsa (2004c:4) and LHA (2003b:2). 111 The market share in brackets only refers to the household charcoal market. The data was obtained from LHA (2003b).

102
• Small-scale producers: It is estimated that there are 160 small-scale producers of charcoal in South Africa. Small-scale producers supply unrefined charcoal to large industrial users (mainly Silicon Smelters) and to the manufacturers of branded products for the braai market (LHA, 2004). A typical small-scale contractor produces 120 tonnes of charcoal per month. The small independents are estimated to have a 15% market share in the household charcoal market and 59% market share in the industrial charcoal market.
6.3. PRODUCTION AND PRODUCTS
Charcoal is slightly different from the rest of the plantation industry segment, as the timber inputs required are mostly procured from non-commercial plots of alien vegetation and inputs, other than timber, may also be used to produce charcoal.
Timber Inputs: According to LHA (2004:10), only hardwoods are used to produce charcoal in South Africa. However, it has been confirmed that some firms also use sawmilling waste, and therefore pine, to produce charcoal112. The quantification of pine used could not be verified, but it is likely to be small. The industry is dependent on low cost raw materials in order to produce charcoal viably and subsequently, most of the timber inputs are obtained from wattle jungle and other infested areas (i.e. non-commercial lots of alien hardwoods suitable for production purposes). A small proportion of timber is obtained from commercial plantations.
No formal industry information is available on the amount of wood used in charcoal production per annum and the estimates available vary substantially based on the assumed average yield ratios. Based on the various yield ratios assumed in the industry, it can be estimated that the charcoal industry uses between 1.2m and 2m m3 of wood inputs per annum.
Non-timber inputs: Interestingly, a number of other inputs can substitute for wood in the production of charcoal113. Due to the nature of the end-product, any material that contains carbon can theoretically be used to produce charcoal. Materials such as bamboo, bagasse, thin twigs, sawmilling waste (sawmill off-cuts and edgings, sawdust), livestock manure, nut shells, animal bones, sewage sludge and even tyres can, therefore, be used to produce charcoal. However, the technology
112 Enviro Charcoal produces charcoal from pine (Enviro Charcoal, 2004) and the PSOM funded charcoal plant in Greytown also makes use of sawmill waste to produce charcoal (EVD, 2005) 113 The extent to which non-timber inputs is used has not been established.

103
required to produce charcoal from these alternative inputs is more complex and more expensive. The bulk of charcoal produced currently, therefore, uses wood inputs.
In addition to these inputs, the production of charcoal requires limited technical expertise and makes use of low skilled labour. Using the labour and output estimates of LHA (2003b), it can be shown that one labourer is required for every 34 tonnes of charcoal produced114.
Outputs: It is estimated that between 136,000 and 205,000 tonnes of charcoal are produced per annum (Crickmay and Associates 2004:27 and LHA 2004:12), as an end product that can be used by both industry and households. The main industrial use is in the production of non-ferrous metals where charcoal is used as a reduction agent. In addition, certain manufacturers convert charcoal to briquettes115 and brand them before distribution. In this way, further value is added to the product. According to LHA (2003b:3), 205,000 tonnes of charcoal is produced, of which it is estimated that the local household charcoal market uses about 70,000 tonnes per annum, the industrial market about 85,000 tonnes per annum and the export market about 50,000 tonnes per annum.
6.4. MARKET DEFINITION, STRUCTURE AND CONDUCT
Market definition: Three markets can be identified. Firstly, the domestic household market, which uses charcoal mainly for braai’s. The local household market uses 34.1% of all charcoal produced in South Africa. The second market is aimed at exporting charcoal for the overseas barbeque market and uses about 24.4% of all the charcoal produced in South Africa. Thirdly, the domestic industrial market, where charcoal is used as a reduction agent in non-ferrous metal processing116. This market uses 41.5% of all charcoal produced117.
114 DWAF (2004a) employment data for charcoal is half that of LHA (2003b): 3,000 vs. 6,000 labourers. Applying the labourers-required-per-tonne-produced measure on other available sources indicated that the LHA employment data could be more accurate than that of DWAF. However, further investigation may be required. 115 Charcoal briquettes are produced by crushing charcoal and mixing in additives, such as nitrates (to make them burn better), and clays and starches (as binders to allow pressing into the traditional shape) and other materials. 116 Non-ferrous metal processing refers to the processing of metals other than iron. An example would be the use of charcoal in the silicon production process. It appears as if charcoal forms an integral part of these production processes. The study did not establish whether viable alternatives to charcoal exist for these production processes. 117 Calculated using LHA (2003b) data.

104
Market geographics: The major producers of branded household charcoal are located in Kwazulu-Natal and Mpumalanga due to the proximity to a supply of timber inputs. However, numerous smaller producers exist throughout the country. As the value-add to household charcoal is sufficient to justify transport costs, the market for this product is national. The market for industrial charcoal is more regional, with the largest buyer located in Polokwane.
Buyers: The major producers of branded charcoal purchase charcoal from smaller producers to supplement their own production. The smaller producers also sell directly to the retail and industrial market. The major buyers of charcoal are the household market, the export market and the industrial users. Silicon smelters situated in Polokwane consume more than 90% of the industrial charcoal produced (LHA, 2004).
Reliance on local plantations: The charcoal industry’s reliance on domestic commercial plantations is currently limited as most of the timber inputs are obtained from invasive alien vegetation and not commercial plantations. In future, the reliance on wood waste products and direct use from plantations is expected to increase, as other sources become limited and demand increases.
Limited information is, unfortunately, available on the cost structures, barriers to entry and pricing mechanisms in this market. However, the large number of participants in the industry suggests that there are no serious barriers to entry118. In terms of the pricing strategy, it is not clear whether the four major household brands, or the largest industrial user, are in a position to abuse their market power. The fact that smaller producers can also sell directly to households or to other industrial users suggests that this is unlikely to be the case.
6.5. SALIENT FEATURES
This section will highlight the salient features of the charcoal industry that drive current market dynamics and are expected to shape the development of the industry going forward.
118 Setting up a small-scale charcoal producer, typically requires minimal investment as the material needed to build a kiln is readily available. However, for larger producers and producers who use alternative inputs, charcoal carbonising machines are required. These machines can cost up to R2m and are produced domestically by firms such as Armco and Enviro Charcoal.

105
6.5.1. THE DEMAND FOR CHARCOAL IS EXPECTED TO INCREASE PLACING PRESSURE ON CURRENT SOURCES OF TIMBER
The demand for charcoal is expected to increase in line with economic growth. In addition, further demand may be created if plans to build another R440m silicon smelter near Van Rhynsdorp (160km north of Saldanha) are realised. Initial capacity will be 23,000 tonnes per year, increasing to 50,000 tonnes per year thereafter (DME, 2004:13). As the silicon production process requires woodchips and charcoal as inputs, the demand for both will increase. In order to produce 1 tonne of silicon, between 1.5 and 2 tonnes of woodchips are required, 0.37 tonnes of low ash coal and 0.25 tonnes of charcoal (DME, 2004:12). This means that an additional 12,500 tonnes of charcoal will have to be produced annually to meet the needs of the new silicon plant.
Furthermore, LHA (2004) reports that raw material for charcoal production is becoming scarcer and that Silicon Smelters (in Polokwane) is sourcing charcoal from as far afield as the Eastern Cape. This may result in charcoal producers having to source timber inputs directly from commercial plantations, which will increase the costs of charcoal production (LHA, 2004:15).
However, the increased demand does not necessarily mean that charcoal producers will be “forced” to purchase timber from commercial plantations. Firstly, 24.4% of all charcoal produced in South Africa is exported. As domestic prices rise (due to increased demand) exports can be redirected to the domestic industrial charcoal market. The current appreciation of the currency also makes it less viable to export charcoal. Secondly, alternative inputs and processes, that can be used to produce charcoal, will become viable as the domestic price of charcoal rises.
6.5.2. CHARCOAL PRODUCTION CAN CONTRIBUTE TO RURAL POVERTY ALLEVIATION
It is estimated that approximately 75% of all people employed in the charcoal industry are employed in the small-scale contracting sector which is mostly located in deep rural areas (LHA, 2003b). Employment estimates range between 3,000 and 6,000 for the industry, but only refer to full time employment. Harvesting and timber collection is sub-contracted to family members and other available workers within the communities on a piecemeal basis, with payment based on the volume of
106
timber delivered. Subsequently, it is likely that the charcoal sector employs more people than the estimates suggest.
The charcoal sector also provides empowerment in developing small business units and, as it requires little capital, is ideal for SME development in rural areas where timber is available (LHA, 2003b). DWAF Group 3 plantations (see Section 14.2.1 in Part 1 for a more detailed discussion on the new classification of DWAF plantations) can be a potential source of timber inputs into the charcoal production process, especially in the Eastern Cape and Limpopo provinces. Group 3 plantations are presently not financially feasible and are generally only used for local needs. If managed properly, these plantations can be a source of timber for charcoal production. Furthermore, LHA (2003b) notes that, due to the neglect of DWAF plantations, wattle infestations have spread within these plantations, representing ideal raw material for charcoal production. Although this would only be once-off, as the infestations are cleared to restore the plantations, the raw material from these infestations would be available at virtually no cost.
Furthermore, waste from sawmilling operations can also be used as an input to produce charcoal. Discussions with smaller mining timber and sawmilling operations revealed that they have a problem in dealing with their waste, which could be made available to charcoal producers at a reasonable cost119. LHA (2003b) argues that large companies are willing to provide funding, training and the initial investment required for small-scale charcoal production plants, if they can form joint ventures with the producers to supply them with lump charcoal on a regular basis. These firms are also willing to enter into supply contracts, thereby guaranteeing the sustainability of the small producer.
119 This method is already being employed by PSOM, who located their charcoal plant close to a sawmill and make use of the waste products from the sawmill.

107
7. TIMBER BOARD
7.1. BASIC DESCRIPTION
The timber board market plays an important role in the building and furniture industry. It is highly concentrated with only a few players. However, opportunities for growth exist, and entry barriers are not insurmountable, as shown by the high likelihood of a new entrant into the market. Furthermore, a significant amount of people are employed in the industry at a relatively high industry average wage, with most employment opportunities created outside of metropolitan areas.
Timber board refers to a wide range of products that are made by compressing woodchips and other wood waste products into a condensed panel by using heat and pressure. The fibre inputs for timber board production are received from various sources, with sawmilling wood waste and woodchips being the main sources. In addition, two major fibreboard producers (Masonite and PG Bison) own plantations which are used as a source of virgin fibre in the production process, whilst other firms source virgin fibre from other plantations close to their production plants.
Two main types of timber board products can be identified. These are particle board (also known as chipboard) and fibre board, with the latter being subdivided into medium density fibreboard (MDF), insulation board and hardboard120. In South Africa, there are various brand names (Bisonboard, Novoboard, etc.) under which these products are sold. Timber board products are well-known for their versatility and have numerous applications, ranging from panelling, furniture to thermal insulation in buildings and flooring.
7.2. MARKET PLAYERS
According to LHA (2004:14), four main producers of timber board products can be identified: Masonite, PG Bison (100% owned by Steinhoff), Sonae Novobord and Chipboard Industries (CIT)121. Three of these produce particle board (PG Bison, Sonae and CIT), PG Bison and Sonae are the only producers of MDF and
120 From Forestry Insights (2004). A small amount of blockboard, laminboard and battenboard is also produced (FES 2004:115) 121 CIT is also known as Magna Board.

108
Masonite is the only producer of hardboard and insulation board in South Africa (Competition Tribunal, 2004).
• PG Bison has five factories in South Africa and is the largest producer of particle board and fibreboard in South Africa. Interestingly, the Competition Tribunal has recently allowed a merger between PG Bison and Steinhoff, an international furniture group (Competition Tribunal, 2004), which has increased the extent of Steinhoff’s vertical integration in the solid wood processing sector.
• Masonite is the only producer of hardboard and insulation board in South Africa and also owns 25,000 ha of eucalyptus plantations (Masonite, 2003a & Masonite, 2003b). These plantations supply the raw material for the manufacture of a wide range of core and value-added wood fibre board products. Excess fibre is sold to various other timber mills throughout KwaZulu-Natal (Masonite, 2003a).
• Sonae Novobord, a Portuguese based firm, is one of the largest producers of wood based panel products in the world. They manufacture particleboard and medium density fibreboard (MDF) products in South Africa. The company has three major manufacturing plants in South Africa. The White River plant produces particleboard and medium density fibreboard (MDF), while the George and Panbult factories focus on particleboard and upgraded products only122.
• Chipboard Industries (CIT) only produces particle board. Furniture manufactures consider the particle board product produced by this firm to be of an inferior quality to that of PG Bison and Sonae (Competition Tribunal, 2004).
7.3. PRODUCTION AND PRODUCTS
Timber inputs used to produce timber board products are typically woodchips, waste timber products (e.g. such as leftover wood from furniture manufacturing) and virgin fibre from plantations that are dedicated to grow fibre for timber board manufacturers. LHA (2004:10) estimated that 700,000 m3 of roundwood was consumed for timber board production in 2003, which includes both virgin fibre and waste timber products. Out of the total amount of roundwood consumed by timber board manufacturers, approximately 200,000m3 was softwood and 500,000m3 was hardwood. This equates to 2.3% of total softwood consumption and 3.2% of total hardwood consumption across the whole FTPP value chain. Some firms, such as
122 Upgraded products refer to the addition of various natural and synthetic decorative surfaces on the particleboard.

109
Masonite and Steinhoff123, source virgin fibre from their own plantations, as well as other plantations. PG Bison, for instance, also sources fibre from Mondi. Waste timber is sourced from sawmills and furniture producers. Estimates of how much waste timber is consumed vary between 20% and 40% of timber inputs124.
Non-timber inputs are machinery used in the manufacturing process, labour, water and energy. Machinery used in the production of fibreboard is imported with maintenance occurring locally.
Products. Two main types of timber board products can be identified. These are particle board (also known as chipboard) and fibre board, with the latter being subdivided into medium density fibreboard (MDF), hardboard and insulation board (Forestry Insights, 2004)125. Various brand names exist under which these products are sold. For example, Sonae sells Novoboard and PG Bison sells Bisonboard
Particle board is produced from wood processing waste and is mainly used for structural purposes such as wall bracing and flooring. Larger particle boards are also used for wall lining and café tabletops. MDF is principally used in the furniture and joinery industry. Hardboard is used for exterior cladding (e.g. outer walls of buildings), panelling and furniture, whilst insulation board is used for cladding in buildings for thermal insulation. Thus, the bulk of output is used in furniture manufacturing, whilst the second biggest user is the building and construction industry. Since little wastage occurs in the production process, output in the industry is estimated to be approximately 700,000 m3126.
7.4. MARKET DEFINITION, STRUCTURE AND CONDUCT
Market definition. The product categories described above have different characteristics and are used in different applications. This differentiation is also enforced by the branding applied to each. For the purpose of this analysis, particle
123 Steinhoff owns PG Bison. 124 Louis Heyl (2004) estimates the use of waste timber to be 20% of current timber inputs. Using data provided by Crickmay and Associates (2004b:21-25), the level of waste timber as a percentage of virgin fibre inputs is estimated to be 39.6%. 125 Various names exist for timber board products. Insulation board, for instance, is also known as soft board according to PG Bison’s website, as well as low density fibre board according to the Masonite website. 126 This figure compares well with FES (2004a:115), where total production, including plywood, blockboard, laminboard and battenboard is estimated at 718,016m3 in 2002/2003. If only particle board and fibreboard is considered, total production amounts to 673,171m3 for 2002/2003.

110
board, medium density fibre board, hardboard and insulation board are, therefore, considered as separate markets127.
Vertical integration: PG Bison and Masonite are vertically integrated with upstream providers of inputs as well as downstream buyers of products. The recent merger between PG Bison and Steinhoff has increased the extent of vertical integration. Before the merger, Steinhoff owned approximately 7,000 ha of plantations (mostly located in the Southern Cape), four sawmills which produce sawn timber, treated poles, cable drums, furniture and doors from high quality timber, as well as bedding bases and furniture frames from lower quality timber. Steinhoff is also regarded as the largest furniture manufacturing in South Africa (PG Bison, 2004 and Steinhoff, 2004). In addition to timber board manufacturing, PG Bison, in turn, also have shares in Timbercity (70%) and Pennypinchers (100%), both of whom are distributors of board and other timber products. Following the investigation into the merger by the Competition Tribunal, it was found that, despite the fact that the merger increases vertical integration, it does not negatively impact on the competitiveness of the market.
In addition to its timber board plants, Masonite also owns 25,000 ha of eucalyptus plantations. Although security of fibre supply is of strategic importance to Masonite, it does not place them in a position to abuse market power.
Concentration. The Competition Tribunal divided the timber board market into segments for particle board and MDF in order to assess the viability of the merger between Steinhoff and PG Bison128. In order to discuss the concentration levels in each industry, this analysis is summarised in this section129.
127 However, we note that a measure of substitution can occur between these various product types, depending on the characteristics of the product and the intended application. 128 See CompetitionTribunal (2004) for details of this merger. Also note that data on the hardboard and insulation board markets could not be obtained, and are not discussed in detail. However, given that there is only one domestic producer, the omission does not detract from the analysis. 129 Market participants indicated that the market shares reported by the Tribunal are correct, however, the Tribunal acknowledged that a typing error may have occurred and that zeros may have been omitted. Subsequently, the data was adjusted by a factor of 10 to bring it into line with other available data.

111
Market Participant Volume m3 Market Share PG Bison 229 400 47.2% Sonae 189 470 39.0% CIT 63 160 13.0% Imports 3 790 0.8%
Total 485 820 100.0%
Table 25: Market for Particle Board, including upgraded Particle Board (2004) Source: Adjusted from Competition Tribunal (2004)
The market for particleboard consists of three domestic producers and an imported component. PG Bison and Sonae dominate the market with a combined market share of 86%. In addition, CIT produces a particleboard that is regarded as inferior to that of the other firms and is generally not purchased by furniture manufactures (with one exception). This means that PG Bison and Sonae are, in fact, the only providers of particle board to furniture manufacturers.
Market Participant Volume m3 Market Share PG Bison 41 430 61.4% Sonae 20 000 29.7% Imports 6 000 8.9%
Total 67 430 100.0%
Table 26: Market for Medium Density Fibre Board, including upgraded MDF (2004) Source: Adjusted from Competition Tribunal (2004)
The market for MDF has only two domestic producers, with the largest firm, PG Bison, having double the market share of Sonae. However, the competition commission judged that this does not give these producers pricing power as timber board can be imported at competitive prices (Competition Tribunal, 2004)130. It does, however, allow them to price products at import parity. Imported product prices are said to be “within cents” of domestic product prices, with domestic branded products priced slightly higher than imported non-branded products.
130 Particleboard = R22.50m2; MDF = R35m2. (2004)

112
Masonite is the only domestic producer of hardboard and insulation board. The exact market size for these products could not be determined131, however, given an estimated timber input level of 130,000 m3 and an estimated recovery rate of 90%132, the production of hardboard and insulation board is estimated to be in the region of 117,000m3.
Market geographics. The location of the main players is not confined to a single geographical area and is spread throughout the country (see Table 27), with factories being located relatively close to sources of fibre. Furthermore, the value of the product justifies higher transport costs and the market for timber board products is, therefore, national.
Firm Location PG Bison Piet Retief PG Bison Alrode PG Bison Boksburg PG Bison Stellenbosch PG Bison Pietermaritzburg Masonite Estcourt Sonae Novobord White River Sonae Novobord George Sonae Novobord Panbult
Chipboard Industries/Magna Board Langeni Table 27: Manufacturers of timber board products and location of their timber board mills Source: Genesis Analytics Research
Trade. Timber board products are imported (Table 25 and Table 26)133 into South Africa, but imported boards are at a disadvantaged compared to domestically produced boards since imports are not convenient in terms of delivery time. This is crucial in the furniture manufacturing industry since the industry is cyclical, with production lowest during the first quarter of the year and higher in the second quarter of the year. A peak is reached between September and December and it is crucial for manufacturers to operate optimally. If furniture manufacturers do not
131 Masonite chose not to divulge any information. 132 An industry expert estimated that the recovery rate for the industry is between 90% and 95%. 133 Imports of hardboard and insulation board could not be established. Crickmay and Associates (2004b:25) also provide import figures for particle board and MDF.

113
have easy access to inputs during this time, it has a negative impact on their profitability.
Exports have declined as the currency has appreciated, but LHA (2004) estimates that 20% of timber board products are exported. However, Crickmay and Associates (2004b:25) places exports at approximately 3%. The reason for this disparity is unclear. Timber board products are exported to countries such as the USA, Europe, South America and the rest of Africa.
Buyers of the products. As indicated by the Competition Tribunal (2004:5), there are a large number of distributors (who are known as board sellers or resellers) of timber board products. Board sellers purchase timber board from the main producers or through imports, stockpile the products in depots from where they supply the various users of timber board products. According to Sonae they directly supply more than 250 stockists in Southern Africa. Additionally, timber board products are also purchased by producers of furniture, such as Steinhoff (the biggest furniture producer in South Africa), Harfred (a case good manufacturer) and Montani (a lounge furniture manufacturer).
Barriers to entry and expansion. Two main barriers can be identified.
• Firstly, access to raw material134 can prevent timber board producers from operating. Importing woodchips is a theoretical solution, but South Africa does not have the sophisticated transportation system that is required to transport woodchips efficiently. Also, the importation of timber board products may make the importation of woodchips unfeasible for timber board producers. Although timber board producers benefit from the ability to utilise waste products out of the sawmilling industry, sawmilling operations are increasing their recovery rate, which implies a reduction in the availability of waste fibre for timber board production. On the other hand, increases in the size of the sawmilling industry may benefit timber board production, through increased availability of waste products. It is believed that the reliance on virgin fibre inputs from plantations may increase going forward, especially if further expansion of the industry occurs.
• Secondly, capital costs required to build a timber board processing plant are high, and have been estimated at R800m.
134 The vertical integration in this sector is not expected to impact on the sourcing of fibre since none of the current timber board producers are major plantation owners.

114
However, these barriers do not seem to be prohibitive, as there is a large possibility that a new entrant will be establishing a particle board plant in Mthatha (Crickmay and Associates 2004b:23). In addition, a number of existing players are considering increasing their plantations in the Eastern Cape, which creates the possibility for additional timber board plants to be established in Mthatha135.
Pricing Mechanism. Prices between individual suppliers and buyers are set annually by negotiation between the various role-players, ranging from timber board manufactures to the users of timber board products such as furniture producers. Furthermore, volume based discounts are viewed as important in ensuring competitive pricing by market participants (Competition Tribunal, 2004). It appears that the industry sets prices at close to import parity levels (imported particle board and MDF have been reported as being “within cents of the going PG Bison price” (Competition Tribunal, 2004) and inquiries with local distributors reveal that imported products are priced at slightly lower levels. Discussions with various industry experts also confirmed that domestic and imported prices are similar.
Reliance on Local Forestry. From the preceding discussion it is clear that the domestic timber board industry sources its timber inputs from plantations and timber processes that produce wood waste (such as sawmilling and furniture manufacturing). As an industry it is, therefore, reliant on the existence of domestic plantations. In fact, industry sources noted that, if commercial plantations did not exist in South Africa, it would not make financial sense to have timber board plants in South Africa. The more viable option in such a situation would be to import timber board products since the cost of importing timber would make it extremely difficult to compete with imported timber board products.
7.5. SALIENT FEATURES
This section will highlight the salient features of the timber board industry that drive current market dynamics and are expected to shape the development of the industry going forward.
135 Infrastructure development is also occurring in Mthatha, which would facilitate further investments. See Section 10 in Part 1 for more details.

115
7.5.1. NEW ENTRY AND EXPANSION IS PLANNED FOR THE TIMBER BOARD INDUSTRY
The barriers to entry are not insurmountable. There is a strong possibility of a new entrant and expansion by existing players. These developments are focused in the Eastern Cape.
7.5.2. HIGH CONCENTRATION LEVELS ALLOWS PRICING AT IMPORT PARITY
The low level of domestic competition allows producers to price at close to import parity. However, this does not prevent imports since the domestic price is slightly higher than the imported goods. The higher domestic price is feasible due to the branded nature and perceived quality of the products produced locally.
7.5.3. CHANGES IN THE SAWMILLING INDUSTRY WILL AFFECT THE TIMBER BOARD PRODUCERS
A large portion of inputs are obtained from sawmilling waste and the timber board industry is sensitive to changes in the sawmilling industry. It has been estimated that sawmilling waste accounts for 20% to 40% of inputs in the timber board industry. If recovery rates in sawmills increase, the timber board industry will have fewer inputs (less waste), however, if the sawmilling industry and sawn timber plantations expand, the timber board industry will have more inputs. Given the strong possibility of a new entrant into the market, more pressure may be placed on these fibre sources. However, it is believed that the new entrant has, or may have, access to plantations that were previously not optimised.
Furthermore, DWAF Group 1 and 2 plantations136 will be open for tender, and may be purchased by timber board producers, which would increase the supply of fibre for production. Even if these plantations are bought by sawmilling concerns, fibre supply may still increase, as discussed.
136 See Section 14.2.1 in Part 1 for a description of these categories

116
8. MINING TIMBER
8.1. BASIC DESCRIPTION
The mining industry requires timber as structural supports in mines, creating the opportunity for mining timber mills and, in fact, was one of the primary reasons for the initial establishment of plantation forestry in South Africa. However, mining timber applications have declined substantially during the past two decades.
Intake volume by the primary processing plants peaked in 1984/85 at 3,149,098 m3, but dropped to 564,922 m3 in 2001/02 (Forestry and Forestry Industry Facts, 2003). The main reason for this is that timber props and packs have been replaced with hydraulic and mechanical props (LHA, 2004:13). The mining industry is also making greater use of backfilling techniques and, therefore, has less need for mining timber. The bulk of timber that was previously used for mining purposes is now exported as woodchips.
The industry can subsequently be described as declining. However, the use of waste products from mining timber mills may still represent a source of inputs for related industries such as charcoal producers and pallet producers.
8.2. MARKET PLAYERS
The major players in the mining timber market are all private firms, with no direct government participation. According to FSA (2003), there were 12 mining timber mills in South Africa in 2001/2002. The number of mining timber mills has shown a steady decline since its peak in 1985/86 at 46 mills. A few reasons can be identified, such as the decline in demand for mining timber products, a decline in the number of new mining activities and improved substitute products. Three major players have been identified:
• Mondi Mining • SMT (previously known as Sappi Mining Timber) • Timrite
These firms are all privately owned, with Mondi Mining having the greatest extent of vertical integration (i.e. through parent company Anglo American).

117
8.3. PRODUCTS AND PRODUCTION
The mechanical processes in the mining timber industry are similar to that of sawmills, but have a much higher recovery rate than the sawmilling industry137 and, therefore, produces less waste.
Timber Inputs. Only hardwood is used to produce mining timber, with the main species used being Eucalyptus grandis and Eucalyptus saligna. The timber is sourced from local plantations owned by Mondi, Hans Merensky and local farmers. Some mining timber mills also receive log inputs from small growers. However, both the extent of this and whether these small growers are affiliated to small grower schemes is unclear.
Estimates of annual log intake for mining timber vary between 797,000m3 and 860,000m3 per annum (according to LHA, 2004)138. Figure 10 shows how log intake and sales volume have declined over time from the peak in 1984/85.
Figure 10: Sales volume and log intake of mining timber mills Data Source: FSA 2003
137 This is due to the fact that less cutting takes place to produce mining timber than sawn timber. The mean recovery rate for the period from 1979 to 2002 was 82% (FSA, 2003). 138 The figures presented by LHA are used when calculating value add since this was the recommendation from FSA.
0
500000
1000000
1500000
2000000
2500000
3000000
3500000
1979
/80
1980
/81
1981
/82
1982
/83
1983
/84
1984
/85
1985
/86
1986
/87
1987
/88
1988
/89
1989
/90
1990
/91
1991
/92
1992
/93
1993
/94
1994
/95
1995
/96
1996
/97
1997
/98
1998
/99
1999
/00
2000
/01
2001
/02
Sales Volume
Log Intake
Cubic metres

118
Non-timber inputs. Various types of machinery are used in the production process, including equipment such as cross cut saws, double lock edge machines, drilling machines, etc. These machines are all produced and maintained locally. Industry experts say that equipment is rarely, if ever, imported. This implies that a domestic industry has evolved to produce and maintain the equipment needed for mining timber mills to operate.
Outputs. Outputs obtained are mat packs for ceiling reinforcement, poles (various applications) and timber for scaffolding within mines. The type of product used within a mine would depend on factors such as soil type, application within the mine, etc. Additionally, waste products from mining timber mills, such as sawdust and solid wood waste, can be used as inputs in other production processes. For example, waste from mining timber mills has been used for pallet production, woodchips139, charcoal production and as fuel wood. No information was available on the volumes directed to these applications.
8.4. MARKET DEFINITION, STRUCTURE AND CONDUCT
Market definition. The mining timber market is defined in terms of a small number of products and a small number of buyers. Each mill can sell to any mining company it chooses as the mills are not forced to sell to a specific mining company through exclusive supply agreements.
Vertical integration. Mondi Mining is linked to both upstream and downstream activities due to Mondi’s parent company Anglo American. Mondi Mining supplies one third of its mining timber to Anglo, with two thirds going to the open market. Other buyers include firms such as Harmony Gold and Goldfields. Timber is obtained from Mondi’s plantations, which include the Swaziland operations of Peak Timbers limited. Mondi plantations sell primarily to Mondi Mining Supplies, but also provide to other mining timber mills. In 2002, Mondi sold 222,267 tonnes of mining timber to Mondi mining supplies. In total, 283,244 tonnes of mining timber were sold by Mondi, with most of the remaining fibre going to Duiwelskloof Mining Supplies.
Market geographics and trade. Mining timber mills are located in areas close to underground mining activity and/or close to the fibre resource. Consequently, more
139 The extent to which wood chipping occurs couldn’t be established, but it has been noted that only the larger mining timber mills are able to do this.

119
than 50% of mining timber mills are located in Mpumalanga (Edwards, 1998). No mining timber products are exported, but some mining timber is imported from Swaziland for processing.
Barriers to entry. As with the sawmilling industry, one of the major barriers to entry would be to secure a steady supply of timber for the production process. A second major barrier would be to secure a market. Given the decline in the number of mining timber mills, limited scope for entry exists in the mining timber industry.
8.5. SALIENT FEATURES
The mining timber industry played an important role in the history and development of the commercial forestry plantation industry in South Africa. However, the industry is currently in decline, due to the increasing importance of substitute technologies, and this sector is not foreseen to be an area of growth of the FTPP cluster.

120
9. TREATED POLES
9.1. BASIC DESCRIPTION
Of the smaller and lesser known roundwood products, poles are one of the more valuable. Most poles and posts are treated with preservatives to protect them against insect and fungal attack and ensure a useful life of up to 50 years (Forestry Insights, 2004). This section will describe the pole market in further detail.
9.2. MARKET PLAYERS
According to FSA (2003), there were 41 pole treating plants in South Africa in 2001/2002. The pole market has three big players who control 85% of the market. They are Thesens, Woodline (owned by Steinhoff) and Boland Wood Industries (LHA, 2003a). However, the market remains highly competitive with the big suppliers under pressure from large customers and alternative products made from concrete and steel.
Furthermore, the three big players face competition at a regional level and are not always the dominant player in specific regions. For example, Shafeera Timbers is the largest treater in the Limpopo province, whilst Natal Forest Products is the largest treater in KZN. In the EC, there are two large players, namely Highbury Treated Timbers and Harding Treated Timbers. Although these firms may not be large national players, they are competitive in their specific regions (LHA, 2003a).
9.3. PRODUCTION AND PRODUCTS
Timber Inputs. Poles are produced with timber inputs grown over shorter rotation periods, or with thinnings from long rotation plantations. The pole market requires posts and poles that are relatively straight. Poles are manufactured by peeling timber, which involves removing the bark and some surface wood and taking off any bumps or swellings to improve the appearance. In some higher value uses, the wood is gauged to produce a length with a profiled edge140 and no narrow edge. The pole market is estimated to consume 750,000 m3 of timber inputs per annum. Of this, 350,000 m3 is softwood and 400,000 m3 is hardwood. Furthermore, the pole treating segment of the pole market is more reliant on eucalyptus (60%) than
140 Forestry Insights (2004)
121
pine (40%), whilst the untreated pole segment of the market is more reliant on pine (67%) than eucalyptus (33%)141. This may be due to regional use issues: pole usage in the Eastern Cape could be dominated by the untreated pole segment and, since pine is more easily available within the region, it becomes the more frequently used specie142.
Non-timber inputs. Typical non-timber inputs are machinery (such as drying facilities), electricity and pole preservatives such as creosote and CCA (Copper Chromium Arsenate). The non-timber inputs for this industry are produced and maintained locally, with subsequent benefits for the economy.
Outputs. Poles are used in a variety of ways including retaining walls, marina poles, telegraph poles and for building foundations and materials. Additionally, posts of a lower value roundwood are used for agricultural fencing, horticultural structures and landscaping. It is estimated that the total output volume amounts to 520,000 m3 (LHA, 2003a).
9.4. MARKET DEFINITION, STRUCTURE AND CONDUCT
Substitutes. Timber poles compete with steel and concrete poles in building, fencing, electricity, transmission and fixed telephone line applications (LHA, 2003a). However, these products are not always available in rural areas. Consequently, poles are often the only viable product for uses such as building and fencing.
Geographical Nature. According to LHA (2003a), timber for poles is grown across the country. From Figure 11 and Table 28 it is clear that the dominant pole supply region is the Western and Southern Cape, followed by Mpumalanga and the Eastern Cape.
141 LHA (2003a) 142 See LHA (2003a: 4-6) for a discussion on the characteristics of the different pole species and their suitability for certain applications.

122
Figure 11: Supply of pole timber according to region Source: Adapted from LHA (2003a)
Approximately two-thirds of known pole sales are treated and transported throughout the country and, as a result, a national market for poles exists. However, several pole timber markets are of a regional nature, with smaller pockets of both commercial plantations and woodlots meeting the building and fencing needs of local communities (LHA, 2003a).
Volume (m3) Region Pine Eucalyptus Total
Limpopo 15 000 50 000 65 000 Mpumalanga 46 000 98 000 144 000 KwaZulu-Natal 2 000 84 000 86 000 Eastern Cape 48 000 94 000 142 000 Western/Southern Cape 268 000 34 000 302 000 Other 1 000 10 000 11 000 Total 380 000 370 000 750 000 Table 28: Regional pole supply figures according to specie Source: LHA (2003a)
Limpopo8.7%
Mpumalanga19.2%
KZN11.5%
EC18.9%
W.&S. Cape40.3%
Other1.5%
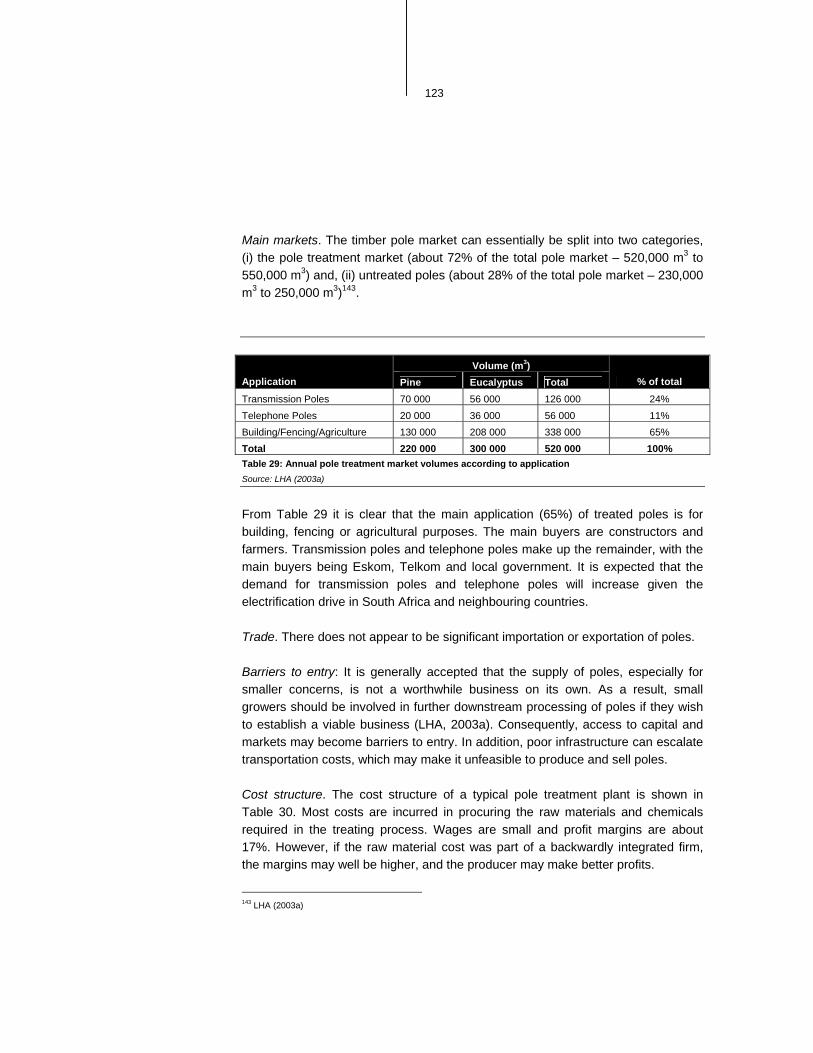
123
Main markets. The timber pole market can essentially be split into two categories, (i) the pole treatment market (about 72% of the total pole market – 520,000 m3 to 550,000 m3) and, (ii) untreated poles (about 28% of the total pole market – 230,000 m3 to 250,000 m3)143.
Volume (m3) Application Pine Eucalyptus Total % of total
Transmission Poles 70 000 56 000 126 000 24% Telephone Poles 20 000 36 000 56 000 11% Building/Fencing/Agriculture 130 000 208 000 338 000 65% Total 220 000 300 000 520 000 100% Table 29: Annual pole treatment market volumes according to application Source: LHA (2003a)
From Table 29 it is clear that the main application (65%) of treated poles is for building, fencing or agricultural purposes. The main buyers are constructors and farmers. Transmission poles and telephone poles make up the remainder, with the main buyers being Eskom, Telkom and local government. It is expected that the demand for transmission poles and telephone poles will increase given the electrification drive in South Africa and neighbouring countries.
Trade. There does not appear to be significant importation or exportation of poles.
Barriers to entry: It is generally accepted that the supply of poles, especially for smaller concerns, is not a worthwhile business on its own. As a result, small growers should be involved in further downstream processing of poles if they wish to establish a viable business (LHA, 2003a). Consequently, access to capital and markets may become barriers to entry. In addition, poor infrastructure can escalate transportation costs, which may make it unfeasible to produce and sell poles.
Cost structure. The cost structure of a typical pole treatment plant is shown in Table 30. Most costs are incurred in procuring the raw materials and chemicals required in the treating process. Wages are small and profit margins are about 17%. However, if the raw material cost was part of a backwardly integrated firm, the margins may well be higher, and the producer may make better profits.
143 LHA (2003a)

124
Description Cost (R/m3) Percentage Raw Material 175 25% Chemicals 180 26% Salaries and Wages 50 7% Other Expenses 65 9% Overheads 110 16% Margins 120 17% Total 700 100%
Table 30: Pole treatment plant cost structure Source: LHA (2003a)
Reliance on Local Forestry. The domestic pole producers are reliant on local commercial plantations. Given that competitively priced substitute products exist, pole manufactures may not be in a position to compete if they have to import timber to produce poles. In addition, import costs may make it more feasible to simply import the end product.
9.5. SALIENT FEATURES
The pole market has not expanded substantially over the past decade since applications such as telephone and transmission poles have been penetrated by other technologies such as fibre optics and cell phones (LHA 2004:13 to 14). However, LHA (2003a) has noted that there is a general undersupply of poles in South Africa and that the electrification drive in South Africa and neighbouring countries may encourage a growth spurt in the industry. In addition, the building and agricultural industries demand 65% of total pole treatment volumes (see Table 29). Furthermore, it is likely that some of the increased demand in the building industry will filter through to the pole industry, with a concomitant increase in demand for poles.
Subsequently, the transfer of DWAF Category B and C plantations, in Limpopo, KwaZulu-Natal and Eastern Cape, offer pole manufacturing opportunities for SMEs and rural communities. With the exception of Eastern Cape, almost all plantations are linked to DWAF pole treatment plants, which provide access to downstream processing facilities.

125
Furthermore, some scope still exists, through upgrading of plants, to achieve a higher value-add production of transmission or telephone poles. Nonetheless, sizeable investment in new plants (such as the Butterworth144 model, which is estimated to cost R50m) and intervention by development agents would be required to facilitate joint pole manufacturing ventures between community plantations and woodlots in the Eastern Cape (LHA, 2003a).
144 An investment model created for the treated pole industry.