part ii – graphics - stanford university
TRANSCRIPT

TEXan
d Graphics
TEXan
d Graphics
TEXan
d Graphics
TEXan
d Graphics
TEXan
d Graphics
TEXan
d Graphics
TEXan
d Graphics
TEXan
d Graphics
TEXan
d Graphics
TEXan
d Graphics
TEXan
d Graphics
TEXan
d Graphics
TEXan
d Graphics
TEXan
d Graphics
TEXan
d Graphics
TEXan
d Graphics
TEXan
d Graphics
TEXan
d Graphics
TEXan
d Graphics
TEXan
d Graphics
TEXan
d Graphics
TEXan
d Graphics
TEXan
d Graphics
TEXan
d Graphics
TEXan
d Graphics
TEXan
d Graphics
TEXan
d Graphics
TEXan
d Graphics
TEXan
d Graphics
TEXan
d Graphics
Custom GraphicsSimple customizationHigher level customization
Online LATEX Tutorial
Part II – GraphicsPSTricks
E Krishnan, CV Radhakrishnan and AJ Alexconstitute the graphics tutorial team. Commentsand suggestions may be mailed [email protected]
c©2004, The Indian TEX Users GroupThis document is generated by TEX withhyperref, pstricks, pdftricks and pdfscreenpackages in an intel running /and is released under
The Indian TEX Users GroupFloor , Buildings, Cotton HillsTrivandrum 695014,
http://www.tug.org.in
� � � � � � 1/23

Simple customizationHigher level customization
Online LATEX Tutorial
Part II – GraphicsPSTricks
E Krishnan, CV Radhakrishnan and AJ Alexconstitute the graphics tutorial team. Commentsand suggestions may be mailed [email protected]
c©2004, The Indian TEX Users GroupThis document is generated by TEX withhyperref, pstricks, pdftricks and pdfscreenpackages in an intel running /and is released under
The Indian TEX Users GroupFloor , Buildings, Cotton HillsTrivandrum 695014,
http://www.tug.org.in
� � � � � � 2/23
8. Custom Graphics
We’ve seen in previous chapters the wide array of graphics objects avail-able off-the-shelf in PSTricks. In this chapter we’ll take a look at some meth-ods of creating our own graphics objects. We’ve also seen how we canproduce variants of such predefined objects by tweaking their default pa-rameter settings. The first level of customization is to save such variants asnew objects and then reuse them.

Custom GraphicsSimple customizationHigher level customization
Online LATEX Tutorial
Part II – GraphicsPSTricks
E Krishnan, CV Radhakrishnan and AJ Alexconstitute the graphics tutorial team. Commentsand suggestions may be mailed [email protected]
c©2004, The Indian TEX Users GroupThis document is generated by TEX withhyperref, pstricks, pdftricks and pdfscreenpackages in an intel running /and is released under
The Indian TEX Users GroupFloor , Buildings, Cotton HillsTrivandrum 695014,
http://www.tug.org.in
� � � � � � 3/23
8.1. Simple customization
If a certain graphics object in PSTricks is repeatedly used with some customparameter settings, we can save the tedium in typing in these values bysaving it under a new name. (This also comes in handy to make changes ina consistent manner, if we happen to change our mind later).
8.1.1. New objects
You may have noticed that many of our examples contain a colored grid likethe one below:
\begin{pspicture}(-2,-2)(2,2)
\psgrid[gridcolor=Apricot,%
gridlabelcolor=Mahogany,%
subgridcolor=Apricot]
\psplot[plotstyle=curve,%
linecolor=Blue]%
{-1.5}{1.5}{x 3 exp x sub}
\end{pspicture}
-2 -1 0 1 2-2
-1
0
1
2
Since the same grid is used in all the examples, it’d be nice if we can avoid thetedium of typing all the parameter settings again and again; and its wherethe command \newpsobject comes in handy. Thus by defining
\newpsobject{colgrid}%
{psgrid}%
{gridcolor=Apricot,%
gridlabelcolor=Mahogany,%
subgridcolor=Apricot}

Custom GraphicsSimple customizationHigher level customization
Online LATEX Tutorial
Part II – GraphicsPSTricks
E Krishnan, CV Radhakrishnan and AJ Alexconstitute the graphics tutorial team. Commentsand suggestions may be mailed [email protected]
c©2004, The Indian TEX Users GroupThis document is generated by TEX withhyperref, pstricks, pdftricks and pdfscreenpackages in an intel running /and is released under
The Indian TEX Users GroupFloor , Buildings, Cotton HillsTrivandrum 695014,
http://www.tug.org.in
� � � � � � 4/23
we can use \colgrid every time we need the grid of these specifications.The syntax of the general command is:
\newpsobject{name}%{object}%{parameter1=value1}%
parameter1=value1. . . . . . . . . . . . }
Where name is the name we give to the variant object (such as colgrid inthe example above), object is the name of the graphics object predefinedin PSTricks that we want to tweak (such as psgrid in the example) andParameter1, parameter2 are the parameters whose values we set by assigningvalues value1, value2 and so on.
Once an object is defined using \newpsobject, we can change its parame-ters the usual way by enclosing the new values within square brackets. Theexamples below illustrates this:
\newpsobject{bigdots}%
{psdots}%
{dotsize=1 0,%
linecolor=Red}
\begin{pspicture}(-0.5,-0.5)(1.5,1.37)
\bigdots(0,0)(1,0)(0.5,0.866)
\end{pspicture}
\vspace{1cm}
\begin{pspicture}(-0.5,-0.5)(1.5,1.37)
\bigdots[linecolor=Green](0,0)
\bigdots[linecolor=Blue](1,0)
\bigdots(0.5,0.866)
\end{pspicture}
bbb
bbb

Custom GraphicsSimple customizationHigher level customization
Online LATEX Tutorial
Part II – GraphicsPSTricks
E Krishnan, CV Radhakrishnan and AJ Alexconstitute the graphics tutorial team. Commentsand suggestions may be mailed [email protected]
c©2004, The Indian TEX Users GroupThis document is generated by TEX withhyperref, pstricks, pdftricks and pdfscreenpackages in an intel running /and is released under
The Indian TEX Users GroupFloor , Buildings, Cotton HillsTrivandrum 695014,
http://www.tug.org.in
� � � � � � 5/23
8.1.2. New styles
We can also freeze certain parameter values under a new name using thecommand \newpsstyle and then use it with various graphics objects, as inthe example below:
\newpsstyle{newdots}%
{linestyle=dotted,%
dotsep=1pt,%
linecolor=Green}
\psset{unit=0.5cm}
\begin{pspicture}(0,-0.5)(8.33,4.5)
\pspolygon[linecolor=Blue](0,0)(8.33,0)(3,4)
\psline[style=newdots](0,0)(3.33,1.67)(8.33,0)
\psline[style=newdots](3.33,1.67)(3.33,0)
\pscircle[style=newdots,linecolor=Red](3.33,1.67){1.67}
\end{pspicture}
The syntax of the general command is
\newpsstyle{name}%{parameter1=value1}%
parameter1=value1. . . . . . . . . . . . }
Note that any parameter value set in \newpsstyle can be changed the usualway, as seen in the \pscircle of the above example.

Custom GraphicsSimple customizationHigher level customization
Online LATEX Tutorial
Part II – GraphicsPSTricks
E Krishnan, CV Radhakrishnan and AJ Alexconstitute the graphics tutorial team. Commentsand suggestions may be mailed [email protected]
c©2004, The Indian TEX Users GroupThis document is generated by TEX withhyperref, pstricks, pdftricks and pdfscreenpackages in an intel running /and is released under
The Indian TEX Users GroupFloor , Buildings, Cotton HillsTrivandrum 695014,
http://www.tug.org.in
� � � � � � 6/23
8.2. Higher level customization
Apart from creating variant objects by merely tweaking the parameter set-tings of predefined objects, PSTricks also allows us to create our own graphicsobjects by combining predefined objects in various ways, using the command\pscustom. Let’s look at an example to see this command in action. Suppose(for whatever reason), we want to draw a red club suit shown below:
bbb
Drawing the top part is easy, using our \bigdots, of the first section.
\psset{unit=1.5cm}
\begin{pspicture}(-1,-1)(2,1.5)
\bigdots(0,0)(0.8,0)(0.4,0.75)
\end{pspicture} bbb
Next we draw the stem. The shape of the stem—it can be scaled to the neededsize later—can be drawn using two parabolic arcs and a line segment as shownbelow:
We’ve included the arrows to show the direction of drawing. The code forproducing this (without the arrows) is shown below:

Custom GraphicsSimple customizationHigher level customization
Online LATEX Tutorial
Part II – GraphicsPSTricks
E Krishnan, CV Radhakrishnan and AJ Alexconstitute the graphics tutorial team. Commentsand suggestions may be mailed [email protected]
c©2004, The Indian TEX Users GroupThis document is generated by TEX withhyperref, pstricks, pdftricks and pdfscreenpackages in an intel running /and is released under
The Indian TEX Users GroupFloor , Buildings, Cotton HillsTrivandrum 695014,
http://www.tug.org.in
� � � � � � 7/23
\begin{pspicture}(-1,-1)(1,0)
\psplot{-1}{0}{x 1 add 2 exp 1 sub}
\psplot{0}{1}{x 1 sub 2 exp 1 sub}
\psline(1,-1)(-1,-1)
\end{pspicture}
So far, so good; but how do we color this? This is where \pscustom steps in.Look at the code and the output shown below:
\begin{pspicture}(-1,-1)(1,0)
\pscustom[fillstyle=solid,%
fillcolor=Red,%
linestyle=none]{%
\psplot{-1}{0}{x 1 add 2 exp 1 sub}
\psplot{0}{1}{x 1 sub 2 exp 1 sub}
\psline(1,-1)(-1,-1)}
\end{pspicture}
Now it’s only a question of scaling the stem we’ve created and pasting at thebottom of the circles, to make our picture:
\psset{unit=1.5cm}
\begin{pspicture}(-1,-1)(2,2)
\bigdots(0,0)(0.8,0)(0.4,0.75)
\rput(0.4,-0.3){%
\pscustom[xunit=0.25cm,%
yunit=0.75cm,%
linestyle=none,%
fillstyle=solid,%
fillcolor=Red]{%
\psplot{-1}{0}{x 1 add 2 exp 1 sub}
\psplot{0}{1}{x 1 sub 2 exp 1 sub}
\psline(1,-1)(-1,-1)}}
\end{pspicture}
bbb

Custom GraphicsSimple customizationHigher level customization
Online LATEX Tutorial
Part II – GraphicsPSTricks
E Krishnan, CV Radhakrishnan and AJ Alexconstitute the graphics tutorial team. Commentsand suggestions may be mailed [email protected]
c©2004, The Indian TEX Users GroupThis document is generated by TEX withhyperref, pstricks, pdftricks and pdfscreenpackages in an intel running /and is released under
The Indian TEX Users GroupFloor , Buildings, Cotton HillsTrivandrum 695014,
http://www.tug.org.in
� � � � � � 8/23
Let’s now take a closer look at the \pscustom command. In the aboveexample, this command helped us to create our “stem” as a new graphicsobject, which could be subjected to the various parameter settings, as witha regular PSTricks object. This is highly useful in highlighting the regionbetween two curves as in the example below:
\renewcommand{\pshlabel}[1]{\small\color{Mahogany}#1}
\renewcommand{\psvlabel}[1]{\small\color{Mahogany}#1}
\begin{pspicture}(-3,-3)(3,3)
\colaxes(0,0)(-3,-3)(3,3)
\pscustom[fillstyle=solid,fillcolor=Cyan]{%
\psplot{0}{1}{x 2 exp}
\psplot{1}{0}{x sqrt}}
\psset{linecolor=Blue}
\psplot{-1.5}{1.5}{x 2 exp}
\psplot{0}{2.25}{x sqrt}
\psplot{0}{2.25}{x sqrt neg}
\end{pspicture}
1 2-1-2
1
2
-1
-2
Note that \colaxes is not a native PSTricks command but is set by
\newpsobject{colaxes}{psaxes}{linecolor=Apricot,arrows=<->}
8.2.1. Of paths and points
As another example, suppose we want to draw a crescent like the one below:
Custom GraphicsSimple customizationHigher level customization
Online LATEX Tutorial
Part II – GraphicsPSTricks
E Krishnan, CV Radhakrishnan and AJ Alexconstitute the graphics tutorial team. Commentsand suggestions may be mailed [email protected]
c©2004, The Indian TEX Users GroupThis document is generated by TEX withhyperref, pstricks, pdftricks and pdfscreenpackages in an intel running /and is released under
The Indian TEX Users GroupFloor , Buildings, Cotton HillsTrivandrum 695014,
http://www.tug.org.in
� � � � � � 9/23
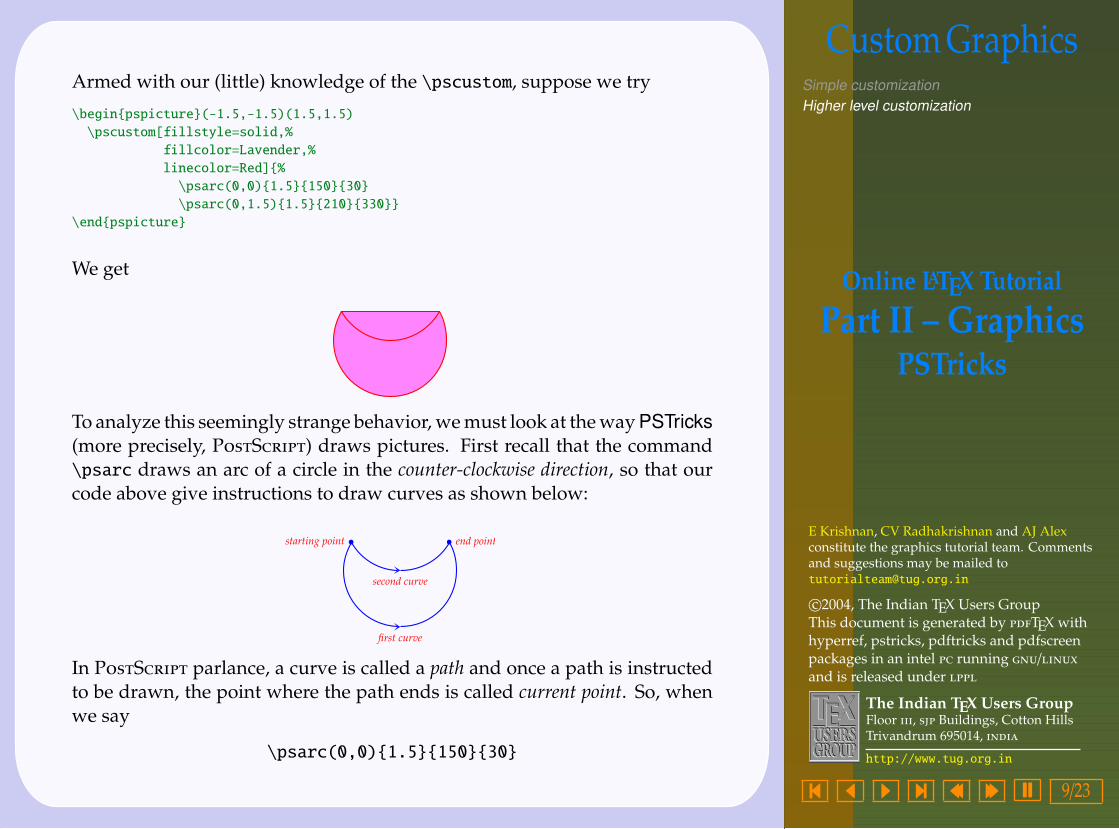
Armed with our (little) knowledge of the \pscustom, suppose we try
\begin{pspicture}(-1.5,-1.5)(1.5,1.5)
\pscustom[fillstyle=solid,%
fillcolor=Lavender,%
linecolor=Red]{%
\psarc(0,0){1.5}{150}{30}
\psarc(0,1.5){1.5}{210}{330}}
\end{pspicture}
We get
To analyze this seemingly strange behavior, we must look at the way PSTricks(more precisely, PS) draws pictures. First recall that the command\psarc draws an arc of a circle in the counter-clockwise direction, so that ourcode above give instructions to draw curves as shown below:
first curve
second curve
starting point end pointb b
In PS parlance, a curve is called a path and once a path is instructedto be drawn, the point where the path ends is called current point. So, whenwe say
\psarc(0,0){1.5}{150}{30}

Custom GraphicsSimple customizationHigher level customization
Online LATEX Tutorial
Part II – GraphicsPSTricks
E Krishnan, CV Radhakrishnan and AJ Alexconstitute the graphics tutorial team. Commentsand suggestions may be mailed [email protected]
c©2004, The Indian TEX Users GroupThis document is generated by TEX withhyperref, pstricks, pdftricks and pdfscreenpackages in an intel running /and is released under
The Indian TEX Users GroupFloor , Buildings, Cotton HillsTrivandrum 695014,
http://www.tug.org.in
� � � � � � 10/23
this is the state we are in:
path
b
current point
The starting point of the second path to be drawn by\psarc(0,1.5){1.5}{210}{330}is the beginning of the first path:
bb
current pointstarting pointof new path
The point to note (no pun!) is that here, the beginning of the new path is notthe current point. Now comes the rub: by default, \pscustom joins the currentpoint with the beginning of a new path. So
\begin{pspicture}(-1.5,-1.5)(1.5,1.5)
\pscustom[linecolor=Blue]{%
\psarc(0,0){1.5}{150}{30}
\psarc(0,1.5){1.5}{210}{330}}
\end{pspicture}
produces (without the arrows)

Custom GraphicsSimple customizationHigher level customization
Online LATEX Tutorial
Part II – GraphicsPSTricks
E Krishnan, CV Radhakrishnan and AJ Alexconstitute the graphics tutorial team. Commentsand suggestions may be mailed [email protected]
c©2004, The Indian TEX Users GroupThis document is generated by TEX withhyperref, pstricks, pdftricks and pdfscreenpackages in an intel running /and is released under
The Indian TEX Users GroupFloor , Buildings, Cotton HillsTrivandrum 695014,
http://www.tug.org.in
� � � � � � 11/23
bb
(Do you see why our earlier construction with \pscustomworked? There wehad three paths, with the beginning of each path the same as the current point).
So, what’s the way out? PSTricks also has a command \psarcn (“n”for negative) which draws the arc of a circle in the clockwise direction.Thus \psarc(0,0){1.5}{210}{330} and \psarcn(0,0){1.5}{330}{210}produce the same curve, but drawn in opposite directions:
\psarc(0,0){1.5}{210}{330} \psarcn(0,0){1.5}{330}{210}
Now we can easily draw the crescent:
\begin{pspicture}(-1.5,-2)(1.5,0.5)
\pscustom[fillstyle=solid,%
fillcolor=Lavender,%
linecolor=Red]{%
\psarc(0,0){1.5}{150}{30}
\psarcn(0,1.5){1.5}{330}{210}}
\end{pspicture}
Here’s another example, using \psarcn

Custom GraphicsSimple customizationHigher level customization
Online LATEX Tutorial
Part II – GraphicsPSTricks
E Krishnan, CV Radhakrishnan and AJ Alexconstitute the graphics tutorial team. Commentsand suggestions may be mailed [email protected]
c©2004, The Indian TEX Users GroupThis document is generated by TEX withhyperref, pstricks, pdftricks and pdfscreenpackages in an intel running /and is released under
The Indian TEX Users GroupFloor , Buildings, Cotton HillsTrivandrum 695014,
http://www.tug.org.in
� � � � � � 12/23
\psset{unit=1.5cm}
\begin{pspicture}(0,-1)(3,1)
\psset{linestyle=none,fillstyle=solid}\pscustom[fillcolor=Yellow]{%
\psarc(1,0){1}{60}{-60}
\psarcn(2,0){1}{240}{120}}
\pscustom[fillcolor=Blue]{%
\psarc(2,0){1}{240}{120}
\psarcn(1,0){1}{60}{-60}}
\pscustom[fillcolor=Green]{%
\psarc(1,0){1}{-60}{60}
\psarc(2,0){1}{120}{240}}
\end{pspicture}
The (default) behavior of PSTricks in joining the current point to the be-ginning of the new path can sometimes be of advantage. For example, in ourconstruction of a “stem” earlier, we need not explicitly mention the “base”,using\psline, if the two curves are specified to be drawn in suitable direc-tions:
\begin{pspicture}(-1,-1)(1,0)
\pscustom[linestyle=none,%
fillstyle=solid,%
fillcolor=Red]{%
\psplot{0}{-1}{x 1 add 2 exp 1 sub}
\psplot{1}{0}{x 1 sub 2 exp 1 sub}}
\end{pspicture}
8.2.2. Current point again
Another feature to note is that the paths drawn by \psline and \pscurvemake use of the current point as the first point; so also does \psplot with

Custom GraphicsSimple customizationHigher level customization
Online LATEX Tutorial
Part II – GraphicsPSTricks
E Krishnan, CV Radhakrishnan and AJ Alexconstitute the graphics tutorial team. Commentsand suggestions may be mailed [email protected]
c©2004, The Indian TEX Users GroupThis document is generated by TEX withhyperref, pstricks, pdftricks and pdfscreenpackages in an intel running /and is released under
The Indian TEX Users GroupFloor , Buildings, Cotton HillsTrivandrum 695014,
http://www.tug.org.in
� � � � � � 13/23
plotstyle=curve and \psbezier with only three points specified. Look atthese examples:
\psset{unit=0.75cm}
\begin{pspicture}(-1,-1.5)(4,4.5)
\colgrid(-1,-1)(4,4)
\pscustom[linecolor=Green,%
fillstyle=gradient,%
gradbegin=OliveGreen,%
gradend=GreenYellow,%
gradmidpoint=1]{%
\psline(0,0)(2,4)
\psplot[plotstyle=curve]{0}{2}{x 2 exp}}
\end{pspicture} -1 0 1 2 3 4-1
0
1
2
3
4
\begin{pspicture}(0,-0.5)(4,3.5)
\colgrid(0,0)(4,3)
\pscustom[linecolor=Blue]{%
\pscurve(0.5,2)(1,1.75)(1.5,2)(2,2.5)%
(2.5,2.75)(3,2.6)(3.5,2.25)
\pscurve(3.5,0.75)(3,0.4)(2.5,0.25)%
(2,0.5)(1.5,1)(1,1.25)(0.5,1)}
\end{pspicture}
0 1 2 3 40
1
2
3
8.2.3. Lifting the pen
The behavior of the commands such as \psline toward the current point canbe modified by setting the parameter liftpen, which can take values 0, 1 or2. The default value is 0 and this corresponds to the (default) behavior of

Custom GraphicsSimple customizationHigher level customization
Online LATEX Tutorial
Part II – GraphicsPSTricks
E Krishnan, CV Radhakrishnan and AJ Alexconstitute the graphics tutorial team. Commentsand suggestions may be mailed [email protected]
c©2004, The Indian TEX Users GroupThis document is generated by TEX withhyperref, pstricks, pdftricks and pdfscreenpackages in an intel running /and is released under
The Indian TEX Users GroupFloor , Buildings, Cotton HillsTrivandrum 695014,
http://www.tug.org.in
� � � � � � 14/23
treating the current point as the first point. With liftpen=1, the current pointis not treated as the first point, but a line is drawn from the current point tothe first point of the path, as with the other path drawing commands:
\begin{pspicture}(0,-0.5)(4,3.5)
\colgrid(0,0)(4,3)
\pscustom[linecolor=Blue]{%
\pscurve(0.5,2)(1,1.75)(1.5,2)(2,2.5)%
(2.5,2.75)(3,2.6)(3.5,2.25)
\pscurve[liftpen=1]%
(3.5,0.75)(3,0.4)(2.5,0.25)%
(2,0.5)(1.5,1)(1,1.25)(0.5,1)}
\end{pspicture}0 1 2 3 4
0
1
2
3
With liftpen=2, the current point is not taken as the first point, nor is a linedrawn from the current point to the first point of the path:
\begin{pspicture}(0,-0.5)(4,3.5)
\colgrid(0,0)(4,3)
\pscustom[linecolor=Blue]{%
\pscurve(0.5,2)(1,1.75)(1.5,2)(2,2.5)%
(2.5,2.75)(3,2.6)(3.5,2.25)
\pscurve[liftpen=2]%
(3.5,0.75)(3,0.4)(2.5,0.25)%
(2,0.5)(1.5,1)(1,1.25)(0.5,1)}
\end{pspicture}0 1 2 3 4
0
1
2
3
The pictures below show the last three pictures above with the parameter set-tings \fillstyle=solid and \fillcolor=Cyan for the \pscustom command:

Custom GraphicsSimple customizationHigher level customization
Online LATEX Tutorial
Part II – GraphicsPSTricks
E Krishnan, CV Radhakrishnan and AJ Alexconstitute the graphics tutorial team. Commentsand suggestions may be mailed [email protected]
c©2004, The Indian TEX Users GroupThis document is generated by TEX withhyperref, pstricks, pdftricks and pdfscreenpackages in an intel running /and is released under
The Indian TEX Users GroupFloor , Buildings, Cotton HillsTrivandrum 695014,
http://www.tug.org.in
� � � � � � 15/23
0 1 2 3 40
1
2
3
liftpen=0
0 1 2 3 40
1
2
3
liftpen=1
0 1 2 3 40
1
2
3
liftpen=2
The last picture may need some explanation; note that when we instruct an“open” curve to be “filled”, then the first and the last points are joined tomake a closed region, which is then filled.
8.2.4. Other tricks
Before discussing some other techniques, we must take a closer look at theway PS handles graphics. When we give instructions to draw apath in PS, it is not immediately drawn; we will also have to giveinstructions to draw it, or stroke it in PS terminology. Again, we willhave to give explicit commands to fill a region. The command \pscustomautomatically does the stroking and filling at the end, subject to the variouslinestyle and fillstyle options. But within \pscustom we ourselves canstroke or fill using the commands \stroke or \fill. We can also use thecommand \newpath to clear the current path and current point. Look at theexample below:

Custom GraphicsSimple customizationHigher level customization
Online LATEX Tutorial
Part II – GraphicsPSTricks
E Krishnan, CV Radhakrishnan and AJ Alexconstitute the graphics tutorial team. Commentsand suggestions may be mailed [email protected]
c©2004, The Indian TEX Users GroupThis document is generated by TEX withhyperref, pstricks, pdftricks and pdfscreenpackages in an intel running /and is released under
The Indian TEX Users GroupFloor , Buildings, Cotton HillsTrivandrum 695014,
http://www.tug.org.in
� � � � � � 16/23
\begin{pspicture}(-2,-2)(2,2)
\pscustom[linestyle=none]{%
\psarcn(0.865,-0.5){1}{330}{210}
\psarcn(-0.865,-0.5){1}{330}{210}
\psarc(0,0){2}{210}{330}\fill[fillstyle=solid,fillcolor=SpringGreen]
\stroke[linestyle=solid,linecolor=OliveGreen]
\newpath
\psarc(1.73,0){2}{150}{210}
\psarc(-1.73,0){2}{-30}{30}
\fill[fillstyle=solid,fillcolor=Goldenrod]
\stroke[linestyle=solid,linecolor=Red]}
\end{pspicture}
Here’s one of our earlier examples, coded using a single \pscustom insteadof the three used earlier:
\psset{unit=1.5cm}
\begin{pspicture}(0,-1)(3,1)
\pscustom[linestyle=none]{%
\psarc(1,0){1}{60}{-60}
\psarcn(2,0){1}{240}{120}
\fill[fillstyle=solid,fillcolor=Yellow]
\newpath
\psarc(1,0){1}{-60}{60}
\psarc(2,0){1}{120}{240}
\fill[fillstyle=solid,fillcolor=Green]
\newpath
\psarc(2,0){1}{240}{120}
\psarcn(1,0){1}{60}{-60}
\fill[fillstyle=solid,fillcolor=Blue]}
\end{pspicture}
Now suppose we want to produce something like this:

Custom GraphicsSimple customizationHigher level customization
Online LATEX Tutorial
Part II – GraphicsPSTricks
E Krishnan, CV Radhakrishnan and AJ Alexconstitute the graphics tutorial team. Commentsand suggestions may be mailed [email protected]
c©2004, The Indian TEX Users GroupThis document is generated by TEX withhyperref, pstricks, pdftricks and pdfscreenpackages in an intel running /and is released under
The Indian TEX Users GroupFloor , Buildings, Cotton HillsTrivandrum 695014,
http://www.tug.org.in
� � � � � � 17/23
0 1 2 3 40
1
2
3
As the previous examples show, tweaking the liftpen values is of no usehere, since in all these the curves are connected, one way or the other. Let’sfirst list what we want to do:
1. Draw the first curve
2. Give instructions to draw thesecond curve, with liftpen=1,without actually stroking it,and instructions to fill the re-gion between the curves
3. Draw the the second curvewith liftpen=2, but no filling.
We know how to do Steps 1 and 3 above; it’s Step 2 that is tricky; we usethe pair of commands \gsave...\grestore to do the job. Let’s see them inaction:

Custom GraphicsSimple customizationHigher level customization
Online LATEX Tutorial
Part II – GraphicsPSTricks
E Krishnan, CV Radhakrishnan and AJ Alexconstitute the graphics tutorial team. Commentsand suggestions may be mailed [email protected]
c©2004, The Indian TEX Users GroupThis document is generated by TEX withhyperref, pstricks, pdftricks and pdfscreenpackages in an intel running /and is released under
The Indian TEX Users GroupFloor , Buildings, Cotton HillsTrivandrum 695014,
http://www.tug.org.in
� � � � � � 18/23
\begin{pspicture}(0,-1)(4,3)\colgrid(0,0)(4,3)
\pscustom[linecolor=Blue]{%
\pscurve(0.5,2)(1,1.75)(1.5,2)(2,2.5)%
(2.5,2.75)(3,2.6)(3.5,2.25)
\gsave
\pscurve[liftpen=1]%
(3.5,0.75)(3,0.4)(2.5,0.25)%
(2,0.5)(1.5,1)(1,1.25)(0.5,1)
\fill[fillstyle=solid,%
fillcolor=Cyan]
\grestore
\pscurve[liftpen=2]%
(3.5,0.75)(3,0.4)(2.5,0.25)%
(2,0.5)(1.5,1)(1,1.25)(0.5,1)}
\end{pspicture}
0 1 2 3 40
1
2
3
As can be seen from this code, the implementation of Step 2 is done withinthe \gsave...\grestore command. We’ve noted that PS strokes orfills a path only on explicit instructions to do so and \pscustom automaticallystrokes or fills a path at the end. Within the commands \gsave...\grestorehowever, \pscustom does not stroke or fill a path, unless told. (In PS,the command gsave saves the current graphics state, such as the current path,current point, color, linewidth and so on to a stack and grestore restores thesaved state.) Thus in the example above, the code within this command pairdoes exactly what we want to do in Step 2 above.
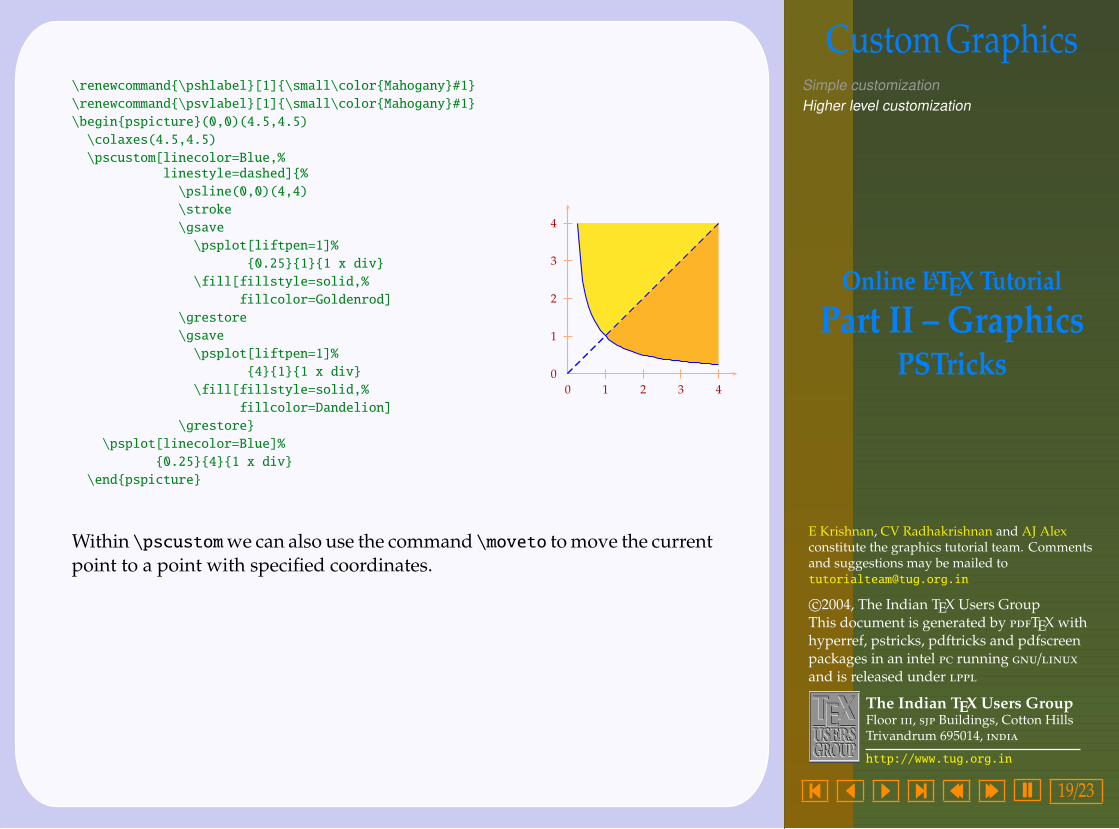
Here’s another example using \gsave...\grestore
Custom GraphicsSimple customizationHigher level customization
Online LATEX Tutorial
Part II – GraphicsPSTricks
E Krishnan, CV Radhakrishnan and AJ Alexconstitute the graphics tutorial team. Commentsand suggestions may be mailed [email protected]
c©2004, The Indian TEX Users GroupThis document is generated by TEX withhyperref, pstricks, pdftricks and pdfscreenpackages in an intel running /and is released under
The Indian TEX Users GroupFloor , Buildings, Cotton HillsTrivandrum 695014,
http://www.tug.org.in
� � � � � � 19/23
\renewcommand{\pshlabel}[1]{\small\color{Mahogany}#1}
\renewcommand{\psvlabel}[1]{\small\color{Mahogany}#1}
\begin{pspicture}(0,0)(4.5,4.5)
\colaxes(4.5,4.5)
\pscustom[linecolor=Blue,%linestyle=dashed]{%
\psline(0,0)(4,4)
\stroke
\gsave
\psplot[liftpen=1]%
{0.25}{1}{1 x div}
\fill[fillstyle=solid,%
fillcolor=Goldenrod]
\grestore
\gsave
\psplot[liftpen=1]%
{4}{1}{1 x div}
\fill[fillstyle=solid,%
fillcolor=Dandelion]
\grestore}
\psplot[linecolor=Blue]%
{0.25}{4}{1 x div}
\end{pspicture}
0 1 2 3 4
0
1
2
3
4
Within \pscustomwe can also use the command \moveto to move the currentpoint to a point with specified coordinates.

Custom GraphicsSimple customizationHigher level customization
Online LATEX Tutorial
Part II – GraphicsPSTricks
E Krishnan, CV Radhakrishnan and AJ Alexconstitute the graphics tutorial team. Commentsand suggestions may be mailed [email protected]
c©2004, The Indian TEX Users GroupThis document is generated by TEX withhyperref, pstricks, pdftricks and pdfscreenpackages in an intel running /and is released under
The Indian TEX Users GroupFloor , Buildings, Cotton HillsTrivandrum 695014,
http://www.tug.org.in
� � � � � � 20/23
\renewcommand{\pshlabel}[1]{\small\color{Mahogany}#1}
\renewcommand{\psvlabel}[1]{\small\color{Mahogany}#1}
\begin{pspicture}(0,0)(4.5,4.5)
\colaxes(4.5,4.5)
\pscustom[linecolor=Blue]{%
\psplot{0}{1.5}{x 2 exp}
\gsave
\psline(0,2.25)
\fill[fillstyle=solid,%fillcolor=Goldenrod]
\grestore
\gsave
\psline(1.5,0)
\fill[fillstyle=solid,%
fillcolor=Dandelion]
\grestore
\moveto(1.5,2.25)
\psplot{1.5}{2}{x 2 exp}}
\end{pspicture}
0 1 2 3 4
0
1
2
3
4
Within \pscustom, we can also transform the coordinate system in cer-tain ways. For example, the command \translate can be used to shift thecoordinate axes (parallel to themselves) to a new point, as in the examplebelow:

Custom GraphicsSimple customizationHigher level customization
Online LATEX Tutorial
Part II – GraphicsPSTricks
E Krishnan, CV Radhakrishnan and AJ Alexconstitute the graphics tutorial team. Commentsand suggestions may be mailed [email protected]
c©2004, The Indian TEX Users GroupThis document is generated by TEX withhyperref, pstricks, pdftricks and pdfscreenpackages in an intel running /and is released under
The Indian TEX Users GroupFloor , Buildings, Cotton HillsTrivandrum 695014,
http://www.tug.org.in
� � � � � � 21/23
\begin{pspicture}(0,-1.5)(5,4.5)
\pscustom[style=mystyle]{%
\pscurve(0.5,2)(1,1.75)(1.5,2)(2,2.5)%
(2.5,2.75)(3,2.6)(3.5,2.25)
\translate(1,-1)
\pscurve[liftpen=1]%
(3.5,2.25)(3,2.6)(2.5,2.75)%
(2,2.5)(1.5,2)(1,1.75)(0.5,2)
\closepath}
\end{pspicture} 0 1 2 3 40
1
2
3
4
0 1 2 3 40
1
2
3
4
Here, the style named mystyle is set as
\newpsstyle{mystyle}%
{linestyle=solid,%
linewidth=2pt,%
linecolor=Yellow,%
fillstyle=gradient,%
gradbegin=Yellow,%
gradend=Red,%
gradangle=10,%
gradmidpoint=1}
We have also drawn two coordinate grids, the lighter one showing the originalsystem and the darker one showing the changed system, the codes of whichare not shown in the example.
We can also use (within \pscustom) the command \scale to scale thecoordinate axes. It takes two numbers as arguments, the x-axis scaled by thefirst number and the y-axis scaled by the second number, as in this example:

Custom GraphicsSimple customizationHigher level customization
Online LATEX Tutorial
Part II – GraphicsPSTricks
E Krishnan, CV Radhakrishnan and AJ Alexconstitute the graphics tutorial team. Commentsand suggestions may be mailed [email protected]
c©2004, The Indian TEX Users GroupThis document is generated by TEX withhyperref, pstricks, pdftricks and pdfscreenpackages in an intel running /and is released under
The Indian TEX Users GroupFloor , Buildings, Cotton HillsTrivandrum 695014,
http://www.tug.org.in
� � � � � � 22/23
\begin{pspicture}(0,-1)(4,4.5)
\pscustom[style=mystyle]{%
\pscurve(0.5,2)(1,1.75)(1.5,2)(2,2.5)%
(2.5,2.75)(3,2.6)(3.5,2.25)
\scale{0.75 0.5}
\pscurve[liftpen=1]%
(3.5,2.25)(3,2.6) (2.5,2.75)%
(2,2.5)(1.5,2)(1,1.75)(0.5,2)
\closepath}
\end{pspicture}
0 1 2 3 40
1
2
3
4
0 1 2 3 40
1
2
3
4
If both axes are to be scaled by the same factor, we need only specify thisnumber only once within the \scale command.
The command \rotate (surprise!) rotates the axes by the angle specifiedin degrees, as in the example below:
\begin{pspicture}(-2,-1)(4,5)
\pscustom[style=mystyle]{%
\pscurve(0.5,2)(1,1.75)(1.5,2)(2,2.5)%
(2.5,2.75)(3,2.6)(3.5,2.25)
\rotate{15}
\pscurve[liftpen=1]%
(3.5,2.25)(3,2.6) (2.5,2.75)%
(2,2.5)(1.5,2)(1,1.75)(0.5,2)
\closepath}
\end{pspicture}
0 1 2 3 40
1
2
3
4
01
23
4
0
1
2
3
4
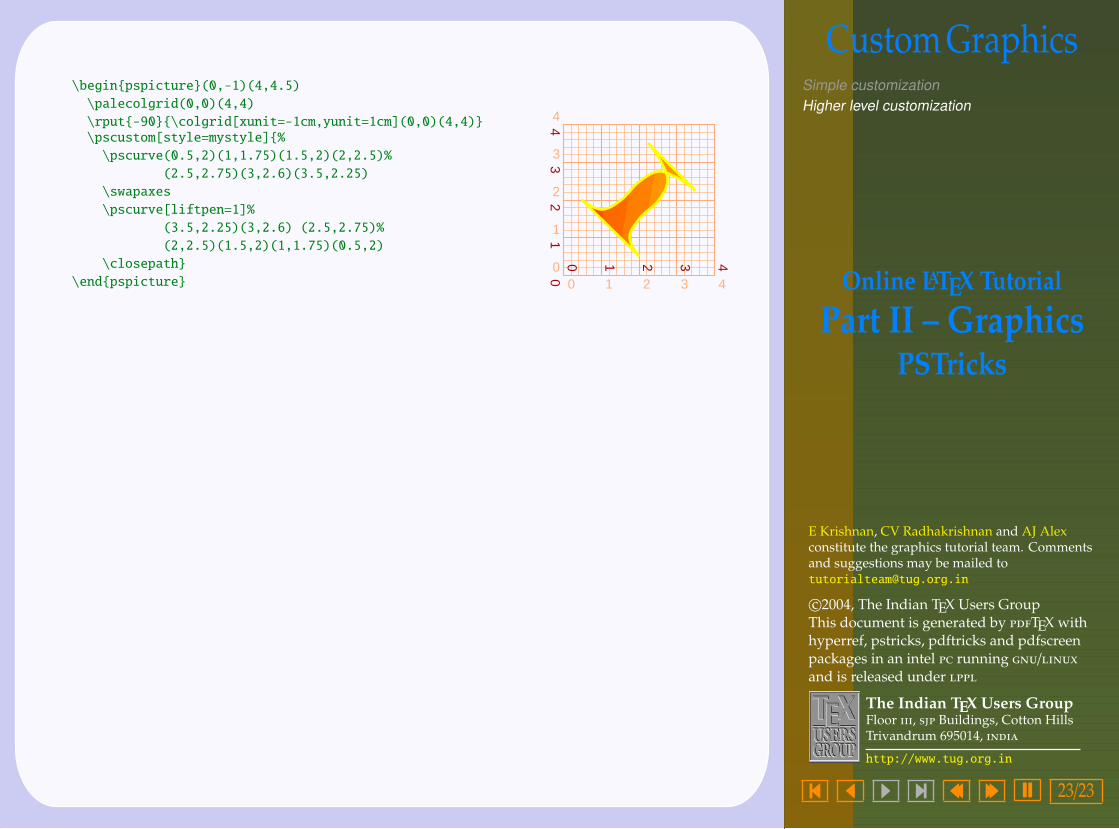
The coordinate axes can be interchanged with the \swapaxes command.
Custom GraphicsSimple customizationHigher level customization
Online LATEX Tutorial
Part II – GraphicsPSTricks
E Krishnan, CV Radhakrishnan and AJ Alexconstitute the graphics tutorial team. Commentsand suggestions may be mailed [email protected]
c©2004, The Indian TEX Users GroupThis document is generated by TEX withhyperref, pstricks, pdftricks and pdfscreenpackages in an intel running /and is released under
The Indian TEX Users GroupFloor , Buildings, Cotton HillsTrivandrum 695014,
http://www.tug.org.in
� � � � � � 23/23
\begin{pspicture}(0,-1)(4,4.5)
\palecolgrid(0,0)(4,4)
\rput{-90}{\colgrid[xunit=-1cm,yunit=1cm](0,0)(4,4)}\pscustom[style=mystyle]{%
\pscurve(0.5,2)(1,1.75)(1.5,2)(2,2.5)%
(2.5,2.75)(3,2.6)(3.5,2.25)
\swapaxes
\pscurve[liftpen=1]%
(3.5,2.25)(3,2.6) (2.5,2.75)%
(2,2.5)(1.5,2)(1,1.75)(0.5,2)
\closepath}
\end{pspicture} 0 1 2 3 40
1
2
3
4
01
23
40 1 2 3 4