part i: classification of manufactured commodities
TRANSCRIPT

This PDF is a selection from an out-of-print volume from the National Bureau of Economic Research
Volume Title: Commodity Flow and Capital Formation, Volume 1
Volume Author/Editor: Simon Kuznets
Volume Publisher: NBER
Volume ISBN: 0-87014-033-7
Volume URL: http://www.nber.org/books/kuzn38-1
Publication Date: 1938
Chapter Title: Part I: Classification of Manufactured Commodities
Chapter Author: Simon Kuznets
Chapter URL: http://www.nber.org/chapters/c4742
Chapter pages in book: (p. 11 - 118)

PART I
CLASSIFICATION OF MANUFACTURED
COMMODITIES
Preface
1 The Classification of Manufactured Commodities 13
2 Measurement of the Value of Output 15
a Adjustment for 'other' and 'secondary' products 15
b Estimates of a detailed commodity breakdown 16
c Adjustment of selected industries in 1919 and 1929 17
3 Allocation of Mixed Commodity Items among Constituent Classes 17
4 Comparison with Net Value of Manufactures 19
Basic Tables I—ito 1—8 27—118.


PART ICLASSIFICATION OF MANUFACTURED
COMMODITIES
PREFACE
1 THE CLASSIFICATION OF MANUFAC-TURED COMMODITIES
THE first task in the procedure by which the mostimportant elements in gross and net capital for-mation were measured was to segregate finishedcommodities from unfinished, with a view to asubsequent segregation of durable. commoditiesfrom among currently produced finished goods.The exhaustive source of primary information onthe output of finished commodities in this countryis the Biennial Census of Manufactures. It is theonly census that reveals, at frequent intervals, theflow of commodities, and that reports many com-modity items. In addition to segregating finishedcommoditIes from unfinished, the classification ofthe Census of Manufactures commodity informa-tion in conformity with the eventual aims of ourstudy, suggested in the Introduction, provides fora third category, servicing and repairs of durablegoods, some of which are reported in the Census ofManufactures. Moreover, construction materialsare segTegated from other unfinished commodities,since one set of estimates of total construction de-veloped in a subsequent part of our study restsupon the value of construction materials con-sumed. Thus, our primary classification of com-modities reported in the Census of Manufacturescontains four classes: finished, construction mate-rials, other unfinished, and servicing. But thisclassification cannot be applied directly to all Cen-sus data, in the sense that every commodity itemin the Census can be unequivocally set in one ofour four divisions. Some commodity items arepartly finished, partly unfinished; others arepartly construction materials, partly other unfin-ished; still others may combine all three. Thesemixed groups require further analysis for alloca-tion among the constituent classes. For this rea-son, the basic classification of manufactured prod-
[131
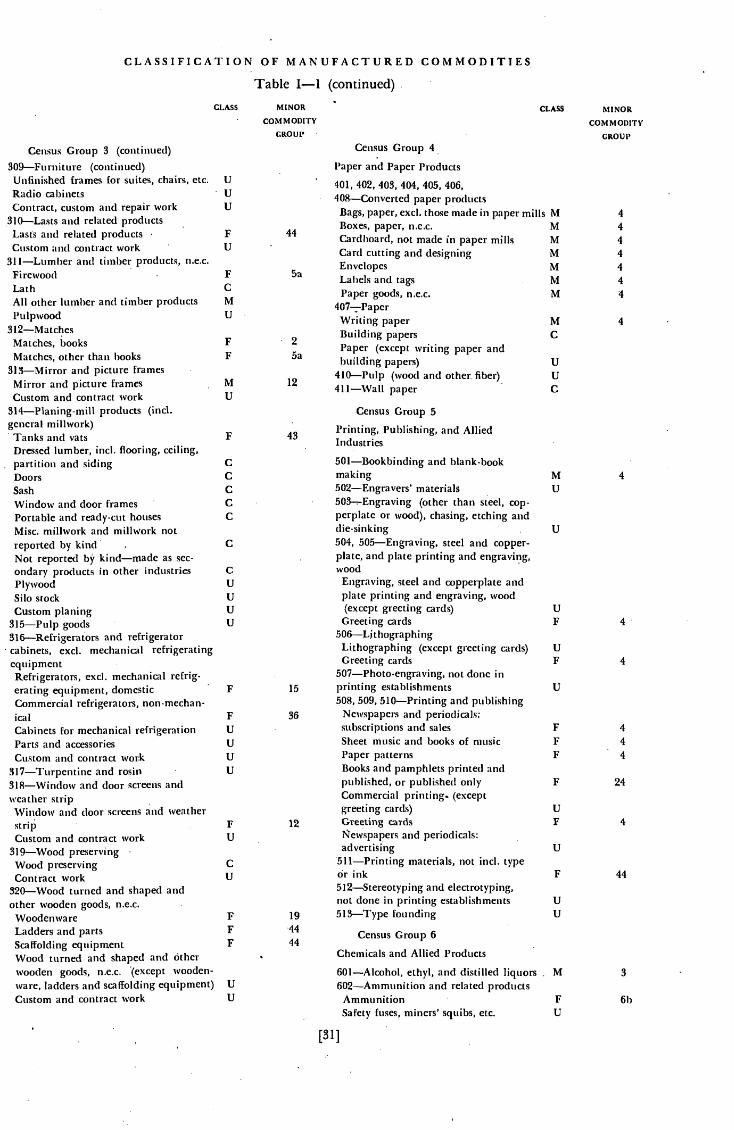
ucts in Table I—i provides for a fifth class, mixedcommodity items.
Finished commodities are in turn classified intoseveral minor groups, largely for practical reasons.It would he impossible to retain in the subsequentstatistical the hundreds of commodityitems distinguished in the Census of Manufac-tures. At the same time, valuable detail would belost if those numerous commodity items wereforthwith combined into the four major divisionsthat our analysis eventually uses: perishable, semi-durable, consumers' durable, and producers' du-rable. Therefore, it seemed advisable classifythe finished commodities into a fair number ofminor commodity groups, some fifty, and to retainthis classification in the subsequent analysis as longas the available data made this possible. Note A toTable I—i lists the minor groups; the number inthe table itself indicates the minor commoditygroup in which either the finished or the mixedfinished and unfinished commodity item reportedin the Census is placed.
The classification into minor commodity groupsis based upon several principles. The ultimate aimof distinguishing perishable, semidurable, anddurable commodities was paramount, since thesubsequent classification into the major divisionswas made with the minor commodity groups,without further reference to the hundreds ofcommodity items given in the Census of Manu-factures. The same procedure was followed in theapportionment of finished durable commoditiesbetween producers' durable and consumers' dura-ble. Within each of these four major divisidns theminor groups are formed by grouping togethercommodities that satisfy distinct types of wants:food products, tobacco products, stationery, cloth-ing, toys, shoes, automobile tires. In the subse-quent analysis some of the minor groups in Part
PART I
I are reallocated or combined, but the consequentreduction in the n'umber of groups is insignificantuntil the analysis passes from the value of outputat producers' prices to the value of the commodityflow at the cost to consumers. At this point, in PartV, the absence of detailed data on distributivemargins necessitates combining the fifty minorgroups into the four major divisions, and limitingthe subsequent estimates to the latter.
Since the allocation of commodities among theminor and major groups is thus basic to the entirestudy, it is given fully in Table I—i. Careful inspec-tion of the table reveals the problems encoun-tered. No single commodity item reported in theCensus of Manufactures can be considered en-tirely finished or unfinished. No matter how com-pletely fabricated non-durable commodity maybe, it is unfinished in our classification if con-sumed in the business process; and small amountsof raw materials or semifinished products may beused by ultimate consumers. Thus beverages, al-though preponderantly a finished commodity,may on some occasions be used not by ultimateconsumers but by business agencies. Cocoa butter,although preponderantly an unfinished commod-ity, may be sold in small amounts to ultimate con-sumers for household use. In the strict sense of theclassification, all commodity items are mixed.But it is impracticable to attempt to correct forthe very small fraction of the total volume ofbeverages that may he utilized in a businessprocess, or for the minute fraction of cocoa but-ter that passes directly to ultimate consumers.Therefore, only when, on the basis of availableknowledge, there was reason to suspect that thefraction of a different use was appreciable was thecommodity item classified as mixed, and then sub-jected in Table 1—3 to further analysis designed tosegregate its constituent classes.
In connection with the distinction between fin-ished and unfinished commodities, the treatmentof parts deserves special mention. There was nodoubt that the commodities of which the re-ported items were parts could be classified as fullyfinished commodities (industrial machinery, cars,
and that parts sold to other manufacturersbelonged to the unfinished class. The questionarose with reference to parts sold as such for re-placement in already existing durable commodi-ties in the hands of their users. Here, especiallyamong producers' durable commodities, partshave a rather long life; and the total of severalmachines may be treated as a combination of parts
since they are ordinarily replaced piece by pieceuntil only the framework of the machine survives.It, therefore, seemed advisable to treat parts ofproducers' durable commodities for sale as suchas finished durable commodities. As the case forsuch a treatment of parts of consumers' durablecommodities seemed much weaker, they weretreated as unfinished.
The approximatc character of the distinctionbetween finished and unfinished applies, al-though less significantly, to the classification offinished commodities among the fifty odd minorcommodity groups. Here the are largelyinstitutional in character, and hence by definitionthe distinction could not be as clear-cut as thatbetween finished and unfinished commodities.Nevertheless, in scrutinizing this classification itmust he borne in mind that the resulting minorcommodity groups, with a few exceptions to benoted in Part II, are cast as units into the four ma-jor divisions: perishable, semidurable, consumers'durable, and producers' durable. Hence, if aminor commodity group includes both perishableand semidurable commodities, or commoditiesthat while durable may be used by both ultimateconsumers and producers, the subsequent classi-fication into the four major divisions reflects thisadmixture within the minor commodity group.In general, the minor commodity groups havebeen so constructed as• to prevent the grouping ofcommodities that belong to different major divi-sions in respect of their durability. But lack ofpertinent data made a precise distinction betweenI)rothlcels' and consumers' goods impossible. Asa result, the subsequent classification of durablecommodities and consumers' and producers'goods is largely on the basis of preponderant use.This probably causes a slight underestimate of thevolume of producers' goods and a correspondingslight overestimate of the volume of consumers'goods.
The services rendered by manufacturing enter-prises are not classified with the same detail asare the commodity items themselves. However,a distinction, based on the characteristics of thecommodity totals in the industries under whichthe services are reported in the Census of Manu-factures, is made between services rendered inconnection with consumers' durable commoditiesand with producers' durable commodities.
1 Throughout this report, consumers indude not only house-holds hut also larger groups such as hospitals, charitable in-stitutions, and hotels.
[I 411
CLASSIFICATION OF MANUFACTURED COMMODITIES
$393,269,849
375,132,530
18,137,319
13,137,319
388,231,171by cominod-
Manufactures, 1929, Volume II, Reports by In-dustries (Table 3, p. 117).1 Confectionery industry, all prod-
ucts, total value2 Confectionery (mci. salted
nuts)3 Other products, not normally
belonging to the industry4 Confectionery (md. salted
nuts) made as secondary prod-ucts in other industries
5 Confectionery (mci. saltednuts), all industries: Aggregatevalue (sum of lines 2 and 4)
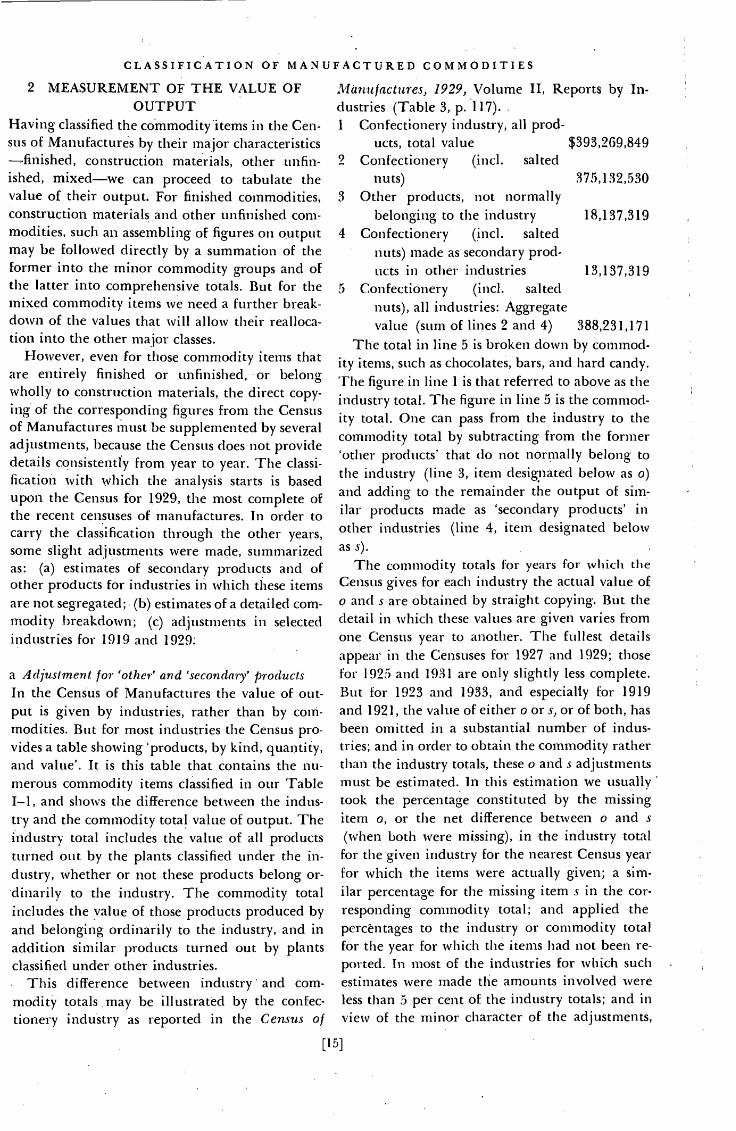
The total in line 5 is broken downity items, such as chocolates, bars, and hard candy.The figure in line 1 is that referred to above as theindustry total. The figure in line 5 is the commod-ity total. One can pass from the industry to thecommodity total by subtracting from the former'other products' that do not normally belong tothe industry (line 3, item designated below as o)and adding to the remainder the output of sim-ilar products made as 'secondary products' inother industries (line 4, item designated belowas s).
2 MEASUREMENT OF THE VALUE OFOUTPUT
Having classified the commodity items in the Cen-sus of Manufactures by their major characteristics
construction materials, other unfin-ished, mixed—we can proceed to tabulate thevalue of their output. For finished commodities,construction materials and other unfinished com-modities, such an assembling of figures on outputmay be followed directly by a summation of theformer into the minor commodity groups and ofthe latter into comprehensive totals. But for themixed commodity items we need a further break-down of the values that will allow their realloca-tion into the other major classes.
However, even for those commodity items thatare entirely finished or unfInished, or belongwholly to construction materials, the direct copy-ing of the corresponding figures from the Censusof Manufactures must be supplemented by severaladjustments, l)ecause the Census does not providedetails consistently from year to year. The classi-fication with which the analysis starts is basedupon the Census for 1929, the most complete ofthe recent censuses of manufactures. In order tocarry the classification through the other years,some slight adjustments were made, summarizedas: (a) estimates of secondary products and ofother products for industries in which these itemsare not segregated;. (b) estimates of a detailed com-modity breakdown; (c) adjustments in selectedindustries for 1919 and 1929;
a Adjus/ment for 'other' and 'secondary' productsIn the Census of Manufactures the value of out-put is given by industries, rather than by com-modities. But for most industries the Census pro-vides a table showing 'products, by kind, quantity,and value'. It is this table that contains the nu-merous commodity items classified in our TableI—i, and shows the difference between the indus-try and the commodity total value of output. Theindustry total includes the value of all productsturned out by the plants classified under the in-dustry, whether or not these products belong or-dinarily to the industry. The commodity totalincludesthe value of those products produced byand belonging ordinarily to the industry, and inaddition similar products turned out by plantsclassified under other industries.
This difference between industry and com-modity totals may be illustrated by the confec-tionery industry as reported in the Census of
[15]
The commodity totals for years for which theCensus gives for each industry the actual value ofo and s are obtained by straight copying. But thedetail in which these values are given varies fromone Census year to another. The fullest detailsappear in the Censuses for 1927 and 1929; thosefor 1925 and 1931 are only slightly less complete.But for 1923 and 1933, and especially for 1919and 1921, the value of either o or s, or of both, hasbeen omitted in a substantial number of indus-tries; and in order to obtain the commodity ratherthan the industry totals, these o and s adjustmentsmust be estimated. In this estimation we usuallytook the percentage constituted by the missingitem o, or the net difference between o and s(when both were missing), in the industry total
for the given industry for the nearest Census yearfor which the items were actually given; a sim-ilar percentage for the missing iteni s in the cor-responding commodity total; and applied thepercentages to the industry or commodity totalfor the year for which the items had not been re-ported. In most of the industries for which suchestimates were made the amounts involved wereless than 5 per cent of the industry totals; and inview of the minor character of the adjustments,

PART I
it was not considered necessary to present them indetail.2
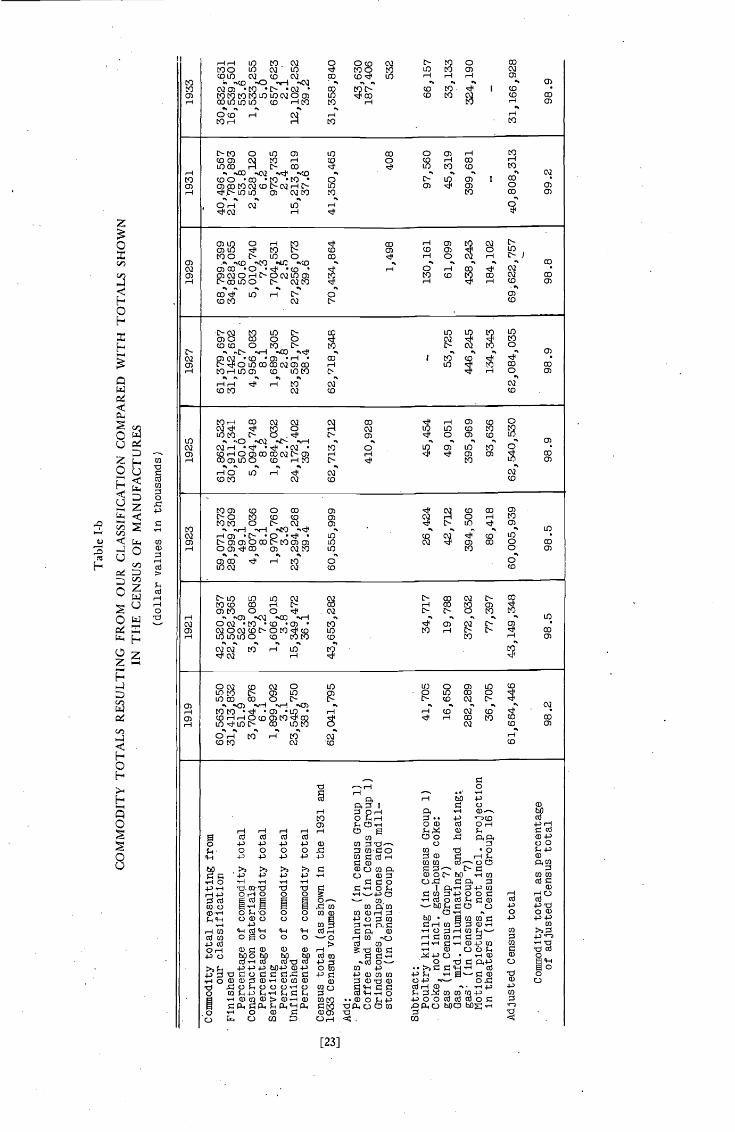
One aspect of this o and s adjustment, however,requires specific'mention. In all years, even whenmost detail is provided by the Census for this item,the reallocation of the 'other products' not nor-mally belonging to the specific industries amongthe specific commodity totals reported as 'second-ary products' is not complete. Hence, total outputreported under the commodity classification as'secondary products' is less than the total reportedunder the several industries as 'other products'.The Census thus contains a volume of manufac-turing output that cannot be allocated within thecommodity classification, but that has been allo-cated within the industry classification. This ex-plains the fact that when in the analysis in Part Iwe retabulate the Census data on the value ofproducts in our commodity and service classifica-tion, the total is less than the total value of outputreported in the Census of Manufactures itself.The difference (Table I—b) is minor when ex-pressed as a percentage of total output, rangingfrom 0.8 per cent in the lowest year to 1.8 per centin the highest year, although in absolute figures itmeans over a billion dollars in the highest year.
Offhand, one would be inclined to distributethis unal locable remainder proportionally amongthe various commodity groups, at least among themajor divisions. But more careful inspection ofthe Census data indicates that the large itemsamong 'other products' that appear never to havebeen recovered among the 'secondary products'are mainly The outstanding examplesare the by-products of the meat-packing industrywhich provide raw materials for other industries,and some of the 'other products' in the motorvehicle industry. For this reason it seemed advis-able to treat the entire difference as belonging tothe group of unfinished commodities.
b Estimates of a detailed commodity breakdownThe commodity classification in Table I—i is
based upon the Census of Manufactures for 1929,which provides the most comprehensive and de-tailed distribution of the value of output amonghundreds of commodity items. The Census datafor 1925, 1927, and 1931 are almost as detailed as
2 In 1933 the commodity breakdown for a small fraction of theoutput of some industries was reported on an: abbreviatedschedule. This resulted in an item on the products table en-titled (in the industry used here as an example)and other products not reported separately'. This item was at-located proportionally among the more detailed items re-ported on the detailed schedules.
those for 1929. But prior to 1925 and partly for1933, some of the commodity items reported sep-arately during 1929 are combined; and for theseyears a detailed breakdown of the value of outputmust be estimated. The commodity items whosevalue of output was thus estimated, the percentagebreakdown on which the estimates were based,and the years for which the estimates had to bemade, are all assembled in Table 1—2. The generalprocedure, the only one easily available, was toapply the percentage allocation of the value of out-put in the nearest Census years for which theitems were. given separately to the combined totalfor the other years. For a few items, listed sep-arately in the footnotes to Table 1—2, the esti-mate was based on a different procedure.
Brief inspection of Table 1—2 shows that for1919, 1921, and 1923, and to a much smaller ex-tent for 1933, the value of output of a substantialportion of the detailed commodity items had to beestimated. By . the application of a constant per-centage allocation we obtained but crude approxi-mations to the detailed commodity items. Thatthe value of chocolate and chocolate coatings was55 and 45 per cent, respectively, of the combinedtotal in 1923 is no warrant that the same percent-age distribution was true of the combined totalin 1921 or 1919. However, the crude character ofthe results is not as significant for the value ofoutput for the minor commodity groups as foreach of the detailed commodity. items, since sev-eral items whose, output is estimated separatelyare combined in the total within a single minorcommodity group. And this reduction of the pos-sible error in the estimating procedure is stillgreater in the major commodity divisions, the fourcategories that are distinguished in our final setof estimates. The initial estimates were made asdetailed as possible, but the results were subse-quently combined into groups so large that thefinal values would be little affected by the possiblecrudities of the estimating procedure at the earlierand more detailed stages of the investigation.
By comparing Tables 1—1, 1—2, and 1—4 a criticalreader can easily see which particular minor com-modity groups are likely to be distorted by errorsimplicit in our simple method of estimating thevalue of output for the detailed commodity itemsnot reported separately in some Census years. Itis difficult to measure this effect quantitatively.But, on the whole, the value of output for theminor commodity groups is not greatly affectedby the crudity of the estimating procedure; andthe few groups for which it is likely to be greatly
[16]
CLASSIFICATION OF MANUFACTURED COMMODITIES
affected, may be recombired into more compre-hensive divisions, in order to avoid substantialerrors.
c Adjustment of selected industries in 1919 and 1929The Census of Manufactures reported for 1919the output of all manufacturing establishments,excluding only those units that had a gross valueof output less than $500; but since 1919 it has ex-einpted from coverage establishments with a grossvalue of output under For the manufac-turing industry as, a whole, and for all save a fewindustries, this rise in the exemption limit causedonly an insignificant difference in total output,and had little effect on the movement from 1919to 1921. In a few industries, however, the outputof establishments with a gross value from $500 to$5,000 accounted for more than 2 or 3 per cent oftotal output, and for these an adjustment wasmade to render the value of output for 1919 com-parable witirthat for 1921 and subsequent years.4The total adjustment (i.e., deduction from the1919 output) amounted to less than 60 milliondollars, an exceedingly minor correction whencompared not only with the total output of manu-factures in 1919, but even with the outkut o. thethirteen industries in question.
Another minor adjustment was made for Se-lected industries in 1929. For that year the Censusof Manufactures asked for reports on the value ofsales rather than of output. For most industriesthis shift in the basis of reporting from productionto sales involved no significant change. But forseventy-six industries, in which inventories of fin-ished products were assumed.to be important, theCensus asked for reports on the value of output,and has supplied separate data on changes in in-ventories (in Distribution of Sales of Manufac-turing Plants, Table 3). Where such inventorychanges were relatively insignificant, or occurredin industries whose products were classified by usas unfinished, the reported production values werenot adjusted. But for some industries, producingfinished commodities and showing significantchanges in inventories, values for sales.rather than
for output were used because we wished to esti-mate eventually the distributive and transporta-tion margins in 1929; and for this purpose data onsales by manufacturers were more thandata on output.
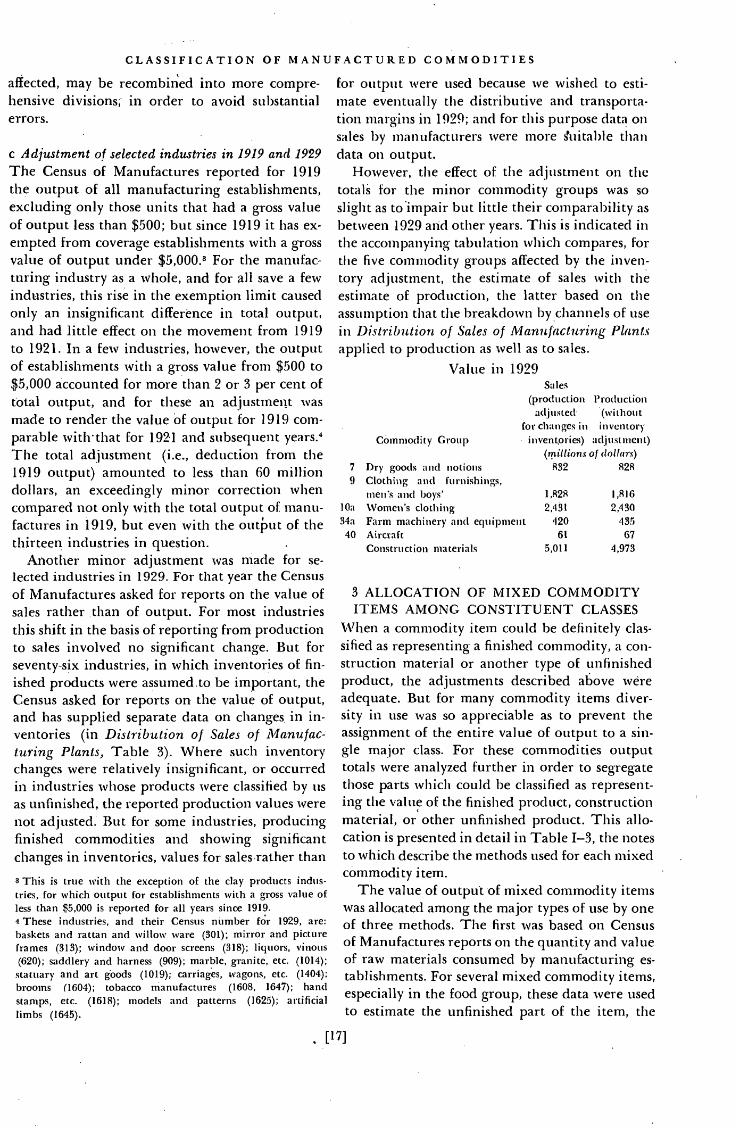
However, the effect o. the adjustment on thetotals for the minor commodity groups was soslight as to'impair but little their comparal)ility asbetween 1929 and other years. This is indicated inthe accompanying tabulation which compares, forthe five commodity groups affected by the inven-tory adjustment, the estimate of sales with theestimate of production, the latter based on theassumption di at the breakdown by channels of usein Distribution of Sales of Manufacturing Plantsapplied to production as well as to sales.
Value in 1929
1,816
2,4304
3 ALLOCATION OF MIXED COMMODITYITEMS AMONG CONSTITUENT CLASSES
When a commodity item could be definitely clas-sified as representing a finished commodity, a con-struction material or another type of unfinishedproduct, the adjustments described above wereadequate. But for many commodity items diver-sity in use was so appreciable as to prevent theassignment of the entire value of output to a Sin-gle major class. For these commodities outputtotals were analyzed further in order to segregatethose parts which could be classified as represent-ing the value of the finished product, constructionmaterial, or other unfinished product. This allo-cation is presented in detail in Table 1—3, the notesto which describe the methods used for each mixedcommodity item.
The value of output of mixed commodity itemswas allocated among the major types of use by oneof three methods. The first was based on Censusof Manufactures reports on the quantity and valueof raw materials consumed by manufacturing es-tablishments. For several mixed commodity items,especially in the food group, these data were usedto estimate the unfinished part of the item, the
Sales(production Productionadjusted (without
for changes in inventoryCommodity Group inventpries) adjustment)
(millions of (loliarx)7 Dry goods and notions 832 828
9 Clothing and furnishings,men's and l)Oys' 1,828
lOa Women's clothing 2,431
34a Farm machinery and equipment 42040 Aircraft 61
Construction materials 5,01 1
a This is true with the exception of the clay products indus-tries, for which output for establishments with a gross value ofless than $5,000 is reported for all years since 1919.4 These industries, and their Census number for 1929, are:baskets and rattan and willow ware (301); mirror and pictureframes (313); window and door screens (318); liquors, vinous(620); saddlery and harness (909); marble, granite, etc. (1014);statuary and art goods (1019); carriages, wagons, etc. (1404.);
brooms (1604); tobacco manufactures (1608, 1647); handstamps, etc. (1618); models and patterns (1625); artificiallimbs (1645).
,. [17]

PART I
remainder constituting the finished part. For thosemixed commodities to which another method ofallocation was applicable the Census data on thevalue consurhed by manufacturing plants wereused only if the total unfinished as estimated onthe basis of them was larger than that resultingfrom the application of a different procedure. Thereason was the possibility that the Census of Man-ufactures reports on consumption of raw materialsunderestimate the value of the commodity utilizedin industrial operation. For other mixed commod-ity items, for which no such check was possible,the Census data on raw materials consumed wereused directly. The mixed commodity items towhich this first method was applied, and the de-tailed data underlying its application, are set forthin Note A to Table 1—3.
The second method of allocation was based onthe Census data in Distribution of Sales of Manu-facturing Plants and on the details in the Censusof Wholesale Distribution for 1929. The formergives for every industry the proportion of totaloutput sold to wholesale outlets of various types,to retailers, to industrial consumers, and to ulti-mate consumers. The sales to industrial consum-ers by manufacturing plants, when applied to themixed commodity item, result in the first estimateof the unfinished part of the corresponding total.
Sales to retailers may be assumed to be largelydestined for ultimate consumers, and hence rep-resent finished commodities. But sales by manu-factitring plants to wholesale outlets must be an-alyzed further to show what part of the sales bywholesalers is to industrial consumers, and hencerepresents another unfinished part of the mixedcommodity total. This estimate of sales by whole-salers to industrial consumers is undertaken onthe basis of the detailed distribution of sales for1929 in the U. S. Summary of Wholesale Distribu-tion. Thus, for the mixed commodity items allo-cated l)y the second method, the unfinished partrepresents the portion based on the percentages ofsales of the corresponding commodity group toindustrial consumers by the manufacturing plants,either directly Or through the channels of whole-sale trade. Note B to Table 1—3 describes thismethod in detail, lists the mixed commodity itemsto which it has been applied, and shows the per-centages used in this breakdown of mixed corn-moclity items.
Both methods must, obviously, be checked andsupplemented with other information on the al-location of commodities among the major typesof use. Neither can determine the allocation of a
mixed commodity item to construction materialsor other u'nfinished products. Besides, even whenthe allocation is to finished or unfinished, bothmethods should be checked whenever possible.Tb this end, additional information was culledfrom the available published sources. Othersources of information were trade associations andcommodity experts, to whom all estimates werecirculated with a request that they review the esti-mated allocation of the mixed commodity itemsand suggest any modifications or changes thatseemed advisable. Note C to Table 1—3 presentsin detail all the items allocated by a procedureother than the first two, and cites the source of theinformation determining each allocation.
The principal limitation of the allocation of themixed commodity items is that most of the dataare for 1929. For example, in recent years theCensus of Manufactures data on the consumptionof raw materials are available in detail only for1929, and sometimes for'1931. Since Distributionof Sales of Manufacturing Plants is available onlyfor 1929 the second method camiot be applied toother years.5 And most of the published and Un-1)ublished information on the distribution ofcommodities among various uses is available alsoonly for recent years. For this reason most mixedcommodity items for years other than 1929 wereallocated hyapplying to the total the percentagesestablished for 1929. The items excepted are thosefor which published or unpublished informationthrew some light on the changes in the allocationover the period studied. Fortunately such infor-mation was available for most items in which 'thechanges were especially marked, and hence hadaroused the attention of students.
In addition to this important qualification ofthe allocation for years other than 1929 two com-ments on the results of this analysis are of interest.First, our methods quite possil)ly underestimatesomewhat the unfinished part of the mixed com-modity total, and hence overestimate the finishedpart, particularly of the items that were estimatedon the basis of the consumption of raw materials.However, since the most important allocationswere checked by correspondence with trade asso-ciations and commodity experts, the error is per-haps not great.
Second, at this stage of our analysis we consid-ered as finished not only the part'of the mixedcommodity total that goes to ultimate consumers,l)ut also that which is exported. This interpreta-5 Similar data in the Censuses for 1935 appeared too late to beutilized in the present study.
[18]

CLASSIFICATION OF MANUFACTURED COMMODITIES
tion is necessary, because in both the first and sec-ond methods of allocation we subtract from thetotal as unfinished only that part which flows todomestic industrial consumers. Similarly, in ob-taining information from trade associations wetook care to emphasize that the finished part, inour definition, included the part exported. Only ata later stage in our analysis, when we passed fromdomestic production to production destined fordomestic consumption, did our groups of finishedcommodities exclude completely all unfinishedproducts. But even at the present stage of theanalysis, unfinished products destined for exportconstitute merely a minor fraction of the finishedcommodity items.
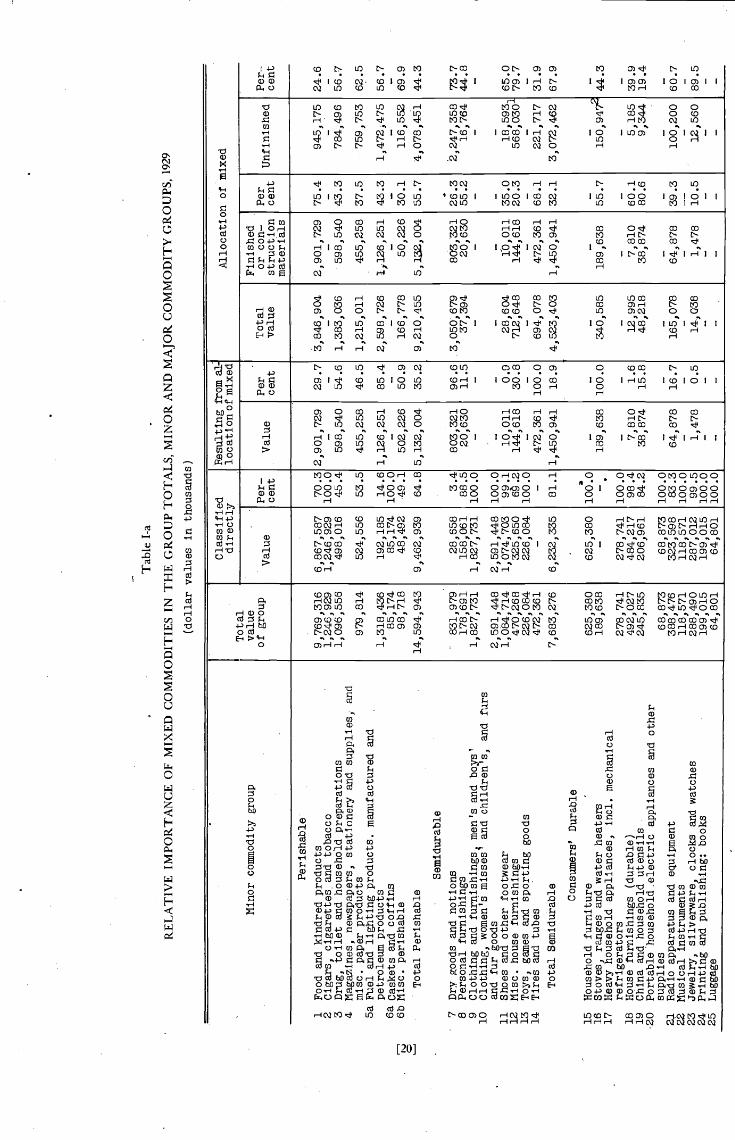
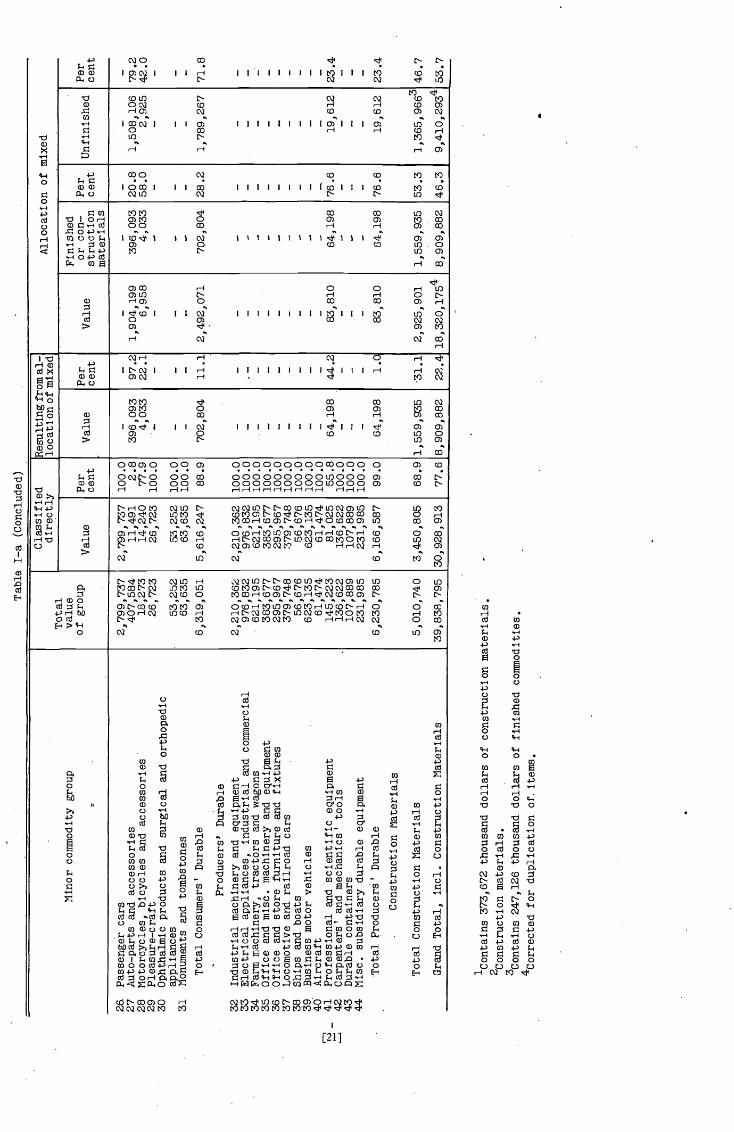
The adequacy of the allocation for. both 1929and other years may be.judged critically from thedetailed notes to Table 1—3. We now merely indi-cate the importance of the mixed commodityitems in the minor or major commodity groups•(Table I—a). The comparison of mixed outputwith that directly classifiable in the major andminor commodity gr@ups shows the area withinwhich the estimating described above had to beundertaken, and the possible importance that er-rors in the estimates would have in the totals forthe minor and major commodity classes, respec-tively.
Of the grand total, 39.8 billion dollars, of fin-ished commodities, plus construction materialsbut excluding the value of servicing, 30.9 billion,or 78 per cent, were classified as finished or con-struction materials directly, without further anal-ysis as mixed commodity items. Total output ofthe latter accounted in 1929 for 18.3 billion dol-lars, of which 8.9 billion were allocated to eitherfinished commodities or construction materials,and the rest, 9.4.billion dollars, to unfinished. Thearea within which the estimating was done was,therefore, fairly wide, and the addition to the totalresulting from the estimate, fairly substantial. Still,if we assume that the distinction between finished,construction materials, other unfinished, andmixed was correct, an error of even 20 per cent inthe allocation of the mixed commodity total, arather improbable magnitude, would imply anerror of less than 5 per cent in the total of finishedcommodities and construction materials.
Of greater significance and interest is the di-verse importance of the mixed commodity itemsamong the minor commodity groups and the fourmajor commodity classes. Naturally, the mixeditems are of greatest importance among commodi-ties with a slight degree of fabrication and rela-
[19]
tively short average life. It is, therefore, notsurprising to find that in such minor groups asfoodstuffs, petroleum products, or dry goods andnotions, the proportion of the total finished valueobtained as a result of the allocation of mixeditems is large. On the other hand, in groups cover-ing such highly fabricated products as musical in-struments, heavy household appliances, passengercars, or industrial machinery, there is little possi-bility of immediate consumption in a businessprocess. Consequently, the estimating procedureby which mixed items were allocated is of greatestimportance for perishable goods and constructionmaterials; of much less importance for the semi-durable group; of some significance for consum-ers' durable products; and of practically no signifi-cance for the producers' durable group. For ourfinal estimates of capital formation the threegroups—construction materials, consumers' du-rable, and producers' durable—are most impor-tant. For two groups the allocation of mixedproducts is of small or no importance; for con-struction materials it is based upon diverse, spe-cific information, rather than upon the usualmethods of value of materials consumed by manu-facturing plants or distribution of sales.
4 COMPARISON WITH NET VALUE OFMANU FACTURES
Tables 1—4 to 1—6 bring together the results of thevarious adjustments and estimates, and show thevalue of output for the minor commodity groups,total output of construction materials, and thevalue of services rendered by manufacturing es-tablishments, for each Census year. To completethe record, the estimated values of unfinishedproducts are given in Table 1—7, for sixteenmajor Census groups.
The brief recapitulation and comparison withthe Census totals (Table I—b) show that our anal-ysis does not account for the entire output re-ported in the Census, and, on the other hand, addsafew items not reported there. We found no roomin our classification for the following commocli-ties and industries reported in the Census: gas (acommodity reported under two industries), mo-tion pictures (industry), and poultry killing (in-dustry).° On the other hand, we supplied estimatesfor the coffee and spice, and the gTindstone, pulp-stone, and millstone industries for years for whichthe Census failed to include them. However, the
6 This industry is not reported continuously in the Census, andwas estimated in Part II of our study under non-manufacturedproducts.
Tab
le I
-a
RE
LA
TIV
E I
MPO
RT
AN
CE
OF
MIX
ED
CO
MM
OD
ITIE
S IN
TH
E G
RO
UP
TO
TA
LS,
MIN
OR
AN
D M
AJO
R C
OM
MO
DIT
Y G
RO
UPS
, 192
9
(dol
lar
valu
es in
thou
sand
s)
Classified
directly
Resulting froinal
location of mixed
Allocation of mixed
.
hinor commodity group
Total
value
of group
.
.
Value
Per—
cent
vajUe
.
Per
cent
Total
value
Finished
or con—
struction
Per
cent
TI f
inis
hed
ufl
Per--
cent
.materials
Perishable
.
1Food and kindred products
2Cigars, cigarettes, and
toba
cco
3Drug,
toile
tand
hous
ehol
dpreparations
4newspapers, stationery and
supp
lies,
and
mis
c.products
5a Fuel and
light
ing
products, manufactured and
9,769,316
1,246,929
1,096,556
979,814
6,867,587
1,246,929
498,016
524,556
70.3
100.0
45.4
53.5
2,901,729
—59
8,54
0
455,258
29.7
— 54.6
46.5
3,846,904
—1,
383,
036
1,215,011
2,901,729
—59
8,54
0
455,258
75.4
— 43.3
37.5
945,
175
—
784,
496
759,753
24.6
— 56.7
62.5
petroleum products
6a Caskets and
coff
ins
6bNisc. perishable
1,318,436
85,174
98,718
192,185
85,174
48,492
14.6
100.0
49.1
1,126,251
—50
2,22
6
85.4
— 50.9
2,598,726
—16
6,77
8
1,126,251
— 50,2
26
43.3
—
30.1
1,472,475
—11
6,55
2
56.7
— 69.9
Total Perishable
.14,594,943
9,462,939
64.85,132,004
35.2
9,210,455
5,13
2,00
455.7
4,078,451
44.3
Semidurable
,.
26.3
55.2
— —
35.0
20.3
— 68.1
•7
Drv Roods and
notio
ns8
Personal furnishings
9Clothing and
furn
ishi
ngs2
men's arid
boys
'10
Clothing, women's misses1 arid
child
ren'
s,arid
furs
and.
fur goods
11
Shoes and
othe
rfootwear
12
Nlsc. house furnishings
13
Toys, gaines and
spor
ting
goods
14
Tires and tubes
"83
1,97
9178,691
1,827,731
2,591,448
1,084,714
470,268
226,084
472,361
28,658
158,061
1,827,731
2,591,448
1,074,703
325,650
226,084
—
3.4
88.5
100.0
100.0
99.1
100.0
—
803,321
20,630
—.
— 10,0
11144,618
—47
2,36
1
96.6
11.5
— — 0.9
30.8
—10
0.0
.3,050,679
37,394
— — 28,6
04712,648
—69
4,07
8
803,321
20,630
— — 10,0
11144,618
—47
2,36
1
2,247,358
16,764
— —
568,030
—22
1,71
7
73.7
44.8
— 65.0
79.7
— 31.9
Total Semidurable
7,683,276
6,232,335
81.1
1,4-50,941
18.9
4,523,403
1,450,941
32.1
3,072,462
67.9
Consumers' Durable
15
Household furniture
16
Stoves, ranges and
wat
erheaters
17
Heavy household appliances, mci. mechanical
625,380
189,638
625,380
—
a10
0.0
—.
—
189,
638
—
100.
0—
340,
585
—
189,
638
— 55.7
—
150,
947'
— 44.3
refrigerators
18
House furnishings (durable)
19
China arid household utensils
20
Portable household electric appliances
and
othe
r
278,741
492,027
245,835
278,741
484,217
206,961
100.0
98.4
84.2
— 7,81
038,874
— 1.6
15.8
— 12,9
9548
,218
— 7,81
038,874
—
60.1
80.6
— 5,18
59,344 .
— 39.9
19.4
supplies
21
Radio apparatus and equipment
22 Nusical Instruments
23
Jewelry, silverware, clocks and watches
24
Printing and
publ
ishi
ng:
books
25
Luggage
68,873
388,476
118,571
288,490
199,015
64,801
68,873
323,598
118,571
287,012
199,015
64,801
100.0
83.3
100.
099.5
100.0
100.0
— 64,8
78— 1,
478
— —
— 16.7
— 0.5
— —
—
165,
078
— 14,0
38— —
— 64,8
78— 1,
478
— —
—
39.3
-.—
10.5
— —
—
100,
200
— 12,5
60— —
— 60.7
— 89.5
— —
t'.)
r t')
1Contains 373,672 thousand dollars of construction materials.
materials.
3Contains 247,126 thousand dollars
offinished commodities.
4corrected for duplication of. items.
a
Table I—a (Concluded)
Minor corrunodity group
Total
value
Classified
directly
.
location of mixed
palocatlon or
mix
ed.
Finished
•:
of group
Value
Value
Value
Unfinished
.materials
26.
27
28
2930
Passenger cars
Auto—parts and
acce
ssor
ies
Motorcycles, bicycles and
acce
ssor
ies
Pleasure-craft
Ophthalmic products and
surg
ical
and
ort
hope
dic
2,799,737
407,584
18,273
26,723
2,799,737
11,491
14,240
26,723
100.0
2.8
77.9
100.0
—
396,
093
4,033
—
— 97.2
22.1
—
—
1,90
4,19
96,958
—
—
396,
093
4,033
—
—
20.8
58.0
—
1,508,106
79.2
2,925
42.0
——
31
appliances
Monuments and
tom
bsto
nes
53,252
63,635
53,252
63,635
100.0
100.0
- -— —
— —
— •-— —
——
——
Total Consumers' Durable
Producers' Durable
6,319,051
5,616,247
88.9
702,804
11.1
2,492,071
702,804
28.2
1,789,267
71.8
32 33
34
35
3637
38
39.
40
41 42
43
44
Industrial machinery and equipment
Electrical appliances, industrial and
com
mer
cial
Farm
mac
hine
ry,
tractors and
wag
ons
Office and
mis
c.machinery and
equi
pmen
tOrfice and
stor
efurniture and
fixt
ures
Locomotive and railroad cars
Ships and
boat
sBusiness motor vehicles
Aircraft
Professional and scientific equipment
Carpenters' and mechanics' tools
Durable containers
Misc, subsidiary durable equipment
.
2,210,362
976,832
621,195
383,677
295,967
379,748
56,676
623,135
61,474
145,223
136,622
107,889
231,985
2,210,362
976,832
621,195
383,677
295,967
379,748
56,676
623,135
61,474
81,025
136,622
107,889
231,985
100.0
100.0
100.0
100.0
100.0
100.0
100.0
100.0
100.0
55.8
100.0
100.0
100.0
— —
. —
— — — — — —
64,1
98—
.
— —
— — .- — — — — — 44.2
— — —
— — —.
— — — — — — 83,8
10— .— —
-. — - — — — 64,1
98— —
— — — — — — — 76.6
— — —
——
——
——
——
——
— ——
——
——
19,6
1223
.4—
—
——
——
-Total Producers' Durable
6,230,785
6,166,587
99.0
64,198
1.0
83,810
64,198
76.6
19,612
23.4
Construction flaterlals
Total Construction Materials
5,010,740
3,450,805
68.9 1,559,935
-31.1
2,925,901
1,559,935
53.3
46.7
Grand Total, md. Construction Materials
39,838,795
30,928,913
77.6
8,909,882
22.4
8,909,882
46.3
53.7
PART I
major source of discrepancy between our total andthe Census lies in the incompleteness, mentiOnedabove, of the allocation in the Censusof 'other products' among the 'secondary prod-ucts'. The resulting difference ranges from 0.8 percent in 1931 to 1.8 per cent in 1919 (last line ofTable I—b).
The relative stability of the percentage distri-bution between finished and unfinished commod-ities is interesting. If servicing is included with
• finished products, and construction materials withunfInished, the former combined group consti-tutes on the average about 55 per cent of the total,ranging from 52.4 to 56.7 per cent. If we add con-struction materials to the finished group, the aver-age percentage of the total becomes more than 61,ranging from 60.4 to 63.9. Notwithstanding theirstability these percentages apparently fluctuatewith cycles in the value of manufacturing output.In years of contraction, such as 1921, 1927, and1931, the output of unfinished products declinesmore appreciably than the total of finished, con-struction materials, and servicing; as a result, theirpercentage of total manufacturing output de-clines. When the value Of Output rises, as in 1923and 1929, the output of unfinished commodities
• rises more than that of other commodities; theirpercentage of the total accordingly rises. This isdue largely to the preponderance among unfin-ished commodities of metal products, a groupmore susceptible to cyclical rises and declines thanare the other groups of manufactured products.
The main results of our analysis can be com-pared .with the net value of manufactures, meas-ured so as to exclude the duplication that oc-curs because the product of one manufacturingestablishment is consumed in the productive proc-esses of another. Such estimates are available forevery odd year in the period covered, prepared for1929 by the Bureau of the Census and for otheryears by the Bureau of Foreign and DomesticCommerce. But the values measured differ fromours in one important respect. In estimating thenet value of manufactures, only those manufac-tured products are considered unfinished whichare consumed directly in the productive processesof other manufacturing plants. In our study, allthose manufactured products are considered un-finished which are consumed in the productiveprocesses not only of other manufacturing plants,but also of other business enterprises. Moreover,consumption of non-durable goods need not bein production proper to render them unfinished inour classification; it may occur in the process of
management. For, example, in the estimate of thenet value of manufactures, gasoline, cement, orlumber are considered unfinished only to the ex-tent that they are consumed by manufacturingplants, while in our study the parts that are con-sumed by construction enterprises, distribution,transportation, or other business agencies, are alsoconsidered unfinished. Or, with respect to paperand printing products, the estimate of the netvalue of manufactures includes among finishedsuch items as account books and advertising cir-culars, since they are not used directly in the man-ufacturing process by other manufacturing plants,even though they may be used in the offices ofmanufacturing establishments. In our study, allthese products, whether used by manufacturingfirms, trading units; advertising companies, orprofessional units, are considered unfinished.
Obviously the definition of unfinished productsused in our study is more comprehensive than thatused by the Bureau of the Census or the Bureau ofForeign and Domestic Commerce in adjusting forthe duplication among manufacturing establish-ments; accordingly, the volume of finished manu-factured products as estimated in our study shouldbe significantly smaller than that obtained as thenet product of manufacturing industries by thetwo Bureaus.
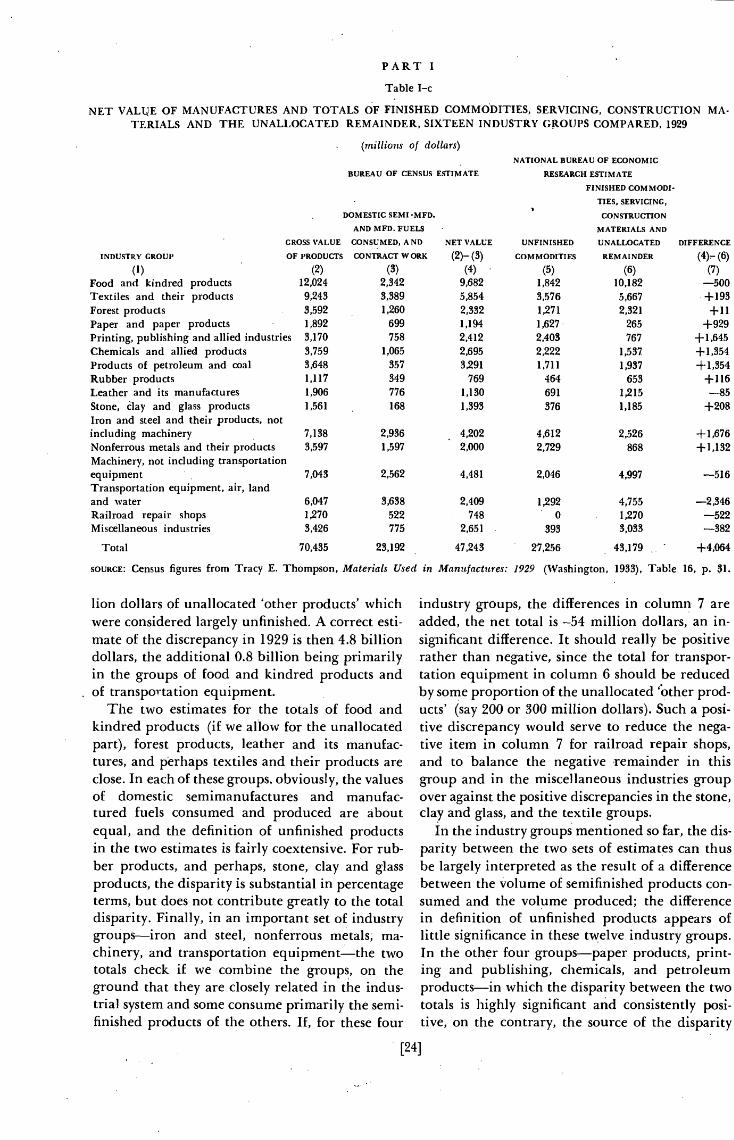
Because net value of manufactures is estimatedin some detail for 1929 we begin with a compar-ison for that year r (Table I—c).
The Census Bureau estimates show the net valueof manufactures originating in the industries ofeach group, i.e.., the gross value adjusted for thevalue of domestic sernimanufactures consumed.Our estimates show the net value of manufacturesproduced by the industries of each group, i.e., thegross value adjusted for the value of domestic semi-manufactures produced. We calculated the valueof finished production for each group by subtract-ing from gross value the value of unfinished prod-ucts that had been segregated. The remainder,therefore, covers not only finished products andservicing, but also construction materials, ex;cluded industries, and the unallocable part thathad to be omitted from our classification.
The Census total exceeds our total by slightlyover 4 billion dollars (Table I—c). This excess ofthe net value of manufactures over our compa-rable total of finished products, servicing, and con-struction materials is, however, underestimated inTable I—c, since in column 6we include 0.8 bil-7 See Materials Used in 1929, by Tracy E.Thompson (Washington, 1933).
[22]
Tab
le I
-b
CO
MM
OD
ITY
TO
TA
LS
RE
SUL
TIN
G F
RO
M O
UR
CL
ASS
IFIC
AT
ION
CO
MPA
RE
D W
ITH
TO
TA
LS
SHO
WN
IN T
HE
CE
NSU
S O
F M
AN
UFA
CT
UR
ES
(dol
lar
values in thousands)
F'., C',
LJ
1919
1921
1923
1925
1927
1929
1931
1933
Cominotlity total resulting from
our
clas
sifi
catio
nFinished
Percentage of commodity total
60,563,550
31,413,832
51.9
42,520,937
22,502,365
52.9
'
59,0
71,3
7328,999 309
49.1
61,862,523
30,911,341
50.0
61,379,697
31,142,602
50.7
68,799,399
34,828,055
50.6
40,496,567
21,780,893
53.8
-
30,8
32,6
3116,539,501
53.6
Construction materials
Percentage of commodity total
3,704 876
6.1
3,063 085
4,807 036
8.1
5,094 748
4,956 083
8.1
5,010,740
7.3
2,528,120
6.2
1,533 255
5.6
Servicing
Percentage of commodity total
Unfinished
Percentage of commodity total
1,899 092
3.1
23,545 750
1,606 015
15,349 472
36.1
1,970 760
23,294,268
39.4
1,684 032
2.&
24,172,402
39.1
1,689 305
23,591,707
38.4
1,704 531
27,256,073
39.6
973,735
2.4
15,213 819
657 623
2.j
12,102 252
Census total (as shown in
the
1931
and
1933
Census volumes)
62,041,795
43,653,282
60,555,999
62,713,712
62,718,348
70,434,864
41,350,465
31,358,840
Add
:.
Peanuts, walnuts (in Census Group 1)
Coffee and spices (in Census Group 1)
Grindstones, pulpstones and mill—
stones (in Census Group 10)
.
.
410,928
1,498
408
43,630
187,406
32
Subtract:
..
Poultry killing (in Census Group 1)
Coke, not md. gas—house coke:
gas (in Census Group 7)
Gas, mfd. illuminating and
heat
ing:
(in
Cen
sus
Gro
up 7
)N
otio
n pl
ctur
es, n
ot m
ci. p
roje
ctio
nin
theaters (in Census Group 16)
41,705
16,650
282,269
36,7
05
34,717
19,788
372,032
77,3
97
26,424
42,7)2
394,
506
86,4
18
45,454
49,051
395,969
93,636
-. 53,7
25
446,245
134,
343
130,161
61,099
.
438,
243
184,
102
97,560
45,319
399,681
—
66,157
33,133
324,
190
—
Adjusted Census total
61,664,446
43,149,348
60,005,939
62,5
40,5
3062,084,035
69,622,757
4t0,808,313
31,166,928
Commodity total as percentage
of adjusted Census total
98.2
98.5
98.5
98.9
98.9
98.8
99.2
98.9
PART ITable I—c
NET OF MANUFACTURES AND TOTALS OF FINISHED COMMODITIES, SERVICING, CONSTRUCTION MA-TERIALS AND THE UNALLOCATED REMAINDER, SIXTEEN INDUSTRY GROUPS COMPARED, 1929
(millions of dollars)
SOURCE: Census figures from Tracy E. Thompson, Materials Used in Manufactures: 1929 (Washington, 1933), Table 16, p. 31.
lion dollars of unallocated 'other products' whichwere considered largely unfinished. A correct esti-mate of the discrepancy in 1929 is then 4.8 billiondollars, the additional 0.8 billion being primarilyin the groups of food and kindred products andof transportation equipment.
The two estimates for the totals of food andkindred products (if we allow for the unallocatedpart), forest products, leather and its manufac-tures, and perhaps textiles and their products areclose. In each of these groups, obviously, the valuesof domestic semimanufactures and manufac-tured fuels consumed and produced are aboutequal, and the definition of unfinished productsin the two estimates is fairly coextensive. For rub-ber products, and perhaps, stone, clay and glassproducts, the disparity is substantial in percentageterms, but does not contribute greatly to the totaldisparity. Finally, in an important set of industrygroups—iron and steel, nonferrous metals, ma-chinery, and transportation equipment—the twototals check if we combine the groups, on theground that they are closely related in the indus-trial system and some consume primarily the semi-finished products of the others. If, for these four
[24]
industry groups, the differences in column 7 areadded, the net total is ---54 million dollars, an in-significant difference. It should really be positiverather than negative, since the total for transpor-tation equipment in column 6 should be reducedby some proportion of the unallocated prod-ucts' (say 200 or 300 million dollars). Such a posi-tive discrepancy would serve to reduce the nega-tive item in column 7 for railroad repair shops,and to balance the negative remainder in thisgroup and in the miscellaneous industries groupover against the positive discrepancies in the stone,clay and glass, and the textile groups.
In the industry groups mentioned so far, the dis-parity between the two sets of estimates can thusbe largely interpreted as the result of a differencebetween the volume of semifinished products con-sumed and the volume produced; the differencein definition of unfinished products appears oflittle significance in these twelve industry groups.In the other four groups—paper products, print-ing and publishing, chemicals, and petroleumproducts—in which the disparity between the twototals is highly significant and consistently posi-tive, on the contrary, the source of the disparity
BUREAU OF CENSUS ESTIMATE
GROSS VALUE
OF PRODUCTS
DOMESTIC SEMI -MFD.
AND MFD. FUELS
CONSUMED, A ND
CONTRACT WORK
NATIONAL BUREAU OF ECONOMIC
RESEARCH ESTIMATE
FINISHED COM MOW-
TIES, SERVICING,
CONSTRUCTION
MATERIALS AND
UNFINISHED UNALLOCATED
COMMODITIES REMAINDER
NET VALUE DIFFERENCE
INDUSTRY GROUP
(1)
(2)— (3) (4)— (6)
(2) (3) (4) (5) (6) (7)
Food and kindred products 12,024 2,342 9,682 1,842 10,182 —500Textiles and their products 9,243 3,389 5,854 3,576 5,667 +193Forest products 3,592 . 1,260 2,332 1,271 2,321 +11Paper and paper products 1,892 699 1,194 1,627 265 +929Printing, publishing and allied industries 3,170 758 2,412 2,403 767 + 1,645Chemicals and allied products 3,759 1,065 2,695 2,222 1,537 +1,354Products of petroleum and coal 3,648 357 3.291 1,711 1,937 +1,354Rubber products 1,117 849 769 464 653 +116Leather and its manufactures 1,906 776 1,130 691 1,215 —85Stone, clay and, glass products 1,561 • 168 1,393 376 1,185 +208Iron and steel and their products, notincluding machinery . 7,138 2,936 4,202 4,612 2,526 +1,676Nonferrous metals and their products 3,597 1,597 2,000 2,729 868 + 1,132Machinery, not including transportationequipment . 7,043 2,562 4,481 2,046 4,997 —516Transportation equipment, air, landand water 6,047 3,638 2,409 1,292 4,755 —2,346Railroad repair shops 1,270 522 748 ' 0 . 1,270 —522Miscellaneous industries 3,426 775 2,651 . 993 3,033 —382
Total 70,435 23,192 47,243 27,256 43,179 - +4,064
CLASSIFICATION OF MANUFACTURED COMMODITIES
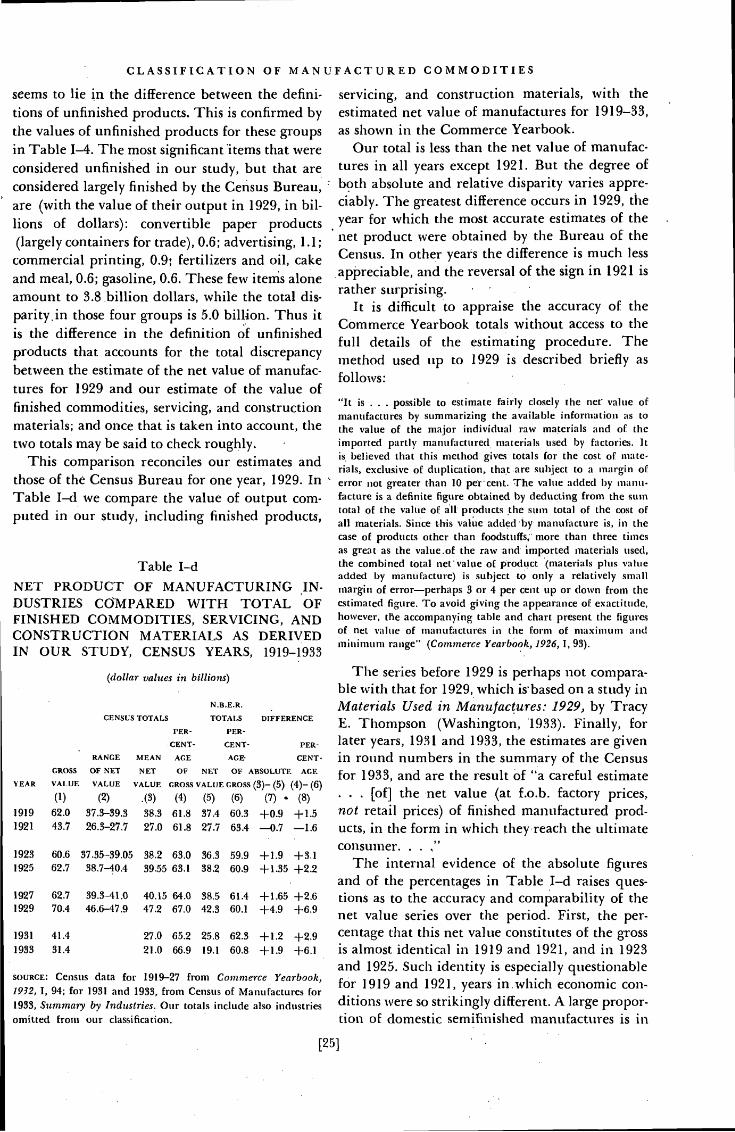
seems to lie in the difference between the defini-tions of unfinished products. This is confirmed bythe values of unfinished products for these groupsin Table 1—4. The most significant Items that wereconsidered unfinished in our study, but that areconsidered largely finished by the Census Bureau,are (with the value of their output in 1929, in bil-lions of dollars): convertible paper products(largely containers for trade), 0.6; advertising, 1.1;commercial printing, 0.9; fertilizers and oil, cakeand meal, 0.6; gasoline, 0.6. These few items aloneamount to 3.8 billion dollars, while the total dis-parity,in those four groups is 5.0 billion. Thus itis the difference in the definition of unfinishedproducts that accounts for the total discrepancybetween the estimate of the net value of manufac-tures for 1929 and our estimate of the value offinished commodities, servicing, and constructionmaterials; and once that is taken into account, thetwo totals may be said to check roughly.
This comparison reconciles our estimates andthose of Census Bureau for one year, 1929. InTable I—d we compare the value of output com-puted in our study, including finished products,
Table I—d
NET PRODUCT OF MANUFACTURING IN-DUSTRIES WITH TOTAL OFFINISHED COMMODITIES, SERVICING, ANDCONSTRUCTION MATERIALS AS DERIVEDIN OUR STUDY, CENSUS YEARS, 1919-1933
(dollar values in billions)
CENT- CENT- PER-
RANGE MEAN AGE AGE- CENT.
GROSS OF NET NET OF NET OF ABSOLUTE AGEYEAR VALUE VALUE VALUE GROSS VALUE GROSS (3)— (5) (4)— (6)
(1) (2) (3) (4) (5) (6) (7) (8)
1919 62.0 37.3—39.3 38.3 61.8 37.4 60.3 +0.9 +1.51921 43.7 26.5—27.7 27.0 61.8 27.7 63.4 —0.7 —1.6
1923 60.6 37.35—39.05 38.2 63.0 36.3 59.9 +1.9 +3.11925 62.7 38.7—40.4 3955 63.1 38.2 60.9 +1.35 +2.2
1927 62.7 39.3—41.0 40.15 64.0 38.5 61.4 +1.65 +2.61929 70.4 46.6—47.9 47.2 67.0 42.3 60.1 +4.9 +6,9
1931 41.4 27.0 65.2 25.8 62.3 +1.2 +2.91933 31.4 21.0 66.9 19.1 60.8 +1.9 +6.1
SOURCE: Census data for 1919—27 from Commerce Yearbook,1932, 1, 94; for 1931 and 1933, from Census of Manufactures for1933, Summary by Industries. Our totals include also industriesomitted from our classification.
servicing, and construction materials, with theestimated net value of manufactures for 19 19—33,as shown in the Commerce Yearbook.
Our total is less than the net value of manufac-tures in all years except 1921. But the degree ofboth absolute and relative disparity varies appre-ciably. The greatest difference occurs in 1929, theyear for which the most accurate estimates of thenet product were obtained by the Bureau of theCensus. In other years the difference is much less
and the reversal of the sign in 1921 israther surprising.
It is difficult to appraise the accuracy of theCommerce Yearbook totals without access to thefull details of the estimating procedure. Themethod used up to 1929 is described briefly asfollows:
The series before 1929 is perhaps not compara-ble with that for 1929, which based on a study inMaterials Used in Manufactures: 1929, by TracyE. Thompson (Washington, 1933). Finally, forlater years, 1931 and 1933, the estimates are givenin round numbers in the summary of the Censusfor 1933, and are the result of "a careful estimate
[of] the net value (at f.o.b. factory prices,not retail prices) of finished manufactured prod-ucts, in the form in which theyreach the ultimateconsumer. . .
The internal evidence of the absolute figuresand of the percentages in Table I—d raises ques-tions as to the accuracy and comparability of thenet value series over the period. First, the per-centage that this net value constitutes of the grossis almost identical in 1919 and 1921, and in 1923and 1925. Such identity is especially questionablefor 1919 and 1921, years in.which economic con-ditions were so strikingly different. A large propor-tion of domestic semifinished manufactures is in
"It is . . . possible to estimate fairly closely the value ofmanufactures by summarizing the available information as tothe value of the major individual raw materials and of theimported partly manufactured materials used by factories. Itis, believed that this method gives totals for the cost of mate-rials, exclusive of duplication, that are subject to a margin oferror not greater than 10 percent. The value added by nianti-facture is a definite figure obtained by deducting from the sumtotal of the value of all products the sum total of the cost ofall materials. Since this 'value added 'by manufacture is, in thecase of products other than foodstuffs; more than three timesas great as the value.of the raw 'and imported materials used,the combined total net value of product (materials plus valueadded by manufacture) is subject to only a relatively smallmargin of error—perhaps 3 or 4 per cent up or down from theestimated figure. To avoid giving the appearance of exactitudc,however, the accompanying table and chart present the figuresof net value of manufactures in the form a maximum andminimum range" (Commerce Yearbook, 1926, 1, 93).
CENSUS TOTALS
N.B.E.R.
TOTALS
PER- PER-
DIFFERENCE
[25]

PART I
the metals and machinery groups. Thus, in 1929unfinished products in the iron and steel, nonfer-rous metal, machinery, and transportation equip-ment groups amounted, according to our calcula-tion, to 10.3 billion dollars, out of a total ofunfinished products of 27.3 billion, and as com-pared to the Census total of domestic semimanu-factures and manufactured fuels of about 23 bil-lion. It is the particularly acute decline in theoutput of these groups during depression thataccounts largely for the decline in the percentageof our unfinished products to the total in a yearlike 1921, and for a corresponding rise in the per-centage accounted for by finished commodities,servicing, and construction materials. But no suchrise in the percentage of net value to gross produc-tion is shown in the Census estimates, even thoughsuch a rise did occur in the Census figures in 1927.Similarly, the decline from 1929 to 1931 is anotherground for doubt.
Another iniportant peculiarity that calls for ex-planation is the change in the estimated net valueof manufactures from 1927 to 1929. The absolutechange, if we compare the means of ranges, con-sisted of a rise of 7.05 billion dollars; the grossvalue increased 7.7 billion dollars. This implies
[26]
that the increase in the value of domestic semi-manufactures was only 0;65 billion. Since the valueof. these semimanufactured products in 1929 wasabout 23 billion dollars, this small percentage risein their output (about 3 per cent) as comparedwith the substantial rise in the output of finishedmanufactures (over 15 per cent) is, if true, an ex-ceptional phenomenon demanding further inves-tigation. An obvious explanation is that the moredetailed estimate for 1929 is not comparable withthose for either earlier or later years..
These comments are not intended as reflectionson the accuracy of the estimates of the net valueof manufactures, especially since for 1919—27 theyare described as accurate only within a certainrange. Nor are the variations in the difference be-tween our estimate of finished products, inclusiveof servicing and construction materials, and thenet value, so far as they are not due to differencesin scope, an indication of inaccuracies in the esti-mates derived in our study. On the contrary, thenecessarily rough comparison results in a faircheck of the two series of totals, in that ours is con-sistently lower, with a fairly reasonable absolutedifference.

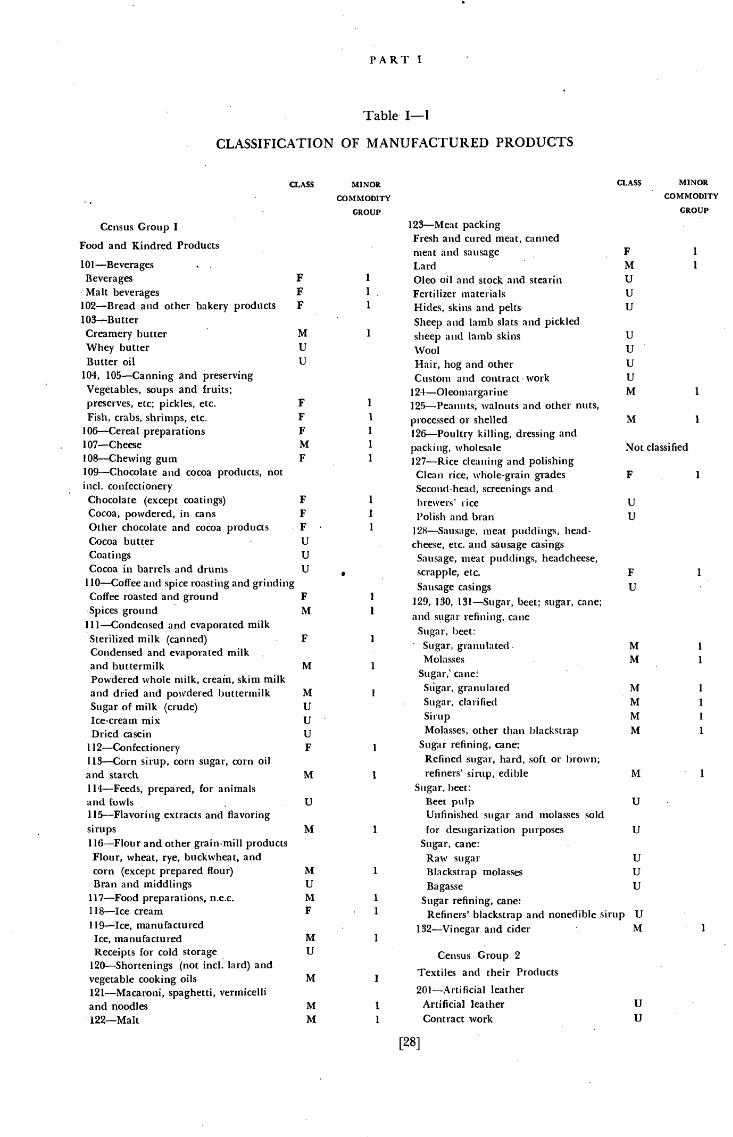
Table I—i
CLASSIFICATION OF MANUFACTURED PRODUCTS INTO
FINISHED (BY MINOR COMMODITY GROUPS), CONSTRUC-
TION MATERIALS, SERVICING, UNFINISHED AND MIXED
The classification is based on the commodity tables of the 1929 Census ofManufactures, and the numbers preceding the industry titles are those shownin that Census.
The class designations used are as follows:
Finished products FConstruction materials CServicing (custom work and repairs) S
Unfinished products UProducts belonging to more than one class (mixed) M
The minor commodity group classification of finished and mixed productsis given in Note A following this table. Comments on the table will be foundin the Preface to Part I, Section 1.
PART I
Table I—I
CLASSIFICATION OF MANUFACTURED PRODUCTS
CLASS
Census Group I
MINOR
COMMODITY
GROUP
123—Meat packingFresh and cured meat, cannedmeat and sausageLard
1 Oleo oil and stock and stearin1 Fertilizer materials1 Hides, skins and pelts
Sheep and Iamb slats and pickled1 sheep and lamb skins
WoolHair, hog and otherCustom and contract work
124—Oleomargarine125—Peanuts, walnuts anti other nuts,processed or shelled126—Poultry killing, dressing andpacking, wholesale127—Rice cleaning and polishingClean rice, whole-grain gradesSecond-head, screenings and
CLASS MINOR
COMMODITY
GROUP
F 1
M 1
UU
U
UUUUM 1
M 1
Not classified
F 1
1
Food and Kindred Products
101—BeveragesBeverages FMalt beverages F
102—Bread and other bakery products F103—ButterCreamery butter M
Whey butter UButter oil U
104, 105—Canning and preservingVegetables, soups and fruits;preserves, etc; pickles, etc. F 1
Fish, crabs, shrimps, etc. F I
106—Cereal preparations F I
107—Cheese M 1
108—Chewing gum F 1
109—Chocolate and cocoa products, notmc!. confectioneryChocolate (except coatings) F 1 brewers' rice UCocoa, powdered, in cans F 1 Polish and bran UOther chocolate and cocoa productsCocoa butter
FU
1 128—Sausage, meat puddings, head-cheese, etc. and sausage casings
CoatingsCocoa in barrels and drums
UU •
Sausage, meat puddings, headcheese,scrapple, etc. F
110—Coffee and spice roasting and grindingCoffee roasted and groundSpices ground
111—Condensed and evaporated milkSterilized milk (canned)
FM
F
1
1
sausage casings129, 130, 131—Sugar, beet; sugar, cane;and sugar refining, caneSugar, beet:
U
Condensed and evaporated milkand buttermilk M 1
Powdered milk, cream, skim milkand dried and powdered buttermilk M I
Sugar of milk (crude)Ice-cream mix
Uu Sirup
Dried casein U Molasses, other tha ii hlackstrap
1 12—Confectionery113—Corn sirup, corn sugar, corn oil
F 1Sugar refining, cane:
Refined sugar, hard, soft or brown;and starch M i refiners' sirup, edible114—Feeds, prepared, for animals Sugar. beet:and fowls U Beet pulp115—Flavoring extracts and flavoring Unfinished sugar and molasses soldsirups M 1 for desugarization purposes116—Flour and other grain-mill products Sugar, cane:Flour, wheat, rye, buckwheat, and Raw sugarcorn (except prepared flour) M 1 Blackstrap molassesBran and middlings U Bagasse U
117—Food preparations, n.e.c. M 1 Sugar refining, cane:118—Ice cream119—Ice, manufacturedIce, manufactured
F
M
- 1
I
Refiners' blackstrap and nonedible sirup132—Vinegar and cider
UM
Receipts for cold storage120—Shortenings (not md. lard) andvegetable cooking oils121—Macaroni, spaghetti, vermicelliand noodles
U
M
M
1
1
Census Group 2Textiles and their Products201—Artificial leather
Artificial leather U
122—Malt M 1 Contract work U
Sugar, granulatedMolasses
Sugar,'
MM
Stigar, granulatedSugar, clarified
I
1
MM
M
M
M
U
U
UU
1
1
1
I
I
I
[28]
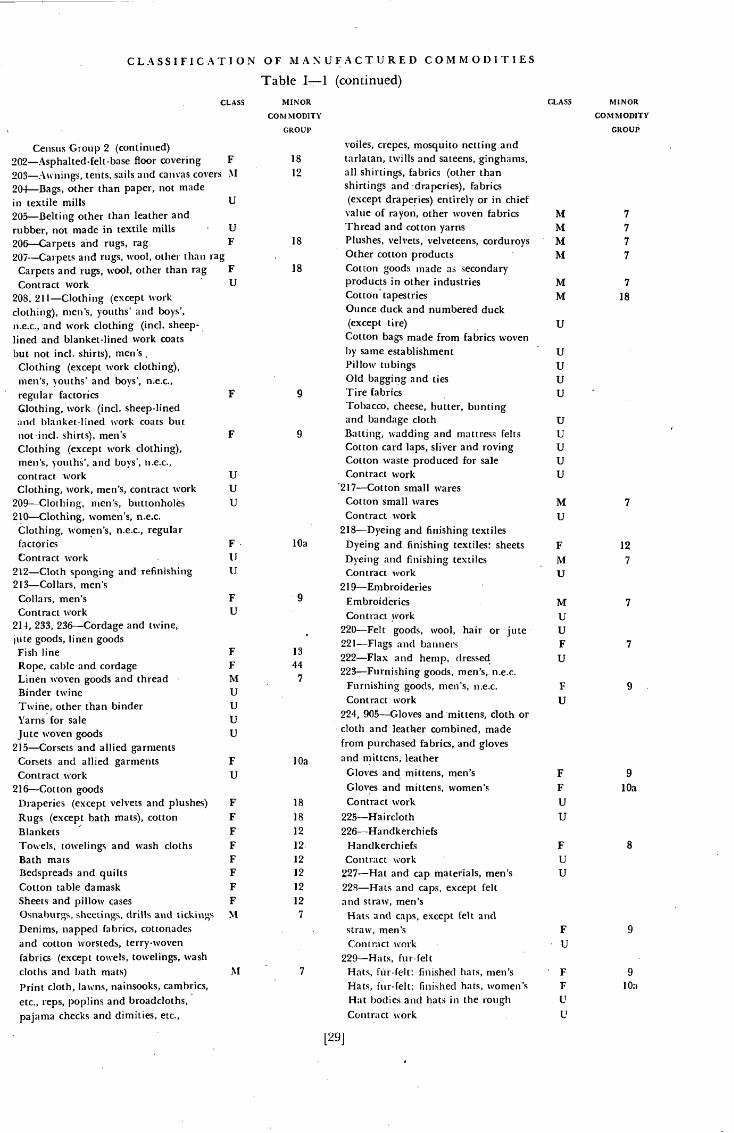
CLASSIFICATION OF MANUFACTURED COMMODITIESTable I—i (continued)
Census Group 2 (continued)202—Asphalted.felt-base floor covering F203—Awnings, rents, sails and canvas covers M20-1—Bags, other than paper, not madein textile mills U
205—Belting other than leather andrubber, not made in textile mills U
206—Carpets and rugs, rag F207-—Carpets and rugs, wool, other than rag
Carpets and rugs, wool, other than rag F
Contract work U
208, 211—Clothing (except workclothing), men's, youths' and boys',n.e.c., and work clothing (md. sheep-,lined and blanket-lined work coatsbut not md. shirts), men'sClothing (except work clothing),men's, youths' and boys', n.e.c.,regular factories FClothing, work (mci. sheep-linedand blanket-lined work coats butnot md. men's FClothing (except work clothing),iiien's, and boys', n.e.c.,contract work UClothing, work, men's, contract work U
209—Clothing, nien's, buttonholes U
210—Clothing, women's, n.e.c.Clothing, %%'omen's, n.e.c., regularfactories FContract work U
212—Cloth sponging and refinishing U213—Collars, men'sCollars, men'sContract work
214, 233, 236—Cordage and twine,jute goods, linen goodsFish lineRope, cable and cordageLinen woven goods and threadBinder twineTwine, other than binderYarns for saleJute woven goods
215—Corsets and allied garmentsCorsets and allied garmentsContract work
216—Cotton goodsDraperies (except velvets and plushes)Rugs (except bath mats), cottonBlanketsTowels, towelings and wash clothsBath matsBedspreads and quiltsCotton table damaskSheets and pillow casesOsnahurgs, drills and tickingsDenims, napped fabrics, cottonadesand cotton worsteds, terry-wovenfabrics (except towels, towelings, washcloths and bath mats) M
Print cloth, lawns, nainsooks, cambrics,etc., reps, poplins and broadcloths,pajama checks and dimities, etc.,
crepes, mosquito netting and18 tarlatan, twills and sateens, ginghams,12 all shirtings, fabrics (other than
shirtings and -draperies), fabrics(except draperies) entirely or in chiefvalue of rayon, other woven fabricsThread and Cotton yarns
18 Plushes, velvets, velveteens, corduroysOther cotton products
18 Cotton goods made as secondaryproducts in other industriesCotton' tapestriesOunce duck and numbered duck(except tire)Cotton bags made from fabrics wovenby same establishmentPillow tubingsOld bagging and ties
g Tire fabricsTobacco, cheese, butter, buntingand bandage cloth
9 Batting, wadding and mattress feltsCotton card laps, sliver and rovingCotton waste produced for saleContract work
'217—Cotton small waresCotton small waresContract work
218—Dyeing and finishing textileslOa Dyeing and finishing textiles: sheets
Dyeing and finishing textilesContract work
21 9—Embroideries9 Embroideries
Contract work220—Felt goods, wool, hair or jute221—Flags and banners222—Flax arid hemp, dressed
7223—Furnishing goods, men's, n.e.c.
Furnishing goods, men's, n.e.c.Contract work
224, 905—Gloves and 'mittens, cloth orand leather combined, made
from purchased fabrics, and gloves
IDa and mittens, leatherGloves and mittens, men'sGloves and mittens, women's
18 Contract work18 225—Haircloth12 226—Handkerchiefs12. Handkerchiefs12 Contract work12 227—Hat and cap materials, men's12 228—Hats and caps, except felt12 and straw, men's
7 Hats and caps, except felt andstraw, men's FCon tract work
229—Hats, fur-felt7 Hats, finished hats, men's
Hats, fur-felt: finished hats, women'sHat bodies and hats in the rough
[29]
CLASS MINOR CLASS MINOR
COMMOrnTY COMMODITY
MMMM
MM
U
UUUU
UU
UUU
M
U
FMU
MUU
F
U
F
U
F
F
U
U
FU
U
7
7
7
7
7
18
7
12
7
7
7
9
9
1 Oa
8
9
9
I Oa
FU
FFMUUUU
FU
F
FFFFFFF
Contract work
FU
U
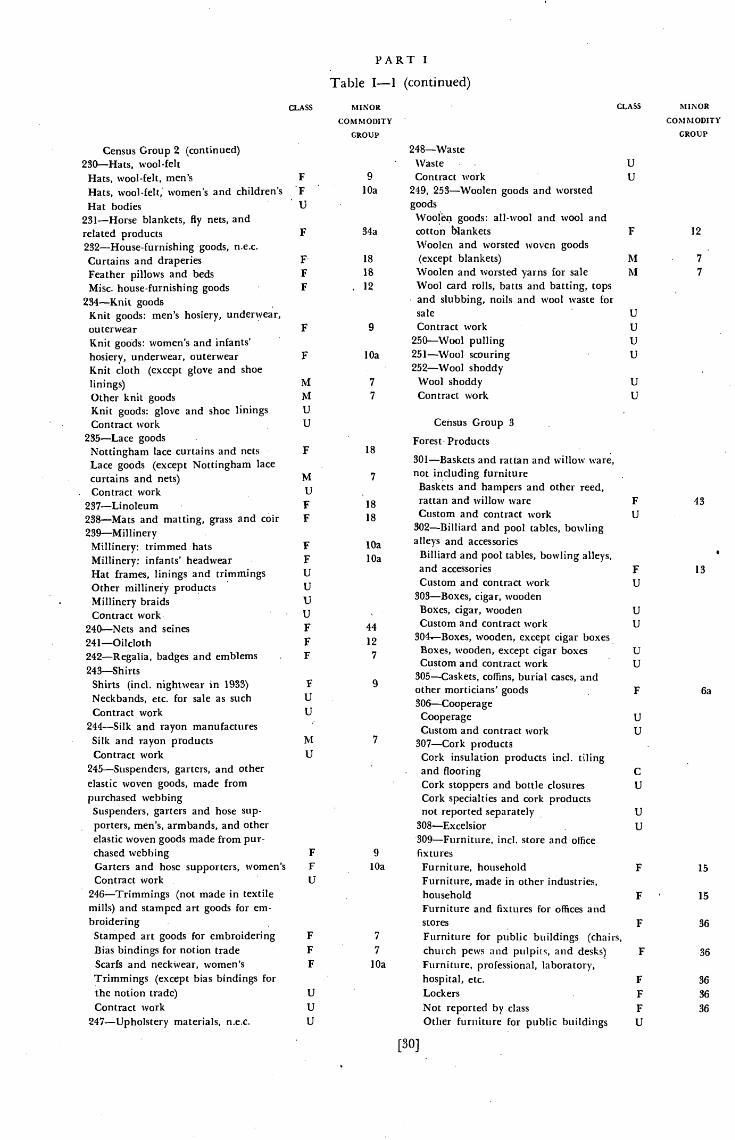
FART I
Table I—i (continued)
Census Group 2 (continued)230—Hats, wool-feltHats, wool-felt, men'sHats, wool-felt; women's and children'sHat bodies
231—Horse blankets, fly nets, andrelated products232—House-furnishing goods, n.e.c.Curtains and draperiesFeather pillows and bedsMisc. house-furnishing goods
234—Knit goodsKnit goods: men's hosiery, underwear,outerwearKnit goods: women's and infants'hosiery, underwear, outerwearKnit cloth (except glove and shoelinings)Other knit goodsKnit goods: glove and shoe liningsContract work
235—Lace goodsNottingham lace curtains and netsLace goods (except Nottingham lacecurtains and nets)Contract work
237—Linoleum238—Mats and matting, grass and coir239—Millinery
Millinery: trimmed hatsMillinery: infants' headwearHat frames, linings and trimmingsOther millinery productsMillinery braidsContract work.
240—Nets and seines241—Oilcloth242—Regalia, badges and emblems243—Shirts
Shirts (md. nightwear in 1933)Neckbands, etc. for sale as suchContract work
244—Silk and rayon manufacturesSilk and rayon productsContract work
245—Suspenders, garters, and otherelastic woven goods, made frompurchased webbingSuspenders, garters and hose sup-porters, men's, armbands, and otherelastic woven goods made from pur-chased webbingGarters and hose supporters, women'sContract work
246—Trimmings (not made in textilemills) and stamped art goods for em-broideringStamped art goods for embroideringBias bindings for notion tradeScarfs and neckwear, women'sTrimmings (except bias bindings forthe notion trade)Contract work
247—Upholstery materials, n.e.c.
U
sale9 Contract work
250—Wool pullinglOa 251—Wool scouring
252—Wool shoddy7 Wool shoddy7 Contract work
U Census Group 3
MUFF
FFUUUU
F
FF
FU
U
MU
F 9
F lOa
U
F 7
F 7
F lOa
Forest- Products
and flooringCork stoppers and bottle closuresCork specialties and cork productsnot reported separately
308—Excelsior309—Furniture, mci. store and officefixtures
Furniture, professional, laboratory,hospital, etc.
U LockersUU
CLASS MINOR
COMMODITY
GROUP
U
U
F 43U
F 13
U
UU
UU
F 6a
UU
MINOR
COMMODITY -
GROUP
248—WasteWaste
9 Contract worklOa 249, 253—Woolen goods and worsted
goodsWoolen goods: all-wool and wool and
34a cotton blanketsWoolen and worsted woven goods
18 (except blankets)18 Woolen and worsted yarns for sale12 Wool card rolls, batts and batting, tops
and slubbing, noils and wool waste for
CLASS
F
F
FFF
F
F
MM
F 12
M 7
M 7
U
UUU
UU
F 18301—Baskets and rattan and willow ware,not including furnitureBaskets and hampers and other reed,
18 rattan and ware
18 Custom and contract work302—Billiard and pool tables, bowling
lOa alleys and accessories
lOa Billiard and pool tables, bowling alleys,and accessoriesCustom and contract work
303—Boxes, cigar, woodenBoxes, cigar, woodenCustom and contract work
12 304—Boxes, wooden, except cigar boxesBoxes, wooden, except cigar boxesCustom and contract work
305—Caskets, coffins, burial cases, andother morticians' goods306—CooperageCooperageCustom and contract work
7 307—Cork productsCork insulation products md. tiling
Furniture, householdFurniture, made in other industries,householdFurniture and fixtures for offices andstoresFurniture for public buildings (chairs,church pews and pulpits, and desks)
C
U
U
U
F 15
F 15
F 36
F 36
F 36
F 36
F 36
U
Not reported by classOther furniture for public buildings
[30]
CLASSIFICATION OF MANUFACTURED COMMODITIES
Table I—i (continued)
Census Group 3 (continued)
309—Furniture (continued)Unfinished frames for suites, chairs, etc.Radio cabinetsContract, custom and repair work
310—Lasts and related productsLasts and related productsCustom and contract work
31 1—Lumber and timber products, n.e.c.FirewoodLathAll other lumber and timber productsPulpwood
312—MatchesMatches, booksMatches, other than hooks
318—Mirror and picture framesMirror and picture framesCustom and contract work
314—Planing-mill products (mci.general miflwork)Tanks and vatsDressed lumber, md. flooring, ceiling,partition and sidingDoorsSashWindow and door framesPortable and ready-cut housesMisc. millwork and miliwork notreported by kindNot reported by kind—made as sec-ondary products in other industriesPlywoodSilo stockCustom planing
315—Pulp goods816—Refrigerators and refrigeratorcabinets, excl. mechanical refrigeratingequipmentRefrigerators, excl. mechanical refrig-erating equipment, domesticCommercial refrigerators, non-mechan-icalCabinets for mechanical i-efrigerationParts and accessoriesCustom and contract work
317—Turpentine and rosin318—Window and door screens andweather stripWindow and door screens and weatherstripCustom and contract work
319—Wood preservingWood preservingContract work
320—Wood turned and shaped andother wooden goods, n.e.c.WoodenwareLadders and partsScaffolding equipmentWood turned and shaped and otherwooden goods, n.e.c. (except wooden-ware, ladders and scaffolding equipment)Custom and contract work
CLASS MINOR - CLASS
COMMODITY
GROUP
Census Group 4
Paper and Paper Products
401, 402, 403, 404, 405, 406,
408—Converted paper productsBags, paper, excl. those made in paper mills MBoxes, paper, n.e.c. MCardboard, not made in paper mills MCard cutting and designing MEnvelopes MLabels and tags MPaper goods, n.e.c. M
407--PaperWriting paper M
2Building papers C
r Paper (except writing paper andbuilding papers) U
12410—Pulp (wood and other. fiber) U411—Wall paper C
Census Group 5
43Printing, Publishing, and AlliedIndustries
501—Bookbinding and blank-bookmaking502—Engravers' materials503—Engraving (other than steel, cop-perplate or wood), chasing, etching and(lie-sinking504, 505—Engraving, steel and copper-plate, and plate printing and engraving,woodEngraving, steel and copperplate andplate printing and engraving, wood(except greeting cards)Greeting cards
506—LithographingLithographing (except greeting cards)Greeting cards
507—Photo-engraving, not done in
is printing establishments
508, 509, 510—Printing and publishing
35 Newspapers and periodicals:
sul)scriptlorls and sales
Sheet music and books of nnisicPaper patternsBooks and pamphlets printed andpublished, or published onlyCommercial (exceptgreeting cards)
12 Greeting caTdsNewspapers and periodicals:
advertising
511—Printing materials, not md. typeor ink512—Stereotyping and electrotyping,not done in printing establishments513—Type founding
Census Group 6
Chemicals and Allied Products
601—Alcohol, ethyl, and distilled liquors M602—Ammunition and related products
AmmunitionSafety fuses, miners' squibs, etc.
UUU
F
U
F
CM
U
F
F
MU
F
CCCCC
C
CUUUU
F
FUUUU
FU
CU
FFF
UU
MINOR
COMMODITY
GROUP
4
4
44
44
4
4
4
4
4
4
4
4
24
4
44
3
6h
MU
U
UF
UF
U
FFF
F
UF
U
F
UU19
.44
44
[311
FU

PAR1 I
Table I—i (continued)
CLASS • MINOR
COMMODITY
GROUP
M 5aUCNot classified
F 5a
M 5aM 5a
M 5aM 5aM 5aM 5aM 5a
CLASS MINOR
COM MODITY
GROUP
Census Group 6 (continued) 703—Gas, manufactured, illuminating602—Ammunition (continued) and heatingBlasting and detonating caps Coke, for saleand railroad torpedoes C By-products (except coke and tar)
603—Baking powders, yeast, and Tarother leavening compounds M 1 Gas604—Blacking, stains and dressings M 3 704, 705—Petroleum lubri-605—Bluing M 3 cating oils and greases, not, made in606—Bone black, carbon black and petroleum refinerieslampblack U Petroleum refining:607—Candles M 5a Illuminating oils608—Chemicals M 3 Lubricating oils and greases, not609—Cleaning and polishing preparations M 3. made in petroleum refineries:610—Compressed and liquefied gases U Lubricating oils611—Druggists' preparations Lubricating greasesAlkaloids and derivatives F 3 Petroleum refining:Biological products for human use F 3 Lubricating oilsTinctures, fluid extracts, Lubricating greases and axle greasemedicinal sirups, etc. F 3 GasolinePills, tablets, powders, etc. F 3 Fuel oilsPharmaceutical metals and their salts F 3 Coke, petroleumBiological products for animal use U Light products of distillation
612—Drug grinding U (except gasoline)613—Explosives M Partially refined oils, sold for rerunning614—Fertilizers U Petrolatum, mineral jelly, etc.615—Fireworks . F 6b Paraffin wax616—Glue and gelatin U ' Acid Oil617—Grease and tallow, not mci. lubri- Other refinery products -
cating greases ' U Liquid asphaltic road oils61 8—Ink, printing U Residuum or tar619—Ink, writing M 4 Asphalt, other than liquid asphalt620—Liquors, vinous M 1
621—Mucilage, paste, and other ad- Census Group 8hesives, except glue and rubber cement M Rubber Products622—Oil, cake and meal, cottonseed U623—Oil, cake and meal, linseed u 801—Rubber boots and shoes
624—Oils, essential' u 802—Rubber goods, other than tires,
625—Oils, n.e.c. u inner tubes, and boots and shoes
626—Paints and varnishes M 12. Garden hose
627—Patent or proprietary medicines and Mats and matting
compounds Bathing caps
Medicines F ' Druggists' and medical sundries
Compounds (excl. agricultural in- (except rubber gloves)
secticides and boiler compounds) F 3 Rubber gloves
Agricultural insecticides and fungicides U Fire hose
Boiler compounds - u Rubber erasers and rubber bands
628—Perfumes, cosmetics, and Rubber cement
other toilet preparations M Hard-rubber goods, other than battery629—Rayon and allied products , U Jars, etc.630—Salt M i Jar rings631—Soap M 3 , Tire sundries and repair materials632—Tanning materials, natural dyestuffs, - Rubber heels, soles and soling stripsmordants and assistants, and sizes U Mechanical rubber goods:633—Wood distillation and charcoal man- Rubber beltingufacture U Rubber hose and tubing (ex-
cept garden and fire hose)Census Group 7 All other mechanical rubber goods
Products of Petroleum and Coal ' Hard-rubber goods, battery
701—Coke, not incL gas-house coke jars, boxes and parts
Tar C Rubberized fabrics
Coke M 5a Reclaimed 'rubber
Screenings and breeze and by- Rubber threadproducts (except gas and tar) u Other manufactures of rubberGas Not classified Not distributed by class or kind
702—Fuel: briquettes and boulets F 5a Rubber flooring
[32}
UUUUUUC
C
C
F
FFF
FFFMM
MM
MM
U
UU
UU
U
U
'UU
C
II
12
12
8
8
8
444
4
8
19
14
11
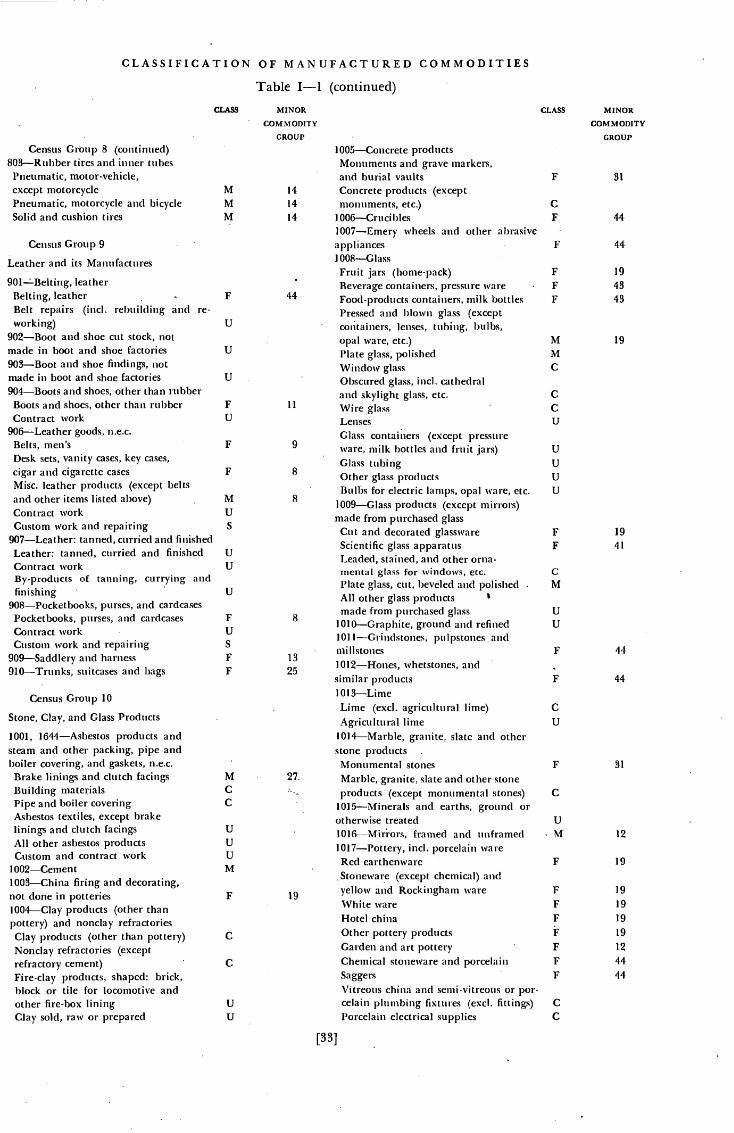
CLASSIFICATION OF MANUFACTURED COMMODITIES
Table I—i (continued)
Census GrOup 8 (continued)803—Rubber tires and inner tubesPneumatic, motor-vehicle,except motorcyclePneumatic, motorcycle and bicycleSolid and cushion tires
Census Group 9
Leather and its Manufactures
901—Belting, leatherBelting, leatherBelt repairs (mci. rebuilding and re-working)
902—Boot and shoe cut stock, notmade in boot and shoe factories903—Boot and shoe findings, notmade in boot and shoe factories904—Boots and shoes, other than rubberBoots and shoes, other than rubberContract work
906—Leather goods, n.e.c.Belts, men'sDesk sets, vanity cases, key cases,cigar and cigarette casesMisc. leather products (except beltsand other items listed above)Contract workCustom work and repairing
907—Leather: tanned, curried and finishedLeather: tanned, curried and finishedContract workBy-products of tanning, currying andfinishing
908—Pocketbooks, purses, and cardcasesPocketbooks, purses, and cardcasesContract workCustom work and repairing
909—Saddlery and harness910—Trunks, suitcases and bags
Census Group 10
Stone, Clay, and Glass Products
1001, 1644—Asbestos products andsteam and other packing, pipe andl)oiler covering, and gaskets, n.e.c.Brake linings and clutch facingsBuilding materialsPipe and boiler coveringAsbestos textiles, except brakelinings and clutch facingsAll other asbestos productsCustom and contract work
1002—Cement1003—China firing and decorating,not done in potteries1004-Clay products (other thanpottery) and nonclay refractoriesClay products (other than pottery)Nonclay refractories (exceptrefractory cement)Fire-clay products. shaped: brick,block or tile for locomotive andother fire-box liningClay sold, raw or prepared
I 005—Concrete productsMonuments and grave markers,and burial vaults
14 Concrete products (except14 monuments, etc.)14 1 006—Crucibles
1007—Emery wheels and other abrasiveappliances1008—GlassFruit jars (home-pack)Beverage containers, pressure wareFood-products containers, milk bottlesPressed and blown glass (exceptcontainers, lenses, tubing, bulbs,opal ware, etc.)Plate glass, polishedWindow glassObscured glass, md. cathedraland skylight glass, etc.
11 Wire glassLensesGlass containers (except pressure
9 ware, milk bottles and fruit jars)Glass tubing
8 Other glass products
8Bulbs for electric lamps, opal ware, etc.
1009—Glass products (except mirrors)made from purchased glassCut and decorated glasswareScientific glass apparatusLeaded, stained, and other orna-mental glass for windows, etc.Plate glass, cut, beveled andAll other glass products
8made from purchased glass
1010—Graphite, ground an(l refined101 1—Grindstones, pulpstones and
13millstones
251012—Hones, whetstones, andsimilar products1013—LimeLime (excl. agricultural lime)Agricultural lime
1014—Marble, granite, slate and otherstone productsMonumental stones
27. Marble, granite, slate and other stoneproducts (except monumental stones)
1015—Minerals and earths, ground orotherwise treated
framed and unframed1017—Pottery, mci. porcelain wareRe(l earthenwareStoneware (excçpt chemical) and
19yellow and Rockingham wareWhite wareHotel chinaOther pottery productsGarden and art potteryChemical stoneware and porcelainSaggersVitreous china and semi-vitreous oi por-celain plumbing fixtures (excl. fittings)Porcelain electrical supplies
CLASS MINOR
COMMODITY
GROUP
F 31
CF 44
F 44
M 19
MC
C
CU
U
UU
U
F 31
C
U
M 12
F 19
MINOR
• COMMODITY
GROUP
FFF
19
4343
M
MM
F
U
U
U
FU
F
F
M
US
UU
U
FUS
FF
MCC
UUUM
F
C
C
UU
F 19
F 41
CM
UU
F 44
44
C
U
19
19
19
19
12
44
44
FFFF
FFF
CC
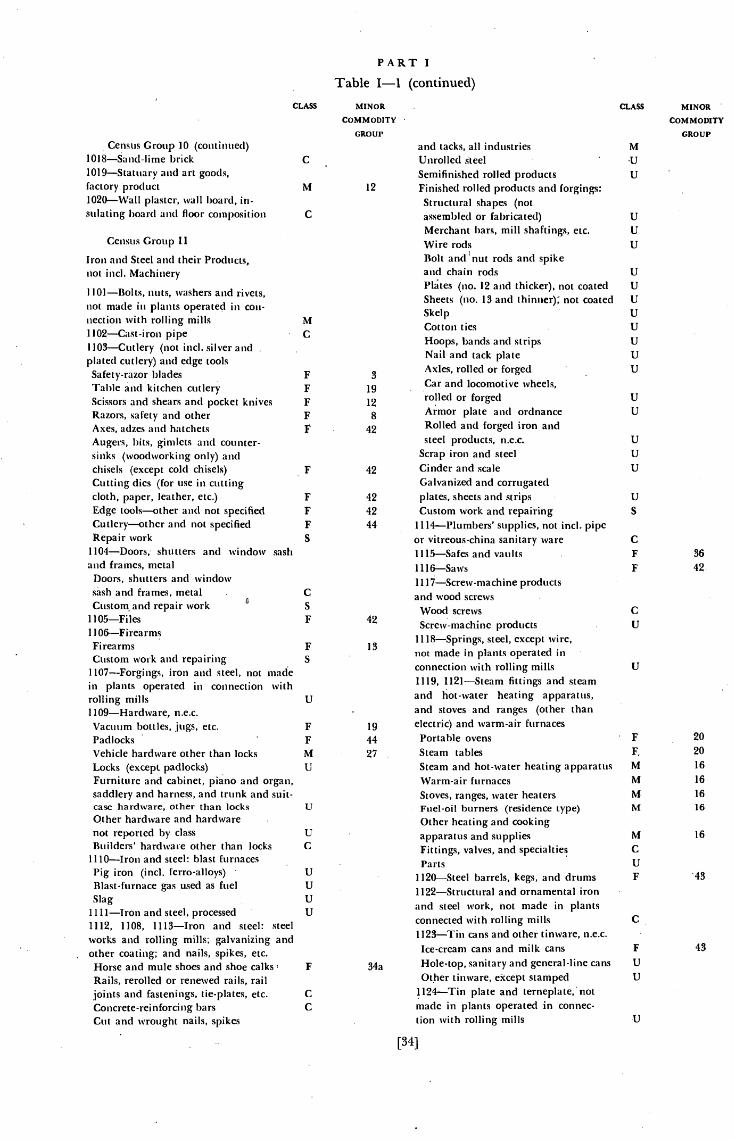
PART ITable I—I (continued)
CLASS MINOR
COMMODITY
GROUP
CLASS
and tacks, all industries MC Unrolled steel 'U
Census Group 10 (continued)1018—Sand-lime brick1019—Statuary and art goods, Semifinished rolled products Ufactory product M 12 Finished rolled products and forgings:1020—Wall plaster, wall board, in- Structural shapes (notsulating board and floor composition C assembled or fabricated)
Merchant bars, mill shaftings, etc.UU
Census Group 11 Wire rods U
Iron and Steel and their Products, Bolt and nut rods and spikenot mci. Machinery
1101—Bolts, nuts, washers and rivets,not made in plants operated in coil-nection with rolling mills1102—Cast-iron pipeI 103—Cutlery (not md. silver andplated cutlery) and edge toolsSafety-razor bladesTable and kitchen cutleryScissors and shears and pocket knivesRazors, safety and otherAxes, adzes and hatchets
M
C
FFFFF •
3
19
12
8
42
and chain rodsPlates (no. 12 and thicker), not coatedSheets (no. 13 and thinner): not coatedSkelpCotton tiesHoops, bands and stripsNail and tack plateAxles, rolled or forgedCar and locomotive wheels,rolled or forgedArmor plate and ordnanceRolled and forged iron and
UUU
UU
UUU
UU
Augers, hits, gimlets and counter- steel products, n.e.c. U
sinks (woodworking only) and Scrap iron and steel U
chisels (except cold chisels) F 42 Cinder and scale U
Cutting dies (for use in cutting Galvanized and corrugatedcloth, paper, leather, etc.) F 42 plates, sheets and strips UEdge tools—other and not specified F 42 Custom work and repairing S
Cutlery—other and not specified F 44 1114—Plumbers' supplies, not md. pipeRepair work S or vitreous-china sanitary ware C
1104—Doors, shutters and window sash 1115—Safes and vaults Fand frames, metal 1116—Saws FDoors, shutters and windowsash and frames, metalCustom, and repair work
C1117—Screw-machine productsand wood screwsWood screws C
1105—Files1106—FirearmsFirearmsCustom work and repairing
1 107—Forgings, iron and steel, not madein plants operated in connection withrolling mills1109—Hardware, n.e.c.
F
F
u
42
13
.
.Screw-machine products1118—Springs, steel, except wire,not made in plants operated inconnection with rolling mills1119, 1121—Steam fittings and steamand hot-water heating apparatus,and stoves and ranges (other than
U
U
Vacuum bottles, jugs, etc. F 19 electric) and warm-air furnacesPadlocks ' F 44 Portable ovensVehicle hardware other than locks M 27 Steam tablesLocks (except padlocks) U Steam and hot-water heating apparatusFurniture and cabinet, piano and organ, Warm-air furnacessaddlery and harness, and trunk and suit- Stoves, ranges, water heaterscase hardware, other than locks U Fuel-oil burners (residence type)Other hardware and hardware Other heating and cookingnot reported by classBuilders' hardware other than locks
1110—Iron and steel: blast furnaces
UC
• apparatus and suppliesFittings, valves, and specialties
.PartsPig iron (md. ferro-alloys)Blast-furnace gas used as fuelSlag
111 1—Iron and steel, processed1112, 1108, 1113—Iron and steel: steelworks and rolling mills; galvanizing andother coating; and nails, spikes, etc.Horse and mule shoes and shoe calks
UUUU
F
•
34a
1120—Steel barrels, kegs, and drums1122—Structural and ornamental ironand steel work, not made in plantsconnected with rolling mills1123—Tin cans and other tinware, n.e.c.Ice-cream cans and milk cansHole-top, sanitary and general-line cans
C
F
U
Rails, rerolled or renewed rails, rail Other tinware, except stamped U
joints and fastenings, tie-plates, etc.Concrete-reinforcing bars
C
C
1124—Tin plate and terneplate, notmade in plants operated in connec-
Cut and wrought nails, spikes tion with rolling mills U
MINOR
COMMODITY
GROUP
36
42
202016
16
16
16
16
43
43
FF,
M
M
MM
MC
UF
[34]
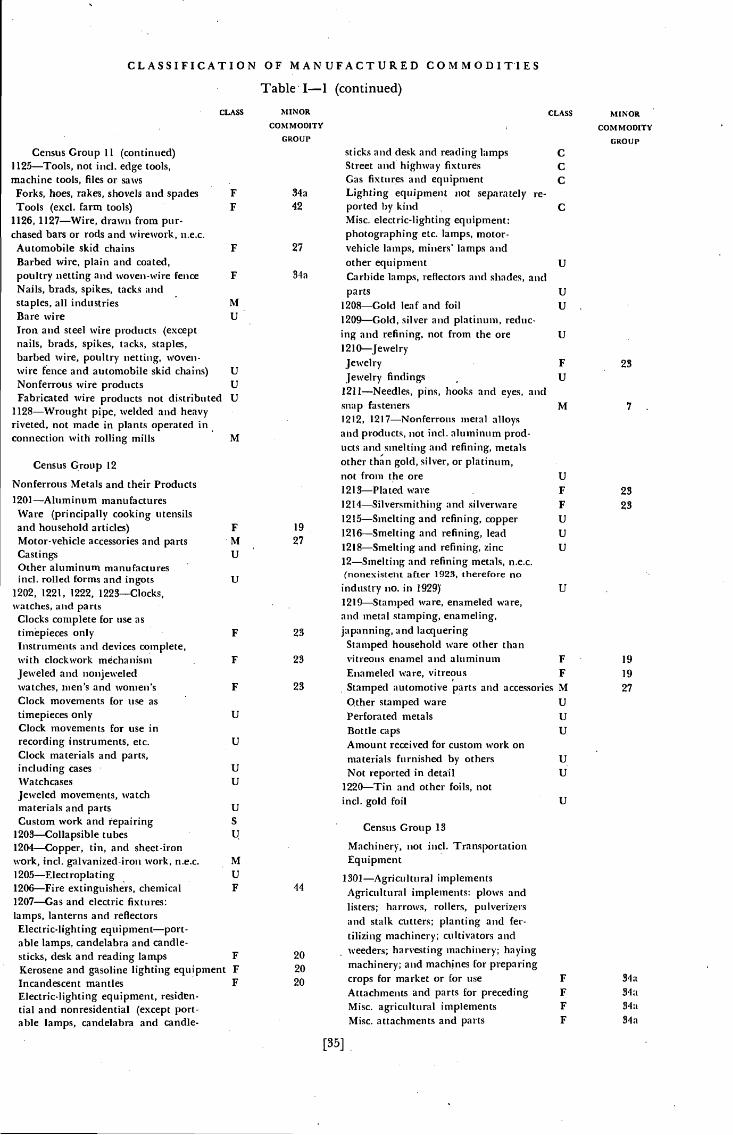
CLASSIFICATION OF MANUFACTURED COMMODITIES
Table I—i (continued)
Census Group 11 (continued)1125—Tools, not mci. edge tools,machine tools, files or sawsForks, hoes, rakes, shovels and spadesTools (exci. farm tools)
1126, 1127—Wire, drawn from pur-chased bars or rods and wirework, n.e.c.
Automobile skid chainsBarbed wire, plain and coated,poultry netting and woven-wire fenceNails, brads, spikes, tacks andstaples, all industriesBare wireIron and steel wire products (exceptnails, brads, spikes, tacks, staples,barbed wire, poultry netting, woven-wire fence and automobile skid chains)Nonferrous wire productsFabricated wire products not distributed
1128—Wrought pipe, welded and heavyriveted, not made in plants operated inconnection with rolling mills
Census Group 12
Nonferrous Metals and their Products1201—Aluminum manufacturesWare (principally cooking utensilsand household articles)Motor-vehicle accessories and partsCastingsOther aluminum manufacturesmd. rolled forms and ingots
1202, 1221, 1222, 1223—Clocks,
watches, and partsClocks complete for use astimepieces onlyInstruments and devices complete,with clockwork mechanismJeweled and nonjeweledwatches, men's and women'sClock movements for use astimepieces only UClock movements for use inrecording instruments, etc. UClock materials and parts,including cases UWatchcases UJeweled movements, watchmaterials and parts UCustom work and repairing S
1203—Collapsible tubes U1204—Copper, tin, and sheet-ironwork, md. galvanized-iron work, n.e.c. M1205—Electroplating U1 206—Fire extinguishers, chemical F1207—Gas and electric fixtures:lamps, lanterns and reflectorsElectric-lighting equipment—port-able lamps, candelabra and candle-sticks, desk and reading lam.ps FKerosene and gasoline lighting equipment FIncandescent mantles FElectric.lighting equipment,tial and nonresidential (except port-able lamps, candelabra and candle-
sticks and desk and reading lampsStreet and highway fixturesGas fixtures and equipment
34a Lighting equipment not separately re-42 ported l)y kind
Misc, electric-lighting equipment:photographing etc. lamps, motor-
27 vehicle lamps, miners' lamps andother equipment
34a Carbide lamps, reflectors and shades, andparts
1208—Gold leaf and foill209—Gold, silver and platinuni, redtic-ing and refining, not from the ore1210—JewelryJewelryJewelry findings
1211—Needles, pins, hooks and eyes, andsnap fasteners1212, 121 7—Nonferrous metal alloysand products, not md. aluminum prod-ucts and smelting and refining, metalsother than gold, silver, or platinum,not from the ore1213—Plated ware
1214—Silversinithing and silverware
91215—Smelting and refining, copper
271216—Smelting and refining, lead1218—Smelting and refining, zinc12—Smelting and refining metals, n.e.c.(nonexistent after 1923, therefore noindustry no. in 1929)1219—Stamped ware, enameled ware,and metal stamping, enameling,
23 japanning, and lacqueringStamped household ware other than
23 vitreous enamel and aluminumEnameled ware, vitreous
23 Stamped automotive parts and accessoriesOther stamped warePerforated metalsBottle capsAmount received for custom work onmaterials furnished by othersNot reported in detail
1220—Tin and other foils, notmci. gold foil
Census Group 13
Machinery, not md. TransportationEquipment
1301—Agricultural implementsAgricultural implements: plows andI isters; harrows, rollers, pulverizersand stalk cutters; planting and fer-tilizing machinery; cultivators andweeders; harvesting machinery; hayingmachinery; and machines for preparingcrops for market or for useAttachments and parts for precedingMisc. agricultural implementsMisc. attachments and parts
CLASS MINOR
COMMODITY
GROUP
C
CC
C
UF
F
UU
U
F
F
MUUU
UU
U
MINOR
COMMODITY
GROUP
CLASS
FF
F
F
MU
UU
U
M
F
MU
U
F
F
F
U
U
U,U
F 23
U
M 7
U
2323
19
19
27
34a34a34a34a
202020
[35]
FFF
F

PART ITable I—i (continued)
Census Group 13 (continued)1302—Cash registers and adding, calcu-lating, and card-tabulating machinesMachinesParts and attachmentsRebuilt machines, experimental work,postage meters and credit systems
1303—Electrical machinery,apparatus and suppliesDry batteries: 6-inchVacuum cleanersElectric fans (destined for domestic use)Domestic (household) apparatus andappliancesRadio apparatus and tubes:Receiving setsCombination phonographs and radiosTransmitting setsRadio and flashlight batteriesReplacement parts, md. head sets
Generators, not mci. motor generatorsets, automotive generators or self-contained power and lighting outfitsMotor-generator sets and dyna-motors (not mci. arc welding sets)Power transformersStationary motors, 1 h.p. and overIndustrial and commercial apparatusand appliances (not md. motor-driven tools)Measuring instruments and meters(except laboratory testing andscientific instruments)Switchboards, circuit breakersand switchesInsulated wire and cable: rubber.insulated except flexible cord, andpaper and cotton insulatedFuses and fuse blocksOverhead trolley-line materialRailway signals and attachmentsSearchlights and floodlightsTelephone and telegraph apparatusSignaling apparaws (other than railway)Rectifying apparatusOther electrical machinery,apparatus and suppliesLightning arrestersWet primary batteriesSelf-contained power and lightingoutfits not exceeding 5 kw.Electrotherapeu tic andelectromedical apparatusLaboratory testing and scientific instru-mentsElectric fans destined forcommercial and industrial useElectric locomotivesWiring devicesInterior conduitsRailway and vehicle power generatorsStationary motors (under 1 h.p.)Railway and vehicle motors•Storage battery parts and suppliesParts and supplies for both wet and drybatteries U
Instrument and meter transformersInsulated wire and cable: varnished-cambric, magnet, and other not reported
35a by kind, and rubber, flexible cord35a Carbons
Flashlight cases35a Parts and supplies for all types of motors
Transformers, etc. except powerControl apparatus
6b Incandescent-filament lamps17a Domestic ranges, 21/2 kw. and over20 Water heaters for permanent installation
Loud speakers20 Transformers, total
Radio tubes21 Misc, radio parts and accessories and21 transformers21 Generators: automotive generators,21 for battery charging and21 automotive starter-motors
Ignition apparatus for in-ternal-cQmbustion engines
33a Storage batteriesCustom work and repairs
33a 1304—Engines, turbines, tractors,33a and water wheels33a Steam engines (except traction)
and turbines, excl. marineWater turbines and water wheels
33b Internal-combustion engines:Diesel and semi-Diesel types,other than marine
33c Electric-ignition type, otherEngines and turbines, classand type not reportedParts for sale as suchTractors and traction enginesSteam engines (except traction) andturbines, marineInternal-combustion engines(except tractors):
Diesel and semi-Diesel, marineElectric-ignition type air-craft and motor-vehicleElectric-ignition type, marine
1305—Foundry and machine-shop products, n.e.c.Dishwashing machineryCement and concrete machineryClay-working machineryCranes (md. hoists and derricks)
41 Dredging, excavating, and road-building machinery
41 Stone-working machineryCars and trucks (mining)Mining machinery (not md. oil-wellmachinery)Oil-well machineryOre crushersBakers' machinery and equipmentBaling presses (other than hay presses)Bookbinding machineryBottling machineryCanning machinery
CLASS MINOR
COMMODITY
GROUP
CLASS MINOR
COMMODITY
GROUP
FF
F
FFF
F
FFFFF
F
FFF
F
F
F
FFFFFFFF
FFF
F
F
F
FFC
CUUUU
U
UUUUUUMMMMMM
M
M
MMS
FF
FF
FFF
U
U
U
U
FF
FF
FFF
F
FF
F
FFF
33c
33c33c3k33c33c33c33c33c
33cSSc33c
34a
6b16
16
21
21
.21
21
27
2727
32a32a
32a32a
32a32a34b
1 7a
32f
32f32f
32f32f32g
32g32g
32g32h32h32h32h32h
35a37
[361
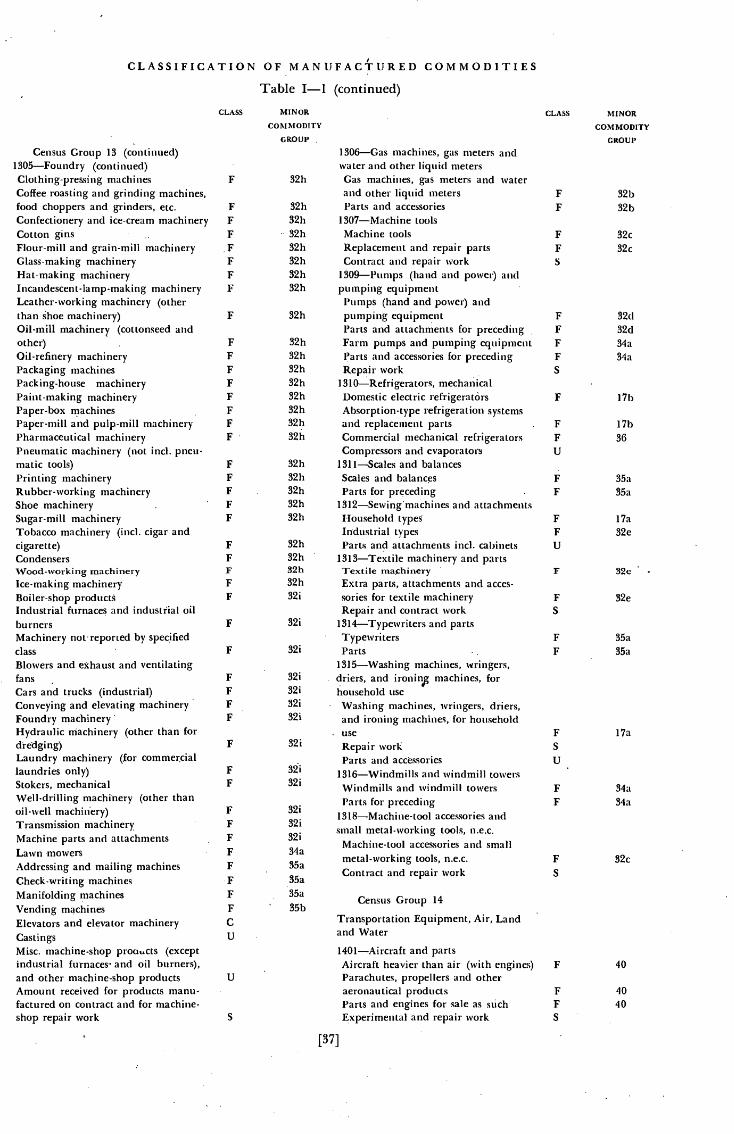
CLASSIFICATION OF MAN UFAC"FURED COMMODITIES
Table I—i (continued)
Census Group 13 (continued)1305—Foundry (continued)Clothing-pressing machinesCoffee roasting and grinding machines,food choppers and grinders, etc.Confectionery and ice-cream machineryCotton ginsFlour-mill and grain-mill machineryGlass-making machineryHat-making machineryIncandescent-lamp-making machineryLeather-working machinery (otherthan shoe machinery)Oil-mill machinery (cottonseed andother)Oil-refinery machineryPackaging machinesPacking-house machineryPaint-making machineryPaper-box machinesPaper-mill and pulp-mill machineryPharmaceutical machineryPneumatic machinery (not mci. plieti-inatic tools)Printing machineryRubber-working machineryShoe machinerySugar-mill machineryTobacco machinery (mci. cigar andcigarette)CondensersWood-working machineryIce-making machineryBoiler-shop productsIndustrial furnaces and industrial oilburnersMachinery not reported by specifiedclassBlowers and exhaust and ventilatingfansCars and trucks (industrial)Conveying and elevating machineryFoundry machinery•Hydraulic machinery (other than fordredging)Laundry machinery (for commerciallaundries only)Stokers, mechanicalWell-drilling machinery (other thanoil-well machinery)Transmission machineryMachine parts and attachmentsLawn mowersAddressing and mailing machinesCheck-writing machinesManifolding machinesVending machinesElevators and elevator machineryCastingsMisc. machine-shop pronucts (exceptindustrial and oil burners),and other machine-shop productsAmount received for products manit-factured on contract and for machine-shop repair work
MINOR CLASS
COMMODITY
GROUP
1306—Gas machines, gas meters andwater and other liquid meters
32h Gas machines, gas meters and waterand other liquid meters
32h Parts and accessories32h 1307—Machine tools32h Machine tools32h Replacement and repair parts32h Contract and repair work32h 1309—Pumps (hand and power) and92h pumping equipment
Pumps (hand and power) and32h pumping equipment
Parts and attachments for preceding32h Farm pumps and pumping equipment32h Parts and accessories for preceding32h Repair work32h 131 0—Refrigerators, mechanical32h Domestic electric refrigerators32h Absorption-type refrigeration systems32h and replacement parts32h Commercial mechanical refrigerators
Compressors and evaporatois32h 1311—Scales and balances32h Scales and balances32h Parts [or preceding32h 1 312—Sewingmachines and attachments32h Household types
Industrial types32h Parts and attachments mcI. cabinets32h 1313—Textile machinery and parts82h Textile32h Extra parts, attachments and acces-32i sories for textile machinery
Repair and contract work32i 1914—Typewriters and parts
Typewriters32i Parts
1315—Washing machines, wringers,32i driers, and machines, for32i household use32i Washing machines, wringers, driers,
and ironing machines, for household
35a Census Group 1435b
Transportation Equipment, Air, Landand Water
1401—Aircraft and partsAircraft heavier than air (with engines)Parachutes, propellers and otheraeronautical productsParts and engines for sale as suchExperimental and repair work
CLASS
F
FFF
FFF
F
FFFF
FFFF
FFFFF
FFFFF
F
F
FFFF
F
FF
FFF
FFFFFC
U
U
S
MINOR
COMMODITY
GROUP
32b32b
32c32c
32d32d34a34a
I 7b
17b36
35a35a
I 7a
32e
32c
32e
35a35a
1 7a
34a34a
32c
40
4040
FF
FFS
FFF
F
S
F
F
FU
FF
FFU
F
FS
FF
FS
U
FF
F
S
F
FFS
use32i Repair work
Parts and accessories32i I 316—Windmills and windmill towers32i Windmills and windmill
Parts for preceding321
1318—Machine-toot accessories and32i
small metal-working tools, n.e.c.32i
Machine-tool accessories and small34a
metal-working tools, n.e.c.95a
Contract and repair work35a
[37]
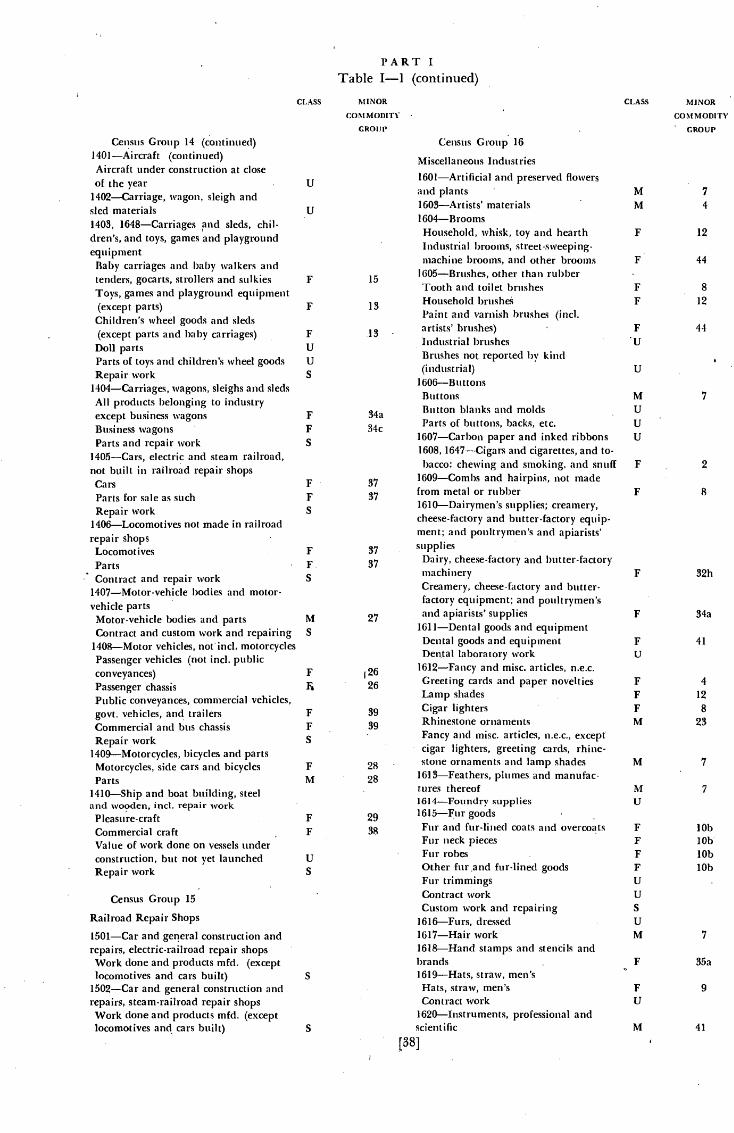
Census Group 14 (continued)1401—Aircraft (continued)Aircraft under construction at closeof the year
1402—Carriage, wagon, sleigh andsled materials1403, 1648—Carriages find sleds, chil-dren's, and toys, games and playgroundequipmentBaby carriages and baby walkers andtenders, gocarts, strollers and sulkiesToys, games and playground equipment(except parts)Children's wheel goods and sleds(except parts and baby carriages)Doll partsParts of toys and children's wheel goodsRepair work
1404—Carriages, wagons, sleighs and sledsAll products belonging to industryexcept business wagonsBusiness wagonsParts and repair work
1405—Cars, electric and steam railroad,not built in railroad repair shopsCarsParts [or sale as suchRepair work
1406—Locomotives not made in railroadrepair shopsLocomotivesPartsContract and repair work
1407—Motor-vehicle bodies and motor-vehicle partsMotor-vehicle bodies and partsContract and custom work and repairing
1408—Motor vehicles, not md. motorcyclesPassenger vehicles (not md. publicconveyances)Passenger chassisPublic conveyances, commercial vehicles,govt. vehicles, and trailersCommercial and bus chassisRepair work
1409—Motorcycles, bicycles and partsMotorcycles, side cars and bicyclesParts
1410—Ship and boat building, steeland wooden, mci. repair work
Pleasure-craftCommercial craftValue of work done on vessels underconstruction, but not yet launchedRepair work
Census Group 15
Railroad Repair Shops
1501—Car and general construction andrepairs, electric-railroad repair shopsWork done and products mfd. (exceptlocomotives and cars built)
1502—Car and general construction andrepairs, steam-railroad repair shopsWork done and products mfd. (exceptlocomotives and cars built)
CLASS MINOR
COMMODITY
C.ROU I'
Household, whisk, toy and hearthIndustrial brooms, street-sweeping-machine brooms, and other brooms
1605—Brushes other than rubber15
Tooth and toilet brushes
13Household brushesPaint and varnish brushes (md.
13- artists' brushes)
Industrial brushesBrushes not reported by kind(industrial)
1 606—B ii ttons
CLASS MINOR
COMMODITY
C.
U
M 7
U
UU
F 2
F 8
F 32h
F 34a
F 41
U
M 7
M 7
U
FFFFUUS
UM
F 35a
F 9U
M 41
PART ITable I—i (continued)
CenSus Group 16
Miscellaneous Industries1601—Artificial and preserved flowersand plants1603—Artists' materials1604—Brooms
M 7
M 4
F 12
F 44
F 8
F 12
F 4-1
U
U
F
F
FUUS
FFS
FFS
FF.S
MS
FF1
FFS
FM
FF
US
S
S
Buttons
34aButton blanks and molds
34c Parts of buttons, backs, etc.1607—Carbon paper and inked ribbons1608, 1647—Cigars and cigarettes, and to-bacco: chewing and smoking. and snuff
371609—Combs and hairpins, not madefrom metal or rubber1610—Dairymen's supplies; creamery,cheese-factory and butter-factory equip-ment; and poultrymen's and apiarists'supplies
Dairy, cheese-factory and butter-factorymachineryCreamery, cheese-factory and butter-factory equipment; and poultrymen's
27 and apiarists' supplies161 1—Dental goods and equipmentDental goods and equipmentDental laboratory work
26 1612—Fancy and misc, articles, n.e.c.126 Greeting cards and paper novelties
Lamp shadesCigar lighters
39 Rhinestone ornamenLsFancy and misc. articles, n.e.c., exceptcigar lighters, greeting cards, rhine-
28 stone ornaments and lamp shades
28 1613—Feathers, plumes and manufac-tures thereof1614—Foundry supplies
29 1615—Fur goodsFur and fur-lined coats and overcoatsFUr neck piecesFur robesOther fur and fur-lined goodsFur trimmingsContract workCustom work and repairing
1616—Furs, dressed1617—Hair work1618—Hand stamps and stencils and1)rands1619—Hats, straw, men'sHats, straw, men'sContract work
1620—Instruments, professional andscientific
[38]
FFFM
4
12
8
23
lObI Ob
lObI Ob
7
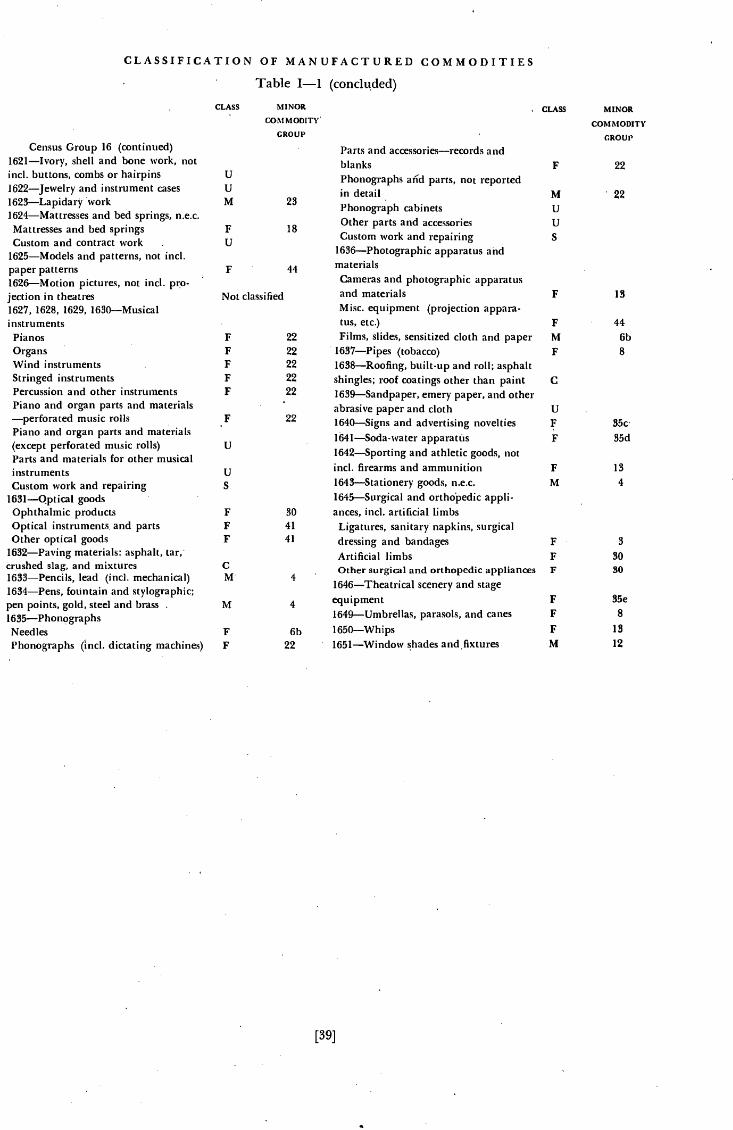
CLASSIFICATION OF MANUFACTURED COMMODITIES
FFFFF
F
Table 1—1 (concluded)
MINOR
COMMODITY
GROUP
dressing and bandagesArtificial limbs
F
M
U
U
S
F
F
M
F
C
UFF
FM
F
FF
FF
F
M
MINOR
COMMODITY
GROUP
22
• 22
13
44
6b8
35c'
35d
13
4
3
3030
SSe
8
13
12
CLASS
UUM
FU
F
CLASS
Not classified
Census Group 16 (continued)1621—Ivory, shell and bone work, notmci. buttons, Combs or hairpins1622—Jewelry and instrument cases1623—Lapidary work1624—Mattresses and bed springs, n.e.c.Mattresses and bed springsCustom and contract work
1625—Models and patterns, not mci.paper patterns1626—Motion pictures, not mci. pro-jection in theatres1627, 1628, 1629, 1630—MusicalinstrumentsPianosOrgansWind instrumentsStringed instrumentsPercussion and other instrumentsPiano and organ parts and materials—perforated music rollsPiano and organ parts and materials(except perforated music rolls)Parts and materials for other musicalinstrumentsCustom work and repairing
1631—Optical goodsOphthalmic productsOptical instruments, and partsOther optical goods
1632—Paving materials: asphalt, tar,'crushed slag, and mixtures1633—Pencils, lead (mci. mechanical)1634—Pens, fountain and stylographic;pen points, gold, steel and brass1635—PhonographsNeedlesPhonographs (mci. dictating machines)
U
US
FFF
CM
M
FF
Parts and accessories—records andblanksPhonographs auid parts, not reportedin detail
23 Phonograph cabinets
18Other parts and accessoriesCustom work and repairing
1636—Photographic apparatus and
44 materialsCameras and photographic apparatusand materialsMisc, equipment (projection appara-tus, etc.)
22 Films, slides, sensitized cloth and paper22 1637—Pipes (tobacco)22 1638—Roofing, built-up and roll; asphalt22 shingles; roof coatings other than paint22 1639—Sandpaper, emery paper, and other
abrasive paper and cloth22 1640—Signs and advertising novelties
apparatus1642—Sporting and athletic goods, notmci. firearms and ammunition1645—Stationery goods, n.e.c.1645—Surgical and orthopedic appli.
30 ances, mci. artificial limbs41 Ligatures, sanitary napkins, surgical41
Other surgical and orthopedic appliances1646—Theatrical scenery and stage
4 equipment1649—Umbrellas, parasols, and canes
6b 1650-Whips22 ' 1651—Window shades and fixtures
[39]
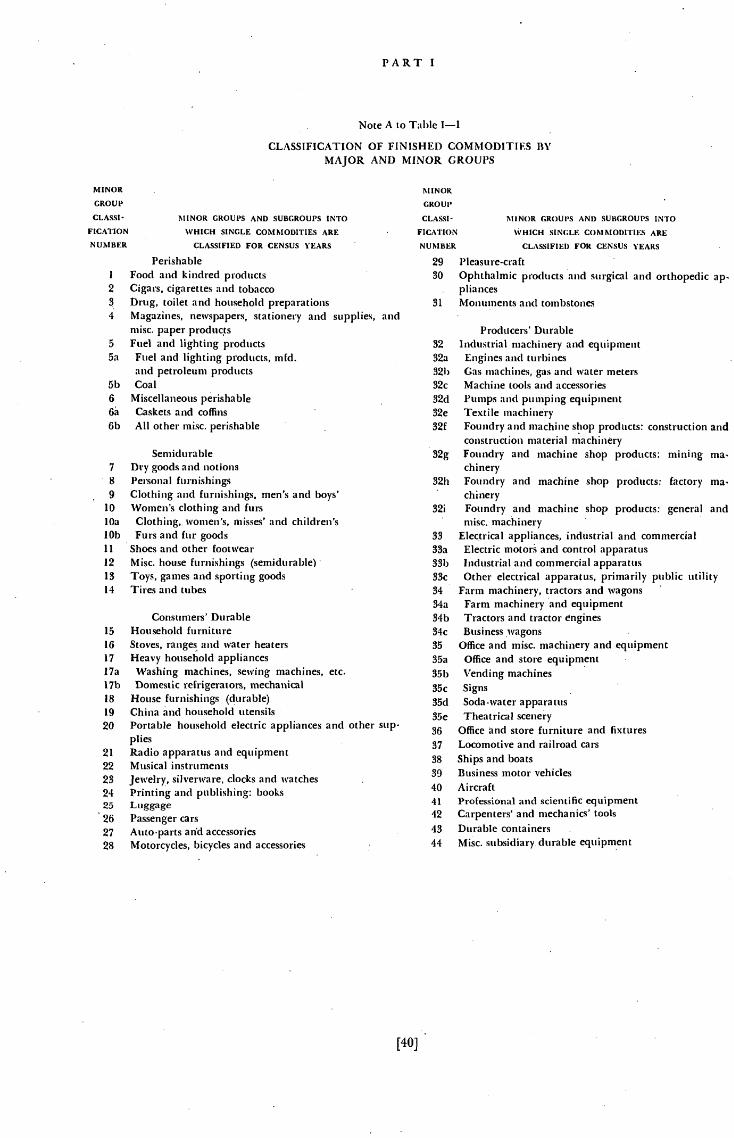
PART I
Note A to Table I—I
CLASSIFICATION OF FIN ISH ED COMMODITI ES BYMAJOR AND MINOR GROUPS
MINOR . MINOR
GROUP GROUP
CLASSI- MINOR GROUPS AND SUBGROUPS INTO CLASS!- MINOR GROUPS AND SUBGROUPS INTO
FICATION WHICH SINGLE COMMODITIES ARE FICArION WHICH SIN(;LE COMMODITIES ARE
NUMBER CLASSIFIED FOR CENSUS YEARS NUMBER CLASSIFIED FOR CENSUS YEARS
29 l'leasure-craft90 Ophthalmic products and surgical and orthopedic ap-
pliances31 Monuments and tombstones
Producers' Durable32 Industrial machinery and equipment32a Engines and turbines32h Gas machines, gas and water meters32c Machine tools and accessories32d Pumps and pumping equipment32e Textile machinery32f Foundry and machine shop products: construction and
construction material machinery32g Foundry and machine shop products: mining ma-
ch i nery
32h Foundry and machine shop products: factory ma-chinery
321 Foundry and machine shop products: general andmisc, machinery
33 Electrical appliances, industrial and commercial33a Electric motors and control apparatus9Th Industrial and commercial apparatus33c Other electrical apparatus, primarily public utility34 Farm machinery, tractors and wagons34a Farm machinery and equipment34b Tractors and tractor engines34c Business wagons35 Office and misc, machinery and equipment35a Office and store equipment35b Vending machines35c Signs35d Soda-water apparatus35e Theatrical scenery36 Office and store furniture and fixtures37 Locomotive and railroad cars38 Ships and boats39 Business motor vehicles40 Aircraft41 Professional and scientific equipment42 Carpenters' and mechanics' tools43 Durable containers44 Misc. subsidiary durable equipment
Perishable1 Food and kindred products2 Cigars, cigarettes and tobaccoS Drug, toilet and household preparations4 Magazines, newspapers, stationery and supplies, and
misc. paper products5 Fuel and lighting products5a Fuel and lighting products, mid.
and petroleum products5b Coal6 Miscellaneous perishable6à Caskets and coffins6b All other misc. perishable
Semidurable7 Dry goods and notions8 Personal furnishings9 Clothing and furnishings, men's and boys'
10 Women's clothing and furslOa Clothing,, women's, misses' and children'slOb Furs and fur goods11 Shoes and other footwear12 Misc. house furnishings (semidurable)13 Toys, gaines and sporting goods14 Tires and tubes
Consuniers' Durable15 Household furniture16 Stoves, ranges and water heaters17 Heavy household appliances17a Washing machines, sewing machines, etc.17b Domestic refrigerators, mechanical18 House furnishings (durable)19 China and household utensils20 Portable household electric appliances and other sup-
plies21 Radio apparatus and equipment22 Musical instruments23 Jewelry, silverware, clocks and watches24 Printing and publishing: books25 Luggage26 Passenger cars27 Auto-parts and accessories28 Motorcycles, bicycles and accessories
[40]

Table 1—2
ESTIMATES OF COMMODITY VALUE FOR COMBINED TO-
TALS AND OTHER COMMODITY RECLASSIFICATIONS
Unless otherwise indicated in the notes at the end of the table, the percentageallocations, wherever shown, are based on data for the Census year nearestto the years for which the allocation had to be estimated. Cases where no per-centages are given represent reclassification of commodities to assure coni-parable figures for the period. Specific footnotes indicate for each case thenature of the adjustment.
Comments on the table will be found in the Preface to Part I, Section 2.

PART I
Table 1—2
ESTIMATES OF COMMODITY VALUE FOR COM MNED TOTALS AND•OTHER COMMODITY REGLASSIFICATIONS
INDUSTRY NUMBER,
COMMODITY AND
CENSUS YEARS IN
WHICH ESTIMATED
PERCENTAGE
OF COM-
BINED TOTAL
ACCOUNTED
FOR BY EACH
'COMMODITY
INDUSTRY NUMBER,
COMMODITY AND
CENSUS YEARS IN
WHICH ESTIMATED
PERCENTAGE
OF COM-
BINED TOTAL
ACCOUNTED
FOR BY EACH
COMMODITY
103
Census Group 1
(1919.1923)Creamery butterWhey butter
109(1919.1921)Chocolate (except coatings)Coatings
110
(1919-1921)
Coffee, roasted and groundSpices, ground
(1925, 1933)
Coffee and spices 1
111
(1919-1921)
Ice-cream mix 2
117
(1919-1925)Food preparations, n.e.c.3
(1929-1931)Food preparations, n.e.c.4
118(1919-1923)Ice cream 5
99.8.2
55.344.7
92.37.7
87.412.6
87.68.83.6
88.511.5
129, 130, 131(1919.1923)Refiners' edible sirupRefiners' nonedible sirup
213
Census Group 2
(1919.1921)
Collars, men'sContract workOther products not belonging to industry
214, 233, 236(1919-1925)Linen woven goods and thread (part)jute woven goods (part) 11Fish line 12
216 '3(1919)Voiles, osnaburgs and other woven goods:Voiles
BaggingCotton bags
(1919-1 925)
Reps, poplins and broadcloths; pajama checks,dimities, and similar fabrics; crepes; otherwoven goods (except preceding) md. baggingand excl. voiles and osnaburgs:Reps, poplins and broadclothsPajama checks, dimitiesCrepesOther (except preceding) mci. baggingand exci. voiles and osnaburgs
(1919-1925)
- Linen woven goods (part) 2
10.4
87.6
6.6
OsnaburgsOther woven goods, except voiles and osnahurgs
(1919-1921)Bagging and cotton bags made fromfabrics woven by same establishment:
64.235.8
27.2
42.857.248.5
9.4
15.2
16.2
68.6
69.5
30.5
35.3932.1
53.1
34.5
3.8
61.7
31.5
'3.5
0.6
64.4
12.4
120(1919-1925)Shortenings (not mci. lard) and vegetable' cooking oils 6
(1927) 7
125
(1919.1925)Peanuts, walnuts and other nuts, processed orshelled 8
(1933)9
127
(1919-1921)Clean rice, whole-grain gradesSecond-head, screenings, and brewers' rice
(1933)
Clean rice, whole-grain gradesSecond-head, screenings, and brewers' ricePolish and bran
128(1923 -1925)
Sausage, meat puddings, head cheese, scrapple, etc.Sausage casings
(1933)10
Other woven goods (residual as estimated above):Draperies, cottonRugs (except bath mats), cottonAll other woven goods
(1927)Other woven goods (as shown in 1927Census) and sheets and pillow cases:Draperies, cottonRugs . . - cottonTerry fabrics -
Misc, other woven goods, md. sheets and pillowcases
[42]

CLASSIFICATION OF MANUFACTURED COMMODITIES
Table 1—2 (continued)
PERCENTAGE PERCENTAGE
OF COM- OF COM-
INDUSTRY NUMBER, BINED TOTAL INDUS1RY NUMBER, DINED TOTAL
COMMODITY AND ACCOUNTED COMMODITY AND ACCOUNTED
CENSUS YEARS IN FOR BY EACH CENSUS YEARS IN FOR BY EACH
WHICH ESTIMATED COMMODITY WHICH ESTIMATED COMMODITY
Census Group 2 (continued) (All
(1919-1933) Mensi4a 500Misc. other woven goods md. sheets Women's 500cases:Misc, other woven goods, 87.4 235Sheets and pillow 12.6 (1919-1921)
Nottingham lace curtains and nets 65.3Cloth composed cotton and silk or Other lace goods 34.7
fiber and silk .
Fabrics . .. in chief value of 219, 226, 239,'5 and 246
cotton, rayon 48.4 (19194925)
Fab.rkcs, . . . in chief value of Embroideries:
ucm, containing silk 9,4 Embroideries 3.9
Fabrics entirely or in chief value of rayon 42.2 Contract work 6.2
(1919.1927) Millinery:
Fabrics . . . in chief value of cotton, containing Trimmed hats 57.7
rayon: . Infants' 2.3
Fabrics . . . 72.8 Hat frames, linings and trimmings 4.1
Draperies . . . 27.2 Other millinery products .5
(1919-1927) Millinery braids .8
Fabrics entirely or in chief yaluç of Contract work .1
Fabrics . . . - 80.1 Trimmings, etc.:
Draperies . . . 19.9 Stamped art goods . . . 3.5
(1919) Trimmings (md. bias bindings) 9.4
All other Neckwear and scarfs, women's 5.5
Other products (exci. cordage and rope) 45.7 Contract work 1.0
bdQnging to the industry 543 Handkerchiefs:Women's 4.8
(1919-1925) 239Furnishing goods, men's 90.5 (1933)Handkerchiefs, men's 14 9.5 Trimmed hats and infants' headwear 91.1
224 905Hat frames, linings and trimmings; other
(A 11 years)millinery products; millinery braids;
Gloves, men's 14aand contract work 8.9
Gloves, women's 14a 25.0 243
229(1919.1925)
(1933) Shirts (mc!. neckbands) 89.6
Hats, fur-felt, men's 70.4Contract work 5.6
Hats, fur.:felt, womens . 1.2Other products not belonging to industry 4.8
Hat 28.2 (1919-1925)
Cqntract .2 Shirts (in neckbands):Shirts 99.2
230 Neckbands .8
(1919-1921)Hats, woohfelt, men's 30.4 245
Hats, wool-felt, women's and children's 69.6Elastic woven goods, men's 70.0
2M Elastic woven goods, women's 30.0
(1933)Hosiery-- Woven goods, men s 72.7
MCfl'S 20.9 Woven goods, women's 26.5and infants' Contract work .8
(19274933)Shirts and drawers: 246
Men's 50.0 (1919-1929)
Womeii's 14a 50.0 Trimmings 84.8
(1919-1925) Bias bindings 15.2
Men's 14a 33.3 (1933)
Women's 14a 66.7 Stamped art goods for embroidering 25.8
[43]

INDUSTRY NUMBER,
COMMODITY AND
CENSUS YEARS IN
WHICH ESTIMATED.
Census Group 2 (continued)
(1933) (continued)Bias bindingsTrimmings (except bias bindings)Contract work
307
(1919)Cork insulation productsCork stoppers and bottle closuresCork specialties .
309(1919-1925)Furniture, household:Furniture, householdUnfinished frames for suites, chairs, etc.
(1931-1933)Furniture, household: laFurniture, householdUnfinished frames for suites, chairs, etc.
(1919.1923)Business furniture:For stores and officesFor public buildingsProfessional, laboratory, etc.LockersSeats for public conveyances
(1933)Furniture for public buildings and seats for publicconveyances:Public buildingsSeats for public conveyances
(All years)Furniture made in other industriesand not reported by class 17
(1919-1925)Radio cabinets 18
312Matches, booksMatches, other than books
315(1919-1921)
Pulp goods 19WaU board 19
320(1919-1925)Commodity total (excl. contract work):Wooden wareLadders and partsScaffolding equipmentAll other
(1927)All other, md. scaffolding equipment:Scaffolding equipmentAll other
(1933)WoodenwareLadders and parts
PERCENTAGE
OF COM-
BINED TOTAL
ACCOUNTED
FOR BY EACH
COMMODITY
INDUSTRY NUMBER,
COMMODITY AND
CENSUS YEARS IN
WHICH ESTIMATED
Scaffolding equipmentAll otherContract work
Census Group 4
401, 402, 403, 404, 405, 406, 408(All years)Paper goods, n.e.c.2°
25.325.1 Census Group 5
504, 505(1919.1927)
Engraving - - . (except greeting cards)Greeting cards
Lithographing (except greeting cards)Greetiiig cards
508, 509, 510(1919-1927)Commercial printing (except greeting cards)
73.2 Greeting cards
14.5
6.9 Census Group 6
608(1919-1925)Chemicals, n.e.c.21
611
(1919-1925)Biological products for human useBiological products for animal use
625(1919.1927)
Oils, n.e.c.22
627(1919)
Patent or proprietary compounds(excl. boiler compounds)Boiler compounds
(1919-1925)
Patent or proprietary compounds (excl.agricultural insecticides and boiler compounds)Agricultural insecticides
Census Group 718.8
7.9.3
73.0
CokeGasScreening and breeze and all other by-products
704, 705(1919-1927)
Lubricating oils not iitade in petroleum refineries 22
[44]
PERCENTAGE
OF COM-
BINED TOTAL
ACCOUNTED
FOR BY EACH
COMMODITY
.3
77.61.2
PART I
Table 1—2 (con tinued)
Census Group 3
11.1
62.0.1
49.6
98.31.7 506
98.91.1
2.82.6
47.452.6
16.084.0
92.08.0
97.8
2.2
40.1
59.9
91.88.2
89.6104
62.220.4129
701
(1933)Tar
1.2
98.8
15.9
5.0
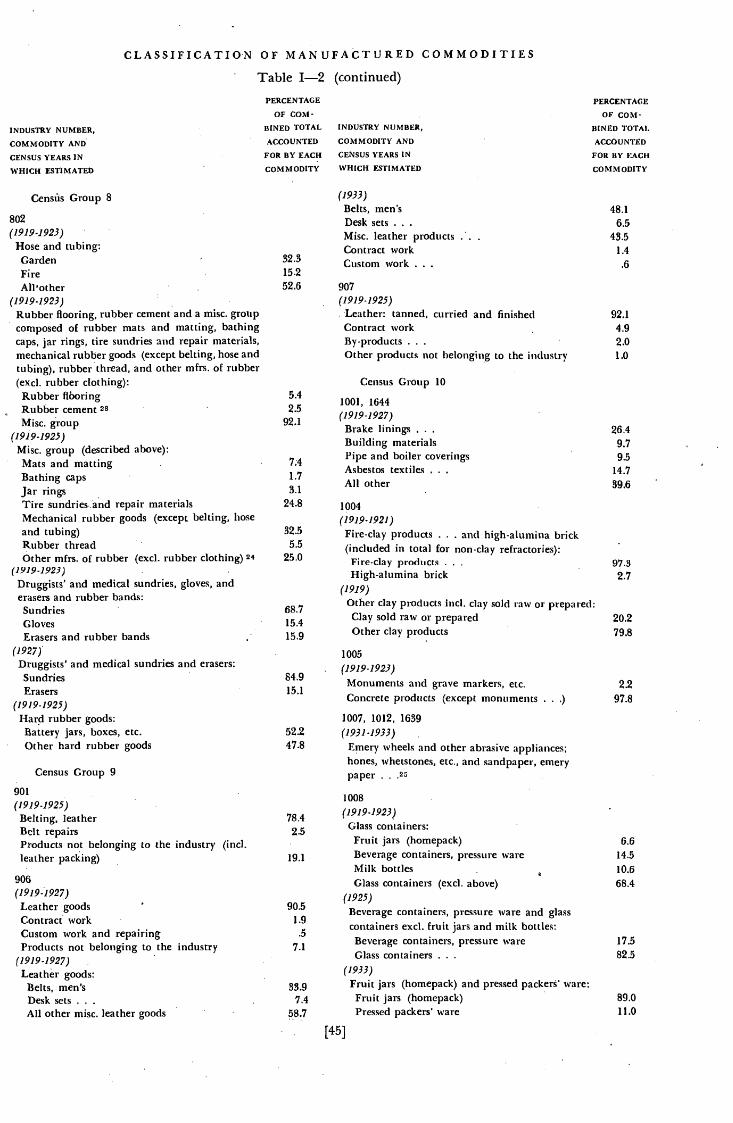
CLASSIFICATION OF MANUFACTURED COMMODITIES
Table 1—2 (continued)
INDUSTRY NUMBER,
COMMODITY AND
CENSUS YEARS IN
WHICH ESTIMATED
PERCENTAGE
OF COM-
BINED TOTAL
ACCOUNTED
FOR BY EACH
COMM ODITY
INDUSTRY NUMBER,
COMMODITY AND
CENSUS YEARS IN
WHICH ESTIMATED
PERCENTAGE
OF COM-
BINED TOTAL
ACCOUNTED
FOR BY EACH
COMMODITY
Census Group 8
802(1919-1923)
Hose and tubing:GardenFireAH'other
(1919-1923)Rubber flooring, rubber cement and a misc. groupcomposed of rubber mats and matting, bathingcaps, jar rings, tire sundries and repair materials,mechanical rubber goods (except belting, hose andtubing), rubber thread, and other mfrs. of rubber(excl. rubber clothing):
Rubber flboringRubber cement 23Misc. group
(1919-1 925)Misc, group (described above):Mats and mattingBathing capsJar ringsTire sundries, and repair materialsMechanical rubber goods (except belting, hoseand tubing)Rubber threadOther mirs. of rubber (exd. rubber clothing) 24
(1919-1923)Druggists' and medical sundries, gloves, anderasers and rubber bands:SundriesGlovesErasers and rubber bands
(1927)Druggists' and medical sundries and erasers:SundriesErasers
(1919-1925)Hard rubber goods:Battery jars, boxes, etc.Other hard rubber goods
Census Group 9
got(1919-1925)Belting, leatherBelt repairsProducts not belonging to the industry (mci.leather packing)
906(1919-1927)Leather goodsContract workCustom work and repairingProducts not belonging to the industry
(1919-1927)Leather goods:Belts, men'sDesk sets . -
All other misc. leather goods
(1933)
Belts, men'sDesk setsMisc, leather productsContract workCustom work
907(1919-1925)Leather: tanned, curried and finishedContract workBy-products .
Other products not belonging to the industry
Census Group 10
1001, 1644(1919-1927)Brake liningsBuilding materialsPipe and boiler coveringsAsbestos textilesAll other
1004(1919-1921)
Fire-clay products - - . and high-alumina brick(included in total for non-clay refractories):Fire-clay products - - -
High-alumina brick(1919)
Other clay products mci. clay sold raw or prepared:Clay sold raw or preparedOther clay products
1005
(1919-1923)
Monuments and grave markers, etc.Concrete products (except monuments -
.
1007, 1012, 1639
(1931-1933)
Emery wheels and other abrasive appliances;hones, whetstones, etc., and sandpaper, emerypaper -
- •25
1008
(1919-1923)
Glass containers:Fruit jars (homepack)Beverage containers, pressure wareMilk bottlesGlass containers (excl. above)
(1925)
Beverage containers, pressure ware and glasscontainers excl. fruit jars and milk bottles:Beverage containers, pressure wareGlass containers -
(1933)
Fruit jars (homepack) and pressed packers' ware:Fruit jars (homepack)Pressed packers' ware
32.315.2
52.6
5.4
2.592.1
7.4
1.73.1
24.8
82.55.5
25.0
68.715.415.9
84.915.1
52.247.8
78.42.5
19.1
90.5
1.9
.5
7.1
39.97.4
58.7
48.1
6.5
43.5
1.4
.6
92.1
4.92.0
1.0
26.49.7
9.5
14.7
39.6
97.3
2.7
20.279.8
2.297.8
6.614.5
10.6
68.4
17.5
82.5
89.011.0
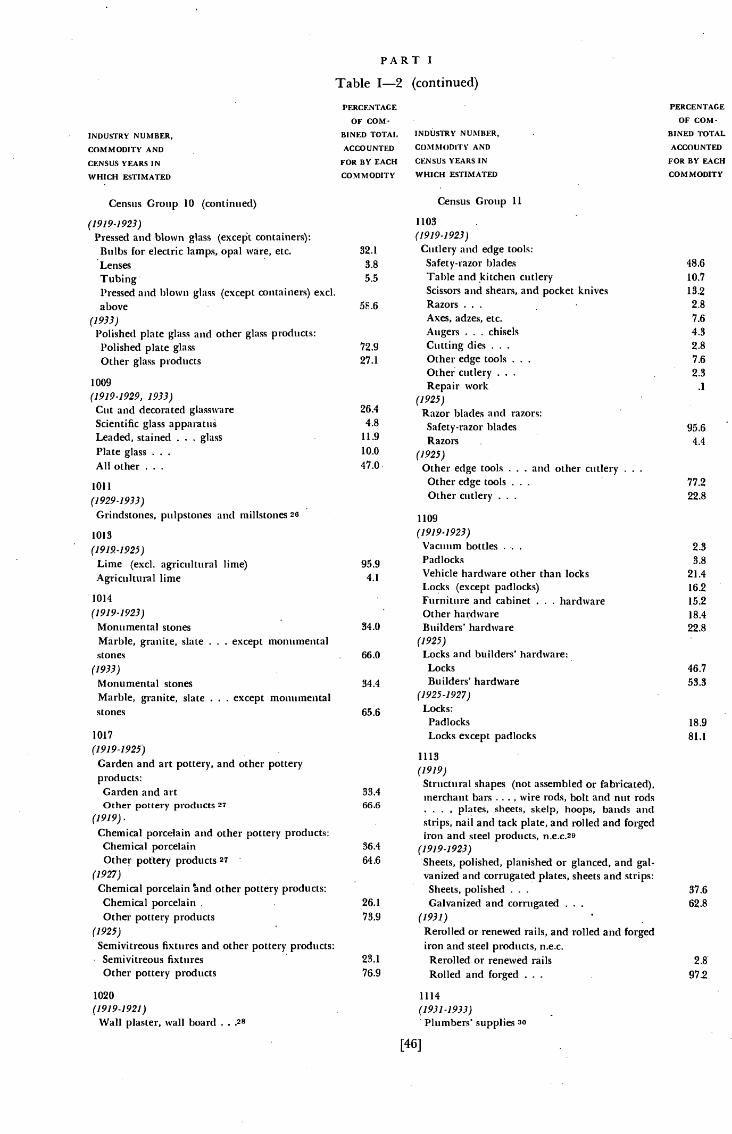
PART I
Table 1—2 (continued)
INDUSTRY NUMBER,
COMMODITY AND
CENSUS YEARS IN
WHICH ESTIMATED
I'ERCEN TACE
OF COM-
BIN ED TOTAL
ACCOUNTED
FOR BY EACH
COMMODITY
INDUSTRY NUMBER,
COMMODITY AND
CENSUS YEARS IN
WHICH ESTIMATED
PERCENTAGE
OF COM-
BINED TOTAL
ACCOU NTED
FOR BY EACH
COMMODITY
(1919-1923)Pressed and blown glass (except containers):Bulbs for electric lamps, opal ware, etc.'LensesTubingPressed and blown glass (except containers) cxci.above
(1933)Polished plate glass and other glass products:Polished plate glassOther glass products
1009(1919-1929, 1933)
Cut and decorated glasswareScientific glass apparatusLeaded, stained . . . glass
Plate glassAll other
1011
(1929-1933)
Grindstones, pulpstones and millstones 26
1013
(1919-1925)
Lime (excl. agricultural lime)Agricultural lime
1014
95.94.1
(1919-1923)
Monumental stones 34.0
Marble, granite, slate . . - except monumentalstones
(1933)
Monumental stonesMarble, granite, slate . . . except monumentalstones 65.6
1017
(1919-1925)
Garden and art pottery, and other potteryproducts:Garden and artOther pottery products 27
(1919).Chemical porcelain and other pottery products:Chemical porcelainOther pot'tery products 27
(1927)
Chemical porcelain other pottery products:Chemical porcelainOther pottery products
(1925)
Semivitreous fixtures and other pottery products:Semivitreous fixturesOther pottery products
1020(1919.1921)Wall plaster, wall board •28
Census Group 11
(1919.1923)Cutlery and edge tools:Safety-razor bladesTable and kitchen cutleryScissors and shears, and pocket knivesRazors . .
Axes, adzes, etc.Augers . . . chiselsCutting diesOther edge toolsOther cutleryRepair work
(1925)Razor blades aiid razors:Safety-razor bladesRazors
(1925)Other edge tools . . . andOther edge toolsOther cutlery
1109(1919.1923)Vacuum bottlesPadlocksVehicle hardware other than locksLocks (except padlocks)Furniture and cabinet . . . hardwareOther hardwareBuilders' hardware
(1925)Locks and builders' hardware:LocksBuilders' hardware
(1925-1927)Locks:PadlocksLocks except padlocks
1113
(1919)Structural shapes (not assembled or fabricated),merchant bars . . . , wire rods, bolt and nut rods• . . , plates, sheets, skelp, hoops, bands andstrips, nail and tack plate, and rolled and forgediron and steel products,
(1919.1923)Sheets, polished, planished or glanced, and gal.vanized and corrugated plates, sheets and strips:Sheets, polishedGalvanized and corrugated
(1931)Rerolled or renewed rails, and rolled and forgediron and steel products, n.e.c.Rerolled or renewed railsRolled and forged
1114(1931-1933)Plumbers' supplies 30
Census Group 10 (continued)
1103
32.1
3.8
5.5
72.927.1
26.44.8
11.9
10.0
47.0. other cutlery
66.0
34.4
48.6
10.7
13.2
2.87.64.3
2.87.6
2.3.1
95.64.4
77.222.8
2.33.8
21.416.2
15.218.4
22.8
46.753.3
18.9
81.1
37.6
62.8
2.8'
97.2
33.466.6
36.4
64.6
26.1
73.9
23.176.9
[46]

CLASSIFICATION OF MANUFACTURED COMMODITIES
Table 1—2 (continued)
INDUSTRY NUMBER,
COMMOI)ITY AND
CENSUS YEARS IN
WHICH ESTIMATED
I'F.RCEN'rACE
OF COM-
BINED TOTAl.
ACCOUNTED
FOR BY EACH
COMMODITY
INDUSTRY NUMBER,
COMMODITY ANI)
CENSUS YEARS IN
WHICH ESTIMATED
I'ERCENTACE
OF COM-
BINED TOTAL
ACCOUNTED
FOR BY EACH
COMMODITY
Census Group 11 (continued)
1119, 1121
(1919-1923)
Steam fittings - heating ap-paratus . . . stoves and ranges:Portable ovensSteam tablesSteam and hot-water heating apparatusWarm-air furnacesStoves, ranges, water heatersFuel-oil burnersOther heating and cookingFittings, valves, and specialtiesParts
(1925)Portable ovens, steam tables, other heatingand cooking . . , and products notbelonging to the industry:Portable ovensSteam tablesOther heating and cookingNot belonging to the industry
(1925)l'arts for steam and hot-water heating boilers andradiators, and steam fittings 31
(1929-1933)Other heating and cooking apparatus 32
(1931 -1933)
Fittings, valves and specialties
1123(19 19-1923)Ice-cream cans and milk cansHole top, sanitary and general line cansOther tinware
1125(1919-1925)All tools 84
(All years)Farm tools 35
1126, 1127
(1919-1921)
Wire and wire products:.SOAutomobile skid chainsBarbed wire. . . poultry netting -Nails, brads, spikesIron and steel wire products excl. aboveNonferrous wire products
(1923.1927)Automobile skid chains, and iron and steelwire products exci. barbed wire . -
poultry netting . - - and nails . . -
Automobile skid chainsIron and steel wire products cxci. barbedwire . . . poultry netting - . . and nails . -
Census Group 12
1201
(1919-1923)
Aluminum manufactures:
Ware - -
Motor-vehicle accessories and partsCoatingsOther aluminum manufactures
1202, 1221, 1222, 1223
(1919-1921)
ClocksInstruments and devices . . -
Jeweled and nonjeweled watches
Clock movements for use in timepieces
Clock movements for use in recording instruments
Clock materials - . -
Watchcases
jeweled movements . . -
Custom work and repairing 1.0
(1923-1 927)
Instruments and devices . - - , and clock move-ments for use in recording instruments, etc:Instruments and devices -
Movements
1203, 1220
(1919-1923)
Collapsible tubes, and tin and other foils:
Collapsible tubesTin and other foils
1207
(1919-1927)Portable lamps, candelabra -
Kerosene - - - equipmentIncandescent mantlesResidential and nonresidential except portablelamps .Street and highway fixturesGas fixtures - . -
Notreported by kindMisc, equipmentCarbide lamps, reflectors - . . 6.9
1210(1919-1925)JewelryJewelry findings
1219
(1919-1927)Stamped household ware - . -
Enameled ware, vitreous
Stamped automotive parts - - -
Other stamped ware
Perforated metals6.1 Bottle caps
Custom work 5.2
1301
Census Group 13
(All years)Agricultural implements and parts 37
[47]
22.7
6.6
20.8
49-9
29.4
3.2
39.9
.9
.8
1.6
20.63.6
-4
.2
23.9
9.8
'34.6
1.5
2.7
20.3
6.6
5-4
3.6
393
51.5
1.8
94.93.3
2.7
25.624.8
40.86.1
81.0
19.0
27.5
723
14.2
3.7
1.1
81.54.8
23
3.2
31.1
90.2
9.8
14.7
15.5
25.3
24.8
1.9
12.6
93.9

PART I
Table 1—2 (continued)
INDUSTRY NUMBER,
COMMODITY AND
CENSUS YEARS IN
WHICH ESTIMATED
PERCENTAGE
OF COM-
BIN ED TOTAl.
ACCOUNTED
FOR BY EACH
COMMODITY
INDUSTRY NIIMBF.R,
COMMODITY AND,
CENSUS YEARS IN
WHICH ESTIMATED
PERCENTAGE
OF COM-
BINED TOTAL
ACCOUNTED
FOR BY EACH
COMMODITY
1302
Census Group 13 (continued)
(1919-1925)Cash registers, and adding, calculatingand card-tabulating machinesParts and attachments
1303(1919)
Electric fans and electric exhaust fans:Electric fansExhaust fans
(1919)Measuring instruments and meters:Laboratory testing and scientific instrumentsInstruments and meters except lal)oratory -
(1919-1925)
Insulated wire and cable:Rubber-insulated - - and paper-atid cotton-insulatedVarnished cambric, magnet -
(411 years)Other electrical machinery,apparatus and supplies 38
(1931)Electric locomotives 38
(1929-1933)Wet primary batteries, and partsand supplies therefor:BatteriesParts and supplies
(1919-1923)Disc stoves, hot plates, and ranges of all sizes:21/2 kw. and overAll other
(1919)Electrical household heating and cookingappliances md. water heaters:Water heatersAll other
(1919)Radio apparatus:Radio tubesAll other
(1933)Other electrical machinery . . . and misc. radio parts:Misc. radio partsOther electrical machinery -
1304
(1919)Internal-combustion engines except electric-ignition type, motor-vehicle:Diesel - - - other than marineDiesel . - - marineElectric-ignition type, other than motor-vehicle
(1921-1923)Total Diesel:Diesel . - . other than marineDiesel - . - marine
(1929)Steam engines (reciprocating):Marine typeOther
(1929)Steam turbines:
Marine typeOther
1305
(All years)Foundry and machine-shop products 39
1306
(1919-1923)Gas machines - - - and parts:Gas machines, meters . - -
Parts and accessories(1933)Gas machines - - - and parts:Gas machines, meters . -
Parts and accessories
1307
(1919-1921)Machine tools and parts 40
1309
(1919-1921)Total pumps and parts (exci. repair work):Pumps and parts, other than used on farmsPumps and parts used on farms
(1919-1921)Pumps and parts other than used on farms:Pumps . . -
Parts and attachments(1919-1921)
Farm pumps . - and parts . -
Farm pumps -Parts and accessories
(1923-1931)Farm pumps . . - and parts •41
(1933)Total pumps and pumping equipment:Other than farmFarm
(1933)Total parts:Other than farmFarm
1310
(1919-1925)
15.7 Domestic refrigerators
7,3 All other refrigerators, etc.
77.0 (1919-1927)Refrigerators, etc. excl. domestic:Absorption-type systems . . -
Commercial - -
[48]
Compressors and evaporators
93.07.0
84.215.8
8,3
91.7
81.818.2
84.8
65.2
85.8
14.2
1.0
99.0
10.389.7
19.6
80.4
23.676.4
20.1
79.9
91J8.9
77.3
22.7
76.3
23.7
91.3
8.7
92.47.6
84.0
16.0
77.9
22.1
88.411.6
36.636.926.5
68.381.7
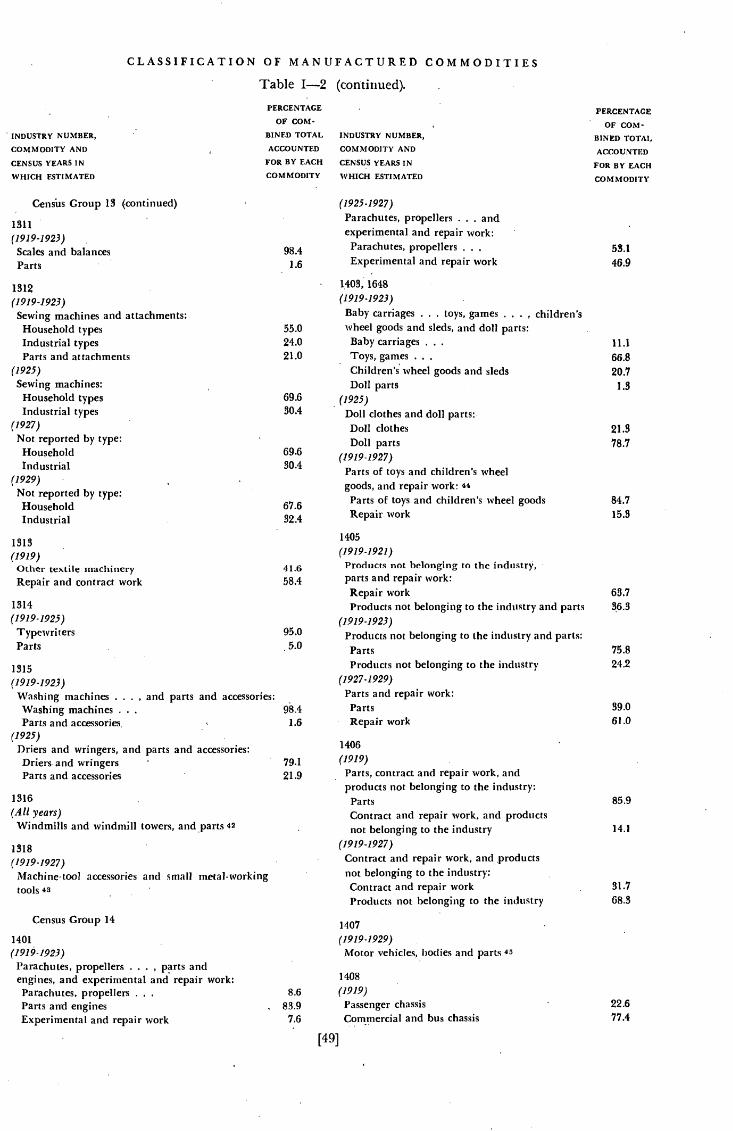
CLASSIFICATION OF MANUFACTURED COMMODITIES
Table 1—2 (continued).
PERCENTAGE PERCENTAGEOF COM- OF COM-
INDUSTRY NUMBER, BINED TOTAL INDUSTRY NUMBER, BINED TOTALCOMMODITY AND ACCOUNTED COMMODITY AND ACCOUNTEDCENSUS YEARS IN FOR BY EACH CENSUS YEARS IN FOR BY EACHWHICH ESTIMATED COMMODITY WHICH ESTIMATED COMMODITY
Census Group 13 (continued) (1925-1927)Parachutes, propellers . . and
1311
(1919-1923)experimental and repair work:
Parachutes, propellers . . . 53.1Scales and balances 98.4
Parts 1.6 Experimental and repair work 46.9
1312 1403,1648
(1919-1923) (1919-1923)
Sewing machines and attachments: Baby carriages . . toys, games . . . , children'sHousehold types 55.0 wheel goods and sleds, and doll parts:Industrial types 24.0 Baby carriages . . . 11.1
Parts and attachments 21.0 Toys, games . . . 66.8(1925) Children's wheel goods and sleds 20.7Sewing machines: Doll parts 1.3Household types 69.6 (1925)Industrial types 30.4 Doll clothes and doll parts:
(1927) Doll clothes 21.3Not reported by type: Doll parts 78.7Household 69.6 (1919-1927)Industrial 30.4 Parts of toys and children's wheel
(1929)Not reported by type:
goods, and repair work: 44Parts of toys and children's wheel goods 84.7
Household 67.6
Industrial 32.4 Repair work 15.3
14051313
(1919)(1919-1921)
Other textile machinery Products not belonging to the industry,
Repair and contract work 58.4 parts and repair work:Repair work 63.7
1314 Products not belonging to the industry and parts 36.3(1919-1925) (1919-1923)
Typewriters 95.0 Products not belonging to the industry and parts:Parts 5.0 Parts 75.8
1315 Products not belonging to the industry 24.2
(1919-1923) (1927-1929)
Washing machines . . . , and parts and accessories: Parts and repair work:Washing machines . . . 98.4 Parts 39.0
Parts and accessories. 1.6 Repair work 61.0
(1925)Driers and wringers, and parts and accessories: 1406
Driers, and wringers 79.1 (1919)
Parts and accessories 21.9 Parts, contract and repair work, andproducts not belonging to the industry:
Parts 85.9(All years) Contract and repair work, and products
Windmills and windmill towers, and parts 42 not belonging to the industry 14.1
1318 (1919-1927)
(1919-1 927) Contract and repair work, and products
Machine-tool accessories and small metal-working not belonging to the industry:
tools 430 Contract and repair work 31.7
Products not belonging to the industry 68.3
Census Group 14 1407
1401 (1919-1929)(19191923) Motor vehicles, bodies and parts 45Parachutes, propellers . . . , parts andengines, and experimental and repair work: 1408
Parachutes, propellers . . . 8.6 (1919)
Parts and engines - 83.9 Passenger chassis 22.6
Experimental and repair work 7.6 and bus chassis 77.4
[49]

PART I
.Table (continued)
INDUSTRY NUMBER,
COMMODITY AND
CENSUS YEARS IN
WHICH ESTIMATED
PERCENTAGE
OF COM-
BINED TOTAL
ACCOUNTED
FOR BY EACH
COMMODITY
INDUSTRY NUMBER,
COMMODITY AND
CENSUS YEARS IN
WHICH ESTIMATED
PERCENTAGE
OF COM-
BINED TOTAL
ACCOUNTED
FOR BY EACH
COMMODITY
1409
Census Group 14 (continued)
(1919-1921)Side cars and parts:Side carsParts
(1931)Motorcycles, side cars, andMotorcycles and side cars -
Parts
1410(All years)
Pleasure-craft and commercial craft 48
1604
Census Group 16
(1919.1925)Household . . . broomsIndustrial, street . . . brooms
(1927)•oy and industrial brooms:ToyIndustrial
1605
(1919-1925)Tooth, toilet and household brushesPaint and varnish . . brushesIndustrial brushes
(1919-1925)Tooth, toilet and household:Tooth and toiletHOusehold
(All years)Not reported by kind 47
1610(All years)Dairymen's supplies: creamery . . . equipment;and poultrymen's and apiarists' supplies 48
1611
(1919-1925)Dental goods and equipmentDental laboratory work
1612, 1621(1931-1933)Fancy and misc. articles, andivory, shell and bone work:Fancy and misc. articlesIvory, shell and bone work
(1919.1927, 1931-1933)Fancy and misc, articles:Greeting cards and paper noveltiesLampshadesCigar lighters
[50]
1615
(1919-1923)CoatsNeckpiecesRobes
Other fur goodsTrimmingsContract workCustom work and repairing
Fpr fur goods, and trimmings:RobesOther furTrimmings
1620(1927-1933)Instruments, professional and scientific
1627, 1628, 1629, 1630
(1919-1921)
?iano and organ parts and materials(except perforated music rolls), andproducts not to the industries:Parts and materialsProducts not belonging to the industries
1631
(1919-1925)Ophthalmic products
Optical instruments and partsOther optical goods
(1933)Ophthalmic productsOptical instruments and partsOther optical goods
1636(1919-1929, 1933)Photographic apparatus and materials:Camera and photographic apparatus
misc, equipmentFilms, slides -
(1919.1927, 1931-1 933)Cameras and photographic apparatus . . -
and -misc, equipment:and photographic apparatus
Misc. equipment
1645
(1919.1927)Ligatures . , and other surgical
anø orthopedic appliances:
Ligatures -
Other app] iances
Footnotes to Table
I. Data on coffee and spices were not reported in the Census in1925 and 1933. Estimates for these years are based on import
data.
Rhinestone ornamentsAll other articles
(1933)Motorcycles, side cars, bicycles, and parts:
Motorcycles, side cars and bicyclesParts
20.379.7
75.0'25.Q
68.831.2
93.66.4
6.293.8
40.241.7
18.1
58.641.4
72.9
27.1
98.6
1.4
10.1
12.55.1
• 2.370.0
79.3
4.2.1
1.5
1.8
.1
3.0
.8
6.5
92.7
79.520.5
78.917.3
3.8
70.3
26.3
3.4
21.578.7
77.1
22.9
67.432.6
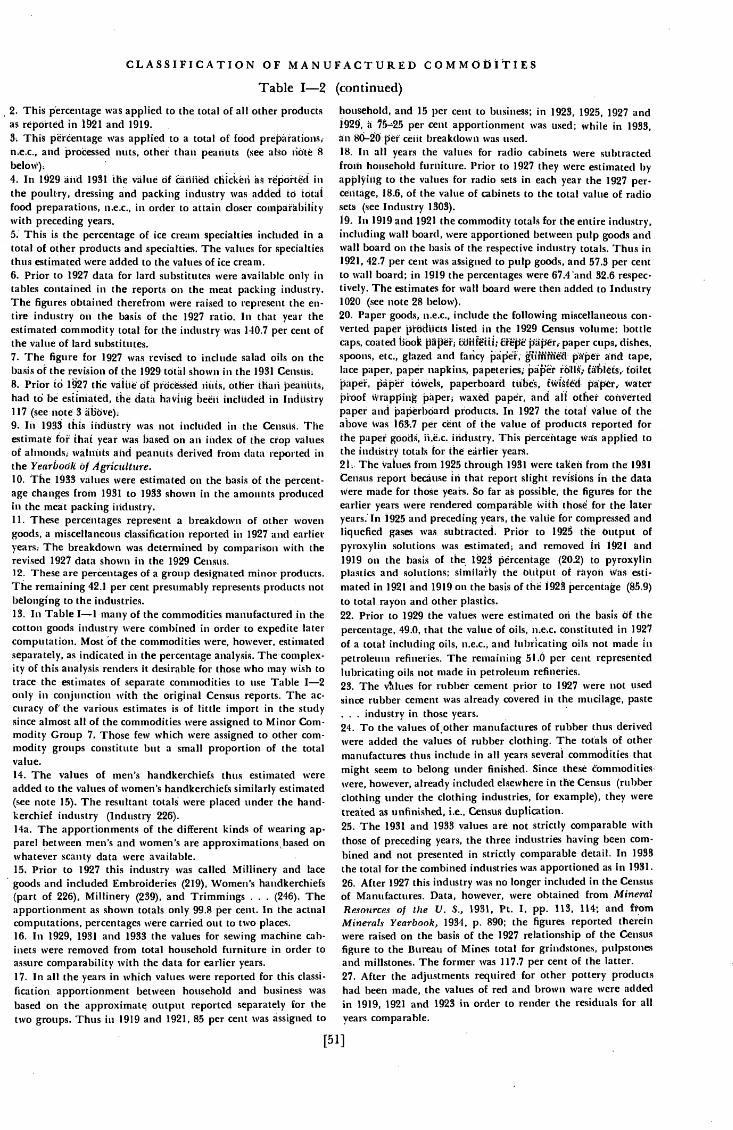
CLASSIFICATION OF MANUFACTURED COMMODITIES
Table [—2 (continued)
2. This percentage was applied to the total of all other productsas reported in and 1919.3. This percentage was applied to a total of foodn.e.c., and processed nuts, other than peanuts (see also iiOte 8below).4. In 1929 and 1931 the value Of chickéti as inthe poultry, dressing and packing industry was added to totalfood preparations, n.e.c., in order to attain closerwith preceding years.5. This is the percentage of ice cream specialties included in atotal of other products and specialties. The values for specialtiesthus estimated were added to the values of ice cream.6. Prior to 1927 data for lard substitutes were available only intables contained in the reports on the meat packing industry.The figures obtained therefrom were raised to represent the en-tire industry on the basis of the 1927 ratio. Iii that year theestimated commodity total for the industry was 140.7 per cent ofthe value of lard substitutes.7. The figure for 1927 was revised to include salad oils on thebasis of the revision of the 1929 tOtal shown in the 19318. Prior Ld 1927 the Of prOcessed other thail peaithts,had tá be esiimated, the data haviiig been included in Indtistry117 (see irnte39. In 1933 this industry was not included in the Census. Theestimate fot year was based on an index of the crop valuesof almonds; walnuts and peanuts derived from data reported inthe YearboOk Of AgricuUure.10. The 1933 values were estimated on the basis of the percent-age changes from 1931 to 1933 shown in the amounts producedin the meat packing industry.11. These percentages represent a breakdown of other wovengoods, a miscellaneous classification reported in 1927 and earlier
The breakdown was determined by comparison with therevised 1927 data shown in the 1929 Census.12. These are percentages of a group designated minor products.The remaining 42.1 per cent presumably represents products notbelonging to the industries.13. In Table I—I many of the commodities manufactured in thecotton goods industry were combined in order to expedite latercomputation. Most 'of the commodities were, however, estimatedseparately, as indicated in the percentage analysis. The complex-ity of this analysis renders it desirable for those who may wish totrace the estimates of separate commodities to use Table 1—2only in conjunction with the original Census reports. The ac-curacy of' the various estimates is of little import in the studysince almost all of the commodities were assigned to Minor Com-modity Group 7. Those few which were assigned to other com-modity groups constitute but a small proportion of the totalvalue.14. The values of men's handkerchiefs thus estimated wereadded to the values of women's handkerchiefs similarly estimated(see note 15). The resultant totals were placed under the hand-kerchief industry (Industry 226).l4a. The apportionments of the different kinds of wearing ap-parel hetween men's and women's are approximations,based onwhatever scanty data were available.15. Prior to 1927 this industry was called Millinery and lacegoods and included Embroideries (219), Women's handkerchiefs(part of 226), Millinery (239), and Trimmings . . . (246). Theapportionment as shown totals only 99.8 per cent. In the actualcomputations, percentages were carried out to two places.16. In 1929, 1931 and 1933 the values for sewing machine cab-inets were removed from total household furniture in order toassure comparability with the data for earlier years.17. In all the years in which values were reported for this classi-fication apportionment between household and business wasbased on the approximate output reported separately for thetwo groups. Thus in 1919 and 1921, 85 per cent was assigned to
household, and 15 per cent to business; in 1923, 1925, 1927 and192*, a per cent apportionment was used; while in 1933,an cent breakdown was used.18. In all years the values for radio cabinets were subtractedfrom household furniture. Prior to 1927 they were estimated byapplying to the values for radio sets in each year the 1927 per.centage, 18.6, of the value of cabinets to the total value of radiosets (see Industry 1303).19. In 1919 and 1921 the commodity totals for the entire industry.including wall board, were apportioned between pulp goods andwall board on the basis of the respective industry totals. Thus in1921, 42.7 per cent was assigned to pulp goods, and 57.3 per centto board; in 1919 the percentages were 67.4'and 32.6 respec-tively. The estimates for wall board were then added to Industry1020 (see note 28 below).20. Paper goods, n.e.c., include the following miscellaneous con-verted papet- pioduets listed in the 1929 Census volume: bottlecaps, coated hOok paper cups, dishes,spoons, etc., glazed and fancy arid tape,lace paper, paper napkins, papeteries, rölh, toilet
'paper tOwels, paperboard fi'/ilfed waterWrap'ping 'paper; waxed and all other converted
paper and paperboard products. In 1927 the total' value of theabove was per cent of the value of products reported forthe paper gOodi, industry. This perceiitage was applied tothe indtistry totals the earlier years.21.. The vahies from 1925 through 1931 were taken from the 1931Census report because in that report slight reviSiöhs in the datawere made for those years. So far as possible, the figures for theearlier years were rendered comparable with those for the lateryears: In 1925 and preceding years, the valtie for compressed andliquefied gases was subtracted. PriOr to 1925 the output ofpyroxylin solutions was estimated; and removed lii 1921 and1919 on the basis of the 1923 'percentage (20.2) to pyroxylinplastic.s and solutions; similarly the Output of rayon was esti-mated in 1921 and 1919 on the basis of the 1923 percentage (85.9)to total rayon and other plastics.22. Prior to 1929 the values were estimated on the basis of thepercentage, 49.0, that the value of oils, constituted in 1927of a total including oils, n.e.c., and lubricating oils not made 1npetroleum refineries, The remaining 51.0 per cent representedlubricating oils not made in petroleum refineries.23. The for rubber cement prior to 1927 were not usedsince rubber cement was already covered in the mucilage, paste• - - industry in those years.24. To the values of other manufactures of rubber thus derivedwere added the values of rubber clothing. The totals of othermanufactures thus include in all years several commodities thatmight seem to belong under finished. Since thesewere, however, already included elsewhere in Census (rubberclothing under the clothing industries, for example), they weretreated as unfinished, i.e., Census duplication.25. The 1931 and 1933 values are not strictly comparable withthose of preceding years, the three industries having been com-bined and not presented in strictly comparable detail. In 1933the total for the combined industries was apportioned as in 1931.26. After 1927 this industry was no longer included in the Censusof Manufactures. Data, however, were obtained from Minei'aiResources of the U. S., 1931, Pt. 1, pp. 113, 114; and fromMinerals Yearbook, 1934, p. 890; the figures reported thereinwere raised on the basis of the 1927 relationship of the Censusfigure to the Bureau of Mines total for grindstones, pulpstonesand millstones. The former was 117.7 per cent of the latter.27. After the adjustments required for other pottery productshad been made, the values of red and brown ware were addedin 1919, 1921 and 1923 in order to render the residuals for allyears comparable.
[511
PART ITable 1—2 (continued)
28. In 1919 antI 1921 the estimated value of wall hoard had tohe added (see note 19 above).29. The values of these products were adjusted in 1919 in orderto remove estimated consumption in own works. All such adjust.ments were based on the proportions in 1921 o[ such consump-tion to total production.30. The values for 1931 and 1933 arc not comparable with thosefor preceding years, indeterminate amounts of plumbers' brassgoods being included in Industries 1119 and 1121 (see note 33below).31. In 1925, to the amount reported for parts in the 1927 Censuswas added the estimated value of parts for steam anti hot-waterheating boilers and radiators, which in 1925 had been includedwith steam fittings. The estimate was made by the use of 1927percentages. The total value of parts thus derived was thenadjusted to agree with a 1929 revision of the 1927 value of parts,the revised figure constituting 99.8 per cent of the original valuereported.32. In 1933 and 1931 the value of other heating and cookingapparatus and supplies included the following items reportedin the Census: gasoline water heaters, gasoline camp stoves, gasburners, parts for oil and gas burners, incinerators, coffee urnsand tanks (1931 only), waffle irons (1931 only), iron cookingutensils (1931 only), other cafeteria, hotel and cooking appara-tus, and heating and cooking equipment not reported by kind.In 1929, it included in addition to the item reported as otherheating and ,cooking apparatus and supplies the values of gaso-line water heaters, gasoline camp stoves, and incinerators.33. The data for 1931 1933 are not comparable with thosefor previous years, since indeterminate amounts of plumbers'supplies are included (see also note 30 above).34. Prior to 1927 the totals as reported for the industry were ad-justed in order to remove machine tool accessories, as indicatedby the percentage, 65.2, of the revised 1927 total for the industryto the unrevised.35. The data for farm tools were taken from the, special Censusreports on farm equipment in 1923, 1925, 1927 and 1931. In 1919and 1921 the values of shovels, spades, scoops and hoes as re-ported in the tool industry were assumed to represent farm tools.36. In 1921 and 1919 the values of wire products made only inthe wire industries were reported by the Census. These figures(excluding insulated wire and cable and bare wire) were raised,on the basis of the 1923 data, to cover wire products made in allindustries; in 1923 the total value was 195.9 per of theamount made in the wire industries. The commodity totals for1921 and 1919 were then apportioned as in 1923.37. Data for the agricultural implements industry for all years,except 1933 and 1919, were secured from the special Censusreports on farm equipment. For convenience the figures takenfrom those reports were divided into two groups. The contentof the first is indicated in the description of agricultural imple-ments given under Industry 1301 in Table I—I. The variousclasses of implements included represent the first seven classesof implements described in the definition of the agriculturalimplements industry given in the 1929 Census. The desired totalswere obtained simply by adding together the correspondingclasses as listed in the farm equipment reports; the values of theimplements and the values of the parts and attachments for theimplements were summated separately. The data for 1925 andearlier years are not strictly comparable with those of later yearsbecause fertilizer machinery was excluded in the earlier years.Miscellaneous agricultural implements include all other typesof farm equipment that can be presumed to be produced pri-marily by the agricultural implements industry. In 1931 and1929 the following items were selected from the farm equipmentreport: all barn and barnyard equipment, corncribs, grain bins,eveners, singletrees, doubletrees and neck yokes, farm gates,scythes, scythe snaths, lightning rods, silos, stump pullers andmiscellaneous items. miscellaneous parts, attachments and
parts for barn and barnyard equipment and the value of attach-ments and parts given at the end of the Census table dealingwith miscellaneous farm equipment were utilized. The latterfigure includes an indeterminate amount of attachments andparts not belonging to the agricultural implements industry.For 1927 the same procedure was followed for miscellaneous im-plements and parts as for 1929. For 1925 a similar procedure wasalso followed, although several other reported items were in-cluded: cane mills, cider mills, scrapers, stalk cuffers, varioustypes of fertilizing machinery, etc. A similar method was adoptedfor 1923 except that it was possil)le to suhtract certain undesireditems included in miscellaneous parts and attachments. For 1921a similar method was followed, except that the value of forks,hoes and rakes was removed from the value of all other products.Attachments and repair parts could not be broken down andwere thus treated as a single total. Finally, for 1919 the totalvalue of the agricultural implements industry corrected for oand s, as reported in the 1919 Census volume, was divided accord-ing to the 1921 proportions—68.4 per cent to implements and31.6 per cent to parts.For 1933 the value of agricultural implements and other prod-ucts not reported separately was apportioned between otherproducts and custom and repair work, 8.8 per cent, and agri-cultural implements, 91.2 per cent.The amount estimated as agricultural implements was then ap-portioned between implements, 59.7 per cent, and parts, 40.3per cent, as indicated by the commodity table.The 1933 data are probably not strictly comparable with thosefor earlier years since the coverage of certain miscellaneous im-plements is uncertain.38. For 1929 the revised figure as shown in the 1931 Census wasused except that the value of relays presented separately in thatreport was re-added. For both 1929 and 1931 the value of poleline hardware was added in order to render the data comparablewith those for earlier years. In 1931 it was necessary to sub-tract an estimated value for electric locomotives. The estimatewas made on the basis of the percentage in 1927, 7.3, that thevalue of electric locomotives was of the total of other electricalmachinery (as calculated) and electric locomotives. For 1921 and1919 the desired values were obtained by totaling all the elec-
machinery items specilIcally classified and presented in ourvarious subgroups, and subtracting this total from the grandtotal for the industry as reported in the Census.The values for the earlier years are not strictly comparable withthose for the later years because of the inclusion of small butindeterminate amounts belonging to items specifically classifiedin later years.39. The values for various types of machinery presented underthis industry were obtained from the special Census reports onthe production of machinery by principal classes. In Ihe earlieryears certain types were not reported separately and could notbe satisfactorily estimated; the missing data presumably are allincluded under machinery not reported by specified class. This,of course, affects the comparability of values by distinct types ofmachinery but not of the totals.Before determining the values for any of the constituent itemsof the industry, it was necessary to adjust the industry totals for1927 and all prior years. First, in accordance with the 1927 re-vision designed to eliminate the value of machine-tool accessories(which were 1.0 per cent of the inclusive total value of productsfor that year) the industry totals for all earlier years were re-duced. Then on the basis of the net correction for o and s in1929, plus 6.4 per cent, all years prior to 1929 were raised. Thesechanges rendered the resultant commodity totals relatively com-parable, and in 1927 and 1925 they were apportioned on thebasis of the Census division of the unadjusted figures. Prior to1925 the 1925 percentages were utilized. The percentage appor-tionments [or 1927 and 1925 follow:
[52]
CLASSIFICATION OF MANUFACTURED COMMODITIES
Table 1—2 (continued)
Boiler-shop productsCastingsAll machinery (specified
and not specified)Parts and miscellaneousContract and repair work
To obtain the values for 'not reported by specified class' the re-spective totals of specified machinery were subtracted from thetotals of all machinery as estimated above. The resultant figuresare not comparable from year to year because of less detailedreporting by type in the earlier years.The values derived for parts and miscellaneous for 1925 andearlier years were apportioned as in 192'7: 95.7 per cent to mis-cellaneous, and 4.3 per cent to parts.The values for miscellaneous were then made comparable by theremoval of industrial furnaces in 1929 per cent of total mis-cellaneous including furnaces as in 1931), and of industrial fur-iiaces and oil burners prior to 1929 (1.4 per cent of the inclusivetotal of miscellaneous in 1929).40. For 1919 and 1921 the values for machine tools and partswere estimated on the basis of the percentages for 1923, 67.9 and19.2, respectively, that the revised 1923 figures were of the nfl-revised 1923 total as shown in the 1923 Census.41. From 1923 to 1931 the values for farm pumps and pumpingequipment, and for parts and accessories thereof, were takenfrom the special Census reports on farm equipment.42. From 1921 through 1931 the desired values were obtainedfrom the special Census reports on farm equipment. For 1921 itwas necessary to estimate the value of parts. This was done onthe basis of the percentage, 6.2, the value of parts to that ofwindmills and windmill towers in 1923. For 1919 the values forboth windmills and parts were estimated on the basis of thepercentage that each constituted in 1921 of the unadjusted in-dustry total: 60.5 and 3.8 respectively.The data for 1933 are not strictly comparable with those forpreceding years, having been secured from the engines, turbines,
industry. (Industry 1304)43. The data For the years prior to 1929 are not comparable withthose for 1929, 1931 and 1933. They are estimates of the amountsof the tools, not including edge tools . . - and the foundry andmachine.shop products, n.e.c., industries which belonged to themachine-tool accessories industry as defined in 1929. The esti-mates are based on comparisons of the original with the revisedfigures for the tool and for the foundry-shop products industry.in 1927. In the tool industry the revised figure was 65.2 per centof the original; in the foundry-shop products industry the re-vised total was 99.0 per cent of the original. Thus in all yearsprior to 1929, 34.8 per cent of the tool industry and 1.0 per centof the foundry products industry were considered to belong tothe machine-tool accessories industry. Additional indeterminateamounts of machine-tool accessories are included, before 1929,in the machine-tool industry.
44. Prior to 1925 the totals for parts and repair work were esti-mated on the basis of the percentage, 1.5, of the 1925 figure tothe industry total in that year.45. Prior to 1931 the Census reported bodies and parts made inother industries (excluding the motor-vehicle industry). On thebasis of 1931 figures, special adjustments were made in order toinclude bodies and parts manufactured in the motor:vehicleindustry. First the difference between the revised and the un-revised s for 1931 was obtained. This difference was expressed asa percentage of o (excluding trailers) of the motor-vehicle in-dustry. The percentage derived, 45, was then applied to the valueof o in all preceding years, the estimates of repair work havingfirst been subtracted from o as reported by the Census. Theresultant figures were added to the commodity totals for thebodies and parts industry. Despite these adjustments, however,it is possible that the commodity totals, especially for the earlieiyears, are still under-estimates since it is believed that largerproportions of bodies and parts were included in the motor-vehicle industry during the earlier years. Thus, the use of 1931percentages probably results in minimum estimates for theseyears.46. The values of pleasure-craft for 1923 through 1933 were esti-mated by adding to 20.0 per cent of ihe value of vessels of 5 grosstons and over the value of all vessels under 5 tons, except life.boats. The 20.0 per cent estimate was obtained from a specialunpublished tabulation of Census schedules. The marked in-crease in ship building in 1921 and 1919, however, rendered thepercentage of dubious validity in those years. In its place anindex of vessels built under 5 tons, was applied to the 1923estimate of pleasure-craft of 5 gross tons and over.The values for lifeboats in years prior to 1927 were estimated onthe basis of the percentage, 1.9, that they were of the value ofall vessels under 5 tons in 1927.The values of commercial craft were derived by subtraction ofthe final pleasure-craft estimates from the values of all shipsand boats.47. The values for brushes not reported by kind were dividedproportionately in each year among the several types.48. The data for dairy, cheese-factory and butter-factory ma-chinery were taken from the Census tabulations of machinery byspecified classes. In 1919 the figure given was apportioned as in1921 between miscellaneous dairy . . - machinery (48.6 per cent)and milking machines and cream separators (51.4 per cent).The data on equipment and supplies include all the commodi-ties produced in the industry except the machinery listed sepa.rately. The figure for 1931 represents a total of such items aswere discovered elsewhere in the Census, notably in the specialreport on farm equipment. For 1933, only the value of broodersand incubators as derived from Industry 1119 could thus befound. The values of the other commodities could not be traced.49. From 1927 through 1933 the data on nautical and surveyinginstruments were removed from the Census totals as reportedand placed in Industry 1631 in order to render the total com-parable with those of preceding years.
1927 19255.1 4.8
17.9 19.0
39.7 39.430.4 31.2
7.0 5.6
[53]

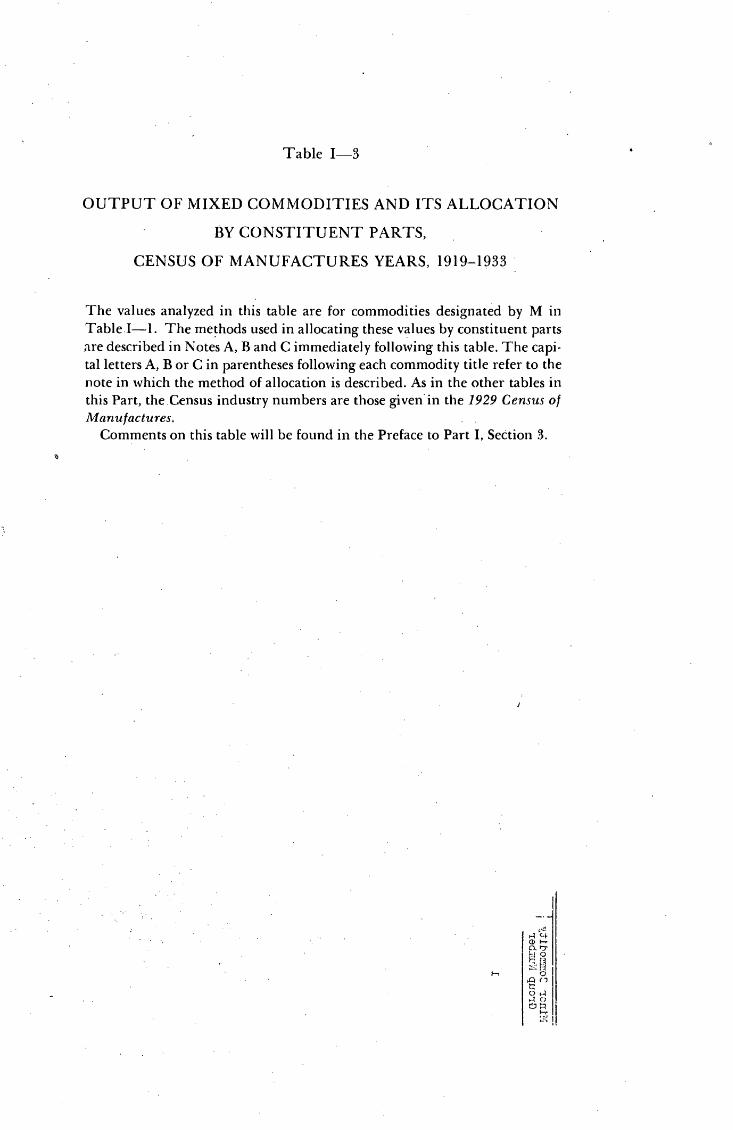
Table I—3
OUTPUT OF MIXED COMMODITIES AND ITS ALLOCATION
BY CONSTITUENT PARTS,
CENSUS OF MANUFACTURES YEARS, 1919-1933
The values analyzed in this table are for commodities designated by M inTable I—i. The methods used in allocating these values by constituent partsare described in Notes A, B and C immediately following this table. The capi-tal letters A, B or C in parentheses following each commodity title refer to thenote in which the method of allocation is described. As in the other tables inthis Part, the Census industry numbers are those given in the 1929 Census ofManufactures.
Comments on this table will be found in the Preface to Part I, Section 3.
CDI-
H 01
0C)

Tab
le 1
-3
OU
TPU
T O
F M
IXE
D C
OM
MO
DIT
IES
AN
D I
TS
AL
LO
CA
TIO
N B
Y C
ON
STIT
UE
NT
PA
RT
S
(tho
usan
ds o
f do
llars
)
Min
or C
omm
odity
Gro
up N
umbe
r.In
dust
ry N
umbe
ran
d C
omm
odity
1919
1921
1923
1925
1927
1929
1931
1933
Cen
sus
Gro
up1
(11
1 1 1 1 1 1 1 1 1 1
103
Cre
amer
y bu
tter
(A)
•T
otal
Unf
inis
hed
Fini
shed
107
Che
ese
(B)
Tot
alUnfinished
Finished
110 Spices, ground (C)
Total
Unfinished
Finished
111 Condensed and evaporated milk
and
•
buttermilk (A)
Total
V
Unf
inis
hed
Finished
Powdered whole milk, cream, skim
milk and dried and powdered
buttermilk (A)
Total
V
Unf
inis
hed
Finished
113 Corn syrup1 corn sugar, corn oil
and starch (B)
•Total
Unfinished
Finished
V
115Flavoring extracts and flavoring
•syrups (A)
Tot
alUnfinished
Finished
116
Flou
r:wheat, rye, buckwheat, and
corn (except prepared flour) (A)
Tot
alUnfinished
V
Fini
shed
117 Foodpreparatlons, n•e.c.
(B)
Total
V
V
Unf
inis
hed
V
Fini
shed
119 Ice, manufactured (C)
•Total
Unfinished
V
Fini
shed
532,
263
23,0
1550
9,24
8
137,
281
11,1
2012
6,16
1
22,3
989,
308
13,0
90
298,
659
25,2
8127
3,37
8
12,1
829,034
3,14
8
156,
549
65,3
2591
,224
90,0
0129
,776
60,2
25
1,52
6,50
3301,746
1,224,757
169
,4-5
619
,826
149,
630
138,
795
61,9
0376
,892
441,
803
19,5
0242
2,30
1
77,9
396,
313
71,6
26
16,5
776,
889
9,68
8
159,
700
22,1
4213
7,55
8
8,16
47,
808
356
68,0
4047
,913
20,1
27
90,2
3742
,481
47,7
76
906,
717
252,
798
653,
919
108,
534
12, 6
9895
,836
161,
865
72,192
89,6
73
585,
058
19,9
81565,077
124,534
10,0
8711
4,44
7
21,3
998,
931
12,468
165,
125
23,8
2014
1,30
5
12,5
287,
772
4,75
6
96,8
7053
,362
43,5
08
86,7
5940
,005
46,7
54
713,
364
240,
836
472,
528
137,
150
16,047
121,
103'
164,
523
73,3
7791
,146
635,
763
22,7
7161
2,99
2
111,
761
V
9,05
310
2,70
8
21,7
7913
,150
8,629
145,304
25,9
8911
9,31
5
11,9
6.7
8,98
92,
978
112,
436
54,6
0557
,831
110,
261
39,4
0070
,861
946,
677
293,
784
652,
893
170,
513
19,9
50 V
150,
563
187,
080
83,4
3810
3,64
2
695,106
23,539
671,
567
110,
162
8,923
101,
239
19,8
0511,979
7,82
6
167,
850
27,251
140,
599
19,7
379,
141
10,596
111,
123
58,4
5552
,668
119,
116
39,4
9679
,620
844,
274
295,
824
548,
450
188,
287
22,0
3016
6,25
7
184,
400
82,2
4210
2,15
8
705,
980
24,6
4668
1,33
4
112,
724
9,13
110
3,59
3
23,6
9813
,239
10,4
59
173,
316
31,6
3914
1,67
7
24,480
10,3
9514,085
135,
216
59,225
75,9
91
143,032
33,7
79.
109,
253
783,
606
325,
399
458,
207
191,
328
22,3
8516
8,94
43
209,
008
93,2
18 790
440,644
16,871
423,
773
70,2
155,
687
64,528
1369
08,423
5,26
7
115,
873
17,0
6198,812
16,306
6,17
410
,132
87,1
4439
,029
48,1
15
136
,189
36,4
6599
,724
471,
333
207,
637
263,
696
173,
087
20,2
5115
2,83
6
189,
410
84,477
104,
933
357,
911
13,3
3334
4,57
8
58,9
474,
775
54,172
10,3
125,
997
4,31
5
107,
575
12,888
94,6
87
16,7
925,
094
11,6
98
83,4
7129
,020
54,4
51
61,8
6120
,789
41,0
72
463,
062
178,
249
284,
813
179,
180
21,5
0215
7,67
8
138,
522
61,7
8176
,741
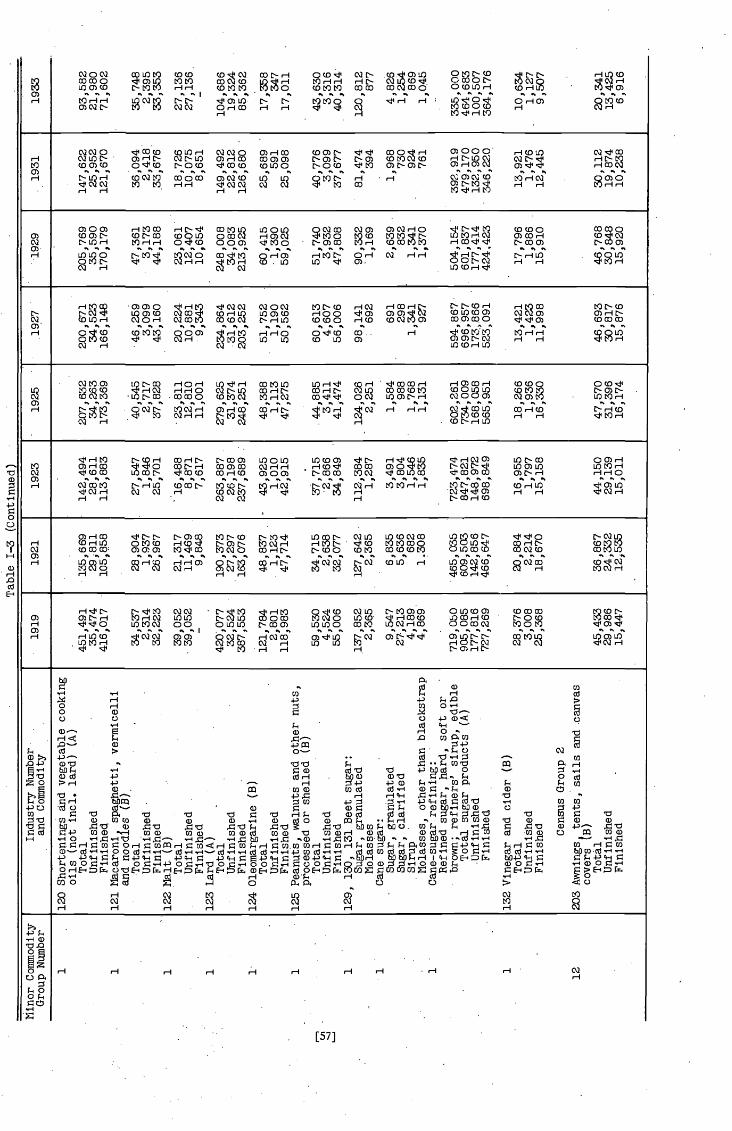
Table 1—3 (Continued)
Min
or C
omm
odity
Gro
up N
umbe
rIn
dust
ry N
umbe
r.
and
Com
mod
ity19
1919
2119
2319
25.1927
1929
1931
1933
1 1 1 1 1• 1 1 1 i 1
12
120 Shortenings and vegetable cooking
oils (not mci. lard) (A)
Total
Unf
inis
hed.
Finished
121 Macaroni, spaghetti, vermicelli
and
nood
les
(B)
Tot
alUnfinished.
Fini
shed
122
Malt. (B)
Total
Unf
inis
hed
Finished
123 Lard (A)
Total
Unf
inis
hed
Finished
-
124
Oleomargarine (B)
Total
Unfinished
Fini
shed
125
Peanuts, walnuts and other nuts,
processed or shelled (B)
Total
Unfinished
Finished
129, 130, 131 Beet sugar:
Sugar, granulated.
Molasses
Can
e su
gar:
Suga
r, g
ranu
late
dSu
gar,
clarified
•Sirup
Molasses, other than blackatrap
Cane-sugar refining:
Refined. sugar, hard, soft or
•brown; refiners' sirup, edible
Total
suga
rproducts (A)
-Unfinished
Finished.
132 Vinegar and cider (B)
Total
Unfinished
Fini
shed Census
Gro
up 2
203Awnings
tents, sails and canvas
cove
rstB)
Total
Unfinished
Finished.
451,491
35,474
416,017
34,537
2,314
32,223
39,052
39,052
420,077
32,524
387,553
121,
784
2,801
118,
983
59,530
4,524
55,006
137,
852
2,365
9,547
27,213
4,189
4,869
719,050
905,085
177,816
727,
269
28,376
3,008
25,368
45,433
29,986
15,447
135,
669
29,8
11105,858
28,904
1,937
26,967
21,317
11,469
9,848
190,373
27,297
163,076
48,837
1,123
47,714
34,715
2,638
32,077
127,642
2,365
6,835
5,636
682
1.308
465,035
609,503
142,856
466,647
20,884
2,214
18,670
36,867
24,332
12,535
142,494
28,611
113,883
27,547
1,846
25,701
'16,488
8,871
7,617
263,887
26,198
237,689 :
43,925
1,010
42,915
37,715
2,866
34,849
112,
384
1,287
3,491
3,804
1,546
1,835
723,474
847,821
14-8, 972
698,849
16,955
1,797
15,158
44,150
29,139
15,011
207,632
34,263
173,369
0,54
52,717
37,828
• 23,811
12,810
11,001
279,
625
31,374
248,251
48,388
1,113
47,275
• 44,885
3,411
124,
026
2,251
1,584
988
1,768
1,131
602,261
734,009
168,058
565,951
18,266
1,936
16,330
47,570
31,396
16,174
200,671
34,523
166,148
• 46,259
3,099
43,160
20,224
10,881
• 9,343
234,864
31,612
203,252
51,752
1,190
50,5
62
60,613
4,607
56,006
98,141
692
691
298
1,341
92'?
594,867
696,957
173,666
523,091
13,421
1,423
11,998
46,693
30,817
15,876
205,769
35,590
170,179
47,361
3,173
44,188
23,061
12,407
10,654
248,
008
34,083
213,925
60,415
1,390
59,025
51,740
3,932
47,808
90,332
1,169
2,639
832
1,341
1,370
504,154
601,837
177,414
424.423
17,796
1,886
15,910
46,768
30,8
4815,920
147,622
25,952
121,670
36,094
2,418
.33,676
18,726
10,075
8,651
149,492
22,812
126,680
25,689
591
25,098
40,776
3,099
37,677
81,474
394
1,968
730
924
761
392,919
479,
170
132,950
346,220
13,921
1,476
12,445
30,112
19,874
10,238
93,582
21,980
71,602
35,748
2,395
33,353
27,136
27,136.
104,686
19,324
85,362
17,358
347
17,011
43,630
3,316
40,314
120,
812
877
4,826
1,254
869
1,045
335,000
464,683
100,507
364,176
10,6
341,127
9,507
20,341
13,425
6,916
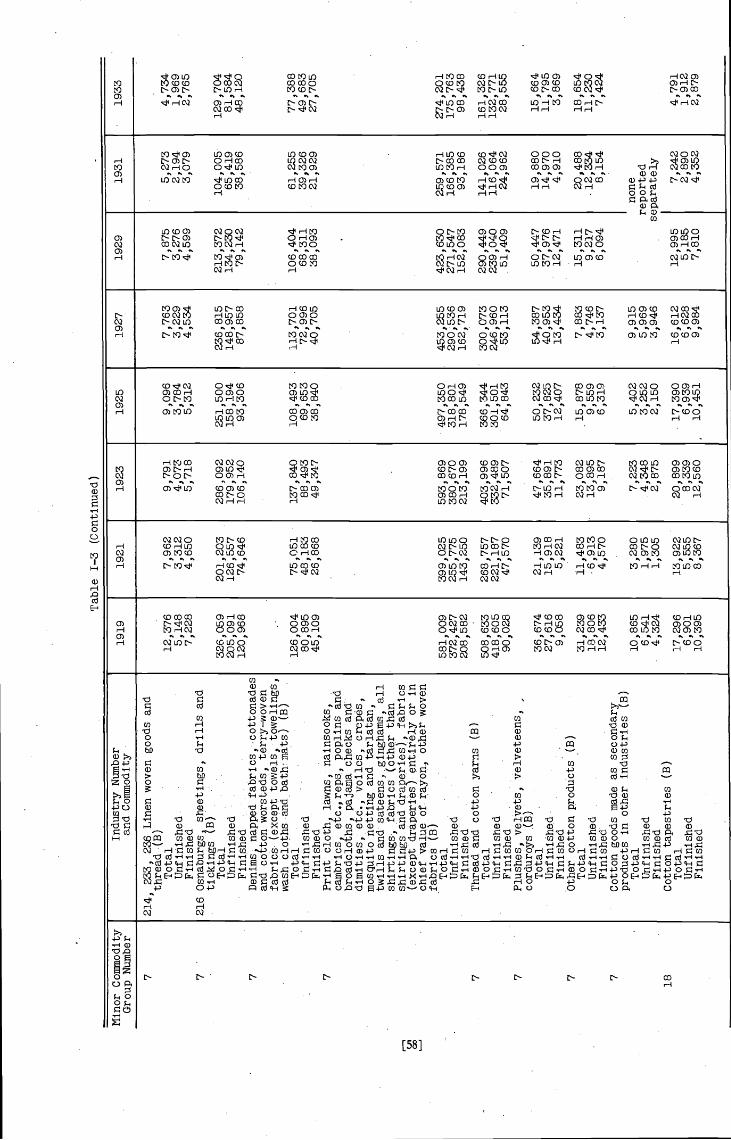
Table 1—3 (Continued)
I'ffnor Commodity
Group Number
Industry. Number
and Commodity
1919
1921
1923
1925
1927
1929
1931
1933
7 7 7 7 7 7 7 7
18
214, 233, 236 Linen woven goods and
thread (B)
Total
Unfinished
Finished
216 Osnaburgs
sheetings, drills and
tickings (B)
Total
Unfinished
Finished
Denims, napped fabrics,
cottonworsteds, terry—woven
fabrics (except towels, towelings,
wash cloths and bath mats) (B)
Total
Unfinished
Finished
Print cloth, lawns, nainsooks,
cambrics, etc.,reps, poplins and
broadcloths, pajama checkS and
dimitles, etc., voiles, crepes,
mosquito netting and tarlatan,
twills and sateens, ginghams, all
shirtings, fabrics (other than
shirtings and draperies), fabrics
(except draperies) entirely or in
chief value of. rayon., other woven
fabrics (B)
Total
Unfinished
Finished
Thread and cotton yarns (B)
Total
Unfinished
Finished
Flushes, velvets, velveteens,
-
cord
uroy
s(B.)
Total
Finished
Other cotton products (B)
Total
Unfinished
Finished
Cotton goods made as secondary
products in other industries (B)
Total
Unfinished
Finished
Cotton tapestries (B)
Total
Unfinished
Finished
12,376
5,148
7,228
326,059
205,091
120,968
126,004
80,895
45,109
581,009
372,427
208,582
508,633
418,605
90,028
36,674
27,616
9,058
31,239
18,806
12,433
10,865
6,541
4,324
17,296
6,901
10,395
7,962
3,312
4,650
201,203
126,557
74,646
75,051
48,183
26,868
399,025
255,775
143,250
268,757
221,187
47,570
21,139
15,918
5,221
11,483
6,913
4,570
3,280
1,975
1,305
13,922
5,555
8,367
9,791
4,073
5,718
286,092
179,952
106,140
137,840
88,493
49,347
593,869
380,670
213,199
403,996
332,489
71,507
47,664
35,891
11,773
23,082
13,895
9,187
7,223
4,348
2,875
20,899
8,339
12,560
9,096
3,784
5,312
251,500
158,194
93,306
108,493
69,653
38,840
497,350
318,801
178,549
366,344
301,501
64,843
50,232
37,828
12,407
15,878
9,559
6,319
5,402
3,252
2,150
17,390
6,939
10,451
7,763
3,229
4,534
236,815
148,957
87,858
113,701
72,996
40,705
453,255
290,536
162,719
300,073
246,960
53,113
54,387
40 ,95
313,434
7,883
4,746
3,137
9,915
5,969
3,946
16,612
6,628
9,984
7,875
3,276
4,599
213,372
134,230
79,1
42
106,404
68,311
38,093
423,630
271,547
152,083
290,449
239,040
51,409
50,447
37,976
12,471
15,311
9,217
6,094
12,995
5,185
7,810
5,273
2,194
3,079
104,005
65,419
38,586
61,255
39,326
21,929
259,571
166,385
93,186
141,026
116,064
24,962
19,880
14,970
4,910
20,488
12,334
8,154
none
reported
separately
7,242
2,890
4,352
4,734
1,969
2,765
129,704
81,584
48,120
77,388
49,683
27,705
274,201
175,763
98,438
161,326
132,771
28,555
15,664
11,795
3,869
18,654
11,230
7,424
4,791
1,912
2,879

Table 1—3 (Continued)
Minor Conunodity
Group Number
Industry Number
and Connilodity
1919
1921
1923
1925
1927
1929
1931
1933
7217 Cotton small wares (B)
Total
73,287
46,701
70,595
66,760
62,156
65,494
40,303
38,109
Unfinished
47,124
30,029
45,393
42,927
39,966
42,113
25,915
24,504
Finished
26,163
16,672
25,202
23,833
22,1
9023,381
14,388
13,605
7218 Dyeing and finishing textiles
(excluding contract work and
sheets) (C)
Total
143,971
122,988
162,927
181,544
180,447
207,032
143,180
123,962
Unfinished
113,593
97,038
128,549
143,238
142,373
163,246
112,969
97,806
Finished
30,378
25,950
34,378
38,306
38,074
43,786
30,211
26,156
7219 Embroideries (B)
Total
9,965
10,600
11,683
12,181
12,679
10,369
8,128
4,901
Unfinished
4,773
5,077
5,596
5,835
6,073
4,967
3,893
2,348
Finished
5,192
5,523
6,087
6,346
6,606
5,402
4,235
2,553
7234 Knit cloth (except glove and shoe
linings)
(B)
Total
56,827
43,181
62,685
50,822
51,399
63,164
49,001
45,214
Unfinished
34,892
26,513
38,489
31,205
31,559
38,771
30,087
27,761
Finished
21,935
16,668
24,196
19,617
19,840
24,393
18,914
17,453
7Other Imit goods (B)
Total
16,393
12,735
21,090
24,872
13,918
16,783
9,855
11,909
Unfinished
1,377
1,070
1,772
2,089
1,169
1,409
828
1,000
Finished
15,016
11,665
19,318
22,783
12,749
15,374
9,027
10,909
7235 Lace goods (except Nottingham lace
curtains and nets) (B)
Total
10,515
9,021
12,337
11,049
8,044
12,006
8,387
7,415
Unfinished
6,025
5,169
7,069
6,331
4,609
6,879
4,806
4,249
Finished
4,490
3,852
5,268
4,718
3,435
5,127
3,581
3,166
7244 Silk and rayon products (C)
Total
646,659
552,756
726,394
763,917
707,092
696,992
376,091
248,768
Unfinished
462,254
393,408
519,659
544,685
509,457
294,721
195,393
Finished
184,405
159,348
206,735
219,232
197,635
189,207
81,370
53,375
7249, 253 Woolen goods and worsted
goods (except blankets) (C)
Total
7.8,142
539,425
733,094
658,860
560,271
544,684
316,301
292,443
Unfinished
626,202
463,906
630,461
566,620
481,833
468,428
272,019
251,501
•Finished
101,940
75,519
102,633
92,240
78,438
76,256
44,282
40,942
7Woolen and worsted yarns for sale
(C) Total
238,064
161,257
252,632
211,095
184,025
199,758
129,144
111,978
Unfinished
230,922
154,807
247,579
208,984
182,185
197,760
126,561
108,619
Finished
7,142
6,450
5,053
2,111
1,840
1,998
2,583
3,359
Census Group 3
Con
311 All other lumber and timber pro-
•ducts (C)
Total
972,375
525,165
924,280
840,520
658,627
756,070
268,844
211,974
Unfinished
555,773
433,158
688,067
665,792
568,088
595,226
222,459
155,758
Construction materials
416,602
92,007
236,213
174,728
90,539
160,844
46,385
56,216
12
313 Nirror and picture frames (B)
Total
17,898
15,419
18,568
19,024
18,312
18,006
10,444
6,657
Unfinished
1,056
910
1,096
1,122
1,080
1,062
616
393
Finished
16,842
14,509
17,472
17,902
17,232
16,944
9,828
6,264

Census Group 5
Table 1—3 (Continued)
Commodity
Group Number
Industry Number
and Commodity
1919
.
1921
1923
1925
1927
1929
1931
1933
Census Group 4
401, 2, 3, 4, 5, 6 and 8. Bags, paper,
excl. those made in paper mills
Boxes, paper, n.e.c.
Cardboard, not made In paper mills
Card cutting and designing
Envelopes
Labels and tags
Paper goods, n.e.c.
Total, converted paper products
(B)
Unfinished
Finished•
407 Writing paper (B)
Total
Unfinished
Finished
4 4 4 4 4 4 4 4 4 4 3 1 3 3 5a
3
55,077
212,424
8,251
5,522
39,518
23,862
175,626
520,280.
385,527
134,753
87,741
26,849
60,892
80,017
54,732
25,285
32,5
3218,673
13,859
48,556
25,677
22,8
79
23,648
5,628
18,020
2,847
313
2,534
7,997
4,758
3,239
558,
861
504,848
54,013
44,6
3518
4,42
46,918
4,700
42,584
18,007
137,719
438,987
325,289
113,698
61,314
18,762
42,552
77,391
52,935
24,456
29,883
17,153
12,730
52,547
21,550
30,997
17,198
4,093
13,105
1,985
218
1,767
5,782
3,440
2,34
2
363, 157
332,995
30,162
51,691
278,638
8,341
6,694
49,276
23,841
190,157
608,638
451,008
157,630
69,098
27,264
61,834
'93,243
63,778
29,465
33,836
19,422
14,414
51,521
20,683
30,838
23,541
5,60
317,938
1,604
176
1,428
7,015
4,174
2,841
570,618
530,383
40,235'
501 Bookbinding and blank—book making
(B) Total
Unfinished
Finished Census Group 6
601 Alcohol, ethyl and distifled
liquors (B)
Total
Unfinished
Fini
shed
603
Bak
ing
pow
ders
, yea
stand other
leavening
com
poun
ds (
A)
Tot
alUnfinished
Finished -
604
Blacking, stains and dressings
(B) Total
Unfinished
Finished
605
Blu
ing
(B)
Tot
alUnfinished
Finid
607 Candles (B)
Total
Unfinished
Finished
608 Chemicals, n.e.c. (B)
Total
Unfinished
Finished
58,991
309,914
6,508
9,185
49,321
26,052
203,343
663,
322
491,522
171,
800
105,
474
32,275
73,199
99,245
67,8
8431,361
59,060
33,900
25,1
60
51,075
24,769
26,306
23,102
5,498
17,604
2,110
232
1,87
8
7,249
4,313
2,93
6
'551,544
505,
462
46,082
71,0
1133
2,37
97,267
15,681
54,512
29,238
230,760
740,848
546,
968
191,880
105,148
32,175
72,973
108,421,
74,160
34,261
32,928
18,901
14,0
27
51,333
24,956
26,377
20,784
4,947
15,837
1,632
180
1,452
7,579
4,510
3,069
610,143
562,845
47,298
79,124
346,447
6,93
716,104
57,658
30,898
281,450
818,618
606,539
212,079
113,224
34,694
78,530
123,027
84,094
38,933
50,203
28,811
21,392
49,941
22,1
4127,800
22,757
5,416
17,341
1,382
152
1,230
8,09
34,815
3,27
8
758,815
700,923
57,892
61,576
259,807
4,205
15,197
.45,270
not re
228,421
614,476
455,327
159,149
77,8
6523,827
54,038
93,0
1963,625
29,394
21,758
12,489
9,269
43,417
21,212
22,205
18,756
4,464
14,2
92
1,187
131
1,056
6,10
93,635
2,474
548,621
488,934
59,687
.57,375
253,557
4,870
10,967
33.093
orted
201,557
561,419
416,
011
145,
408
61,330
18,767
42,563
62,636
42,843
19,7
93
60,850
34,928
25,922
29,296
17,996
11,300
17,570
4,182
13,388
1,040
114
926
4,673
2,780
1,893
484,137
433,
771
50,366
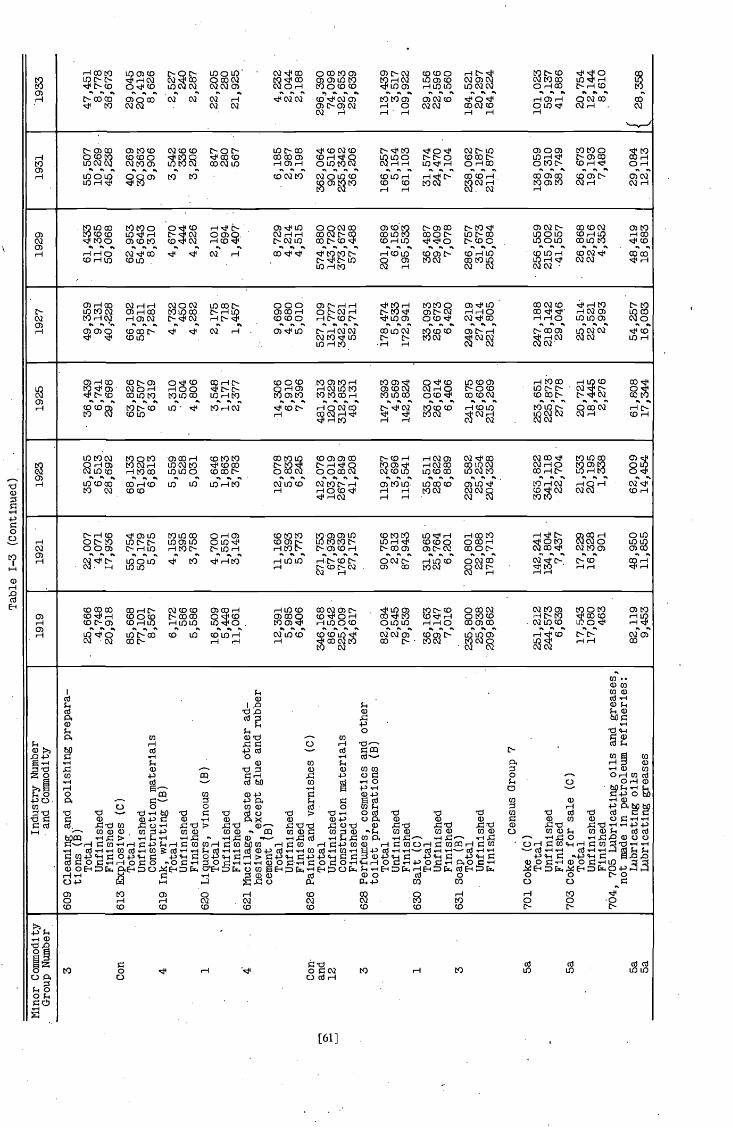
Census Group 7
Table 1—3 (Continued)
Minor Commodity
Group Number
Industry Number
'and
Commodity
1919
1921
1923
.
1925
1927
1929
1931
.
1933
609 Cleaning and polishing prepara-
tions (B)
Total
Unfinished
F ml shed
613 ExplosIves (C)
Total
Unfinished
Construction materials
619 Ink, writing (B)
Total
Unfinished
Finished
620
Liq
uors
,vinous (B)
Total
Unt inisheci
Finished
621 Nucliage, paste and other ad-
hesives
except glue and rubber
cement
Total
Uriflnlshed
Finished
626 Paints and varnishes (C)
Total
Unfinished
Construction materials
Finished
628 Perfumes, cosmetics and other
toilet preparations (B)
Total
Unfinished
Finished
630 Salt (C)
Total
Unfinished
Finished
631 Soap (B)
Total
Unfinished
Finished
3
Con
4 1 4.
Con
and
12 3 1 3 5a
5a
5a
5a
25,666
4,748
20,9
18
85,668
77,101
8,567
6,172
586
5,586
16,509
5,448
.11,961
12,391
5,985
6,406
346,
168
86,542
225,009
34,6
17
82,084
2,545
79,5
39
36,163
29,147
7,016
235,800
25,9
38209,862
251,
212
244,
573
6,63
9
17, .543
17,080
463
82,1
199,453
22,007
'4,071
17,936
55,754
50,179
5,575
4,153
395
3,758
4,700
1,551
3,149
11,166
5,393
5,773
271,753
67,9
39176,639
27,175
90,756
2,813
87,943
31,9
6525,764
6,20
1
200,801
22,088
178,713
142,241
134,804
.7,437
17,2
2916,328
901
48,950
11,8
55
35,2
056,
513.
28,692
68,133
61,320
6,813
5,559
528
5,031
5,646
1,863
3,783
12,078
5,833
6,245
412,
076
103,019
267,849
41,208
119,
237
3,696
115,541
35,511
28,622
6,889
229,582
25,254
204,
328
363,822
341,118
22,7
04
21,533
20,195
1,33
8
62,0
0914,454
36,439
6,741
29,698
63,826
57,507
6,319
5,310
504
4,806
3,548
1,17
12,377
14,306
6,910
7,396
481,313
120,
329
312,853
48,131
147,
393
4,569
142,824
33,020
26,6
146,406
241,
875
26,606
215,269
253,651
225,873
27,778
20,721
18,445
2,27
6
61,808
17,344
49,359
9,131
40 66,192
58,911
7,281
4,732
450
4,28
2
2,175
718
1,457
9,690
4,680
5,010
527,109
131,777
342,621
52,711
173,474
5,533
172,
941
33,093
26,6
736,420
249,219
27,4
14221,805
247,
188
218,142
29,046
25,514-
22,5
212,993
54,257
16,0
83
61,433
11,365
50,068
62,953.
54,643
8,310
4,670
444
4,22
6
2,101
694
1,407
8,72
94,214
4,515
574,880
143,720
373, 672
57,488
201,
689
6,15
6.195,533
36,4
8729,409
7,078
286,757
31,673
255,084
2,56
,559
215,
002
-41,557
26,868
22,516
4,352
48,419
18,6
83
55,507
10,269
45,238
40,2
6930
,363
9,906
3,542
336
3,20
6
847
280
567
6,185
2,987
3,198
362,064
90,516
235,342
36,206
166,257
5,15
4161,103
31,574
24,470
7,10
4
238,062
26,1
87211,875
138,059
99,310
38,749
26,673
19, 193
7,460
29,084
12,1
13
47,4
518,
778
38,673
29,045
20,419
8,62
6
2,527
240
2,28
7
.22,205
280
21,925
4,232
2,044
2,18
8
296,390
74,098
192,653
29,639
113,439
3,51
7109,922
29,156
22,596
6,560
184,521
20,297
164,
224
101,
023
59,1
3741
,886
20,754
12,1
448,610
28,358
701 Coke (C)
Total
Unfinished
Finished
703 Coke, for sale (C)
Total
Unfinished
Finished
704, 705 Lubricating oils
not made
Inpetroleum
Lubricating oils
Lubricating greases
and greases,
refineries:
11

Table 1—3 (ContInued)
Connnodlty
Group Number
Industry Number
and Conunodity
1919
1921
1923
1925
1927
1929
1931
1933
704,705 (Continued)
5a
Petroleum refining:
5a
Lubricating oils
196,242
194,609
204,495
252,105
244,629
304,673
197,372
142,656
Lubricatinggreases and axle grease
8,14
67,204
7,998
10,361
9,987
14,098
10,153
7,396
5a
Total, oils and. greases (C)
295,960
262,618
288,956
341,618
324,956
385,873
248,722
178,410
Unfinished
248,702
204,790
228,640
257,674
244,121
278,300
186,541
21,203
Finished
47,258
57,828
60,316
83,944
80 835
107,
573
62,181
57,207
5a
Gasoline (C)
Total
679,867
840,672
876,732
1,218,236
1,048,471
1,531,242
831,386
764,691
Unfinished
265,148
327,862
341,925
475,112
335,511
581,872
282,671.
259,995
Finished
414,719
512,810
534,807
743,124
712,960
949,370
548,715
504,696
5a
Fuel oils (0)
Total
318,124
377,264
345,666
488,958
456,959
384,630.
271,568
256,104
Unfinished
314,943
373,491
342,209
476,734
442,336
365,398
251,744
228,957
Finished
3,181
3,773
3,457
12,224
14,623
19,232
19,824
27,147
5a
Coke, petroleum (C)
Total
3,928
3,715
4,796.
6,437
7,170
5,461
7,182
5,596
Unfinished
3,824
3,521
4,504
5,729
6,315
4,572
5,155
3,272
Finished
104
194
292
708
855
889
2,027
2,324
Census Group 8
..
4802 Rubber erasers and rubber
bands (B)
Total
2,511
2,145
3,156
2,934
2,500
3,020
1,821
1,445
Unfinished
615
526
773
719
.61
2740
446
354
Finished
1,896
1,619
2,383
2,215
1,888
2,280
1,375
1,091
4Rubber cement (B)
Total
.
.3,
884
4,697
3,262
2,378
Unfinished
Included with Industry 621
1,876
2,269
1,576
1,149
Finished
2,008
2,428
1,686
1,229
19
Jar rings (B)
Total
2,328
1,357
1,994
3,287
3,054
3,001
3,115
1,784
Unfinished
889
518
762
1,256
1,167
1,146
1,190
681
Finished
1,439
839
1,232
2,031
1,887
1,855
1,925
1,103
14
Tire sundries and repair materials
(C) Total
18,442
10,748
15,792
26,036
24,210
17,168
9,583
7,817
Unfinished
7,377
4,836
7,896
14,320
13,316
10,301
6,229
5,081
Finished
11,065
5,910
7,896
11,716
10,894
6,867
3,354
2,736
11
Rubber heels, soles and soling
.
strip
s(C)
Total
18,559
16,268
28,599
36,476
34,845
28,604
22,017
21,208
Unfinished
14,847
13,014
21,449
24,439
21,604
18,593
16,513
16,542
Finished
3,712
3,254
7,150
12,037
13,241
10,011
5,504
4,666
8Hard rubber goods (other than
battery jars, boxes, etc.) (C)
Total
16,435
5,708
12,014
13,915
9,029
12,128
5,879
5,673
UnfInished
11,504
3,996
8,410
9,741
6,320
8,490
4,115
3,976
Finished
4,931
1,712
3,604
4,174
2,709.
3,638
1,764
1,697
14
803 Pneumatic tires, motor—vehicle,
except motorcycle (C)
Total
685,209
430,688
533,090
774,726
739,070
654,103
358,997
250,464
Unfinished
151,068
97,571
186,903
218,589
160,450
205,445
74,540
46,481
Finished
534,141
333,117
346,187
556,137
578,620
448,658
284,457
203,983
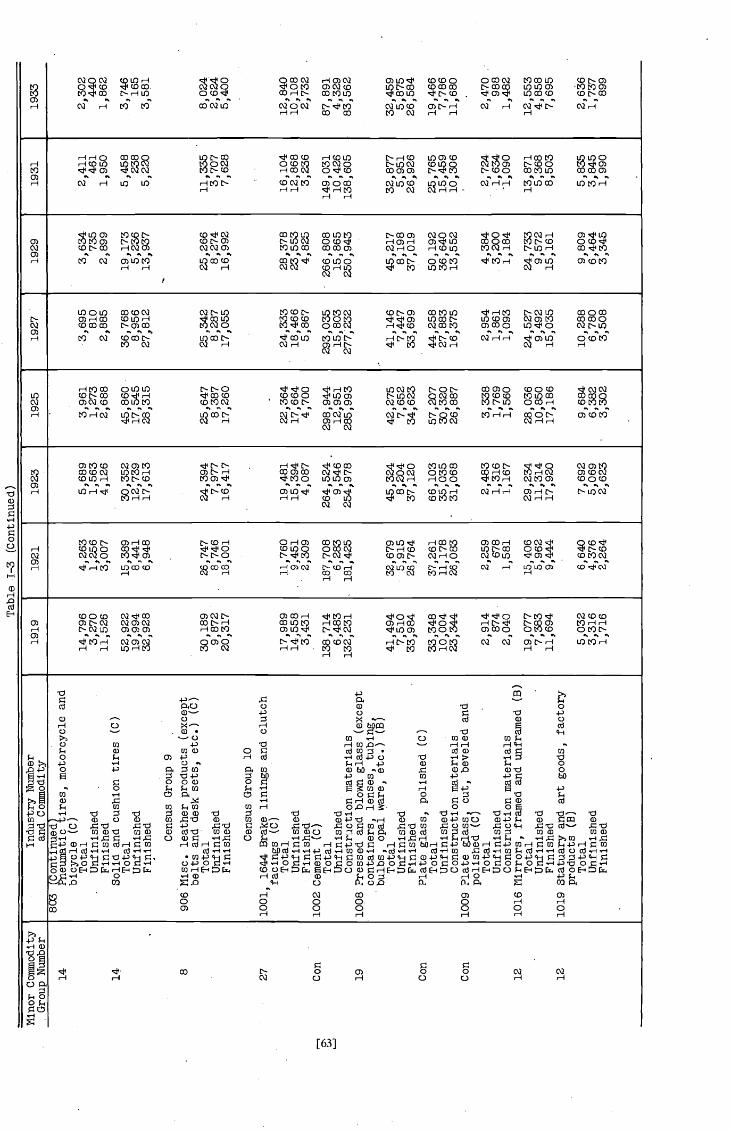
Table 1-3 (Continued)
Com
mod
ityG
roup
Num
ber
Indu
stry
Num
ber
and
Commodity
1919
1921
1923
1925
1927
1929
1931
1933
14
14 8 27 Con 19 Con
Con 12 12
803 (Continued)
Pneumatic tires, motorcycle and
bicycle (C)
Total
Unfinished
Finished
Solid and cushion tires (C)
Total
Unfinished
F mi shed
Census Group 9
906 ?Ilsc. leather products (except
belts and desk sets, etc.) (C)
Total
Unfinished
Finished
Census Group 10
1001, 1644 Brake linings and clutch
facings (C)
Total
Unfinished
Finished
1002 Cement (C)
Total
Unfinished
Construction materials
1008 Pressed and blown glass (except
containers, lenses, tubing
bulbs, opal ware, etc.) (35
Tot
alUnfinished
FInished
Plate glass, polished (C)
Total
Unfinished
Construction materials
1009 Plate glass, cut, beveled and
polished (C)
Total
Unfinished
Construction materials
1016 Nlrrors, framed and unframed (B)
Total
Unf
inis
hed
Finished
1019
Sta
tuar
y an
d ar
t goo
ds, f
acto
ry-
prod
ucts
(B)
Total
Unfinished
Finished
14,796
3,270
11,5
26
52,9
2219
,994
32,928
30,1
899,872
20,3
17
17,9
8914
,558
3,43
1
138,714
6,483
132,231
41,4
947,510
33,984
33,348
10,004
23,344
2,91
487
42,
040
19,077
7,38
311,694
5,03
23,
316
1,71
6
4,263
1,256
3,007
15,389
8,441
6,948
26,747
8,74
618,001
11,760
9,451
2,309
187,708
6,283
181,425
32,679
5,91
526,764
37,261
11,1
7826
,083
2,259
678
1,581
15,406
5,962
9,44
4
6,64
04,376
2,264
5,689
1,563
4,126
30,3
5212,739
17,6
13
24,3
947,977
16,4
17
19,4
8115,394
4,087
264,524
9,546
254,
978
45,324
8,20
437
,120
66,1
0335
,035
31,068
2,48
31,316
1,16
7
29,2
3411,314
17,920
7,692
5,069
2,623
3,961
1,273
2,688
45,860
17,545
28,315
25,647
6,387
17,2
60
22,3
6417,664
4,700
298,944
12,951
285,
993
42,2
757,
652
34,6
23
57,207
30,320
26,8
87
3,33
81,769
1,560
28,0
3610,850
17,186
9,68
46,382
3,302
3,695
810
2,885
36,7
688,
956
27,8
12
25,3
428,287
17,0
55
24,333
18,466
5,867
293,035
15,803
277,
232
41,146
7,44
733,699
44,258
27,883
16,3
75
2,95
41,861
1,093
24,527
9,492
15,0
35
10,288
6,78
03,
508
3,634
735
2,89
9
19,173
5,23
613
,937
25,2
668,274
16,9
92
28,3
7823
,553
4,825
266,808
15,865
250,
943
45,2
176,198
37,019
50,1
9236
,640
13,552
4,38
43,200
1,184
24,7
339,
572
15,1
61
9,80
96,
464
3,345
2,41
146
11,
950
5,45
8238
5,22
0
11,335
3,707
7,62
8
16,1
0412,868
3,23
6
149,031
10,4
2613
8,60
5
32,8
775,
951
26,9
26
25,7
6515,459
10,306
2,72
41,634
1,090
13,8
715,
368
8,50
3
5,83
53,845
1,99
0
2,30
244
01,
862
3,746
165
3,56
1
8,02
42,624
5,400
12,840
10, 108
2,732
87,8
914,
329
83,5
62
32,4
595,
875
26,5
84
19,4
667,
786
11,6
80
2,47
098
81,482
12,553
4,85
87,
695
2,63
61,
737
899
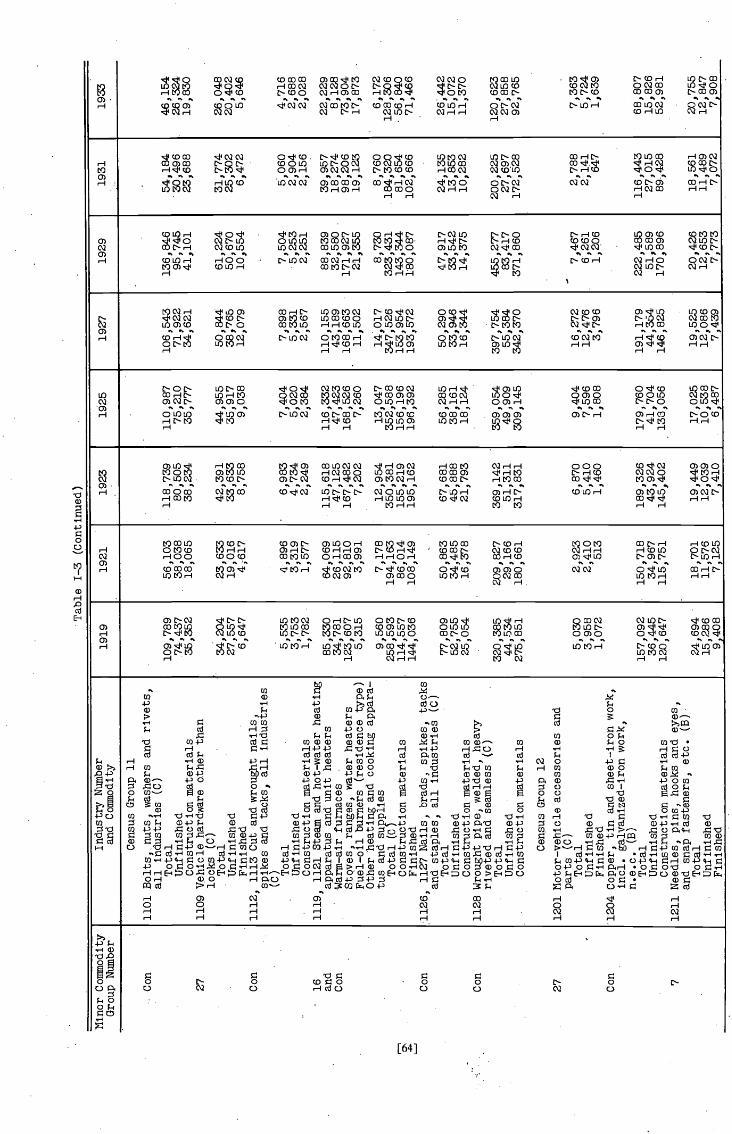
Table 1—3
(Con
tinue
d)
Min
or C
omm
odity
Gro
upNumber
Indu
stry
Num
ber
and
Coniniodity
1919
1921
1923
.
1925
1927
1929
1931
1933
.
Census Group 11
Con
27 Con
-16 an
dC
on
Con
Con
27 Con 7
1101 Bolts, nuts, washers and rivets,
all industries (C)
Total
Unfinished
Construction materials
1109 VehIcle hardware other than
locks (C)
Total
Unfinished
Finished
1112, 1113 Cut and wrought nails,
spikes and tacks, all industries
(C) T
otal
Unf
inis
hed
Construction materials
1119, 1121 Steam
and
hot—water heating
apparatus and unit
heat
ers
Warm—air furnaces
Stoves, ranges, water heaters
Fuel—oil burners (residence type)
Other heating and cooking appara-
tus and supplies
Total (C)
Construction materials
Finished
1126, 1127 Nails, brads, spikes, tacks
and staples, all industries (0)
Total
Unfinished
Construction
mat
eria
ls11
28Wrought pipe, welded, heavy
riveted and seamless (C)
Total
Unfinished
Construction
mat
eria
lsC
ensu
sGroup 12
1201 Motor—vehicle accessories and
parts (C)
Total
Unfinished
Finished
1204
Cop
per,
tin and sheet—iron work,
mci. galvanized—iron work,
n.e.c. (B)
Total
Unfinished
Construction materials
1211 Needles, pins, hooks and
eyes
,and snap fasteners, etc. (B)
Total
Unfinished
Finished
109,789
14,437
35,3
52
34,2
0427
,557
6,64
7
5,53
53,753
1,78
2
85,3
3034
,781
123,
607
5,31
5
9,56
0258,593
114,
557
144,036
77,8
0952
,755
25,054
320,
385
44,5
3427
5,85
1
5,030
3, 9
581,
072
157,
092
36,4
4512
0,64
7
24,694
15,286
9•40
8
56,1
0338
,038
18,0
65
23,633
19,0
164,617
4,896
3,319
1,577
64,069
26,115
92,810
3,991
7,178
194,163
86,014
108,149
50,863
34,485
16,378
209,827
29,166
180,661
2 2,410
513
150,718
34,967
115,751
18,701
11,576
7,125
118,739
80,505
38,2
34
42, 3
9133
,633
8,75
8
6,98
34,
734
2,24
9
115,
618
47,125
167,482
7,202
12,954
350,
381
155,
219
195,
162
67,6
8145,888
21,793
369,142
51,311
317,831
6,870
5,410
1,480
189,326
43,924
145,
402
19,4
4912
,039
7,410
110,
987
75,2
1035
,777
44,9
5535
,917
9,03
8
7,40
45,
020
2,38
4
116,
332
47,4
2316
8,52
67,
260
13,0
4735
2,58
8156,196
196,392
56,285
38,161
18,124
359,
054
49,9
09309,145
9,40
47,
596
1,80
8
179,760
41,704
138,056
17,025
10,538
6,487
106,
543
71,9
2234
,621
50,8
4438
,765
12,079
7,898
5,331
2,567
110,155
43,189
168,663
11,502
14,017
347,526
153,954
193,
572
50,290
33,946
16,3
44
397,
754
55,3
8434
2,37
0
16,2
7212
,476
3,796
191,179
44,354
146,
825
19,5
2512
,086
7,43
9
136,
846
95,7
4541
,101
61,224
50,6
7010
,554
7,50
4•5
,253
2,25
1
88,8
3932
,580
171,
927
21,3
55
8,73
032
3,43
114
3,34
418
0,08
7
47,917
33,542
14,375
455,277
83,417
371,860
7,467
6,261
1,206
222,485
51,589
170,896
20,426
12,6
537,773
54,1
8430
,496
23,688
31,774
25,302
6,47
2
5,06
02,
904
2,15
6
39,9
5718
,274
98,2
0619
,123
8,76
018
4,32
081
,654
102,666
24,135
13,8
5310
,282
200,
225
27,6
9717
2,52
8
2,78
82,
141
647
116,
443
27,0
1589
,428
18,5
6111
,489
7,07
2
46,1
5426
,324
19,8
30
26,0
4820
,402
5,64
6
4,71
62,
688
2,02
8
22,2
298,
128
73,9
0417
,873
6,17
212
8,30
6•
56,8
4071
,466
2644
215
,072
11,3
70
120,
623
27,8
5892
,765
7,36
35,
724
1,63
9
68,8
0715
,826
52,9
81
20,7
5512
,847
7,90
8

Census Group 13
Table 1-3 (Continued)
1219 Stamped automotive parts and
accessories (C)
Total
Unfinished
Fini
shed
Gro
up N
umbe
rIn
dust
ry N
umbe
ran
d C
omm
odity
1919
1921
1923
1925
1927
1929
1931
1933
27 6b
16and
Con
21
21
21
21
27 27
27
1303 Incandescent-filament lamps
(C)
Tot
alUnfinished
Fini
shed
Domestic ranges, 2* kw. and over
(C) Total
Con
stru
ctio
nmaterials
Finished
Water heaters for permanent in-
stallation (C)
Total
Construction materials
Finished
Loud speakers (C)
Total
Unfinished
Fini
shed
Transformers
(C)
Tot
alUnfinished
Fini
shed
Radio tubes (C)
Total
Unfinished
Finished
Nlsc. radio parts and accessories
and
tran
sfor
mer
s (C
)T
otal
Unfinished
Finished
Generators:
automotive genera-
tors for battery charging and
auto
mot
ive
starter—motors (C)
Total
Unfinished
Finished
Ignition apparatus for internal-
combustion engines (C)
Total
Unfinished
Fini
shed
Storage
batte
ries
(C
)T
otal
Unf
inis
hed
Finished
36,8
4126
,073
29,5
5120
,943
7,29
05,130
57,647
59,728
37,471
38,823
20,176
20,905
2,954
1,54
01,
309
682
1,645
858
376
367
167
163
209
204
no d
ata no
dat
a
832
1,09
837
649
645
660
2
no d
ata
36,6
6327
,443
29,5
8722,056
7,076
5,387
51,287
20,589
23,0
379,
344
28,2
5011
,245
56,6
4843
,242
25,2
0818
,812
31,4
4024
,430
44,0
92.
35,0
429,
050
71,966
46,7
7825,188
3,154
1,39
71,
757
406
180
226
5,608
1,122
4,486
9,824
4,44
05,
384
24,3
224,
864
19,4
58
54,0
0742,913
11,094
31,8
3114,109
17,722
66,9
2228
,042
38,8
80
42,3
1933
,642
8,677
73,558
47,8
1325,745
6,77
73,002
3,775
769
341
428
18,956
5,68
7.13,269
1,860
558
1,302
23,015
10,4
0312
,612
28,789
8,637
20,152
56,2
2144,652
11,5
69
41,854
19,0
3122,823
88,8
7036,809
52,061
36,553
27,580
8,973
87,933
57,156
30,777
11,1
354,
933
6,202
953
422
531
18,839
8,101
10,738
690
297
393
22,163
10,018
12,1
45
48,779
20,9
7527
,804
58,128
43,979
14,1
49
36,431
16,2
1520,216
79,6
7434,268
45,4
06
56,985
47,034
9,95
1
85,320
55,458
29,8
62
15,514
6,876
8,638
1,640
727
913
30,551
23,219
7,332
1,04
2792
250
82,0
1337,070
44,943
51,4
7239,119
12,353
61,0
59
10,554
58,6
2725,787
32,8
40
105,
720
44,0
2261
,698
25,888
20,495
5,39
3
70,502
44,064
26,4
38
9,00
83,991
5,017
1,106
490
616
4,648
4,55
5 93
29,335
13,2
6416
,071
21,649
21,2
16 433
23,6
2818
,666
4,962
27,894
12,982
14,912
63,435
26,9
7836
,457
no data
38,516
30,320
8,19
6
49,849
31,1
5618,693
3,898
1,727
2,171
432
191
241
3,00
22,94260
27,319
9,345
17,9
74
12, 177
11,933
244
16,8
1113,168
13,643
23,4
3211
,272
12,1
60
51,217
20,655
30,562
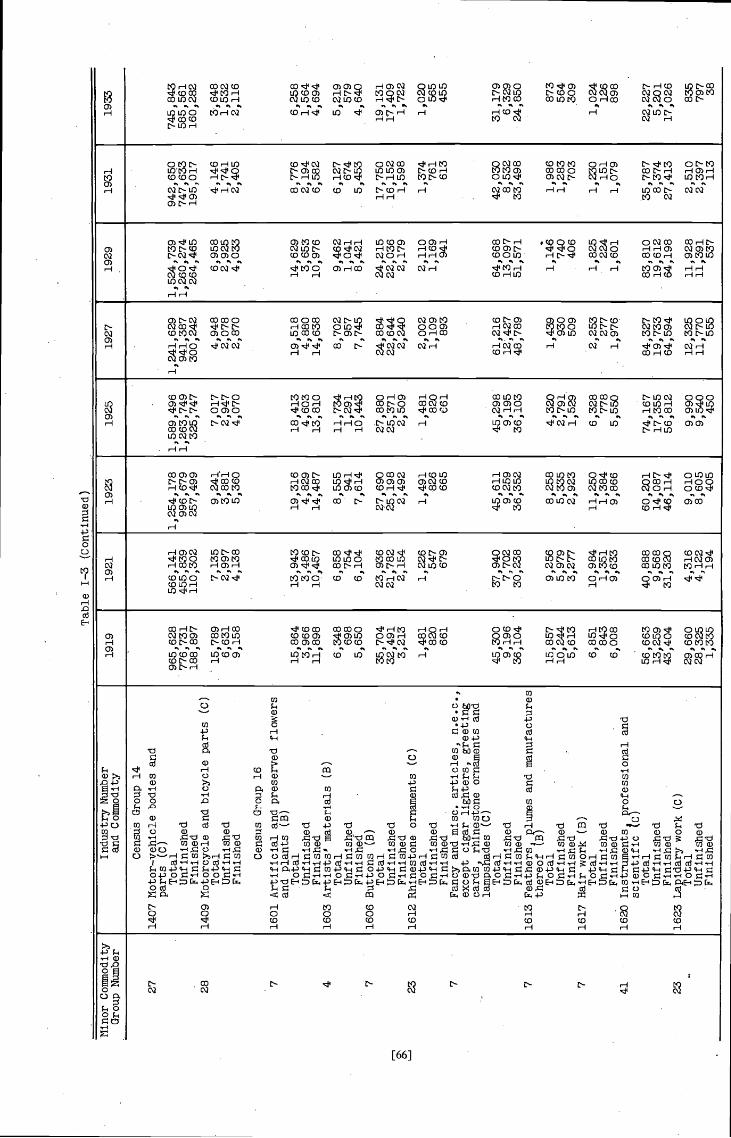
Table 1—3 (Continued)
Minor Commodity
Group Number
Industry Number
and Commodity
1919
1921
1923
1925
1927
1929
1931
1933
Census Group 14
Census Group 16
1407 Motor—vehicle bodies and
parts (C)
Total
Unf lnishecl
Finished
1409 Motorcycle and bicycle parts (C)
Total
Unfinished
Finished
n 0' C'
27
28 7 4 7
23 7 7 7
41
23
965,628
776,731
188,897
15,789
6,631
9,158
15,864
3,986
11,898
6,348
698
5,650
35,704
32,491
3,213
1,481
820
661
45,300
9,196
36,104
15,857
10,244
5,61
3
6,851
843
6,008
56,663
13,259
43,404
29,660
28,325
1,335
1601 Artificial and preserved flowers
and plants (B)
Total
Unfinished
Finished
1603 Artists' materials (B)
Total
Unfinished
Finished
1606 Buttons (B)
Total
Unfinished
Finished
1612 RhInestone ornaments (C)
Total
Unfinished
Finished
Fancy and misc, articles, n.e.c.,
except cigar lighters, greeting
cards, rhinestone ornaments and
lampshades (C)
Total
Unfinished
Finished
1613 Feathers
plumes and manufactures
thereof {B)
Total
Unfinished
Finished
1617 Hair work (B)
Total
Unfinished
Finished
1620 Instruments
professional and
scientific
Total
Unfinished
Finished
1623 Lapidary work (C)
Total
Unfinished
Finished
566,141
455,839
110,302
7,135
2,997
4,138
13,943
3,486
10,457
6,858
754
6,104
23,936
21,782
2,154
1,226
547
679
37,940
7,70
230,238
9,256
5,979
3,277
10,984
1,351
9,63
3
40,888
9,568
31,320
4,316
4,122
194
1,254,178
996,679
257,499
9,241
3,881
5,360
19,316
4,829
14,487
8,555
941
7,614
27,690
25,198
2,492
1,491
826
665
45,611
9,259
36,352
8,258
5,335
2,92
3
11,250
1,384
9,866
60,201
14,087
46,114
9,010
8,605
405
1,589,496
1,263,749
325,747
7,017
2,947
4,070
18,413
4,603
13,810
11,734
1,291
10,443
27,8
8025,371
2,509
1,481
820
661
45,298
9,195
36,103
4,320
2,791.
1,529
6,328
778
5,550
74,167
17,355
56,812
9,990
9,540
450
1,241,629
941,387
300,242
4,948
2,078
2,870
19,518
4,880
14,638
8,702
957
7,745
24,884
22,6
442,240
2,00
21,109
893
61,216
12,427
46,789
1,439
930
509
2,253
277
1,976
84,327
19,733
64,594
12,325
11,770
555
1,524,739
1,260,274
264,465
6,958
2,925
4,033
14,629
3,653
10,976
9,462
1,041
8,421
24,215
22,036
2,179
2,110
1,169
941
64,668
13,097
51,571
1,146
740
406
1,82
5224
1,60
1
83,810
19,612
64,198
11,928
11,391
537
942,65.0
747,633
195,017
4,146
1,741
2,405
8,776
2,194
6,582
6,127
674
5,453
17,7
5016,152
1,598
1,374
761
613
42,030
8,532
33,498
1,986
1,283
703
1,230
151
1,079
'35,787
8,374
27,413
2,510
2,397
113
745,
843
585,
561
160,282
3,648
1,532
2,116
6,258
1,564
4,694
5,219
579
4,640
19,131
17,409
1,722
1,020
565
455
31,179
6,329
24,850
873
564
.309
1,024
126
898
22,227
5,201
17,026
835
797
38

Table 1—3 (Concluded)
Industry Number
1919
1921
1923
1925
1927
1929
1931
1933
4 4
'
1633
1634
,
•
PencIls, lead (mci. mechanical)
(B) Total
Unfinished
Finished
Pens, fountain and stylographic;
pen points, gold, steel and
brass (B)
Total
Unfinished
FInished
.
18,4
964,532
13,964
18,819
753
18,066
16,529
4,050
12,479
14,913
597
14,316
.
19,7
474,838
14,909
23,709
948
22,761
•
20,519
5,027
15,492
.
26,4
551,058
25,397
. 21,4
415,253
16,188
21,779
871
20,908
.24,476
5,997
18,479
29,235
1,169
28,066
.
16,861
4,131
12,730
17,8
06 712
17,094
•13,975
3,424
10,551
8,675
347
8,32
822
1635
Phon
ogra
phs
and
part
s, n
ot r
e-po
rted
indetail (C)
Total
Unfinished
•
7,173
509
1,40274
1,302
103
3,599
173
3,092
235
nonereported
6b
1636
FInished
FIlms, slides, sensitized cloth
and paper (C)
6,664
1,328
1,199
3,426
2,857
.
.
4
12
1643
1651
Total
Unfinished
Finished
Stationery goods, n.e.c. (B)
Total
Unfinished
Finished
WIndow
and fixtures (B)
70,462
52,846
17,616
61,565
15,083
46,482
56,613
42,460
14,1
53
66,520
16,297
50,223
57,275
42,956
14,319
81,699
20,016
61,683
61,940
46,455
15,485
71,757
17,580
54,177
71,953
53,965
17,988
. 60,9
3514.929
46,006
81,458
61,094
20,364
75,853
18,552
57,301
•
62,359
46,769
15,590
53,120
13,014
40,106
42,260
31,695
10,565
15,978
3,915
12,063
.Total
Unfinished
Finished
26,456
1,852
24,604
26,538
1,858
24,680
43,364
3,035
40,329
39,104
2,737
36,367
36,558
2,559
33,999
•38,452
2,692
35,760
20,676
1,447
19,229
16,267
1,139
15,128

PART I
Note A to Table I—S
ALLOCATION OF MIXED COMMODITIES BASED ON CENSUS REPORTS OF MATERIALS CONSUMED INMANUFACTURING
The following commodities were apportioned on the basisof the amount estimated as consumed in manufacturing estab-lishments, that amount of course representing unfinished:•butter; condensed and evaporated milk; powdered milk, etc.;flavoring extracts, and sirups; flour; shortenings (except lard)and vegetable cooking oils; lard; sugar; baking powder,yeast, etc.
The adequacy of the method is dependent on the reliabilityof tables appearing in the Census of Manufactures, 1929which show for various industries the value of principal ma-terials consumed. The figures given for each industry representat least 50 per cent of the industry in terms of value ofproducts (usually covering between 75 and 95 per cent). Con-sequently they had to be raised in order to provide completecoverage, on the assumption that the part of an industry not
reporting materials consumed consumes them in the samerelative proportion to value of products as the rest of theindustry.
After the necessary adjustments for a complete coveragehad been made the values for specific materials were estimatedfor the years prior to 1929 on the basis of the average of1929and 1931 relationships (if both were available) to totalcost of materials. For 1933, the 1931 apportionment was used.
It is highly probable that the estimates of unfinished ascalculated by the above method represent minima, since notall industries using specified materials report them as sucheven 1929.
Table A—i indicates the consumption of specified materialsby industries in which it could be estimated.
{68]

Not
e A
to T
able
1-3
Tab
le A
-i
SEL
EC
TE
D M
AT
ER
IAL
S C
ON
SUM
ED
IN
VA
RIO
US
IND
UST
RIE
S
(tho
usan
dsof dollars)
•:
S
Percentage
Percentage
1919
1921
1923
1925
1927
1929
Distribu—
1931
Distribu—
1933
.
.tion 1929
tion 1931
101 Beverages1
..
..
..
Total cost of materials, md.
fuel and containers
68,599
116,102
99,572
.
98,4
6695,430
103,026
76,045
•41,873
S
Cost of specified materials:
..
Sugar
.
Cor
nsirup
Flavoring extract and coloring
Malt extract
.
.
•
9,083
672
18,343
343
15,372
1,138
31,046
581.
13,183
976
26,626
498
13,037
965
26,330
492
12,635
935
.25
,518 477
14,633
:1,055
19,358
541
14.20
1.02
18.79
.53
9,337
719
26,378
355
12.28
.95
34.69
.47
.
5,142.
398
14,526
197
102 Bread and other bakery
productsl
.
.
..
.
.
.
.
.
Total cost of materials, md.
fuel
.and containers
,
713,239
598,614
574,521
.
.688
,016
693,236
737,100
..
5054
77.
.
.38
.22
9.16
2.41
4.51
.
.
428,
465
Cost of specified materials:
Flour (all kinds)
Sugar
.
But
ter
..
.
Lard
Lard substitutes and other
. 283,
898
60,768
17,118
32,524
238,608
51,002
14,367
27,297
229,004
48,949
13,789
26,198
.
:274,243
58,619
16,512
31,374
.
.
276,
324
59,064
16,638.
31,612
305,969
58,041
17,627
34,083
41.51
7.87
2.39
4.62
193,200
46,320
12,171
22,812
163,759
.39
,247
10,326
19,324
shortenings
.
Con
dens
edand evaporated milk
Powdered milk
..
Yea
st-
•
35,474
13,837
7,917
25,677
29,811
11,613
6,645
21,550
28,611
11,146
6,377
20,683
34,263
13,348
7,637
24,769
34,523
13,449
7,695
24,956
35,590
14,892
8,176
22,141
4.83
.2.
021.11
3.00
25,952
9,338
5,607
21,212
.
5.13
1.85
1.11
4.20
21,980
7,927
4,756
17,996
105 Canning and preserving:
Fruits and vegetables, etc.'
..
.
S
.
.
..
.
S
Total cost of materials, md.
fuel and containers
358,666
237,682
298,969
385,573
355,186
.
462,
062
322,005
.
5268,420
Cost of specified materials:
..
.S
Sugar
S22,022
14,594
15,357
23,674
21,808
27,354
5.92
20,527
6.37
17,098
108 Chewing gum1
..
SS
.•
Total cost of materials, mci.
*
fuel
and containers
.
•
19,908
15,487
17,968
27,168
23,231
16,824
12,599
Cost of specified materials:
Sugar
.
Cor
nsl.rup
S
Flavoring extracts
3,314
587
199
2,618
464
157
2,037
361
.12
2
2,363
419
142
.3,573
.63
3215
3,090
609
286
13.30
2.62
1.23
.2,
187
344
59
.
.13
.00
2.04
35
1,638
25744
0'
'0

Note A to Table 1-3 (Concluded)
Table A-i (Concluded)
1919
1921
1923
1925
1927
.
1929
Percentage
Distribu—
tion 1929.
1931
Percentage
Distribu—
tiort 1931
1933
109 Chocolate and cocoa
productsl
Total cost of materials, mci.
fuel and containers
Cost of specified materials:
Sugar
Evaporated
condensed and
powdered
Butter
112 Confectionery1
Total cost of materials, mci.
fuel and containers
Cost of specified materials:
Sugar
Corn sirup
Flavoring extracts
115 Flavoring extracts and
slrupsl
Total cost of materials, md.
fuel and containers
Cost of specified materials:
Sugar
Corn
suga
r
118
Ice
Cre
am1-
Tot
al c
ost o
f m
ater
ials
, mci
.fu
eland conta.iners
Cost of specifledmaterlals:
Powdered milk
Evaporated and condensed milk
Sugar
Cre
amer
ybutter
Flavors
121
spaghetti, etc.l
Total cost of materials, mci.
fuel and containers
Cost of specified materials:
Flour
101,754
13,208
2,483
1,80
1
252,434
50,5
3718,756
1,918
50,417
11,424
908
116,375
1,117
8,961
7,460
4,096
8,984
25,110
17,8
48
49,1
34
6,37
8
1,199
870
174,072
34,849
12,9
341,
323
45,3
49
10,2
76 816
121,170
l;163
9,330
7,767
4,265
9,354
19,9
64
14,190
60,8
43
7,89
7
1,485
1,077
202,719
40,5
8415
,062
1,541
38,1
77
8,65
1687
145,307
1,39
511,189
9,314
5,115
11,218
16,646
11,8
32
73,5
22
9,54
3
1,79
41,301
205,433
41,1
2815,264
1,56
1
47,064
10,665
847
140,
864
1,352
10,847
9,029
4,958
10,875
27,491
19,541
90,4
23
11,7
37
2,206
1,600
218,373
43,7
1816
,225
1,66
0
51,091
11,577
920
150,602
1,446
11,5
969,654
5,301
11,626
27,434
19,5
00
79,5
49
8,89
2
1,618
1,529
215,
192
41,767
16,501
1,55
4
55,118
12,760
804
155,964
2,219
15,1
2910,877
5,490
12,040
27,336
19,430
11.18
2 •03
1 •
92
19.41
7.67
.72
22.98
1 •45
1•42
9 •
706 •97
71.0
8
12 •
98
2•84
1•62
20.6
47
•19.79
22.35
2•14
.51
5.70
5.85
3.52
7•7
2
50,045
7,395
1,42
2811
144,748
29,8
6910,404
1,141
48,575
10,855
1,039
110,504
567
6,30
16,460
3,889
8,532
20,3
11
14,4
37
41,572
5,396
1,181
673
114,
164
23,563
8,20
890
2
20,333
4,54
443
5
66,3
15 338
3,78
03,879
2,334
5,12
0
20,385
14,4
90
1 The data
as reported were raised to cover the entire industry on the basis of the percentage of the industry that
they
represented:
1929
1931
101
Beverages
.76.0
94.2
102
105
108
Bread and other bakery
Canning
and
pres
ervi
ng,
and
vege
tabl
es,
etc.
Chewing gi.un
products
fruits
90.8
78.8
100.0
85.3
67.6
100.0
109
Chocolate and cocoa products
97.3
100,0
1929
1931
112
115
118
121
Con
fect
Ione
ryFl
avor
ing
extracts and sirups
Ice cream
-
Mac
aron
i,spaghetti, etc.
92.9
93.0
65.9
99.0
96.9
92.4
96.9
no data
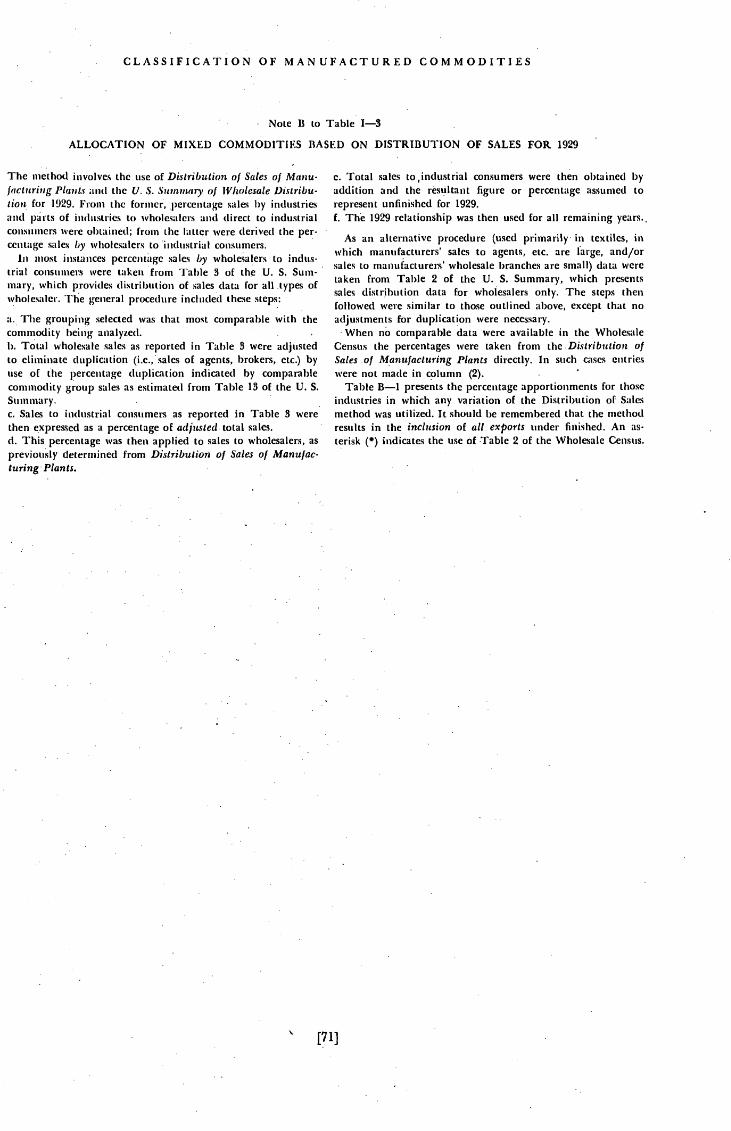
CLASSIFICATION OF MANUFACTURED COMMODITIES
Note B to Table 1—3
ALLOCATION OF MIXED COMMODITIES BASED ON DISTRIBUTION OF SALES FOR 1929
The method involves the use of Distribution of Sales of Man u-facturing Plants and the U. S. Suinmaiy of Wholesale Distribu-tion for 1929. From the former, percentage sales by industriesand parts of industries to wholesalers and direct to industrialconsumers were obtained; from the latter were derived the per-centage sales by wholesalers to industrial consumers.
In most instances percentage sales by wholesalers to indus-trial consumers were taken from Table 3 of the U. S. Sum-mary, which provides distribuLion of sales data for all types ofwholesaler. The general procedure included these steps:
a. The grouping selected was that most comparable with thecommodity l)eing analyzed.b. Total wholesale sales as reported in Table 3 were adjustedto eliminate duplication (i.e.,sales of agents, brokers, etc.) byuse of the percentage (luplication indicated by comparablecommodity group sales as estimated from Table 13 of the U. S.S U inina ry.c. Sales to in(lustrial consumers as reported in Table 3 werethen expressed as a percentage of adjusted total sales.d. This percentage was then applied to sales to wholesalers, aspreviously determined from Distribution of Sales of Manufac-turing Plants.
[71]
e. Total sales to ,industrial consumers were then obtained byaddition and the resultant figure or percentage assumed torepresent unfinished for 1929.f. The 1929 relationship was then used for all remaining years.
As an alternative procedure (used primarily in textiles, inwhich manufacturers' sales to agents, etc. are large, and/orsales to manufacturers' wholesale branches are small) data weretaken from Table 2 of the U. S. Summary, which presentssales distribution data for wholesalers only. The steps thenfollowed were similar to those outlined above, except that noadjustments for duplication were necessary.
When no comparable data were available in the WholesaleCensus the percentages were taken from the Distribution ofSales of Manufacturing Plants directly. In such cases entrieswere not made in column (2).
Table B—i presents the percentage apportionments for thoseindustries in which any variation of the Distribution o Salesmethod was utilized. It should be remembered that the methodresults in the inclusion of all. exports under finished. An as-terisk () indicates the use of Table 2 of the Wholesale Census.

PART I
Table B—I
PERCENTAGE OF SALES TO VARIOUS CHANNELS, 1929
(Entries in columns (1), (2), (4), and (5) are'
percentages of sales .by manufacturing plants; entries in column (3) are per-centages of sales by wholesalers)
FROM DISTRIBU-
TION OF SALES OF
MANUFACTURSNC PLANTS
FROM WHOLESALE CENSUS
SALES TO
INDUSTRIAL
SALES BY CONSUMERS TOTAL.
. WHOLE- THROUGH SALES TO
INDUS- DIRECT TO TO SALERS TO WHOLE- INDUSTRIAL
TRY
NUM-
BER
. INDUSTRIAL WHOLE-
CONSUMERS SALERS
(1) (2)
INDUSTRIAL SALERS CONSUMERS
CONSUMERS (2) X (3) (1) + (4)
(3) (4) (5)
8.1 .. no data 8.1
43.8 .. no data 43.811.7 .. nodata 11.7
6.7 .. no data 6.7
2.3 .. no data 2.37.6 .. no data 7.6
10.6 . no data 10.6
53.8 .. no data 53.865.6 14.4 2.5' .4 66.0
31.2 68.5 41.9' 28.7 62.9 2
38.4 61.6 41.9* 25.8 64.2
38.3 61.5 41.9' 25.8 64.1
46.3 50.9 679' 34.6 82.3 2
61.2 33.6 41.9 14.1 75.335.4 59.2 41.9 24.8 60.2
(same percentages used as for other cotton products)38.3 45.6 35' 1.6 39.951.1 41.1 32.0' 13.2 64.322.6 53.0 47.7 25.3 47.941.0 48.3 42.2' 20.4 61,4
8.0 56.6 .7 .4 8;4
18.3 81.7 47.7 39.0 57.338.3 61.5 5.4 3.3 41.6
4.9 32.5 3.0 1.0 5.9
COMMODITY
107 Cheese113 Corn sirup, sugar, oil and starchi117 Food preparations, n.e.c.121 Macaroni, spaghetti, etc.124 Oleomargarine125 Peanuts, walnuts, etc.132 Vinegar and cider122 Malt 1203 Awnings, tents, etc.216 Osnaburgs, sheetings, drills and ticking
Denims, napped fabrics, etc.Print cloth, lawns, etc.Thread and yarnsPlushes, velvets, etc.Other cotton productsCotton goods made in other industriesCotton tapestries
217 Cotton small wares219 Embroideries234 Knit cloth
Other knit goods235 Lace goods236 Linen woven goods and thread313 Mirror and picture frames
401,2,3,4,5,
6, 8 Converted paper products407 Writing paper501 Bookbinding and blank-book making601 Alcohol, ethyl and distilled liquors605 Bluing
607 Candles
604 Blacking, stains, etc.608 Chemicals, n.e.c.i.609 Cleaning and polishing preparations619 Ink, writing620 Liquors, vinous 1621 Mucilage, paste, etc.631 Soap
628 Perfumes, cosmetics, etc.802 Rubber erasers and rubber bands
Rubber cementJar rings
1008 Pressed and blown glassware (except containers, etc.)1016 Mirrors
1019 Statuary and art goods
1204 Copper, tin and sheet-iron work1211 Needles, pins, hooks and eyes, etc.1303 Ignition apparatus 4
Storage batteries 41601 Artificial and preserved flowers and plants
57.7 33.8 48.5 16.4
25.4 72.8 7.2 5.2 30.6
66.9 20.2 7.2 1.5
36.93 1.6 .6
(same percentages as for soap, Industry 631)
68.4
56.88 57.4
59.5 .. no data 59.523.8 . .. no data 23.861.7 36.6 83.8 30.7 92.4
18.5 .. no data 18.5
5.4 57.1 7.2 4.1 9.5
29.2 66.3 5.8 3.8 38.045.2 42.7 7.2 3.1 48.3
76 78.3 4.4 3.4 11.0
1.2 47.5 3.9 1.9 3.1
(same percentages as for stationery goods, Industry 1643)(same percentages as for mucilages, etc., Industry 621)
38.215.237.165.9
23.251.819.9
16.7
215
58.6
383
31.767.6
633
39.9
no data5.0'2.5
no datano data
32.0'28.234.1 3
8.7 *
38.22.9 18.1
1.0 88.765.923.2
10.1 61.919.1 39.021.7 38.4
33 25.0
[72]
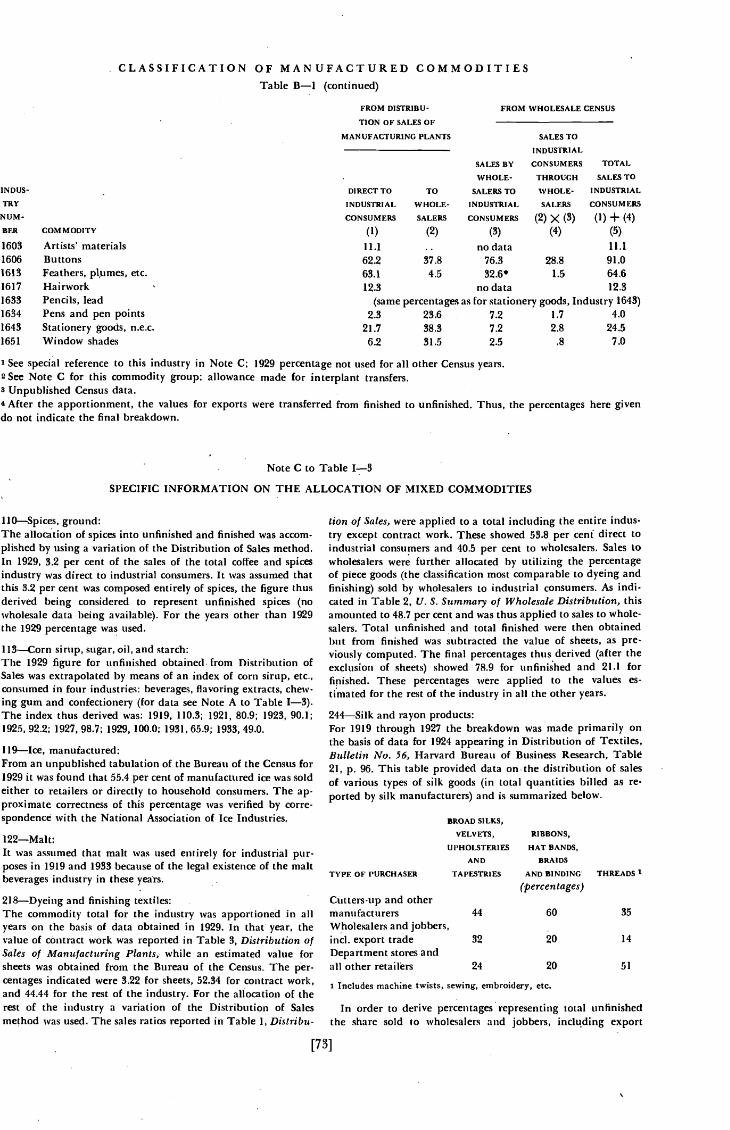
• CLASSIFICATION OF MANUFACTURED COMMODITIESTable B—i (continued)
COMMODITY
Artists' materialsButtonsFeathers, plumes, etc.HairworkPencils, leadPens and pen pointsStationery goous, n.e.c.Window shades
FROM DISTRIBU-
TION OF SALES OF
MANUFACTURING PLANTS
12.3 no data(same percentages as for stationery
2.3 23.6 7.221.7 38.3 7.2
6.2 31.5 2.5
12.3
goods, Industry 1643)1.7 4.0
2.8 24.5.8 7.0
•
Note C to Table 1—3
SPECIFIC INFORMATION ON THE ALLOCATION OF MIXED COMMODITIES
1 10—Spices, ground:The allocation of spices into unfinished and finished was accom-plished by using a variation of the Distribution of Sales method.In 1929, 3.2 per cent of the sales of the total coffee and spicesindustry was direct to industrial consumers. It was assumed thatthis 3.2 per cent was composed entirely of spices, the figure thusderived being considered to represent unfinished spices (nowholesale data being available). For the years other than 1929the 1929 percentage was used.
113—Corn sirup, sugar, oil, and starch:The 1929 figure for unfinished obtained, from Distribution ofSales was extrapolated by means of an index of corn sirup, etc.,consumed in four industries: beverages, flavoring extracts, chew-ing gum and confectionery (for data see Note A to Table 1—3).The index thus derived was: 1919, 110.3; 1921, 80.9; 1923, 90.1;1925, 92.2; 1927, 98.7; 1929, 100.0; 1931, 65.9; 1933, 49.0.
1 19—Ice, manufactured:From an unpublished tabulation of the Bureau of the Census for1929 it was found that 55.4 per cent of manufactured ice was soldeither to retailers or directly to household consumers. The ap.proximate correctness of this percentage was verified by corre-spondence with the National Association of Ice Industries.
122—Malt:It was assumed that malt was used entirely for industrial pur-poses in 1919 and 1933 because of the legal existence of the maltbeverages industry in these years.
218—Dyeing and finishing textiles:The commodity total for the industry was apportioned in allyears on the basis of data obtained in 1929. In that year, thevalue of contract work was reported in Table 3, Distribution ofSales of Manufacturing Plants,. while an estimated value forsheets was obtained from the Bureau of the Census. The per-centages indicated were 3.22 for sheets, 52.34 for contract work,and 44.44 for the rest of the industry. For the allocation of therest of the industry a variation of the Distribution of Salesmethod was used. The sales ratios reported in Table 1, Distribu-
[73]
tion of Sales, were applied to a total including the entire indus-try except contract work. These showed 53.8 per ceni direct toindustrial consumers and 40.5 per cent to wholesalers. Sales towholesalers were further allocated by utilizing the percentageof piece goods (the classification most comparable to dyeing andfinishing) sold by wholesalers to industrial consumers. As indi-cated in Table 2, U. S. Summary of Wholesale Distribution, thisamounted to 48.7 per cent and was thus applied to sales to whole-salers. Total unfinished and total finished were then obtainedbut from finished was subtracted the value of sheets, as pre-viously computed. The final percentages thus derived (after theexclusion of sheets) showed 78.9 for unfinished and 21.1 forfinished. These percentages were applied to the values es-timated for the rest of the industry in all the other years.
244—Silk and rayon products:For 1919 through 1927 the breakdown was made primarily onthe basis of data for 1924 appearing in Distribution of Textiles,Bulletin No. 56, Harvard Bureau of Business Research, Table21, p. 96. This table provided data onthe distribution of salesof various types of silk goods (in total quantities billed as re-ported by silk manufacturers) and is summarized below.
Cutters-up and othermanufacturersWholesalers and jobbers,md. export tradeDepartment stores andall other retailers
BROAD SILKS,
VELvETS,
UPHOLSTERIES
AND
TAPESTRI ES
44 60 35
20 14
24 20 51
i Includes machine twists, sewing, embroidery, etc.
In order to derive percentages representing total unfinishedthe share sold to wholesalers and jobbers, export
INDUS-
TRY
NUM-
FROM WHOLESALE CENSUS
SALES TO
INDUSTRIAL
SALES BY CONSUMERS TOTAL
BER
1603
16061613
1617
163316341643
1651
. WHOLE- THROUGH SALES TO
DIRECT TO TO SALERS TO WHOLE- INDUSTRIAL
INDUSTRIAL WHOLE- INDUSTRIAL SALERS CONSUM ERS
CONSUMERS SALERS CONSUMERS (2) X (3) (1) + (4)
(1) (2) (3) (4) (5)
11.1 .. nodata 11.1
62.2 37.8 76.3 28.8 91.063.1 4.5 32.6* 1.5 64.6
1 See special reference to this industry in Note C; 1929 percentage not used for all other Census years.2 See Note C for this commodity group; allowance made for interplant transfers.3 Unpublished Census data.4 After the apportionment, the values for exports were transferred from finished to unfinished. Thus, the percentages here givendo not indicate the final breakdown.
TYPE OF PURCHASER
RIBBONS,
HAT BANDS,
BRAIDS
AND BINDING'
(percentages)THREADS I

trade, had to be apportioned. This was done on the basis ofdata taken from the Census of Wholesale Distribution in 1929.Table 2 of the U. S. Summary indicated that 66.5 per cent osilk and velvet piece goods were sold by wholesalers to industrial
Lack of more satisfactory data necessitated the appli-cation of this percentage to sales to wholesalers of all the com-modities treated in the above table. Thus it was indicated thatthe percentages of billings representing total unfinished wereas follows:
All the commodities not included above—yarns, fringes andgimps, silk warps and minor silk products—were consideredcompletely unfinished. The percentages were then applied tothe respective value figures in the various Census years, the re-sultant amounts being totaled and subtracted from the corn-inodity total for the industry in order to derive figures repre-senting finished.
In 1929, after a correction for inventory change (On the basis ofthe inventory decrease shown in Table 3 of Distribution of Sales)the usual Distribution of Sales procedure was followed. The salesratios derived for silk and rayon manufactures from Table I,Distribution of. Sales, were 59.9 per cent to wholesalers and 33.2per cent direct to industrial consumers after the inclusion ofinterplant transfers. Sales to wholesalers were further allocatedby utilizing the percentage of sales of piece goods, rayons andpiece goods, silks and velvets by wholesalers to industrial con-sumers. As indicated in Table 2 of the U. S. Summary of Whole.sale Distribution this percentage was 66.2 and it was applied tosales to wholesalers as previously determined. Total unfinishedand consequently total finished were then obtained.
In 1931 and 1933 the same procedure as in the years prior to1929 was followed except that the broad goods percentage waschanged. This change was based on Table 29, p. 52, of Productionund Distribution of Silk and Rayon Broad Goods, Textile Foun-clation and National Federation of Textiles, New York, 1935. Oftotal distribution of broad goods and prints 7 per cent was soldto wholesalers and 70 per cent to cutters-up (industrial consum-ers). When industrial sales of wholesalers were estimated aspreviously total industrial sales were indicated to be 75 per cent.This percentage, together with the previously estimated per.centages for ribbons, etc. and threads, was applied to the respec-tive Census figures for 1931 and 1933.249, 253—Woolen and worsted woven goods except blankets:Distribution ratios were derived from data on woolen andworsted billings for 1924 as given in Distribution of Textiles.After subtracting all billings of blankets and horse blankets, thefollowing percentages were computed from Table 12, p. 62 ofthat volume.
To cutters-up and other manufacturers 76To wholesalers including export trade 21
To retailers 3
Sales to wholesalers were further allocated by using the per.centage of piece goods, woolens and worsted sold by wholesalersto industrial consumers. As indicated in Table 2, U. S. Summaryof Wholesale Distribution, the amount so sold was 47.8 per centand this percentage was then applied to sales to wholesalers.Thus total unfinished was 86 per cent (76 per cent + 47.8 percent of 21 per cent).
This percentage was then applied to all the Census totals.Distribution of Sales data were not used in 1929 because of theconfusion on the part of the reporting manufacturers, of cut-ters-up and wholesalers.
Woolen and worsted yarns for sale:The apportionment of yarns between unfinished and finishedrepresents a rough approximation based on data relating to the
production of hand knitting worsted yarns as revealed in Analysis of Production of Worsted Sales Yarn, Research StudiesVII, Industrial Research Department, University of Pennsylvania. The allocation in 1931 and 1933 is little more than a gues;based on an approximate allowance for the apparent increasehome knitting in these years.
311—Lumber and timber products:Commodity totals were obtained by removing the value of planing mill products made in the industry and the value of otheproducts not belonging to the industry. From these commodititotals were subtracted the estimated values for firewood, pulpwood and lath. The values for firewood and pulpwood wenestimated on the basis of 1929 percentages. In that year firewoocas reported was .15 per cent of the commodity total, and pulpwood was 1.03 per cent. The values for lath were derived b1multiplying the quantities produced by respective average pricesBoth quantities and prices are reported in the various volumeof the Census.
Upon the. subtraction of the figures for firewood, pulpwoocand lath, values representing all other lumber and timber products remained. These were apportioned between unfinished antconstruction materials by the following procedure. In 1928 thequantity of lumber consumed in manufacture (excludingmill products and sash, doors, blinds and general mill work)10,3 17,421 M.ft. b.m.' After adjustment to include boxes, basketscrates, patterns and flasks consumed in non-wood industries orthe basis of 1933 ratios 2 the amount of lumber used in manufacture was raised to 11,530,138 M.ft. b.m. This total was movecfor the various Census years except 1933 by means of an inde,of total lumber production derived from data given in theCensus of Manufactures. The quantities thus obtained for theCensus years were multiplied by the respective average priceper M. bd. ft. of lumber at the mill (also reported in the Census)The following table shows the estimated quantities of lumbeiconsumed in manufacture and the resultant estimated values.
ESTIMATED
AVERAGE VALUE OF
QUANTITY . PRICE, LUMBER CONSUMEE
OF LUMBER ALL LUMBER IN MANUFACTURE
CONSUMED (dollars per (thousands(M.Bd.Ft.) M.Bd.Ft.) of dollars)
1919 11,668,500 30.21 352,5051921 10,123,461 23.47 237,5981923 12,556,320 399,0401925 12,948,345 28.02 362,8131927 11,656,970 25.80 300,7501929 12,452,549 26.94 335,4721931 5,580,587 18.56 100,5761933 5,105,7531 18.55 94,712
1 Taken from Lumber Used in Manufactures, 1933, Table 1, passim,amount used for flooring, sash, frames, doors, etc., having been subtractecfrom the total.
All data relating to 'planing mills having been removed fronthe preceding estimates, it was necessary to estimate the value alumber consumed in independent planing mills. In 1929, 4,860857 M.bd.ft. of lumber was reported in the Census as being consumed by independent planing mills whose aggregate productiorvalue represented 72.7 per cent of the total value of productiorfor the industry. Raised to cover the entire industry, theconsumption figure becomes 6,686,186 M.bd.ft. When multiplieby the average lumber price at mill for 1929, $26.94 per M.bd.ft.this quantity becomes' in terms of value $180,126 thousand.following table indicates the values as estimated for theyears on the basis of an index of the total cost of materials iithe planing mill products industry.
I Lumber Used in Manufacture, 1928, U. S. Dept. of Agriculture ForesSer' ice, Table 1, passim.2 Ibid., 1933, Table 1, passim.
'PART I
Broad silks, etc.Ribbons, etc.Threads
65 (44 + 66.5 of 32)73 (60 + 66.5 of 20)44 (35 + 66.5 of 14)

CLASSIFICATION OF MANUFACTURED COMMODITIES
Value of lumber consumedin independent planing mills(thousands of dollars)Index of cost of materials usedin independent planing millsEstimated value of materials usedin independent planing mills(thousands of dollars)
91.9 135.5 136.2 108.6 100.0 42.5
182,107 165,536 244,071 245,532 195,617 180,126 76,554
There remains one further set of estimates relating to lumberconsumption, i.e., the amount purchased by the wood preservingindustry. In 1933, 1931, 1929 and 1927 it was possible to obtainfor contract work in this industry the value of products beforeand after treatment. In 1933 the value of products before treat-ment was 64.0 per cent of the value after treatment, in 1931, 67.7per cent, in 1929, 68.1 per cent, and in 1927, 63.2 per cent. Thesepercentages were applied to the total value of products (exclud-ing contract work) for the respective years; for the years priorto 1927 the 1927 percentage was used. The resultant estimates of
1. Total value of all other lumberand timber products
2. Unfinished (amount used inall manufacturing industries) 1
3. Construction materials (md. allexports), line (1) — line (2)
lumber purchased by the wood preserving industry in thousandsof dollars were:1919 1921 1923 1925
21,161 30,024 44,956 57,647
1927 1929 1931 1933
71,721 79,628 42,329 19,797
Combination of the above figures for various types of lumberconsumption made possible the apportionment of all other lum.ber and timber products between unfinished and constructionmaterials. This apportionment is given in the following table:
688,067 665,792 568,088 595,226 222,459 155,758
56,216
1 This includes lumber consumed in manufacture, in independent planing mills and in the wood preserving industry.
608—Chemicals, n.e.c.:The figure for finished secured for 1929 by use of Distributionof Sales, was extrapolated for the other Census years by meansof an index of the values of sodium bicarbonate (refined), chlo-roform, hydrogen peroxide and finished coal-tar medicinals.Data for the first three items were available in the Census, for thefourth the Tariff Commission's Census of Dyes and Other Syn-thetic Organic Chemicals (1927, pp. 6—8; 1929, pp. 6—7; 1933, p.3) used. The index thus derived was: 1919, 93.3; 1921, 52.1;1923, 69.5; 1925, 79.6; 1927, 81.7; 1929,100.0; 1931, 103.1; 1933,87.0.
615—Explosives:From Technical Paper 510, pp. 21—22, and Report of investiga-tions 325, p. 5, both publications of the Bureau of Mines, thefollowing percentages of explosives (in terms of quantity) usedin railroad and other construction work were derived: 1933,29.7; 1931, 24.6; 1929, 13.2; 1927, 11.0; 1925, 9.9. These data wereassumed to be representative of value relationships and werethus employed to estimate the values for explosives used as con-struction materials. Prior to 1925, 10%, an approximation basedon the 1925 relationship, was used.
620—Liquors, vinous:It was arbitrarily assumed that, because of the repeal of prohibi-tion in 1933, the value of unfinished was the same as in 1931,and that the rest of the industry was finished.
626—Paints and varnishes:The apportionment of paints and varnishes was based on ap-proximations by Henry A. Gardner, Director of the ScientificSection of the National Paint, Varnish and Lacquer Association(by correspondence). His allocations indicate 25% to unfinished,65% for construction purposes, and 10% to finished.
630—Salt:From Production and Distribution of Salt in the United States
by Primary Producers, U. Tariff Commission (mimeographed),March 1935, pp. 7 and 8, the average quantities (for the five-yearperiod 1929—33) of rock salt and evaporated salt destined fordomestic or household use were ascertained. The percentages(derived from Table 3 of the report) were 9 for rock salt and
28 for evaporated salt. From Table 2 of the same report annualpercentages of domestic to total salt (all types) were taken:1929, 16; 1930, 17; 1931, 19; 1932, 21; 1933, 20; five-year average19%. By deriving the ratios of the annual percentages to thefive-year average and applying them to the five-year averagesfor rock and evaporated salt, the following percentages repre-senting production for domestic use were obtained:
Application of these percentages to the values for rock andevaporated salt as determined by the Bureau of Mines andreported in the Census of Manufactures resulted in the follow-ing values in thousands of dollars:
Rock for domestic useEvaporated for domestic use
Total
The totals of domestic rock and domestic evaporated expressedas percentages of the total values of salt were 19.4 in 1929, 22.5in 1931. These percentages were applied to the total values ofsalt as reported by the Census of Manufactures. Prior to 1929the 1929 percentage was used; in 1933 the 1931 percentage wasapplied.
701, 703, 705—Coke:Based on data from the Minerals Yearbook, 1934, and fromMineral Resources of the U. S., Part Ii, 1931, 1929 and 1922.Actual dollar sales of coke destined for domestic users were
[75]
1921 19231919
101.1
1925 1927 1929 1931 1953
180,126
22.9
41,249
1919 1921 1923
972,375 525,165
555,773 433,158
1925 1927 1929(thousands of dollars)
924,280 840,520
1931
658,627 755,990 268,844
1933
211,974
416,602 92,007 286,213 174,728 90,539 160,764 46,385
RockEvaporated
1929 1931
8 9
24 28
1933
9
29
1929570
4,3014,871
1931
5165,9704,486
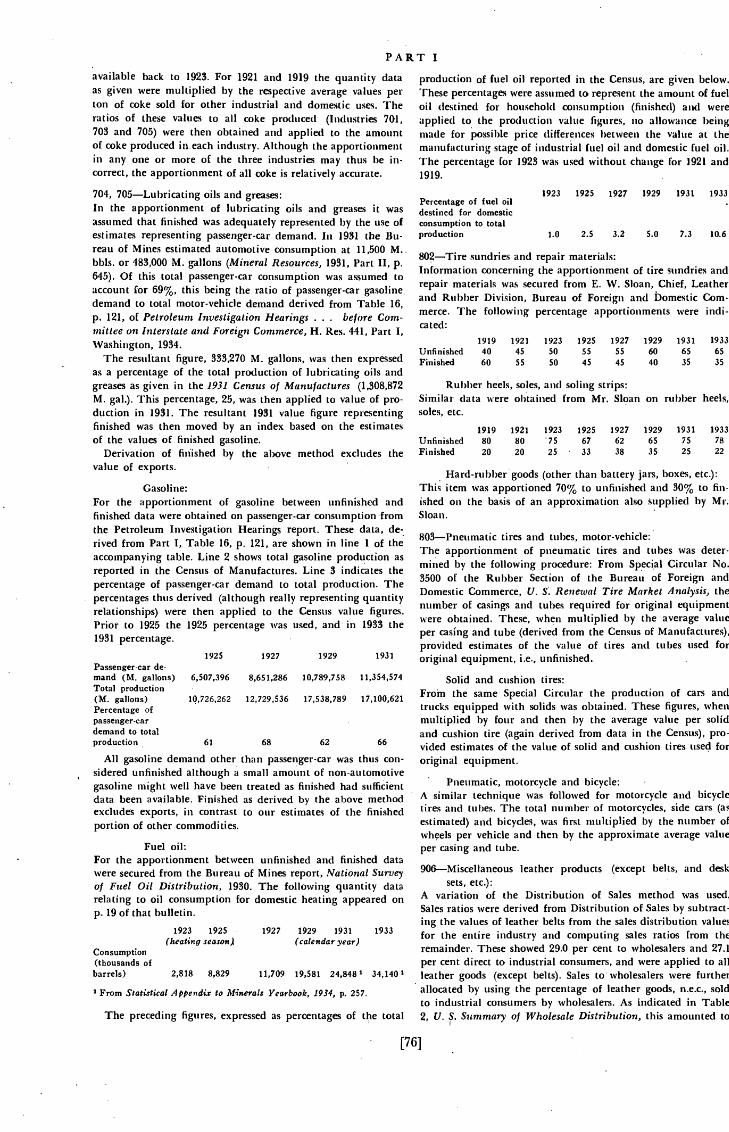
available back to 1923. For 1921 and 1919 the quantity dataas given were multiplied by the respective average values perton of coke sold for other industrial and domestic uses. Theratios of these values to all coke produced (Industries 701,703 and 705) were then obtained and applied to the amountof coke produced ineach industry. Although the apportionmentin any one or more of the three industries may thus be in-correct, the apportionment of all coke is relatively accurate.
704, 705—Lubricating oils and greases:In the apportionment of lubricating oils and greases it wasassumed that finished was adequately represented by the use ofestimates representing passenger-car demand. In 1931 the Bu-reau of Mines estimated automotive consumption at 11,500 M..bbls. or 483,000 M. gallons (Mineral Resources, 1931, Part II, p.645). Of this total passenger-car consumption was assumed toaccount for 69%, this being the ratio of passenger-car gasolinedemand to total motor-vehicle demand derived from Table 16,p. 121, of Petroleum Investigation Hearings . . . before Corn-mittee on Interstate and Foreign Commerce, H. Res. 441, Part I,Washington, 1934.
The resultant figure, 333,270 M. gallons, was then expressedas a percentage of the total production of lubricating oils andgreases as given in the 1931 Census of Manufactures (1,308,872M. gal.). This percentage, 25, was then applied to value of pro-duction in 1931. The resultant 1931 value figure representingfinished was then moved by an index based on the estimatesof the values of finished gasoline.
Derivation of finished by the alxve method excludes thevalue of exports.
Gasoline:For the apportionment of gasoline between unfinished andfinished data were obtained on passenger-car consumption fromthe Petroleum Investigation Hearings report. These data, de-rived from Part I, Table 16, p. 121, are shown in line 1 of theaccompanying table. Line 2 shows total gasoline production asreported in the Census of Manufactures. Line 3 indicates thepercentage of passenger-car demand to total production. Thepercentages thus derived (although really representing quantityrelationships) were then applied to the Census value figures.Prior to 1925 the 1925 percentage was used, and in 1933 the1931 percentage.
1927Passenger-car de-mand (M. gallons) 6,507,396 8,651,286 10,789,758 11,354,574Total production(M. gallons) 10,726,262 12,729,536 17,538,789 17,100,621Percentage ofpassenger-cardemand to totalproduction 61 68 62 66
All gasoline demand other than passenger-car was thus con-sidered unfinished although a small amount of non-automotivegasoline might well have been treated as finished had sufficientdata been available. Finished as derived by the above methodexcludes exports, in contrast to our estimates of the finishedportion of other commodities.
Fuel oil:For the apportionment between unfinished and finished datawere secured from the Bureau of Mines report, NatiOnal Surveyof Fuel Oil Distribution, 1930. The following quantity datarelating to oil consumption for domestic heating appeared onp. 19 of that bulletin.
production of fuel oil reported in the Census, are given below.These percentages were assumed to represent the amount of fueloil destined for household consumption (finished) and wereapplied to the production value figures, no allowance beingmade for possible price differences between the value at themanufacturing stage of industrial fuel oil and domestic fuel oil.The percentage for 1923 was used without change for 1921 and1919.
1923 1925 1927 1929 1931 1933Percentage of fuel oildestined for domesticconsumption to totalproduction 1.0 2.5 3.2 5.0 7.3 10.6
802—Tire sundries and repair materials:Information concerning the apportionment of tire sundries andrepair materials was secured from E. W. Sloan, Chief, Leatherand Rubber Division, Bureau of Foreign and bomestic Com-merce. The following percentage apportionments were indi-cated:
1919 1921 1923 1925 1927 1929 1931 1933Unfinished 40 45 50 55 55 60 65 65Finished 60 55 50 45 45 40 35 35
Rubber heels, soles, anti soling strips:Similar (lata were obtained from Mr. Sloan on rubber heels,soles, etc.
Hard-rubber goods (other than battery jars, boxes, etc.):This item was apportioned 70% to unfinished and 30% to fin-ished on the basis of an approximation also supplied by Mr.S loan.
803—Pneumatic tires and tubes, motor-vehicle:The apportionment of pneumatic tires and tubes was deter-mined by the following procedure: From Special Circular No.3500 of the Rubber Section of the Bureau of Foreign andDomestic Commerce, U. S. Renewal Tire Market Analysis, thenumber of casings and tubes required for original equipmentwere obtained. These, when multiplied by the average valueper casing and tube (derived from the Census of Manufactures),provided estimates of the value of tires and tubes used for
1931 original equipment, i.e., unfinished.
Solid and cushion tires:From the same Special Circular the production of cars andtrucks equipped with solids was obtained. These figures, whenmultiplied by four and then by the average value per solidand cushion tire (again derived from data in the Census), pro-vided estimates of the value of solid and cushion tires used fororiginal equipment.
Pneumatic, motorcycle and bicycle:A similar technique was followed for motorcycle and bicycletires and tubes. The total number of motorcycles, side cars (asestimated) and bicycles, was first multiplied by the number ofwheels per vehicle and then by the approximate average valueper casing and tube.
906—Miscellaneous leather products (except belts, and desksets, etc.):
A variation of the Distribution of Sales method was used.Sales ratios were derived from Distribution of Sales by subtract-ing the values of leather belts from the sales distribution valuesfor the entire industry and computing sales ratios from theremainder. These showed 29.0 per cent to wholesalers and 27.1per cent direct to industrial consumers, and were applied to allleather goods (except belts). Sales to wholesalers were furtherallocated by using the percentage of leather goods, n.e.c., soldto industrial consumers by wholesalers. As indicated in Table2, U. S. Summary of Wholesale Distribution, this amounted to
1933
[76]
PART I
1919 1921 1923 1925Unfinished 80 80 75 67Finished 20 20 25 33
1927 1929 1931 193362 65 75 78
38 35 25 22
1925 1929
1923 1925(heating season)
Consumption(thousands ofbarrels)
1927 1929 1931(ca(endar year)
2,818 8,829 11,709 19,581 24,8481 34,1401
1 From Statistical Appendix to M-inerals Yearbook, 1934, p. 257.
The preceding figures, expressed as percentages of total

CLASSIFICATION OF MANUFACTUREDCOMMOD1TIES6.9 per cent. Total unfinished was then obtained by totaling allsales to industrial consumers. Total finished for miscellaneousthen represented total sales minus unfinished and minus salesalready treated as finished, desk sets, etc. The final 1929 per-centages as used for the apportionment of miscellaneous were32.7 to unfinished and 67.3 to finished.
1648—Brake linings and clutch facings: See note forIndustry 1407.
1002—Cement:The value of cement was apportioned between unfinished andconstruction materials on the basis of the amount of cementconsumed in making concrete products as reported for 1929in the Census of Manufactures. This item was estimated for allyears except 1929 on the basis of the 1929 percentage relation-ship, 46.6, to total materials consumed in the concrete productsindustry.
1008, 1009—Plate glass:For the apporiionment of plate glass between unfinished andconstruction materials quantity percentages representing thepercentage of plate glass production consumed by the automo-bile industry were used. These were obtained from Facts andFigures of the Automobile Industry.
1919 1921 1923 1925 1927 1929 1931 1933
(1921 30 53 53 63 73 60 40
used)
1101—Bolts, nuts, washers, and rivets:These data were taken from the special tables appearing in theCensus reports for the steel works and rolling mill industry(1112).
For the apportionment between unfinished and constructionmaterials an approximation was used. The values of railroadspikes, plus those of railroad, boiler [not listed separately],bridge and structural bolts were assumed to represent construc-tion materials. In 1933, the 1931 percentage was used, while in1927 and 1925 the values of railroad, boiler, etc. were estimatedon the basis of the percentage, 22.5, that the 1929 figure was ofthe total production of bolts, nuts, etc. Prior to 1925 the com-modity totals were apportioned as in 1925, 32.2 per cent toconstruction materials, and 67.8 per cent to unfinished.
1109—Vehicle hardware other than locks: See note for Indus-try 1407.
1112, IllS—Cut and wrought nails, spikes . -
These data include the production in all For cut andwrought nails, etc. the figures were partially estimated prior to1925. In that year the value of these commodities produced inestablishments connected with rolling mills was 24.1 per centof the total value. Thus in 1923, 1921 and 1919 the values re-ported for rolling mills were raised to represent total produc-tion on the basis of the preceding percentage.
Lack of adequate distribution data necessitated the use ofthe bolt, nut, etc. percentages (see 1101) for the apportionmentbetween unfinished and construction materials;
1119, 1121—Heating apparatus . . . stoves:
From Table 13, p. 27, of the Census of Construction, 1930, thecost to contractors of heating and ventilating equipment andsupplies was obtained. Since the Construction Census isably deficient in coverage, the cost figure as reported was mul-tiplied by 1.2064, the ratio of the total volume of constructionin 1929 as estimated in National Income, 1929—32, Senate Docu-ment No. 124, 73d Congress, 2d Session (see Ch. IX) to theCensus figure for total construction. The resultant figure was
assumed to represent the value of all heating equipment, etc.
used as construction material. Expressed as a percentage ofthe total value of heating equipment derived from the Census
[77}
(the data presented in the mixed group of Industries 1119and 1121, plus the values of electric domestic ranges, and elec-tric water heaters as shown under Industry 1303) it amountedto 44.3. The remainder, 55.7, was assumed to represent finished,and these percentages were then applied to the value totals forall years.
1126, 1127—Nails, bi-ads, spikes, tacks and staples, all industries:Lack of adequate sales distribution data necessitated using the
percentage apportionments derived for bolts, nuts, etc. (In-dustry 1101), given below.
1919 1921 1923 1925 1927 1929 1931 1933678 678 67.8 67.8 67.5 70.0 57.4 57.0
32.2 32.2 32.2 32.2 32.5 30.0 42.6 43.0
1128—Wrought pipe, welded, heavy riveted and seamless:For the apportionment between unfinished and constructionmaterials all boiler tubing and mechanical tubing were treatedas unfinished. Prior to 1927 the values for unfinished were esti-
mated on the basis of the 1927 percentage of the total, 13.9.
1201—Motor-vehicle accessories and parts: See note for Indus-try 1407.
1219—Stamped automotive parts and accessories: See note forIndustry 1407.
1303—Incandescent-filanient lamps:The apportionment between unfinished and finished is basedon information given by the Incandescent Lamp Department ofthe General Electric Company. Correspondence with this de-
partment revealed that in 1931, 37.5 per cent of all incandescentlamps were estimated as sold for household use (finished) andin 1930, 35.6 per cent. For 1929 and all prior Census years house-hold lamps were assumed to be 35 per cent of the total. For 1933,the 1931 percentage was used.
Domestic ranges and water heaters: See note for Indus-tries 1119 and 112L
Loud speakers, transformers and miscellaneous radio
parts:
The apportionment of loud speakers was based on the per-centage of quantities sold at retail (as reported in the annualstatistical issues of Radio Retailing) to total number produced,except in. 1931 when an estimate obtained by correspondencewith the Department of Commerce was used. Thus, in 1923, 80%was finished, in 1925, 70%; in 1927, 57%; in 1929, 24% and in1931 and 1933, 2%. The same percentages were applied to trans-formers and no miscellaneous parts.
Radio tubes:The apportionment for all years was based on the 1931 Censusdata which indicated that 45.2 per cent of total tube protuc-tion was sold as initial equipment, i.e., unfinished.
Automotive generators, etc: See note for Industry 1407.
1407—Motor-vehicle bodies and parts:The apportionment of automotive equipment, parts and ac-cessories was difficult, because the inadequacy of the availablesales distribution data made the usual method of working for-ward by use of Distribution of Sales etc. unsatisfactory. A methodthat involved working backward from retail sales was substi-tuted. From the Retail Census, 1929, it was possible to derivetotal retail sales of automobile parts and accessories and tiresand tubes. This total amounted to $1,470,633 thousand and couldnot be divided between parts .. - and tires and tubes on thebasis of available retail commodity data because of indeter-minate overlapping.
Hence, the next step was to estimate the retail sales value oftires and tubes. This was done by the application of successivemark-ups to the manufacturers' value of finished tires and tubesas previously estimated (see note for Industry 803). The retail
UnfinishedConstructionmaterials
Percentageconsumed by auto-mobile industry
value obtained by use of the mark-ups was $718,916 thousand(see Table 111—4, for the derivation). This figure was thensubtracted from the total retail sales of parts and accessoriesand tires and tubes as determined above.
The resultant figure, $751,717 thousand, was assumed to repre-sent retail sales of parts and accessories. To translate the retailfigure into manufacturers' value an approximate spread of 45%was utilized (based on examination of available data, wholesaleand retail expense ratios, etc.).1 Thus, in terms of manufac-turers' prices, the. value of finished automobile parts and acces-sories in 1929 was $407,586 thousand.
Our next problem was the division of the preceding totalamong the nine groups of products (belonging to seven indus-tries) that constituted various kinds of automotive parts andaccessories. Closely connected with this problem was the deriva-tion of figures for the years other than 1929. The grand total ofthe nine groups of products (inclusive of both unfinished andfinished) amounted to $1,915,690 thousand. Of this total, $407,-586 thousand represented finished. In order to move this figurefor finished, three indexes given in the Survey of Current Busi-ness were utilized. These indexes represented accessory ship-ments to wholesalers, shipments of replacement parts and ofservice equipment. The separate indexes were weighted equallyas of January 1925 and combined, the resultant summary indexwith 1929 as a base being as follows:
1925 1927 1929 1931 1933109 103 100 67 56.
By means of this index, values for finished were obtainedback to 1925. Prior to 1925 a constant percentage based on therelationship of the 1925 finished estimate to the 1925 total pr&duction of all parts, accessories etc. was used, this percentage be-ing applied to the total production data in the earlier years. Itthen merely remained to apportion the finished total among thenine groups of products. Three of the groups, automobile skidchains, storage batteries and ignition apparatus, were treatedseparately. Skid chains were considered entirely finished; whilethe value of finished storage batteries and ignition apparatuswas first estimated in 1929 by the Distribution of Sales methodand then estimated for the other years by use of the 1929percentages. The remainder of total finished (after subtrac-tion of chains, batteries and ignition apparatus) was appor-tioned among the six remaining groups of products on the basisof the relative production in each Census year. Although such
In actuality a spread of 45.2371% was used. The resultant manufac-turers' value was then divided by 101 per cent in order to allow for a1% transportation charge. Such decimal accuracy in computation wasrendered necessary because of minor revisions in the basic data. Sincea number of dependent data had been calculated before the revision, itwas decided to vary the spread (originally exactly 45%) rather thanattempt a laborious recalculation of the dependent data.
an apportionment may be inaccurate in its application to asingle industry, it does not affect the estimated total.
1409—Motorcycle and bicycle parts:The apportionment was made by means of a variation of theDistribution of Sales method. The industrial sales for the entireindustry, 13.8 per cent of the commodity total as determinedfrom Distribution of Sales, were assumed to represent unfinishedparts. The 1929 figure thus calculated was 42.0 when expressedas a percentage of parts alone. This percentage was utilized forthe other years.
1612—Rhinestone ornaments:All rhinestone ornaments except those sold to retailers weretreated as unfinished. Unpublished Census data indicated 44.6%sales to retailers.
Miscellaneous articles:First the Distribution of Sales method was applied to the com-modity total for the industry. Of total sales 40.6% were to whole-salers and 14.8% direct to industrial consumers. As indicated inTable 2, U. S. Summary of Wholesale Distribution, 1.6% ofnovelties was sold to industrial consumers by wholesalers. Thispercentage was applied to sales to wholesalers. Thus total un-finished and consequently total finished were obtained for theentire industry. From these totals the data treated separately(cigar lighters, greeting cards, rhinestone ornaments, and desksets, etc.) were subtracted. After all such adjustments the 1929percentages as derived for application to the miscellaneousgroup, unfinished and 79.7 finished, were applied in allyears.
1620—Instruments, professional and scientific:From unpublished Census tabulations it was ascertained that23.4% of total sales was to manufacturers for incorporation inmachines, etc. in 1929. This percentage was used for all years.
1628—Lapidary work:Only lapidary work sold direct to retailers (4.5% according toDistribution of Sales) was treated as finished. This percentagewas used for all years.
1635—Phonographs not reported in detail:During the years in which this item was reported, the data wereapportioned between unfinished and finished on the basis of theproportionate division of the rest of the industry. The percent-ages for unfinished were 1927, 7.6; 1925, 4.8; 1923, 7.9; 1921, 5.3;1919, 7.1.
1636—Films, slides, sensitized cloth and paper:The apportionfrtent between unfinished and finished was madeon the basis of a confidential trade estimate.
PART I
[78]
Table I—4
OUTPUT OF FINISHED COMMODITIES BY MAJOR AND
MINOR COMMODITY GROUPS
CENSUS OF MANUFACTURES YEARS, 19 19-1933
The entries in this table are the commodities marked F in Table I—i andthose designated as finished in Table I—3. The output values, at pricescharged by the producing establishments, are given for the specific commodi-ties by minor commodity groups and subgroups according to the order indi•cated in the classification provided in Note A to Table I—i. Within eachgroup or subgroup the order of the specific commodities follows the cor-responding 1929 Census industry numbers.
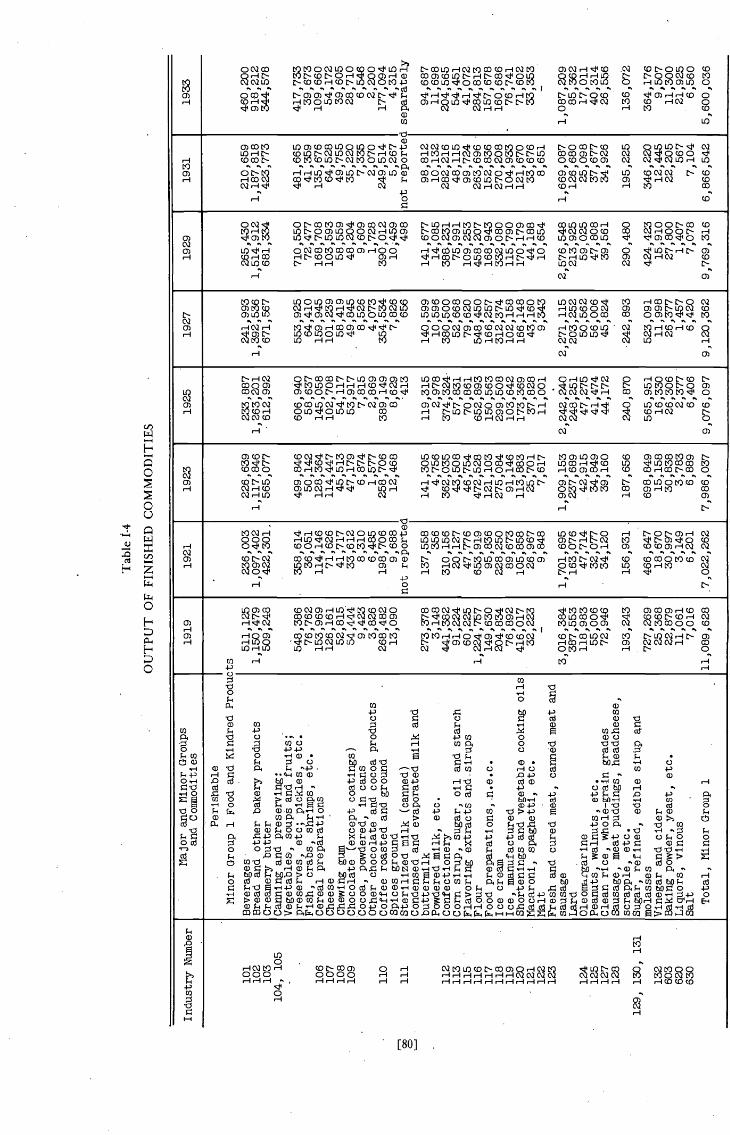
Tab
le 1
-4
OU
TPU
T O
F FI
NIS
HE
D C
OM
MO
DIT
IES
Indu
stry
Num
ber
Naj
or a
nd. ?
linor
Gro
ups
and
Commodities
1919
1921
1923
1925
1927
1929
1931
1933
Perishable
Nirior Group 1 Food and Kindred Products
101
Beverages
511,125
236,003
226,639
233,887
241,993
265,430
210,659
460,200
102
Bread and other bakery
prod
ucts
1,150,479
1,097,402
1,117,846
1,263,201
1,392,536
1,514,912
1,187,818
918,212
103
Creamery butter
509,248
422,301.
565,077
612,992
671,567
681,334
423,773
344,578
104, 105
Canning
and.
preserving:
Vegetables, soups and fruits;
-
-pr
eser
ves,
etc; pickles, etc.
548,386
358,614
499,846
606,
940
553,925
710,
550
481,665
417,733
Fish, crabs, shrimps, etc.
76,762
36,051
50,142
58,637
64,410
72,477
41,359
39,673
106
Cereal preparations
153,969
114,146
128,364
145,058
159,945
168,708
135,676
109,660
107
Cheese
-12
6,16
171,626
114,447
102,708
101,239
103,593
64,528
54,172
108
Chewing gum
52,815
41,717
45,513
54,117
58,419
58,559
49,755
39,605
109
Chocolate (except coatings)
54,444
33,612
47,179
53,917
49,845
48,204
35,2
2028,710
Cocoa, powdered, in cans
9,423
8,31
06,874
7,815
8,526
9,609
7,335
6,54
6O
ther
chocolate and cocoa products
3,826
6,485
1,577
2,869
4,073
1,728
2,070
2,200
110
Coffee roasted and ground
268,482
198,706
258,706
389,149
354,534
390,
012
249,514
177,
094
Spices ground
13,090
9,688
12,468
8,629
7,826
10,459
5,267
4,315
111
Sterilized. milk (canned)
not reported.
-413
656
498
not reported separately
Condensed and. evaporated milk and
buttermilk
273,378
137,558
141,305
119,315
140,599
141,677
98,812
94,687
Powdered milk, etc.
3,148
356
4,756
2,978
10,596
14,085
10,132
11,698
112
Confectionery
441,382
310,156
362,035
374,324
380,
500
388,231
282,216
204,565
113
Corn sirup, sugar, oil and starch
91,224
20,1
2743,508
57,831
52,668
75,991
48,115
54,451
115
Flavoring extracts and .sirups
60,225
47,7
7646,754
70,861
79,620
109,253
99,724
41,0
72116
Flour
1,224,757
653,919
472,528
652,893
548,450
458,
207
263,
696
284,813
117
Food preparations, n.e.c.
149,630
95,836
121,103
150,563
166,
257
168,943
152,836
157,678
118
Ice cream
204,834
228,250
275,084
299,508
312,374
332,080
270,208
160,686
119
Ice, manufactured
76,892
89,673
91,146
103,642
102,158
115,790
104,933
-76
,741
120
Shor
teni
ngs
and vegetable cooking oils
416,017
105,858
113,883
173,369
166,148
170,179
121,670
71,602
-12
1Nacaroni, spaghetti, etc.
32,223
26,967
25,701
37,828
43,160
44,1
8833
,676
33,353
122
Malt
—9,
848
7,61
711,001
9,343
10,6
548,651
123
Fres
hand cured meat, canned meat and
saus
age
3,016,384
1,701,695
1,909,153
2,242,240
2,271,115
2,576,548
1,669,087
1,087,209
Lard
387,
553
163,076
237,689
248,
251
203,252
213,925
126,680
85,362
124
Ole
omar
gari
ne118,983
47,714
42,915
47,275
50,562
59,025
25,0
9817,011
125
Pean
uts,
walnuts, etc.
55,006
32,077
34,849
41,4
7456,006
47,808
37,677
40,314
127
Clean rice, whole-grain grades
72,946
34,120
39,1
6044,172
45,8
2439
,561
34,926
26,556
128
Sausage, meat puddings, headcheese,
scrapple, etc.
193,243
156,931 -
187,
656
240,870
242,893
290,480
195,225
136,072
129, 130,
131
Sugar, refined, edible sirti.p
molasses
727,269
466,647
698,849
565,951
523,091
424,423
346,
220
364,
176
132
Vinegar and cider
25,368
18,6
7015,158
16,330
11,998
15,910
12,445
9,507
603
Baking
pow
der,
yeast, etc.
22,879
30,997
30,838
26,306
26,377
27,800
22,205
11,300
620
Liq
uors
,vinous
11,061
3,149
3,783
2,377
1,457
1,40
756
721
,925
630
Salt
7,016
6,201
6,889
6,40
66,
420
7,078
7,104
6,560
Total, Minor Group 1
11,089,628
.7,022,262
7,986,037
9,076,097
9,120,362
9,769,316
6,866,542
5,600,036
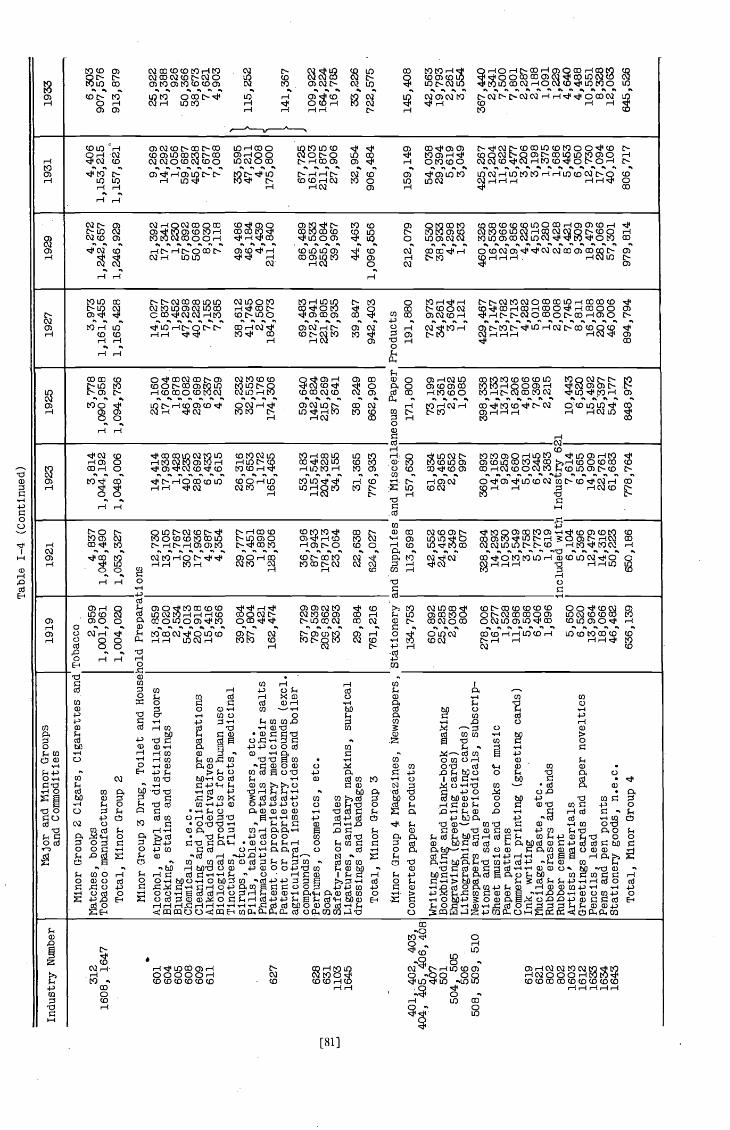
Table 1—4 (Continued)
Minor Group 2 Cigars, Cigarettes and Tobacco
Matches, books
Tobacco manufactures
Total, Minor Group 2
Industry Number
Major and llinor Groups
and Commodities
1919
1921
1923
1925
1927
1929
1931
1933
312
1608, 1647
601
604
605
608
609
611
627
628
631
1103
1645
401,
402,
403
404,
406,
468
501
504, 505
506
508, 509, 510
619
621
802
802
1603
1612
1633
1634
1643
2,959
1,001,061
4,837
1,048,490
3,814
1,044,192
1,004,020
1,053,327
1,048,006
Minor Group 3 Drug, Toilet and Household Preparations
Alcohol, ethyl and distilled liquors
Blacking, stains and dressings
Bluing
Chemicals, n.e.c.
Cleaning and polishing preparations
Alkaloids and derivatives
Biological products for human use
Tinctures
fluid extracts, medicinal
sirups,
Fills, tablets, powders, etc.
Pharmaceutical metals and their salts
Patentor proprietary medicines
Patent or proprietary compounds (excl.
agricultural insecticides and boiler
compounds)
Perfumes, cosmetics, etc.
Soap
Safety—razor blades
Ligatures, sanitary napkins, surgical
dressings and bandages
13,859
18,020
2,534
54,013
20,918
15,416
6,366
39,084
37,804
421
162,474
37,729
79,539
209,862
33,293
29,884
12,730
13,105
1,767
30,162
17,936
4,987
4,354
29,777
30,451
1,898
128,306
36,196
87,943
178,713
23,064
22,638
14,414
17,938
1,428
40,235
28,692
6,433
5,61
5
26,316
30,653
1,172
165,465
53,183
115,541
204,328
34,155
31,365
Total, Minor Group 3
761,216
624,027
776,933
Minor Group 4 Magazines, i'Jewspapers,
Stationeryand Suppifes
and Fliscell
Converted paper products
134,753
113,698
157,630
Writing paper
Bookbinding and blanic—book making
Engraving (greeting cards)
Lithographing (greeting cards)
Newspapers and periodicals, subscrip-
tions and sales
Sheet music and books of music
Paper patterns
Commercial printing (greeting cards)
Ink, writing
Muc
ilage
,paste, etc.
Rubber erasers and
band
sRubber cement
Artists' materials
Greetings cards and paper novelties
Pencils, lead
Pens and
pen
points
Stationery goods, n.e.c.
60,892
25,285
2,038
804
278,006
16,277
1,528
11,986
5,586
6,406
1,896
5,650
6,520
13,964
18,066
46,482
42,552
24,456
2,34
9807
328,284
14,293
10,530
13,549
3,758
5,773
1,619
included with
6,104
5,396
12,479
14,316
50,223
61,834
29,465
2,652
997
360,893
14,163
9,259
14,680
5,031
6,245
2,38
3Industry
7,614
6,565
14,909
22,761
61,683
Total, Minor Group 4
636,139
650,186
778,764
3,778
1,090,958
1,094,736
25,160
17,604
1,878
46,082
29,698
6,337
4,259
30,232
32,553
1,176
174,306
59,640
142,824
215,269
37,641
38,249
862,908
ineous Paper
171,800
73,199
31,361
2,692
1,085
398,338
14,133
13,713
16,206
4,806
7,396
2,215
1Q,443
6,520
15,492
25,397
54,177
848,973
3,973
1,161,455
1,165,428
14,027
15,837
1,452
47,298
40,228
7,155
7,385
38,612
41,745
2,580
184,073
69,483
172,941
221,805
37,935
39,847
942,403
Products
191,880
72,973
34,261
3,604
1,121
429,467
17,1
4713,782
17,713
4,282
5,010
1,888
2,008
7,745
8,811
16,188
20,908
46,006
894,794
4,272
1,242,657
1,246,929
21,392
17,341
1,230
57,8
9250,068
8,030
7,118
49,486
46,184
4,43
9211,840
86,489
195,533
255,084
39,967
44,463
1,09
6,55
6
212,079
78,530
38,933
4,298
1,263
460,326
16,538
12,966
19,856
4,226
4,515
2,280
2,428
8,421
9,309
18,479
28,066
57,301
979,814
4,406
1,153,215
9,269
14,292
1,056
59,687
45,238
7,67
77,088
33,595
47,211
4,008
175,800
67,725
161,103
211,875
27,906
32,954
906,484
159,149
54,038
29,394
5,619
3,049
425,267
12,204
11,622
15,477
3,206
3,198
1,375
1,686
5,463
6,050
12,730
17,094
40,106
806,717
6,303
907,576
913,879
25,922
13,388
926
50,366
38,673
7,621
4,903
115,252
141,367
109,922
164,224
16,7
85
33,226
722,
575
145,408
42,563
19,793
2,261
3,554
367,
440
2,341
7,500
7,801
2,287
2,188
1,091
1,229
4,640
4,48
810,551
8,328
12,0
63645,526

Table 1—4 (Continued)
Industry Number
Major and Minor Groups
and Commodities
1919
1921
1923
1925
1927
1929
1931
1933
Minor Group 5 Fuel and
Lig
htin
gProducts
Fuel and Lighting Products, Manufactured and
Petr
oleu
mProducts
Selaldurable
Minor Group 7 Dry Goods and Notions
Firewood
Matches, other than book
Candles
Coke
Fuel,
briq
uette
sand boulets
Illuminating oils
Lubricatiiig oils and greases
Gasoline
Fuel oils
Total, Minor Group 5a
Minor Group 6 MIscellaneous Perishable
aCaskets, Coffins, etc.
Caskets, coffins, burial cases, etc.
bAll Other Miscellaneous Perishable
Animuniti on
Fireworks
Dry batteries:
6-inch
Incandescent—fl lament lamps
Phonograph
need
les
Film
s, s
ensi
tized
clo
th a
nd p
aper
,sl
ides
and plates
Total, Minor Group Gb
Total, Major Group of Perishable
Commodities
00 N.,
311
312
607
701,
703
, 705
702
705
704,
705
305
602
615
1303
1303
1635
1636 21
6
217
218
219
221
234
235
236
242
244
246
1,42
015
,537
3,23
97,
206
2,359
235,
663
47,2
5841
4,71
93,181
730,582
64,237
92,9
674,
630
17,8
0620
,176
1,60
9
17,6
16154,804
14,440,626
120,968
45,1
09
208,
582
90,028
9,058
12,433
4,32
426
,163
30,3
785,192
5,45
421
,935
15,016
4,490
7,228
8,93
318
4,40
58,953
768
25,3
952,
342
8,532
3,25
815
1,59
557
,828
512,
810
3,77
376
6,30
1
53,8
69
22,9
994,
727
10,5
6020,905
1,13
4
14,1
5374,478
10,244,450
74,6
4626
,868
143,250
47,5
705,221
4,570
1,305
16,6
7225,950
5,52
33,
522
16,6
6811,665
3,852
4,650
10,003
159,
348
9,52
4
1,36
720
,025
2,841
24,3
346,299
146,
942
60,316
534,
807
3,45
780
0,38
8
64,1
89
36,6
224,
977
9,055
25,1
881,465
14,319
91,6
26
11,545,943
106,
140
49,3
47
213,
199
71,5
0711,773
9,187
2,875
25,202
34,3
786,
087
3,87
024
,196
19,3
185,268
5,718
10,634
206,
735
10,4
97
1,24
319
,832
2,93
630
,762
6,78
8161,881
83,944
743,
124
12,2
241,
062,
734
69,3
22
29,5
316,
031
12,3
1625
,745 961
15,4
859O
,069
13,104,839
93,3
0638
,840
178,549
64,843
12,4
076,
319
2,15
023,833
38,306
6,346
4,59
819
,617
22,783
4,718
5,312
9,389
219,
232
10,945
975
20,8
723,
069
32,894
8,093
147,925
80,8
3571
2,96
014
,623
1,02
2,24
6
74,4
69
30,9
345,
885
9,28
730,777
1,32
2
17,9
8896
,193
13,315,895
87,858
40,7
05
162,
719
53,1
1313,434
3,137
3,94
622
,190
38,074
6,60
64,524
19,8
4012,749
3,43
54,534
7,91
7197,635
11,3
92
1,08
916
,079
3,27
846,798
10,1
81164,836
107,
573
949,370
19,2
321,
318,
436
85,1
74
31,686
6,58
48,
250
29,8
621,
972
20,364
98,7
18
14,594,943
79,1
4238
,093
152,083
51,409
12,4
716,
094
none
r23
,381
43,7
865,
402
3,88
624,393
15,3
745,127
4,599
8,443
189,
207
12,279
411
14,067
2,474
48,256
5,24
172
,743
62,1
81548,715
19,824
773,
912
68,650
20,8
143,
722
3,680
26,438.
434
15,590
70,678
10,650,604
38,586
21,9
29
93,1
8624
,962
4,91
08,
154
ported
sepa
14,3
8830,211
4, 2
352,
789
18,914
9,027
3,581
3,079
6,059
81,370
7,246
Osnaburgs, sheetings, etc.
Denims, napped fabrics, etc.
Print cloth, lawns, poplins, voiles,
crepes, ginghams, shirtings, etc.
Thread
and
cotto
n ya
rns
Plus
hes,
velvets, etc.
Other cotton products
Cotton
good
s m
ade
in o
ther
Ind
ustr
ies
Cot
ton
smal
l war
esD
yein
gand finishing textiles
Embroideries
Flag
s an
d ba
nner
sK
nit C
loth
Oth
er k
nit g
oods
Lace
good
s(except curtains)
Linen woven goods and thread
Regalia, badges and emblems
Silk and rayon products
Stamped art goods for enthroldering
•323
20,0
701,893
52,8
203,337
78,4
6157,207
504,
696
27,147
74,5,974
57,7
41
21,318
2,520
2,84
418
,693345
10,565
56,285
8,74
2,01
6
48,120
27,705
98,438
28,5
553,869
7,424
atel
y 13,6
0526,156
2,553
2,13
917,453
10,909
3,166
2,765
3,020
53,3
755,524

Table 1-4 (Continued)
Indu
stry
Num
ber
and
Min
or G
roup
san
d C
omm
oditi
es19
1919
2119
2319
2519
2719
2919
3119
33
249,
253
1211
1601
1606
1612
1613
1617
226
802
906
906
908
1103
1605
1609
1612
1637
1649
208
211
213
223
224,
905
228
229
230
234
243
245
Bias bindings for notion trade
Woolen and worsted woven goods (ex-
cept blankets)
and
wor
sted
yarns
Needles, pins, etc.
Artificial and preserved flowers
Buttons
Fanc
yand miscellaneous articles
Feathers, plumes, etc.
Hairwork
Total, Minor Group 7
Minor Group 8 Personal Furnishings
Han
dker
chie
fsB
athi
ng c
aps
Drugglsts'andmedlcal sundries (ex-
cept rubber gloves)
Rubber gloves
Hard—rubber goods, other than battery
jars, etc.
Desk sets, vanity cases,'key cases,
cigar and, cigarette cases
Misc. leather goods
Pocketbooks, purses and card cases
Razors, safety and other
Brushes:
tooth and toilet
Combs and hairpins, not made from
metal or rubber
Cigar lighters
Pipes (tobacco)
Umbrellas, parasols and canes
Total, Minor Group 8
Minor Group 9 Clothing and Furnishin s,
Clothing (except work clothing),
men's
youths', and boys', n.e.c.
Clothing work (mci. sheep—lined and
blanket-fined work coats but not
mci. shirts) men's
Collars, men's
Furnishing goods, men's
n.e.c.
Gloves and mittens, cloth or cloth
and leather combined, made from
purchased fabrics, arid leather, men's
Hats and caps, except felt and straw,
men's
Finished fur—felt hats, men's
Hats, wool—felt, men's
Men's
hosi
ery,
underwear,
oute
rwea
rSh
irts
Suspenders, garters, and hose support-
ers, men's, arm bands, and other
elastic woven goods
mad
e fr
ompur-
chased webbing
3,610
3,840
4,23
24,
413
4,596
4,050
3,110
2,376
101,940
75,5
19102,633
92,240
78,438
76,256
44,282
40,9
427,142
6,450
5,053
2,111
1,840
1,998
2,583
3,359
9,40
87,125
7,410
6,487
7,439
7,77
37,072
7,908
11,898
10,457
14,487
13,810
14,638
10,976
6,582
4,694
3,213
2,154
2,492
2,509
2,240
2,179
1,598
1,722
36,104
30,238
36,3
5236,103
48,789
51,571
33,498
24,850
5,61
33,277
2,923
1,529
509
406
703
309
6,008
9,633
9,866
5,550
1,976
1,601
1,079
898
993,585
719,500
1,001,379
926,245
854,273
831,979
473,133
441,834
23,077
20,964
24,588
26,8
5231,351
28,548
18,427
15,105
1,294
754
1,108
1,827
1,701
1,842
1,795
1,341
10,857
9,277
13,649
12,686
10,809
10,946
8,499
5,933
2,43
32,
079
3,059
2,843
2,423
2,928
2,01
31,815
4,931
1,712
3,604
4,174
2,709
3,638
1,764
1,697
3,806
3,37
23,
075
3,23
33,195
3,166
1,692
1,199
20,317
18,0
0116
,417
17,2
6017
,055
16,9
927,
628
5,40
013,811
12,483
31,0
5540,742
54,226
65,200
42,2
0027
,724
1,91
81,
329
1,968
2,139
2,119
2,22
81,
983
689
8,895
8,16
211
,776
10,5
9711
,616
11,9
2310
,113
7,699
6,211
4,33
28,294
4,91
23,
843
2,940
1,880
894
3,325
2,75
23,348
3,325
4,49
34,750
3,085
2,288
11,515
7,109
9,685
7,360
7,246
5,53
75,380
3,190
24,227
24,8
9227,391
26,096
23,001
18,0
539,101
8,242
136,
617
117,218
159,017
164,046
175,787
178,691
115,560
83,216
Men's and Boys'
1,071,647
864,815
936,787
878,092
871,310
841,102
513,792
406,061
mci. in Industry 208
157,447
139,
416
136,889
127,274
80,842
133,
439
35,167
24,897
32,587
23,519
14,417
8,883
5,165
3,092
102,983
75,491
97,284
112,985
149,883
155,587
100,813
57,133
55,292
29,475
48,704
46,216
49,157
52,235
31,607
29,312
44,812
37,951
43,698
44,306
41,442
34,832
17,1
3012
,858
70,595
44,023
62,5
5359,677
-70
,659
68,917
39,231
26,696
1,668
1,476
2,619
2,944
2,93
12,937
1,443
1,16
0258,366
230,828
297,514
277,451
262,410
261,845
169,429
149,391
198,743
190,
007
232,612
213,820
230,385
216,933
148,883
110,199
41,607
30,762
16,632
18,720
18,819
19,975
11,452
8,530

bFurs
and
Fur
Goo
ds
Table 1—4 (Continued)
Industry Number
Major and Minor Groups
and Commodities
1919
1921
1923
1925
1927
1929
1931
1933
Belts, men's
Hats,
stra
w,men's
Total, Minor Group 9
Minor Group 10 Women's Clothing arid
Clothing, Women's, Misses' and
Clothing, women's, n.e.c., regular
factories
Corsets and allied garments
Gloves and mittens, cloth or cloth
and leather combined, made from pur-
chased fabrics, women's
-
Fin
ishe
dfur—felt flats, women's
Hats, wool—felt, women's and
children's
Women's and infants' hosiery, under-
wear, outerwear
Trimmed hats
Infants' headwear
Garters and hose supporters, women's
Scarfs and neckwear, women's
Total, Minor Group ba
906
1619
210
215
224, 905
229
230
234
239
245
246
1615
801
802
904
203
216
218
232
241
249
313
17,4
3532
,650
1,930,967
urs
Chi
ldre
n's
1,146,312
72,5
69
18,430
1,148
3,81
8
365,529
145,854
5,918
17,831
13,885
1,791,294
132,628
7,024
167
2,509
142,328
115,957
3,712
1,137,820
1,257,489
15,4
4730
,312
-1,5
75,4
84
•978,926
74,44-6
9,82
571
6
3,379
331,531
155,148
6,295
13,184
14,770
1,588,220
106,973
5,666
135
2,023
114,797
94,807
3,254
857,
903
955,964
12,535
21,507
31,148
11,002
10,760
4,208
8,91
139,812
14,921
15,153
14,509
14,088
33,867
1,976,392
1,360,777
75,126
16,235
1,010
5,994
439,279
171,
008
6,939
7,128
16,279
2,099,775
149,676
7,927
189
2,831
160,623
134,
987
7,15
0988,989
1,131,126
15,011
24,713
36,6
93
13,552
10,852
6,067
11,805
52,072
18,714
20,745
17,4
72
14,811
30,213
1,86
2,17
0
1,227,050
74,0
94
15,406
3,074
3,869
436,783
178,298
7,235
8,02
316,973
1,970,805
193,012
10,262
247
3,63
520
7,156
119,923
12,037
915,532
1,047,492
16,174
29,548
38,150
16,7
0312,480
6,728
13,154
56,9
9018,822
23,575
17,9
02
14,6
3526
,652
1,889,589
1,407,183
74,1
35
16,386
2,425
2,74
8
468,926
185,602
7,521
8,050
17,653
2,190,629
160,720
14,113
790
7,279
182,902
133,196
13,2
4193
3,99
71,080,434
15,876
29,452
42,611
18,950
6,751
5,036
13,075
59,520
18,763
24,127
17,2
32
14,582
22,629
1,827,731
1,615,392
74,202
17,411
1,892
2,037
534,729
173,518
•5,290
6,556
2,431,027
133,839
21,779
635
4,16
8160,421
111,360
10,011
963,343
1,084,714
15,920
25,392
J-
33,0
37
16,396
8,383
5,723
15,0
0076,171
23,640
26,4
5416
,944
Fur and fur—lined coats and
over
-coats
Fur
neck
pieces
Fur
robe
sOther fur and fur—lined goods
Total, Minor Group lOb
Minor Group 11 Shoes and Other Footwear
Rubber boots and shoes
Rubber heels, soles and soling strips
Boots and shoes,. other than rubber
Total, Minor Group 11
Minor Group 12 Miscellaneous House F
Awnings, etc.
Blankets
Towels, towelings and wash cloths
Bath mats
Bedspreads and
quilt
sCotton table damask
Shee
tsand pillow cases
Dyeing
and
fini
shin
gtextiles:
sheets
Misc. house—furnishing goods
Oilcloth
All-wool and wool and cotton blankets
Mirror and picture frames
12,517
16,146
1,14
8,45
0
1,224,982
70,6
14
10,536
668
706
344,292
132,091
2,243
4,17
7d in Indust]
1,790,309
73,936
8,619
213
4,316
87,084
48,308
5,504
653,104
706,916
10,238
12,721
24,108
1,41
68,643
3,65
14,241
10,374
50,670
13,506
15,066
9,828
8,862
11,551
958,284
801,638
57,012
9,772
455
-•57
0
279,566
}71
,872
3,109
y 210
1,223,994
}42
,273
41,513
4,666
552,636
598,815
6,916
16,069
22,487.
988
6,360
2,837
4,555
8,982
49,424
12,2
2313,838
6,264
rnls
hing
s15
,447
32,640
30,8
12
10,245
9,544
3,36
910,432
43,946
15,9
5122,804
16,842

Table 1—4 (Continued)
Number
Maj
or a
ndMinor Groups
and Commodities
1919
1921
1923
1925
1927
1929
1931
1933
rji
318
626
802
1016
1017
1019
1103
1604
1605
1612
1651
214
302
909
1106
1403, 1648
1636
1642
1650
802
803
309
Window and door screens and weather
strip
Paints and. varnishes
Garden hose
Rubber mats
and
matting
Mir
rors
,framed and unfrained
Garden and art pottery
Statuary and art goods
Scissors and shears, and pocket
knives
Brooms:
household., whisk, toy and
hearth
Brushes:
household.
Lamp shades
Window shades and fixtures
Total, Minor Group 12
Minor Group 13 Toys, Gaines and
Fish line
Billiard and pool tables, bowling
alleys and. accessories
Saddlery and harness
Firearms
Toys, games and playground equipment
(except parts)
Children's wheel goods and. sleds
(except parts and baby carriages)
Cameras and. equipment
Sporting and athletic goods, not
md. firearms
and
ammunition
Whips
Tot
al,Minor Group 13
Minor Group 14 Tires and.
Tire sundries and repair materials
Pneumatic tires and. tubes, motor—
vehicle
Pneumatic tires and tubes, motor-
cycles and bicycles
Solid and cushion tires
Total, Minor Group 14
Total
Major Group of Bemidurable
Consumers' Durable
Minor Group 15 Household Furniture
Furniture,
hous
ehol
dFurniture,
mad
ein other industries,
household.
10,944
34,617
8,72
05,
534
11,6
94 465
1,71
6
9,043
26,876
6,285
8,060
24,604
360,590
Ing Goods
2,109
15,375
83,494
29,212
48,041
14,887
14,703
21,592
3,090
232,503
11,065
534,141
11,5
2632,928
589,660
7,435,033
494,
299
14,017
12,039
27,175
5,889
3, 9,44
497
32,264
6,264
16,754
5,767
6,670
24,680
305,610
1,207
7,325
30,4
7213
,737
39,170
12,138
11,813
29,71'?
1,139
146,718
5,91
0
333,117
3,00
76,948
348,982
5,87
2,49
3
455,760
10,2
56
20,7
2241
,208
10,986
4,740
17,9
201,
683
2,623
9,27
7
24,080
8,319
8,115
40,329
417,
698
2,195
6,295
42,372
16,041
61,787
19,146
11,9
52
37,417
800
198,005
7,896
346,187
4,126
17,6
13375,822
7,519,837
568,866
9,299
28,901
48,131
11,514
7,814
17,186
2,259
3,302
10,252
20,753
7,466
8,060
36,367
452,221
•2,674
5,621
30,901
14,289
58,852
18,248
12,925
38,6
58 586
182,754
ll,7l6
556,137
2,688
28,315
598,856
7,411,745
603,529
18,514
25,639
52,711
8,092
7,273
15,035
2,48
23,
508
10,021
17,644
7,000
10,892
33,999
445,
689
2, 7,242
27,786
16,889
68,363
18,262
15,014
42,230
265
198,384
10,984
578,
620
2,88
527,812
620,211
7,63
7,89
8
605,087
19,628
28,187
57,488
9,049
8,806
15,161
2,694
3,345
8,39
6
17,173
8,115
11,502
35,760
470,268
2,893
9,602
23,712
17,701
79,832
18,731
17,000
56,286
327
226,084
6,86
7
448,658
2,89
913,937
472,361
7,683,276
575,176
24,398
•
14,996
36,206
6,03
84,616
8,503
1,923
1,990
6,184
11,911
4,334
7,47
819,229
287,870
2,187
4,339
9,39
47,805
54,212
9,693
13,040
50,441
136
151,247
3,354
284,457
1,950
5,220
294,981
5,055,550
332,778
none
reported
separately
6,992
29,639
3,804
4,021
7,695
1,665
899
4,477
8,080
4,800
5,547
15,128
243,690
1,955
1,296
10,364
6,573
38,265
7,993
8,819
25,873
included in
Industry
101,
138
2,736
203,983
1,862
3,581
212,162
3,905,406
224,095
2,492
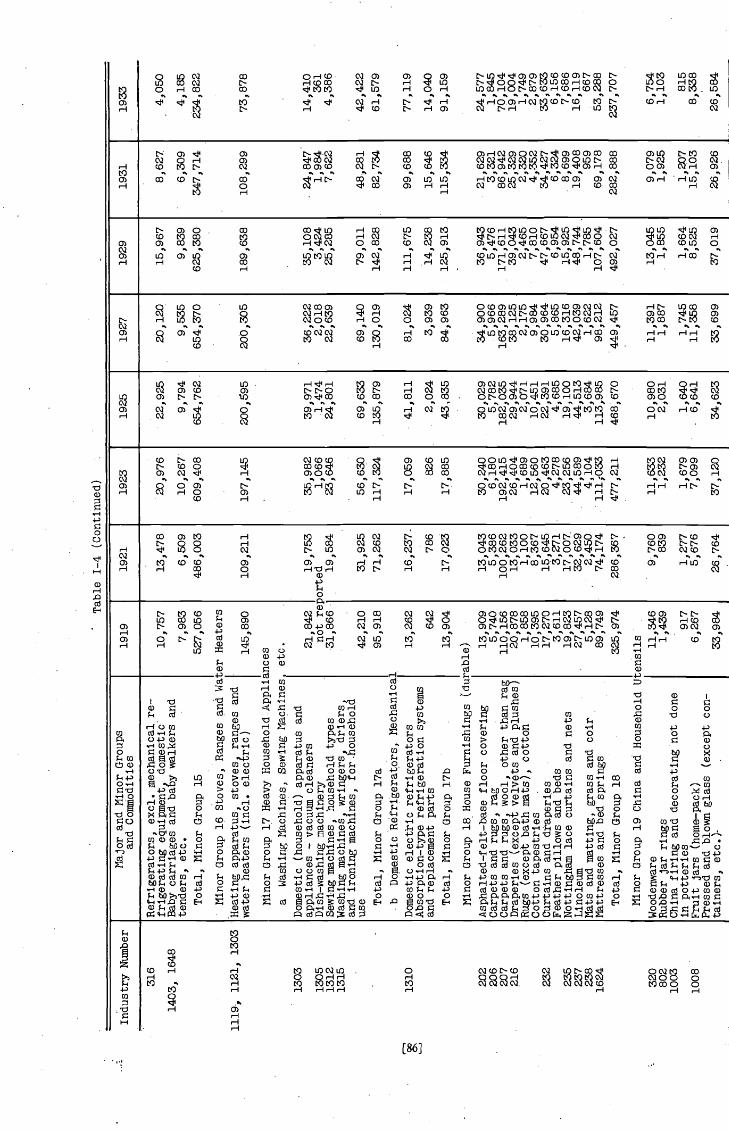
Minor Group 19 China and Household Utensils
Table 1-4 (Continued)
Indu
stry
Num
ber
Maj
or a
nd M
inor
Gro
ups
and
Com
mod
ities
1919
1921
1923
1925
1927
1929
1931
1933
00 C'
316
1403
,1648
1119
,1121, 1303
1303
1305
1312
1315
1310 202
206
207
216
232
235
237
238
1624
320
802
1003
1008
Refrigerators, exci. mechanical re—
frigeratirig equipment, domestic
Baby carriages and baby walkers arid
tend
ers,
etc.
Total, Minor Group 15
Minor Group 16 Stoves, Ranges and Wa
Heating apparatus, stoves
ranges and
I
wat
erheaters (md.
Minor Group 17 Heavy Household
aWashing Machines, Sewing Machines
Domestic (household) apparatus and
appliances
vacuum cleaners
Dish-washing machinery
Sewing machines, household types
Washing machines, wringers, driers,
and ironing machines, for-household
use Total,
Min
or G
roup
17a
-bDomestic Refrigerators, Nechanica:
Domestic electrlc refrigerators
Absorption—type refrigeration systems
and replacement parts
Total, Minor Group 17b
Minor Group 18 House Furnishings (din
Asphalted—felt—base floor covering
Carpets and rugs, rag
Car
pets
and rugs
woo
l,other than ra
Draperies
velvets and plushes
Rugs (except bath mats), cotton
Cotton tapestries
Curtains and draperies
Feather pillows and beds
Nottingham lace curtains and nets
Linoleum
Mats and matting, grass and coir
Mattresses and bed springs
Total, Minor Group 18
10,757
7,983
527,
056
;er
Heaters
145,890
tnces
etc. 21
,842
not
31,8
66
42,2
1095,918
13,2
62 642
13,9
04
Sabl
e) 13,9
095,
740
110,156
20,8
7811
858
10,3
9517
,270
3,61
119
,823
27,457
5,12
889,749
325,
974
13,4
78
6,50
9486,003
109,
211
19,753
orted9,
584
31,925
71,262
16,2
37-
786
17,0
23
13,043
5,386
100,
262
13,0
331,
100
8,36
715
,645
3,271
17,007.
32,6
29•
2,45
074
,174
286,
367
-9,
760
839
1,27
75,
676
26,7
64
20,976
10,267
609,408
197,
145
35,982
1,06
623
,646
56,6
30117,324
17,059
826
17,8
85
30,2
406,
180
192,
415
26,4
041,689
12,5
6020
,463
4,27
823,256
44,589
4,104
ll1;0
33477,211
11,6
331,
232
1,679
7,09
9
37,1
20
22,925
9,794
654,
762
200,
595
39,971
1,47
424
,801
69,633
135,
879
41,811
2,024
43,835
30,029
5,78
218
2,03
529,944
2,071
10,4
5122,391
4,685
19,1
0044
,513
3,684
113,985
468,
670
10,980
2,03
1
1,64
06,
641
34,6
23
20,1
20
9,53
5654,370
200,
305
36,2
222,
018
22,6
39
69,1
40130,019
81,024
3,939
84,9
63
34,900
5,966
163,289
38,1
252,
175
9,98
430,964
5,865
16,316
42,0
391,
622
98,2
1244
9,45
7
11,391
1,88
7
1,74
511,358
33,699
15,9
67
9,83
962
5,38
0
189,638
35,1
083,424
25,285
79,0
1114
2,82
8
111,
675
14,238
125,913
36,943
51476
171,
611
39,0
432,465
7,81
047
,667
6,95
415,925
48,7
441,
785
107,604
492,
027
13,0
451,855
1,664
8,52
5
37,019
8,62
7
6,30
9347,714
108,299
24,8
471,984
7,622
48,281
82,734
99,688
15,646
115,334
21,
629
3,32
186
,942
25,3
292,320
4,352
34,427
6,324
8,699
19,408
959
69,1
7828
2,88
8
9,07
91,
925
1,207
15,103
26,9
26
•4,
050
4,18
5234,822
73,878
14,4
10 361
4,38
6
42,422
61,5
79
77,1
19
14,0
4091,159
24,5
771,845
70,1
0419,004
1,74
92,
879
33,6
336,
156
7,686
16,1
19 667
53,2
88237,707
6,754
1,103
815
8,33
8
26,584
Woo
denw
are
Rub
ber
jar
ring
sChina firing and decorating not done
in potteries
Fruit jars (home—pack)
Pressed and blown glass (except con-
tainers, etc.)-
11,346
1,439
917
6,26
7
33,9
84
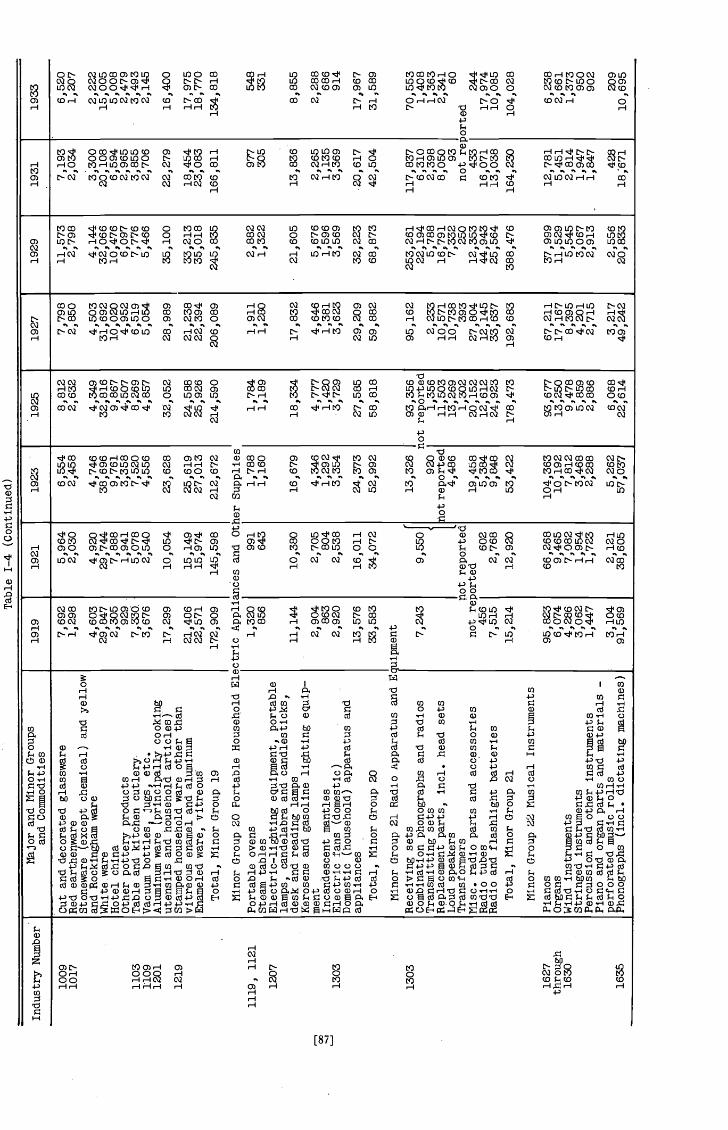
Industry Number
Major and Minor Groups
and Commodities
Table 1—4 (Continued)
1919
1921
1923
1925
1927
1929
1931
1933
1009
1017
1103
1109
1201
1219
1119
, 112
1
1207
1303
1303
1627
through
1630
1635
Cut and decorated glassware
7,692
Red earthenware
1,298
Stoneware (except chemical) and yellow
and Rocklngham ware
4,603
29,847
Hotel china
2,305
Other pottery products
929
Table and kitchen cutlery
7,330.
Vacuum bottles
jugs, etc.
3,676
Aluminum
war
eco
okin
gut
ensi
ls a
ndhousehold articles)
17,299
Stamped
hous
ehol
d w
are
other than
vitreous enamel and aluminum
21,406
Enameled ware, vitreous
22,571
Total, Minor Group 19
172,909
Minor Group 20 Portable Household Electric Appli.
Portable ovens
1,320
Steam tables
856
Electric—lighting equipment, portable
lamps, candelabra and candlesticks,
desk and reading lamps
11,144
Kerosene and gasoline lighting equip-
ment
2,904
Incandescent mantles
863
Electric fans (domestic)
2,920
Domestic (household) apparatus and
appliances
13,576
Total, Minor Group 20
33,583
Minor Group 21 Radio Apparatus and Enulpment
Receiving sets
Combination phonographs and radios
7,243
Transmitting sets
Replacement parts, md. head sets
Loud speakers
Transformers
riisc. radio parts and accessories
not re
Radio tubes
456
Rad
ioand flashlight batteries
7,515
Total, Minor Group 21
15,214
Minor Group 22 Musical Instruments
Pianos
95,823
Organs
6,074
Wind instruments
4,286
Stringed
inst
rum
ents
3,06
2Pe
rcus
sion
and
other
inst
rum
ents
1,44
7Pi
ano
and
orga
n pa
rts
and
mat
eria
ls —
perf
orat
edmusic
rolls
3,10
4Ph
onog
raph
s(md. dictating machines)
91,569
5,964
2,030
4,92
029
,744
7,888
1,94
15,
078
2,54
0
10,0
54
15,149
15,9
7414
5,59
8
nces
and
Ot
991
643
10,3
80
2,70
580
42,
538
16,0
1134
,072
9,550
otreported
orted
602
2,76
812,920
66,268
9,46
57,
082
1,95
41,723
2,12
138
,605
6,554
2,458
4,74
638,696
9,76
13,
358
7,52
04,
556
23,6
28
25,619
27,013
212,672
ierSupplies
1,788
1,160
16,6
79
4,34
61,292
3,35
4
24,373
52,992
13,3
26 920
lot reported
4,486
19,4
585,
384
9,848
53,422
104,
363
10,1
927,
812
3,468
2,288
5,262
57,0
37
8,812
2,632
4,34
932
,816
9,867
4.,507
8,26
94,
857
32,052
24,5
8825,926
214,590
1,784
1,18
9
18,3
34
4,77
71,
420
3,72
9
27,585
58,818
93,356
tot
repo
rted
1,35
611
,503
13,2
691,
302
20,1
5212,612
24,9
23178,473
93,6
7713,250
9,47
85,
859
2,88
6
6,06
822
,614
7,79
82,
850
4,503
31,692
10,0
204,952
6,51
95,
054
28,9
89
21,238
22,3
94206,089
1,911
1,28
0
17,8
32
4,64
61,
381
3,62
3
29,2
0959,882
95,1
62
2,233
10,571
10,738
393
27,8
0412,145
33,637
192,683
67,2
1117
,167
8,39
54,
201
2,71
5
3,21
749
,242
11,573
2,798
4,144
32,0
6610,476
6,097
7,77
65,
466
35,1
00
33,213
35,018
245,
835
2,882
1,322
21,605
5,676
1,596
3,56
9
32,223
68,873
253,261
22,194
5,788
16,7
917,332
250
12,353
44,943
25,564
388,476
37,9
9911,529
5,545
3,067
2,913
2,55
620,833
7,19
32,
034
3,30
020,108
6,594
2,96
53,855
2,706
22,2
79
18,4
5423
,083
166,811
977
305
13,836
2,265
1,13
53,369
.20,
617
42,504
117,
837
6,310
2,39
88,
050 93
not r
ei43
316,071
13,038
164,
230
12,781
5,45
12,
814
1,94
71,
847
428
18;6
7l
6,520
1,207
2,22
215
,005
5,008
2,47
93,493
2,14
5
16,400
17,9
7518
,770
134,
818
548
331
8,855
2,288
686
914
17,9
6731,589
70,5
531,408
1,36
32,341 60
orte
d244
17,974
10,085
104,028
6,23
82,661
1,37
395
090
2
209
10,6
95

Table 1—4 (Continued)
1635
Industry Number
Major and Minor Groups
and Commodities
1919
1921
1923
1925
1927
1929
1931
1933
r
Parts and accessories —
reco
rds
and
blanks
Phonographs and parts
notreported in
detail
44,690
6,664
47,844
1,328
Total, Minor Group 22
256,468
176,390
Minor Group 23 Jewelry, Silverware,
Clocks and
Wat
ches
1202
,12
21,
1223
1210
1213
1214
1612
1623
1222
.
Clocks complete for use as timepieces
only
Instruments and devices
with
clockwork mechanism
Jeweled and nonjeweled watches, men's
and women's
Jewelry
Plated ware
Silversmlthlng and silverware
Rhinestone ornaments
Lapidary work
Total, Minor Group 23
21,087
•
2,29
5
28,619
184,308
40,636
27,366
661
1,335
306,
307
15,747
1,714
21,370
115,169
34,240
22,346
679
194
211,459
Minor Group 24 Printing and Publishing:
Books
508
Books and pamphlets printed and
pub-
lished or published only
132,699
126,256
Minor Group 25 Luggage
910
Trunks, suitcases and bags
64,864
47,051
1408 .
.
Minor Group 26 Passenger Cars
Passenger vehicles (not mci. public
conveyances)
1,324,459
Passenger chassis
41,118
Total, Minor Group 26
1,365,577
Minor Group 27 Auto—Parts and
Accessories1
1,128,605
18,805
1,147,410
1001
1109
1126
1201
1219
1303
1407
1This
Brake linings and clutch facings
Vehicle hardware other than locks
Automobile skid chains
Aluminum motor—vehicle accessories
and parts
Stamped automotive parts and accesso-
ries
Automotive generators and starter-
motors
Ignition apparatus for internal—com-
bustion engines
Storage batteries
Motor-vehicle bodies and parts
Total, Minor Group' 27
group does not include any
expo
rts.
3,431
6,647
8,471
1,072
7,290
7,076
28,250
31,4
40188,897
282,574
2,309
4,617
5,537
513
5,130
5,387
11,245
24,430
110,302
169,470
36,372
1,199
227,993
21,606
2,387
29,360
156,548
51,7
6024,843
665
405
287,
574
135,
279
63,810
2,253,110
25,121
2,278,231
4,08
78,758
7,243
1,460
9,050
11,094
17,722
38,880
257,499
355,793
26,791
3,426
184,049
22,904
2,224
33,1
2315
1,45
4•
46,6
0328
,919 66
1450
286,338
154,991
61,2
31
2,483,885
39,919
2,523,804
4,70
09,038
7,846
1,808
8,677
11,569
22,823
52,0
61325,747
444,269
31,781
2,857
186,786
28,708
3,816
29,845
140,
944
54,044
27,7
57893
555
286,562
178,
163
60,750
2,147,563
27,156
2,174,719
5,867
12,079
9,086
3,796
8,973
14,149
20,216
45,406
300,242
419,814
34,1
29
118,
571
25,512
6,950
33,446
142,433
52,5
0326,168
941
537
288,490
199,015
64,801
2,767,339
32,3
982,799,737
4,825
10,554
11,4
91
1,206
9,95
1
10,554
32,8
4061,698
264,465
407,
584
7,698
one reporte
51,637
20,391
2,461
14,829
68,175
28,828
14,9
85 613
113
150,395
146,438
27,062
1,119,817
3,739
1,123,556
3,23
66,
472
5,987
647
5,393
4,96
2
14,912
36,457
195,
017
273,083
2,500
25,528
11,4
74
1,249
12,2
2240,302
34,3
33 455
38100,073
95,312
17,594
753,134
3,875
757,009
2,732
5,646
3,38
7
1,639
8,196
3,643
12,1
6030,562
160,282
228,
247
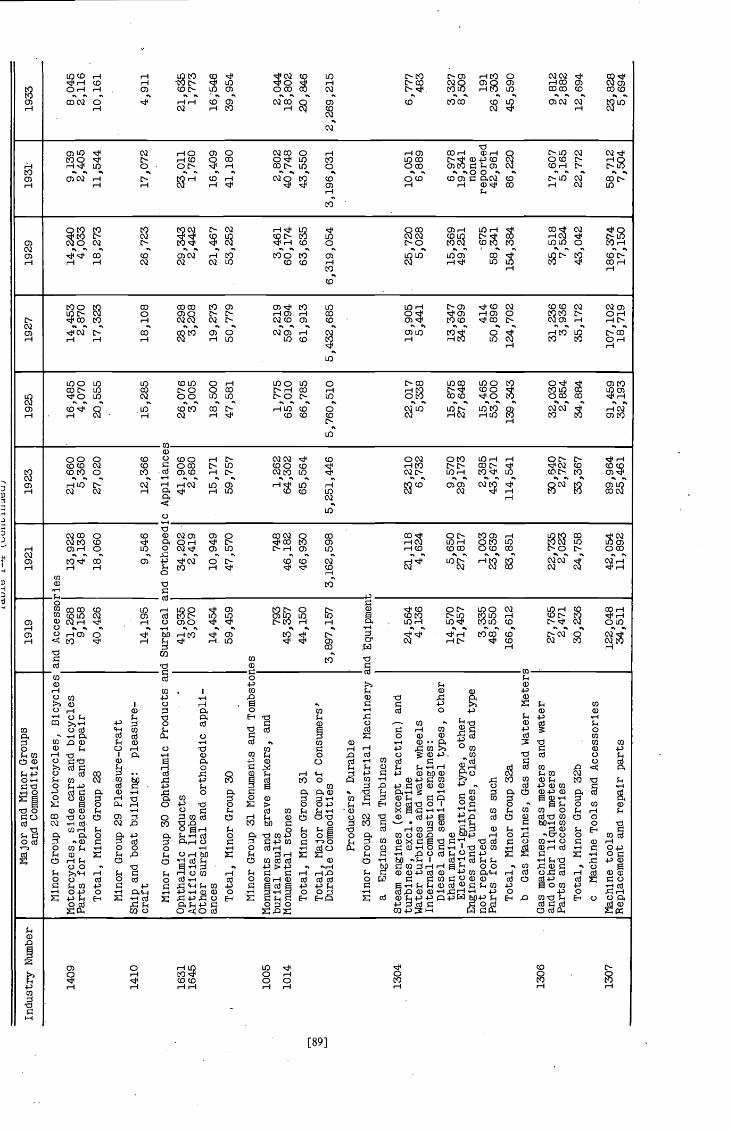
Industry Number
Major and Minor Groups
and Commodities
1919
1921
1923
1925
1927
1929
1931
1933
Lc
1409
1410
1631
1645
1005
1014
1304
1306
1307
Minor Group 26 Motorcycles, Bicycles and
Motorcycles, side cars and bidycles
Parts
forreplacement and repair
Total, Minor Group 28
Minor Group 29 Pleasure—Craft
Ship and boat building:
pleasure—
craft
Minor Group 30 OphthalmIc Products
Ophthalmic products
Artificial limbs
Other surgical and orthopedic appli-
ances
Total, Minor Group 30
Minor Group 31 Monuments and Tombsto:
Monuments and grave markers, and
burial vaults
Monumental stones
Total, Minor Group 31
Total, Major
Gro
upof Consumers'
Durable Commodities
Producers' Durable
Minor Group 32 Industrial Machinery
aEngines and Turbines
Steam engines (except traction) and
turbines, exci. marine
Water turbines and water wheels
Internal—combustion engines:
Diesel and semi—Diesel types, other
ti-ian marine
-
Ele
ctric
—ig
nitio
ntype; other
Engines and turbines, class and type
notreported
Parts
for
sale as such
Total, Minor Group 32a
bGas Machines, Gas and Water Meter
Gas machines, gas meters and water
and other liquid meters
Parts and accessories
Total, Minor Group 32b
cMachine Tools and
Acc
esso
ries
Machine tools
Replacement and
repa
irparts
Accesso
31,268
9,158
40,426
14,195
and Surgical
41,935
3,070
14,454
59,459
.es
793
43,357
44,1
50
3,89
7,15
7
nd Equipmen;
24,564
4,13
6
14,570
71,457
3,335
48,5
5016
6,61
2
27,765
2,47
130,236
122,
048
34,511
13,922
4,138
18,060
9,546
and Orthoped
2,419
10,949
47,570
748
46,1
82W
46,930
3,16
2,59
8
21,118
4,624
5,65
027,817
1,003
23,639
83,851
22,735
2,023
24,758
42,054
11,892
21,660
5,360
27,020
12,366
Appliance
41,906
2,680
15,171
59,757
1,262
64,302
65,564
5,251,446
23,210
6,732
9,570
29,173
2,385
43,471
114,541
30,640
2,72
733,367
89,9
6425,461
16,485
4,070
20,555
15,2
85
26,076
3,005
18,500
47,581
1,775
65,010
66,785
5,760,510
22,017
5,338
15,8
7527,648
15,465
53,000
139,343
32,0
302,854
34,8
84
91,4
5932
,193
14,453
2,870
17,323
18,108
28,298
3,20
8
19,273
50,779
2,219
59,694
61,913
5,432,685
19,9
055,441
13,3
4734
,699 414
50,896
124,702
31,236
3,936
35,172
107,102
18,719
14,2
404,
033
18,273
26,723
29,343
2,44
2
21,467
53,2
52
3,46
160,174
63,635
6,319,054
25,720
5,02
8
15,369
49,251
675
58,341
154,384
35,5
187,
524
43,0
42
186,374
17,150
9,139
2,405
11,5
44
17,0
72
23,011
1,760
16,409
41,1
80
2,802
40,748
43,550
3,196,031
10,051
6,889
6,978
19,341
none
reported
42,961
86,220
17,6
075,165
22,772
58,712
7,504
8,045
2,116
10,161
4,911
21,635
1,77
3
16,546
39,9
54
2,044
18,8
0220,846
2,26
9,21
5
6,777
483
3,32
78,509
191
26,303
45,5
90
9,81
22,882
12,694
23,628
5,69
4
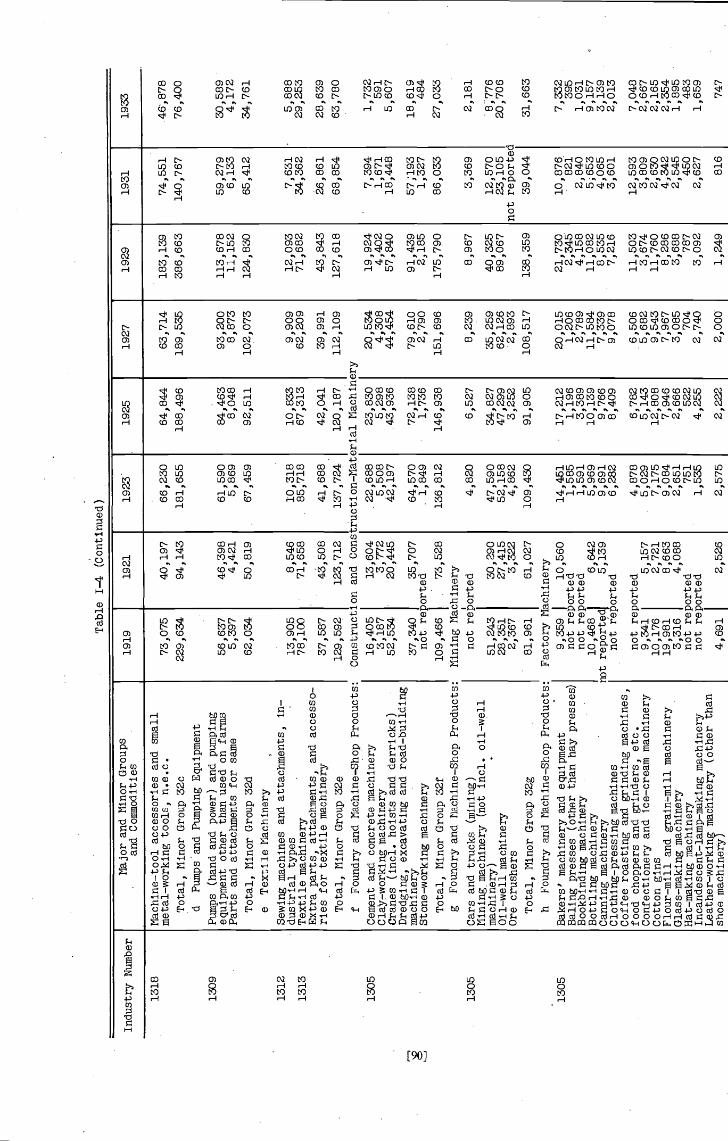
eTextile Machinery
Table 1-4 (Continued)
Indu
stry
Num
ber
Major and Minor Groups
and Commodities
1919
1921
1923
1925
1927
1929
1931
1933
Mac
hine
—to
ol a
cces
sori
es a
nd s
mal
lm
etal
—w
orki
ng to
ols,
n.e
.c.
Tot
al, M
inor
Gro
up 3
2cd
Pum
psand Pumping
Equ
ipm
ent
Pum
ps(hand
and
pow
er)
and
pum
ping
equipment
othe
r th
an u
sed
on f
arm
sParts
and
atta
chm
ents
for
sam
eTotal,
Min
or G
roup
32d
73,075
229,634
56,6
375,397
62,034
40,197
94,143
46,398
4,421
50,819
66,230
181,655
61,590
5,869
67,459
1318
1309
1312
1313
1305
1305
1305
LJ
Sewing machines and attachments, in-
dustrial types
Textile machinery
Extra parts, attachments, and accesso-
ries for textile machinery
Total, Minor Group 32e
fFoundry and Machine-Shop Proaucts:
Cement and concrete machinery
Clayrworking machinery
Cranes (md. hoists and derricks)
Dredging, excavating and road-building
machinery
Stone—working
mac
hine
ryT
otal
, Min
or G
roup
32f
gFounary and rlachine—Shop Products:
Cars and trucks (mining)
Mining
mac
hine
ry (
not m
d. o
il—w
ell
mac
hine
ry)
Oil-
wel
l mac
hine
ryO
recrushers
Total, Minor Group 32g
13,905
78,100
8,545
71,658
10,318
.85
,718
37,587
43,508
41,688
129,592
123,712
137,724
Construction and Construction—Mat
16,405
13,604
.22,688
3,187
3,772
5,508
52,534
20,445
42,197
37,340
35,707
not reported
109,466
73,528
64,570
.1,
849
136,812
Min
ing
Mac
hine
ryno
t
64,844
188,496
84,4
638,048
92,511
10,833
67,313
42,041
120,187
rial
Mac
him
23,8
305,
298
43,9
36
72,1
381,
736
146,938
6,527
34,827
47,299
3,252
91,905
17,2
121,196
3,389
10,139
9,76
68,409
6,782
5,143
12,808
7,946
2,666
522
4,255
2,222
51,243
28,351
2,367
81,961
63,714
189,535
93,200
8,873
102,073
9,909
62,209
39,991
112,109
20,534
4,308
44,454
79,610
2,790
151,696
8,239
35,259
62,126
2,893
108,517
20,0
151,206
2,789
11,584
7,339
9,078
6,506
5,682
9,543
7,967
3,085
704
2,740
2,000
30,290
27,415
3,322
61,027
183,139
386,663
113,678
11,152
124,
830
12,093
71,682
43,8
43127,618
19,9
244,402
57,840
91,439
2,185
175,790
8,967
40,325
89,067
138,359
21,7
302,345
4,158
11,082
8,53
57,
216
11,503
3,674
11,760
8,286
3,68
8787
3,09
2
1,249
74,551
140,767
59,279
6,133
65,412
7,63
134,362
26,861
68,854
7,394
1,671
18,448
57;193
1,327
86,033
3,369
12,570
23,105
not reportec
39,044
10,876
821
2,840
5,653
4,065
3,601
12,593
3,809
2,630
4,342
2,545
450
2,627
816
46,878
76,400
30,589
4,172
34,761
5,888
29,2
53
28,639
63,780
1,732
591
5,607
18,619
484
27,033
2,181
•8;776
20,706
31,663
7,33
2395
1,031
9,157
3,139
2,013
7,048
2,667
2,165
2,354
1,895
483
1,659
747
hFo
undr
y an
dMachine—Shop
Prod
ucts
:Fa
ctor
y M
achi
nery
Bak
ers'
mac
hine
ry a
ndequipment
9,35
9J
10,5
60B
alin
gpresses (other than hay presses)
not reported
Bookbinding machinery
..
.no
treported
Bottling machinery
10,468
I6,
642
Canning machinery
not report9dlJ
5,13
9C
loth
ing-
pres
sing
machines
not reported
Coffee roasting and grinding machines,
food choppers and grinders, etc.
Confectionery and ice—cream machinery
Cotton gins
Flour—mill and grain-mill machinery
Glass—making machinery
.
Hat
-mak
ing
machinery
Incandescent-lamp--making machinery
Leather-working
mac
hine
ry (
othe
r th
ansh
oe m
achi
nery
)
not reported
9,341
5,157
10,176
2,721
19,981
8,663
3,316
4,088
not reported
not reported
4,691
2,52
6
4,820
47,590
52,158
4,862
109,430
14,451
1,585
1,591
5,969
9,691
6,282
4,878
5,02
97,175
9,084
2,651
751
1,535
2,575
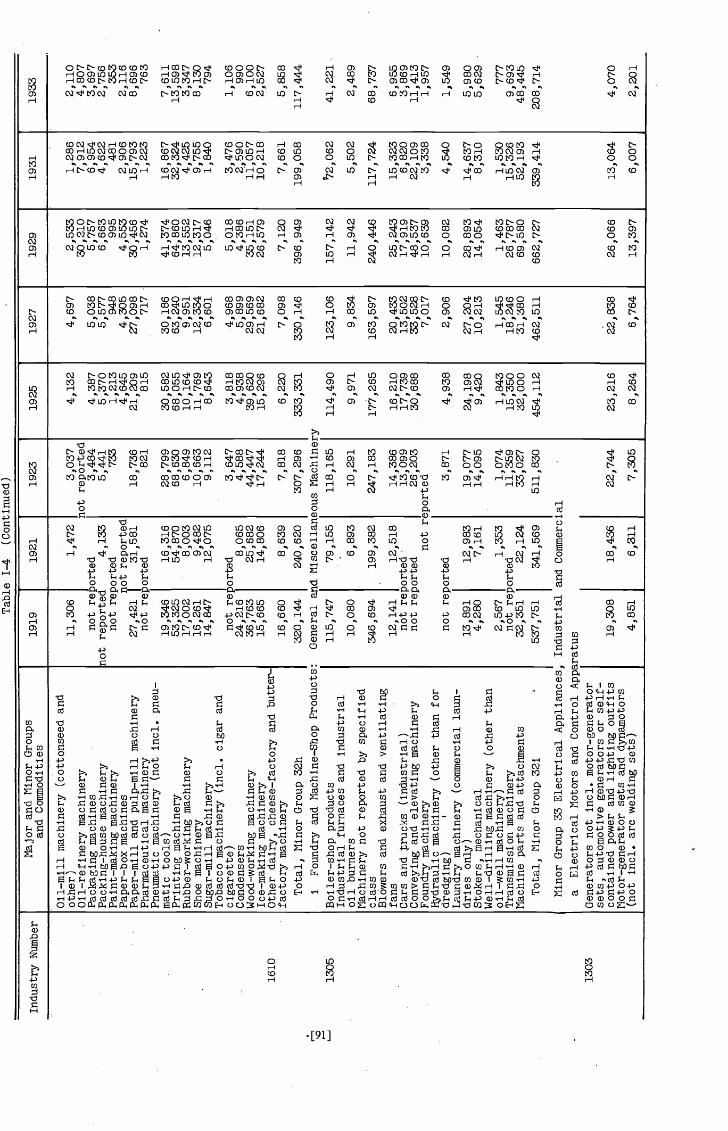
Industry Number
Major and Minor Groups
and Commodities
Table 1-4
(Continued)
1919
1921
1923
1925
1927
1929
1931
1933
'C
Oil—mill machinery (cottonseed and
other)
Oil—refinery machinery
Packaging machines
Packing-house machinery
Paint—making machinery
Paper—box machines
Paper—mill and pulp-mill machinery
Pharmaceutical machinery
Pneumatic machinery (not mci. pneu-
matic tools)
Printing machinery
Rubber-working machinery
Shoe machinery
Sugar—mill machinery
Tobacco machinery (md. cigar and
cigarette)
Condensers
Wood—working machinery
Ice—making machinery
Other dairy, cheese—factory and butter—
factory machinery
11,306
1,472
:
not reported
iot reported
4,133
not reported
not reported
27,421
31,581
not reported
19,346
16,316
53,325
54,870
17,002
8,003
16,261
9,482
14,847
12,075
.
notreported
24,216
8,065
36,763
25,682
15,665
14,806
16,660
8,639
Total, Minor Group 32h
320,144
1Foundry and Machine—Shop Products:
General
240,620
and Niscellan
Boiler—shop products
Industrial furnaces and industrial
oil burners
Machinery not reported by specified
class
Blowers and exhaust and ventilating
fans
Cars and trucks (industrial)
Conveying and elevating machinery
Foundry machinery
Hydraulic machinery (other than for
dredging)
Lau
ndry
machinery
(coi
mne
rcia
l lau
n-dr
ies
only
)St
oker
s,mechanical
Well—drilling machinery (other than
oil—well machinery)
Transmission
mac
hine
ryM
achi
ne p
arts
and
atta
chm
ents
115,747
79,155
10,080
6,893
346,694
199,382
.
12,1
4112,518
notreportednot r
not
repo
rted
13,8
9112
,983
4,28
07,161
2,567
1,353
not
repo
rted
32,3
5122
,124
Total, Minor Group 321
537,
751
341,
569
Minor Group 33 Electrical Appliances, Industrial and Conimercial
aElectrical Motors and Control Apparatus
Generators not md. motor-generator
sets, automotive generators or self—
contained power and lighting outf its
Motor—generator
sets
and
dynamotors
(not
mci. arc welding sets)
19,308
18,436
4,851
6,311
1610
1305
1303
3,03
7lo
t rep
orte
d3,
484
5,441
733
18,736
821
28,799
68,630
6,849
10,663
9,112
3,647
4,58
844,447
17,244
7,818
307,296
Mac
hine
118,
165
10,2
91
247,
183
14,386
13,0
9926,203
3,87
1
19,0
7714
,095
1,07
411
,359
33,0
27511,830
22,744
7,30
5
4,13
2
4,38
75,370
1,213
4,645
21,209
815
30,582
68,055
10,164
11,769
8,643
3,818
4,936
39,620
15,296
6,220
333,331
114,490
9,97
1
177,265
16,210
17,739
30,688
4,938
24,198
9,420
1,843
15,350
32,000
454,112
23,216
8,26
4
4,697
5,038
5,577
948
4,305
27,098
717
30,186
63,240
9,951
12,334
6,601
4,968
5,899
29,569
21,682
7,098
330,146
123,106
9,834
163,597
20,4
3313
,502
33,528
7,017
2,906
27,204
10,213
1,545
18,246
31,380
462,511
22,838
6,76
4
2,533
30,210
5,757
6,663
995
4,553
30,456
1,274
41,374
64,860
13,5
5212,317
5,046
5,018
4,386
35,151
26,579
7,120
396,949
157,142
11,942
240,446
25,2
4317
,919
48,537
10,639
10,082
28,893
14,054
1,463
26,787
69,580
662,727
26,066
13,397
1,28
67,
912
6,954
4,622
481
2,906
15,793
1,223
16,867
32,324
4,425
9,755
1,840
3,476
2,590
11,0
5710
,218
7,661
199,058
,062
5,502
117,724
15,323
6,820
22,109
3,338
4,540
14,637
8,310
1,530
15,326
52,193
339,414
13,064
6,007
2,110
4,807
3,697
2,756
353
2,11
68,696
763
7,611
13,598
3,347
8,130
794
1,106
990
6,100
2,527
5,858
117,444
41,221
2,48
9
68,737
6,955
3,869
11,413
1,957
1,549
5,980
5,629
777
9,693
48,445
208,714
4,070
2,201

aFa
rm M
achi
nery
and Equipment
Table 1—4 (ContInued)
Industry Number
Major and Ninor Groups
and Conunodities
1919
1921
1923
1925
1927
1929
1931
1933
6,25
176
,178
106,588
6,631
Publ
ic
17,718
21,861
98,313
7,895
9,379
4,46
7
48,8
63
8,21
6
Power transformers
Stationary motors, 1 h.p. and over
Total, Minor Group 32a
bIndustrial and Commercial Apparatus
Industrial and commercial apparatus
and appliances (not md. motor—driven
tools)
cOther Electrical Apparatus, Primarily
Measuring instruments and meters
(except laboratory testing and
scientific inst•ruments)
Switchboards, circuit breakers and
switches
insu
late
dwire and cable (rubber—
flexible cord, and
paper—and cotton—insulated)
Fuses and fuse blocks
Overhead trolley—line material
Railway signals and attachments
Searchlights and floodlights
Telephone and telegraph apparatus
Signaling apparatus (other than
railway)
Rectifying apparatus
Other electrical machinery, apparatus
and supplies
Lightning arresters
Wet primary batteries
Total,
Min
or G
roup
33c
Minor Group 34
Machinery, Tractors,
9,74
241
,171
75,660
3,82
1Jt
ility 17
,484
36,2
99
75,1
264,
483
2,691
1,62
0ot
rep
orte
d10
2,23
6
8,84
8
956
1303
1303 23
1
1113
1125
1127
1301
18,5
0660
,839
109,
394
6,78
8
22,9
15
57,8
56
140,
937
9,245
8,796
4,46
6
94,4
84
9,78
2
4,25
1
104,
838
3,83
42,
543
463,947
5,884
8,66
914
,417
70,004
95,3
7035
,842
2.4,576
1,69
7
20,234'
64,399
116,
113
10,2
83
26,3
98
69,7
59
160,
911
10,3
934,
240
14,030
1,263
84,4
33
8,57
1
10,4
66
117,
407
5,961
3,74
351
7,57
5
4,23
65,
327
13,0
70
58,6
28
104,
212
32,7
3726
,039
2,68
6
22,8
0663
,770
116,
178
12,7
61
26,1
59
71,9
24
160,
384
10,891
5,446
22,3
403,
217
121,
013
9,97
6
11,9
10
137,
033
6,32
73,
359
589,
979
4,43
65,682
12,8
67
52,9
83
149,
873
37,3
6319
,584
1,42
8
28,9
8584
,783
153,231
28,6
37
25,7
31
81,2
01
'228
,446
14,0
363,
261
22,5
723,
875
166,
293
12,2
47
4,25
9
224,
259
6,515
2,26
979
4,96
4
3,04
73,
203
13,1
61
52,4
01
183,
011
51,2
6720
,404962
1,96
5
109,
156
2,353
3,50
9333,695
and Wagons
7,945
11,7
8714
,461
80,3
19
15,680
34,782
69,5
33
17,6
60
17,073
44,8
32
90,7
917,761'
1,71
810
,583
3,94
111
3,17
0
'6,8
81
2,87
1
89,0
083,
257
1,21
239
3,09
8
'1,2
851,
680
8,04
7
30,3
42
56,174
20,3
2711
,386 81
6
60,7
522,
044
1,28
031
3,819
4,549
7,964
7,04
3
52,5
04
2,62
717
,196
26,0
94
12,5
98
7,29
5
16,2
43
32,4
194,
825
1,21
36,
432
riot
rep
orte
d21
,180
md.
with
railw
aysi
gnal
s an
dat
tach
men
ts1,
723
49,9
521,
592
830
143,704
1,77
71,
519
6,49
8
26,2
40
17,4
6311
,810
md.
above
md. above
Horse blankets, fly nets and related
products
Horse and mule shoesand shoe calks
Forks, hoes, rakes, shovels and spades
Barbed wire, plain and coated, poultry
netting and woven-wire fence
Plows and listers; harrows, rollers
pulverizers and stalk cutters; plan —
ing
and fertilizing machinery; culti-
vators and weeders; harvesting
machinery;
hayi
ng m
achi
nery
; and
mac
hine
s fo
r pr
epar
ing
crop
s fo
rm
arke
t or
for
use
Atta
chm
ents
and
par
ts f
or p
rece
ding
Mis
c. a
gric
ultu
ral i
mpl
emen
tsM
isc.
atta
chm
ents
and
par
ts
163,101
75,351
md.
above
md.
89,844
47,589
13,2
77ab
ove

Table 1-4 (Continued)
Industry Number
Major and Minor Groups
and Commodities
1919
1921
1923
1925
1927
1929
1931
1933
1303
Self—contaIned power and lighting
outfits not exceeding 5 kw.
24,079
4,043
7,685
11,14,3
8,239
6,840
1,639
945
1305
Lawn mowers
3,777
6,401
8,258
8,047
9,269
10,953
6,141
3467
1309
Farm pumps and pumping equipment
17,805
14,586
19,390
20,074
15,865
17,581
11,268
5,827
Parts and accessories for same
1,463
1,199
1,620
1,801
2,293
2,315
1,741
1,183
1316
WIndmills and windmill towers
6,009
3,953
4,636
5,682
4,555
5,411
1,652
1,400
Parts for same
377
245
286
690
366
522
265
185
1404
Carriages, wagons, sleighs and sleds
(except business wagons)
60,474
21,327
23,491
18,854
10,820
10,754
2,834
2,610
1610
Dairymen's supplies:
creamery,
cheese—factory and butter—factory
-
equl
pmen
t;-an
dpoultrymen's and
apiarists' supplies
20,140
18,350
34,885
34,330
37,138
38,487
12,385
2,615
Total, Minor Group 34-a
-48
7,08
8292,874
356,710
347,556
372,761
420,319
167,982
83,539
bTractors and Tractor Engines
1304
Tractors and traction engines
172,667
53,169
78,320
102,905
136,950
196,997
57,537
18,900
cBusiness Wagons
-
1404
BusIness wagons
8,418
4,071
5,172
4,960
4,593
3,879
1,393
1,283
Minor Group 35a, b, C,
dand e Office and Misc. Machinery and Equipment
1302
Cash registers and adding, calculating
and card—tabulating machines
79,577
50,183
89,632
87,063
93,526
99,570
44,746
33,287
Parts and attachments
5,990
3,777
6,746
6,553
7,077
6,647
4,163
2,988
Rebuilt machines, etc.
none reported
3,854
3,352
1303
Electric fans (destined for commer-
cial and industrial use)
5,423
4,713
6,229
6,925
6,729
6,627
5,615
1,523
1305
AddressIng and mailing machines
not reported
5,768
9,035
9,788
10,5
376,
156
2,29
3C
heck
—w
ritin
gmachines
not reported
2,489
2,093
1,780
2,346
1,316
731
Nanifolding machines
not reported
3,884
3,779
3,489
2,998
2,345
1311
Scales and balances
20,641
15,885
21,836
23,691
22,165
25,385
12,072
6,805
Part
s fo
r sa
me
330
254
349
382
108
700
447
328
1314
Typ
ewrI
ters
41,1
4730
,373
37,5
4547,680
51,9
4255
,057
19,1
7214
,059
.Pa
rts
2,16
61,
599
.1,
976
2,51
02,
737
6,47
62,
483
1,809
1618
Han
d st
amps
and
ste
ncils
and
bra
nds
9,01
49,
414
10,8
2414,998
13,1
3216
,768
15,2
5411,-601
Subt
otal
35a
164,288
116,198
183,394
204,814
212,763
233,602
118,276
81,121
1305
Vending machines, 35b
.1,
646
2,466
3,777
4,202
7,059
8,821
5,861
5,472
1640
Signs and advertising novelties, 35c
44,618
54,088
67,987
89,056
98,217
113,137
70,835
44,740
1641
Soda—water apparatus, 35d
13,852
12,620
14,649
17,888
20,327
22,636
14,307
5,914
1646
Theatrical scenery and stage equip-
ment, 35e
.1,
028
1,169
1,566
3,561
5,485
5,481
3,032
2,064
Total, Minor Group 35
225,432
186,541
271,373
319,521
343,851
383,
677
212,311
139,311
Minor Group 35 Office and
Stor
eFurniture and Fixtures
309
Furniture and fixtures f or offices and
stores
55,404
62,194
121,107
140,488
159,270
193,359
91,405
46,857
Furniture for public buildings
10,975
12,320
23,990
27,867
23,733
22,779
13,768
4,309
Professional, laboratory, hospital,
etc.
5,223
5,862
11,416
13,139
15,204
14,283
10,044
4,554
Loc
kers
2,119
2,379
4,632
5,309
4,641
5,233
3,14
21,149
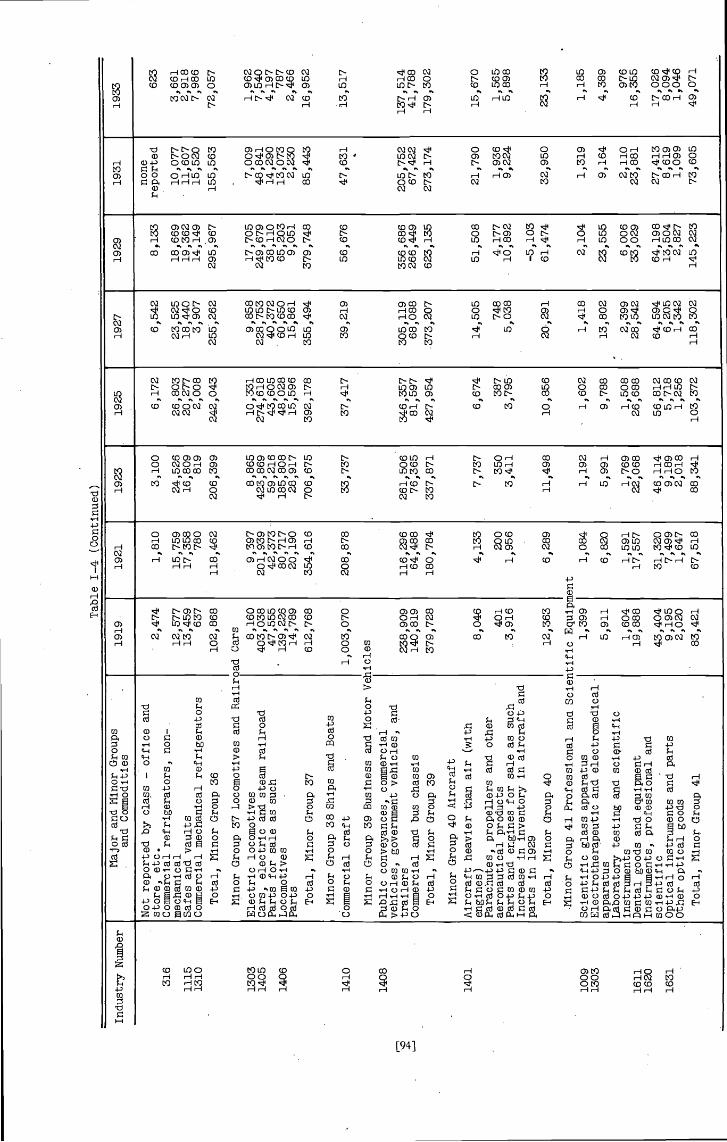
Table 1—4 (Continued)
Industry Number
Major and Minor Groups
and Commodities
1919.
1921
1923
.19
251927
1929
1931
1933
'0
316
1115
1310
1303
1405
1406
1410
1408
1401
1009
1303
1611
1620
1631
Not reported by class —
offic
eand
store, etc.
Commercial refrigerators, non—.
mechanical
Safes and vaults
Commercial mechanical refrigerators
Total, Minor Group 36
Minor Group 37 Locomotives and Railr
Electric locomotives
Cars, electric and steam railroad
Parts for sale as such
Locomotives
Parts
Total, Minor Group 37
Minor Group 38 Ships and
Boa
tsCommercial craft
Minor Group 39 Business and
Mot
orVel
Public conveyances, commercial
vehicles, government vehicles, and
trailers
Commercial and bus chassis
Total, Minor Group 39
Minor Group 40 Aircraft
Aircraft heavier than air (with
engines)
Parachutes, propellers and other
aeronautical products
Parts and engines for sale as such
Increase in inventory In aircraft and
parts in 1929
Total, Minor Group 40
Minor Group 41 Professional ann Scier
Sclentific glass apparatus
Electrotherapeutlc and electromedical
apparatus
Laboratory testing and
instruments
Dental goods and equipment
Instruments, professional and
scientific
-
Opt
ical
Instruments and parts
Other optical goods
Total, Minor
Gro
up41
2,474
12,577
13,459
637
102,868
)ad Cars 8,16
0403,038
47,5
55139,226
14,7
89612,768
1,003,070
iicles
238,909
140,
819
379,728
8,046
401
3,91
6
12,363
.tiflc Equipr
1,399
5,911
1,604
19,888
43,404
9,19
52,020
83,4
21
1,810
15,759
17,358
780
118,462
9,39
7201,939
42,373
80,717
20,190
354,616
208,
878
116,
296
64,488
180,784
4,133
200
1,95
6
6,289
1,084
6,820
1,591
17,557
31,320
7,499
1,647
67,518
3,100
24,526
16,809
819
206,399
8,865
425,869
59,216
185,808
28,917
706,
675
33,737
261,506
76,365
337,871
7,737
350
3,411
11,498
1,192
5,991
1,769
22,068
46,114
9,189
2,018
88,341
6,172
26,803
20,277
2,008
242,043
10,331
274,
618
43,605
48,028
15,596
392,178
37,417
346,357
81,5
97427,954
6,674
387
3795.
10,856
1,602
9,788
1,508
26,688
56,812
5,718
1,256
103,372
6,542
23,525
18,440
3,907
255,262
9,858
228,753
40,372
60,650
15,861
355,494
39,219
305,119
68,0
88.373,207
14,5
05 748
5,03
8
20,291
1,41
8
13,802
2,399
28,542
64,594
6,205
1,342
118,302
8,133
18,669
19,362
14,149
295,967
17,705
249,679
38,110
65,203
9,05
1379,748
56,676
356,686
266,449
623,
135
51,5
08
4,177
10,892
-5,103
61,4
74
2,104
23,555
6,00
633,029
64,198
13,504
2,827
145,223
none
reported
10,077
11,607
15,520
155,563
7,009
46,841
14,290
13,073
2,230
65,443
47,6
31
205,752
67,422
273,174
21,790
1,936
9,224
32,9
50
1,319
9,164
2,110
23,881
27,413
8,619
1,099
73,605
623
3,66
12,918
7,986
72,057
1,962
7,540
4,19
7787
2,486
16,952
13,517
137,514
41,788
179,302
15,670
1,565
5,898
23,133
1,18
5
4,389
976
16,355
17,0
268,094
1,048
49,071
Len
t

Group 43 Durable
Con
tain
ers
Table 1—4
(Con
tinue
d)
Industry Number
Major and Minor Groups
and Commodities
1919
1921
1923
1925
1927
1929
1931
1933
Minor Group 42 Carpenters' and Mechanics
Axes,
adze
sand hatchets
bits
,gimlets and counter-
sinks (woodworking only) and chisels
(except cold chisels)
Cutting dies (for use In cutting
cloth
paper, leather
etc.)
Edge tools —
othe
ranã not specified
Flies
Saws
Tools (excl. farm
tool
s)Total, Minor Group 42
C"
LJ
1103
1105
1116
1125
301
314
1008
1120
1123
214
240
310
320
511
-80
2901
1006
1007
1011
1012
1017
1103
1109
1206
1604
1605
1625
1636
Baskets and hampers, and other rattan
and willow ware
Tanks and vats
Beverage containers, pressure ware
Food—products containers, milk bottles
Steel barrels, kegs and drums
Ice-cream, cans and milk cans
Total, Minor Group 43
Minor Group 44 Miscellaneous Subsidiary
Rope, cable and cordage
Nets and seines
Lasts and related products
Ladders and parts
Scaffolding equipment
Printing materials, not md. type or
ink
Fire hose
Belting, leather
Crucible s
Emery wheels and other abrasive
appliances
Grindstones, pulpstones and millstones
Hones, whetstones and similar products
Chemical stoneware and porcelain
Saggers
Cutlery —
othe
rand not specified
Padlocks
Fire extinguishers, chemical
Industrial brooms, street—sweeping—
machine
broo
ms,
and
oth
er b
room
sPa
int a
nd v
arni
sh b
rush
es (
mci
.ar
tists
' bru
shes
)M
odel
sand patterns, not md. paper
patterns
Misc. photographic equipment
Total, Minor Group 44
Total,
Maj
or G
roup
of
Prod
ucer
s'D
urab
le C
omm
oditi
es
Tools
5,206
3,60
75,341
5,928
3,708
5,105
2,217
3,208
2,94
62,041
3,022
3,303
3,025
3,12
01,
245
772
1,91
81,329
1,968
2,153
3,057
3,981
3,363
3,181
5,206
3,60
75,341
5,931
9,969
4,108
1,055
2,245
18,515
8,037
14,257
14,2
3412,476
13,609
6,957
7,246
30,598
17,762
30,151
24,236
19,538
20,3
989,
471
8,11
279
,559
38,9
3865
,882
65,9
9363
,740
86,3
0134,370
27,701
143,948
75,321
125,962
121,778
115,513
136,622
58,678
52,465
12,042
11,777
15,404
18,384
23,797
24,7
0617
,168
13,0
164,
461
4,065
6,582
5,819
5,220
6,180
3,210
4,955
13,699
12,407
15,5
1614,513
15,995
16,690
13,097
20,102
9,99
79,055
11,3
2410,588
11,480
11,696
10,027
9,181
22,429
13,660
22,355
20,837
27,275
42,8
1822,060
30,977
4,124
2,94
63,
759
4,56
05,
537
5,79
93,
404
2,95
766
,752
53,910
74,940
74,701
89,304
107,889
68,966
81,188
Durable Equipment
57,577
25,809
38,4
4147,976
44,642
42,671
18,9
8715,238
5,22
73,082
4,692
5,717
5,774
6,589
2,867
2,026
12,134
12,5
599,
996
9,67
28,
109
7,67
35,
601
4,91
64,
768
4,101
4,889
4,614
4,811
5,345
2,84
62,
124
181
156
186
175
149
208
155
127
5,00
55,301
5,107
6,536
7,519
9,204
5,99
95,
513
4,09
02,748
5,15
35,401
6,20
35,
988
3,856
2,622
35,616
15,477
29,764
25,475
21,777
25,624
9,642
9,63
66,
674
2,463
4,153
2,767
2,504
2,752
1,114
758
31,127
12,5
3024
,940
25,381
22,4
2835
,523
15,274
14,5
641,
466
1,53
02,
283
2,01
21,
872
1,49
840
8532
769
290
500
732
753
975
5750
1,09
9829
1,157
1,171
1,243
1,342
970
700
2,11
61,927
1,870
1,764
1,916
1,308
645
326
1,57
61,092
1,616
1,751
2,937
6,631
4,719
3,985
6,074
4,19
77,
527
7,94
07,
046
6,54
73,657
2,209
5,249
3,97
85,
665
7,34
47,
495
7,54
44,468
3,78
6
1,89
41,
146
1,64
71,
419
1,20
72,
152
1,17
51,
043
15,7
6314
,465
20,8
6718
,778
19,3
2018
,354
11,572
9,450
25,3
6715
,675
30,839
22,864
23,833
39,010
17,725
9,447
4,367
3,50
93,
550
3,83
94,
460
5,04
73,
873
2,61
922
8,13
9133,064
204,842
203,328
195,
998
231,985
115,610
91,671
5,641,006
3,222,824
4,682,083
4,634,247
4,75
6,12
46,230,785
2,878,708
1,622,864

Table 1—4
(Con
clud
ed)
RECAPITIJIATION
Industry Number
Naj
or a
nd N
inor
Gro
ups
1919
1921
1923
1925
1927
1929
1931
1933
•Perishable
Semidurable
Consumers' Durable
-
Pro
duce
rs'Durable
All Finished Manufactured
Commodities
14,440,626
7,435,033
3,897,157
5,641,006
31,413,822
10,2
44,4
505,
872,
493
3,162,598
3,222,824
22,502,365
11,545,943
7,519,837
5,251,446
4,682,083
28,999,309
13,104,839
7,411,745
5,760,510
4,634,247
30,911,341
13,315,895
7,637,898
5,432,685
4,756,124
31,142,602
14,594,943
7,683,276
6,319,054
6,230,785
34,828,058
10,650,604
5,055,550
3,196,031
2,878,708
21,780,893
8,742,016
3,905,406
2,269,215
1,622,864
16,539,501
Table 1—5
OUTPUT OF CONSTRUCTION MATERIALS
CENSUS OF MANUFACTURES YEARS,
The entries in this table are for commodities marked C in Table 1—1 and forthose shown as construction materials in Table 1—3. The specific commodi-ties are listed in the order of the corresponding industry numbers. The valueof output is at prices charged by the manufacturing establishments.
Table 1—6
VALUE OF REPAIRS AND SERVICING
CENSUS OF MANUFACTURES YEARS, 1919-1933
The entries in this table are those marked S in Table I—i. Repairs andservicing are classified in two malor groups: those for consumers' durablecommodities and those for producers' durable commodities. Within eachgroup the items are arranged in the order of the Census industry numbersunder which they are reported.
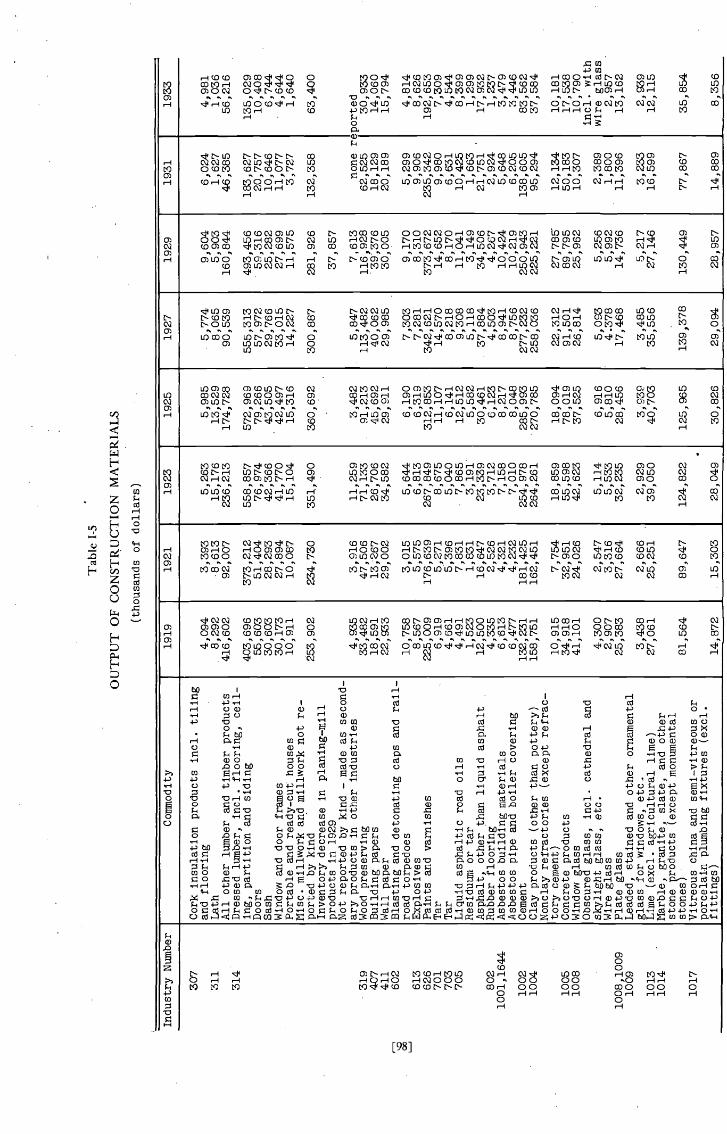
Tab
le 1
-5
OU
TPU
T O
F C
ON
STR
UC
TIO
N M
AT
ER
IAL
S
(tho
usan
ds o
f do
llars
)
Industry Number
CommodIty
1919
1921
1923
1925
1927
1929
1931
1933
'C
307
311
314
319
407
411
602
613
626
701
703
705
802
1001,1644
1002
1004
1005
1008
1008,1009
1009
1013
1014
1017
Cork insulation products mci. tiling
and flooring
Lath
All other lumber and timber products
Dressed lumber, mci. flooring, cell—
ing, partition and
sidi
ngDoors
Sash
Window and
door
frames
Portable and ready-cut houses
Misc. miliwork and millwork not re-
ported by kind
Inventory decrease in planing—mill
products in 1929
Not reported by kind —
mad
eas second-
ary products
In o
ther
indu
stri
esW
ood
preserving
Building papers
paper
Blasting and detonating caps and rail-
road torpedoes
Explosives
Paints and
varn
ishe
sTar
Tar
Liquid asphaltic road oils
Residuum or tar
Asphalt, other than liquid asphalt
Rubber flooring
Asbestos building materials
Asbestos pipe and boiler covering
Cement
Clay products (other than pottery)
Nonclay refractories (except refrac-
tory cement)
Concrete products
Window glass
Obscured glass, md. cathedral and
skylight glass, etc.
Wire glass
Plate glass
Leaded, stained and other ornamental
glass for windows, etc..
Lime (exci. agricultural lime)
Marble, granite, slate, and other
stone products (except monumental
stones)
Vitreous china and
sem
i—vi
treo
usor
porcelain plumbing fixtures (exci.
fittings)
4,094
3,393
5,263
5,985
.5,
774
9,604
6,024
4,981
8,292
15,176
13,529
8,065
5,903
1,627
1,036
416,602
92,007
236,213
174,728
90,539
160,844
46,385
56,216
403,696
373,212
558,857
572,969
555,313
493,456
183,627
135,029
.55,603
51,404
76,974
79,266
57,972
59,316
20,757
10,408
30,603
28,293
42,366
43,505
29,766
25,282
10,646
6,744
30,173
27,894
41,770
42,497
33,015
27,699
11,077
4,644
10,911
10,087
15,104
15,316
14,227
11,575
3,727
1,640
253,902
234,730
351,490
360,692
300,887
281,926
132,358
63,400
37,857
4,935
3,916
11,259
3,482
5,847
7,613
none reported
33,482
47,5
0671,133
91,213
113,482
116,928
62,525
30,933
18,591
13,267
26,706
45,692
40,062
39,376
18,129
14,060
22,933
29,002
34,582
29,911
29,985
.30
,005
20,189
15,794
10,758
3,015
5,644
6,190
7,303
9,170
5,299
4,814
8,567
5,575
6,813
6,319
7,281
8,310
9,906
8,626
225,009
176,639
267,849
312,853
342,621
373,672
235,342
192,653
6,919
5,271
8,675
11,107
14,570
14,652
9,980
7,309
4,661
5,396
5,040
6,141
8,218
8,170
6,631
4,544
4,49
17,831
.7,
865
12,512
9,308
11,041
10,425
8,399
1,523
1,831
3,191
5,582
5,118
3,149
1,663
1,299
12,500
16,647
23,339
30,4
6137,884
34,506
21,751
17,932
4,335
2,526
3,712
6,123
4,503
4,267
2,924
1,237
6,613
4,321
7,158
8,217
8,941
10,424
5,648
3,479
6,477
4,232
7,010
8,048
8,756
10,219
6,205
3,446
132,
231
181,425
254,978
285,993
277,232
250,943
138,605
83,562
158,751
162,451
264,261
270,785
258,036
225,221
95,2
9437,584
10,915
7,754
18,859
18,094
22,312
27,785
12,134
10,181
34,918
32,951
55,598
78,019
91,501
89,795
50,183
17,538
41,101
24,026
42,623
37,525
26,614
25,962
10,307
10,790
md. with
4,300
2,547
5,114
6,916
5,093
5,256
2,389
wire glass
2,907
3,316
5,533
5,810
4.378
5,992
1,800
2,957
25,383
27,664
32,235
28,456
17,468
14,736
11,396
13,162
3,438
2,666
2,929
3,939
3,485
.5,217
3,233
2,93
927,061
25,251
39,050
40,703
35,556
27,146
16,599
12,115
81,564
89,647
124,822
125,965
139,378
130,449
77,867
35,854
14,872
.15
,303
28,049
30,826
29,094
28,957
14,889
8,356

Table 1—5
(Con
clud
ed)
Industry Number
CommodIty
1919
1921
1923
1925
1927
1929
1931
1933.
1018
1020
Porcelain electrical supplIes
Sand—lime brick
Wall plaster, wall board, insulating
12,615
1,730
14,331
1,269
21,248
2,472
21,827
3,781
22,861
3,646
22,135
2,910
13,154
1,237
7,056
195
.
1101
1102
1104
board, and floor composition
Bolts, nuts, washers and rivets
Cast—iron pipe
Doors, shutters, and window sash and
35,298
35,352
48,515
49,871
18,065
40,401
73,441
38,234
90,144
90,438
35,777
97,387
81,934
34,621
91,238
.
75,622
41,101
85,890
52,900
23,688
51,111
27,340
19,830
22,633
1109
1112
frames, metal
BuIlders-' hardware other than locks
Rails, rerolled or renewed rails, rail
8,832
36,442
10,123
25,179
12,478
45,165
40,647
47,949
56,218
42,625
69,369
58,309
34,782
29,000
13,071
15,078
. 1112
,1113
joints and fastenings, tie—plates,
etc.
Concrete-reinforcing bars
Cut and wrought nails, spikes and
125,184
18,429
125,124
10,267
161,953
32,446
163,710
35,078
168,062
35,410
163,619
42,417
67,900
23,081
25,010
12,309
1113,1126,1127
1114
tacks
Wire nails, brass, etc.
Plumbers' supplies, not mci. pipe or
1,782
25,054
1,577
16,378
2,249
21,793
2,384
18,124
2,567
16,344
2,251
14,375
2,156
10,282
2,028
11,370
1117
1119,1121,1303
1119,1121
1122
vitreous—china sanitary ware
Wood screws
Heating apparatus
Fittings, valves and specialties
Structural and ornamental iron and
57,896
12,179
116,033
72,416
66,521
8,450
86,859
54,373
129,732
14,258
156,796
98,121
175,806
14,777
159,539
98,756
151,098
8,874
159,309
104,118
12,990
150,947
140,730
66,953
5,186
86,135
115,154
43,144
4,447
58,758
67,396
1128
1204
1207
1303
1305
1632
1638
steel' work
Wrought pipe,-wlded and heavy ri-
veted
Copper, tin and sheet—iron work
Electric—lighting equipment, residen—
tial and -nonresidential (except- port-
able lamps, candelabra and candle—
sticks and desk and reading lamps)
Street and highway fIxtures
Gas fixtures and equipment
Lighting equipment, not separately re—
ported by kind
Wiring devices
Interior conduits
Elevators and elevator machinery
Asphalt, tar, crushed slag and mix—
tures
Roofing, built—up and roll; asphalt
shingles, roof coatings, other than
paint
Total Construction Naterials
305,546
275,851
120,647
24,720
3,767
1,962
2,511
26,919
19,267
70,187
41,290
81,341
3,704,876
262,762
180,661
115,751
23,027
3,509
1,828
2,339
21,806
19,346
40,931
57,264
73,464
3,063,085
419,859
317,831
145,402
36,999
5,638
2,936
.
3,75
934,966
37,500
52,516
65,965
76,255
4,807,036
435,794
309,145
138,056
40,671
6,197
3,228
4,132
34,806
45,785
47,430
84,980
113,175
5,094,748
445,394
342,370
146,825
39,556
6,028
3,139
4,018
32,703
41,717
43,152
.
107,
137
115,335
4,956,083
482,284
371,860
170,896
47,804
7,337
3,786
4,921
38,395
58,158
44,044
27,619
-
101,
065
5,010,740
- .
-
237,216
172,528
89,428
.
23,882
4,195
1,467
none
reported
21,778
32,835
20,035
-
18,8
99
55,597
2,528,120
107,289
92,765
52,981
16,006
458
17,796
19,102
8,322
12,932
42,278
1,533,255
L4

Tab
le 1
-6
VA
LU
E O
F R
EPA
IRS
AN
D S
ER
VIC
ING
RE
POR
TE
D I
N T
HE
CE
NSU
S O
F M
AN
UFA
CT
UR
ES
(tho
usan
dsof dollars)
Industry Number
Major Group and Industry
1919
1921
1923
1925
1927
1929
1931
1933
Consumers' Durable
Prod
ucer
s' D
urab
leBelting, leather:
belt repairs (mci.
rebuilding and reworking)
Cutlery (not md. silver and plated
cutlery) and edge tools:
repair work
Doors, shutters:
custom and repair
work
Steel works and rolling mills:
custom
work and repairing
Electrical machinery, apparatus and
supplies:
custom work and repairs
Foundry and machine-shop products:
amount received for products mfd. on
contract and for machine—shop repair
work
Machine tools:
contract and repair
work
-
Mac
hine
—to
olaccessories and small
metal—working tools, n.e.c.:
contract
arid repair work
and
pumping equipment:
repair
work
Leather goods, n.e.c.: custom work and
repairing
Pocketbooks, purses and cardcases:
custom work and repairing
Firearms:
custom work and repairing
Clocks, watches and parts:
custom
work and repairing
Washing machines, etc:
repair work
Children's carriages and sleds, arid
toys and games:
repair work
Motor—vehicle bodies and motor—vehicle
parts:
contract and custom work and
repairing
Motor vehicles:
repair work
Fur goods:
custom worK and repairing
Musical instrument industries:
custom
work and repairing
Phonographs:
custom work and repair-
ing Total, Repairs and Servicing of Con-
sumers' Durable
r C C
906
908
1106
1202,1221
1222,1223
1315
1403,164-8
1407
1408
1615
1627,1628
1629,1630
1635
901
1103
1104
1112
1303
1305
1307
1318
1309
data
-21
6
115
680
1,649
959
219
15,023
16,104
20,037
1,47
2
233
56,707
194
112
1,064
1,122
1,294
236
13,063
10,998
19,241
1,96
6
1,072
50,362
265
29
396
764
489
210
7,614
25,372
5,017
1,576
269
42,001
1,136
69
371
6,307
27,106
135,039
8,921
950
239
2739
570
362
172
4,488
13,411
4,047
1,396
452
25,203
494
48
425
3,713
4,825
92,348
2,84
5
523
201
66
496
791
604
271
11,144
21,358
5,662
1,515
408
42,516
949
70
524
4,486
10,9
42
137,860
5,763
203 87
633
860
812
241
16,081
9,635
7,274
1,653
296
37,775
812
66
1,707
3,037
6,887
133,571
6,056
843
1,428
681
1,127
• 151
236
333 no
786
181
8,000
7,376
11,682
911
945
30,601
468
294
323
1,361
5,055
64,666
1,948
1,433
6,28
8
107
168
209
687
49
4,092
1,087
5,670
444
1,30
3
13,816
223
120
119
798
4,067
41,107
1,263
713
4,211
278
2,361
1,900
5,642
168,969
6,651
828
6,133
220
2,918
3,111
10,026
184,967
5,414
2,305
8,046
861
1,02.5
840
1,11
5

TABLE 1—6 (Concluded)
Industry Number
Major Group and Industry
1919
1921
1923
1925
1927
1929
1931
1933
1313
Textile machinery and parts:
repair
1401
and contract work
Alrcrart and parts:
experimental and
repair work
5,994
355
6,563
.
177
9,679
309
7,797
342
6,912
660
6,978
3,68
8
4,125
4,597
2,326
1,730
1404
1405
Carriages, wagons, sleighs and sleds:
parts and repair work
Cars, electric and steam railroad:
repair work
.
26,1
78
110,087
14,424
98,095
9,333
136,971
2,963
68,159
. 3,66
7
63,145
3,812
59,607
1,777
38,002
1,637
33,012
1406
Locomotives:
contract and repair
work
3,356
1,070
1,711
1,190
1,299
4,092
2,006
289
1410
ShIp and boat building, steel arid
.
.wooden, mci. repair work:
repair
work
187,486
104,995
113,327
89,514
101,464
.
114,
728
78,442
51,746
1501
Car and general construction and re—
pairs, electric—railroad repair shops:
.
.work done and products manuractured
(except locomotives and cars built)
74,434
86,064
82,690
82,987
83,590
84,806
S
61,7
4944,187
1502
Car and general construction and re—
pairs, steam—railroad repair shops:
.
work done and products manufactured
(except locomotives and cars built)
1,268,277
1,163,363
1,411,654
1,238,898
L,l78;418
1,158,324
670,600
456,259
.Total,
and Servicing of
Producers' Durable
Total, All Repairs and Servicing
1,857,091
1,899,092
1,580,812
1,606,015
1,928,244
1,970,760
1,646,257
1,684,032
.. 1,63
2,59
8
1,689,305
1,654,169
1,704,531
943,134
973,735
643,807
657,623
© I-.


Table 1—7
OUTPUT OF UNFINISHED COMMODITIES,
BY CENSUS GROUPS
CENSUS OF MANUFACTURES YEARS, 1919-1933
The entries in this table are for commodities marked u in Table I—i andfor those shown as unfinished in Table 1—3. They are grouped by the six-teen broad industry groupings distinguished in the Census of Manufactures.The order of the specific commodities within each industry group followsthe industry numbers of the Census. The value of output is at prices chargedby manufacturing establishments.
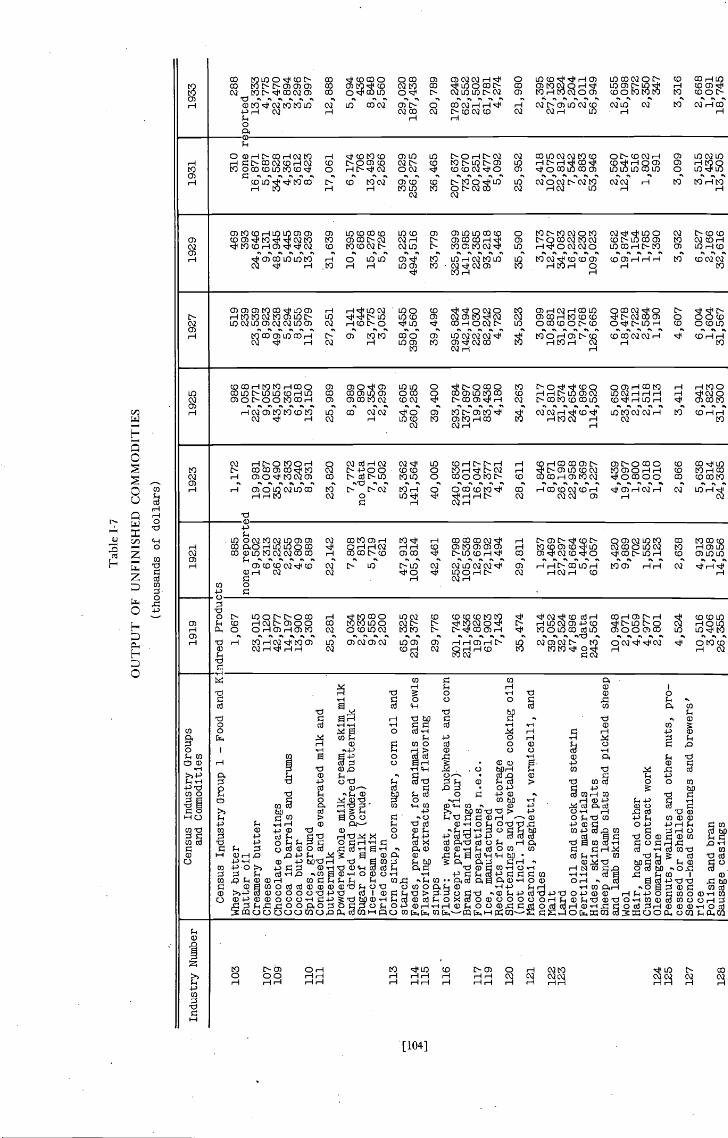
Tab
le 1
-7
OU
TPU
T O
F U
NFI
NIS
HE
D C
OM
MO
DIT
IES
(tho
usan
ds o
f do
llars
)
Industry Number
and Conimodities
Census Industry Groups
1919
1921
1923
1925
1927
1929
1931
1933
Census Industry Group 1 —
Foo
dand K:
103
Whey
butter
107
•Cheese
109
Chocolate coatings
Cocoa in barrels and drums
Cocoa butter
110
Spices, ground
111
Condensed and
evap
orat
edmilk and
buttermilk
Powdered whole milk, cream, skim milk
and dried and powdered buttermilk
Sugar of milk (crude)
Ice—cream mix
Dried casein
113
Corn sirup, corn sugar, corn oil and
starch
114
Feeds, prepared, br animals and fowls
115
Flavoring extracts and flavoring
sirups
116
Flour:
wheat, rye, buckwheat and corn
(except prepared flour)
Bra
nand middlings
117
Food preparations, n.e.c.
119
Ice, manufactured
Receipts for cold storage
120
Shortenings and vegetable cooking oils
(not md. lard)
121
MacaronI, spaghetti, vermicelli, and
noodles
122
Malt
123
Lard
Oleo oil and stock and
stea
rin
Fert
ilize
rniaterlals
Hides, skins and
pelts
Sheep and lamb slats and pickled sheep
and lamb skins
Wool
Hair, hog and other
Custom and contract work
124
Oleomargarine
125
Peanuts, walnuts and other nuts, pro-
cessed or shelled
127
Second-head screenings and brewers'
rice
Polish and bran
128
Sausage casings
Indred produ
1,067
23,015
11,120
42,977
14,197
13,900
9,308
25,281
9,034
2,633
9,55
82,200
65,325
219,372
29,776
301,746
211,436
19,826
61,903
7,143
35,4
74
2,31
439,052
32,524
47,896
no data
243,561
10,9
482,071
4,059
4,977
2,801
4,524
10,516
3,406
26,355
885
none report
19,502
6,313
26,252
2,255
4,809
6,889
22,142
7,808
813
5,719
621
47,913
105,814
42,461
252,798
105,
538
12,698
72,192
4,494
29,811
1,93
711,469
27,2
9718,664
5,446
61,0
57
3,420
9,889
702
1,555
1,123
2,638
4,913
1,598
14,556
1,172
19,981
10,087
35,490
2,38
35,240
8,93
1
23,820
7,772
no data
7,701
2,502
53,362
11,564
40,005
240,
836
118,
011
16,047
73,377
4,72
1
28,611
1,846
8,871
26,198
22,958
6,369
91,227
4,439
19,097
1,800
2,018
1,010
2,866
5,638
1,814
24,385
986
1,058
22,771
9,053
43,053
3,361
6,818
13,150
25,989
8,98
9890
12,354
2,29
9
54,605
260,285
39,400
293,784
137,
897
19,950
83,438
4,18
0
34,263
2,71
712,810
31,374
24,654
6,896
114,520
5,65
023,429
2,111
2,518
1,113
3,411
6,941
1,823
31,300
519
239
23,5
398,
923
49,238
5,294
8,555
11,979
27,251
9,141
644
13,7
753,052
58,4
5539
0,56
0
39,4
96
295,824
142,
194
22,030
82,242
4,72
0
34,523
3,09
910,881
31,6
1219,031
7,768
126,665
6,040
18,4
782,722
2,58
41,
190
4,607
6,004
1,604
31,567
469
393
24,646
9,13
148,945
5,44
55,429
13,239
31,639
10,395
686
15,278
5,726
59,225
494,516
33,779
325,399
141,985
22,385
93,2
185,446
35,590
3,17
312,407
34,083
16,222
6,230
109,023
6,562
19,874
1,154
1,785
1,390
3,932
6,527
2,166
32,616
310
none
16,871
5,687
34,528
4,361
3,612
8,423
17,061
6,174
706
13,493
2,266
39,029
256,275
36,465
207,
637
73,670
20,251
84,477
5,09
2
25,952
2,418
10,075
22,812
7,542
2,883
53,946
2,56
012,547
516
1,802
591
3,099
3,515
1,432
13,5
05
288
13,333
4,775
22,470
3,89
43,296
5,997
12,888
5,094
436
8,84
82,
560
29,020
187,438
20,789
.178,249
62,5
5221,502
61,781
4,274
21,980
2,395
27,136
19,324
5,204
2,01
156,949
2,655
15,098
372
2,350
347
3,316
2,668
1,09
118,745
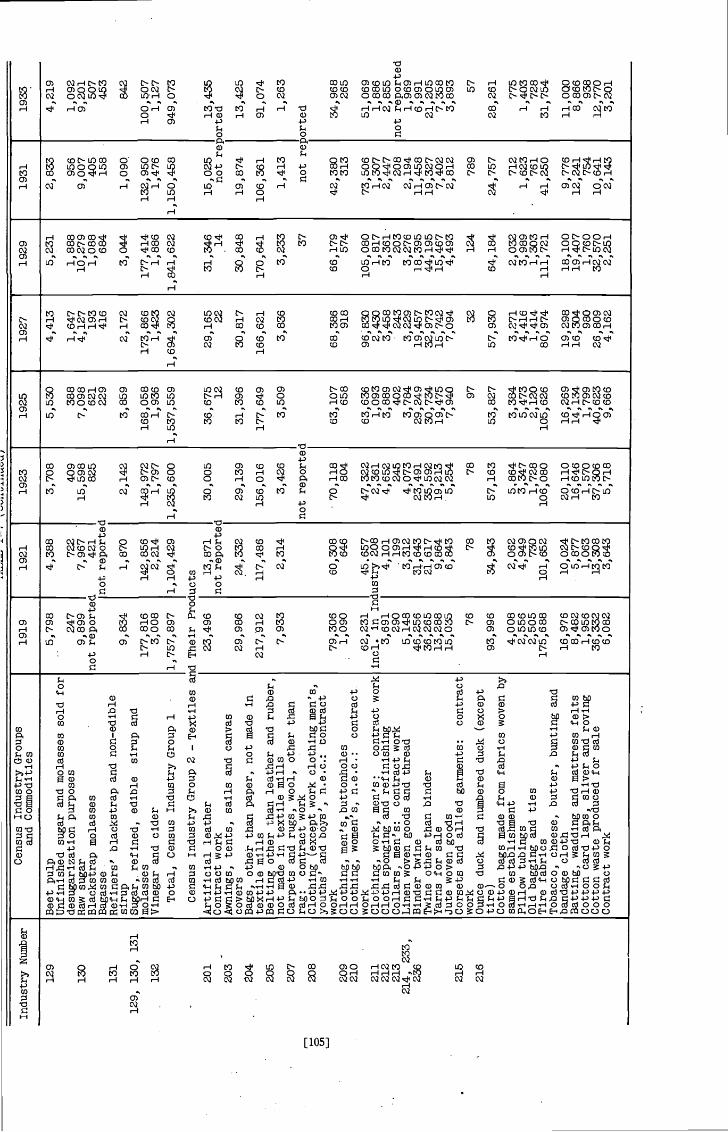
a- —
I'."
JhS
Industry Number
Census Industry Groups
arid Commodities
1919
1921
1923
1925
1927
1929
1931
1933 .
I
129
130
131
129, 130, 131
132
201
203
204
205
207
208
209
210
211
212
213
214, 233,
236
215
216
CM
I
Beet pulp
5,798
4,388
Un!inished sugar arid molasses sold for
desugarization purposes
247
722
Raw sugar
9,899
7,967
Blackstrap molasses
not reported
Bagasse
not reporte
Refiners' blackstrap and non—edible
sirup
9,834
1,870
Suga
r, r
efin
ed,
edible
sirup and
molasses
177,816
142,856
Vinegar and cider
3,008
2,214
Total, Census Industry Group 1
1,757,897
1,104,429
Census Industry Group 2 —
Tex
tiles
and Their Products
Artificial leather
23,496
13,871
Contract work
not reporte
Awnings, tents, sails and canvas
covers
29,986
24,332
Bags, other than paper, not made in
-
text
ilemills
217,912
117,486
Belting other than leather and rubber,
not made in textile mIlls
7,933
2,314
Carpets and rugs, wool, other than
rag:
contract work
Clothing (except work clothing men's,
youths' and boys', n.e.c.: contract
work
79,306
60,308.
Clothing, inen's,buttonholes
1,090
646
Clothing, women's, n.e.c.:
contract
work
62,231
45.657
Clothing, work, men's:
contract work mci. in
Indu
stry
208
Clo
th s
pong
ing
and
refi
nish
ing
3,69
14,
101
Col
lars
, men
's:
cont
ract
wor
k29
0-
199
Lin
en w
oven
goo
ds a
nd th
read
5,14
83,
312
Bin
der
twine
46,256
Twine other than binder
36,265
21,617
Yarns for sale
13,288
9,864
Jute woven goods
15,035
6,843
Corsets and allied gannents:
contract
work
76
78
Ounce
duck
and
num
bere
d du
ck (
exce
pttir
e)93
,996
34,9
4-3
Cotton bags made from fabrics woven by
same establishment
4,008
2,062
Pillow tubings
2,556
4,949
Old bagging and ties
2,505
730
Tire fabrics
175,688
101,652
Tobacco, cheese, butter, bunting and
bandage
clot
h16
,976
10,0
24B
attin
g, w
addi
ng a
ndmattress
felts
8,48
25,877
Cotton card laps, sliver and roving
1,956
1,063
Cotton waste produced for sale
36,332
13,308
Contract work
6,082
3,643
I.
3,70
8
409
15,598
825
2,142
148,
972
1,797
1,23
5,60
0
30,005
29,1
39
156,
016
3,42
6
not
70,118
804
47,3
222,361
4,652
245
4,073
23,
491
35,5
9219,213
5,25
4 78
57,1
63
5,86
43,
347
1,728
106,
080
20,1
1016
,646
1,57
037
,306
5,718
5,530
388
7,09
862
122
9
3,85
9
168,
058
1,93
61,
537,
559
36,6
75 12
31,3
96
177,
649
3,50
9
63,1
07 658
63,6
361,093
3,88
940
23,784
29,249
30,7
3419,475
7,940 97
53,8
27
3,38
45,473
2,12
0105,
626
16,2
6914,134
1,799
40,6
239,666
4,413
1,647
4,12
719
341
6
2,17
2
173,
866
1,42
31,694,302
29,165 22
30,817
166,621
3,83
6
68,3
86 918
96; 8
302,
430
3,458
243
3,229
19,4
5732,973
15,742
7,09
4 32
57,930
3,27
14,
416
1,41
480
,974
19,2
9816
,304 980
26,8
094,
162
5,23
1
1,88
810
,279
1,08
8684
3,044
177,
414
1,886
1,84
1,62
2
31,346 14
30,8
48
170,641
3,233
37
66,1
79 574
105,080
1,81
73,
361
203
3,27
618
,395
44,1
9515,467
4,49
3
124
64,1
84
2,032
3,989
1,30
3111,721
18,1
0019
,407
1,760
32,5
702,
251
2,833
956
9,007
405
158
1,09
Q
132,
950
1,476
1,150,458
15,025
not rei
19, 874
106,361
1,413
not
rej
42,380
313
73,5
061,
307
2,447
208
2,194
11,4
5819,327
7,40
22,812
789
24,757
712
1,62
376
141
,250
9,776
12,2
41 754
10,641
2,14
3
4,219
1,092
9,201
507
453
842
100,507
1,12
7949,073
13,4
35ported
13,425
91,074
1,263
34,968
265
51,0
691,886
2,85
5no
treported
1,969
6,99
121
,205
7,35
83,893 57
28,2
61 775
1,40
3728
31,7
54
11,OQO
8,866
938
12,7
703,201
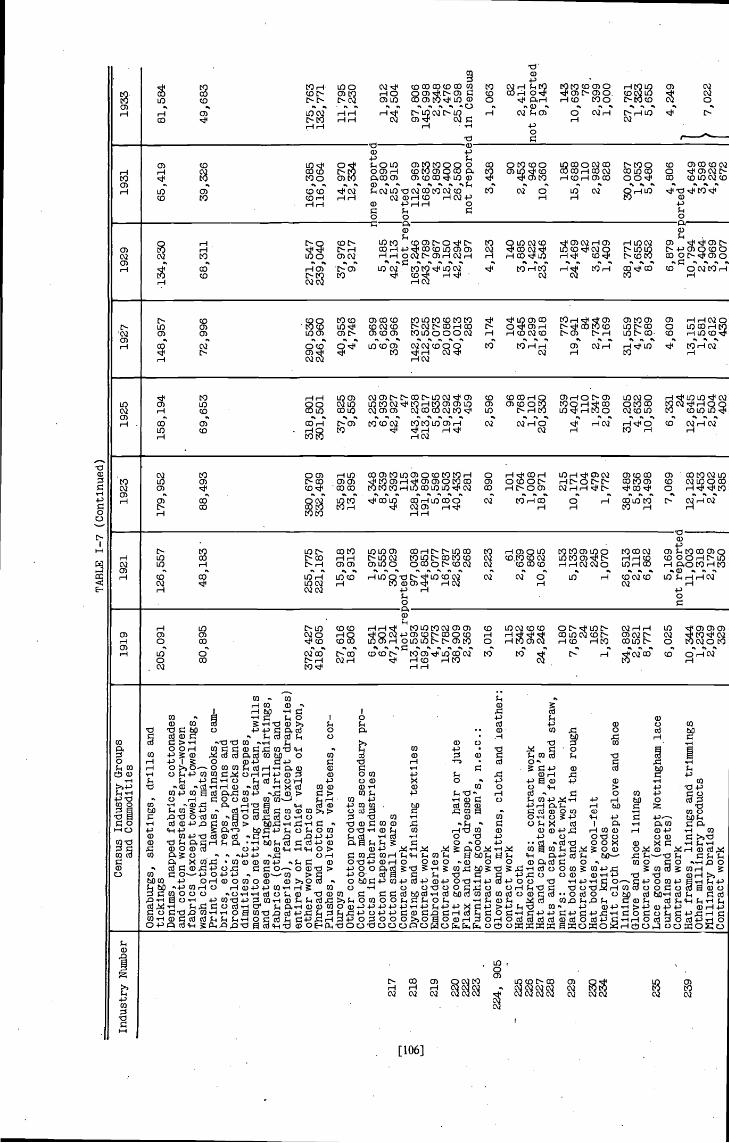
TA
BLE
I—?
(Continued)
Industry Number
Census Industry Groups
and Commodities
1919
1921
1923
1925
1927
1929
1931
1933
Osnaburgs, sheetings, drills and
ti ckings
Denims, napped fabrics, cottonades
and cotton worsteds, terry—woven
fabrics (except towels, towelings,
wash cloths, and bath mats)
Print cloth, lawns, nainsooks, cam—
bric
s,etc., reps, poplins and
broadcloths, pajama checks and
dimnities, etc., volles, crepes,
mosquito netting and tarlatan, twills
and sateens, ginghams, all shirtings,
fabrics (other than shirtings and
draperies), fabrics (.except draperies)
entirely or in chief value of rayon,
other woven fabrics
Thread and cotton yarns
Plushes, velvets, velveteens, cor—
duroys
Other cotton products
Cotton goods made as secondary pro—
ducts in other industries
Cotton tapestries
Cotton small wares
Contract work
Dyeing and finishing textiles
Contract work
Embroideries
Contract work
Felt goods, wool, hair or jute
Flax and hemp, dressed
Furnishing goods, men's, n.e.c.:
contract work
Gloves and mittens, cloth and leather:
contract work
Hair cloth
Handkerchiefs:
contract work
Hat and cap materials, men's
Hats and caps, except felt and straw,
men's:
contract work
Hat bodies and hats in the rough
Contract work
Hat bodies, wool—felt
Other knit goods
Knit cloth (except glove and shoe
linings)
Glove and shoe linings
Contract work
Lace goods (except Nottingham lace
curtains and. nets)
Contract work
Hat frames, linings and trinunings
Other millinery products
Millinery braids
Contract work
205,091
80,895
372,427
418,605
27,616
18,806
6,541
6,901
47,124
not re
113,593
169,565
4,773
15,782
38,909
2,369
3,016
115
3,342
946
24,246
180
7,657
24
165
1,377
34,892
2,521
8,771
6,025
10,344
1,239
2,049
329
217
218
219
220
222
223
-
224,
905
225
226
227
228
229
230
234
235
239
126,557
48,183
255, 775
221,187
15,918
6,913
1,975
5,555
30,029
orted97,038
144,851
5,077
16,787
22,635
268
2,223
.61
2,639
860
10,625
153
5,133
299
245
1,070.
26,513
2,118
6,862
5,169
not reportec
11,003
1,318
2,179
350
179,952
88,493
380,670
332,489
35,891
13,895
4,348
8,339
45,393
115
128,549
191,890
5,596
18,503
40,433
281
2,890
101
3,764
1,008
18,971
215
10,171
104
479
1,772
38,489
5,836
13,498
7,069
12,128
1,453
2,402
385
158,194
69,653
318,801
301,501
37,825
9,559
3,252
6,939
42,927
47
143,238
213,817
5,835
19,292
41,394
459
2,596
96
2,768
1,101
20,330
539
14,401
110
1,347
2,089
31,205
4,632
10,580
6,331 24
12,645
1,515
2,504
402
148,957
72,996
290,536
246, 960
40,953
4,746
5,969
6,628
39,966
142,373
212,525
6,073
20,086
40,013
283
3,174
104-
3,645
1,299
21,618
773
19,94184
2,734
1,169
31,559
4,773
5,889
4,609
13,151
1,581
2,612
430
134,230
68,311
271,547
239,040
37,976
9,217
5,185
42,113
not rei
163,246
243,789
4,967
15,150
42,294
197
4,123
140
3,885
1,422
23,546
1,154
24,469 42
3,621
1,409
38,771
4,655
8,352
6,879
not rej
10, 794
2,404
3,969
1,007
65,419
39,326
166,385
116,064
14,970
12,334
one reportec
2,890
25,915
orted
112,969
168,633
3,893
12,400
26,580
not reportE
3,438
90
2,453
946
10,360
185
15, 688
110
2,982
828
30,087
1,053
5,480
4,806
orted 4,649
3,598
4,226
672
81,584
49,683
175,763
132,771
11,795
11,230
1,912
24,504
97,806
145,998
2,348
7,476
.25,598
4 In Census
1,063
82
2,411
not reported
9,143
143
10,693
76.
2,399
1,090
27,761
1,323
5,655
4,249
}
'7,
022

TA
BL
E I
—?
(Continued)
Industry Number
Census Industry Groups
and Commodities
1919
1921
1923
1925
1927
.
1929
1931
1933
1,532
11,972
393,408
29,829
306
21,422
2,77
14,130
16,739
463,906
154,807
17,156
13,142
6,767
6,820
5,944
480
2,749,221
©
1,876
14,655
519,659
32,730
173
23,612
3,054
7,731
33,140
630,461
247,579
43,5
3913,522
15,176
8,190
14,026
1,118
3,893,134
243
244
245
246
247
248
249,
253
250
251
252
301
302
303
304
306
307
308
309
310
311
Neckbands, etc.., for sale as such
.1,
603
Contract work
12,522
Silk and rayon products
462,254
Contract work
38,335
Suspenders, garters, and other elastic
woven goods, made from purchased web-
bing:
contract work
413
Trimmings (except bias bindings for the
notion trade)
20,138
Contract work
2,605
Upholstery materials, n.e.c.
6,799
Waste
30 590
Contract work
Woolen and worsted woven goods (except
blankets)
626,202
Woolen and worsted yarns
230,922
Wool card rolls, bats and batting,
tops and slubbing, foils and wool
waste for sale
39,732
Contract work
18,387
Wool pulling
17,361
Wool scouring
13,680
Wool shoddy
22,084
Contract work
1,099
Total, Census Industry Group 2
4,073,545
Census Industry Group 3 —
For
estProducts
Baskets and rattan and willow ware,
not md. furniture:
custom and
contract work
Billiard and pool tables, bowling
alleys, and accessories:
custom and
contract work
273
Boxes, cigar, wooden
13,659
Custom and contract work
23
Boxes, wooden, except cigar boxes
187,976
Custom and contract work
109
Cooperage
91,856
Custom and contract work
118
Cork stoppers and bottle closures
4,061
Cork specialties and cork products
not reported separately
8,025
Excelsior
4,978
Other furniture for public buildings
(seats for public conveyances, etc.)
1,968
Unfinished frames for suites, chairs,
etc.
8,572
Radio cabinets
1,347
Contract, custom and repair work
not re:
Lasts and related products:
custom
and contract work
135
Pulpwood
9,748
All other lumber and timber products
555,773
1,72
413
,471
544,285
48,943
195
24,618
3,184
8,736
139
,308 35
3566,620
208,984
41, 826
11,120
15,209
5,831
19,201
1,241
3,76
9,42
3
100
13,50023
219,361
124
68,7
37 87
6,739
4,223
4,920
5,067
10,742
17,616
4,308
101
8,534
665,
792
not reported
1,892
14,577
•50
9,45
748
,566 196
25,639
3,309
10,549
33,476
431
481,833
182,185
39,785
11,580
14,640
6,66
210,737
1,363
3,491,897
36
127
12,775 82
180,113
371
65,722
208
6,294
5,897
4,686
6,845
10,788
18,128
4,927
82
6,696
568,088
1,592
17,630
507,
783
57,274
215
22,598
1,121
12,259
33,268
657
468,428
197,760
31,980
14,741
13,648
6,241
13,3
541,174
3,576,229
16
103
11,723
100
197,778
262
61,877
174
7,195
6,857
4,954
18,2
65
7,355
69,5
515,544
168
7,708
595,226
not reported
1,058
15,977
6,195
294,721
195,393
46,366
39,301
132
94
17,399
13,274
300
235
5,527.
15,258
3,215
}14
,163
272,019
126,561
251,501
108,619
19,120
13,991
7,378
4,640
26,564
12,739
10,226
4,404
5,197
8,203
576
345
2,116,484
1,888,426
19
not reported
41
12
8,680
5,699
not reported
108,206
79,2
3771
64
37,575
33,3
97289
538
3,382
2,826
3,065
-2,834
3,038
1,969
15,277
4,781
3,84
112
,601
2,568
6,756
1,583
664
144
-12
62,819
222,459
2,22
015
5,75
8
130
14,856 25
133,
660 77
58,12074
3,376
6,660
4,304
2,20
9
7,91
31,776
'orted
134
5,27
2433,158
113
15,234 25
178,
192
103
73,73195
5,200
5,726
5,447
4,30
2
9,884
2,65
03,858
107
9,386
688,
067
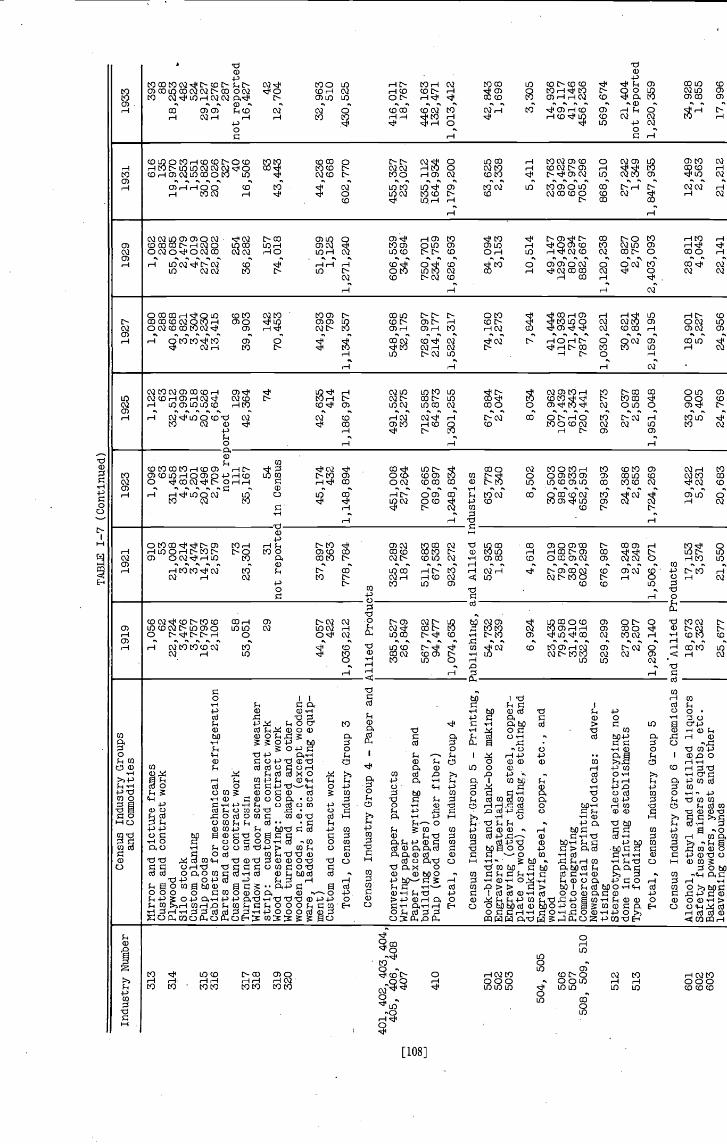
TA
BLE
1—
7(Continued)
Industry Number
Census Industry Groups
anl Conimodities
1919
1921
1923
1925
1927
1929
1931
1933
S
910
53
21,008
3,214
3,474
14,137
2,579
1,05662
22,724
3,476
3,757
16,793
2,106 58
53,051 29
1,096
1,122
63
63
31,458
32,512
4,813
4,999
5,201
5,518
20,496
20,526
2,709
6,641
not reported
111
129
35,167
42,364
54
74
Census
313
314
315
316
317
318
319
320
401, 402, 403, 404,
405, 406, 408
407
410
501
502
503
504, 505
506
507
508, 509, 510
512
513
601
602
603
Nirror and picture
fram
esCustom and contract work
Plywood
Silo stock
Custom planing
Pulp goods
Cabinets for mechanical refrigeration
Parts and accessories
Custom and contract work
73
Turpentine and rosin
Window and door screens and weather
23,301
strip:
custom and contract work
31
Wood preserving:
contract work
not reported in
Wood turned and shaped and other
wooden goods, n.e.c. (except wooden—
ware
ladders and scaffolding equip—
menti
Custom and contract work
44,057
422
37,897
363
45,174
432
Total, Census Industry Group 3
1,036,212
778,784
1,148,894
Census Industry Group 4 —
Pap
erand
Allied Products
Converted paper products
385,527
325,289
451,008
Writing paper
Paper (except writing paper and
building papers)
Pulp (wood and other fiber)
26,849
567,782
94,477
18,762
511,683
67,538
27,264
700,665
69,897
Total, Census Industry Group 4
1,074,635
923,272
1,248,834
Census IndustryGroup 5 —
Prin
ting,
Publishing,
and Allied Industries
Book—binding and blank—book making
54,732
52,935
63,778
Engravers' materials
Engraving (other than steel, copper-
plate or wood), chasing, etching and
diesinking
2,339.
6,924
1,858
4,618
2,340
8,502
Engravlng,steel, copper, etc., and
wood
Lithographlng
23,435
79,598
27,019
79,880
30,503
98,690
Photo—engraving
Commercial printing
31,410
532,616
38,979
602,298
46,933
652,591
Newspapers and periodicals:
adver-
tising
Stereotyping and electrotyping not
529,299
676,987
793,893
done in printing establishments
27,380
19,248
24,386
Type founding
2,207
2,249
2,653
Total, Census Industry Group 5
1,290,140
1,506,071
1,724,269
Census Industry Group 6 —
Che
mic
als
and Allied Products
Alcohol, ethyl and distilled liquors
Safety fuses, miners' squibs, etc.
18,673
3,322
17,153
3,374
19,422
5,231
Baking powders, yeast and other
leavening compounds
25,677
21,550
20,683
1,080
288
40,668
3,821
3,304
24,230
13,415
96
39,903
142
70,453
44,293
799
1,134,357
548,968
32,175
726,997
214,177
1,522,317
74,160
2,273
7,844
41,444
110,938
71,451
787,409
1,030,221
30,621
2,834
2,159,195
18,901
5,227
24,956
1,062
282
55,085
2,479
4,019
27,220
22,802
254
36,282
157
74,018
51,599
1,125
1,271,240
606,539
34,694
750,701
234,759
1,626,693
84,094
3,153
10,514
49,147
129,409
80,294
882,667
1,120,238
40,827
2,750
2,403,093
28,811
4,043
22,141
616
135
19,970
1,253
1,551
30,826
20,026
327
40
16,506 83
43,443
44,236
668
602,770
455,327
23,027
535,112
164,934
,179,200
63,625
2,338
5,411
23,763
89,422
60,979
705,296
868,510
27,242
1,349
,847,935
12,469
2,563
21,212
1
39388
18,253
-
482
524
29,127
19,276
287
not reported
16,427
42
12,704
32,963
510
430,525
416,011
18,767
446,163
132,471
1,013,412
42,843
1,698
3,305
14,936
69,117
41,146
456,236
569,674
21,404
not reported
1,220,359
34,928
1,855
17,996
42,635
414
1,186,971
491,522
32,275
712,585
64,873
1,301,255
67,884
2,047
8,034
30,962
107,439
61,343.
720,441
923,273
27,037
2,588
1,951,048
33,900
5,405
24,769
1

Industry Number
Census Industry Groups
and Commodities
1919
TA
BLE
1—
7(C
ontIn
ued)
1921
1923
1925
1927
1929
1931
1933
'0
604
605
606
607
608
609
610
611
612
613
614
616
617
618
619
620
621
622
623
624
625
626
627
628
629
630
631
632
633
701
701, 703, 705
703
704, 705
Blacking, stains and dressings
Bluing
-
Bon
ebl
ack,
car
bon
blac
k an
dlampb lack
Candles
Chemicals, n.e.c.
Cleaning and polishing preparations
Compressed and liquefied gases
Biological products for animal use
Drug grinding
Explosives
Fertilizers
Glue and gelatin
Grease and
not mci. lubri-
cating greases
Ink, printing
Ink, writing
Liquors, vinous
Mucilage
paste, and other adhesives,
except gfue and rubber cement
011, cake and meal, cottonseed
Oil, cake' and meal, linseed
Oils, essential
Oils, n.e.c.
Paints and varnishes
Agricultural insecticides and fungi-
cides
Boiler compounds
Perfumes, cosmetics and other toilet
preparations
Rayon and allied products
Salt
Soap
Tanning materials, natural dyestuffs,
etc.
Wood distillation and charcoal manu-
facture
Total, Census Industry Group 6
Industry Groun 7 —
Pro
duct
so
Screenings and breeze and by-products
(except gas and tar)
Coke
Gas, manufactured, illuminating and
heating:
by—products (except coke and
tar)•
Light
prod
ucts
of distillation (except
gasoline)
Partially refined oils, sold for re-
running
Petrolatuni, mineral jelly, etc.
Paraffin wax
Acid oil
4,093
218
10,386
3,440
332,995
4,071
40,421
6,503
10,086
50,179
176,600
23,177
34,851
20,220
395
1,551
5,393
217,225
69,489
3,422
45,705
67,939
4,622
3,622
2,813
36,766
25, 764
22,088
27,501
9,710
1,303,322
and Coal
28,175
154,653
3,80
9
40,483
24,178
2,552
11,764
1,477
5,628
313
7,579
4,75
8504,848
4,74
843,264
9,510
16,9
3877,101
287,715
34,898
91,8
9525,429
586
5,448
5,985
581,245
116, 773
5,698
76,675
86,542
4,821
3,80
1
2,545
36,885
29, 147
25,938
52,9
58
32,662
2,230,005
Petroleum
39, 602
265,477
4,340
77,480
29,2
693,750
28,348
993
•5,603
176
15,567
4,174
530,383
6,513
53,384
8,38
710,562
61,320
179,950
26,457
61,460
28,510
528
1,863
5,833
226,388
109,455
3,18
457,897
103,019
6,740
4,889
3,696
59,051
28,622
25,254
33,410
29, 761
1,737,372
53, 176
365,817
4,90
4
47,624
54,977
2,78
712,899
1,472
5,498
232
13,614
4,313
505,462
6,74
155,533
6,36
38,446
57,507
195,040
26,0
85
70,618
34,260
504
1,171
6,910
295,685
128,693
5,882
57,710
120,329
7,591
5,757
4,569
88,008
26,614
26,606
31,224
25,238
1,88
6,27
7
51,718
250,047
4 •
021
47,048
65,305
3,559
30,590
1,139
4,947
180
14,518
4,510
562,845
9,131
61,864
11,026
9,205
58,911
173,810
30,752
62,9
2635,472
450
718
4,680
276,338
112,111
4,642
50,660
131,777
8,782
5,867
5,533
109,
888
26,673
27,414
30,929
27,571
1,913,214
53,370
246,978
6,531
53,683
62,210
2,974
23,432
1,849
5,416
152
20,703
4,815
700,023
11,365
71,293
9,734
9,66
954,643
222,
731
32,196
67,872
41,630
444
694
4,214
298,376
118,389
6,653
45,160
143,
720
10,340
5,084
6,156
149,546
29,4
0931,673
33,615
30,289
2,221,899
62,774
242,090
6,74
3
78,802
49,1
432,548
22,328
663
4,464
131
10,230.
3,635
488,934
10,269
62,484
7,733
9,159
30,363
140,718
27,653
32,575
32,3
29336
280
2,987
181,347
64.4
583,505
25,922
90,5
16
6,965
3,387
5,154
132,632
24,470
26,187
24,091
11,4
881,500,666
28,622
123,658
4,268
22,690
28,458
2,222
13,3
531,
120
4,182
114
8,488
2,780
433,771
8,778
49,781
5,088
6,399
20,419
85,028
17,249
29,229
26,1
31 240
280
2,044
104,212
41,475
3,094
22,254
74,098
3,781
3,365
3,51?
156,932
22,596
20,297
21,964
11,080
1,243,445
20,952
74,553
3,443
14,577
23,762
1,968
12,225
1,015

TA
BLE
I—?
(Continued)
Industry Number
Census Industry Groups
and Conimoditles
1919
1921
1923
1925
1927
1929
1931
.
1933
20,413
278,300
581,872
365,398
1,711,074
28,333
186,541
282,671
251,744
973,680
—
Other refinery products
Lubricating oils and greases
Gasoline
Fuel oils
Total, Census Industry Group 7
Census Industry Group B -
Rub
berPro
Rubber belting
Rubber hose and tubing (except garden
and fire hose)
All other mechanical rubber goods
Hard-rubber goods, battery Jars,
boxes and parts
Hard-rubber goods, other than battery
jars, etc.
Rubberized fabrics
Reclaimed rubber
Rubber thread
Other manufactures of rubber
Not distributed by class or kind
Rubber erasers and rubber bands
Rubber. cement
Jar rings
Tire sundries and repair materials
Rubber heels, soles and soling strips
Pneumatic tires and tubes, motor-
vehicle, except motorcycle
Pneumatic tires and tubes, motorcycle
and bicycle
Solid and cushion tires
Total, Census Industry Group 8
Census Industry Group 9 —
Leat
her
an
Boot and shoe cut stock, not made in
boot and shoe factories
Boot and shoe findings, not made in
boot and shoe factories
Boots and shoes, other than rubber:
contract work
Misc. leather products
Contract work
-
Leat
her
Contract work
By—products
of ta
nnin
g, c
urry
ing
and
finishing
Pock
etbo
oks,
-pu
rses
and
car
dcas
es:
cont
ract
wor
kT
otal
,Census Industry
Gro
up 9
802
803
902
903
904
906
907
908
1001, 1644
22,324
244,121
335,511
442,336
1,495,319
21,947
27,177
36,557
9,862
6,320
26,541
27,373
5,340
40,428
612
1,876
1,167
13,316
21,604
160,450
810
8,956
410,336
15,473
23,608
248,702
204,790
265,148
327,862
314,943
373,491
1,293,525
1,196,842
lucts 22,436
13,067
14,188
9,532
31,464
18,531
17,948
6,233
11,504
3,996
24,409
11,219
20,173
7,424
4,069
2,371
27,400
14,908
9,134
2,498
615
526
included with
889
518
7,377
4,836
14,847
13,014
151,068
97,571
3,270
1,256
19,994
8,441
380,785
215,941
I Its Nanufactures
163,363
78,423
65,080
39,772
876
1,128
9,872
8,746
1,006
907
856,379
353,474
45,501
18,785
18,572
7,667
117
106
1,160,766
Products
33,611
228,640
341,925
342,209
1,490,041
24,267
17,873
26,307
13,120
8,410
20,758
11,714
3,485
29,054
2,431
773
Industry 621
762
7,896
21,449
186,903
1,563
12,739
389,504
106,236
49,782
1,300
7,977
763
451,549
23,956
9,778
264
651,605
25,776
13,608
25,894
12,219
49,140
27,648
5,810
5,577
8,490
4,115
29,754
17,653
23,906
9,985
5,190
2,904
45,446
32,229
none reported
740
446
2,269
1,576
1,146
1,190
10,301
6,229
18,593
16,513
205,4.45
.
74,5
40
735
461
5,236
.238
463,871
227,131
29,894
257,674
475,112
476,734
1, 692, 841
23,481
18,729
38,535
15,196
9,741
21,633
23,021
5,745
33, 972
10,999
719
1,256
14,320
24,439
218,589
1,273
17,545
479,193
96,403
56,067
1,203
8,387
770
416,568
22,157
9,044
346
612,945
36,019
121,203
259,995
228,957
798,669
12,928
11,743
24,384
4,339
3,976
18,251
5,983
2,236
32,556
354
1,149
681
5,081
16,542
46,481
440
165
187,289
60,388
38,867
971
2,624
251
222,885
9,331
1,254
56
336,627
Census Industry Group 10 —
Sto
ne,Clay, and Glass
Asbestos textiles, except brake lin-
ings and clutch facings
10,022
129,887
143,190
555
58,382
59,588
37., 973
1,233
1,593
695
8,287
8,274
3,707
.823
670
354
454,965
458,308
253,682
24,201
17,457
11,972
10,010
1,726
3,975
461
522
94
688,249
691,328
398,007
6,548
10,847
12,453
13,549
15,804
8,375
6,477

Industry Number
Census Industry Groups
and CommodIties
1919
TABLE 1—7 (Continued)
1921
1923
1925
1927
1929
1931
1933
1002
1004
1008
1008
,1009
1009
1010
1013
1015
1016
1019
1101
1107
1109
1109
1110
1111
1112
All other asbestos products
Custom and contract work
Brake linings and clutch facings
Cement
Fire—clay products, shaped:
brick,
block or tile for locomotive and
other fire—box lining
Clay sold, raw or prepared
Pressed and blown glass (except con-
tainers)
Bulbs for electric lamps, opal ware,
etc.
Lenses
Glass containers (except pressure
ware, milk bottles and fruit jars)
Glass tubing
Other glass products
Plate glass
-
All
other glass products made from
purchased glass
Graphite, ground and refined
Agricultural lime
I'lInerals and earths, ground or other-
wise treated
Mirrors, framed and unframed
Stat
uary
and art goods, factory
product
Total, Census Industry Group 10
Census Industry Group 11 —
Iron
and
Bolts, nuts, washers and rivets
F'orgings, iron and steel, not made in
plants operated in connection with
rolling mills
Locks (except padlocks)
Furniture and cabinet, piano and
organ, saddlery and harness, and
trunk and suitcase hardware, other
than locks
Vehicle hardware other than locks
Other hardware and hardware not re-
ported by class
Pig
iron
(md. rerro—alloys)
Blast—furnace
gas
used
as
fuel
Slag
Iron
and
ste
el, p
roce
ssed
Unr
olle
dsteel
Semifinished rolled products
Structural shapes (not assembled or
fabricated)
Merchant bars, mill shaftings, etc.
26,9
99 129
14,558
6,483
36,9
521,
786
7,510
22,703
2,696
64,707
3,863
2,05
710
,879
13,6
942,
240
1,157
44,6
347,383
3,31
628
3,76
8
and
74,437
166, 97q
25,893
24, 2
9527
,557
29,4
0978
5,96
05,
929
655
9,92
6
169,
465
389,
596
138,
142
319,
096
17,6
40 849,451
6,28
3
24,138
1,16
0
5,91
5
17,880
2,12
3
58,6
063,
042
1,80
111
,856
10,6
17
1,08
0
26,1
285,
962
4,37
621
6,14
7
Their Products
38,038
79,908
17,8
91
16,7
8619
,016
20,3
20408,582
7,79
886
15,
466
85,7
5217
5,74
8
57,2
7310
0,90
1
29,2
21 140
15,394
9,54
6
45,370
3,18
2
8,20
4
24,7
992,
944
73,2
924,
219
2,38
636
,351
11,6
68•2
,l85
1,67
0
34,7
3811
,314
5,06
933
2,53
9
80,5
05
172,030
32,0
91
30,110
33,6
33
36,4
49984,983
17,0
341,
345
8,002
240,
533
455,460.
161,749
345,
936
33,5
46 160
17,6
6412
,951
40,7
283,
482
7,65
2
23,1
322,
744
68,5
60:3
, 935
6,63
732
,089
15,6
882,
569
1,74
0
41,8
1010,850
6,38
234
4,77
2
75,2
10
129,
211
34,0
72
31,8
6135
,917
38,6
3674
4,73
417,004
1,68
71,
857
184,
670
405,
411
154,
815
318,
500
36,5
00 174
18,4
6615,803
34,2
872,
598
7,44
7
29,9
091,
579
75,5
484,
023
5,18
229
,744
13,8
822,
932
1,53
8
40,1
329,492
6,78
034
9,56
5
71,9
22
100,792
30,2
35
26,051
38, 7
65
37,0
3168
8,64
215
,747
2,05
91,
267
168,
128
346,
041
148,339
254,
050
42,5
36 159
23,5
5315
,865
36,1
692,
200
8,19
8
32,6
192,
966
84,7
44.4,750
5,11
039
,840
20,6
043,
760
2,482
18,9
839,
572
6,46
437
6,37
8
95,7
45
149.
999
28,076
29,711
50,6
70
31,5
8474
4,58
819
,019
2,46
23,
395
215,
183
421,328
188,898
371,885
25,6
06 125
12,868
10,4
26
15,6
86 970
5,95
1
19,1
321,
362
67,1
003,
140
9,85
317
,093
12,8
111,
962
1,43
1
7,524
5,36
8
3,84
5340,628
30,4
96
4.5,
792
12,2
34
17,0
3525
,302
19,563
296,
212
8,449
1,28
8co
mbi
ned
Industry
67,683
161,
673
71,6
6811
5,33
2
22,2
30 352
10,108
4,32
9
13,1
161,
012
5,87
5
11,9
06 795
61,9
682,
601
7,55
88,
774
11,6
081,
490
1,03
9
9,98
44,
858
1,73
718
7,81
7
26,3
24
31,222
5,85
2
17,1
4820
,402
12,6
5220
4,05
66,021
508
with
1305 38
,737
137,
957
35,2
1611
1,18
9
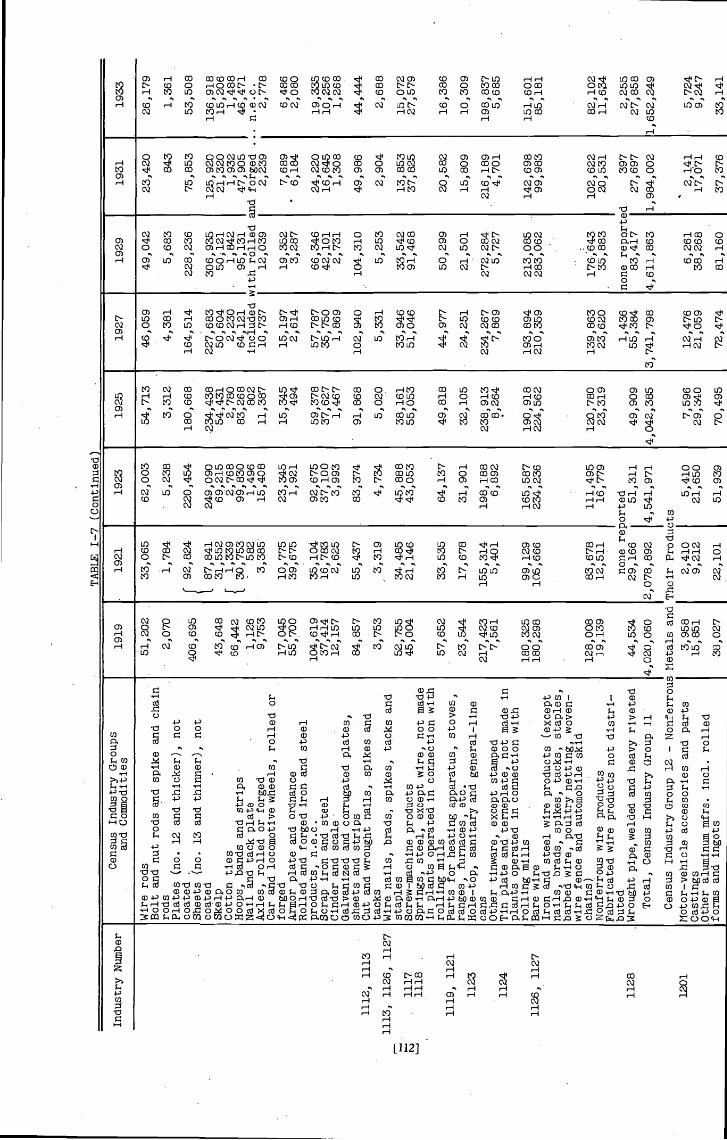
Industry Number
Census Industry Groups
and Commodities
1919
1921
1923
1925
1927
1—7
(Continued)
1929
1931
1933
Wire rods
Bolt and nut rods and spike and chain
rods
Plates (no. 12 and thicker), not
coated
Sheets (no. 13 and thinner), not
coated
-
Ske
ipCotton ties
Hoops, bands and strips
Nail and tack plate
Axles, rolled or forged
Car and locomotive wheels, rolled or
forged
Armor plate and ordnance
Rolled and forged iron and steel
products, n.e.c.
Scrap iron and steel
Cinder and scale -
Gal
vani
zed
and
corrugated
plat
es,
shee
ts a
ndstrips
Cut
and
wrought
nails
, spi
kes
and
tack
sWire. nails, brads, spikes, tacks and
staples
Screw—machine
prod
ucts
Spri
ngs,
steel, except wire, not made
In plants
oper
ated
in connection with
rolling mills
Parts for heating apparatus, stoves,
ranges, furnaces, etc.
Hole—top, sanitary and general—line
cans
Other tinware, except stamped
Tin plate arid terneplate, not made in
plants operated in connection with
rolling
mill
sBare wire
Iron and steel wire products (except
nails, brads, spikes, tacks, staples,
barbed wire, poultry netting, woven—
wire fence and automobile skid
chains)
Nonferrous wire products
Fabricated wire products not distri-
buted
Wrought pipe, welded and heavy riveted
Total, Census Industry Group 11
Census Industry Group 12 -
Not
or—
vehi
cle
acce
ssor
ies
and
part
sC
astin
gsO
ther
aluminum
mfr
s. m
ci. r
olle
dfo
rms
and
ingo
ts
51,202
2,070
406,695
.3,6
4866,442
1,12
69,753
17,045
55,7
00
104,619
37,4
1412,157
84,8
57
3,75
3
52,755
45,0
04
57,652
23,544
217,423
7,561
180,325
180,
298
128,
008
19,139
44,5
344,020,060
Netals and
3,958
15,851
36,027
1112, 1113
1113, 1126, .1127
1117
1118
1119, 1121
1123
1124
1126
,1127
1128
1201
33,065
1,784
f92
,824
1.87
,841
31,552
1,339
30,7
53-
582
3,385
10,775
39,675
35,104
16,783
2,62
5
-3,
319
34,485
21,146
33,5
3,5
17,6
78
155,314
5,401
99,1
29105,666
83,678
12,511
none re
29,166
2,078,892
The
ir P
ro d
u2,
410
9,21
2
22,1
01
62,003
5,238
220,454
249,
090
69,2
152,768
99,8
301,
496
15,4
08
23,3
451,
921
92,675
37,100
3,993
83,374
4,734
45,8
8843
,053
64,137
31,9
01
198,
188
6,89
2
165,587
234,
236
111,
495
16,7
79
orted51,311
4,541,971
5,41
021,650
51,939
54,7
13
3,31
2
180,668
-234,438
54,4
312,
780
83,268
802
11,387
15,345
494
59,3
7837,627
1,467
91,8
68 020
38,1
6155
,053
49,8
18
32,1
05
238,
913
8,264
190,
918
224,
562
120,
780
23,319
49,909
4,042,385
7,59
629,340
70,4
95
49,042
5,683
228,236
306,935
50, 1
211,
842
95,1
31iith
rolle
d12
,039
19,3
523,
287
66,346
42,1
012,731
104,310
5,253
33,542
91,4
68
50,2
99
21,501
272,
284
5,72
7
213,085
283,062
176,643
35,883
none 8
3,417
4,611,863
6,261
38,268
81,160
46,0
59
4,38
1
164,514
227,
683
50,604
2,230
64,121
10,737
15,197
2,614
57,787
35,750
1,86
9
102,940
5,33
1
33,9
4651
,046
44,9
77
24,2
51
234,
267
7,86
9
193,894
210,359
139,863
23,620
1,436
55,384
3,74
1,79
8
12,476
21,059
72,474
23,420
843
75,8
53
125,920
21,3
201,932
47,905
and forged
2,239
7,689
*6,
184
24,2
2016
,645
1,30
8
49,986
2,904
13,853
37,825
20,5
82
15,809
216,189
4,701
142,698
99,983
102,622
20,531
397
27,697
1,984,002
17,071
37,376
26,179
1,361
53,508
136,918
15,206
1,488
46,471
n.e.
c.2,778
6,486
2,08
0
19,335
10,256
1,26
8
44,444
2,68
8
15,072
27,579
16,386
10,309
198,837
5,685
151,
601
85,1
81
82,1
0211
,634
2,25
527,858
1,652,249
5,72
49,
247
33,1
41
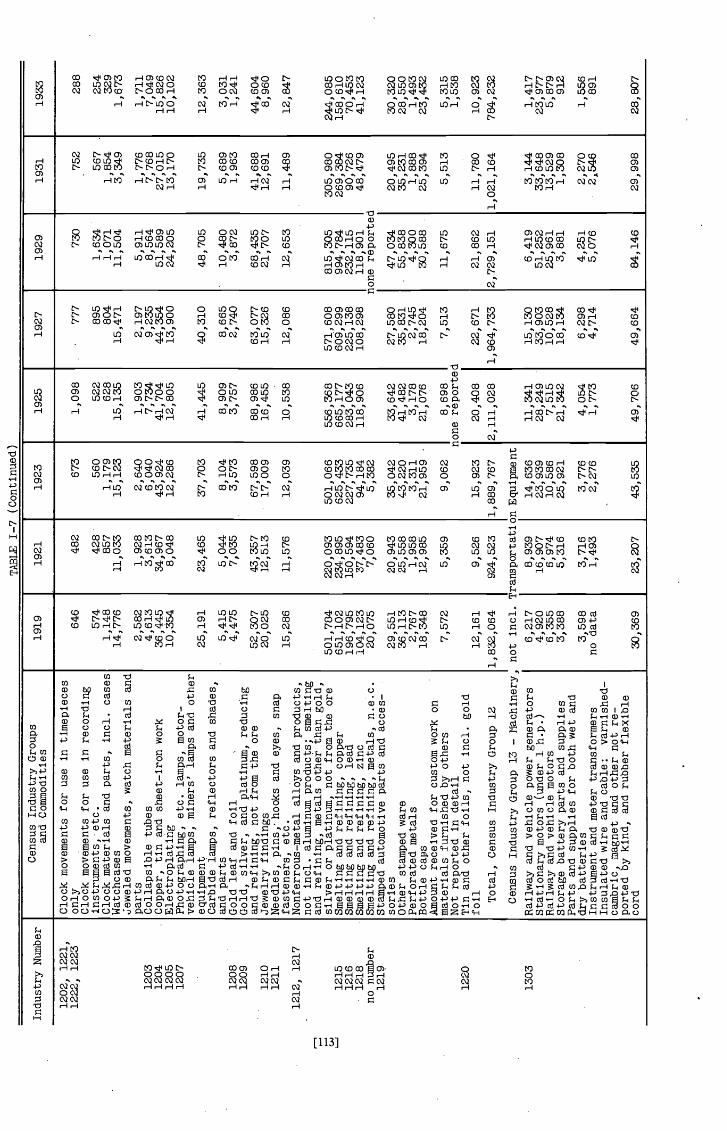
TA
BLE
I—?
(Continued)
Industry Number
Census Industry Groups
and Commodities
1919
1921
1923
1925
1927
1929
1931
1933
1202, 1221,
Clock movements for use in timepieces
1222, 1223
only
646
482
673
1,098
777
730
752
288
Clock movements for use in recording
instruments, etc.
574
428
560
522
895
1,634
567
254
Clock materials and parts, mci. cases
1,148
857
1,179
628
804
1,071
1,854
329
Watchcases
14,776
11,033
15,123
15,135
15,471
11,504
3,349
1,673
Jeweled movements, watch materials and
parts
2,582
1,928
2,640
1,903
2,197
5,911
1,776
1,711
1203
Collapsible tubes
4,613
3,613
6,040
7,734
9,235
8,564
7,768
7,049
1204
Copper, tin and sheet—iron work
36,445
34,967
43,924
41,704
44,354
51,589
27,015
15,826
1205
Electroplating
10,354
8,048
12,286
12,805
13,900
24,205
13,170
10,102
1207
Photographing, etc. lamps, motor—
vehicle lamps, miners' lamps and other
equipment
25,191
23,465
37,703
41,445
40,310
48,705
19,735
12,363
Carbide lamps, reflectors and shades,
arid parts
5,415
5,044
8,104
8,909
8,665
10,480
5,689
3,031
1208
Gold leaf and foil
4,475
7,035
3,573
3,757
2,740
3,872
1,963
1,241
1209
Gold, silver, and platinum, reducing
and refining, not from the ore
52,307
43,357
67,598
88,986
63,077
68,435
41,688
44,604
1210
Jewelry findings
20,025
12,513
17,009
16,455
15,326
21,707
12,691
8,960
1211
Needles, pins, hooks and eyes, snap
fasteners, etc.
15,286
11,576
12,039
10,538
12,086
12,653
11,489
12,847
1212, 1217
Nonferrous—metal alloys and products,
not md. aluminum products; smelting
and refining, metals other than gold,
silver or platinum, not from the ore
501,784
220,093
501,066
556,368
571,608
815,305
305,980
244,085
1215
Smelting and refining, copper
651,102
234,895
625,433
665,177
609,299
994,784
269,384
158,610
1216
Smelting and refining, lead
196,795
150,594
227,735
283,043
225,138
232,115
90,726
70,453
1218
Smelting and refining, zinc
104,123
37,483
94,184
118,906
108,298
118,901
48,479
41,123
no number
Smelting and refining, metals, n.e.c.
20,075
7,060
5,382
none reported
1219
Stamped automotive parts and acces-
sories
29,551
20,943
35,042
33,642
27,580
47,034
20,495
30,320
Other stamped ware
36,113
25,558
43,220
41,482
35,831
55,838
35,231
28,550
Perforated metals
2,767
1,958
3,311
3,178
2,745
4,300
1,888
1,493
Bottle caps
18,348
12,985
21,959
21,076
18,204
30,588
25,394
23,432
Amount received for custom work on
materials furnished by others
7,572
5,359
9,062
8,698
7,513
11,675
5,513
5,315
Not reported in detail
none reported
1,538
1220
Tin and other foils, not md. gold
foil
12,161
9,526
15,923
20,408
22,671
21,862
11,780
10,923
Total, Census Industry Group 12
1,832,064
924,523
1,889,767
2,111,028
1,964,733
2,729,151
1,021,164
784,232
Census Industry Group 13 —
Nac
hine
ry,
not mci. Transportation Equipment
1303
Railway arid vehicle power generators
6,217
8,939
14,636
11,341
15,130
6,419
3,144
1,417
Stationary motors (under 1 h.p.)
4,920
16,907
23,939
28,249
33,903
51,252
33,648
23,977
Railway and vehicle motors
6,355
6,974
10,586
7,515
10,528
25,961
13,529
5,879
Storage battery parts and supplies
3,388
5,316
25,921
21,342
18,134
3,881
1,308
912
Parts and supplies for both wet arid
dry batteries
3,598
3,716
3,776
4,054
6,298
4,251
2,270
1,556
Instrument and meter transformers
no data
1,493
2,276
1,773
4,714
5,076
891
Insulated wire and cable:
varnished—
cambric, magnet and other not re-
ported by kind, arid rubber flexible
cord
30,369
23,207
43,535
49,706
49,664
84,146
29,998
28,807
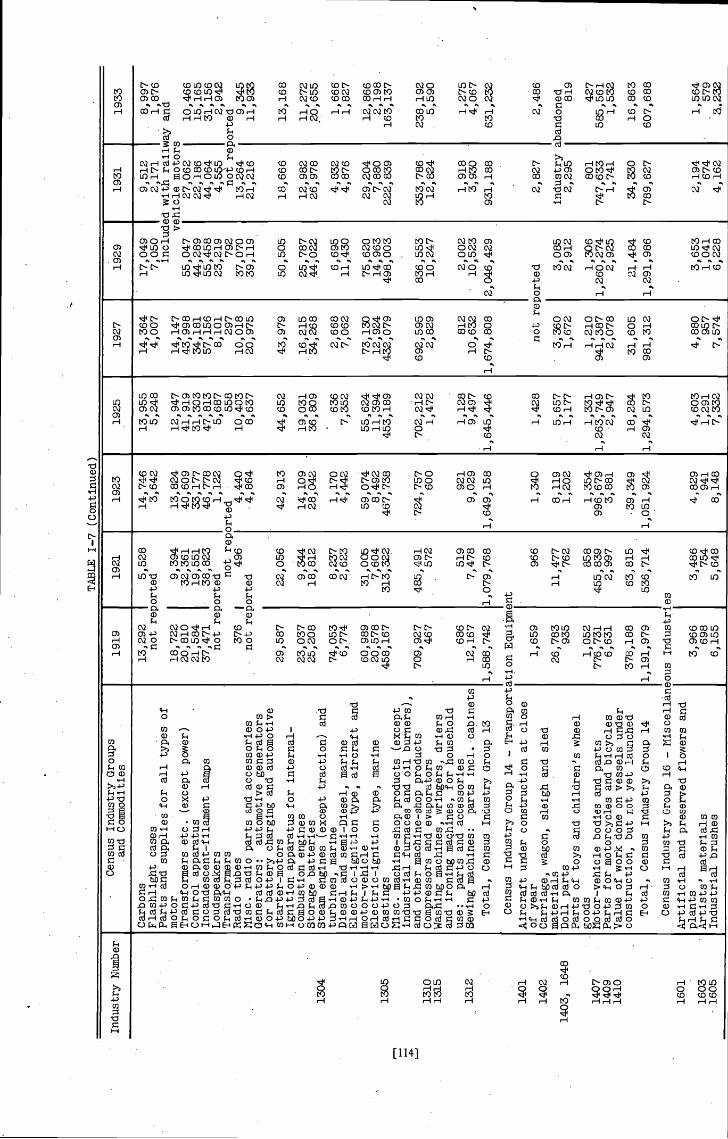
TABLE 1—7 (Continued)
Industry Number
Census Industry Groups
and Comniodities
1919
1921
1923
1925
1927
1929
1931
1933
13,292
5,528
not reported
18,722
9,394
20,810
32,361
21,584
19,551
37,471
38,823
not reported not rep
376
496
not reported
Carbons
Flashlight cases
Parts and supplies for all types of
motor
Transformers etc. (except power)
Control apparatus
Incandescent-f I lament lamps
Loudspeakers
Transformers
Radio tubes
Misc. radio parts and accessories
Generators:
automotive generators
for battery charging and automotive
starter—motors
Ignition apparatus for internal-
combustion engines
Storage batteries
Steam engines (except traction) and
turbines, marine
Diesel and semi—Diesel, marine
Electric—Ignition type, aircraft and
motor—vehicle
Electric—ignition type, marine
Castings
Misc. machine—shop products (except
Industrial furnaces and oil burners),
and other machine-shop products
Compressors and evaporators
Washing machines, wringers, driers
and
iron
ing
niaqhines, for household
use:
parts and accessories
Sewing machines:
parts md. cabinets
Total, Census Industry Group 13
-4
17,049
9,512
7,050
2,171
included with
vehicle
55,047
27,062
44,289
22,186
55,458
44,064
23,219
792
not rel
37,070
13,264
39,119
21,216
29,587
23,037
25,208
74,053
6,774
60,989
20,578
458,167
709,927
467
686
12,167
1,588,742
14,364
4,007
14,147
43,998
34,181
57,156
8,101
297
10,018
20,975
43,979
16,215
34,268
2,668
7,062
73,130
12,924
432,079
692,595
2,829
812
10,632
1,674,808
1304
1305
1310
1315
1312
1401
1402
1403,
1648
1407
1409
1410
1601
1603
1605
14,7
463,
642
13,824
40,609
33,177
46,778
1,122
)rte
d 4,440
4,864
42,913
14,109
28,042
1,170
4,442
59,074
8,492
467,738
724,757
600
921
9,029
1,649,158
1,340
8,119
1,202
1,354
996, 679
3,881
.39,349
1,051,924
4,829
941
8,148
50,505
25, 787
44,022
6,695
11,430
75,620
14,963
498,003
836,553
10,247
2,002
10,523
2,046,429
Census Industry Group 14 —
Tra
nspo
rtat
ion
Equipment
13,955
5,248
12,9
4741,919
31,303
47,813
5,687
558
10,403
8,637
44,652
19,031
36,809
636
7,352
55,6
2411,394
453,189
702,212
1,472
1,128
9,497
1,645,446
1,42
8
5,657
1,177
1,331
1,263,749
2,947
18,284
1,294,573
4,603
1,291
7,332
22,056
9,344
18,812
8,237
2,62
3
31,005
7,604
313,322
485,491
572
519
7,478
1,079,768
966
11,477
762
858
455,
839
2, 997
63,815
536, 714
3,486
754
5,64
8
Aircraft under construction at close
of year
Carriage, wagon, sleigh and sled
materials
Doll parts
Parts of toys and children's wheel
goods
Hotor—vehlcle bodies and parts
Parts for motorcycles and bicycles
Value of work done on vessels under
construction, but not yet launched
Total, Census Industry Group 14
8,997
•1,876
ray and
10,4
6615,165
31,156
2,942
orted 9,345
11,9
33
13,168
11,272
20,655
1,666
1,827
12,866
2,198
163,137
238,192
5,590
1,275
4,067
631,232
2,486
.bandoned819
427
585,561
1,532
16,863
607,688
1,564
579
a,232
1,659
26,783
935
1,052
776,731
6,631
378,188
1,191,979
18,666
12,982
26,978
4,832
4,87
6
29,204
7,880
222,839
353,786
12,824
1,918
3,930
931,
188
2,827
industry
2,295
801
747,633
1,741
34,330
789,627
2,194
674
4,162
not reported
'S
Census Industry Group 16 —
Nis
cellã
neou
sIndustries
Artificial and preserved flowers and
plants
3,966
Artists' materials
698
Industrial brushes
6,155
C•
3,360
1,672
1,210
941,387
2,078
31,605
981,312
4,880
957
7,574
3,085
2,912
1,306
1,260,274
2,925
21,484
1,291, 986
3,653
1,041
6,228

TABLE 1—7 (Concluded)
Industry Number
Census Industry Groups
and Commodities
1919
1921
1923
1925
1927
1929
1931
1933
Brushes not reported by kind (indus-
trial)
663
608
878
790
811
613
439
438
1606
Buttons
32,491
21,782
25,198
25,371
22,644
22,036
16,152
17,409
Button blanks and molds
3,092
2,380
3,082
3,182
2,839
3,972
2,246
Part
sof buttons, backs, etc.
1,070
100
343
79
16
226
194
I
1607
Carbon paper and inked ribbons
9,425
8,469
11,200
12,349
13,534
16,781
14,535
12,112
1611
Dental laboratory work
7,393
6,526
8,203
9,921
not included in Census
1612
Rhinestone ornaments
820
547
826
820
1,109
1,169
761
565
Fancy and misc. articles, n.e.c.,
except cigar lighters, greeting
cards, rhinestone ornaments and lamp
shades
9,196
7,702
9,259
9,195
12,427
13,097
8,532
6,329
1613
Feathers, plumes and mfrs. thereof
10,244
5,979
5,335
2,791
930
740
1,283
564
1614
Foundry supplies
9,090
4,921
10,643
12,429
11,518
12,168
5,132
3,580
1615
Fur trimmings
19,735
15,918
22,272
28,647
87,817
93,467
64,366
31,250
Con
trac
twork
167
135
189
387
2,070
3,211
1,807
1,412
1616
Furs,
dres
sed
21,551
19,149
25,797
25,7
4627
,692
40,237
37,873
24,948
1617
Hair work
843
1,351
1,384
778
277
224
151
126
1619
Hats, straw, men's:
contract work
258
229
261
216
222
228
406
296
1620
Instruments, professional and
scientific
13,259
9,568
14,087
17,355
19,733
19,612
8,374
5,201
1621
Ivory, shell, and bone work, not mci.
buttons, combs or hairpins
2,640
2,383
2,669
2,125
876
1,321
852
632
1622
Jewelry and instrument cases
8,551
7,197
10,746
11,109
10,239
9,64
25,
314
3,34
41623
Lapidary work
28,325
4,122
8,605
9,540
11,770
11,3
912,
397
797
1624
Nattresses and bed springs, n.e.c.:
custom and contract work
581
517
745
742
1,866
1,653
918
702
1627,
1628
,Pi
ano
and
organ
part
s an
dmaterials
1629
, 163
0(except
perf
orat
ed m
usic
rol
ls)
36,3
8118
,885
33,6
9031,847
22,2
6510
,390
3,37
81,
649
Part
sand materials for other musical
instruments
3,677
1,713
1,851
1,867
2,180
2,830
1,612
787
1633
Pencils, lead (md. mechanical)
4,532
4,050
4,838
5,027
5,253
5,997
4,13
13,
424
1634
Pens, fountain and stylographic, pen
points, gold, steel and brass
753
597
948
1,058
871
1,169
712
347
1635
Phonograph cabinets
3,653
1,683
2,544
2,817
2,01
678
6not reported
Other parts and accessories
10,516
4,911
8,093
2,543
6,773
6,68
4not reported
Phonographs and parts, not reported
In detail
509
74
103
173
235
none reported
1636
Films, sensitized cloth and paper,
slides and plates
52,846
42,460
42,956
46,455
53,965
61,094
46,769
31,695
1639
Sandpaper, emery paper, and other
abrasive paper and cloth
11,612
7,539
15,942
17,784
17,458
20,313
11,054
10,539
1643
Stationery goods, n.e.c.
15,083
16,297
20,016
17,580
14,929
18,552
13,014
3,915
1651
Window shades and fixtures
1,852
1,85
83,
035
2,737
2,559
2,692
1,447
1,139
Total, Census Industry Group 16
331,627
229,038
309,656
316,686
370,305
393,217
260,879
171,209


Table 1—8
OUTPUT OF INDUSTRIES AND COMMODITIES NOT
UTILIZED IN THE STUDY
CENSUS OF MANUFACTURES YEARS, 1919-1933
The entries in this table are for industries or commodities marked notclassified in Table I—I.
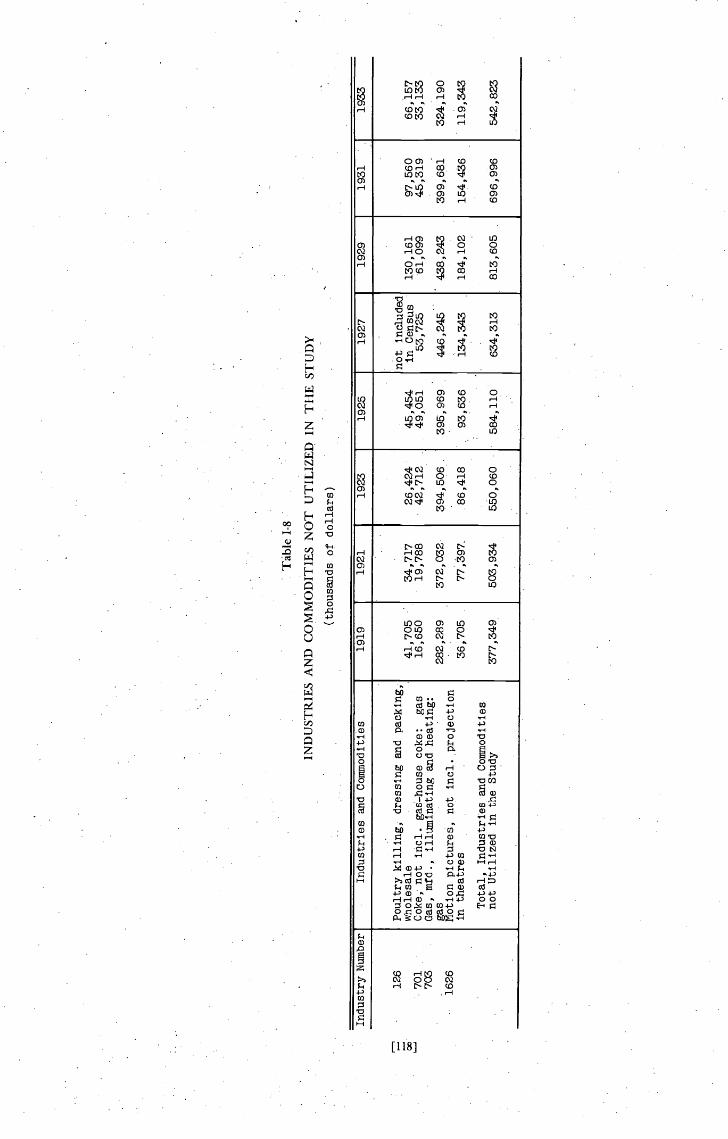
Tab
le 1
-8
IND
UST
RIE
S A
ND
CO
MM
OD
ITIE
S N
OT
UT
ILIZ
ED
IN
TH
E S
TU
DY
(tho
usan
dsor dollars)
Industry Number
Industries and CommodIties
1919
1921
1923
1925
1927
1929
1931
1933
126
701
Poultry killing1 dressing and packing,
wholesale
Coke, not mci. gas-house coke:
gas
41,705
16,650
.
34,7
1719,788
26,424
42,712
.
• 45,4
5449,051
not included
In Census
53,725
130,161
61,099
97,560
45,319
.
66,1
5733,133
703
Gas, mrd., illuminating and heating:
gas
282,289
372,032
394,506
.
.
.
395,
969
..44
6,24
5.
438,
243
-
399,
681
324,190
•1626
Notion pictures, not mci. projection
in theatres
:
36,7
05•
77,3
97..
86,418
93,636
.
584,
110
.. 134,
343
.
184,
102
154,436
.
119,
343
Total, Industries and Coimnoditles
not Utilized in the Study
377,349
503,934
550,
060
.
634,
313
813,605
696,996
542,823
.