part e: financial information 115...academic versus the financial year the difference between the...
TRANSCRIPT
ETDP SETA Annual Report 2014/15 1
Table of Contents Page
Part A: General Information .......................................................................................... 3
1 ETDP SETA’s Information ...................................................................................................... 4
2 List of Abbreviations/Acronyms ............................................................................................ 5
3 Acknowledgements ............................................................................................................. 7
4 Foreword by the Chairperson ............................................................................................... 8
5 Chief Executive Officer’s Overview ..................................................................................... 10
6 Statement of Responsibility and Confirmation of Accuracy of the Annual Report ................. 13
7 Strategic Overview ............................................................................................................ 14
8 Legislative and Other Mandates ......................................................................................... 15
9 Organisational Structure .................................................................................................... 16
Part B: Performance Information ................................................................................. 17
1 Auditor‑General’s Report: Predetermined Objectives .......................................................... 18
2 Situational Analysis ........................................................................................................... 18
3 Performance Information by Programme ............................................................................ 20
4 Revenue Collection ............................................................................................................ 85
5 Capital Investment ............................................................................................................ 86
Part C: Governance ..................................................................................................... 87
1 Introduction ...................................................................................................................... 88
2 Portfolio Committees ........................................................................................................ 88
3 Executive Authority ........................................................................................................... 88
4 The Accounting Authority .................................................................................................. 88
5 ETDP SETA Strategic Partners ........................................................................................... 103
6 Risk Management ............................................................................................................ 103
7 Internal Controls ............................................................................................................. 103
8 Internal Audit and Audit Committee ................................................................................ 104
9 Compliance with Laws and Regulations ............................................................................ 104
10 Fraud and Corruption ...................................................................................................... 104
11 Minimising Conflict of Interest ......................................................................................... 104
12 Code of Conduct ............................................................................................................. 105
13 Health, Safety and Environmental Issues .......................................................................... 105
14 Audit Committee Report .................................................................................................. 105
ETDP SETA Annual Report 2014/152
Part D: Human Resource Management ........................................................................ 107
1 Introduction .................................................................................................................... 108
2 Human Resource Oversight Statistics ................................................................................ 110
Part E: Financial Information ...................................................................................... 115
1 Report of the Auditor‑General to Parliament on the Education, Training and Development Practices Sector Education and Training Authority ....................................... 116
2 ETDP SETA Annual Financial Statements ........................................................................... 118

Part A General Information
ETDP SETA Annual Report 2014/154
1 ETDP SETA’s Information
Name:Education, Training and Development Practices Sector Education and Training Authority
Referred to in this report as ETDP SETA
Physical Address:24 Johnson RoadRiverwoods Office ParkBedfordview2008
Postal Address:Private Bag X105Melville2109
Contact Details:Contact Person: Ms Nombulelo NxesiTelephone Number: +27 11 372 3300Email Address: [email protected] Address: www.etdpseta.org.za
Addresses of the nine provincial offices are presented on the back cover of this report.
External Auditors:The Auditor‑General of South Africa300 Middel StreetNew MuckleneukPretoria, RSA0181
Banker:The Standard Bank of South Africa Limited30 Baker Street Rosebank 2193
Company Secretary:N/A
The Accounting Authority (AA) governance affairs are managed by the Accounting Authority Secretary for minute taking, Ms Priya Govender, and the Office of the CEO, Ms Nombulelo Nxesi.
Part A: General Information
ETDP SETA Annual Report 2014/15 5
2 List of Abbreviations/AcronymsABET Adult Basic Education and TrainingACE Advanced Certificate in EducationADE Advanced Diploma in EducationAET Adult Education and TrainingAFS Annual Financial StatementsAGSA Auditor‑General of South AfricaAPP Annual Performance PlanAPPETD Association of Private Providers of Education, Training and DevelopmentATR Annual Training ReportB.Ed Bachelor of EducationCBO Community-based OrganisationCDO Career Development OfficerCEO Chief Executive OfficerCOMDEV Community DevelopmentCONSAWU Confederation of South African Workers UnionCOSATU Congress of South African Trade UnionsCUTis Central University of Technology Innovation ServicesDBE Department of Basic EducationDHET Department of Higher Education and TrainingDPSA Department of Public Service and AdministrationECD Early Childhood DevelopmentELRC Education Labour Relations CouncilETD Education, Training and DevelopmentETDP SETA Education, Training and Development Practices Sector Education and Training AuthorityETDQA Education, Training and Development Quality AssuranceFAWU Food and Allied Workers UnionFEDUSA Federation of Unions of South AfricaFET Further Education and TrainingFETC Further Education and Training CertificateGRAP Generally Recognised Accounting PracticeHEI Higher Education InstitutionHESA Higher Education South AfricaHELM Higher Education Leadership and Management HOSPERSA Health and Other Services Personnel Trade Union of South AfricaHR Human ResourcesHRD Human Resource DevelopmentHRD SA Human Resource Development Strategy for South AfricaICT Information and Communication TechnologyIFP Inkatha Freedom PartyIMATU Independent Municipal and Allied Trade UnionISPFTED-SA Integrated Strategic Planning Framework for Teacher Education and Development in South AfricaISS Institute for Security StudiesKZN KwaZulu‑NatalLIASA Library and Information Association of South AfricaLO Life OrientationLP LimpopoLSEN Learners with Special Educational NeedsM&E Monitoring and EvaluationMBA Master of Business Administration
ETDP SETA Annual Report 2014/156
MBL Master of Business LeadershipMERSETA Manufacturing, Engineering and Related Services Sector Education and Training AuthorityMIS Management Information SystemMoU Memorandum of UnderstandingMPA Master of Public AdministrationMTEF Medium Term Expenditure FrameworkMTSF Medium Term Strategic FrameworkNACTU National Council of Trade UnionsNAISA National Alliance of Independent School AssociationsNAPSG National Association of Parents in School GovernanceNASGB National Association of School Governing BodiesNDP National Development PlanNECT National Education Collaboration TrustNEHAWU National Education, Health and Allied Workers’ UnionNGO Non-Governmental OrganisationNLPE Non-Levy Paying EntityNPO Non-Profit OrganisationNQF National Qualifications FrameworkNSDS National Skills Development StrategyNSFAS National Student Financial Aid SchemeNUM National Union of MineworkersOECD Organisation for Economic Co-operation and DevelopmentPFMA Public Finance Management ActPGCE Postgraduate Certificate in EducationPIVOTAL Professional, Vocational, Technical and Academic LearningPMDS Performance Management and Development SystemPSETA Public Sector Education and Training AuthorityPWD People with DisabilitiesQCTO Quality Council for Trades and OccupationsRPL Recognition of Prior LearningSACPO South African College Principals’ OrganisationSACTWU Southern African Clothing and Textile Workers UnionSAPU South African Policing UnionSAQA South African Qualifications AuthoritySAYC South African Youth CouncilSCM Supply Chain ManagementSDF Skills Development FacilitatorSETA Sector Education and Training AuthoritySGB School Governing BodySIP Strategic Integrated ProjectsSLA Service Level AgreementSMT Senior Management TeamSoP Standard Operating ProcedureSSP Sector Skills PlanTVET Technical, Vocational Education and TrainingUnisa University of South AfricaUoT University of TechnologyWIL Work Integrated LearningWPE Workplace ExperienceWSP Workplace Skills PlanWSPR Workplace Skills Plan Report
Part A: General Information

ETDP SETA Annual Report 2014/15 7
3 Acknowledgements
Executive Authority
The ETDP SETA Accounting Authority, management and staff would like to express their heartfelt appreciation for the visionary and thought leadership of both the Minister and Deputy Minister of Higher Education and Training. We commit ourselves to supporting this vision by ensuring its realisation.
Basic Education Ministry and Provincial Departments We extend our appreciation for the support received from the Department of Basic Education and the Provincial Departments of Education who continue to make their financial contributions to the ETDP SETA, and without which, we would not be in a position to achieve our mandate.
Levy Paying Organisations Without the levy grant system and the contributions made by the levy paying organisations, it would not be possible to achieve the objectives and targets. The ETDP SETA Accounting Authority appreciates the contributions made.
Honourable Dr BE Nzimande, MPMinister of Higher Education and Training
Honourable Mr MC Manana, MPDeputy Minister of Higher Education
and Training
ETDP SETA Annual Report 2014/158
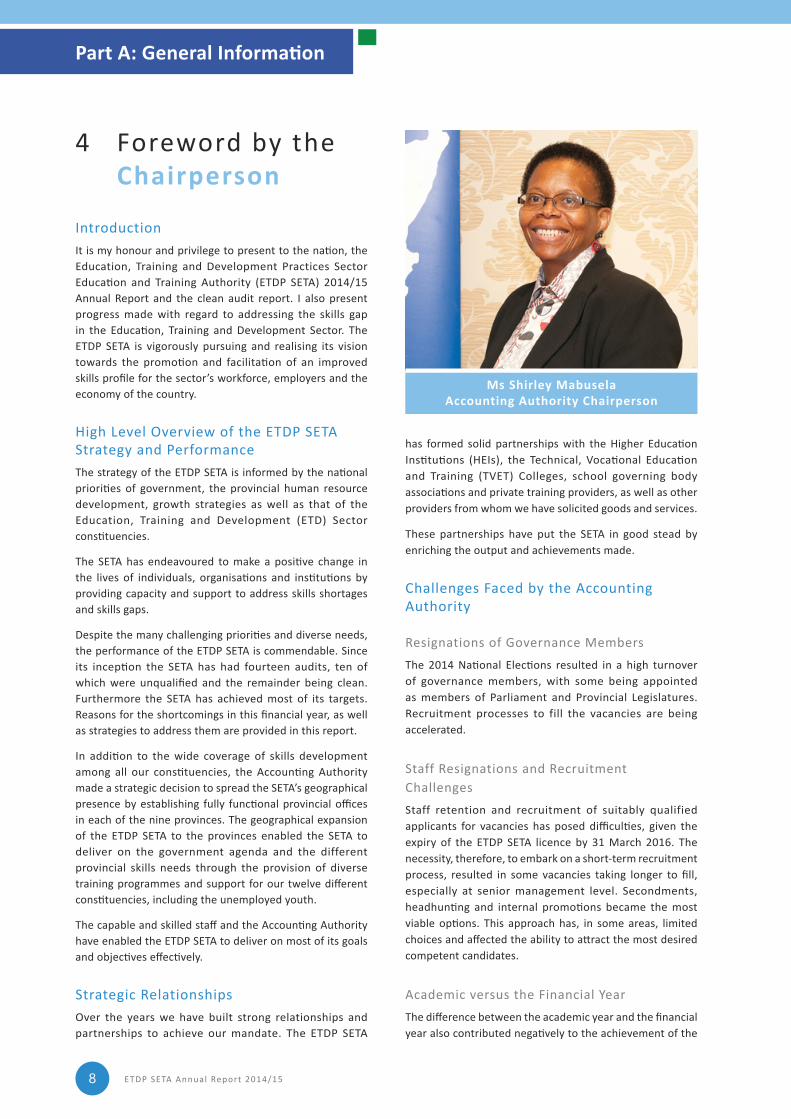
4 Foreword by the Chairperson
IntroductionIt is my honour and privilege to present to the nation, the Education, Training and Development Practices Sector Education and Training Authority (ETDP SETA) 2014/15 Annual Report and the clean audit report. I also present progress made with regard to addressing the skills gap in the Education, Training and Development Sector. The ETDP SETA is vigorously pursuing and realising its vision towards the promotion and facilitation of an improved skills profile for the sector’s workforce, employers and the economy of the country.
High Level Overview of the ETDP SETA Strategy and PerformanceThe strategy of the ETDP SETA is informed by the national priorities of government, the provincial human resource development, growth strategies as well as that of the Education, Training and Development (ETD) Sector constituencies.
The SETA has endeavoured to make a positive change in the lives of individuals, organisations and institutions by providing capacity and support to address skills shortages and skills gaps.
Despite the many challenging priorities and diverse needs, the performance of the ETDP SETA is commendable. Since its inception the SETA has had fourteen audits, ten of which were unqualified and the remainder being clean. Furthermore the SETA has achieved most of its targets. Reasons for the shortcomings in this financial year, as well as strategies to address them are provided in this report.
In addition to the wide coverage of skills development among all our constituencies, the Accounting Authority made a strategic decision to spread the SETA’s geographical presence by establishing fully functional provincial offices in each of the nine provinces. The geographical expansion of the ETDP SETA to the provinces enabled the SETA to deliver on the government agenda and the different provincial skills needs through the provision of diverse training programmes and support for our twelve different constituencies, including the unemployed youth.
The capable and skilled staff and the Accounting Authority have enabled the ETDP SETA to deliver on most of its goals and objectives effectively.
Strategic RelationshipsOver the years we have built strong relationships and partnerships to achieve our mandate. The ETDP SETA
has formed solid partnerships with the Higher Education Institutions (HEIs), the Technical, Vocational Education and Training (TVET) Colleges, school governing body associations and private training providers, as well as other providers from whom we have solicited goods and services.
These partnerships have put the SETA in good stead by enriching the output and achievements made.
Challenges Faced by the Accounting Authority
Resignations of Governance Members The 2014 National Elections resulted in a high turnover of governance members, with some being appointed as members of Parliament and Provincial Legislatures. Recruitment processes to fill the vacancies are being accelerated.
Staff Resignations and Recruitment ChallengesStaff retention and recruitment of suitably qualified applicants for vacancies has posed difficulties, given the expiry of the ETDP SETA licence by 31 March 2016. The necessity, therefore, to embark on a short‑term recruitment process, resulted in some vacancies taking longer to fill, especially at senior management level. Secondments, headhunting and internal promotions became the most viable options. This approach has, in some areas, limited choices and affected the ability to attract the most desired competent candidates.
Academic versus the Financial YearThe difference between the academic year and the financial year also contributed negatively to the achievement of the
Ms Shirley MabuselaAccounting Authority Chairperson
Part A: General Information
ETDP SETA Annual Report 2014/15 9
quarterly targets. As a result, we found ourselves having to commence programmes in the last quarter of the financial year, which is the beginning of the academic year. This has resulted in the SETA commencing with programmes and having these programmes run over into the following financial years. Programmes not only run over, but also increase in operational scope, and this continues to increase our financial commitment rather than our actual expenditure.
Government Departments’ Contribution and Timing of Payments It should be noted that not all departments have committed to pay the 30%. So far, only three provincial departments of education have paid their 30%. The transfer of uncommitted discretionary grants to the National Skills Fund within the financial year negatively impact on the ETDP SETA’s ability to provide more skills development opportunities.
Medium to Long‑Term GoalsThe five-year life span of SETAs has unfortunately made it impossible to develop long‑term strategies. Since inception in 2000, the SETAs have had three National Skills Development Strategies (NSDS) with different objectives and outcomes, namely, NSDS I (2000–2005), NSDS II (2005–2011) and NSDS III (2012–2015). Skilling a nation that is confronted by the serious challenges of poverty, inequality and unemployment needs a long‑term planning process with clear strategies and outcomes in order to make a visible impact.
Despite the uncertainty regarding the future of the SETAs, education and skills will always be needed. The Accounting Authority has taken a strategic decision to host a National Stakeholder Summit in either September or October 2015 to discuss the ETDP SETA Vision 2030, in line with the National Development Plan. The summit is aimed at soliciting inputs from the constituencies and stakeholders to shape the 2030 Vision for Education and Skills for socio-economic emancipation of the nation.
Acknowledgements and AppreciationIt is fitting at this point to acknowledge and thank the Accounting Authority members who have performed a sterling job in their governance and oversight role. The tasks carried out by management and staff of the ETDP SETA, under the leadership of the Chief Executive Officer, are also appreciated.
A word of gratitude also goes to the Accounting Authority Committees and Chambers who are primarily responsible for the technical and specialist work on behalf of the Accounting Authority in support of the SETA’s programmes. Finally, I acknowledge and thank all our constituent
members, stakeholders, providers of services and goods, as well as the beneficiaries of our programmes.
ConclusionThe ETDP SETA is looking forward to the implementation of the 2015/16–2019/20 Strategic Plan which will take its performance and achievements to the next level.
Ms Shirley MabuselaAccounting Authority Chairperson ETDP SETA
Date: 31 July 2015
ETDP SETA Annual Report 2014/1510
5 Chief Executive Officer ’s Overview
Introduction It is with great pleasure and pride that we have reclaimed our clean audit. In the 2013/14 financial year we received an unqualified report due to misstatements which were later clarified.
Since inception in the 2000/01 financial year, the ETDP SETA has received either unqualified or clean audits from the Auditor‑General.
We have to date, to a large extent met our set targets and surpassed some. We have put strategies in place to address a few against which we under‑achieved. A detailed report of the extent to which we fared against our targets is presented in Part B: Performance Information.
This overview gives a brief account of our finances, achievements, constraints and challenges for the year under review as well as future plans for the medium‑ to long‑term goals.
General Financial ReviewThe SETA is funded through the following three major sources each year:
1. Skills development levies, paid by companies registered with South African Revenue Services as levy payers, which amounted to R344.6 million for the 2014/15 financial year
2. Contributions from Provincial Departments of Education, which amounted to R186.9 million in the 2014/15 financial year
3. Interest from investment income, which amounted to R27.5 million.
The core expenditure areas of the SETA are:
1. Mandatory grants: These are payments to levy payers who have submitted approved Workplace Skills Plan Reports (WSPRs). Payments are made in terms of the Grant Regulations. An amount of R70.17 million was paid during the financial year in respect of these grants
2. Discretionary grants: These are amounts that are paid according to programmes in an Annual Performance Plan (APP), approved in terms of the Grant Regulations. During the financial year, an amount of R240.2 million was paid in terms of these grants.
Spending trends
Expenditure type 2014/15R’000
2013/14R’000
2012/13R’000
Mandatory grants 70 167 85 157 138 742
Discretionary grants 240 200 136 096 100 816
Administration 115 986 115 930 101 913
Ms Sesi Nombulelo NxesiChief Executive Officer
Part A: General Information
ETDP SETA Annual Report 2014/15 11
Mandatory grant expenditure decreased year‑on‑year, from a high in 2012/13 when the New SETA Grant Regulations (Government Notice No. 35940) came into effect in December 2012. The mandatory grant was reduced from 50% to 20% in 2013/14 and the total expenditure for the category declined again in this reporting period. In addition to the fact that the quantum of mandatory grant pay‑outs in 2014/15 was lower than in the previous two years, relatively more mandatory grants were paid out. In 2012/13, 992 WSPRs were received, in 2013/14, 1 044 WSPRs were received and in 2014/15, 1 276 WSPRs were received.
The above trends are an indication of the commitment of the SETA to ensuring receipt of WSPRs and making payment of mandatory grants.
Discretionary grant spending has exhibited an upward trend in response to new grant regulation requirements since 2013/14. In addition, discretionary commitments by way of contracts have peaked in the financial year at R345.8 million. The SETA was able to increase the targets and revise its Grants Disbursement Policy to cater for the increased cost of tertiary education, other learning programmes as well as stipends. This is indicated by the high level of spending and contractual commitments.
Administrative expenditure demonstrates a response to cost containment measures implemented in the financial year. The total expenditure shows not only a below-inflation reduction, but a reduction in the total overall administration cost. This is in contrast to increased discretionary spending and a high level of research expenditure. In the 2014/15 financial year, it was possible to transfer funding from administration to augment discretionary grants and to provide the necessary administrative backup for programme implementation at a high level, through the introduction of cost containment arrangements.
Capacity Constraints and ChallengesA concerted effort was made during the year under review to fill vacant positions, with a view to providing a strong base from which to perform. This was generally achieved but only in the second half of the year. The position of Chief Operations Officer remained vacant for most of the year and the function was taken up by the Chief Executive Officer, placing strain on that office. Capacity constraints in the Human Resources Unit created challenges but the appointment of a highly experienced unit head in the position of Chief Human Resource Officer, served to consolidate that area successfully. As a result, the ETDP SETA has dramatically reduced its vacancy backlog and improved its performance against APP targets.
A further challenge was the delay in the development of new occupational qualifications and materials, due to dependency on the Quality Council for Trades and Occupations (QCTO) approval processes.
AchievementsThe achievements made during the year under review are outlined in Part B: Performance Information.
Discontinued Activities or Activities to be DiscontinuedThere has been no discontinuation or planned discontinuation of any major part of the ETDP SETA’s operations.
New or Proposed ActivitiesThe ETDP SETA will be supporting youth‑driven co‑operatives as part of its constituency skills development programmes. This support is intended to increase the human resource capacity to strengthen their operations.
Furthermore, the ETDP SETA will be supporting the development of academics in research by contributing to masters and doctoral graduates. This is in line with the achievement of the Medium Term Strategic Framework (MTSF 2014–2019) objectives, which will be undertaken in collaboration with higher education institutions.
Request for Rollover of FundsOn 31 May of each year, the SETA makes an application to the National Treasury to accumulate unspent reserves. This was granted for 2014/15 but an instruction from the Executive Authority, in terms of the Grant Regulations, was received for the SETA to pay the DHET R110 million from reserves during the financial year.
Supply Chain ManagementThe Accounting Authority approved policies, including those of Supply Chain Management, which sought to strengthen operations and performance. Bid committees are in place and operate effectively.
Strict controls have been applied to comply with National Treasury Cost Containment Instructions and this has manifested in reduced administration costs during the year.
No unsolicited bids were recorded during the year.
Audit Report Matters of 2013/14 and how they were addressedThere were two main areas of concern during the 2013/14 audit by the Auditor‑General. These related to an incomplete register of contractual commitments and inaccuracy of reported performance information. The Commitments Register has been revised to conform to organisational and audit requirements. Performance information has been improved by increasing the regularity
ETDP SETA Annual Report 2014/1512
of reporting and requiring staff at provincial offices to keep records that can be compared directly with consolidated reports. Major quarterly verification has assisted the process. All other audit findings from prior years had been satisfactorily addressed by the reporting date.
Strategies, Results and Challenges Our strategies have been carefully planned and programmes have been packaged for the purposes of coherence and connectedness. Our eight programmes, reflected in the APP 2014/15, are providing a structured approach towards achieving our goals. All our provincial and national priorities are covered, including a wide range of diverse beneficiaries to our programmes. The results have been clearly demonstrated.
The ETDP SETA is constituency-based, with constituents displaying different needs that at times are not related. It takes time for our constituencies to complete recruitment and comply with our business processes. This results in slow expenditure patterns and consequently a large commitment of funds.
Plans for the Future to Address Financial ChallengesThe main financial challenge is the collection of contributions from the DBE and the DHET in good time, as mostly these funds are paid during the last quarter of the financial year. The ETDP SETA will continue to engage the departments to ensure that funds are paid at least by the end of the first quarter.
Events after the Reporting DateNo subsequent events have occurred that have a material effect on the financial position or performance of the SETA.
Economic ViabilityThe SETAs are licensed to operate for a period of five years at a time. At the end of each five year period, the Minister of Higher Education and Training will make a determination as to the re-registration of SETAs and the form that will prevail over the next five year period. The ETDP SETA has operated as a going concern since 2000 and its current registration ends on 31 March 2016. The ETDP SETA is currently in a healthy financial position but the SETA landscape for the next five year period is currently unknown.
Acknowledgements and AppreciationA word of gratitude goes to the Chairperson, members of the Accounting Authority and the Executive Committee for their unwavering support. The continued guidance provided by the Committees, especially the Audit Committee and the Chambers, is appreciated.
I would like to thank the ETDP SETA’s constituent employers and beneficiaries, nationally and provincially, who continue to support the SETA in the delivery and achievement of its APP outputs.
I would also like to express my gratitude to management and staff of the ETDP SETA for their resilience and willingness to meet the objectives of the organisation. It was indeed a difficult year but we survived and overcame the challenges in order to make a difference in the lives of ordinary South Africans, especially young people.
Conclusion Despite the few outputs that were not met in the financial year, we remained committed and therefore achieved most targets. The targets that were not met will continue to receive attention in the new financial year.
We strongly believe that our programmes, activities and information-sharing sessions have gone a long way towards making a difference in the lives of our people, especially lecturers, providers and practitioners in various institutions, learners, students, the unemployed youth and our constituencies and their organisations.
Together, we are moving South Africa towards ensuring that all doors of learning and culture are open.
Ms Sesi Nombulelo NxesiChief Executive OfficerETDP SETA
Date: 31 July 2015
Part A: General Information
ETDP SETA Annual Report 2014/15 13
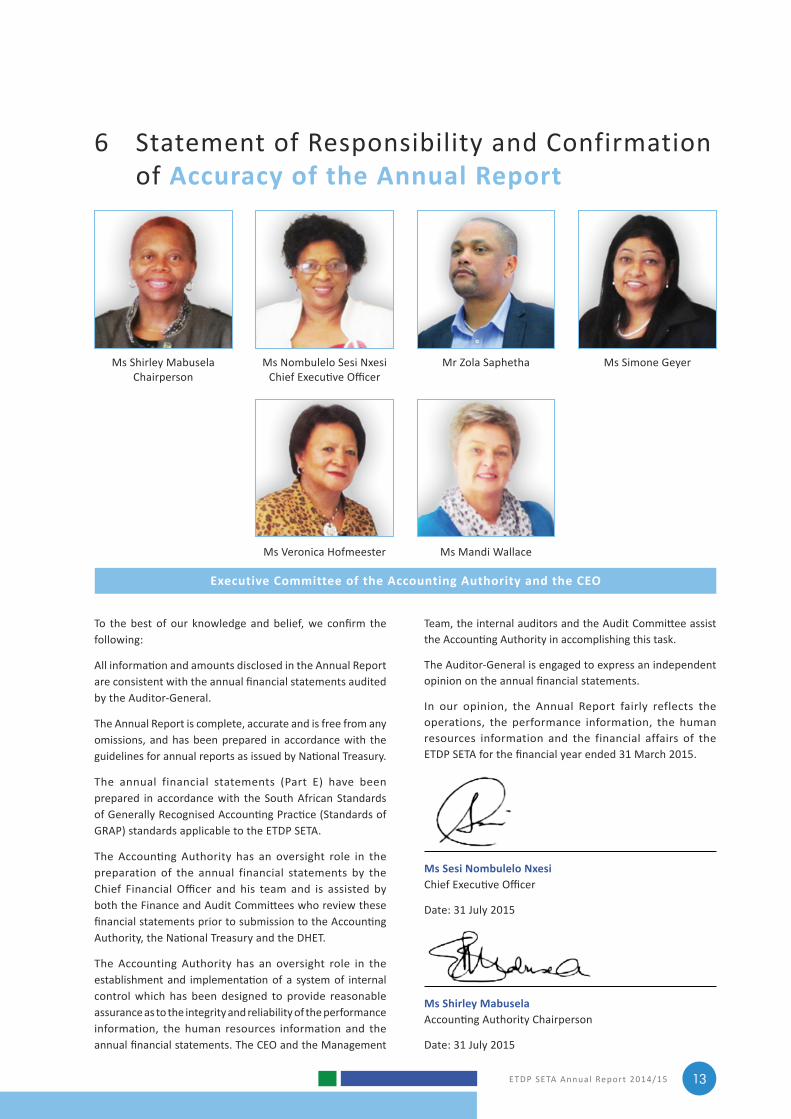
6 Statement of Responsibility and Confirmation of Accuracy of the Annual Report
To the best of our knowledge and belief, we confirm the following:
All information and amounts disclosed in the Annual Report are consistent with the annual financial statements audited by the Auditor‑General.
The Annual Report is complete, accurate and is free from any omissions, and has been prepared in accordance with the guidelines for annual reports as issued by National Treasury.
The annual financial statements (Part E) have been prepared in accordance with the South African Standards of Generally Recognised Accounting Practice (Standards of GRAP) standards applicable to the ETDP SETA.
The Accounting Authority has an oversight role in the preparation of the annual financial statements by the Chief Financial Officer and his team and is assisted by both the Finance and Audit Committees who review these financial statements prior to submission to the Accounting Authority, the National Treasury and the DHET.
The Accounting Authority has an oversight role in the establishment and implementation of a system of internal control which has been designed to provide reasonable assurance as to the integrity and reliability of the performance information, the human resources information and the annual financial statements. The CEO and the Management
Team, the internal auditors and the Audit Committee assist the Accounting Authority in accomplishing this task.
The Auditor‑General is engaged to express an independent opinion on the annual financial statements.
In our opinion, the Annual Report fairly reflects the operations, the performance information, the human resources information and the financial affairs of the ETDP SETA for the financial year ended 31 March 2015.
Ms Sesi Nombulelo NxesiChief Executive Officer
Date: 31 July 2015
Ms Shirley MabuselaAccounting Authority Chairperson
Date: 31 July 2015
Executive Committee of the Accounting Authority and the CEO
Mr Zola SaphethaMs Shirley MabuselaChairperson
Ms Mandi WallaceMs Veronica Hofmeester
Ms Nombulelo Sesi NxesiChief Executive Officer
Ms Simone Geyer
ETDP SETA Annual Report 2014/1514
7 Strategic Overview
7.1 Vision, Mission and Values
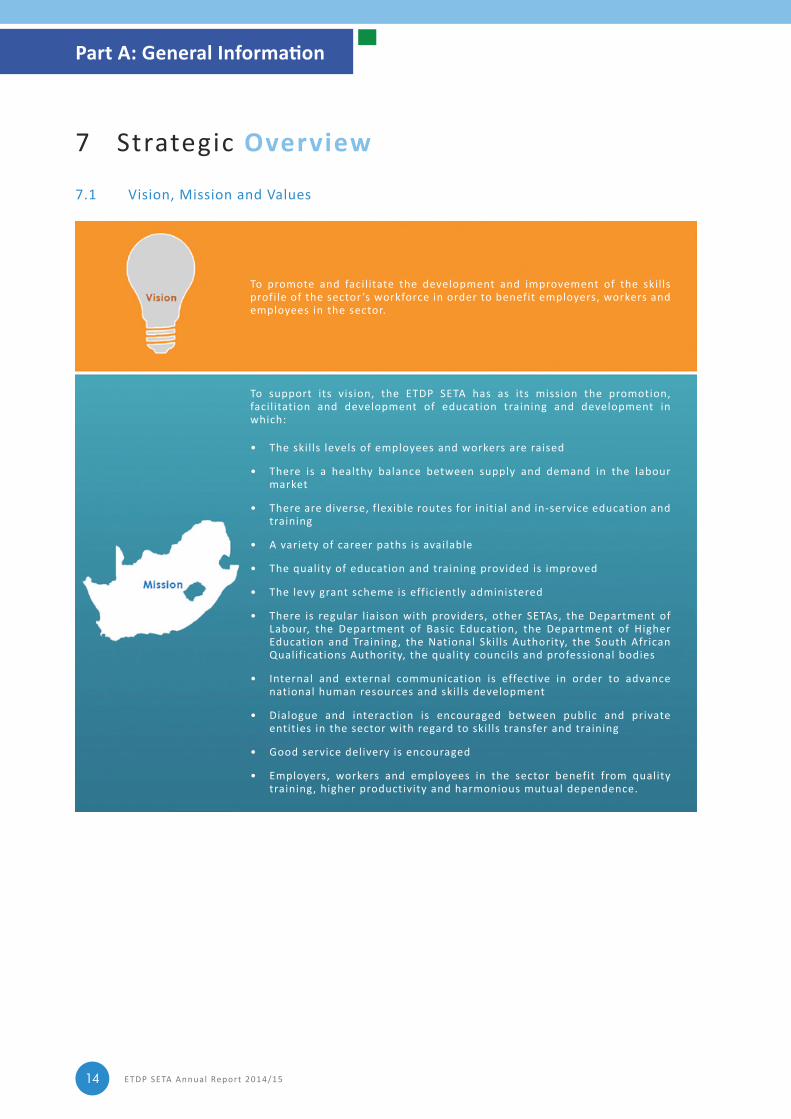
To promote and facilitate the development and improvement of the skills profile of the sector ’s workforce in order to benefit employers, workers and employees in the sector.
To support its vision, the ETDP SETA has as its mission the promotion, facilitation and development of education training and development in which:
• The skills levels of employees and workers are raised
• There is a healthy balance between supply and demand in the labour market
• There are diverse, flexible routes for initial and in‑service education and training
• A variety of career paths is available
• The quality of education and training provided is improved
• The levy grant scheme is efficiently administered
• There is regular l iaison with providers, other SETAs, the Department of Labour, the Department of Basic Education, the Department of Higher Education and Training, the National Skills Authority, the South African Qualifications Authority, the quality councils and professional bodies
• Internal and external communication is effective in order to advance national human resources and skills development
• Dialogue and interaction is encouraged between public and private entities in the sector with regard to skills transfer and training
• Good service delivery is encouraged
• Employers, workers and employees in the sector benefit from quality training, higher productivity and harmonious mutual dependence.
Part A: General Information

ETDP SETA Annual Report 2014/15 15
8 Legislative and Other MandatesThe ETDP SETA operates under Schedule 3A in terms of the PFMA. The following are the legislative, policy and other mandates that govern the work of the ETDP SETA:
• The Skills Development Act, 1998 (Act No. 97 of 1998), as amended in 2008• The Skills Development Levies Act, 1999 (Act No. 9 of 1999)• The Public Finance Management Act, 1999 (Act No. 1 of 1999), as amended by Act No. 29 of 1999• The National Treasury Regulations• The National Skills Development Strategy III• The New SETA Grant Regulations – December 2012 (Government Notice No. 35940)• The Standard Constitution provided for the SETAs• National Development Plan Vision 2030• The Medium Term Strategic Framework 2014–2019 • The White Paper on Post School Education and Training• The Human Resource Development Strategy for South Africa, 2030• Education, Training and Development Sector Skills Plan.
The ETDP SETA upholds the following values:• Transparency
• Fairness
• Courteousness and caring
• Honouring deadlines
• Promotion of quality among all stakeholders
• Co‑operative governance
• Approaching work in a developmental manner
• Continuous improvement
• A sustainable environment.
ETDP SETA Annual Report 2014/1516
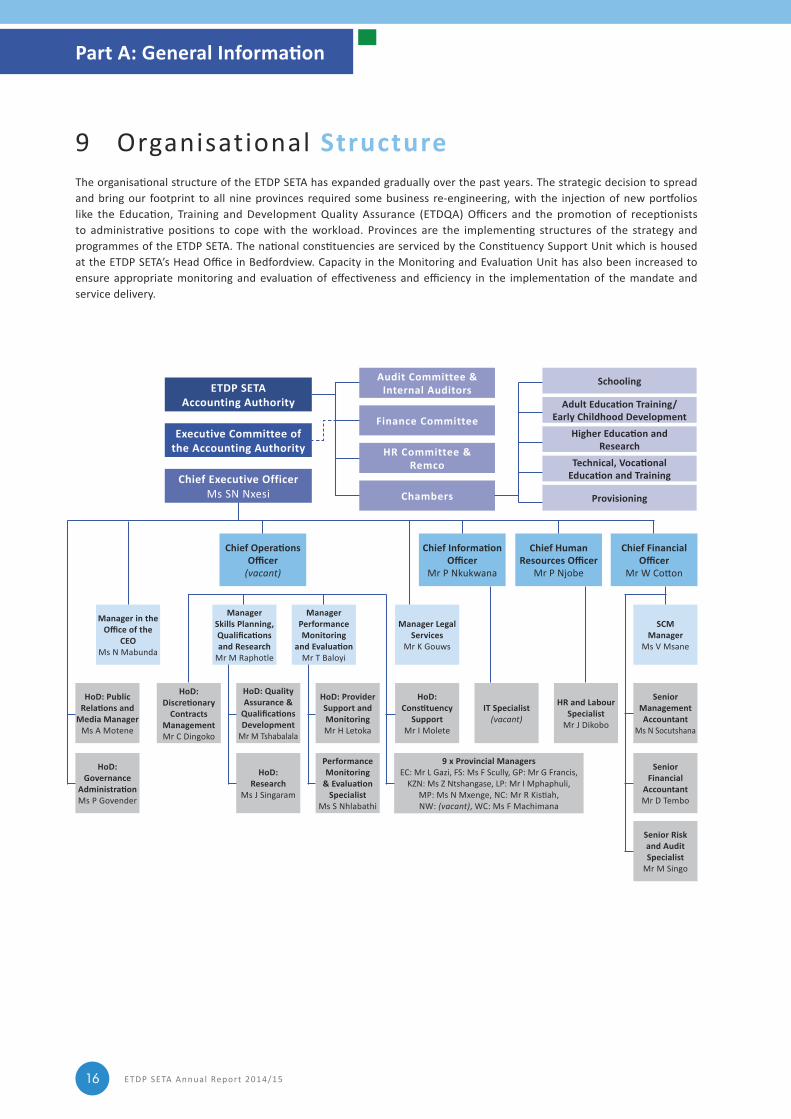
9 Organisational StructureThe organisational structure of the ETDP SETA has expanded gradually over the past years. The strategic decision to spread and bring our footprint to all nine provinces required some business re-engineering, with the injection of new portfolios like the Education, Training and Development Quality Assurance (ETDQA) Officers and the promotion of receptionists to administrative positions to cope with the workload. Provinces are the implementing structures of the strategy and programmes of the ETDP SETA. The national constituencies are serviced by the Constituency Support Unit which is housed at the ETDP SETA’s Head Office in Bedfordview. Capacity in the Monitoring and Evaluation Unit has also been increased to ensure appropriate monitoring and evaluation of effectiveness and efficiency in the implementation of the mandate and service delivery.
ETDP SETA Accounting Authority
Audit Committee &Internal Auditors
Finance Committee
HR Committee &Remco
Chambers
Chief Financial Officer
Mr W Cotton
Schooling
Adult Education Training/ Early Childhood Development
Higher Education and Research
Technical, Vocational Education and Training
Provisioning
Chief Human Resources Officer
Mr P Njobe
Chief Information Officer
Mr P Nkukwana
Chief Operations Officer
(vacant)
HoD: Public Relations and
Media ManagerMs A Motene
HoD: Governance
AdministrationMs P Govender
Manager in the Office of the
CEOMs N Mabunda
ManagerSkills Planning, Qualificationsand Research
Mr M Raphotle
ManagerPerformance Monitoring
and EvaluationMr T Baloyi
Manager Legal Services
Mr K Gouws
SCMManager
Ms V Msane
HoD: Discretionary
Contracts ManagementMr C Dingoko
HoD: Quality Assurance &
Qualifications Development
Mr M Tshabalala
HoD:Research
Ms J Singaram
HoD: Provider Support and MonitoringMr H Letoka
PerformanceMonitoring
& Evaluation Specialist
Ms S Nhlabathi
HoD: Constituency
SupportMr I Molete
9 x Provincial ManagersEC: Mr L Gazi, FS: Ms F Scully, GP: Mr G Francis,
KZN: Ms Z Ntshangase, LP: Mr I Mphaphuli, MP: Ms N Mxenge, NC: Mr R Kistiah, NW: (vacant), WC: Ms F Machimana
IT Specialist(vacant)
HR and Labour Specialist
Mr J Dikobo
SeniorManagement Accountant
Ms N Socutshana
Senior Financial
AccountantMr D Tembo
Senior Risk and Audit Specialist
Mr M Singo
Executive Committee of the Accounting Authority
Chief Executive OfficerMs SN Nxesi
Part A: General Information

Part BPer formance Information
ETDP SETA Annual Report 2014/1518
1 Auditor‑General’s Report: Predetermined Objectives
The Auditor‑General performed procedures to obtain evidence about the usefulness and reliability of the reported performance information for the following selected programmes presented in the annual performance report of the public entity for the year ended 31 March 2015:
• Programme 2: Supporting FETs and HEIs to be responsive to ETD sector and national priorities
• Programme 3: Teacher development in support of the integrated strategic planning framework for teacher education and development in South Africa
• Programme 4: Increasing student access to and graduate output in higher and further education institutions
• Programme 5: Youth development for employability.
The Auditor‑General evaluated the reported performance information against the overall criteria of usefulness and reliability.
The Auditor‑General evaluated the usefulness of the reported performance information to determine whether it was presented in accordance with the National Treasury’s annual reporting principles and whether the reported performance was consistent with the planned programmes. The Auditor‑General further performed tests to determine whether indicators and targets were well defined, verifiable, specific, measurable, time bound and relevant, as required by the National Treasury’s Framework for managing programme performance information (FMPPI).
The Auditor‑General assessed the reliability of the reported performance information to determine whether it was valid, accurate and complete.
The Auditor-General did not raise any material findings on the usefulness and reliability of the reported performance information for the selected programmes.
2 Situational Analysis
2.1 Service Delivery EnvironmentThe ETDP SETA, like all public sector institutions, has to respond to high demands for skills within the context of a low base of accredited providers and diminishing public funds for public education and training institutions. The ETDP SETA delivers services to 12 constituencies ranging from pre-schooling (early childhood development), schooling (public and independent schools), and post schooling (TVET Colleges, Adult Education and Training (AET) Centres, and public and private HEIs, to non-schooling constituencies (trade unions, political parties, professional bodies, non‑governmental organisations, libraries and archives). These constituencies have different and divergent skills development needs which the ETDP SETA has to coalesce into an accepted APP, informed by its five-year Strategic Plan, Sector Skills Plan, national priorities and the DHET’s directives. It is within this environment that the ETDP SETA implemented its eight programmes as per its 2014/15 APP.
As a constituency‑based organisation, the ETDP SETA encountered some challenges relating to the long process of consultations with its constituencies, which led to delays in the implementation of programmes. This negatively affected the achievement of some targets. The ETDP SETA continues to experience challenges in the collection of WSPRs, mainly due the reduction of mandatory grant pay-outs from 50% to 20%. These challenges are currently being addressed through the adoption of different approaches to ensure better participation of constituent employers in the ETDP SETA programmes and submission of WSPRs.
2.2 Organisational EnvironmentThe ETDP SETA, like other SETAs has experienced high staff turnover levels due to the uncertainty of its continued existence. As part of the ongoing maturation of the strategy, a full reassessment of our organisational structure is under way and will be incorporated as part of the 2015 updated structure in response to capacity needs of the organisation. This is dealt with under Programme 8: Improving organisational administration and management to enhance organisational performance.
There is a need for the development of second tier management and leadership in our organisation. This is critical to ensure higher levels of responsiveness as well as effective and efficient service delivery to the public.
Part B: Performance Information
ETDP SETA Annual Report 2014/15 19
During the period under review, the organisation experienced challenges regarding ETDQA support processes to service providers due to systemic and IT weaknesses. The organisation has to strengthen its financial management system with strengthened reporting and accounting systems and an improved administrative system, in order to:
• Begin the process of integrating business units into transversal and collaborative components and discourage unproductive silo approaches
• Continue to leverage finance and human capital management through IT enabled systems
• Recognise the competitive advantage the SETA has developed by establishing Research Chairs and enhancing the internal research capacity of the organisation as well as improving knowledge management and talent enhancement
• Standardise management reporting through integrated business management systems by capitalising on IT innovations and institutionalising Standard Operating Procedures (SoPs) across all business units.
The ETDP SETA, through its governance structures and management, undertook strategic retreat meetings to respond to the challenges experienced in the course of its operation and programme delivery. The decisions reached at these retreats yielded important and far reaching indicators regarding turning around and shaping the Five Year Strategic Plan (2016–2019), and the Annual Performance Plan 2015/16.
2.3 Key Policy Developments and Legislative Changes
The White Paper for Post-School Education and Training came into effect in November 2013 and largely informed the goals, and objectives of the Annual Performance Plan 2014/15.
The Guidelines on the New Grant Regulations regarding monies received by a SETA and related matters – Government Gazette no. 35940 of 03 December 2012 were amended on 15 July 2013.
The ETDP SETA received correspondence which prescribed a capped amount for expenditure for the 2013 Medium Term Expenditure Framework (MTEF). The capping was lifted in the second week of March, at the close of the financial year. This change will contribute to under‑expenditure and the non‑commitment of funds, which will also have to be returned to the NSF.
2.4 Strategic Outcome Oriented Goals
2.4.1 BackgroundFollowing the launch of the National Skills Development Strategy (NSDS III) in February 2011, the ETDP SETA developed its Five Year Strategic Plan. The Strategic Plan, which was approved by the Accounting Authority, was developed to set out the ETDP SETA’s policy priorities, programmes and project plans for the period 2011/12–2015/16.
The Five Year Strategic Plan focused on strategic outcome oriented goals for the organisation as a whole; and objectives for its primary service-delivery areas aligned with its budget programmes and budget sub‑programmes. The identified programmes and sub‑programmes for implementation during the five‑year period were informed by the government outcomes following the 2009 elections.
2.4.2 Strategic Outcome Oriented GoalsThe following are the ETDP SETA strategic outcome oriented goals and the progress made towards the achievement of the goals:
Goal 1: Increasing the ETDP SETA’s capacity for skills planning and mechanisms for addressing the gap and/or mismatch between the supply of, and demand for, skills in the ETD Sector by March 2016.
The ETDP SETA has increased its capacity to develop an improved and quality ETD Sector Skills Plan, by entering into a partnership with Research Chairs and researcher specialists in addressing the mismatch between supply of and demand for skills in the ETD Sector. As a result the SSP informs the five year Strategic plan to ensure that the skills interventions are relevant and addresses the skills gaps and the scarce and critical skills and PIVOTAL list have informed the programmes of the APP on an annual basis.
Goal 2: Strengthening the human resource base of TVET Colleges by increasing the development of competent and professional lecturers and managers.
The TVET Colleges have been supported in extending the scope to be responsive to the ETD sector and national priorities. The Senior Management of the colleges have been trained in Leadership and Management programmes to improve their skills in managing the colleges. For the lecturers, the focus has been in content knowledge and work integrated learning. Since there is no vocational qualification for lecturers, the ETDP SETA has initiated and supported the development of the TVET Vocational qualification.
ETDP SETA Annual Report 2014/1520
In addition, the TVET College Councils have been supported through and induction programme to ensure that college corporate governance. Furthermore, their career development service has been supported by the placement of Career Development Officers in all the TVET College campuses.
Goal 3: Improving the quality of teaching and learning in the schooling system aimed at improving learner performance.
Teachers have been trained on gateway subjects and the End User Computing to improve the quality of teaching and learning in schools. Teachers in full service and LSEN schools have been capacitated in Braille and Sign Language to ensure inclusive education in our schools. The ETDP SETA has also funded the training of the Grade R/Foundation Phase teachers to improve their qualifications.
In support of the effective functions of the public schooling institutions, the SETA has placed school administrators.
Goal 4: Increasing student access to occupationally directed programmes, providing both intermediate and high level skills for new entrants to ETD occupations and professions.
The ETDP SETA has ensured that a Learner’s Career Guide is developed and to date 97 290 career guides have been distributed to support learners in their selection of relevant subjects and careers. The SETA has also provided funding to learners to access occupationally directed programmes.
Goal 5: Developing young people for employability by providing workplace learning opportunities.
In the achievement of this goal, young people have been provided with workplace learning such as Learnerships, Internships and Workplace learning opportunities. Majority have completed their programmes and this has increased their chances for employment.
Goal 6: Improving the level of skills and competencies of employees in the ETDP constituencies.
The ETDP SETA Constituencies have been supported through skills development funding to ensure that the skills level of the employees improves as well as institutional capacity.
Goal 7: Improving the quality of provisioning of the ETDP SETA programmes by strengthening the quality assurance systems.
The ETDP SETA has revised its policies to be in line with the QCTO landscape. It continued to increase the accreditation of providers including verification and certification of learners. The SETA is also piloting the implementation of the RPL in four provinces.
Goal 8: Tightening the ETDP SETA’s internal controls and improving organisational performance through competent leadership, management and efficient administration.
Internal controls and performance of the SETA have improved hence the SETA has consistently received unqualified and clean audit reports since its inception.
3 Performance Information by Programme
3.1 Programme 1: Development of a credible Sector Skills Plan
3.1.1 PurposeThe purpose of this programme is to create institutional capacity for skills planning and mechanisms for addressing skills development needs and interventions in the ETD Sector. The Sector Skills Plan (SSP) for the ETD Sector informed the ETDP SETA’s Strategic Plan (2011–2016) and the 2014/15 Annual Performance Plan (APP), to ensure synergy and alignment between the three documents.
3.1.2 Sub‑programmes• Sector Skills Plan (SSP) update• Continuous support for the four Research Chairs and
establishment of two new Chairs • Development/revision of the Scarce and Critical Skills
Guide• Distribution/dissemination of the Scarce and Critical
Skills Guide• Training of Skills Development Facilitators (SDFs)/
Sector Skills Specialists/Life Orientation (LO) teachers• Submission of Workplace Skills Plans (WSPs)/Annual
Training Reports (ATRs)• Annual Stakeholder Satisfaction Survey • Evaluation Study on SETA funded programmes.
3.1.3 Strategic Objectives• A credible SSP in place informed by in‑depth research
and analysis of the ETD Sector• To improve the submission of WSPs, ATRs, Professional,
Vocational, Technical and Academic Learning (PIVOTAL) Plans and Reports by both levy paying and non‑levy paying organisations
• Disbursement of mandatory grants to all levy paying organisations in the ETD Sector
• Research agenda and strategy as well as the skills planning systems in place; including monitoring, evaluation and impact assessment frameworks.
ETDP SETA Annual Report 2014/15 21
3.1.4 Actual Achievements
Sector Skills Plan
The updated 2015/16 SSP was submitted to the DHET on 30 September 2014 and was approved.
Research Chairs Project
Six Research Chairs have been appointed to date; two of whom were appointed in 2014/15. The focus areas of the Research Chairs are as follows:
• The development of a system for labour market intelligence gathering and information relating to the ETD Sector (University of Pretoria)
• Technical Vocational Education and Training empirical research relating to skills planning and TVET lecturer professional development (University of the Witwatersrand)
• Research relating to monitoring, evaluation and impact assessment support for the ETD Sector (University of KwaZulu-Natal)
• Early Childhood Development (ECD) and Schooling (North West University)
• Youth Employability and Empowerment for Socio‑Economic Development (Nelson Mandela Metropolitan University)
• Work Integrated Learning and the Recognition of Prior Learning in the ETD Sector (Cape Peninsula University of Technology).
Distribution of the Scarce and Critical Skills Guide
The Scarce and Critical Skills Guide was distributed among 8 762 constituencies, SDFs, Sector Specialists and LO teachers in all the nine provinces.
Training of SDFs and Sector Specialists
Training in the use of the guide was given to 2 377 Sector Specialists, against a target of 3 000.
Workplace Skills Plan Reports (WSPR)
A target of 1 500 WSPR submissions was set for the 2014/15 financial year, however 1 276 submissions were received, a shortfall of 224.
Stakeholder Satisfaction Survey
A stakeholder questionnaire was developed and administered. A stakeholder satisfaction survey and an evaluation study were implemented in order to assess satisfaction. The report is available and shows areas of strength and those that require improvement. Strides are being made to respond to the challenges identified.
ETDP SETA Annual Report 2014/1522
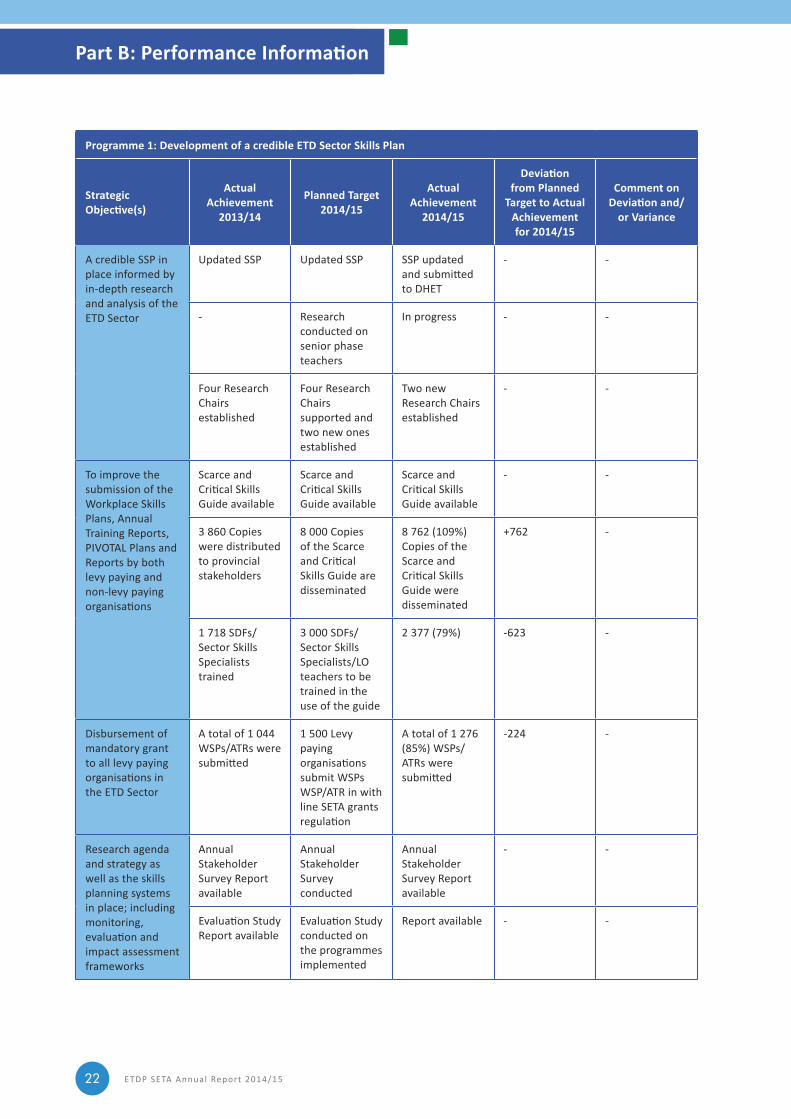
Programme 1: Development of a credible ETD Sector Skills Plan
Strategic Objective(s)
Actual Achievement
2013/14
Planned Target2014/15
Actual Achievement
2014/15
Deviation from Planned
Target to Actual Achievement for 2014/15
Comment on Deviation and/
or Variance
A credible SSP in place informed by in‑depth research and analysis of the ETD Sector
Updated SSP Updated SSP SSP updated and submitted to DHET
‑ ‑
‑ Research conducted on senior phase teachers
In progress ‑ ‑
Four Research Chairs established
Four Research Chairs supported and two new ones established
Two new Research Chairs established
‑ ‑
To improve the submission of the Workplace Skills Plans, Annual Training Reports, PIVOTAL Plans and Reports by both levy paying and non‑levy paying organisations
Scarce and Critical Skills Guide available
Scarce and Critical Skills Guide available
Scarce and Critical Skills Guide available
‑ ‑
3 860 Copies were distributed to provincial stakeholders
8 000 Copies of the Scarce and Critical Skills Guide are disseminated
8 762 (109%) Copies of the Scarce and Critical Skills Guide were disseminated
+762 ‑
1 718 SDFs/Sector Skills Specialists trained
3 000 SDFs/ Sector Skills Specialists/LO teachers to be trained in the use of the guide
2 377 (79%) ‑623 ‑
Disbursement of mandatory grant to all levy paying organisations in the ETD Sector
A total of 1 044 WSPs/ATRs were submitted
1 500 Levy paying organisations submit WSPs WSP/ATR in with line SETA grants regulation
A total of 1 276 (85%) WSPs/ATRs were submitted
‑224 ‑
Research agenda and strategy as well as the skills planning systems in place; including monitoring, evaluation and impact assessment frameworks
Annual Stakeholder Survey Report available
Annual Stakeholder Survey conducted
Annual Stakeholder Survey Report available
‑ ‑
Evaluation Study Report available
Evaluation Study conducted on the programmes implemented
Report available ‑ ‑
Part B: Performance Information
ETDP SETA Annual Report 2014/15 23
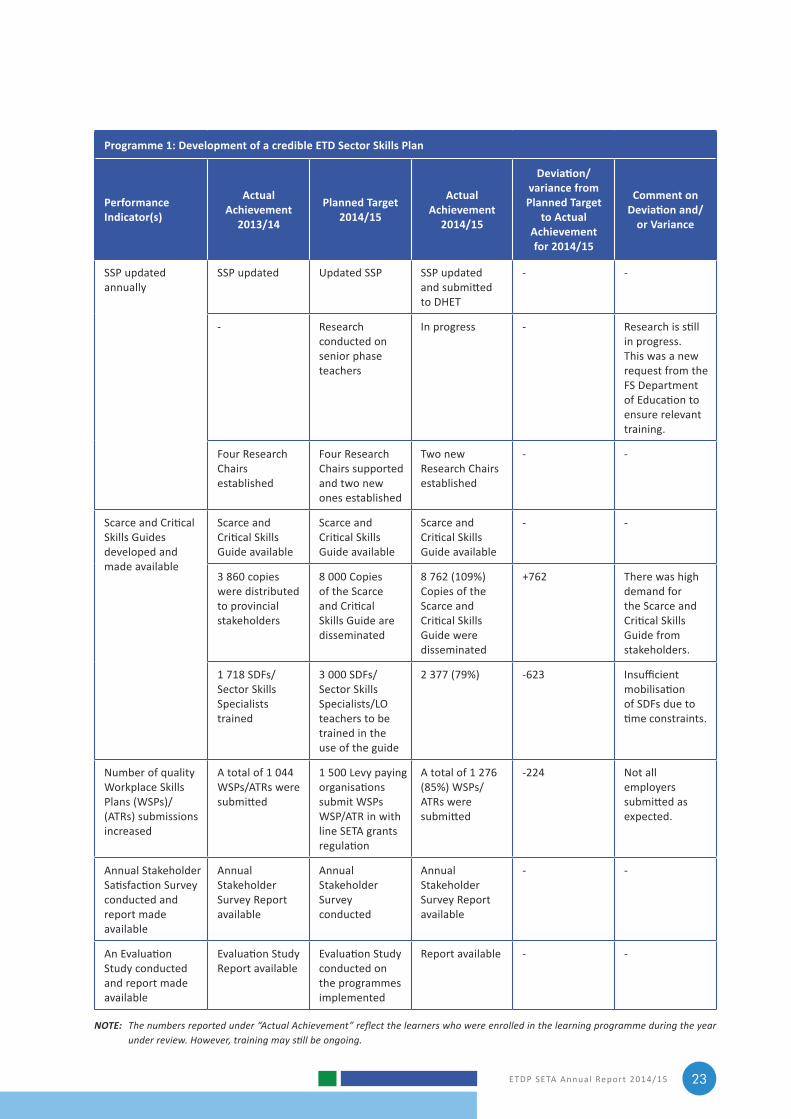
Programme 1: Development of a credible ETD Sector Skills Plan
Performance Indicator(s)
Actual Achievement
2013/14
Planned Target2014/15
Actual Achievement
2014/15
Deviation/variance from Planned Target
to Actual Achievement for 2014/15
Comment on Deviation and/
or Variance
SSP updated annually
SSP updated Updated SSP SSP updated and submitted to DHET
‑ ‑
‑ Research conducted on senior phase teachers
In progress ‑ Research is still in progress. This was a new request from the FS Department of Education to ensure relevant training.
Four Research Chairs established
Four Research Chairs supported and two new ones established
Two new Research Chairs established
‑ ‑
Scarce and Critical Skills Guides developed and made available
Scarce and Critical Skills Guide available
Scarce and Critical Skills Guide available
Scarce and Critical Skills Guide available
‑ ‑
3 860 copies were distributed to provincial stakeholders
8 000 Copies of the Scarce and Critical Skills Guide are disseminated
8 762 (109%) Copies of the Scarce and Critical Skills Guide were disseminated
+762 There was high demand for the Scarce and Critical Skills Guide from stakeholders.
1 718 SDFs/Sector Skills Specialists trained
3 000 SDFs/ Sector Skills Specialists/LO teachers to be trained in the use of the guide
2 377 (79%) ‑623 Insufficient mobilisation of SDFs due to time constraints.
Number of quality Workplace Skills Plans (WSPs)/ (ATRs) submissions increased
A total of 1 044 WSPs/ATRs were submitted
1 500 Levy paying organisations submit WSPs WSP/ATR in with line SETA grants regulation
A total of 1 276 (85%) WSPs/ATRs were submitted
‑224 Not all employers submitted as expected.
Annual Stakeholder Satisfaction Survey conducted and report made available
Annual Stakeholder Survey Report available
Annual Stakeholder Survey conducted
Annual Stakeholder Survey Report available
‑ ‑
An Evaluation Study conducted and report made available
Evaluation Study Report available
Evaluation Study conducted on the programmes implemented
Report available ‑ ‑
NOTE: The numbers reported under “Actual Achievement” reflect the learners who were enrolled in the learning programme during the year under review. However, training may still be ongoing.
ETDP SETA Annual Report 2014/1524
3.1.5 Strategy to Overcome Areas of Under PerformanceThe Scarce and Critical Skills Guide will be printed during the first quarter to ensure that there is enough time for the training of the SDFs and mobilisation for the submission of WSPs/ATRs.
3.1.6 Changes to Planned TargetsAdditional research was conducted on Senior Phase teachers in collaboration with the Free State Department of Education.
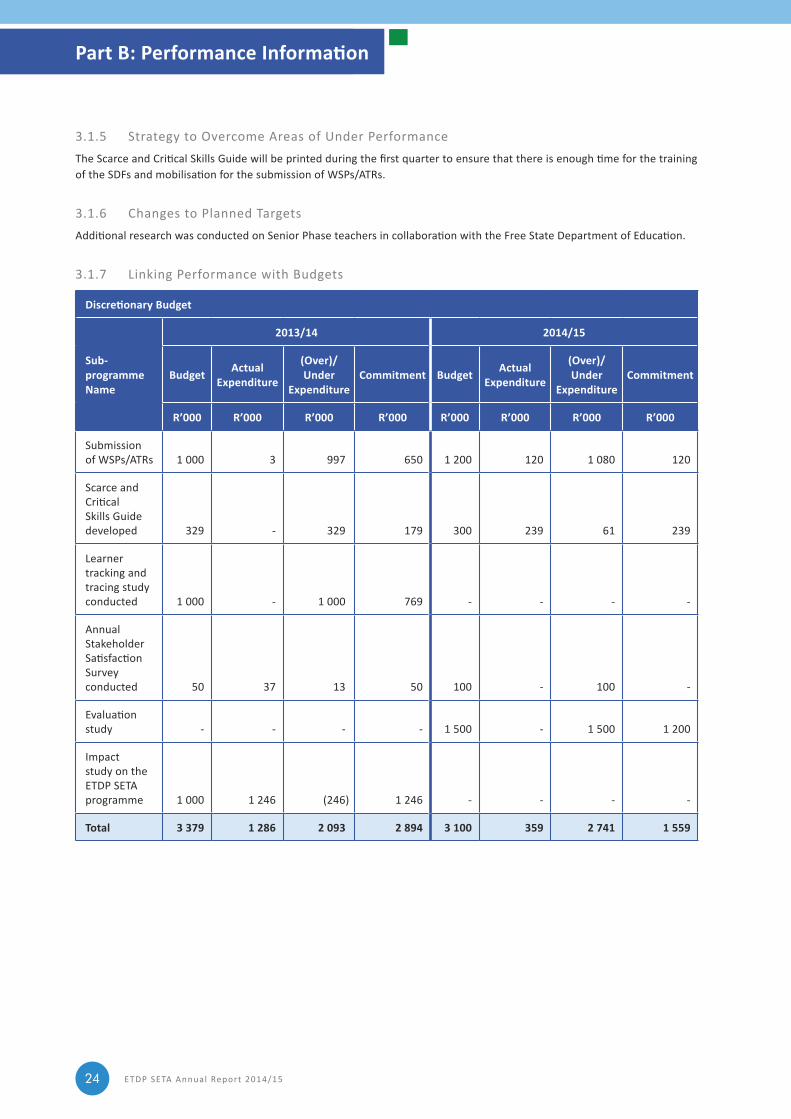
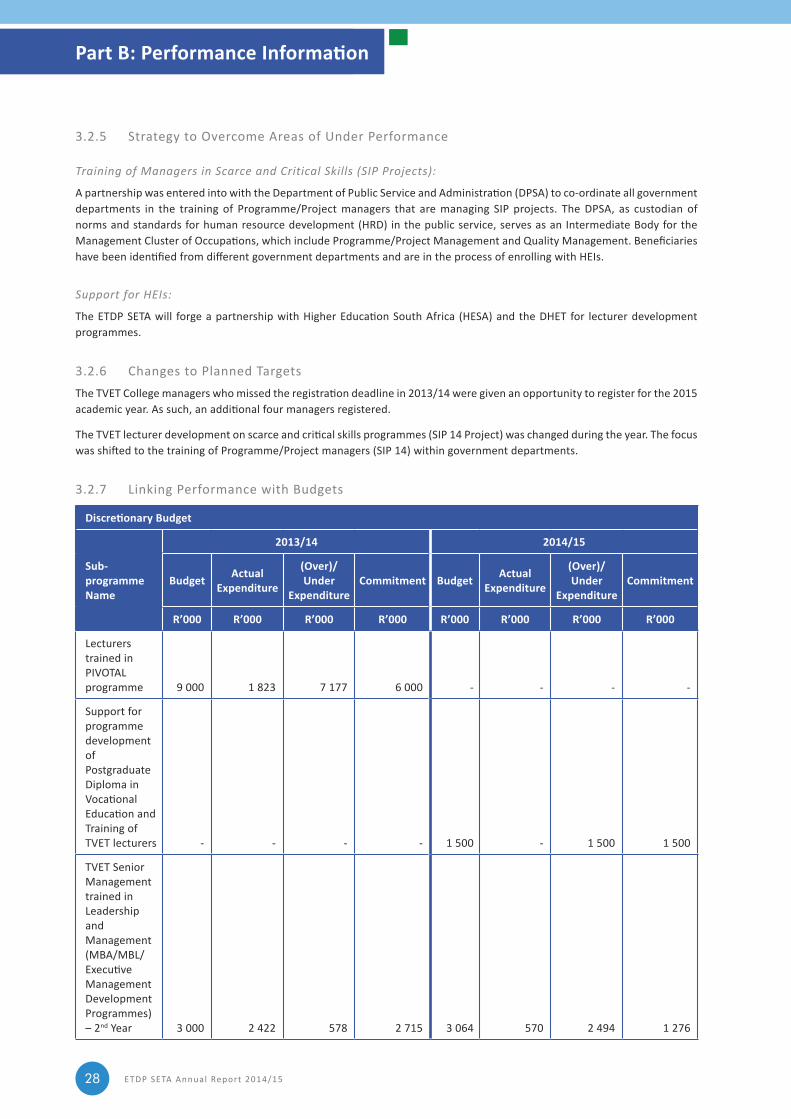
3.1.7 Linking Performance with Budgets
Discretionary Budget
Sub-programme Name
2013/14 2014/15
Budget Actual Expenditure
(Over)/Under
ExpenditureCommitment Budget Actual
Expenditure
(Over)/Under
Expenditure Commitment
R’000 R’000 R’000 R’000 R’000 R’000 R’000 R’000
Submission of WSPs/ATRs 1 000 3 997 650 1 200 120 1 080 120
Scarce and Critical Skills Guide developed 329 ‑ 329 179 300 239 61 239
Learner tracking and tracing study conducted 1 000 ‑ 1 000 769 ‑ ‑ ‑ ‑
Annual Stakeholder Satisfaction Survey conducted 50 37 13 50 100 ‑ 100 ‑
Evaluation study ‑ ‑ ‑ ‑ 1 500 ‑ 1 500 1 200
Impact study on the ETDP SETA programme 1 000 1 246 (246) 1 246 ‑ ‑ ‑ ‑
Total 3 379 1 286 2 093 2 894 3 100 359 2 741 1 559
Part B: Performance Information
ETDP SETA Annual Report 2014/15 25
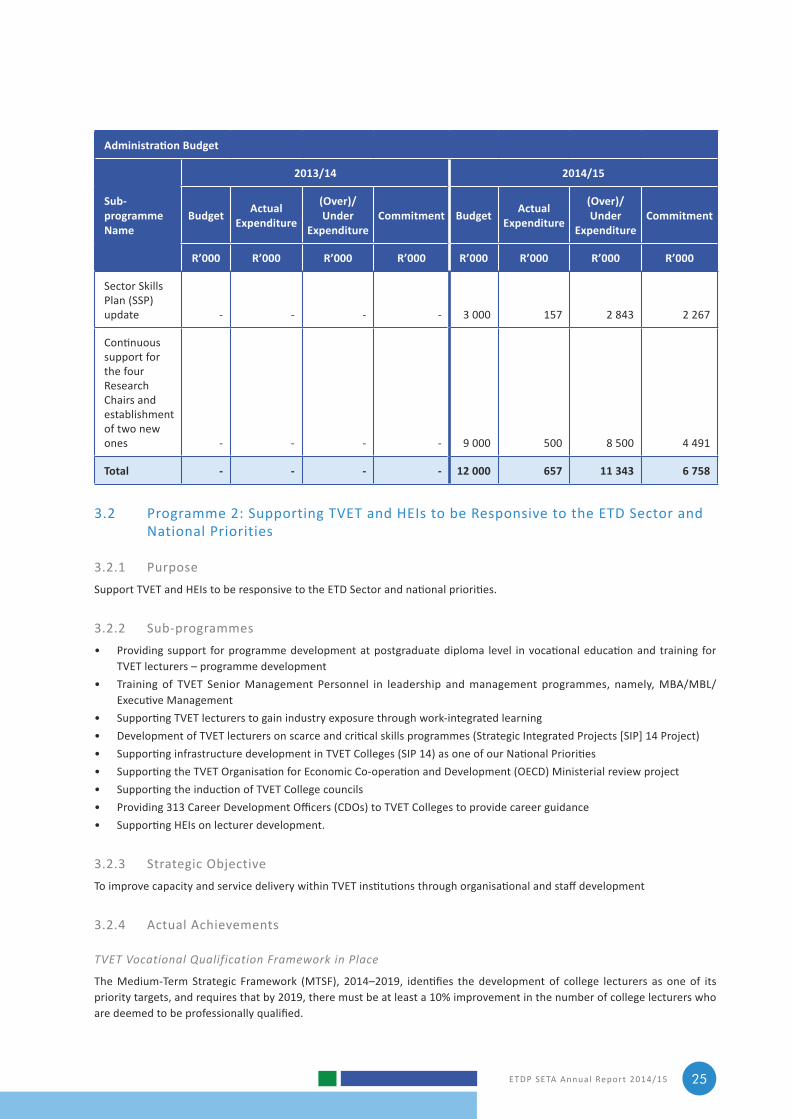
Administration Budget
Sub-programme Name
2013/14 2014/15
Budget Actual Expenditure
(Over)/Under
ExpenditureCommitment Budget Actual
Expenditure
(Over)/Under
Expenditure Commitment
R’000 R’000 R’000 R’000 R’000 R’000 R’000 R’000
Sector Skills Plan (SSP) update ‑ ‑ ‑ ‑ 3 000 157 2 843 2 267
Continuous support for the four Research Chairs and establishment of two new ones ‑ ‑ ‑ ‑ 9 000 500 8 500 4 491
Total - - - - 12 000 657 11 343 6 758
3.2 Programme 2: Supporting TVET and HEIs to be Responsive to the ETD Sector and National Priorities
3.2.1 PurposeSupport TVET and HEIs to be responsive to the ETD Sector and national priorities.
3.2.2 Sub‑programmes• Providing support for programme development at postgraduate diploma level in vocational education and training for
TVET lecturers – programme development• Training of TVET Senior Management Personnel in leadership and management programmes, namely, MBA/MBL/
Executive Management• Supporting TVET lecturers to gain industry exposure through work-integrated learning• Development of TVET lecturers on scarce and critical skills programmes (Strategic Integrated Projects [SIP] 14 Project)• Supporting infrastructure development in TVET Colleges (SIP 14) as one of our National Priorities• Supporting the TVET Organisation for Economic Co-operation and Development (OECD) Ministerial review project• Supporting the induction of TVET College councils• Providing 313 Career Development Officers (CDOs) to TVET Colleges to provide career guidance• Supporting HEIs on lecturer development.
3.2.3 Strategic ObjectiveTo improve capacity and service delivery within TVET institutions through organisational and staff development
3.2.4 Actual Achievements
TVET Vocational Qualification Framework in Place
The Medium-Term Strategic Framework (MTSF), 2014–2019, identifies the development of college lecturers as one of its priority targets, and requires that by 2019, there must be at least a 10% improvement in the number of college lecturers who are deemed to be professionally qualified.
ETDP SETA Annual Report 2014/1526
To contribute to this national need, the ETDP SETA set a target in 2014/15 to fund the development of the Diploma in TVET for TVET College lecturers. This was done in collaboration with the DHET and nine HEIs, through a signed Memorandum of Understanding (MoU) and Service Level Agreement (SLA). The nine HEIs agreed in a workshop in September 2014 to recommend Wits as the co-ordinating HEI for the project, since Wits is host to the ETDP SETA Research Chair in TVET. The project is in progress. This has enabled the ETDP SETA to contribute towards the improvement of postgraduate qualifications in colleges thus improving the quality of human capital as well as teaching and learning in colleges.
TVET College Managers Trained in Leadership and Management Programmes
Of the 95 managers who were supposed to have been in their 2nd year of study, only 47 remain. The balance either dropped out or did not make it to the 2nd year. There are, however, an additional four managers who registered for the first year of study who may not be counted as part of the 95.
TVET College Lecturers Trained in Work Integrated Learning and Given Industry Exposure
Although 221 lecturers were supposed to have been trained in work integrated learning and given industry exposure, TVET Colleges managed to place 315 lecturers. The target was exceeded by 94 due to the high demand for work integrated learning.
Managers Trained in Scarce and Critical Skills Linked to SIP Projects
No achievement was recorded in this area, although the training of 100 managers is in progress. The programme commenced late due to the scope and focus of the programme being changed by the DHET.
TVET College Councils Inducted on Governance
A total 323 college council members were inducted on governance, 23 more than the target of 300. The additional number were, however, trained within the allocated budget.
Career Development Officers Placed in TVET Colleges and Trained
There was 100% achievement in this area, with 113 new CDOs having been placed and registered with Unisa.
HEIs Supported in Lecturer Development Programmes
A total of 25 HEIs should have been supported, however only 20 received support, with five not participating in the programme.
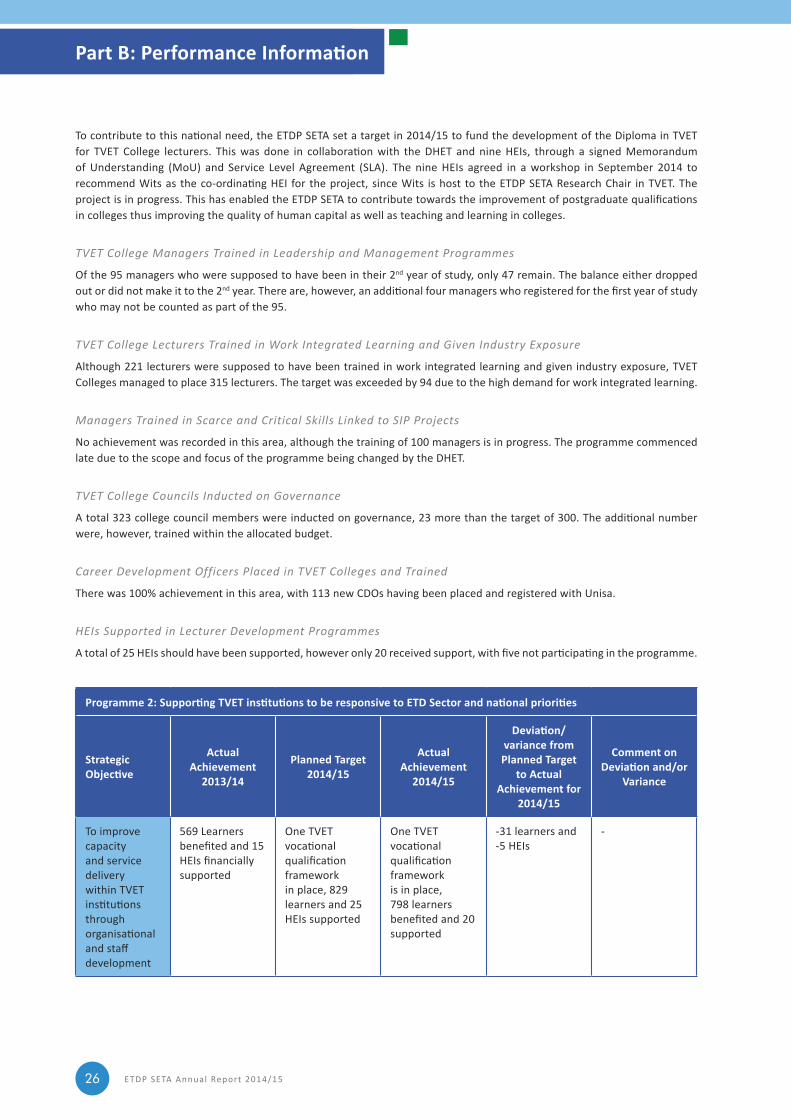
Programme 2: Supporting TVET institutions to be responsive to ETD Sector and national priorities
Strategic Objective
Actual Achievement
2013/14
Planned Target2014/15
Actual Achievement
2014/15
Deviation/variance from Planned Target
to Actual Achievement for
2014/15
Comment on Deviation and/or
Variance
To improve capacity and service delivery within TVET institutions through organisational and staff development
569 Learners benefited and 15 HEIs financially supported
One TVET vocational qualification framework in place, 829 learners and 25 HEIs supported
One TVET vocational qualification framework is in place, 798 learners benefited and 20 supported
‑31 learners and ‑5 HEIs
‑
Part B: Performance Information
ETDP SETA Annual Report 2014/15 27
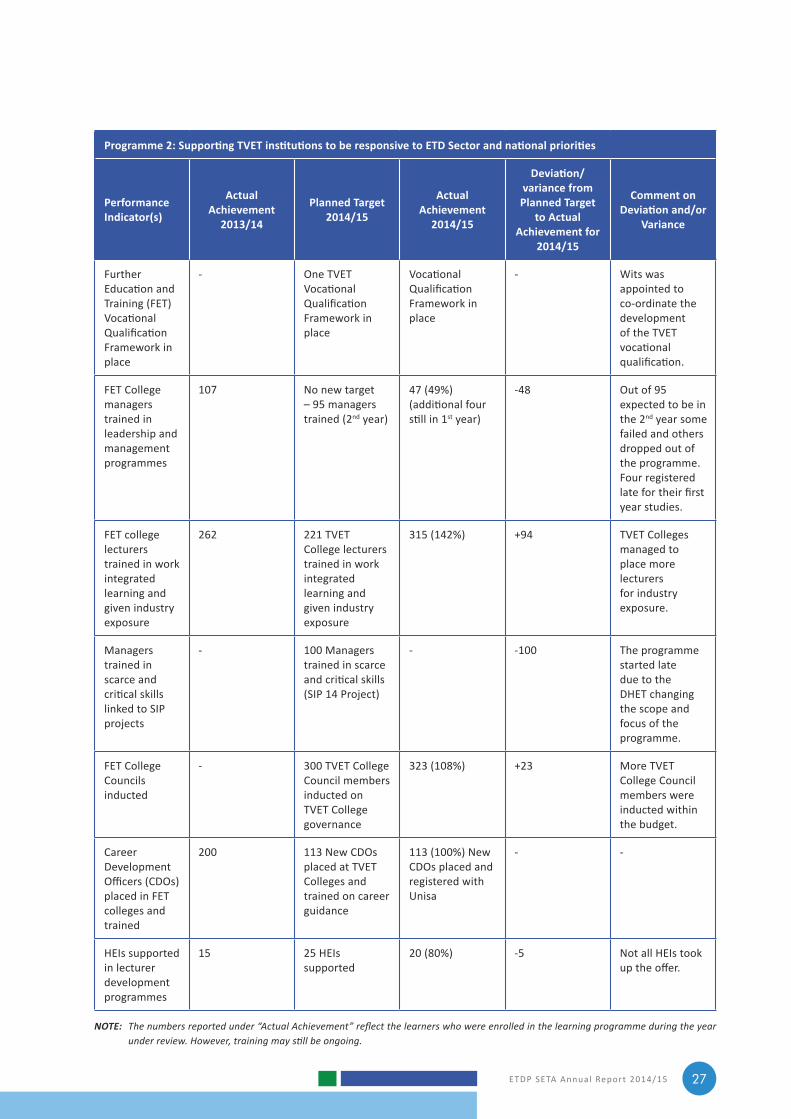
Programme 2: Supporting TVET institutions to be responsive to ETD Sector and national priorities
Performance Indicator(s)
Actual Achievement
2013/14
Planned Target2014/15
Actual Achievement
2014/15
Deviation/variance from Planned Target
to Actual Achievement for
2014/15
Comment on Deviation and/or
Variance
Further Education and Training (FET) Vocational Qualification Framework in place
‑ One TVET Vocational Qualification Framework in place
Vocational Qualification Framework in place
‑ Wits was appointed to co‑ordinate the development of the TVET vocational qualification.
FET College managers trained in leadership and management programmes
107 No new target – 95 managers trained (2nd year)
47 (49%) (additional four still in 1st year)
‑48 Out of 95 expected to be in the 2nd year some failed and others dropped out of the programme. Four registered late for their first year studies.
FET college lecturers trained in work integrated learning and given industry exposure
262 221 TVET College lecturers trained in work integrated learning and given industry exposure
315 (142%) +94 TVET Colleges managed to place more lecturers for industry exposure.
Managers trained in scarce and critical skills linked to SIP projects
‑ 100 Managers trained in scarce and critical skills (SIP 14 Project)
‑ ‑100 The programme started late due to the DHET changing the scope and focus of the programme.
FET College Councils inducted
‑ 300 TVET College Council members inducted on TVET College governance
323 (108%) +23 More TVET College Council members were inducted within the budget.
Career Development Officers (CDOs) placed in FET colleges and trained
200 113 New CDOs placed at TVET Colleges and trained on career guidance
113 (100%) New CDOs placed and registered with Unisa
‑ ‑
HEIs supported in lecturer development programmes
15 25 HEIs supported
20 (80%) ‑5 Not all HEIs took up the offer.
NOTE: The numbers reported under “Actual Achievement” reflect the learners who were enrolled in the learning programme during the year under review. However, training may still be ongoing.
ETDP SETA Annual Report 2014/1528
3.2.5 Strategy to Overcome Areas of Under Performance
Training of Managers in Scarce and Critical Skills (SIP Projects):
A partnership was entered into with the Department of Public Service and Administration (DPSA) to co-ordinate all government departments in the training of Programme/Project managers that are managing SIP projects. The DPSA, as custodian of norms and standards for human resource development (HRD) in the public service, serves as an Intermediate Body for the Management Cluster of Occupations, which include Programme/Project Management and Quality Management. Beneficiaries have been identified from different government departments and are in the process of enrolling with HEIs.
Support for HEIs:
The ETDP SETA will forge a partnership with Higher Education South Africa (HESA) and the DHET for lecturer development programmes.
3.2.6 Changes to Planned TargetsThe TVET College managers who missed the registration deadline in 2013/14 were given an opportunity to register for the 2015 academic year. As such, an additional four managers registered.
The TVET lecturer development on scarce and critical skills programmes (SIP 14 Project) was changed during the year. The focus was shifted to the training of Programme/Project managers (SIP 14) within government departments.
3.2.7 Linking Performance with Budgets
Discretionary Budget
Sub-programme Name
2013/14 2014/15
Budget Actual Expenditure
(Over)/Under
ExpenditureCommitment Budget Actual
Expenditure
(Over)/Under
Expenditure Commitment
R’000 R’000 R’000 R’000 R’000 R’000 R’000 R’000
Lecturers trained in PIVOTAL programme 9 000 1 823 7 177 6 000 ‑ ‑ ‑ ‑
Support for programme development of Postgraduate Diploma in Vocational Education and Training of TVET lecturers ‑ ‑ ‑ ‑ 1 500 ‑ 1 500 1 500
TVET Senior Management trained in Leadership and Management (MBA/MBL/Executive Management Development Programmes) – 2nd Year 3 000 2 422 578 2 715 3 064 570 2 494 1 276
Part B: Performance Information
ETDP SETA Annual Report 2014/15 29
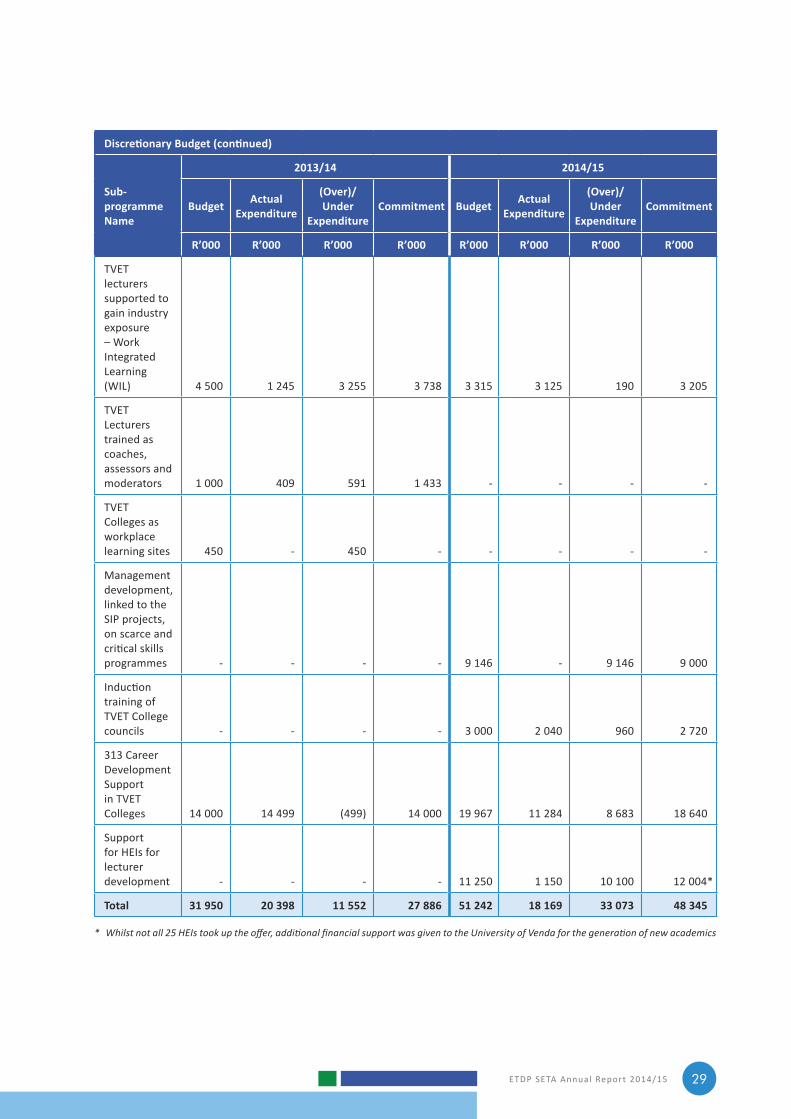
Discretionary Budget (continued)
Sub-programme Name
2013/14 2014/15
Budget Actual Expenditure
(Over)/Under
ExpenditureCommitment Budget Actual
Expenditure
(Over)/Under
Expenditure Commitment
R’000 R’000 R’000 R’000 R’000 R’000 R’000 R’000
TVET lecturers supported to gain industry exposure – Work Integrated Learning (WIL) 4 500 1 245 3 255 3 738 3 315 3 125 190 3 205
TVET Lecturers trained as coaches, assessors and moderators 1 000 409 591 1 433 ‑ ‑ ‑ ‑
TVET Colleges as workplace learning sites 450 ‑ 450 ‑ ‑ ‑ ‑ ‑
Management development, linked to the SIP projects, on scarce and critical skills programmes ‑ ‑ ‑ ‑ 9 146 ‑ 9 146 9 000
Induction training of TVET College councils ‑ ‑ ‑ ‑ 3 000 2 040 960 2 720
313 Career Development Support in TVET Colleges 14 000 14 499 (499) 14 000 19 967 11 284 8 683 18 640
Support for HEIs for lecturer development ‑ ‑ ‑ ‑ 11 250 1 150 10 100 12 004*
Total 31 950 20 398 11 552 27 886 51 242 18 169 33 073 48 345
* Whilst not all 25 HEIs took up the offer, additional financial support was given to the University of Venda for the generation of new academics
ETDP SETA Annual Report 2014/1530
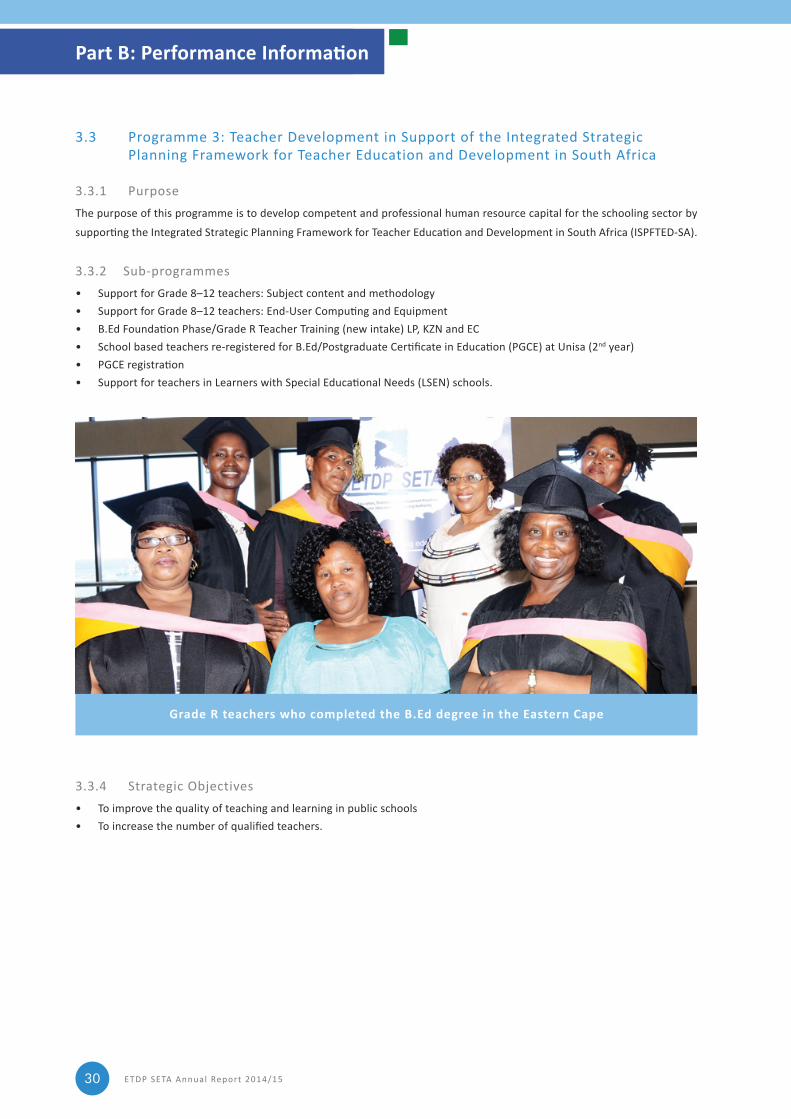
3.3 Programme 3: Teacher Development in Support of the Integrated Strategic Planning Framework for Teacher Education and Development in South Africa
3.3.1 PurposeThe purpose of this programme is to develop competent and professional human resource capital for the schooling sector by
supporting the Integrated Strategic Planning Framework for Teacher Education and Development in South Africa (ISPFTED-SA).
3.3.2 Sub‑programmes• Support for Grade 8–12 teachers: Subject content and methodology • Support for Grade 8–12 teachers: End-User Computing and Equipment • B.Ed Foundation Phase/Grade R Teacher Training (new intake) LP, KZN and EC• School based teachers re-registered for B.Ed/Postgraduate Certificate in Education (PGCE) at Unisa (2nd year)• PGCE registration• Support for teachers in Learners with Special Educational Needs (LSEN) schools.
3.3.4 Strategic Objectives• To improve the quality of teaching and learning in public schools • To increase the number of qualified teachers.
Grade R teachers who completed the B.Ed degree in the Eastern Cape
Part B: Performance Information
ETDP SETA Annual Report 2014/15 31
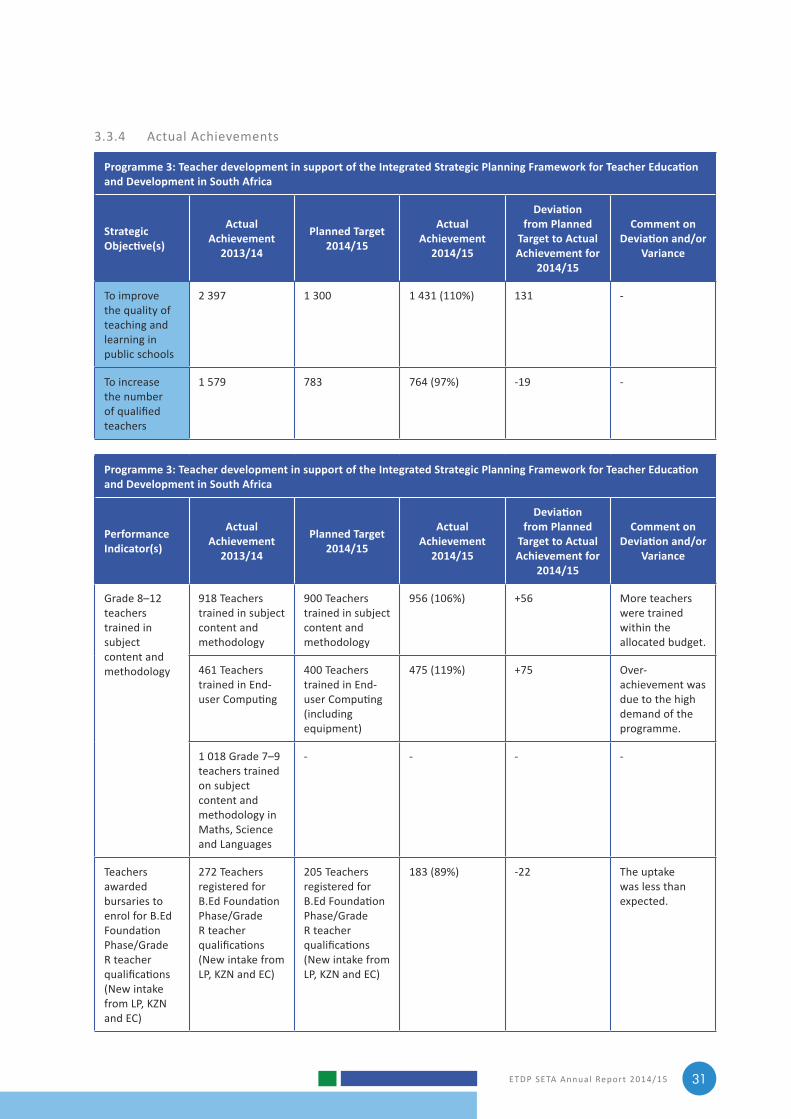
3.3.4 Actual Achievements
Programme 3: Teacher development in support of the Integrated Strategic Planning Framework for Teacher Education and Development in South Africa
Strategic Objective(s)
Actual Achievement
2013/14
Planned Target2014/15
Actual Achievement
2014/15
Deviation from Planned
Target to Actual Achievement for
2014/15
Comment on Deviation and/or
Variance
To improve the quality of teaching and learning in public schools
2 397 1 300 1 431 (110%) 131 ‑
To increase the number of qualified teachers
1 579 783 764 (97%) ‑19 ‑
Programme 3: Teacher development in support of the Integrated Strategic Planning Framework for Teacher Education and Development in South Africa
Performance Indicator(s)
Actual Achievement
2013/14
Planned Target2014/15
Actual Achievement
2014/15
Deviation from Planned
Target to Actual Achievement for
2014/15
Comment on Deviation and/or
Variance
Grade 8–12 teachers trained in subject content and methodology
918 Teachers trained in subject content and methodology
900 Teachers trained in subject content and methodology
956 (106%) +56 More teachers were trained within the allocated budget.
461 Teachers trained in End‑ user Computing
400 Teachers trained in End‑ user Computing (including equipment)
475 (119%) +75 Over‑achievement was due to the high demand of the programme.
1 018 Grade 7–9 teachers trained on subject content and methodology in Maths, Science and Languages
‑ ‑ ‑ ‑
Teachers awarded bursaries to enrol for B.Ed Foundation Phase/Grade R teacher qualifications (New intake from LP, KZN and EC)
272 Teachers registered for B.Ed Foundation Phase/Grade R teacher qualifications (New intake from LP, KZN and EC)
205 Teachers registered for B.Ed Foundation Phase/Grade R teacher qualifications (New intake from LP, KZN and EC)
183 (89%) ‑22 The uptake was less than expected.
ETDP SETA Annual Report 2014/1532
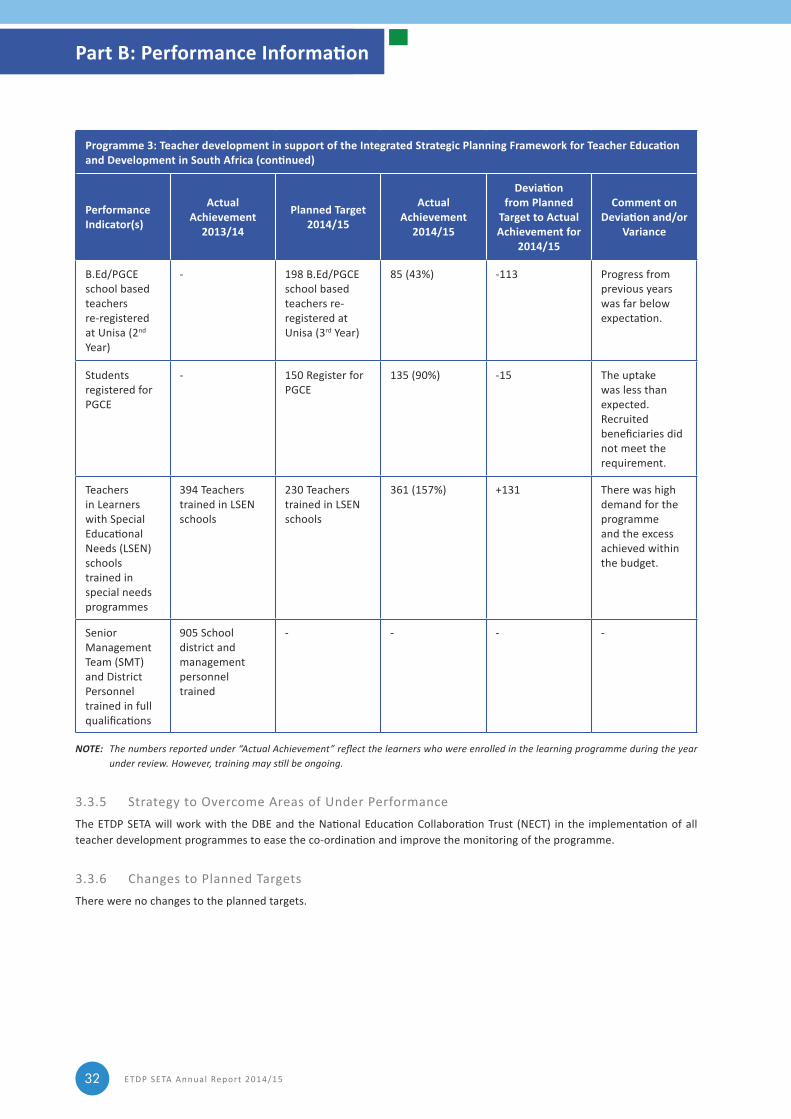
Programme 3: Teacher development in support of the Integrated Strategic Planning Framework for Teacher Education and Development in South Africa (continued)
Performance Indicator(s)
Actual Achievement
2013/14
Planned Target2014/15
Actual Achievement
2014/15
Deviation from Planned
Target to Actual Achievement for
2014/15
Comment on Deviation and/or
Variance
B.Ed/PGCE school based teachers re‑registered at Unisa (2nd Year)
‑ 198 B.Ed/PGCE school based teachers re‑registered at Unisa (3rd Year)
85 (43%) ‑113 Progress from previous years was far below expectation.
Students registered for PGCE
‑ 150 Register for PGCE
135 (90%) ‑15 The uptake was less than expected. Recruited beneficiaries did not meet the requirement.
Teachers in Learners with Special Educational Needs (LSEN) schools trained in special needs programmes
394 Teachers trained in LSEN schools
230 Teachers trained in LSEN schools
361 (157%) +131 There was high demand for the programme and the excess achieved within the budget.
Senior Management Team (SMT) and District Personnel trained in full qualifications
905 School district and management personnel trained
‑ ‑ ‑ ‑
NOTE: The numbers reported under “Actual Achievement” reflect the learners who were enrolled in the learning programme during the year under review. However, training may still be ongoing.
3.3.5 Strategy to Overcome Areas of Under PerformanceThe ETDP SETA will work with the DBE and the National Education Collaboration Trust (NECT) in the implementation of all teacher development programmes to ease the co-ordination and improve the monitoring of the programme.
3.3.6 Changes to Planned TargetsThere were no changes to the planned targets.
Part B: Performance Information
ETDP SETA Annual Report 2014/15 33
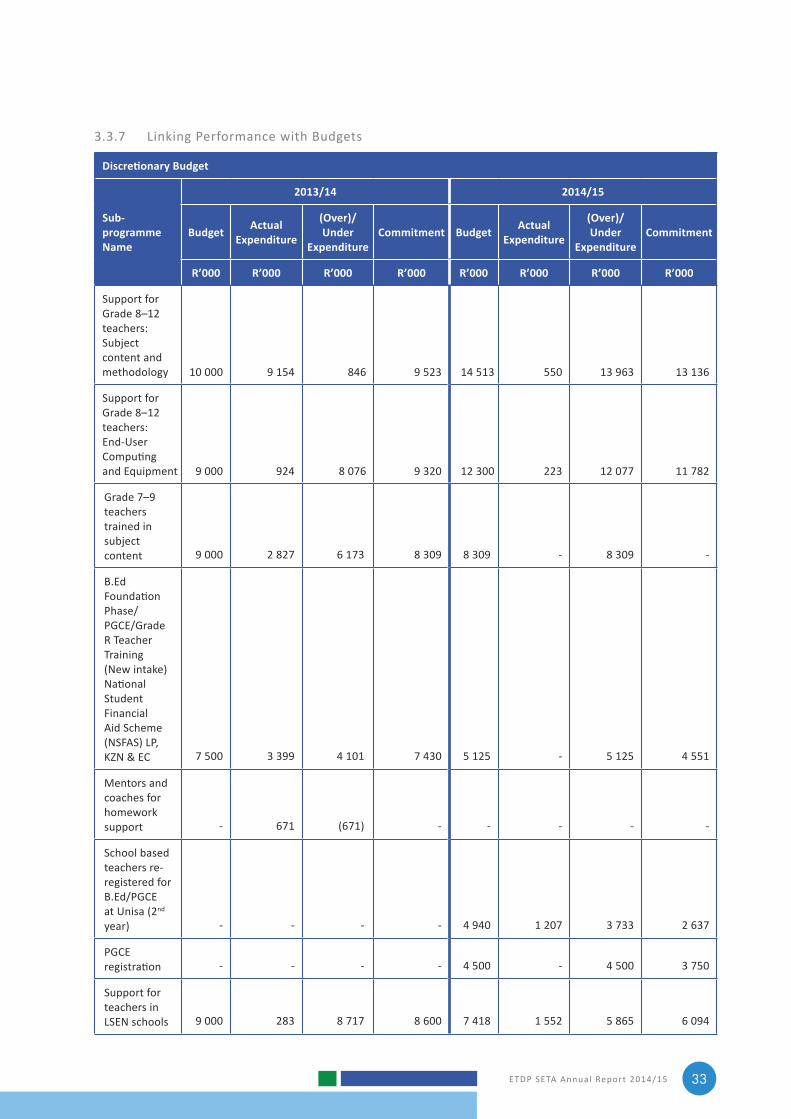
3.3.7 Linking Performance with Budgets
Discretionary Budget
Sub-programme Name
2013/14 2014/15
Budget Actual Expenditure
(Over)/Under
ExpenditureCommitment Budget Actual
Expenditure
(Over)/Under
Expenditure Commitment
R’000 R’000 R’000 R’000 R’000 R’000 R’000 R’000
Support for Grade 8–12 teachers: Subject content and methodology 10 000 9 154 846 9 523 14 513 550 13 963 13 136
Support for Grade 8–12 teachers: End-User Computing and Equipment 9 000 924 8 076 9 320 12 300 223 12 077 11 782
Grade 7–9 teachers trained in subject content 9 000 2 827 6 173 8 309 8 309 ‑ 8 309 ‑
B.Ed Foundation Phase/PGCE/Grade R Teacher Training (New intake) National Student Financial Aid Scheme (NSFAS) LP, KZN & EC 7 500 3 399 4 101 7 430 5 125 ‑ 5 125 4 551
Mentors and coaches for homework support ‑ 671 (671) ‑ ‑ ‑ ‑ ‑
School based teachers re‑registered for B.Ed/PGCE at Unisa (2nd year) ‑ ‑ ‑ ‑ 4 940 1 207 3 733 2 637
PGCE registration ‑ ‑ ‑ ‑ 4 500 ‑ 4 500 3 750
Support for teachers in LSEN schools 9 000 283 8 717 8 600 7 418 1 552 5 865 6 094
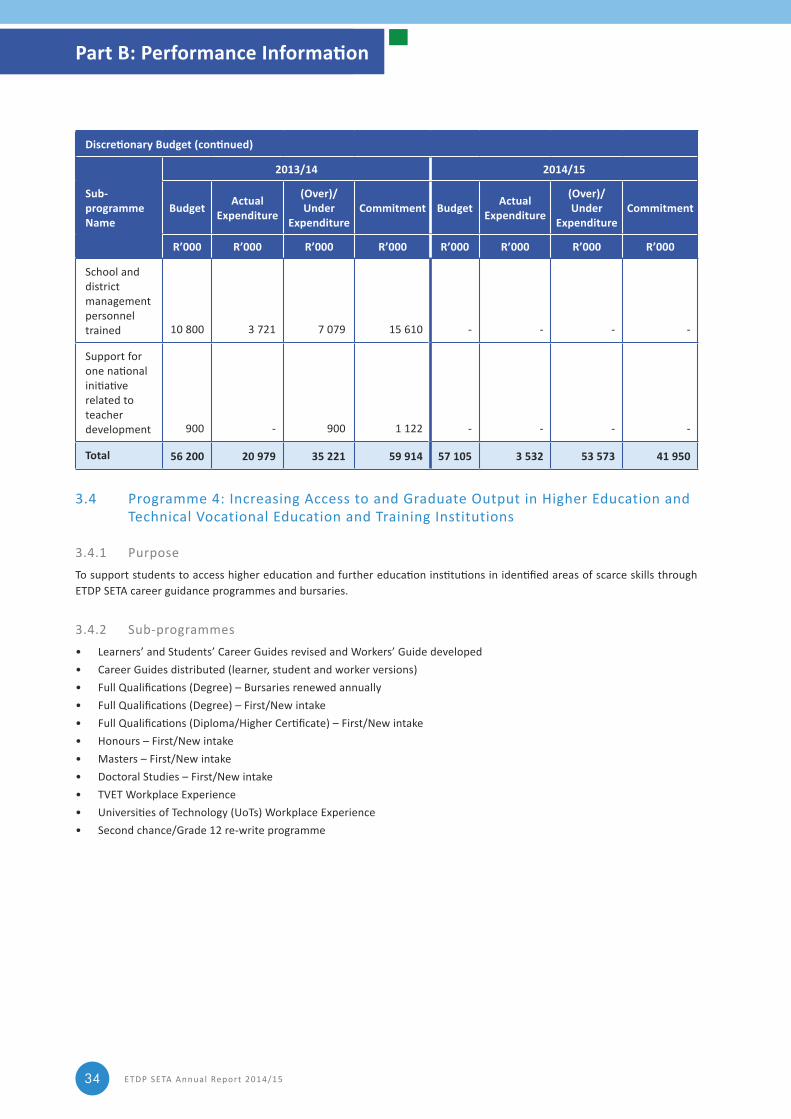
ETDP SETA Annual Report 2014/1534
Discretionary Budget (continued)
Sub-programme Name
2013/14 2014/15
Budget Actual Expenditure
(Over)/Under
ExpenditureCommitment Budget Actual
Expenditure
(Over)/Under
Expenditure Commitment
R’000 R’000 R’000 R’000 R’000 R’000 R’000 R’000
School and district management personnel trained 10 800 3 721 7 079 15 610 ‑ ‑ ‑ ‑
Support for one national initiative related to teacher development 900 ‑ 900 1 122 ‑ ‑ ‑ ‑
Total 56 200 20 979 35 221 59 914 57 105 3 532 53 573 41 950
3.4 Programme 4: Increasing Access to and Graduate Output in Higher Education and Technical Vocational Education and Training Institutions
3.4.1 PurposeTo support students to access higher education and further education institutions in identified areas of scarce skills through ETDP SETA career guidance programmes and bursaries.
3.4.2 Sub‑programmes• Learners’ and Students’ Career Guides revised and Workers’ Guide developed• Career Guides distributed (learner, student and worker versions)• Full Qualifications (Degree) – Bursaries renewed annually• Full Qualifications (Degree) – First/New intake• Full Qualifications (Diploma/Higher Certificate) – First/New intake• Honours – First/New intake • Masters – First/New intake• Doctoral Studies – First/New intake• TVET Workplace Experience• Universities of Technology (UoTs) Workplace Experience• Second chance/Grade 12 re‑write programme
Part B: Performance Information
ETDP SETA Annual Report 2014/15 35
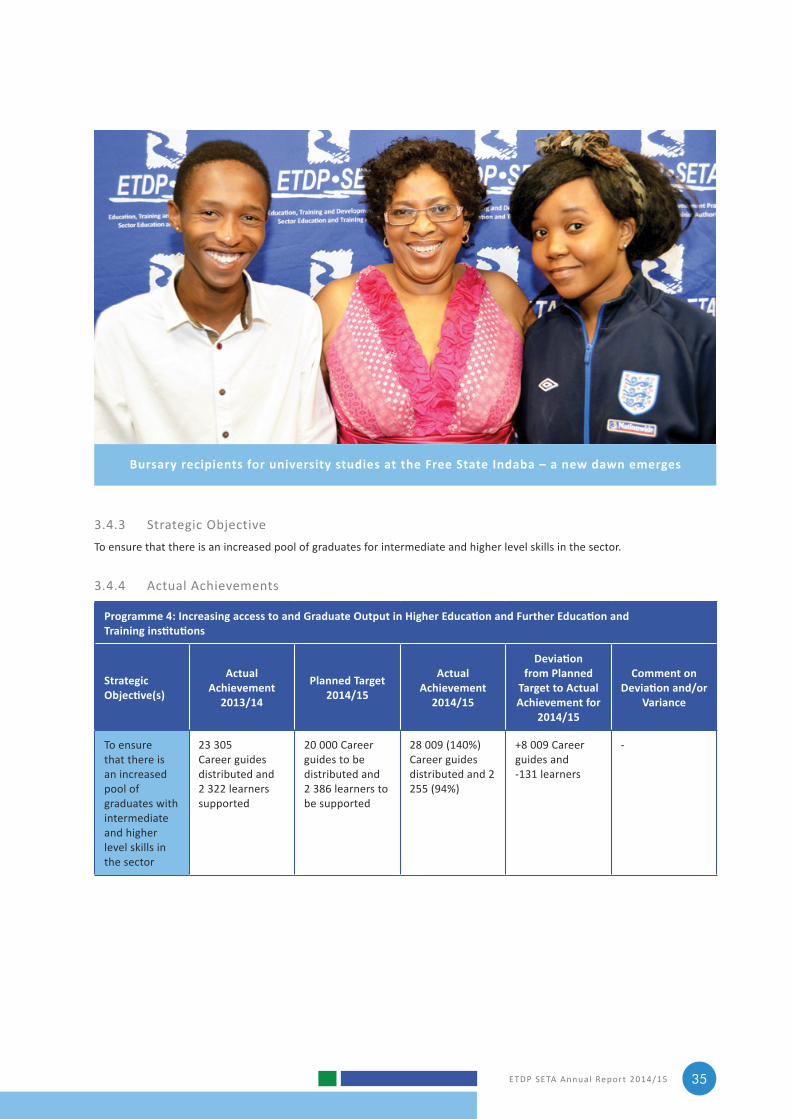
3.4.3 Strategic ObjectiveTo ensure that there is an increased pool of graduates for intermediate and higher level skills in the sector.
3.4.4 Actual Achievements
Programme 4: Increasing access to and Graduate Output in Higher Education and Further Education and Training institutions
Strategic Objective(s)
Actual Achievement
2013/14
Planned Target2014/15
Actual Achievement
2014/15
Deviation from Planned
Target to Actual Achievement for
2014/15
Comment on Deviation and/or
Variance
To ensure that there is an increased pool of graduates with intermediate and higher level skills in the sector
23 305 Career guides distributed and 2 322 learners supported
20 000 Career guides to be distributed and 2 386 learners to be supported
28 009 (140%) Career guides distributed and 2 255 (94%)
+8 009 Career guides and ‑131 learners
‑
Bursary recipients for university studies at the Free State Indaba – a new dawn emerges
ETDP SETA Annual Report 2014/1536
Programme 4: Increasing access to and Graduate Output in Higher Education and Further Education and Training institutions
Performance Indicator(s)
Actual Achievement
2013/14
Planned Target2014/15
Actual Achievement
2014/15
Deviation from Planned
Target to Actual Achievement for
2014/15
Comment on Deviation and/or
Variance
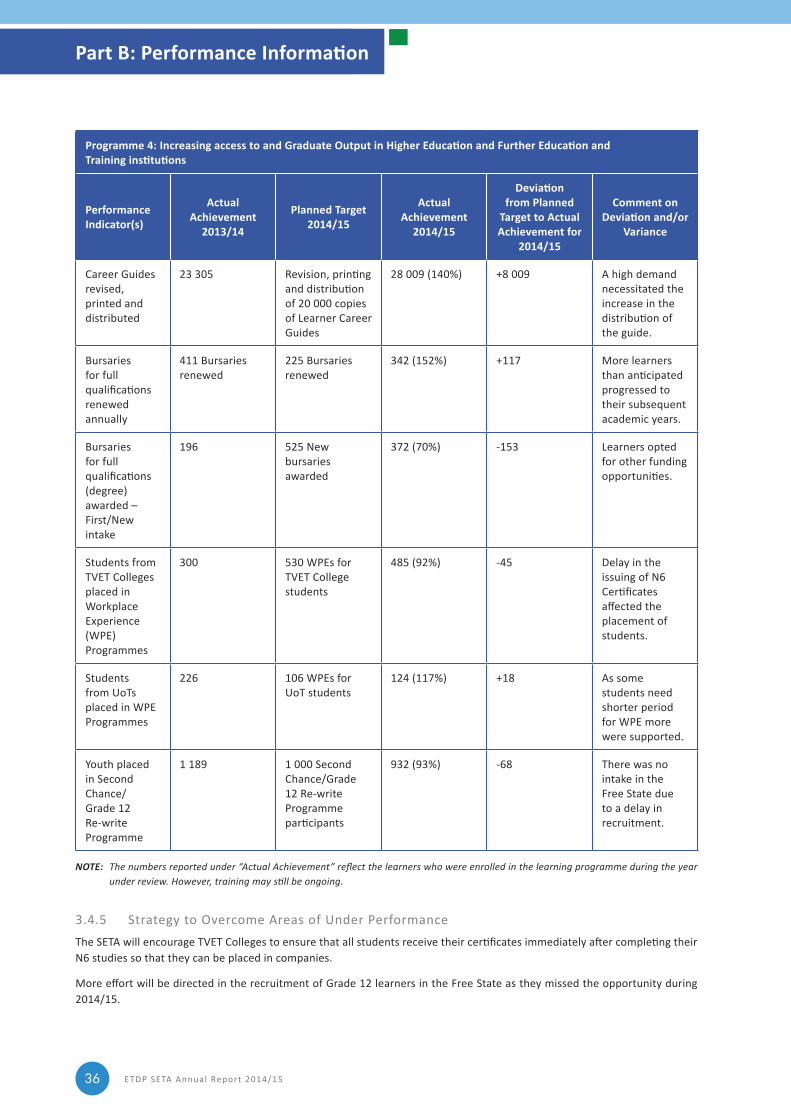
Career Guides revised, printed and distributed
23 305 Revision, printing and distribution of 20 000 copies of Learner Career Guides
28 009 (140%) +8 009 A high demand necessitated the increase in the distribution of the guide.
Bursaries for full qualifications renewed annually
411 Bursaries renewed
225 Bursaries renewed
342 (152%) +117 More learners than anticipated progressed to their subsequent academic years.
Bursaries for full qualifications (degree) awarded – First/New intake
196 525 New bursaries awarded
372 (70%) ‑153 Learners opted for other funding opportunities.
Students from TVET Colleges placed in Workplace Experience (WPE) Programmes
300 530 WPEs for TVET College students
485 (92%) ‑45 Delay in the issuing of N6 Certificates affected the placement of students.
Students from UoTs placed in WPE Programmes
226 106 WPEs for UoT students
124 (117%) +18 As some students need shorter period for WPE more were supported.
Youth placed in Second Chance/Grade 12 Re‑write Programme
1 189 1 000 Second Chance/Grade 12 Re‑write Programme participants
932 (93%) ‑68 There was no intake in the Free State due to a delay in recruitment.
NOTE: The numbers reported under “Actual Achievement” reflect the learners who were enrolled in the learning programme during the year under review. However, training may still be ongoing.
3.4.5 Strategy to Overcome Areas of Under PerformanceThe SETA will encourage TVET Colleges to ensure that all students receive their certificates immediately after completing their N6 studies so that they can be placed in companies.
More effort will be directed in the recruitment of Grade 12 learners in the Free State as they missed the opportunity during 2014/15.
Part B: Performance Information
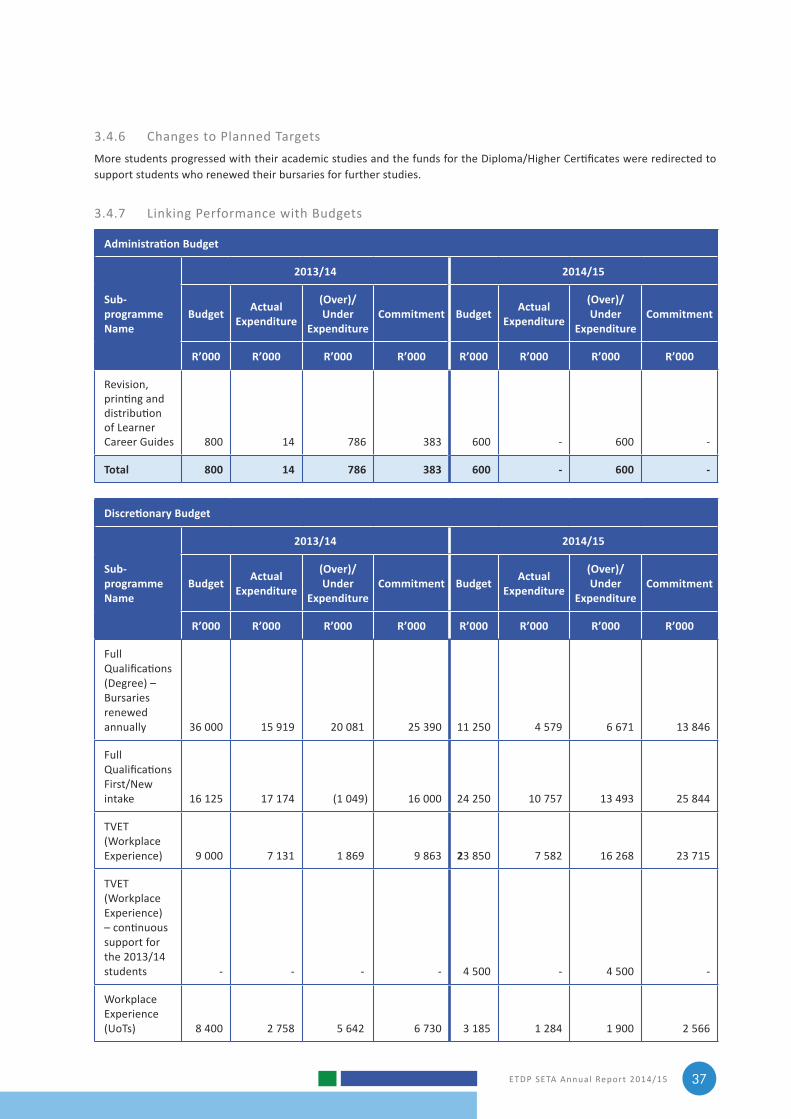
ETDP SETA Annual Report 2014/15 37
3.4.6 Changes to Planned TargetsMore students progressed with their academic studies and the funds for the Diploma/Higher Certificates were redirected to support students who renewed their bursaries for further studies.
3.4.7 Linking Performance with Budgets
Administration Budget
Sub-programme Name
2013/14 2014/15
Budget Actual Expenditure
(Over)/Under
ExpenditureCommitment Budget Actual
Expenditure
(Over)/Under
Expenditure Commitment
R’000 R’000 R’000 R’000 R’000 R’000 R’000 R’000
Revision, printing and distribution of Learner Career Guides 800 14 786 383 600 ‑ 600 ‑
Total 800 14 786 383 600 - 600 -
Discretionary Budget
Sub-programme Name
2013/14 2014/15
Budget Actual Expenditure
(Over)/Under
ExpenditureCommitment Budget Actual
Expenditure
(Over)/Under
Expenditure Commitment
R’000 R’000 R’000 R’000 R’000 R’000 R’000 R’000
Full Qualifications (Degree) – Bursaries renewed annually 36 000 15 919 20 081 25 390 11 250 4 579 6 671 13 846
Full Qualifications First/New intake 16 125 17 174 (1 049) 16 000 24 250 10 757 13 493 25 844
TVET (Workplace Experience) 9 000 7 131 1 869 9 863 23 850 7 582 16 268 23 715
TVET (Workplace Experience) – continuous support for the 2013/14 students ‑ ‑ ‑ ‑ 4 500 ‑ 4 500 ‑
Workplace Experience (UoTs) 8 400 2 758 5 642 6 730 3 185 1 284 1 900 2 566
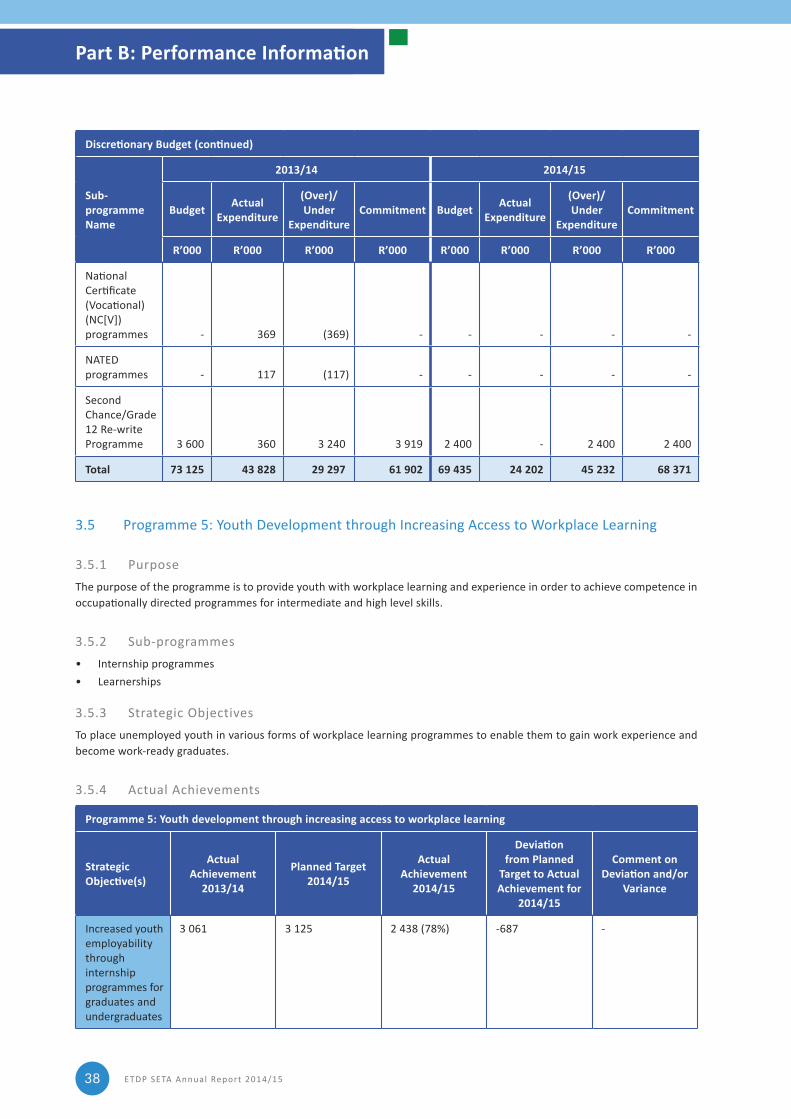
ETDP SETA Annual Report 2014/1538
Discretionary Budget (continued)
Sub-programme Name
2013/14 2014/15
Budget Actual Expenditure
(Over)/Under
ExpenditureCommitment Budget Actual
Expenditure
(Over)/Under
Expenditure Commitment
R’000 R’000 R’000 R’000 R’000 R’000 R’000 R’000
National Certificate (Vocational) (NC[V]) programmes ‑ 369 (369) ‑ ‑ ‑ ‑ ‑
NATED programmes ‑ 117 (117) ‑ ‑ ‑ ‑ ‑
Second Chance/Grade 12 Re‑write Programme 3 600 360 3 240 3 919 2 400 ‑ 2 400 2 400
Total 73 125 43 828 29 297 61 902 69 435 24 202 45 232 68 371
3.5 Programme 5: Youth Development through Increasing Access to Workplace Learning
3.5.1 PurposeThe purpose of the programme is to provide youth with workplace learning and experience in order to achieve competence in occupationally directed programmes for intermediate and high level skills.
3.5.2 Sub‑programmes• Internship programmes• Learnerships
3.5.3 Strategic ObjectivesTo place unemployed youth in various forms of workplace learning programmes to enable them to gain work experience and become work‑ready graduates.
3.5.4 Actual Achievements
Programme 5: Youth development through increasing access to workplace learning
Strategic Objective(s)
Actual Achievement
2013/14
Planned Target2014/15
Actual Achievement
2014/15
Deviation from Planned
Target to Actual Achievement for
2014/15
Comment on Deviation and/or
Variance
Increased youth employability through internship programmes for graduates and undergraduates
3 061 3 125 2 438 (78%) ‑687 ‑
Part B: Performance Information
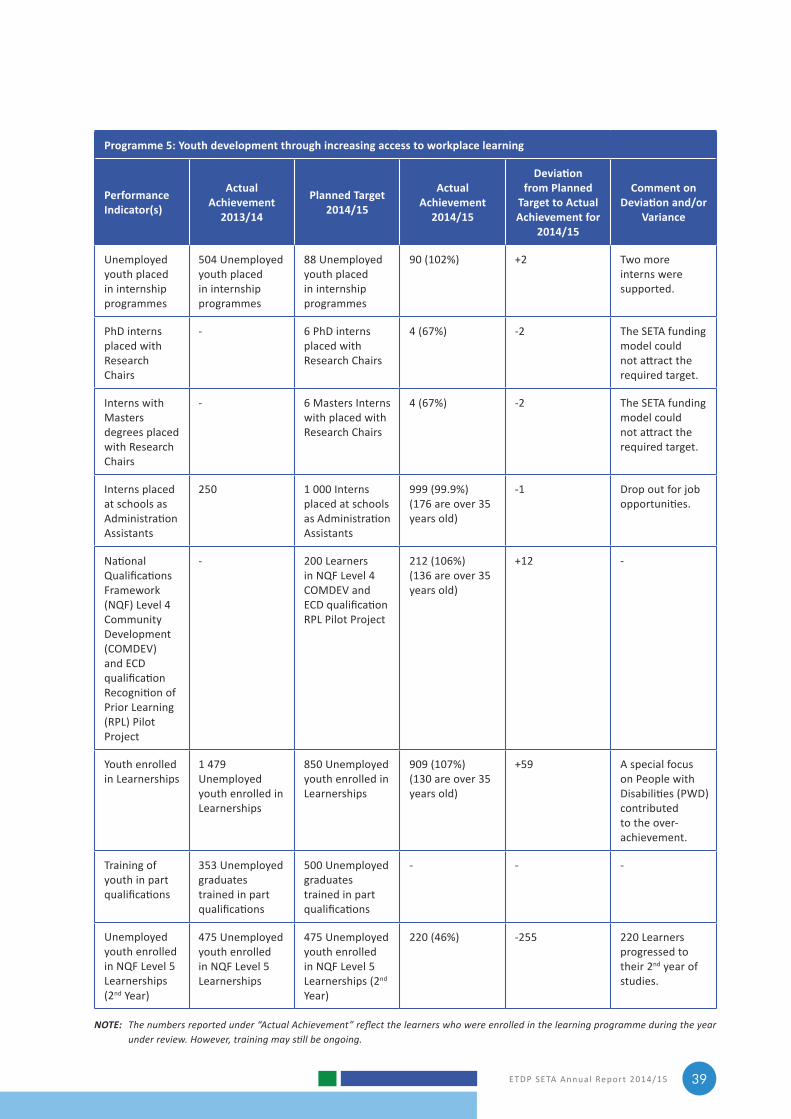
ETDP SETA Annual Report 2014/15 39
Programme 5: Youth development through increasing access to workplace learning
Performance Indicator(s)
Actual Achievement
2013/14
Planned Target2014/15
Actual Achievement
2014/15
Deviation from Planned
Target to Actual Achievement for
2014/15
Comment on Deviation and/or
Variance
Unemployed youth placed in internship programmes
504 Unemployed youth placed in internship programmes
88 Unemployed youth placed in internship programmes
90 (102%) +2 Two more interns were supported.
PhD interns placed with Research Chairs
‑ 6 PhD interns placed with Research Chairs
4 (67%) ‑2 The SETA funding model could not attract the required target.
Interns with Masters degrees placed with Research Chairs
‑ 6 Masters Interns with placed with Research Chairs
4 (67%) ‑2 The SETA funding model could not attract the required target.
Interns placed at schools as Administration Assistants
250 1 000 Interns placed at schools as Administration Assistants
999 (99.9%)(176 are over 35 years old)
‑1 Drop out for job opportunities.
National Qualifications Framework (NQF) Level 4 Community Development (COMDEV) and ECD qualification Recognition of Prior Learning (RPL) Pilot Project
‑ 200 Learners in NQF Level 4 COMDEV and ECD qualification RPL Pilot Project
212 (106%)(136 are over 35 years old)
+12 ‑
Youth enrolled in Learnerships
1 479 Unemployed youth enrolled in Learnerships
850 Unemployed youth enrolled in Learnerships
909 (107%)(130 are over 35 years old)
+59 A special focus on People with Disabilities (PWD) contributed to the over‑achievement.
Training of youth in part qualifications
353 Unemployed graduates trained in part qualifications
500 Unemployed graduates trained in part qualifications
‑ ‑ ‑
Unemployed youth enrolled in NQF Level 5 Learnerships (2nd Year)
475 Unemployed youth enrolled in NQF Level 5 Learnerships
475 Unemployed youth enrolled in NQF Level 5 Learnerships (2nd Year)
220 (46%) ‑255 220 Learners progressed to their 2nd year of studies.
NOTE: The numbers reported under “Actual Achievement” reflect the learners who were enrolled in the learning programme during the year under review. However, training may still be ongoing.
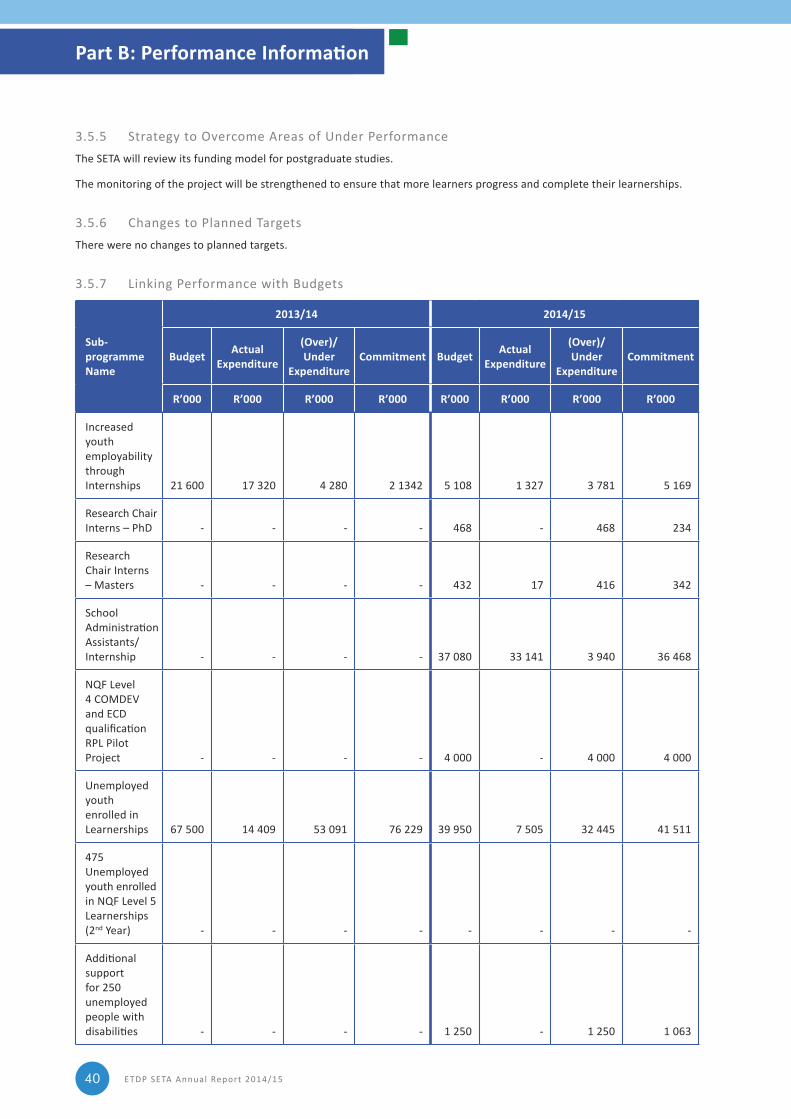
ETDP SETA Annual Report 2014/1540
3.5.5 Strategy to Overcome Areas of Under PerformanceThe SETA will review its funding model for postgraduate studies.
The monitoring of the project will be strengthened to ensure that more learners progress and complete their learnerships.
3.5.6 Changes to Planned TargetsThere were no changes to planned targets.
3.5.7 Linking Performance with Budgets
Sub-programme Name
2013/14 2014/15
Budget Actual Expenditure
(Over)/Under
ExpenditureCommitment Budget Actual
Expenditure
(Over)/Under
Expenditure Commitment
R’000 R’000 R’000 R’000 R’000 R’000 R’000 R’000
Increased youth employability through Internships 21 600 17 320 4 280 2 1342 5 108 1 327 3 781 5 169
Research Chair Interns – PhD ‑ ‑ ‑ ‑ 468 ‑ 468 234
Research Chair Interns – Masters ‑ ‑ ‑ ‑ 432 17 416 342
School Administration Assistants/Internship ‑ ‑ ‑ ‑ 37 080 33 141 3 940 36 468
NQF Level 4 COMDEV and ECD qualification RPL Pilot Project ‑ ‑ ‑ ‑ 4 000 ‑ 4 000 4 000
Unemployed youth enrolled in Learnerships 67 500 14 409 53 091 76 229 39 950 7 505 32 445 41 511
475 Unemployed youth enrolled in NQF Level 5 Learnerships (2nd Year) ‑ ‑ ‑ ‑ ‑ ‑ ‑ ‑
Additional support for 250 unemployed people with disabilities ‑ ‑ ‑ ‑ 1 250 ‑ 1 250 1 063
Part B: Performance Information
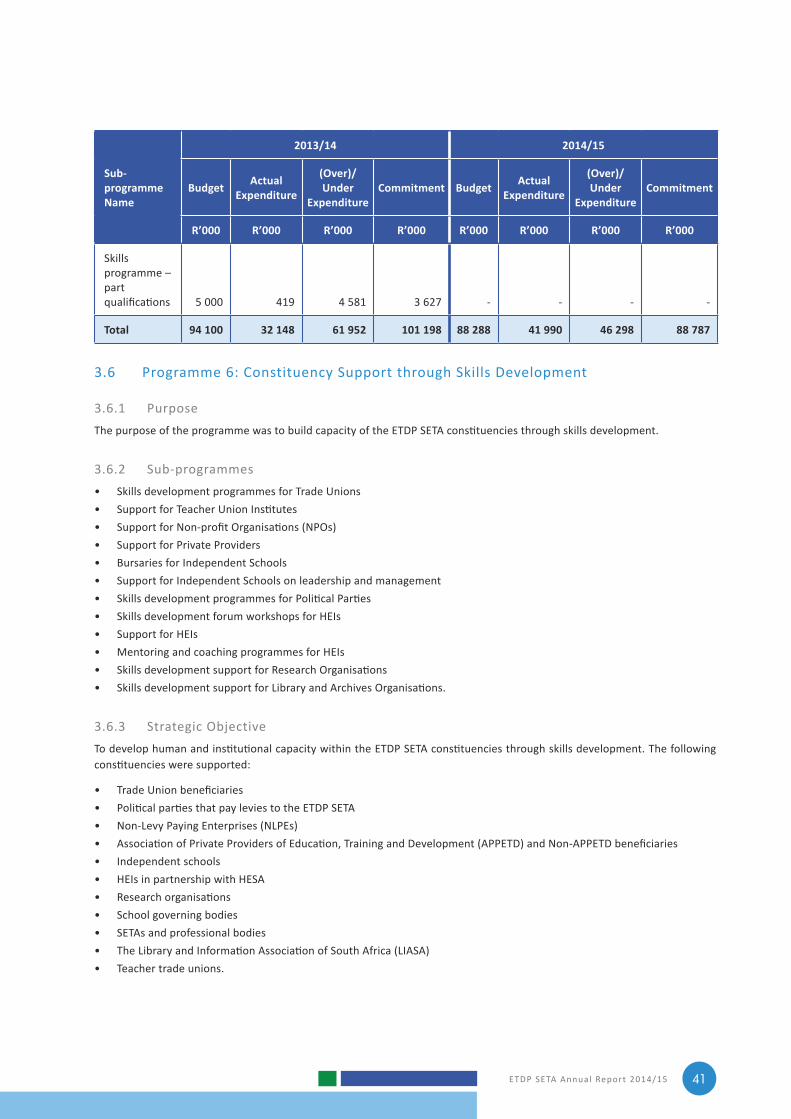
ETDP SETA Annual Report 2014/15 41
Sub-programme Name
2013/14 2014/15
Budget Actual Expenditure
(Over)/Under
ExpenditureCommitment Budget Actual
Expenditure
(Over)/Under
Expenditure Commitment
R’000 R’000 R’000 R’000 R’000 R’000 R’000 R’000
Skills programme – part qualifications 5 000 419 4 581 3 627 ‑ ‑ ‑ ‑
Total 94 100 32 148 61 952 101 198 88 288 41 990 46 298 88 787
3.6 Programme 6: Constituency Support through Skills Development
3.6.1 PurposeThe purpose of the programme was to build capacity of the ETDP SETA constituencies through skills development.
3.6.2 Sub‑programmes• Skills development programmes for Trade Unions• Support for Teacher Union Institutes• Support for Non-profit Organisations (NPOs)• Support for Private Providers• Bursaries for Independent Schools• Support for Independent Schools on leadership and management• Skills development programmes for Political Parties• Skills development forum workshops for HEIs• Support for HEIs• Mentoring and coaching programmes for HEIs• Skills development support for Research Organisations• Skills development support for Library and Archives Organisations.
3.6.3 Strategic ObjectiveTo develop human and institutional capacity within the ETDP SETA constituencies through skills development. The following constituencies were supported:
• Trade Union beneficiaries• Political parties that pay levies to the ETDP SETA• Non-Levy Paying Enterprises (NLPEs)• Association of Private Providers of Education, Training and Development (APPETD) and Non-APPETD beneficiaries• Independent schools • HEIs in partnership with HESA• Research organisations• School governing bodies• SETAs and professional bodies• The Library and Information Association of South Africa (LIASA)• Teacher trade unions.
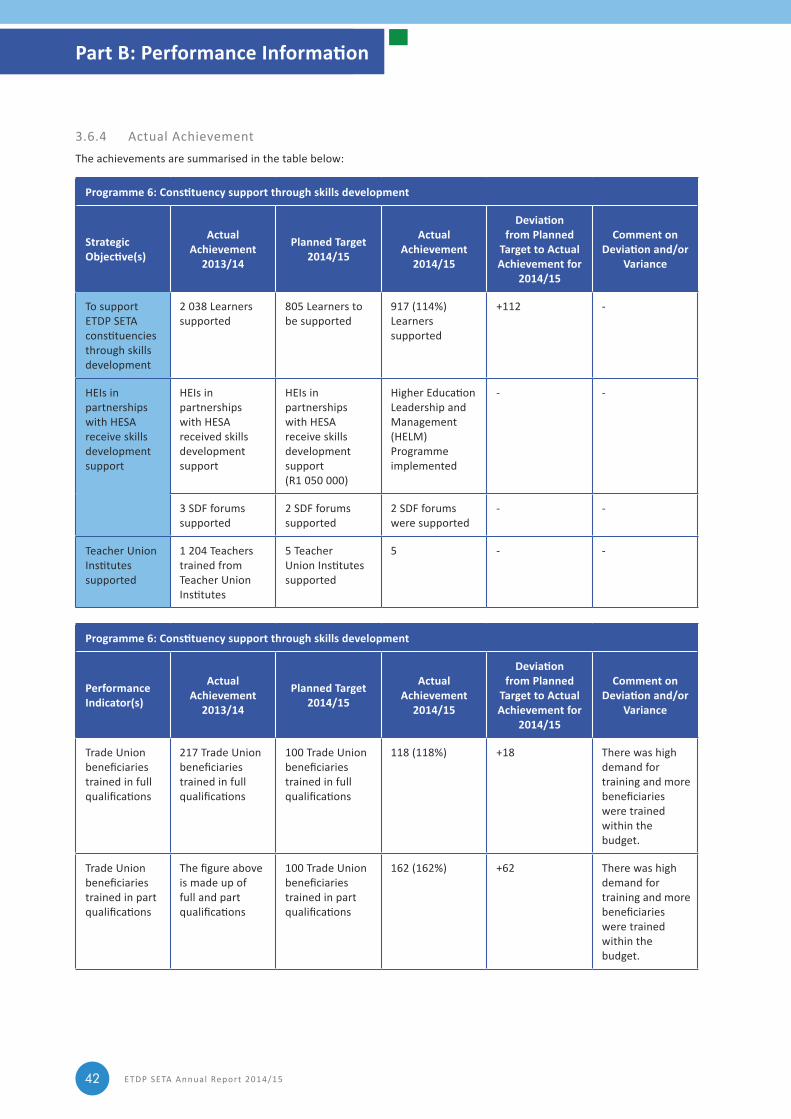
ETDP SETA Annual Report 2014/1542
3.6.4 Actual AchievementThe achievements are summarised in the table below:
Programme 6: Constituency support through skills development
Strategic Objective(s)
Actual Achievement
2013/14
Planned Target2014/15
Actual Achievement
2014/15
Deviation from Planned
Target to Actual Achievement for
2014/15
Comment on Deviation and/or
Variance
To support ETDP SETA constituencies through skills development
2 038 Learners supported
805 Learners to be supported
917 (114%) Learners supported
+112 ‑
HEIs in partnerships with HESA receive skills development support
HEIs in partnerships with HESA received skills development support
HEIs in partnerships with HESA receive skills development support (R1 050 000)
Higher Education Leadership and Management (HELM) Programme implemented
‑ ‑
3 SDF forums supported
2 SDF forums supported
2 SDF forums were supported
‑ ‑
Teacher Union Institutes supported
1 204 Teachers trained from Teacher Union Institutes
5 Teacher Union Institutes supported
5 ‑ ‑
Programme 6: Constituency support through skills development
Performance Indicator(s)
Actual Achievement
2013/14
Planned Target2014/15
Actual Achievement
2014/15
Deviation from Planned
Target to Actual Achievement for
2014/15
Comment on Deviation and/or
Variance
Trade Union beneficiaries trained in full qualifications
217 Trade Union beneficiaries trained in full qualifications
100 Trade Union beneficiaries trained in full qualifications
118 (118%) +18 There was high demand for training and more beneficiaries were trained within the budget.
Trade Union beneficiaries trained in part qualifications
The figure above is made up of full and part qualifications
100 Trade Union beneficiaries trained in part qualifications
162 (162%) +62 There was high demand for training and more beneficiaries were trained within the budget.
Part B: Performance Information
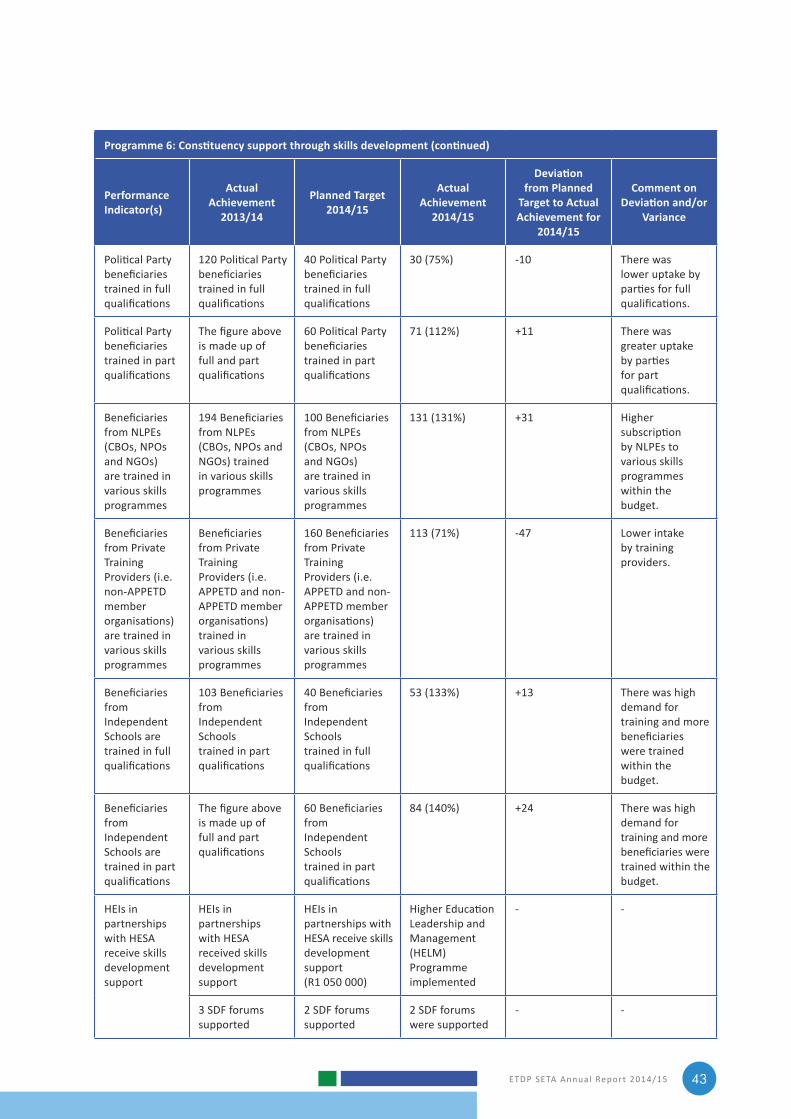
ETDP SETA Annual Report 2014/15 43
Programme 6: Constituency support through skills development (continued)
Performance Indicator(s)
Actual Achievement
2013/14
Planned Target2014/15
Actual Achievement
2014/15
Deviation from Planned
Target to Actual Achievement for
2014/15
Comment on Deviation and/or
Variance
Political Party beneficiaries trained in full qualifications
120 Political Party beneficiaries trained in full qualifications
40 Political Party beneficiaries trained in full qualifications
30 (75%) ‑10 There was lower uptake by parties for full qualifications.
Political Party beneficiaries trained in part qualifications
The figure above is made up of full and part qualifications
60 Political Party beneficiaries trained in part qualifications
71 (112%) +11 There was greater uptake by parties for part qualifications.
Beneficiaries from NLPEs (CBOs, NPOs and NGOs) are trained in various skills programmes
194 Beneficiaries from NLPEs (CBOs, NPOs and NGOs) trained in various skills programmes
100 Beneficiaries from NLPEs (CBOs, NPOs and NGOs) are trained in various skills programmes
131 (131%) +31 Higher subscription by NLPEs to various skills programmes within the budget.
Beneficiaries from Private Training Providers (i.e. non‑APPETD member organisations) are trained in various skills programmes
Beneficiaries from Private Training Providers (i.e. APPETD and non‑APPETD member organisations) trained in various skills programmes
160 Beneficiaries from Private Training Providers (i.e. APPETD and non‑APPETD member organisations) are trained in various skills programmes
113 (71%) ‑47 Lower intake by training providers.
Beneficiaries from Independent Schools are trained in full qualifications
103 Beneficiaries from Independent Schools trained in part qualifications
40 Beneficiaries from Independent Schools trained in full qualifications
53 (133%) +13 There was high demand for training and more beneficiaries were trained within the budget.
Beneficiaries from Independent Schools are trained in part qualifications
The figure above is made up of full and part qualifications
60 Beneficiaries from Independent Schools trained in part qualifications
84 (140%) +24 There was high demand for training and more beneficiaries were trained within the budget.
HEIs in partnerships with HESA receive skills development support
HEIs in partnerships with HESA received skills development support
HEIs in partnerships with HESA receive skills development support (R1 050 000)
Higher Education Leadership and Management (HELM) Programme implemented
‑ ‑
3 SDF forums supported
2 SDF forums supported
2 SDF forums were supported
‑ ‑
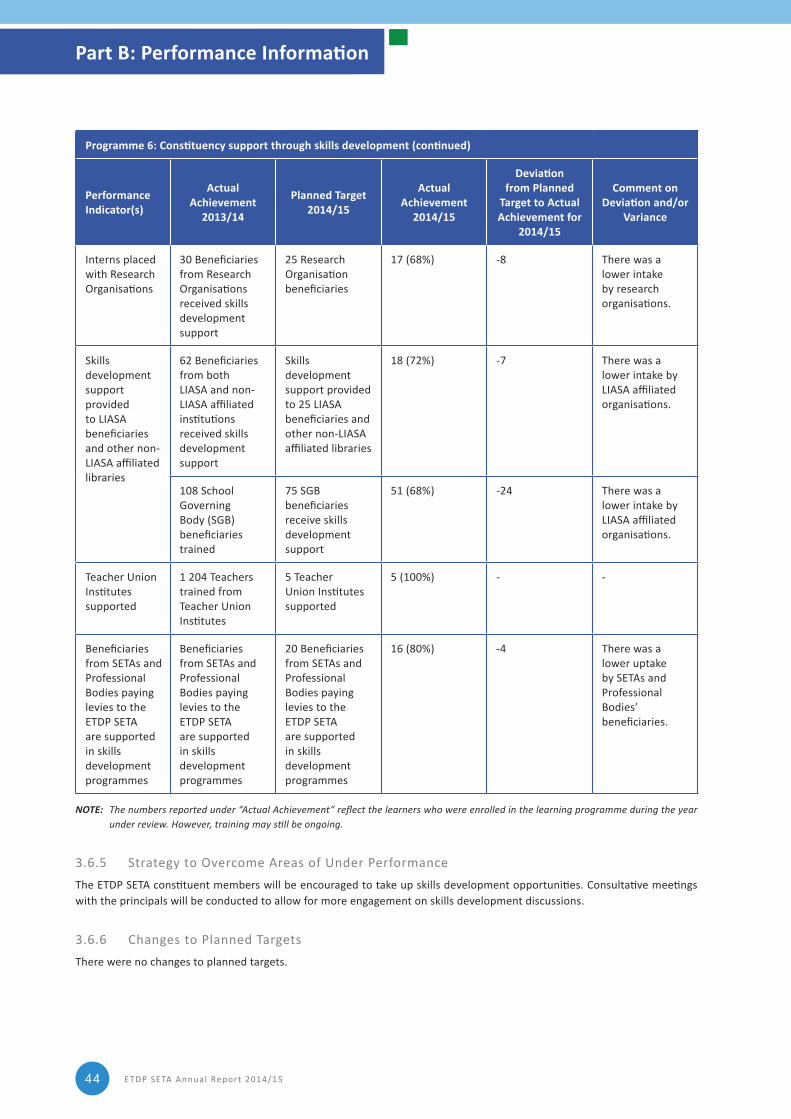
ETDP SETA Annual Report 2014/1544
Programme 6: Constituency support through skills development (continued)
Performance Indicator(s)
Actual Achievement
2013/14
Planned Target2014/15
Actual Achievement
2014/15
Deviation from Planned
Target to Actual Achievement for
2014/15
Comment on Deviation and/or
Variance
Interns placed with Research Organisations
30 Beneficiaries from Research Organisations received skills development support
25 Research Organisation beneficiaries
17 (68%) ‑8 There was a lower intake by research organisations.
Skills development support provided to LIASA beneficiaries and other non‑LIASA affiliated libraries
62 Beneficiaries from both LIASA and non‑LIASA affiliated institutions received skills development support
Skills development support provided to 25 LIASA beneficiaries and other non‑LIASA affiliated libraries
18 (72%) ‑7 There was a lower intake by LIASA affiliated organisations.
108 School Governing Body (SGB) beneficiaries trained
75 SGB beneficiaries receive skills development support
51 (68%) ‑24 There was a lower intake by LIASA affiliated organisations.
Teacher Union Institutes supported
1 204 Teachers trained from Teacher Union Institutes
5 Teacher Union Institutes supported
5 (100%) ‑ ‑
Beneficiaries from SETAs and Professional Bodies paying levies to the ETDP SETA are supported in skills development programmes
Beneficiaries from SETAs and Professional Bodies paying levies to the ETDP SETA are supported in skills development programmes
20 Beneficiaries from SETAs and Professional Bodies paying levies to the ETDP SETA are supported in skills development programmes
16 (80%) ‑4 There was a lower uptake by SETAs and Professional Bodies’ beneficiaries.
NOTE: The numbers reported under “Actual Achievement” reflect the learners who were enrolled in the learning programme during the year under review. However, training may still be ongoing.
3.6.5 Strategy to Overcome Areas of Under PerformanceThe ETDP SETA constituent members will be encouraged to take up skills development opportunities. Consultative meetings with the principals will be conducted to allow for more engagement on skills development discussions.
3.6.6 Changes to Planned TargetsThere were no changes to planned targets.
Part B: Performance Information
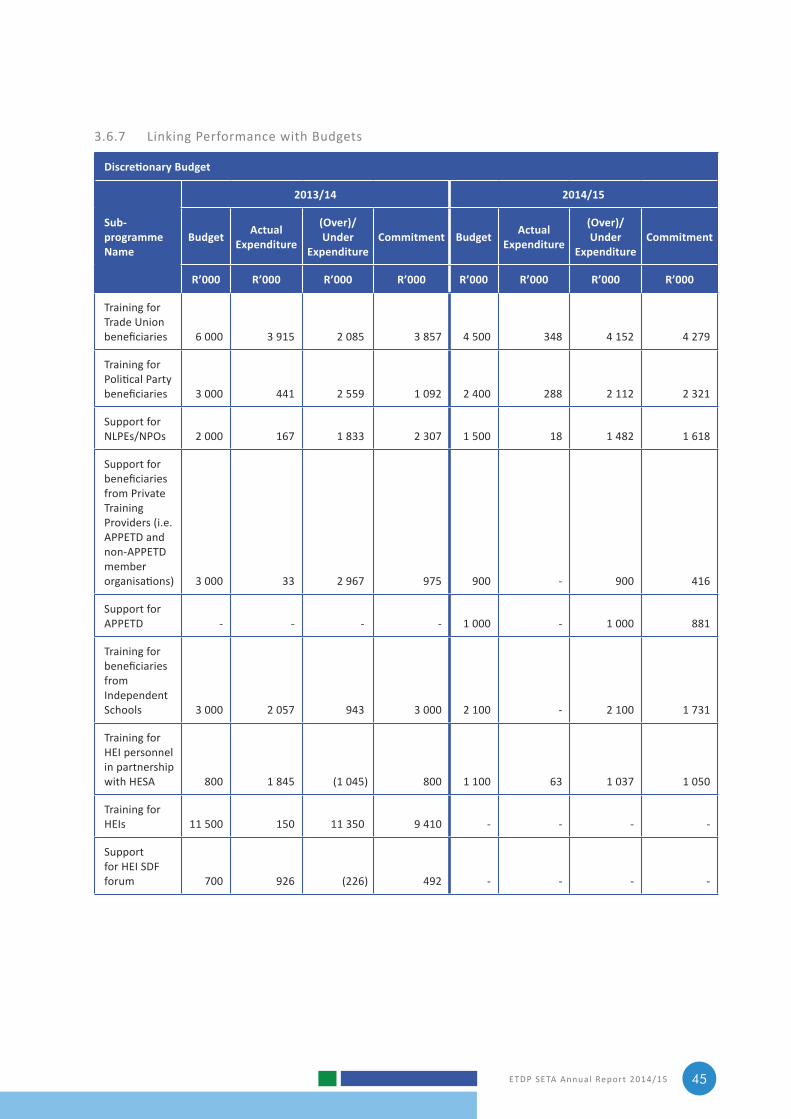
ETDP SETA Annual Report 2014/15 45
3.6.7 Linking Performance with Budgets
Discretionary Budget
Sub-programme Name
2013/14 2014/15
Budget Actual Expenditure
(Over)/Under
ExpenditureCommitment Budget Actual
Expenditure
(Over)/Under
Expenditure Commitment
R’000 R’000 R’000 R’000 R’000 R’000 R’000 R’000
Training for Trade Union beneficiaries 6 000 3 915 2 085 3 857 4 500 348 4 152 4 279
Training for Political Party beneficiaries 3 000 441 2 559 1 092 2 400 288 2 112 2 321
Support for NLPEs/NPOs 2 000 167 1 833 2 307 1 500 18 1 482 1 618
Support for beneficiaries from Private Training Providers (i.e. APPETD and non‑APPETD member organisations) 3 000 33 2 967 975 900 ‑ 900 416
Support for APPETD ‑ ‑ ‑ ‑ 1 000 ‑ 1 000 881
Training for beneficiaries from Independent Schools 3 000 2 057 943 3 000 2 100 ‑ 2 100 1 731
Training for HEI personnel in partnership with HESA 800 1 845 (1 045) 800 1 100 63 1 037 1 050
Training for HEIs 11 500 150 11 350 9 410 ‑ ‑ ‑ ‑
Support for HEI SDF forum 700 926 (226) 492 ‑ ‑ ‑ ‑
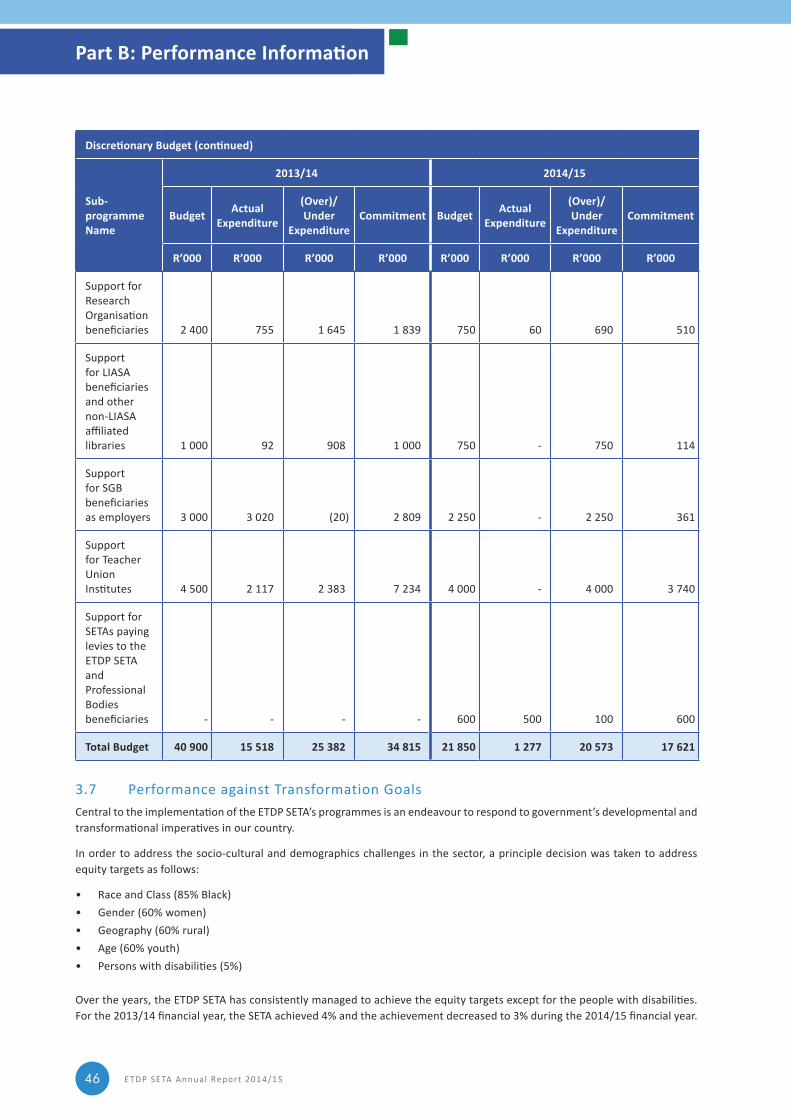
ETDP SETA Annual Report 2014/1546
Discretionary Budget (continued)
Sub-programme Name
2013/14 2014/15
Budget Actual Expenditure
(Over)/Under
ExpenditureCommitment Budget Actual
Expenditure
(Over)/Under
Expenditure Commitment
R’000 R’000 R’000 R’000 R’000 R’000 R’000 R’000
Support for Research Organisation beneficiaries 2 400 755 1 645 1 839 750 60 690 510
Support for LIASA beneficiaries and other non‑LIASA affiliated libraries 1 000 92 908 1 000 750 ‑ 750 114
Support for SGB beneficiaries as employers 3 000 3 020 (20) 2 809 2 250 ‑ 2 250 361
Support for Teacher Union Institutes 4 500 2 117 2 383 7 234 4 000 ‑ 4 000 3 740
Support for SETAs paying levies to the ETDP SETA and Professional Bodies beneficiaries ‑ ‑ ‑ ‑ 600 500 100 600
Total Budget 40 900 15 518 25 382 34 815 21 850 1 277 20 573 17 621
3.7 Performance against Transformation GoalsCentral to the implementation of the ETDP SETA’s programmes is an endeavour to respond to government’s developmental and transformational imperatives in our country.
In order to address the socio‑cultural and demographics challenges in the sector, a principle decision was taken to address equity targets as follows:
• Race and Class (85% Black)• Gender (60% women)• Geography (60% rural)• Age (60% youth)• Persons with disabilities (5%)
Over the years, the ETDP SETA has consistently managed to achieve the equity targets except for the people with disabilities. For the 2013/14 financial year, the SETA achieved 4% and the achievement decreased to 3% during the 2014/15 financial year.
Part B: Performance Information
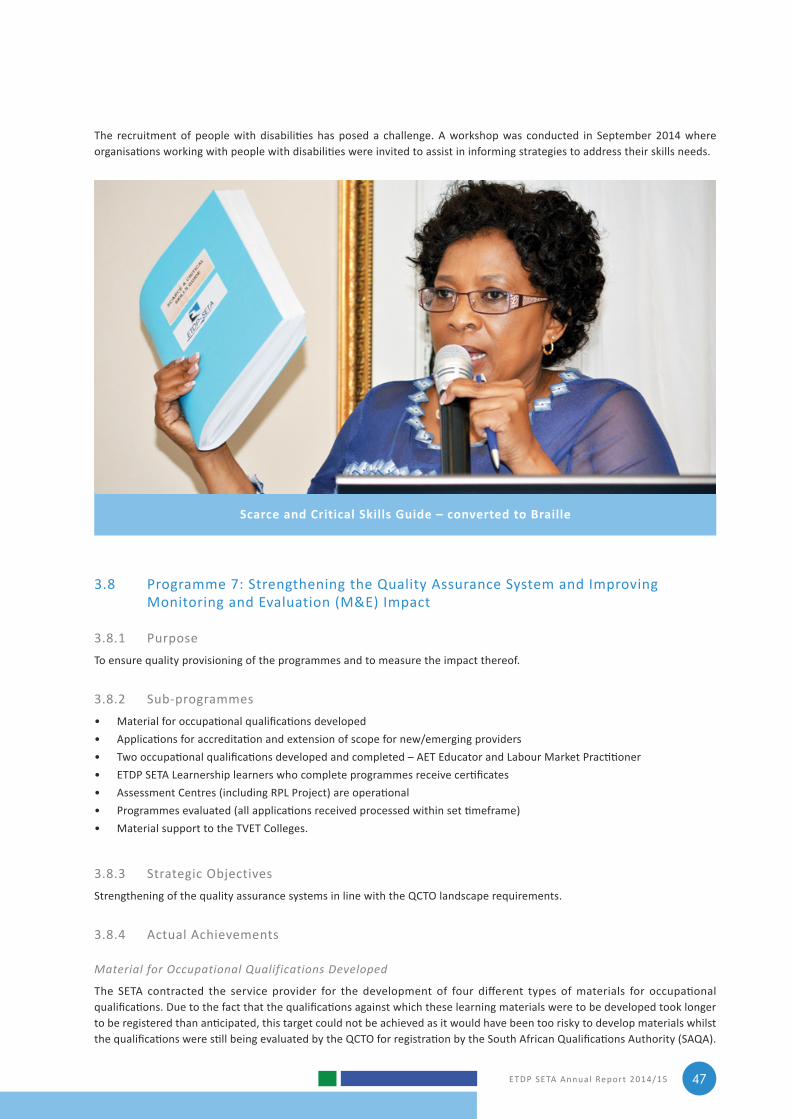
ETDP SETA Annual Report 2014/15 47
The recruitment of people with disabilities has posed a challenge. A workshop was conducted in September 2014 where organisations working with people with disabilities were invited to assist in informing strategies to address their skills needs.
3.8 Programme 7: Strengthening the Quality Assurance System and Improving Monitoring and Evaluation (M&E) Impact
3.8.1 PurposeTo ensure quality provisioning of the programmes and to measure the impact thereof.
3.8.2 Sub‑programmes• Material for occupational qualifications developed• Applications for accreditation and extension of scope for new/emerging providers• Two occupational qualifications developed and completed – AET Educator and Labour Market Practitioner• ETDP SETA Learnership learners who complete programmes receive certificates• Assessment Centres (including RPL Project) are operational• Programmes evaluated (all applications received processed within set timeframe)• Material support to the TVET Colleges.
3.8.3 Strategic ObjectivesStrengthening of the quality assurance systems in line with the QCTO landscape requirements.
3.8.4 Actual Achievements
Material for Occupational Qualifications Developed
The SETA contracted the service provider for the development of four different types of materials for occupational qualifications. Due to the fact that the qualifications against which these learning materials were to be developed took longer to be registered than anticipated, this target could not be achieved as it would have been too risky to develop materials whilst the qualifications were still being evaluated by the QCTO for registration by the South African Qualifications Authority (SAQA).
Scarce and Critical Skills Guide – converted to Braille
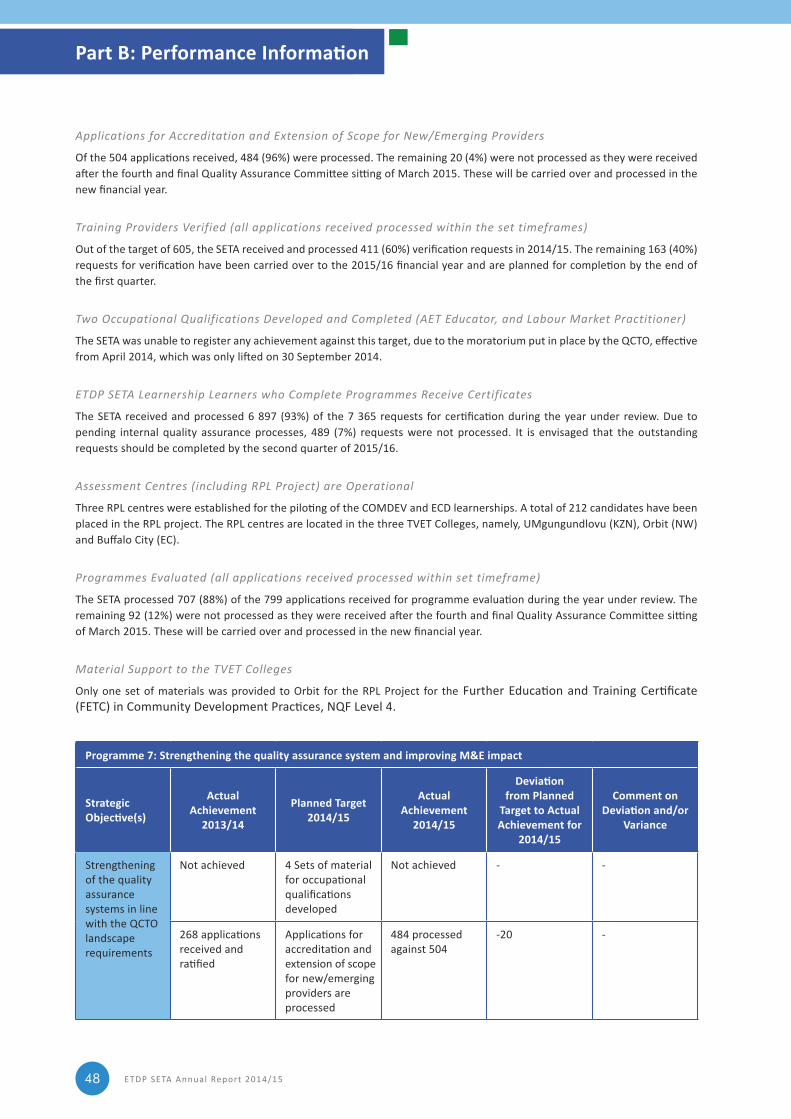
ETDP SETA Annual Report 2014/1548
Applications for Accreditation and Extension of Scope for New/Emerging Providers
Of the 504 applications received, 484 (96%) were processed. The remaining 20 (4%) were not processed as they were received after the fourth and final Quality Assurance Committee sitting of March 2015. These will be carried over and processed in the new financial year.
Training Providers Verified (all applications received processed within the set timeframes)
Out of the target of 605, the SETA received and processed 411 (60%) verification requests in 2014/15. The remaining 163 (40%) requests for verification have been carried over to the 2015/16 financial year and are planned for completion by the end of the first quarter.
Two Occupational Qualifications Developed and Completed (AET Educator, and Labour Market Practitioner)
The SETA was unable to register any achievement against this target, due to the moratorium put in place by the QCTO, effective from April 2014, which was only lifted on 30 September 2014.
ETDP SETA Learnership Learners who Complete Programmes Receive Certificates
The SETA received and processed 6 897 (93%) of the 7 365 requests for certification during the year under review. Due to pending internal quality assurance processes, 489 (7%) requests were not processed. It is envisaged that the outstanding requests should be completed by the second quarter of 2015/16.
Assessment Centres (including RPL Project) are Operational
Three RPL centres were established for the piloting of the COMDEV and ECD learnerships. A total of 212 candidates have been placed in the RPL project. The RPL centres are located in the three TVET Colleges, namely, UMgungundlovu (KZN), Orbit (NW) and Buffalo City (EC).
Programmes Evaluated (all applications received processed within set timeframe)
The SETA processed 707 (88%) of the 799 applications received for programme evaluation during the year under review. The remaining 92 (12%) were not processed as they were received after the fourth and final Quality Assurance Committee sitting of March 2015. These will be carried over and processed in the new financial year.
Material Support to the TVET Colleges
Only one set of materials was provided to Orbit for the RPL Project for the Further Education and Training Certificate (FETC) in Community Development Practices, NQF Level 4.
Programme 7: Strengthening the quality assurance system and improving M&E impact
Strategic Objective(s)
Actual Achievement
2013/14
Planned Target2014/15
Actual Achievement
2014/15
Deviation from Planned
Target to Actual Achievement for
2014/15
Comment on Deviation and/or
Variance
Strengthening of the quality assurance systems in line with the QCTO landscape requirements
Not achieved 4 Sets of material for occupational qualifications developed
Not achieved ‑ ‑
268 applications received and ratified
Applications for accreditation and extension of scope for new/emerging providers are processed
484 processed against 504
‑20 ‑
Part B: Performance Information
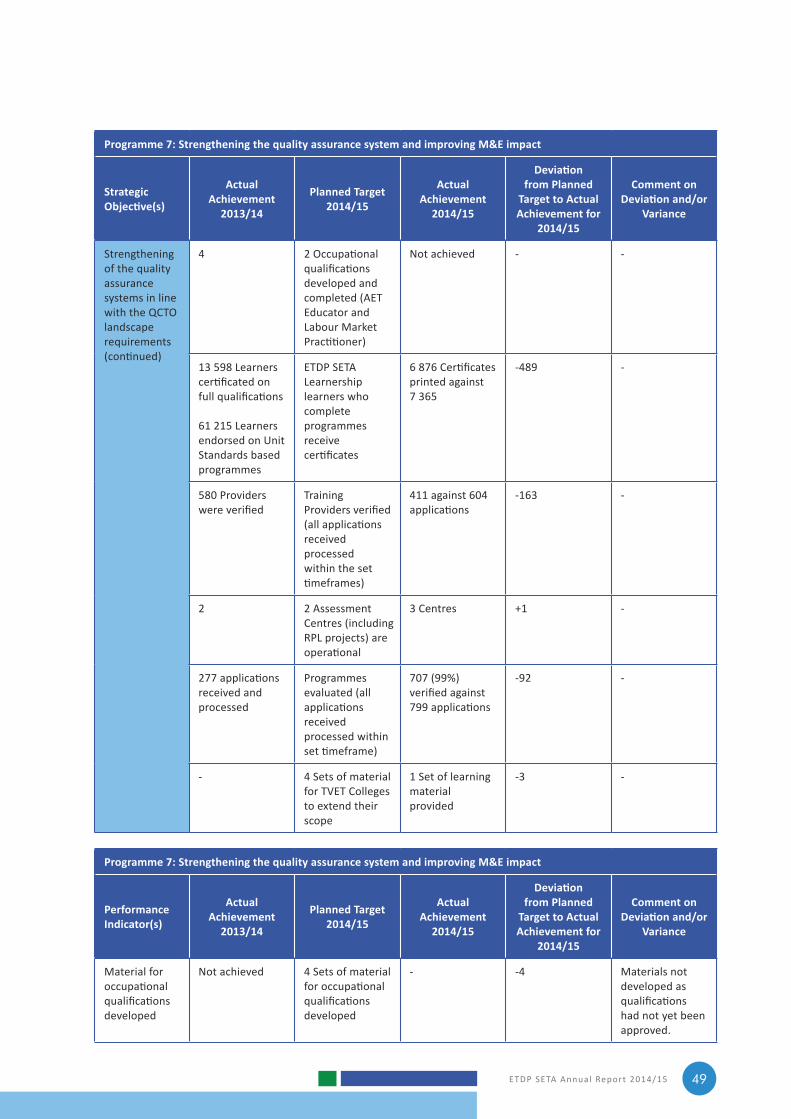
ETDP SETA Annual Report 2014/15 49
Programme 7: Strengthening the quality assurance system and improving M&E impact
Strategic Objective(s)
Actual Achievement
2013/14
Planned Target2014/15
Actual Achievement
2014/15
Deviation from Planned
Target to Actual Achievement for
2014/15
Comment on Deviation and/or
Variance
Strengthening of the quality assurance systems in line with the QCTO landscape requirements (continued)
4 2 Occupational qualifications developed and completed (AET Educator and Labour Market Practitioner)
Not achieved ‑ ‑
13 598 Learners certificated on full qualifications
61 215 Learners endorsed on Unit Standards based programmes
ETDP SETA Learnership learners who complete programmes receive certificates
6 876 Certificates printed against 7 365
‑489 ‑
580 Providers were verified
Training Providers verified (all applications received processed within the set timeframes)
411 against 604 applications
‑163 ‑
2 2 Assessment Centres (including RPL projects) are operational
3 Centres +1 ‑
277 applications received and processed
Programmes evaluated (all applications received processed within set timeframe)
707 (99%) verified against 799 applications
‑92 ‑
‑ 4 Sets of material for TVET Colleges to extend their scope
1 Set of learning material provided
‑3 ‑
Programme 7: Strengthening the quality assurance system and improving M&E impact
Performance Indicator(s)
Actual Achievement
2013/14
Planned Target2014/15
Actual Achievement
2014/15
Deviation from Planned
Target to Actual Achievement for
2014/15
Comment on Deviation and/or
Variance
Material for occupational qualifications developed
Not achieved 4 Sets of material for occupational qualifications developed
‑ ‑4 Materials not developed as qualifications had not yet been approved.
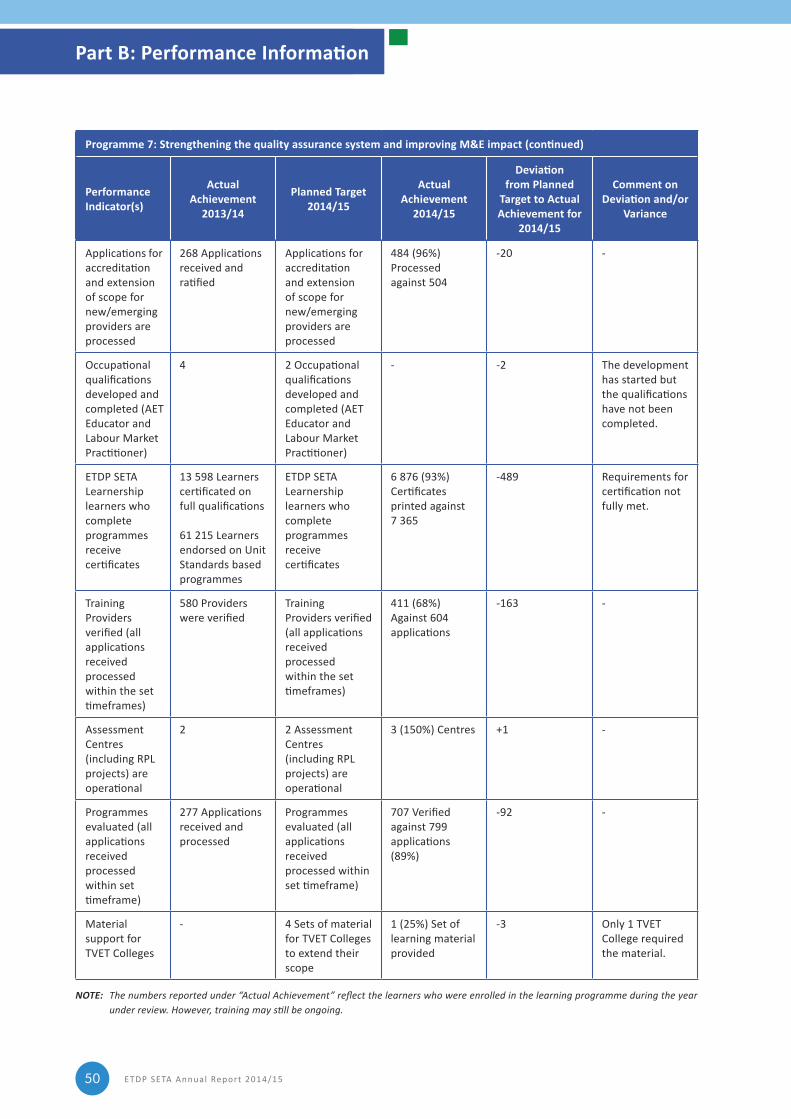
ETDP SETA Annual Report 2014/1550
Programme 7: Strengthening the quality assurance system and improving M&E impact (continued)
Performance Indicator(s)
Actual Achievement
2013/14
Planned Target2014/15
Actual Achievement
2014/15
Deviation from Planned
Target to Actual Achievement for
2014/15
Comment on Deviation and/or
Variance
Applications for accreditation and extension of scope for new/emerging providers are processed
268 Applications received and ratified
Applications for accreditation and extension of scope for new/emerging providers are processed
484 (96%) Processed against 504
‑20 ‑
Occupational qualifications developed and completed (AET Educator and Labour Market Practitioner)
4 2 Occupational qualifications developed and completed (AET Educator and Labour Market Practitioner)
‑ ‑2 The development has started but the qualifications have not been completed.
ETDP SETA Learnership learners who complete programmes receive certificates
13 598 Learners certificated on full qualifications
61 215 Learners endorsed on Unit Standards based programmes
ETDP SETA Learnership learners who complete programmes receive certificates
6 876 (93%) Certificates printed against 7 365
‑489 Requirements for certification not fully met.
Training Providers verified (all applications received processed within the set timeframes)
580 Providers were verified
Training Providers verified (all applications received processed within the set timeframes)
411 (68%) Against 604 applications
‑163 ‑
Assessment Centres (including RPL projects) are operational
2 2 Assessment Centres (including RPL projects) are operational
3 (150%) Centres +1 ‑
Programmes evaluated (all applications received processed within set timeframe)
277 Applications received and processed
Programmes evaluated (all applications received processed within set timeframe)
707 Verified against 799 applications (89%)
‑92 ‑
Material support for TVET Colleges
‑ 4 Sets of material for TVET Colleges to extend their scope
1 (25%) Set of learning material provided
‑3 Only 1 TVET College required the material.
NOTE: The numbers reported under “Actual Achievement” reflect the learners who were enrolled in the learning programme during the year under review. However, training may still be ongoing.
Part B: Performance Information
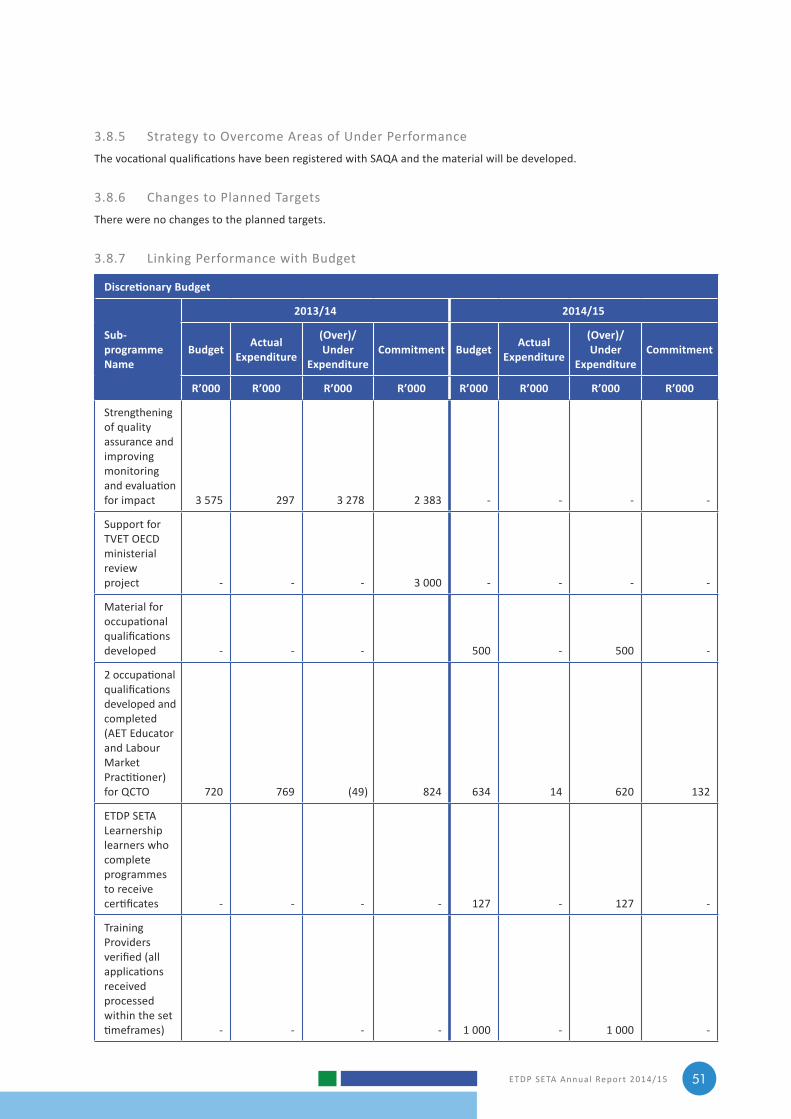
ETDP SETA Annual Report 2014/15 51
3.8.5 Strategy to Overcome Areas of Under PerformanceThe vocational qualifications have been registered with SAQA and the material will be developed.
3.8.6 Changes to Planned TargetsThere were no changes to the planned targets.
3.8.7 Linking Performance with Budget
Discretionary Budget
Sub-programme Name
2013/14 2014/15
Budget Actual Expenditure
(Over)/Under
ExpenditureCommitment Budget Actual
Expenditure
(Over)/Under
Expenditure Commitment
R’000 R’000 R’000 R’000 R’000 R’000 R’000 R’000
Strengthening of quality assurance and improving monitoring and evaluation for impact 3 575 297 3 278 2 383 ‑ ‑ ‑ ‑
Support for TVET OECD ministerial review project ‑ ‑ ‑ 3 000 ‑ ‑ ‑ ‑
Material for occupational qualifications developed ‑ ‑ ‑ 500 ‑ 500 ‑
2 occupational qualifications developed and completed (AET Educator and Labour Market Practitioner) for QCTO 720 769 (49) 824 634 14 620 132
ETDP SETA Learnership learners who complete programmes to receive certificates ‑ ‑ ‑ ‑ 127 ‑ 127 ‑
Training Providers verified (all applications received processed within the set timeframes) ‑ ‑ ‑ ‑ 1 000 ‑ 1 000 ‑
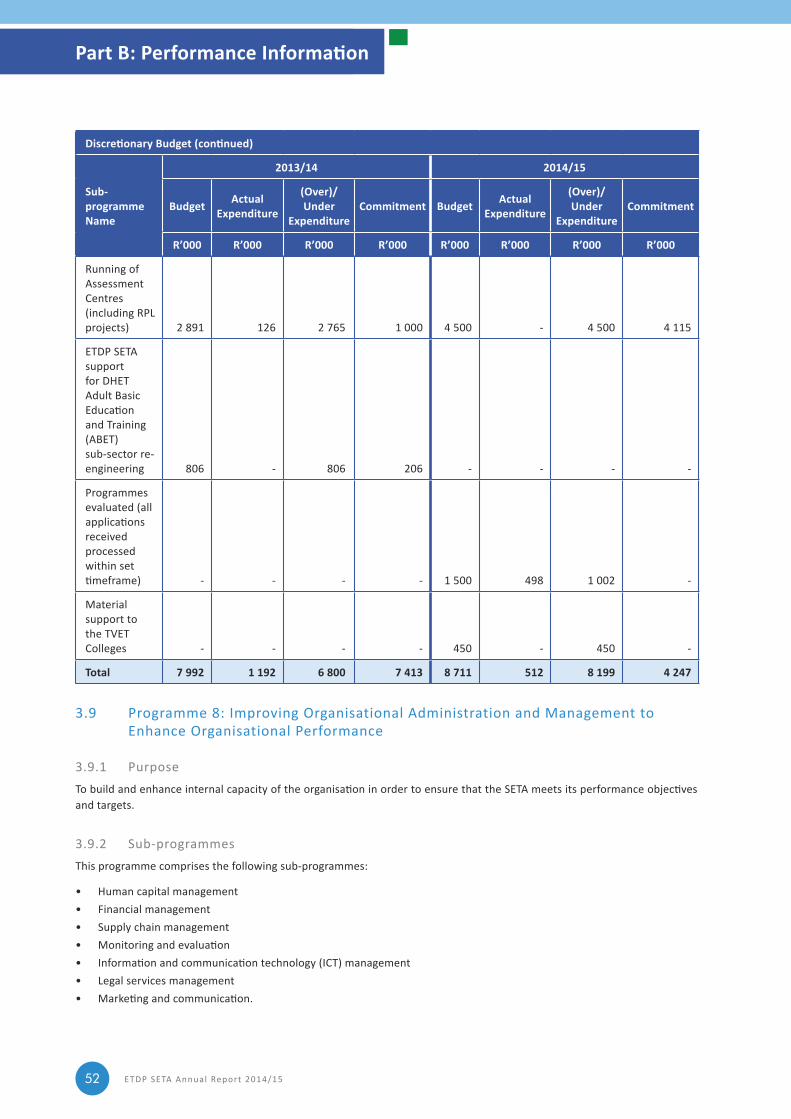
ETDP SETA Annual Report 2014/1552
Discretionary Budget (continued)
Sub-programme Name
2013/14 2014/15
Budget Actual Expenditure
(Over)/Under
ExpenditureCommitment Budget Actual
Expenditure
(Over)/Under
Expenditure Commitment
R’000 R’000 R’000 R’000 R’000 R’000 R’000 R’000
Running of Assessment Centres (including RPL projects) 2 891 126 2 765 1 000 4 500 ‑ 4 500 4 115
ETDP SETA support for DHET Adult Basic Education and Training (ABET) sub‑sector re‑engineering 806 ‑ 806 206 ‑ ‑ ‑ ‑
Programmes evaluated (all applications received processed within set timeframe) ‑ ‑ ‑ ‑ 1 500 498 1 002 ‑
Material support to the TVET Colleges ‑ ‑ ‑ ‑ 450 ‑ 450 ‑
Total 7 992 1 192 6 800 7 413 8 711 512 8 199 4 247
3.9 Programme 8: Improving Organisational Administration and Management to Enhance Organisational Performance
3.9.1 PurposeTo build and enhance internal capacity of the organisation in order to ensure that the SETA meets its performance objectives and targets.
3.9.2 Sub‑programmesThis programme comprises the following sub‑programmes:
• Human capital management• Financial management• Supply chain management• Monitoring and evaluation• Information and communication technology (ICT) management• Legal services management• Marketing and communication.
Part B: Performance Information
ETDP SETA Annual Report 2014/15 53
3.9.3 Strategic Objectives • Implementation of an Integrated Organisational
Development and Performance Strategy• Effective and efficient governance through training for
governance structures including Chambers• Revised Media and Public Relations Strategy• Improved Supply Chain Management practices• Improved Financial Management practices• Introduction and implementation of Integrated
Management Information System• Implementation of legal management and advisory
services to the organisation.
3.9.4 Actual Achievements
Human Capital Management
The organisation made available bursaries to enable staff members to attend various forms of training, both for full qualifications and skills programmes. During the year under review, a target of 100 employees was expected to apply for part qualifications related to the Performance Management and Development System (PMDS) however only 13 took up the offer. Twenty five employees were awarded bursaries against an expected target of 30. The target was based on the target allocation in the previous year.
Governance Training
A target of 55 beneficiaries was planned for training on governance however there was no uptake for the programme in the year under review. Most of the members received training towards the end of the 2013/14 financial year.
Financial Management
Sound financial management and governance remain objectives of the ETDP SETA. The organisation receives skills development levies from a number of sources and these are managed fully and accurately through the controls in place to ensure that no funds are paid out without the necessary authorisation. Furthermore, an accurate, reliable and always up‑to‑date commitment schedule has been developed to ensure accurate reporting and tracking of project funding. This will, in part, address audit challenges that were faced by the organisation at the end of the 2013/14 financial year.
Supply Chain Management
Supply Chain Management processes and systems are designed in such a manner that compliance with all applicable laws and regulations is managed. In the past year, measures were put in place to implement strategic sourcing towards the realisation of a more economic and effective procurement process and practice for critical goods and services.
Information Technology Management
ICT systems were upgraded through the implementation of a document management system and core administration system. This will enable the organisation to have accurate, complete, and timely management information accessible, thereby solidifying the basis for an integrated Management Information System (MIS). The organisation has started digitising its paper‑based performance information, a process that will ensure a more efficient and cost-effective operation. In order to enable effective service delivery to the organisation’s beneficiaries and stakeholders, IT infrastructure upgrades, for both hardware and communication capabilities, were implemented.
The Business Continuity Management Strategy was implemented, and the organisation now has a disaster recovery system in place that protects it from losing critical information assets. As demonstrated through various tests during the year, the ETDP SETA is able to continue with its business in the case of a major disruption.
Marketing and Communication
The profiling and visibility of the ETDP SETA was further elevated among stakeholders. In 2014, provincial Indabas were held in all nine provinces to provide feedback on the previous year’s performances and share information.
Legal Services Provision
The organisation has not been involved in any litigation matters in the year under review.
3.9.5 Strategy to Overcome Underperformance
Whilst challenges do indeed exist, HR has employed a number of strategies to attract human capital who agree to the limited conditions of employment imposed by the period of service availed, i.e. 31 March 2016.
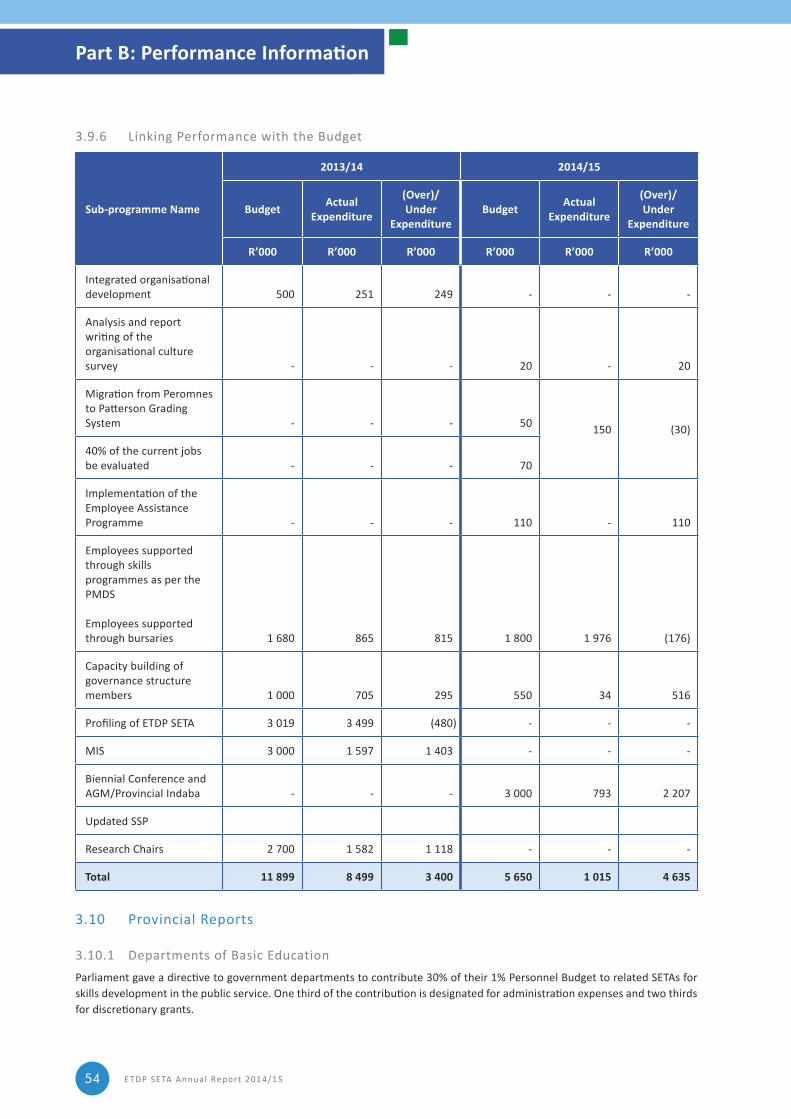
ETDP SETA Annual Report 2014/1554
3.9.6 Linking Performance with the Budget
Sub-programme Name
2013/14 2014/15
Budget Actual Expenditure
(Over)/Under
ExpenditureBudget Actual
Expenditure
(Over)/Under
Expenditure
R’000 R’000 R’000 R’000 R’000 R’000
Integrated organisational development 500 251 249 ‑ ‑ ‑
Analysis and report writing of the organisational culture survey ‑ ‑ ‑ 20 ‑ 20
Migration from Peromnes to Patterson Grading System ‑ ‑ ‑ 50 150 (30)
40% of the current jobs be evaluated ‑ ‑ ‑ 70
Implementation of the Employee Assistance Programme ‑ ‑ ‑ 110 ‑ 110
Employees supported through skills programmes as per the PMDS
Employees supported through bursaries 1 680 865 815 1 800 1 976 (176)
Capacity building of governance structure members 1 000 705 295 550 34 516
Profiling of ETDP SETA 3 019 3 499 (480) ‑ ‑ ‑
MIS 3 000 1 597 1 403 ‑ ‑ ‑
Biennial Conference and AGM/Provincial Indaba ‑ ‑ ‑ 3 000 793 2 207
Updated SSP
Research Chairs 2 700 1 582 1 118 ‑ ‑ ‑
Total 11 899 8 499 3 400 5 650 1 015 4 635
3.10 Provincial Reports
3.10.1 Departments of Basic EducationParliament gave a directive to government departments to contribute 30% of their 1% Personnel Budget to related SETAs for skills development in the public service. One third of the contribution is designated for administration expenses and two thirds for discretionary grants.
Part B: Performance Information
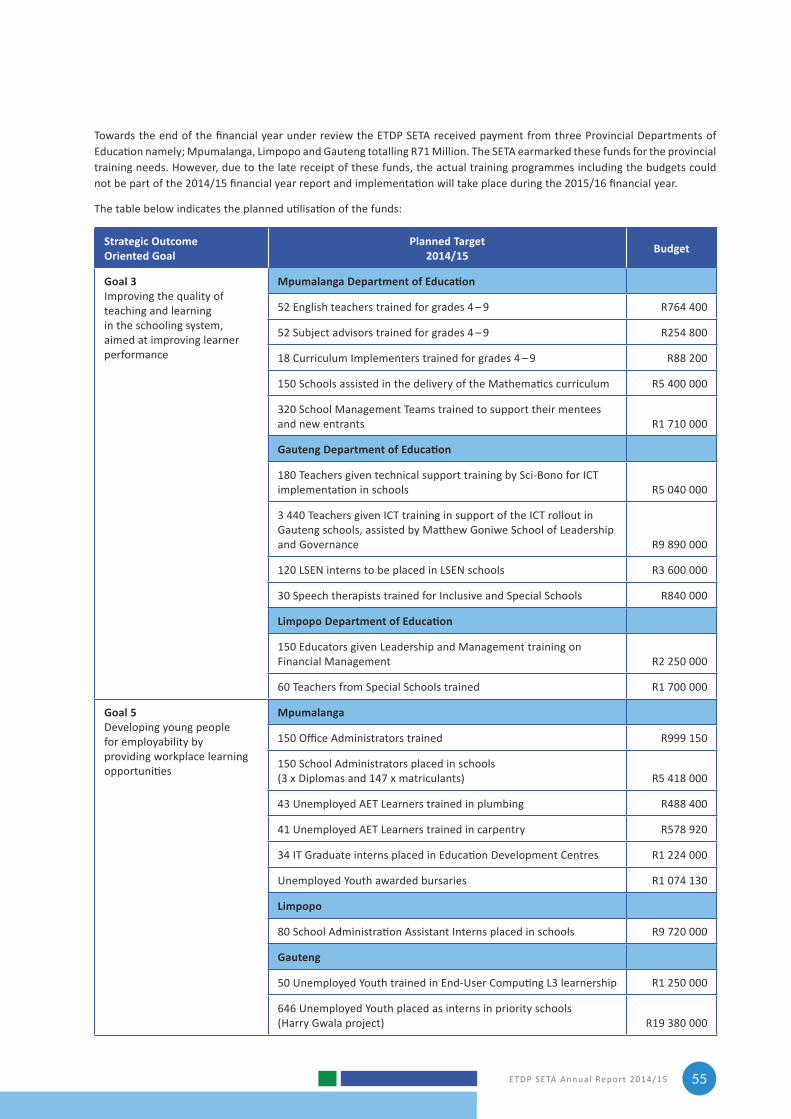
ETDP SETA Annual Report 2014/15 55
Towards the end of the financial year under review the ETDP SETA received payment from three Provincial Departments of Education namely; Mpumalanga, Limpopo and Gauteng totalling R71 Million. The SETA earmarked these funds for the provincial training needs. However, due to the late receipt of these funds, the actual training programmes including the budgets could not be part of the 2014/15 financial year report and implementation will take place during the 2015/16 financial year.
The table below indicates the planned utilisation of the funds:
Strategic Outcome Oriented Goal
Planned Target2014/15 Budget
Goal 3Improving the quality of teaching and learning in the schooling system, aimed at improving learner performance
Mpumalanga Department of Education
52 English teachers trained for grades 4 – 9 R764 400
52 Subject advisors trained for grades 4 – 9 R254 800
18 Curriculum Implementers trained for grades 4 – 9 R88 200
150 Schools assisted in the delivery of the Mathematics curriculum R5 400 000
320 School Management Teams trained to support their mentees and new entrants R1 710 000
Gauteng Department of Education
180 Teachers given technical support training by Sci‑Bono for ICT implementation in schools R5 040 000
3 440 Teachers given ICT training in support of the ICT rollout in Gauteng schools, assisted by Matthew Goniwe School of Leadership and Governance R9 890 000
120 LSEN interns to be placed in LSEN schools R3 600 000
30 Speech therapists trained for Inclusive and Special Schools R840 000
Limpopo Department of Education
150 Educators given Leadership and Management training on Financial Management R2 250 000
60 Teachers from Special Schools trained R1 700 000
Goal 5Developing young people for employability by providing workplace learning opportunities
Mpumalanga
150 Office Administrators trained R999 150
150 School Administrators placed in schools (3 x Diplomas and 147 x matriculants) R5 418 000
43 Unemployed AET Learners trained in plumbing R488 400
41 Unemployed AET Learners trained in carpentry R578 920
34 IT Graduate interns placed in Education Development Centres R1 224 000
Unemployed Youth awarded bursaries R1 074 130
Limpopo
80 School Administration Assistant Interns placed in schools R9 720 000
Gauteng
50 Unemployed Youth trained in End-User Computing L3 learnership R1 250 000
646 Unemployed Youth placed as interns in priority schools (Harry Gwala project) R19 380 000
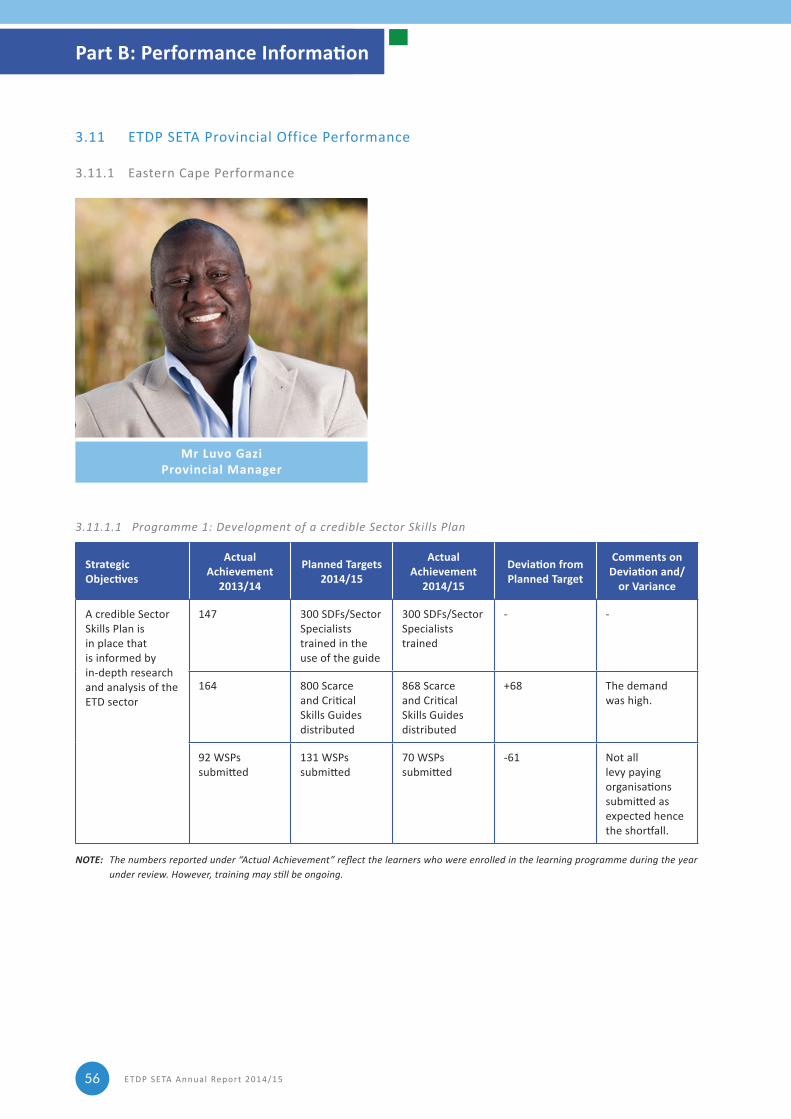
ETDP SETA Annual Report 2014/1556
3.11 ETDP SETA Provincial Office Performance
3.11.1 Eastern Cape Performance
Mr Luvo GaziProvincial Manager
3.11.1.1 Programme 1: Development of a credible Sector Skills Plan
Strategic Objectives
Actual Achievement
2013/14
Planned Targets 2014/15
Actual Achievement
2014/15
Deviation from Planned Target
Comments on Deviation and/
or Variance
A credible Sector Skills Plan is in place that is informed by in‑depth research and analysis of the ETD sector
147 300 SDFs/Sector Specialists trained in the use of the guide
300 SDFs/Sector Specialists trained
‑ ‑
164 800 Scarce and Critical Skills Guides distributed
868 Scarce and Critical Skills Guides distributed
+68 The demand was high.
92 WSPs submitted
131 WSPs submitted
70 WSPs submitted
‑61 Not all levy paying organisations submitted as expected hence the shortfall.
NOTE: The numbers reported under “Actual Achievement” reflect the learners who were enrolled in the learning programme during the year under review. However, training may still be ongoing.
Part B: Performance Information
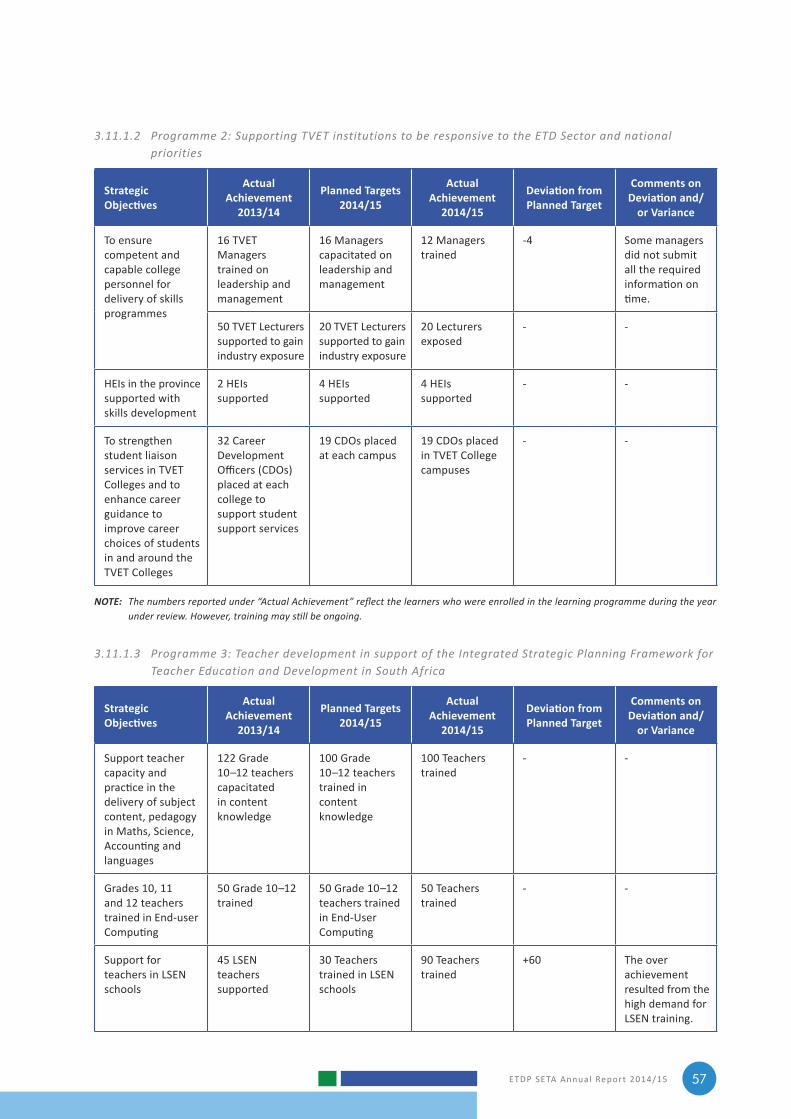
ETDP SETA Annual Report 2014/15 57
3.11.1.2 Programme 2: Supporting TVET institutions to be responsive to the ETD Sector and national priorities
Strategic Objectives
Actual Achievement
2013/14
Planned Targets 2014/15
Actual Achievement
2014/15
Deviation from Planned Target
Comments on Deviation and/
or Variance
To ensure competent and capable college personnel for delivery of skills programmes
16 TVET Managers trained on leadership and management
16 Managers capacitated on leadership and management
12 Managers trained
‑4 Some managers did not submit all the required information on time.
50 TVET Lecturers supported to gain industry exposure
20 TVET Lecturers supported to gain industry exposure
20 Lecturers exposed
‑ ‑
HEIs in the province supported with skills development
2 HEIs supported
4 HEIs supported
4 HEIs supported
‑ ‑
To strengthen student liaison services in TVET Colleges and to enhance career guidance to improve career choices of students in and around the TVET Colleges
32 Career Development Officers (CDOs) placed at each college to support student support services
19 CDOs placed at each campus
19 CDOs placed in TVET College campuses
‑ ‑
NOTE: The numbers reported under “Actual Achievement” reflect the learners who were enrolled in the learning programme during the year under review. However, training may still be ongoing.
3.11.1.3 Programme 3: Teacher development in support of the Integrated Strategic Planning Framework for Teacher Education and Development in South Africa
Strategic Objectives
Actual Achievement
2013/14
Planned Targets 2014/15
Actual Achievement
2014/15
Deviation from Planned Target
Comments on Deviation and/
or Variance
Support teacher capacity and practice in the delivery of subject content, pedagogy in Maths, Science, Accounting and languages
122 Grade 10–12 teachers capacitated in content knowledge
100 Grade 10–12 teachers trained in content knowledge
100 Teachers trained
‑ ‑
Grades 10, 11 and 12 teachers trained in End‑user Computing
50 Grade 10–12 trained
50 Grade 10–12 teachers trained in End-User Computing
50 Teachers trained
‑ ‑
Support for teachers in LSEN schools
45 LSEN teachers supported
30 Teachers trained in LSEN schools
90 Teachers trained
+60 The over achievement resulted from the high demand for LSEN training.
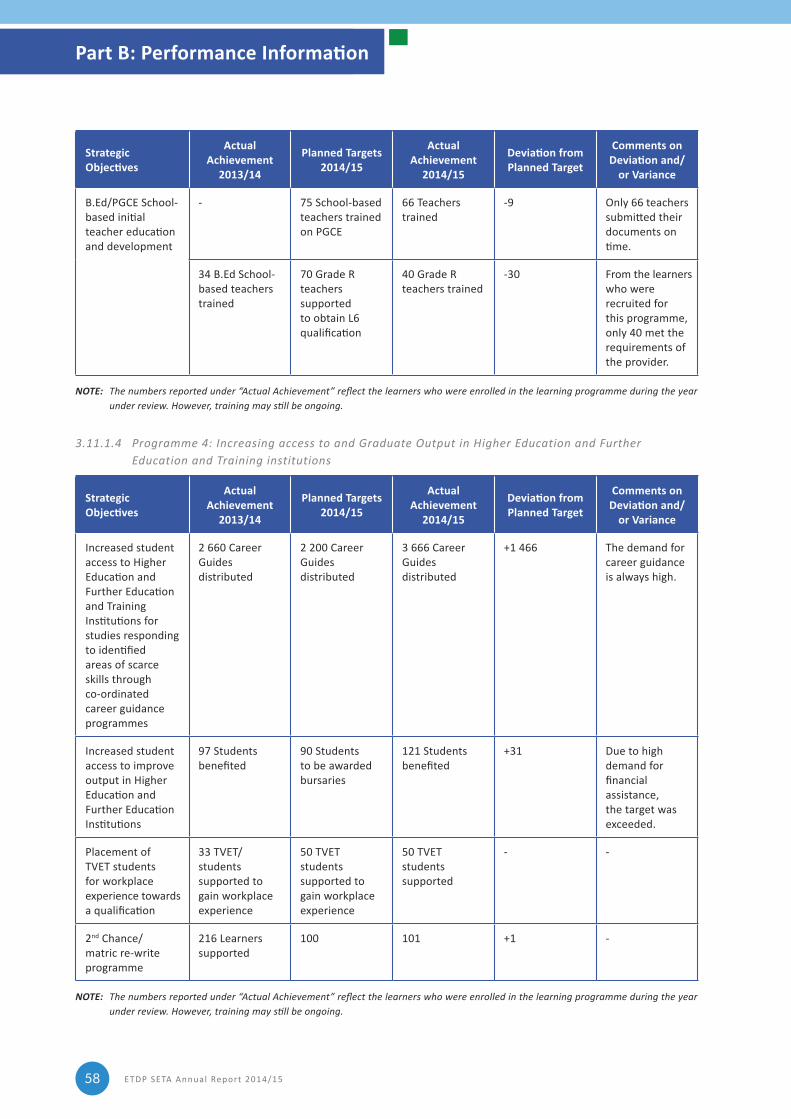
ETDP SETA Annual Report 2014/1558
Strategic Objectives
Actual Achievement
2013/14
Planned Targets 2014/15
Actual Achievement
2014/15
Deviation from Planned Target
Comments on Deviation and/
or Variance
B.Ed/PGCE School‑based initial teacher education and development
‑ 75 School‑based teachers trained on PGCE
66 Teachers trained
‑9 Only 66 teachers submitted their documents on time.
34 B.Ed School‑ based teachers trained
70 Grade R teachers supported to obtain L6 qualification
40 Grade R teachers trained
‑30 From the learners who were recruited for this programme, only 40 met the requirements of the provider.
NOTE: The numbers reported under “Actual Achievement” reflect the learners who were enrolled in the learning programme during the year under review. However, training may still be ongoing.
3.11.1.4 Programme 4: Increasing access to and Graduate Output in Higher Education and Further Education and Training institutions
Strategic Objectives
Actual Achievement
2013/14
Planned Targets 2014/15
Actual Achievement
2014/15
Deviation from Planned Target
Comments on Deviation and/
or Variance
Increased student access to Higher Education and Further Education and Training Institutions for studies responding to identified areas of scarce skills through co‑ordinated career guidance programmes
2 660 Career Guides distributed
2 200 Career Guides distributed
3 666 Career Guides distributed
+1 466 The demand for career guidance is always high.
Increased student access to improve output in Higher Education and Further Education Institutions
97 Students benefited
90 Students to be awarded bursaries
121 Students benefited
+31 Due to high demand for financial assistance, the target was exceeded.
Placement of TVET students for workplace experience towards a qualification
33 TVET/students supported to gain workplace experience
50 TVET students supported to gain workplace experience
50 TVET students supported
‑ ‑
2nd Chance/matric re‑write programme
216 Learners supported
100 101 +1 ‑
NOTE: The numbers reported under “Actual Achievement” reflect the learners who were enrolled in the learning programme during the year under review. However, training may still be ongoing.
Part B: Performance Information
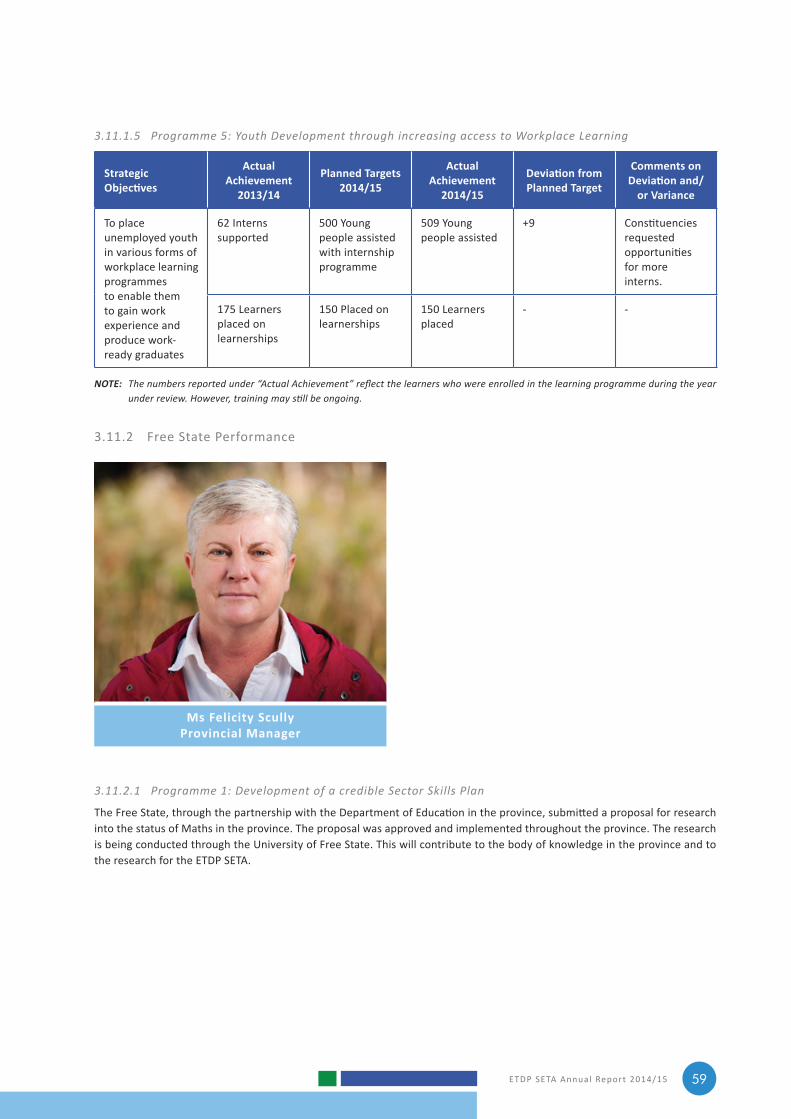
ETDP SETA Annual Report 2014/15 59
3.11.1.5 Programme 5: Youth Development through increasing access to Workplace Learning
Strategic Objectives
Actual Achievement
2013/14
Planned Targets 2014/15
Actual Achievement
2014/15
Deviation from Planned Target
Comments on Deviation and/
or Variance
To place unemployed youth in various forms of workplace learning programmes to enable them to gain work experience and produce work‑ ready graduates
62 Interns supported
500 Young people assisted with internship programme
509 Young people assisted
+9 Constituencies requested opportunities for more interns.
175 Learners placed on learnerships
150 Placed on learnerships
150 Learners placed
‑ ‑
NOTE: The numbers reported under “Actual Achievement” reflect the learners who were enrolled in the learning programme during the year under review. However, training may still be ongoing.
3.11.2 Free State Performance
Ms Felicity ScullyProvincial Manager
3.11.2.1 Programme 1: Development of a credible Sector Skills Plan
The Free State, through the partnership with the Department of Education in the province, submitted a proposal for research into the status of Maths in the province. The proposal was approved and implemented throughout the province. The research is being conducted through the University of Free State. This will contribute to the body of knowledge in the province and to the research for the ETDP SETA.
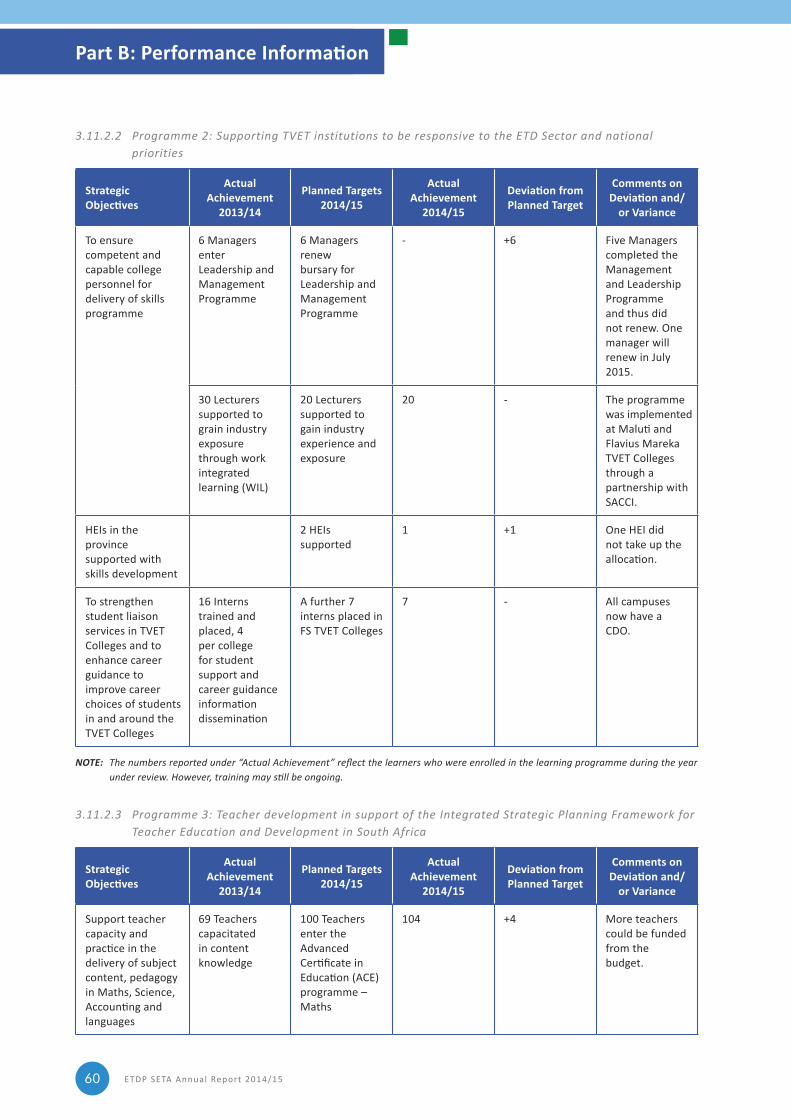
ETDP SETA Annual Report 2014/1560
3.11.2.2 Programme 2: Supporting TVET institutions to be responsive to the ETD Sector and national priorities
Strategic Objectives
Actual Achievement
2013/14
Planned Targets 2014/15
Actual Achievement
2014/15
Deviation from Planned Target
Comments on Deviation and/
or Variance
To ensure competent and capable college personnel for delivery of skills programme
6 Managers enter Leadership and Management Programme
6 Managers renew bursary for Leadership and Management Programme
‑ +6 Five Managers completed the Management and Leadership Programme and thus did not renew. One manager will renew in July 2015.
30 Lecturers supported to grain industry exposure through work integrated learning (WIL)
20 Lecturers supported to gain industry experience and exposure
20 ‑ The programme was implemented at Maluti and Flavius Mareka TVET Colleges through a partnership with SACCI.
HEIs in the province supported with skills development
2 HEIs supported
1 +1 One HEI did not take up the allocation.
To strengthen student liaison services in TVET Colleges and to enhance career guidance to improve career choices of students in and around the TVET Colleges
16 Interns trained and placed, 4 per college for student support and career guidance information dissemination
A further 7 interns placed in FS TVET Colleges
7 ‑ All campuses now have a CDO.
NOTE: The numbers reported under “Actual Achievement” reflect the learners who were enrolled in the learning programme during the year under review. However, training may still be ongoing.
3.11.2.3 Programme 3: Teacher development in support of the Integrated Strategic Planning Framework for Teacher Education and Development in South Africa
Strategic Objectives
Actual Achievement
2013/14
Planned Targets 2014/15
Actual Achievement
2014/15
Deviation from Planned Target
Comments on Deviation and/
or Variance
Support teacher capacity and practice in the delivery of subject content, pedagogy in Maths, Science, Accounting and languages
69 Teachers capacitated in content knowledge
100 Teachers enter the Advanced Certificate in Education (ACE) programme – Maths
104 +4 More teachers could be funded from the budget.
Part B: Performance Information
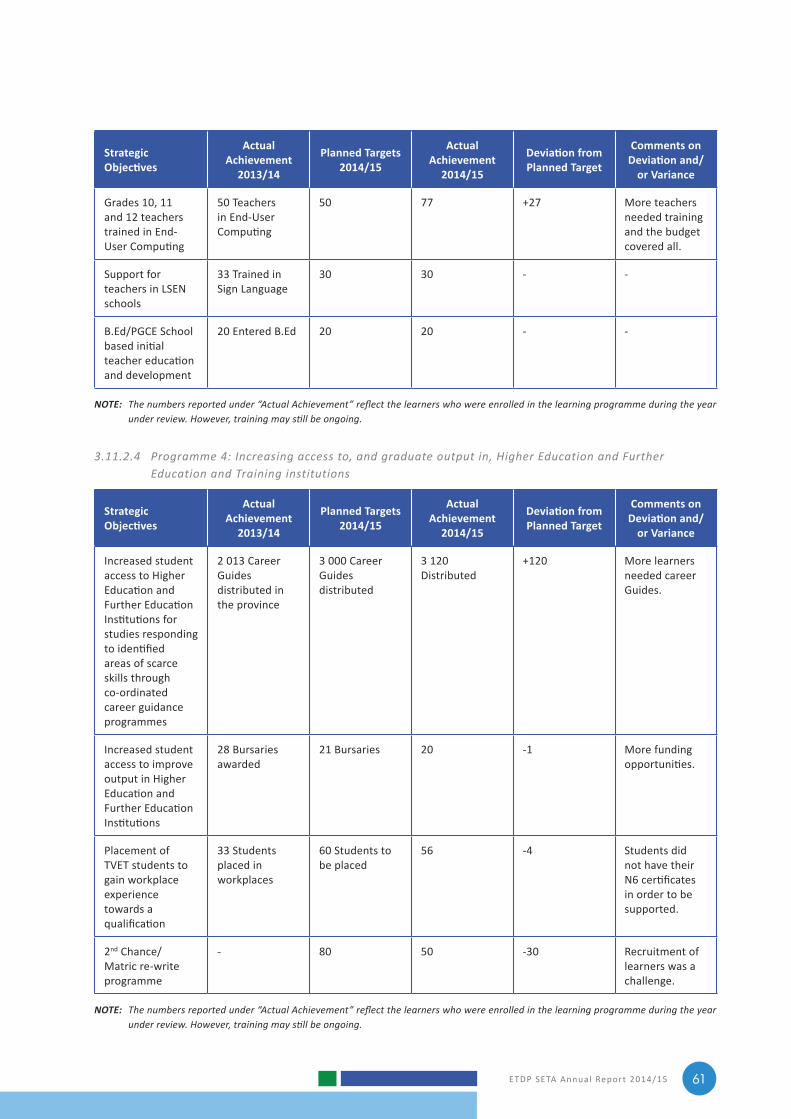
ETDP SETA Annual Report 2014/15 61
Strategic Objectives
Actual Achievement
2013/14
Planned Targets 2014/15
Actual Achievement
2014/15
Deviation from Planned Target
Comments on Deviation and/
or Variance
Grades 10, 11 and 12 teachers trained in End‑User Computing
50 Teachers in End-User Computing
50 77 +27 More teachers needed training and the budget covered all.
Support for teachers in LSEN schools
33 Trained in Sign Language
30 30 ‑ ‑
B.Ed/PGCE School based initial teacher education and development
20 Entered B.Ed 20 20 ‑ ‑
NOTE: The numbers reported under “Actual Achievement” reflect the learners who were enrolled in the learning programme during the year under review. However, training may still be ongoing.
3.11.2.4 Programme 4: Increasing access to, and graduate output in, Higher Education and Further Education and Training institutions
Strategic Objectives
Actual Achievement
2013/14
Planned Targets 2014/15
Actual Achievement
2014/15
Deviation from Planned Target
Comments on Deviation and/
or Variance
Increased student access to Higher Education and Further Education Institutions for studies responding to identified areas of scarce skills through co‑ordinated career guidance programmes
2 013 Career Guides distributed in the province
3 000 Career Guides distributed
3 120 Distributed
+120 More learners needed career Guides.
Increased student access to improve output in Higher Education and Further Education Institutions
28 Bursaries awarded
21 Bursaries 20 ‑1 More funding opportunities.
Placement of TVET students to gain workplace experience towards a qualification
33 Students placed in workplaces
60 Students to be placed
56 ‑4 Students did not have their N6 certificates in order to be supported.
2nd Chance/Matric re‑write programme
‑ 80 50 ‑30 Recruitment of learners was a challenge.
NOTE: The numbers reported under “Actual Achievement” reflect the learners who were enrolled in the learning programme during the year under review. However, training may still be ongoing.
ETDP SETA Annual Report 2014/1562
3.11.2.5 Programme 5: Youth development through increasing access to Workplace Learning
Strategic Objectives
Actual Achievement
2013/14
Planned Targets 2014/15
Actual Achievement
2014/15
Deviation from Planned Target
Comments on Deviation and/
or Variance
To place unemployed youth in various forms of workplace learning programmes to enable them to gain work experience and to produce work‑ready graduates
1 Intern 20 Interns enter the workplace
14 ‑6 Interns dropped out of the programme.
‑ 30 Learners enter Library Practice Learnership
33 +3 ‑
‑ 50 People with disabilities enter a learnership
50 ‑ ‑
NOTE: The numbers reported under “Actual Achievement” reflect the learners who were enrolled in the learning programme during the year under review. However, training may still be ongoing.
3.11.3 Gauteng Performance
Mr Gerrard Francis Provincial Manager
3.11.3.1 Programme 1: Development of a credible ETD Sector Skills Plan (SSP)
Strategic Objectives
Actual Achievement
2013/14
Planned Targets 2014/15
Actual Achievement
2014/15
Deviation from Planned Target
Comments on Deviation and/
or Variance
A credible Sector Skills Plan is in place that is informed by in‑depth research and analysis of the ETD sector
434 WSP/ATRs were collected
850 WSP/ATR to be submitted
391 ‑459 Not all small levy paying organisations submitted as expected despite workshops and visits to the organisations.
Part B: Performance Information
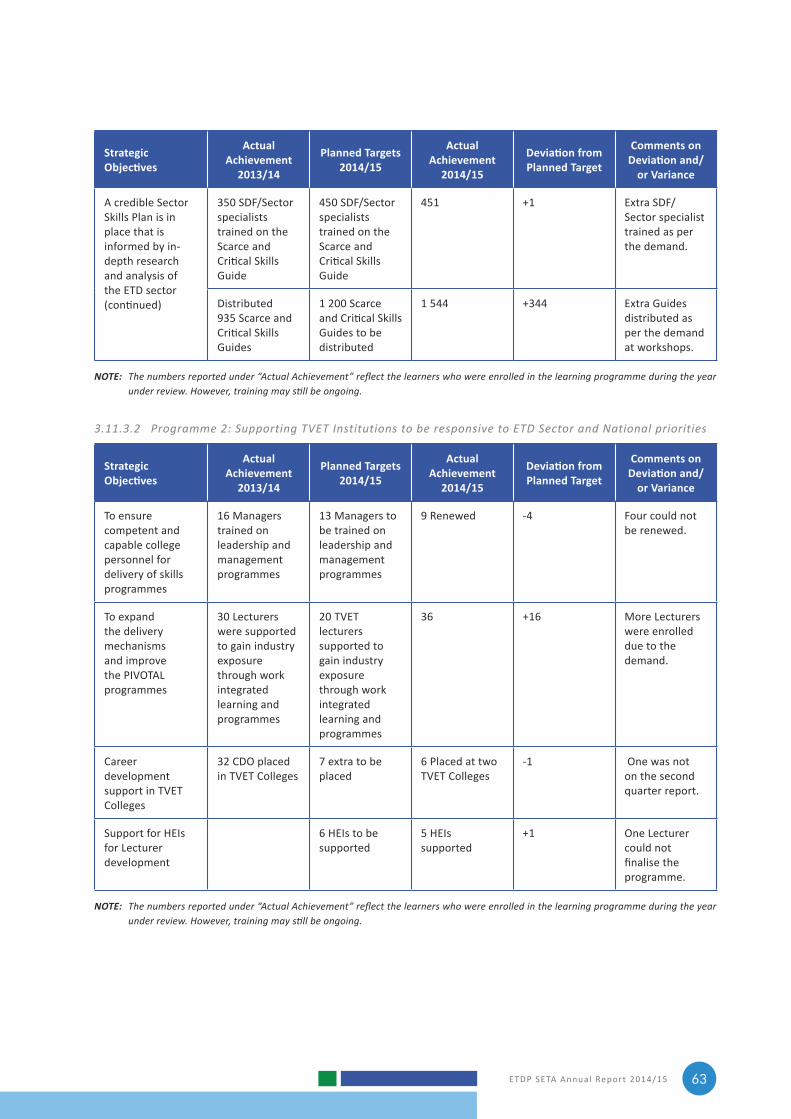
ETDP SETA Annual Report 2014/15 63
Strategic Objectives
Actual Achievement
2013/14
Planned Targets 2014/15
Actual Achievement
2014/15
Deviation from Planned Target
Comments on Deviation and/
or Variance
A credible Sector Skills Plan is in place that is informed by in‑depth research and analysis of the ETD sector (continued)
350 SDF/Sector specialists trained on the Scarce and Critical Skills Guide
450 SDF/Sector specialists trained on the Scarce and Critical Skills Guide
451 +1 Extra SDF/Sector specialist trained as per the demand.
Distributed 935 Scarce and Critical Skills Guides
1 200 Scarce and Critical Skills Guides to be distributed
1 544 +344 Extra Guides distributed as per the demand at workshops.
NOTE: The numbers reported under “Actual Achievement” reflect the learners who were enrolled in the learning programme during the year under review. However, training may still be ongoing.
3.11.3.2 Programme 2: Supporting TVET Institutions to be responsive to ETD Sector and National priorities
Strategic Objectives
Actual Achievement
2013/14
Planned Targets 2014/15
Actual Achievement
2014/15
Deviation from Planned Target
Comments on Deviation and/
or Variance
To ensure competent and capable college personnel for delivery of skills programmes
16 Managers trained on leadership and management programmes
13 Managers to be trained on leadership and management programmes
9 Renewed ‑4 Four could not be renewed.
To expand the delivery mechanisms and improve the PIVOTAL programmes
30 Lecturers were supported to gain industry exposure through work integrated learning and programmes
20 TVET lecturers supported to gain industry exposure through work integrated learning and programmes
36 +16 More Lecturers were enrolled due to the demand.
Career development support in TVET Colleges
32 CDO placed in TVET Colleges
7 extra to be placed
6 Placed at two TVET Colleges
‑1 One was not on the second quarter report.
Support for HEIs for Lecturer development
6 HEIs to be supported
5 HEIs supported
+1 One Lecturer could not finalise the programme.
NOTE: The numbers reported under “Actual Achievement” reflect the learners who were enrolled in the learning programme during the year under review. However, training may still be ongoing.
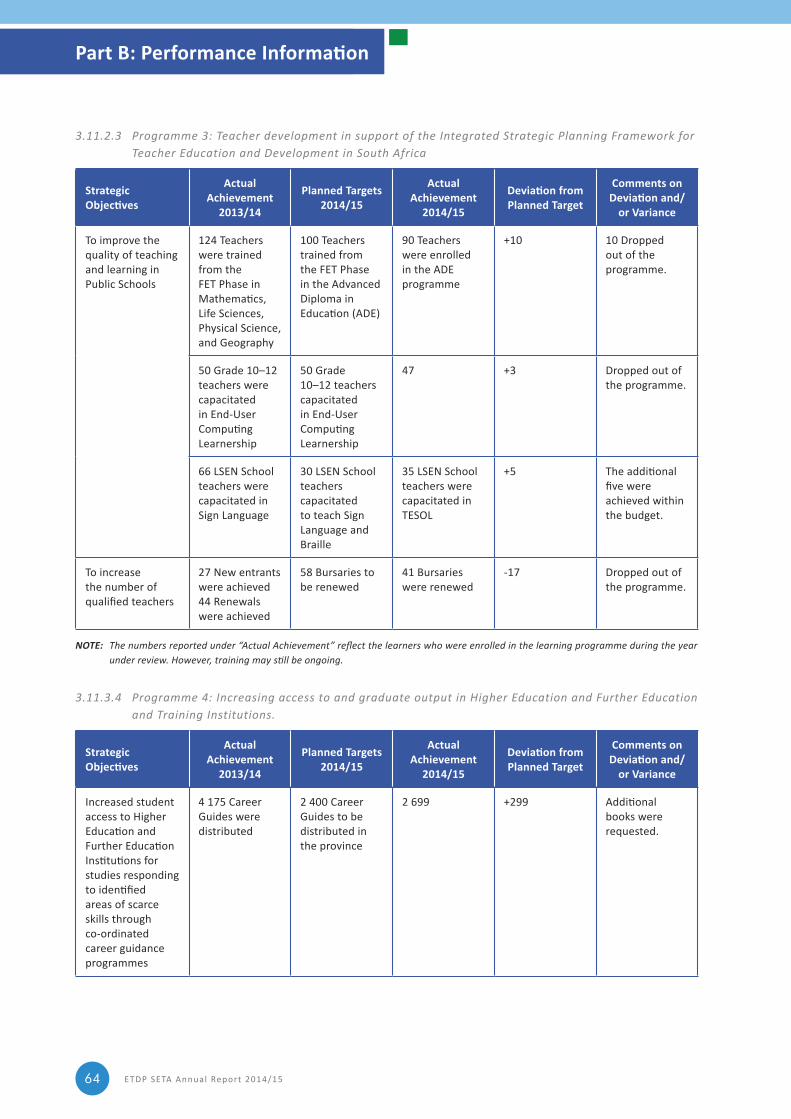
ETDP SETA Annual Report 2014/1564
3.11.2.3 Programme 3: Teacher development in support of the Integrated Strategic Planning Framework for Teacher Education and Development in South Africa
Strategic Objectives
Actual Achievement
2013/14
Planned Targets 2014/15
Actual Achievement
2014/15
Deviation from Planned Target
Comments on Deviation and/
or Variance
To improve the quality of teaching and learning in Public Schools
124 Teachers were trained from the FET Phase in Mathematics, Life Sciences, Physical Science, and Geography
100 Teachers trained from the FET Phase in the Advanced Diploma in Education (ADE)
90 Teachers were enrolled in the ADE programme
+10 10 Dropped out of the programme.
50 Grade 10–12 teachers were capacitated in End-User Computing Learnership
50 Grade 10–12 teachers capacitated in End-User Computing Learnership
47 +3 Dropped out of the programme.
66 LSEN School teachers were capacitated in Sign Language
30 LSEN School teachers capacitated to teach Sign Language and Braille
35 LSEN School teachers were capacitated in TESOL
+5 The additional five were achieved within the budget.
To increase the number of qualified teachers
27 New entrants were achieved 44 Renewals were achieved
58 Bursaries to be renewed
41 Bursaries were renewed
‑17 Dropped out of the programme.
NOTE: The numbers reported under “Actual Achievement” reflect the learners who were enrolled in the learning programme during the year under review. However, training may still be ongoing.
3.11.3.4 Programme 4: Increasing access to and graduate output in Higher Education and Further Education and Training Institutions.
Strategic Objectives
Actual Achievement
2013/14
Planned Targets 2014/15
Actual Achievement
2014/15
Deviation from Planned Target
Comments on Deviation and/
or Variance
Increased student access to Higher Education and Further Education Institutions for studies responding to identified areas of scarce skills through co‑ordinated career guidance programmes
4 175 Career Guides were distributed
2 400 Career Guides to be distributed in the province
2 699 +299 Additional books were requested.
Part B: Performance Information
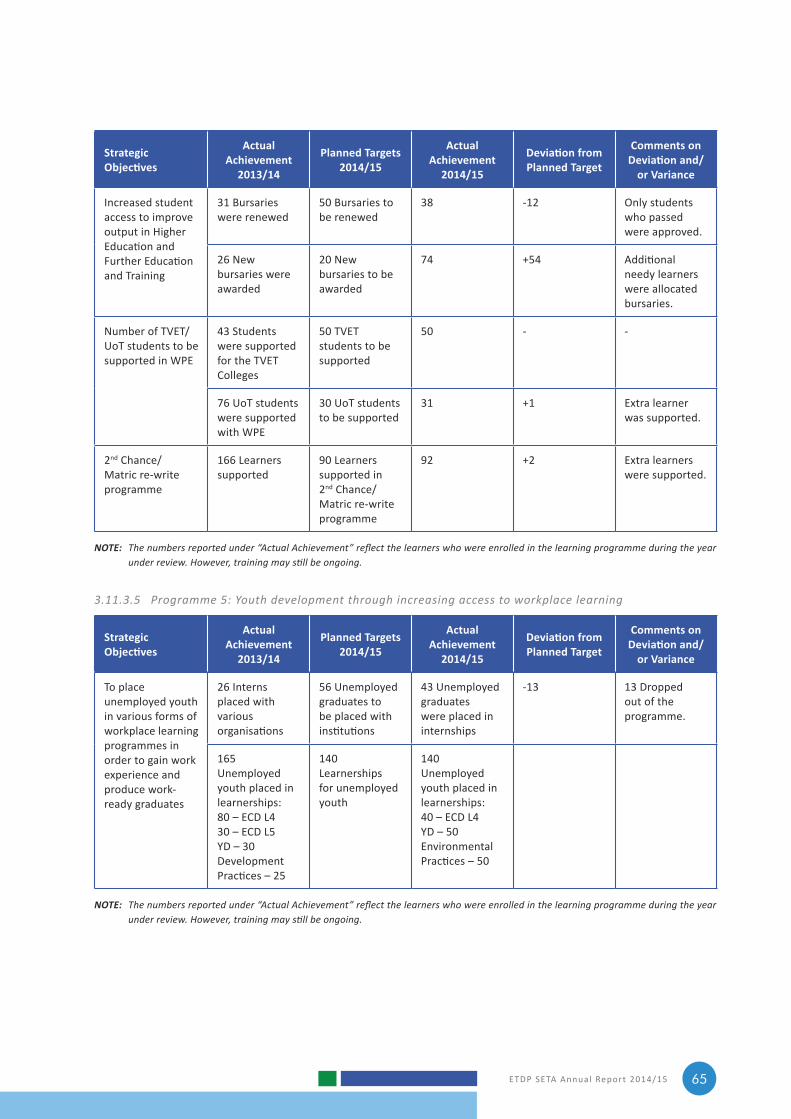
ETDP SETA Annual Report 2014/15 65
Strategic Objectives
Actual Achievement
2013/14
Planned Targets 2014/15
Actual Achievement
2014/15
Deviation from Planned Target
Comments on Deviation and/
or Variance
Increased student access to improve output in Higher Education and Further Education and Training
31 Bursaries were renewed
50 Bursaries to be renewed
38 ‑12 Only students who passed were approved.
26 New bursaries were awarded
20 New bursaries to be awarded
74 +54 Additional needy learners were allocated bursaries.
Number of TVET/UoT students to be supported in WPE
43 Students were supported for the TVET Colleges
50 TVET students to be supported
50 ‑ ‑
76 UoT students were supported with WPE
30 UoT students to be supported
31 +1 Extra learner was supported.
2nd Chance/Matric re‑write programme
166 Learners supported
90 Learners supported in 2nd Chance/Matric re‑write programme
92 +2 Extra learners were supported.
NOTE: The numbers reported under “Actual Achievement” reflect the learners who were enrolled in the learning programme during the year under review. However, training may still be ongoing.
3.11.3.5 Programme 5: Youth development through increasing access to workplace learning
Strategic Objectives
Actual Achievement
2013/14
Planned Targets 2014/15
Actual Achievement
2014/15
Deviation from Planned Target
Comments on Deviation and/
or Variance
To place unemployed youth in various forms of workplace learning programmes in order to gain work experience and produce work‑ready graduates
26 Interns placed with various organisations
56 Unemployed graduates to be placed with institutions
43 Unemployed graduates were placed in internships
‑13 13 Dropped out of the programme.
165 Unemployed youth placed in learnerships:80 – ECD L430 – ECD L5YD – 30Development Practices – 25
140 Learnerships for unemployed youth
140 Unemployed youth placed in learnerships:40 – ECD L4YD – 50Environmental Practices – 50
NOTE: The numbers reported under “Actual Achievement” reflect the learners who were enrolled in the learning programme during the year under review. However, training may still be ongoing.
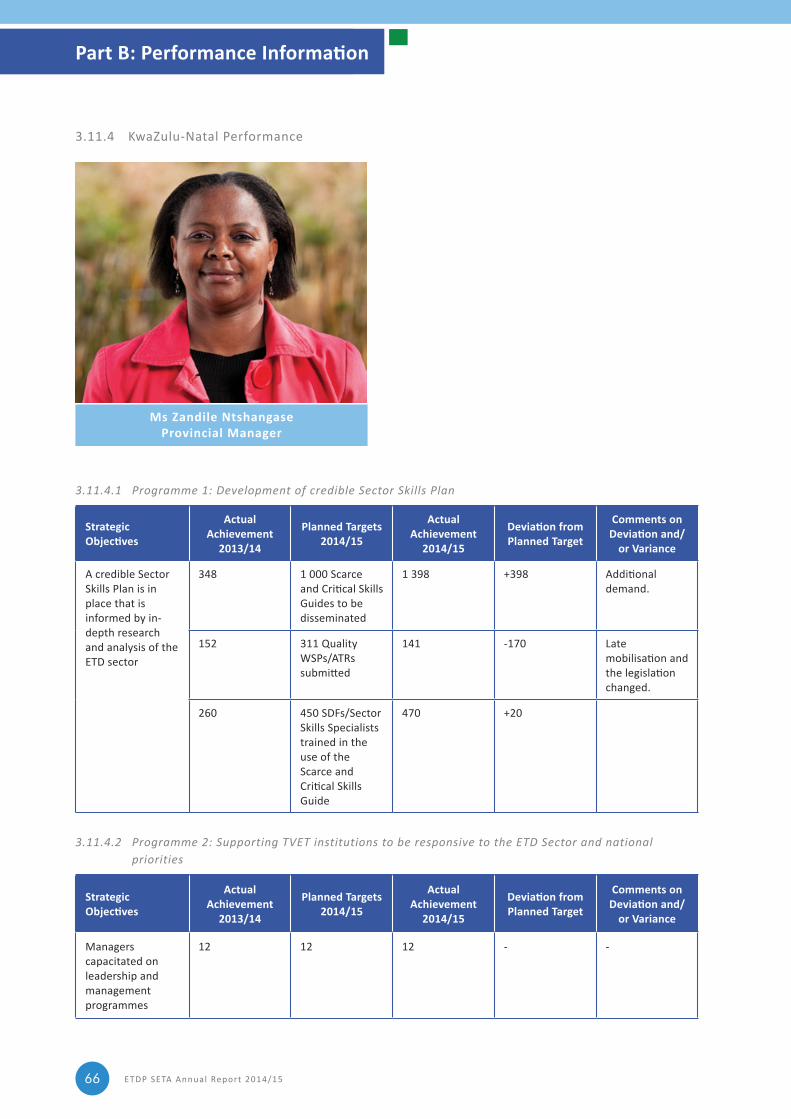
ETDP SETA Annual Report 2014/1566
3.11.4 KwaZulu‑Natal Performance
Ms Zandile NtshangaseProvincial Manager
3.11.4.1 Programme 1: Development of credible Sector Skills Plan
Strategic Objectives
Actual Achievement
2013/14
Planned Targets 2014/15
Actual Achievement
2014/15
Deviation from Planned Target
Comments on Deviation and/
or Variance
A credible Sector Skills Plan is in place that is informed by in‑depth research and analysis of the ETD sector
348 1 000 Scarce and Critical Skills Guides to be disseminated
1 398 +398 Additional demand.
152 311 Quality WSPs/ATRs submitted
141 ‑170 Late mobilisation and the legislation changed.
260 450 SDFs/Sector Skills Specialists trained in the use of the Scarce and Critical Skills Guide
470 +20
3.11.4.2 Programme 2: Supporting TVET institutions to be responsive to the ETD Sector and national priorities
Strategic Objectives
Actual Achievement
2013/14
Planned Targets 2014/15
Actual Achievement
2014/15
Deviation from Planned Target
Comments on Deviation and/
or Variance
Managers capacitated on leadership and management programmes
12 12 12 ‑ ‑
Part B: Performance Information
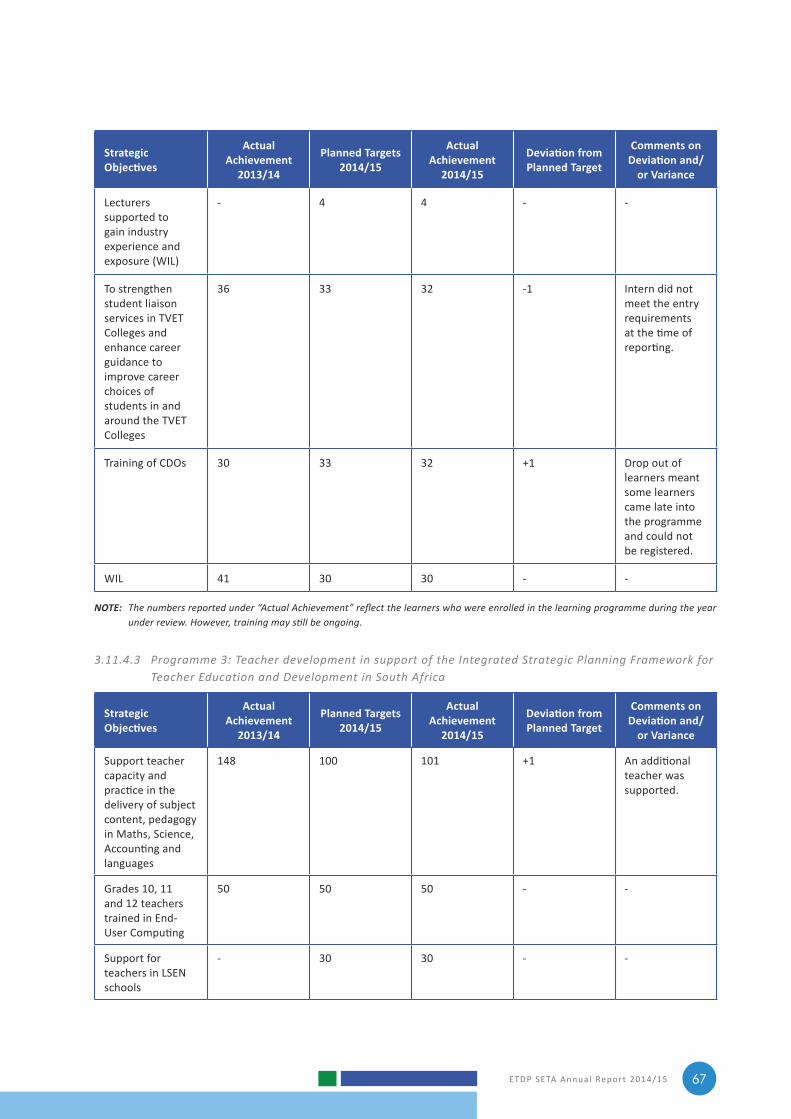
ETDP SETA Annual Report 2014/15 67
Strategic Objectives
Actual Achievement
2013/14
Planned Targets 2014/15
Actual Achievement
2014/15
Deviation from Planned Target
Comments on Deviation and/
or Variance
Lecturers supported to gain industry experience and exposure (WIL)
‑ 4 4 ‑ ‑
To strengthen student liaison services in TVET Colleges and enhance career guidance to improve career choices of students in and around the TVET Colleges
36 33 32 ‑1 Intern did not meet the entry requirements at the time of reporting.
Training of CDOs 30 33 32 +1 Drop out of learners meant some learners came late into the programme and could not be registered.
WIL 41 30 30 ‑ ‑
NOTE: The numbers reported under “Actual Achievement” reflect the learners who were enrolled in the learning programme during the year under review. However, training may still be ongoing.
3.11.4.3 Programme 3: Teacher development in support of the Integrated Strategic Planning Framework for Teacher Education and Development in South Africa
Strategic Objectives
Actual Achievement
2013/14
Planned Targets 2014/15
Actual Achievement
2014/15
Deviation from Planned Target
Comments on Deviation and/
or Variance
Support teacher capacity and practice in the delivery of subject content, pedagogy in Maths, Science, Accounting and languages
148 100 101 +1 An additional teacher was supported.
Grades 10, 11 and 12 teachers trained in End‑User Computing
50 50 50 ‑ ‑
Support for teachers in LSEN schools
‑ 30 30 ‑ ‑
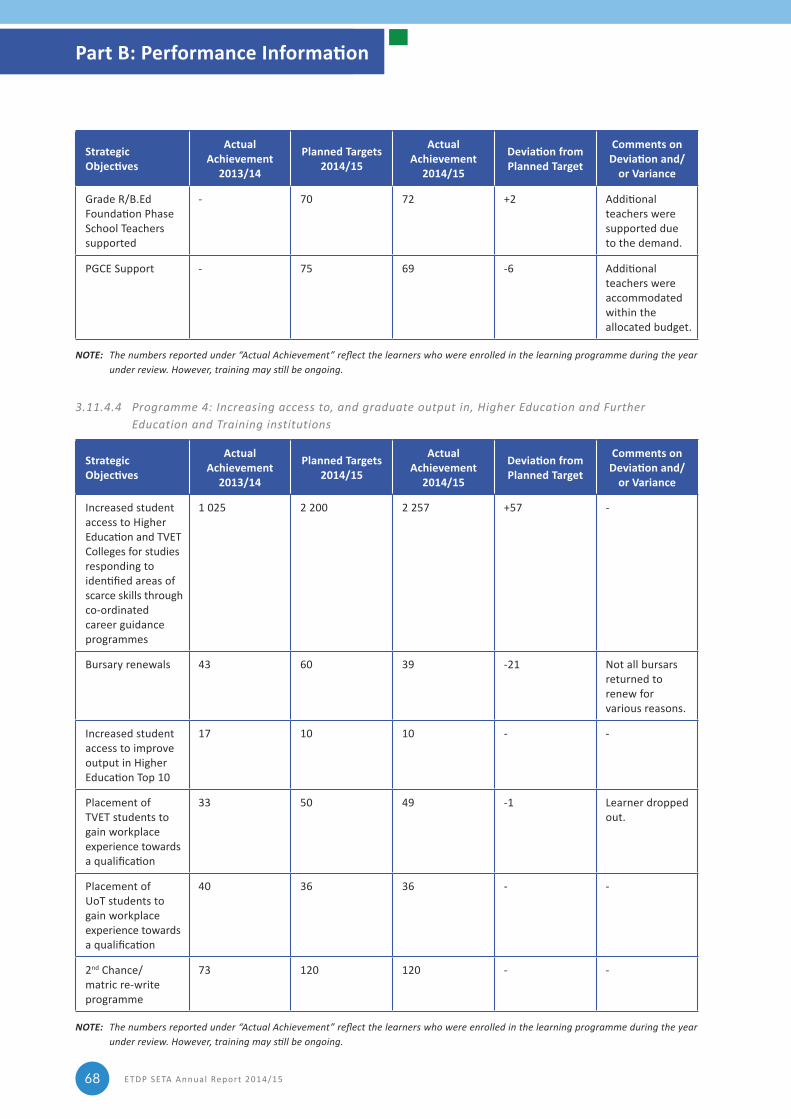
ETDP SETA Annual Report 2014/1568
Strategic Objectives
Actual Achievement
2013/14
Planned Targets 2014/15
Actual Achievement
2014/15
Deviation from Planned Target
Comments on Deviation and/
or Variance
Grade R/B.Ed Foundation Phase School Teachers supported
‑ 70 72 +2 Additional teachers were supported due to the demand.
PGCE Support ‑ 75 69 ‑6 Additional teachers were accommodated within the allocated budget.
NOTE: The numbers reported under “Actual Achievement” reflect the learners who were enrolled in the learning programme during the year under review. However, training may still be ongoing.
3.11.4.4 Programme 4: Increasing access to, and graduate output in, Higher Education and Further Education and Training institutions
Strategic Objectives
Actual Achievement
2013/14
Planned Targets 2014/15
Actual Achievement
2014/15
Deviation from Planned Target
Comments on Deviation and/
or Variance
Increased student access to Higher Education and TVET Colleges for studies responding to identified areas of scarce skills through co‑ordinated career guidance programmes
1 025 2 200 2 257 +57 ‑
Bursary renewals 43 60 39 ‑21 Not all bursars returned to renew for various reasons.
Increased student access to improve output in Higher Education Top 10
17 10 10 ‑ ‑
Placement of TVET students to gain workplace experience towards a qualification
33 50 49 ‑1 Learner dropped out.
Placement of UoT students to gain workplace experience towards a qualification
40 36 36 ‑ ‑
2nd Chance/matric re‑write programme
73 120 120 ‑ ‑
NOTE: The numbers reported under “Actual Achievement” reflect the learners who were enrolled in the learning programme during the year under review. However, training may still be ongoing.
Part B: Performance Information
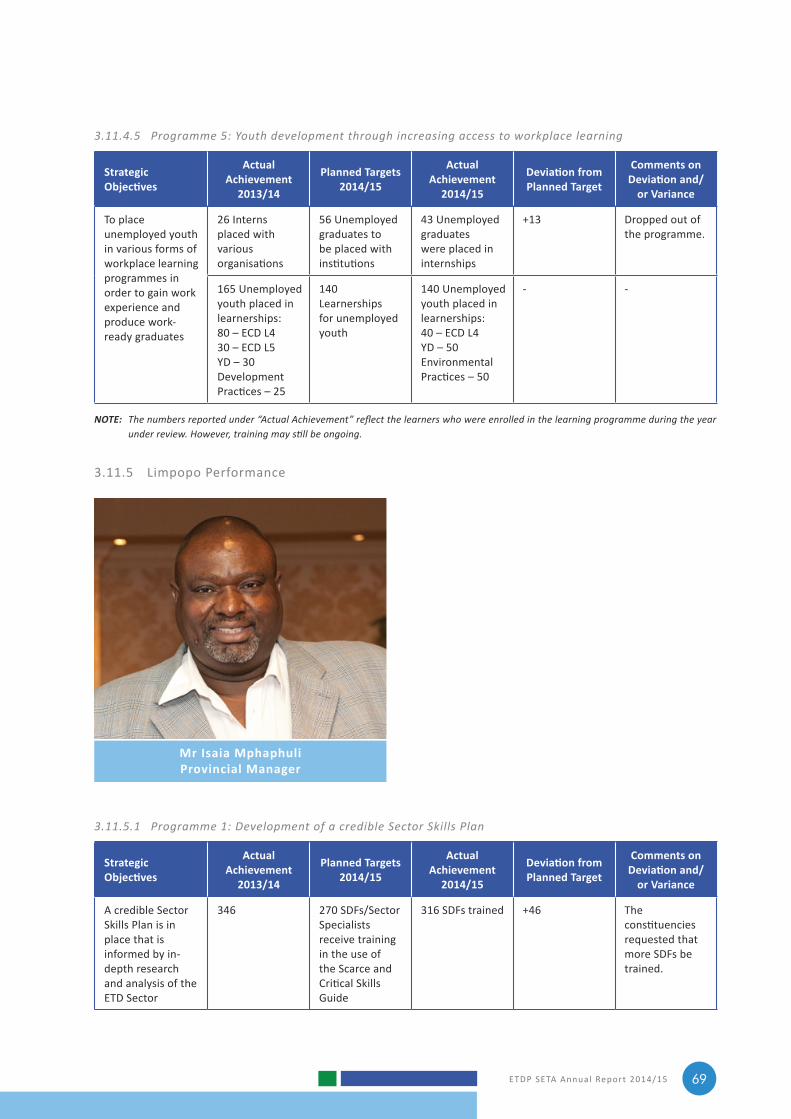
ETDP SETA Annual Report 2014/15 69
3.11.4.5 Programme 5: Youth development through increasing access to workplace learning
Strategic Objectives
Actual Achievement
2013/14
Planned Targets 2014/15
Actual Achievement
2014/15
Deviation from Planned Target
Comments on Deviation and/
or Variance
To place unemployed youth in various forms of workplace learning programmes in order to gain work experience and produce work‑ready graduates
26 Interns placed with various organisations
56 Unemployed graduates to be placed with institutions
43 Unemployed graduates were placed in internships
+13 Dropped out of the programme.
165 Unemployed youth placed in learnerships:80 – ECD L430 – ECD L5YD – 30Development Practices – 25
140 Learnerships for unemployed youth
140 Unemployed youth placed in learnerships:40 – ECD L4YD – 50Environmental Practices – 50
‑ ‑
NOTE: The numbers reported under “Actual Achievement” reflect the learners who were enrolled in the learning programme during the year under review. However, training may still be ongoing.
3.11.5 Limpopo Performance
Mr Isaia MphaphuliProvincial Manager
3.11.5.1 Programme 1: Development of a credible Sector Skills Plan
Strategic Objectives
Actual Achievement
2013/14
Planned Targets 2014/15
Actual Achievement
2014/15
Deviation from Planned Target
Comments on Deviation and/
or Variance
A credible Sector Skills Plan is in place that is informed by in‑depth research and analysis of the ETD Sector
346 270 SDFs/Sector Specialists receive training in the use of the Scarce and Critical Skills Guide
316 SDFs trained +46 The constituencies requested that more SDFs be trained.
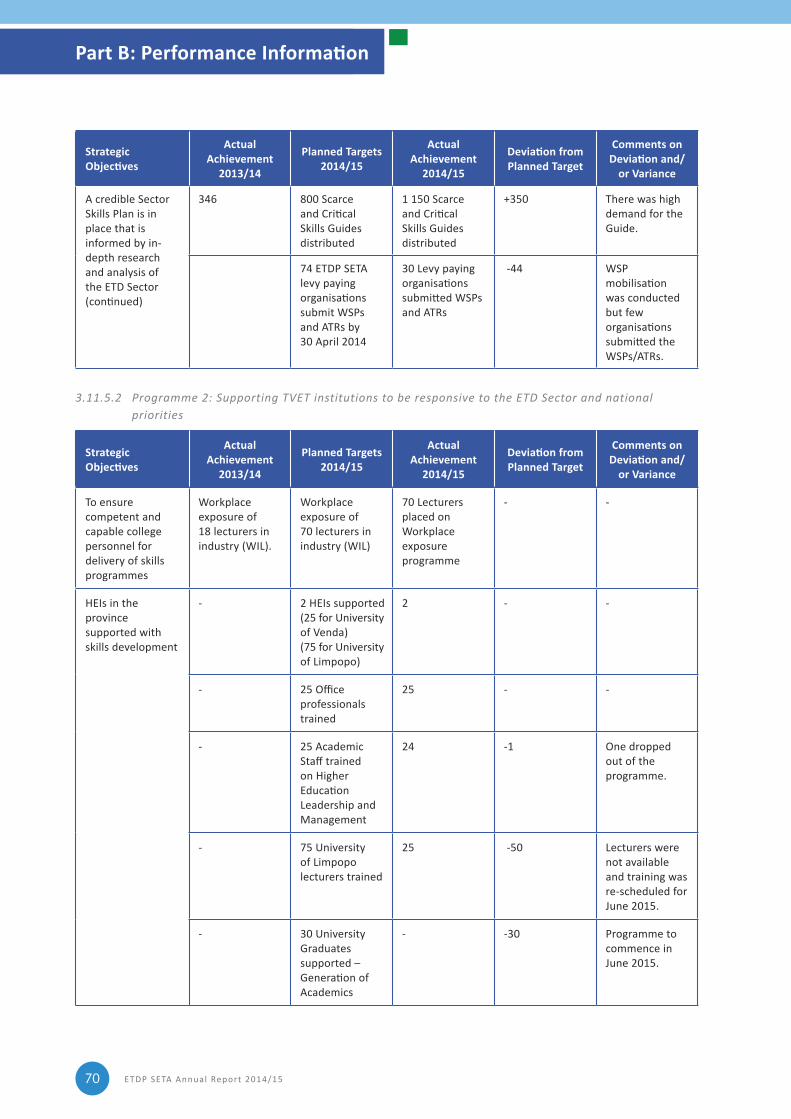
ETDP SETA Annual Report 2014/1570
Strategic Objectives
Actual Achievement
2013/14
Planned Targets 2014/15
Actual Achievement
2014/15
Deviation from Planned Target
Comments on Deviation and/
or Variance
A credible Sector Skills Plan is in place that is informed by in‑depth research and analysis of the ETD Sector (continued)
346 800 Scarce and Critical Skills Guides distributed
1 150 Scarce and Critical Skills Guides distributed
+350 There was high demand for the Guide.
74 ETDP SETA levy paying organisations submit WSPs and ATRs by 30 April 2014
30 Levy paying organisations submitted WSPs and ATRs
‑44 WSP mobilisation was conducted but few organisations submitted the WSPs/ATRs.
3.11.5.2 Programme 2: Supporting TVET institutions to be responsive to the ETD Sector and national priorities
Strategic Objectives
Actual Achievement
2013/14
Planned Targets 2014/15
Actual Achievement
2014/15
Deviation from Planned Target
Comments on Deviation and/
or Variance
To ensure competent and capable college personnel for delivery of skills programmes
Workplace exposure of 18 lecturers in industry (WIL).
Workplace exposure of 70 lecturers in industry (WIL)
70 Lecturers placed on Workplace exposure programme
‑ ‑
HEIs in the province supported with skills development
‑ 2 HEIs supported (25 for University of Venda)(75 for University of Limpopo)
2 ‑ ‑
‑ 25 Office professionals trained
25 ‑ ‑
‑ 25 Academic Staff trained on Higher Education Leadership and Management
24 ‑1 One dropped out of the programme.
‑ 75 University of Limpopo lecturers trained
25 ‑50 Lecturers were not available and training was re‑scheduled for June 2015.
‑ 30 University Graduates supported – Generation of Academics
‑ ‑30 Programme to commence in June 2015.
Part B: Performance Information
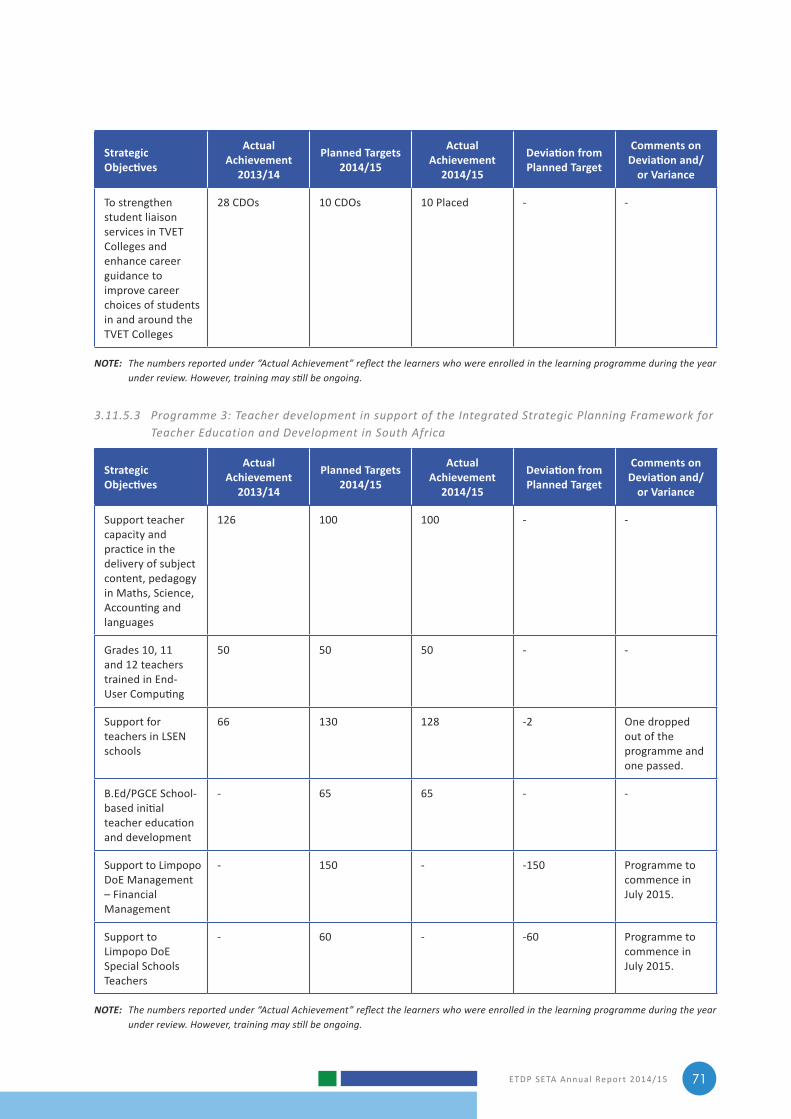
ETDP SETA Annual Report 2014/15 71
Strategic Objectives
Actual Achievement
2013/14
Planned Targets 2014/15
Actual Achievement
2014/15
Deviation from Planned Target
Comments on Deviation and/
or Variance
To strengthen student liaison services in TVET Colleges and enhance career guidance to improve career choices of students in and around the TVET Colleges
28 CDOs 10 CDOs 10 Placed ‑ ‑
NOTE: The numbers reported under “Actual Achievement” reflect the learners who were enrolled in the learning programme during the year under review. However, training may still be ongoing.
3.11.5.3 Programme 3: Teacher development in support of the Integrated Strategic Planning Framework for Teacher Education and Development in South Africa
Strategic Objectives
Actual Achievement
2013/14
Planned Targets 2014/15
Actual Achievement
2014/15
Deviation from Planned Target
Comments on Deviation and/
or Variance
Support teacher capacity and practice in the delivery of subject content, pedagogy in Maths, Science, Accounting and languages
126 100 100 ‑ ‑
Grades 10, 11 and 12 teachers trained in End‑User Computing
50 50 50 ‑ ‑
Support for teachers in LSEN schools
66 130 128 ‑2 One dropped out of the programme and one passed.
B.Ed/PGCE School‑based initial teacher education and development
‑ 65 65 ‑ ‑
Support to Limpopo DoE Management – Financial Management
‑ 150 ‑ ‑150 Programme to commence in July 2015.
Support to Limpopo DoE Special Schools Teachers
‑ 60 ‑ ‑60 Programme to commence in July 2015.
NOTE: The numbers reported under “Actual Achievement” reflect the learners who were enrolled in the learning programme during the year under review. However, training may still be ongoing.
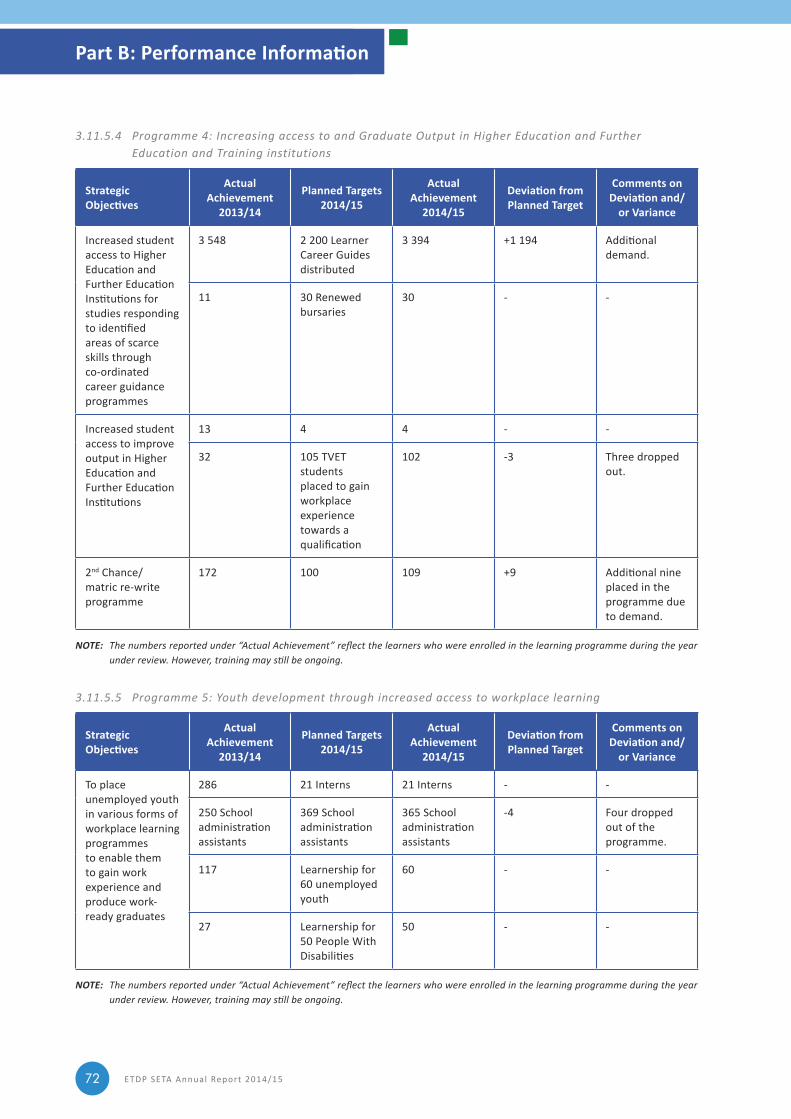
ETDP SETA Annual Report 2014/1572
3.11.5.4 Programme 4: Increasing access to and Graduate Output in Higher Education and Further Education and Training institutions
Strategic Objectives
Actual Achievement
2013/14
Planned Targets 2014/15
Actual Achievement
2014/15
Deviation from Planned Target
Comments on Deviation and/
or Variance
Increased student access to Higher Education and Further Education Institutions for studies responding to identified areas of scarce skills through co‑ordinated career guidance programmes
3 548 2 200 Learner Career Guides distributed
3 394 +1 194 Additional demand.
11 30 Renewed bursaries
30 ‑ ‑
Increased student access to improve output in Higher Education and Further Education Institutions
13 4 4 ‑ ‑
32 105 TVET students placed to gain workplace experience towards a qualification
102 ‑3 Three dropped out.
2nd Chance/matric re‑write programme
172 100 109 +9 Additional nine placed in the programme due to demand.
NOTE: The numbers reported under “Actual Achievement” reflect the learners who were enrolled in the learning programme during the year under review. However, training may still be ongoing.
3.11.5.5 Programme 5: Youth development through increased access to workplace learning
Strategic Objectives
Actual Achievement
2013/14
Planned Targets 2014/15
Actual Achievement
2014/15
Deviation from Planned Target
Comments on Deviation and/
or Variance
To place unemployed youth in various forms of workplace learning programmes to enable them to gain work experience and produce work‑ ready graduates
286 21 Interns 21 Interns ‑ ‑
250 School administration assistants
369 School administration assistants
365 School administration assistants
‑4 Four dropped out of the programme.
117 Learnership for 60 unemployed youth
60 ‑ ‑
27 Learnership for 50 People With Disabilities
50 ‑ ‑
NOTE: The numbers reported under “Actual Achievement” reflect the learners who were enrolled in the learning programme during the year under review. However, training may still be ongoing.
Part B: Performance Information
ETDP SETA Annual Report 2014/15 73
3.11.5.6 Programme 6: ETDP SETA Constituency Support and Development
Strategic Objectives
Actual Achievement
2013/14
Planned Targets 2014/15
Actual Achievement
2014/15
Deviation from Planned Target
Comments on Deviation and/
or Variance
To support ETDP SETA Constituencies through skills development programmes
‑ 30 NLPE beneficiaries supported
30 ‑ ‑
‑ 32 SGBs supported
30 ‑2 Two learners dropped out of the programme.
NOTE: The numbers reported under “Actual Achievement” reflect the learners who were enrolled in the learning programme during the year under review. However, training may still be ongoing.
3.11.6 Mpumalanga Performance
Ms Ntombi MxengeProvincial Manager
3.11.6.1 Programme 1: Development of a credible Sector Skills Plan
Strategic Objectives
Actual Achievement
2013/14
Planned Targets 2014/15
Actual Achievement
2014/15
Deviation from Planned Target
Comments on Deviation and/
or Variance
A credible Sector Skills Plan is in place that is informed by in‑depth research and analysis of the ETD sector
239 800 Scarce and Critical Skills Guides disseminated
804 ‑ ‑
34 38 Quality WSPs/ATRs submitted
36 ‑1 Two constituencies did not submit their WSPs/ATRs
183 280 SDFs/Sector Skills Specialists trained in the use of the Scarce and Critical Skills Guide
284 +4 4 Additional SDFs attended the training.
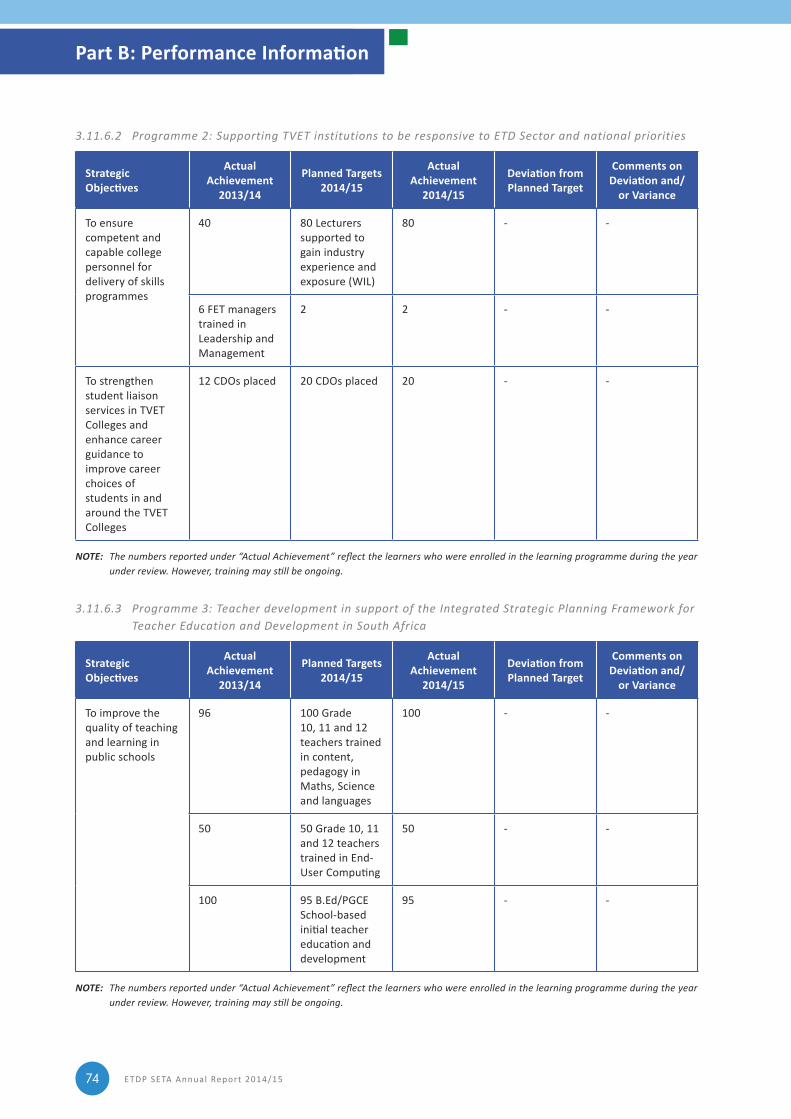
ETDP SETA Annual Report 2014/1574
3.11.6.2 Programme 2: Supporting TVET institutions to be responsive to ETD Sector and national priorities
Strategic Objectives
Actual Achievement
2013/14
Planned Targets 2014/15
Actual Achievement
2014/15
Deviation from Planned Target
Comments on Deviation and/
or Variance
To ensure competent and capable college personnel for delivery of skills programmes
40 80 Lecturers supported to gain industry experience and exposure (WIL)
80 ‑ ‑
6 FET managers trained in Leadership and Management
2 2 ‑ ‑
To strengthen student liaison services in TVET Colleges and enhance career guidance to improve career choices of students in and around the TVET Colleges
12 CDOs placed 20 CDOs placed 20 ‑ ‑
NOTE: The numbers reported under “Actual Achievement” reflect the learners who were enrolled in the learning programme during the year under review. However, training may still be ongoing.
3.11.6.3 Programme 3: Teacher development in support of the Integrated Strategic Planning Framework for Teacher Education and Development in South Africa
Strategic Objectives
Actual Achievement
2013/14
Planned Targets 2014/15
Actual Achievement
2014/15
Deviation from Planned Target
Comments on Deviation and/
or Variance
To improve the quality of teaching and learning in public schools
96 100 Grade 10, 11 and 12 teachers trained in content, pedagogy in Maths, Science and languages
100 ‑ ‑
50 50 Grade 10, 11 and 12 teachers trained in End‑User Computing
50 ‑ ‑
100 95 B.Ed/PGCE School‑based initial teacher education and development
95 ‑ ‑
NOTE: The numbers reported under “Actual Achievement” reflect the learners who were enrolled in the learning programme during the year under review. However, training may still be ongoing.
Part B: Performance Information
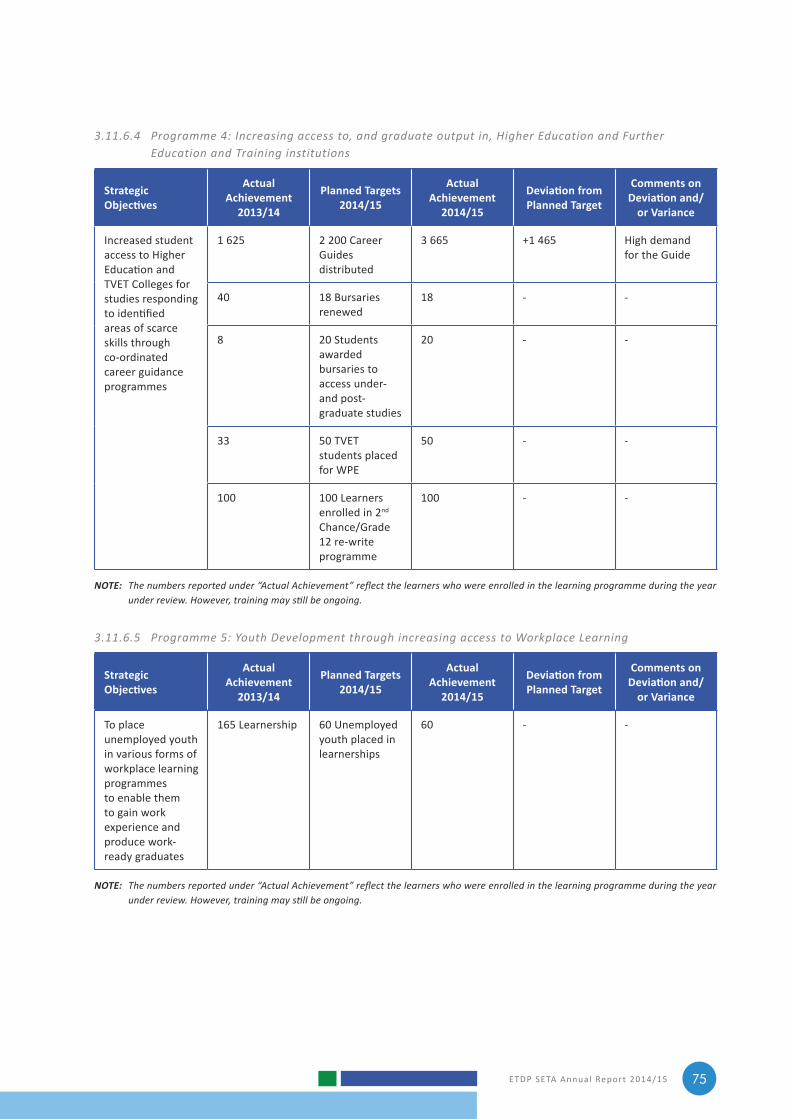
ETDP SETA Annual Report 2014/15 75
3.11.6.4 Programme 4: Increasing access to, and graduate output in, Higher Education and Further Education and Training institutions
Strategic Objectives
Actual Achievement
2013/14
Planned Targets 2014/15
Actual Achievement
2014/15
Deviation from Planned Target
Comments on Deviation and/
or Variance
Increased student access to Higher Education and TVET Colleges for studies responding to identified areas of scarce skills through co‑ordinated career guidance programmes
1 625 2 200 Career Guides distributed
3 665 +1 465 High demand for the Guide
40 18 Bursaries renewed
18 ‑ ‑
8 20 Students awarded bursaries to access under‑ and post‑graduate studies
20 ‑ ‑
33 50 TVET students placed for WPE
50 ‑ ‑
100 100 Learners enrolled in 2nd Chance/Grade 12 re‑write programme
100 ‑ ‑
NOTE: The numbers reported under “Actual Achievement” reflect the learners who were enrolled in the learning programme during the year under review. However, training may still be ongoing.
3.11.6.5 Programme 5: Youth Development through increasing access to Workplace Learning
Strategic Objectives
Actual Achievement
2013/14
Planned Targets 2014/15
Actual Achievement
2014/15
Deviation from Planned Target
Comments on Deviation and/
or Variance
To place unemployed youth in various forms of workplace learning programmes to enable them to gain work experience and produce work‑ ready graduates
165 Learnership 60 Unemployed youth placed in learnerships
60 ‑ ‑
NOTE: The numbers reported under “Actual Achievement” reflect the learners who were enrolled in the learning programme during the year under review. However, training may still be ongoing.
ETDP SETA Annual Report 2014/1576
3.11.7 Northern Cape Performance
Mr Rama KistiahProvincial Manager
3.11.7.1 Programme 1: Development of a credible Sector Skills Plan
Strategic Objectives
Actual Achievement
2013/14
Planned Targets 2014/15
Actual Achievement
2014/15
Deviation from Planned Target
Comments on Deviation and/
or Variance
To improve the submission of the Workplace Skills Plans; Annual Training reports; PIVOTAL plans and reports by both levy paying and non‑levy paying organisations
107 200 SDFs capacitated
177 ‑23 Fewer participants attended than planned.
800 Scarce and Critical Skills Guides distributed
817 +17 Demand was higher than target.
3.11.7.2 Programme 2: Supporting TVET institutions to be responsive to ETD Sector and national priorities
Strategic Objectives
Actual Achievement
2013/14
Planned Targets 2014/15
Actual Achievement
2014/15
Deviation from Planned Target
Comments on Deviation and/
or Variance
TVET lecturers supported to gain industry exposure (WIL)
30 20 TVET lecturers supported to gain industry exposure (WIL)
19 ‑1 Learner dropped out.
Support for HEIs for lecturer development – beneficiaries
‑ 1 HEI supported 1 ‑ ‑
NOTE: The numbers reported under “Actual Achievement” reflect the learners who were enrolled in the learning programme during the year under review. However, training may still be ongoing.
Part B: Performance Information
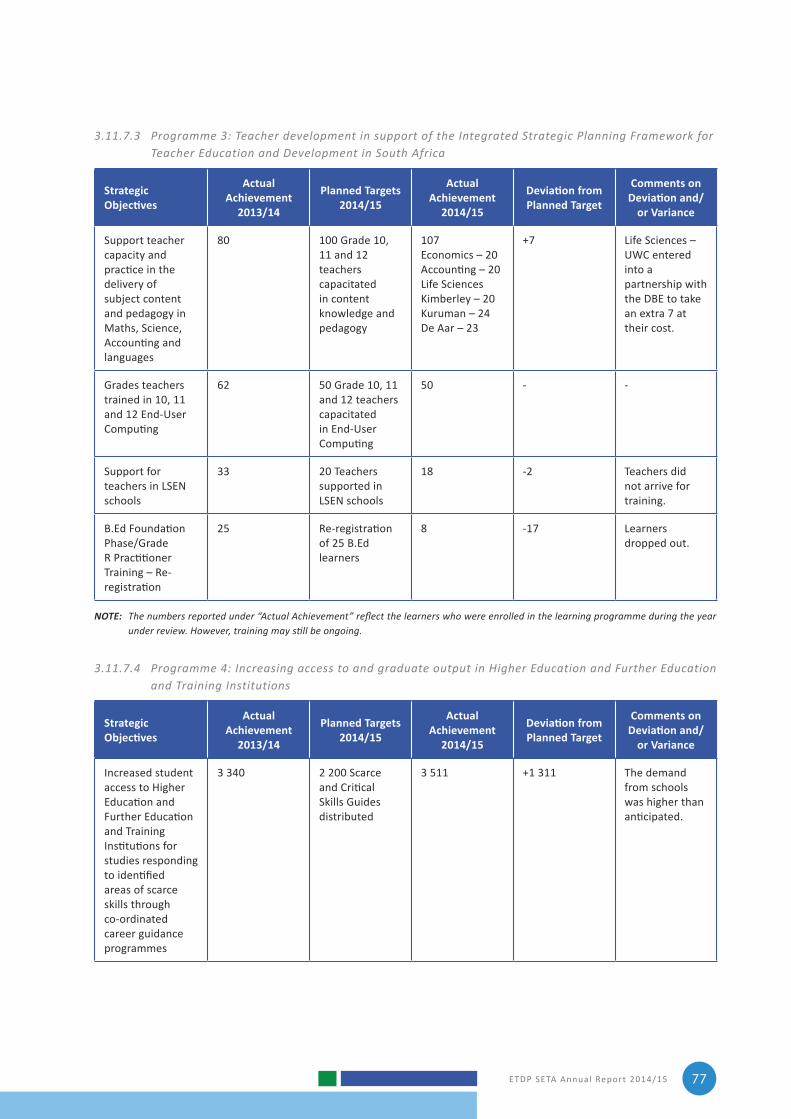
ETDP SETA Annual Report 2014/15 77
3.11.7.3 Programme 3: Teacher development in support of the Integrated Strategic Planning Framework for Teacher Education and Development in South Africa
Strategic Objectives
Actual Achievement
2013/14
Planned Targets 2014/15
Actual Achievement
2014/15
Deviation from Planned Target
Comments on Deviation and/
or Variance
Support teacher capacity and practice in the delivery of subject content and pedagogy in Maths, Science, Accounting and languages
80 100 Grade 10, 11 and 12 teachers capacitated in content knowledge and pedagogy
107Economics – 20Accounting – 20Life SciencesKimberley – 20Kuruman – 24De Aar – 23
+7 Life Sciences – UWC entered into a partnership with the DBE to take an extra 7 at their cost.
Grades teachers trained in 10, 11 and 12 End-User Computing
62 50 Grade 10, 11 and 12 teachers capacitated in End-User Computing
50 ‑ ‑
Support for teachers in LSEN schools
33 20 Teachers supported in LSEN schools
18 ‑2 Teachers did not arrive for training.
B.Ed Foundation Phase/Grade R Practitioner Training – Re-registration
25 Re-registration of 25 B.Ed learners
8 ‑17 Learners dropped out.
NOTE: The numbers reported under “Actual Achievement” reflect the learners who were enrolled in the learning programme during the year under review. However, training may still be ongoing.
3.11.7.4 Programme 4: Increasing access to and graduate output in Higher Education and Further Education and Training Institutions
Strategic Objectives
Actual Achievement
2013/14
Planned Targets 2014/15
Actual Achievement
2014/15
Deviation from Planned Target
Comments on Deviation and/
or Variance
Increased student access to Higher Education and Further Education and Training Institutions for studies responding to identified areas of scarce skills through co‑ordinated career guidance programmes
3 340 2 200 Scarce and Critical Skills Guides distributed
3 511 +1 311 The demand from schools was higher than anticipated.
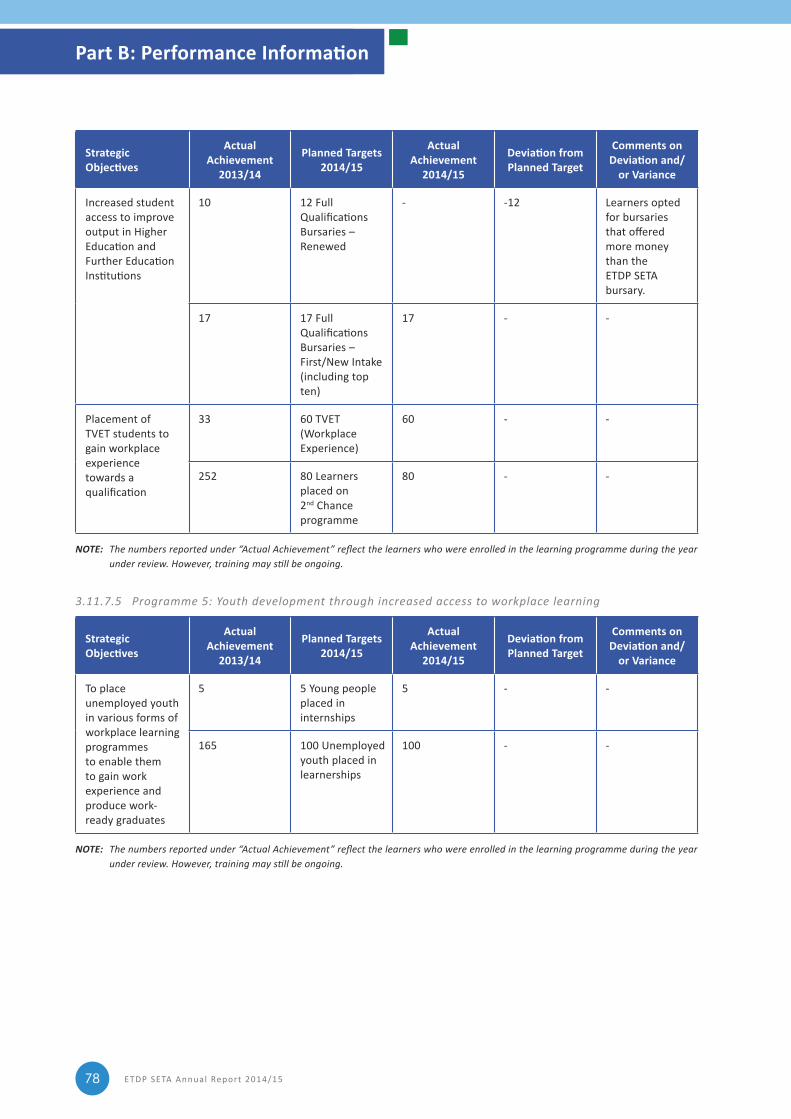
ETDP SETA Annual Report 2014/1578
Strategic Objectives
Actual Achievement
2013/14
Planned Targets 2014/15
Actual Achievement
2014/15
Deviation from Planned Target
Comments on Deviation and/
or Variance
Increased student access to improve output in Higher Education and Further Education Institutions
10 12 Full Qualifications Bursaries – Renewed
‑ ‑12 Learners opted for bursaries that offered more money than the ETDP SETA bursary.
17 17 Full Qualifications Bursaries – First/New Intake (including top ten)
17 ‑ ‑
Placement of TVET students to gain workplace experience towards a qualification
33 60 TVET (Workplace Experience)
60 ‑ ‑
252 80 Learners placed on 2nd Chance programme
80 ‑ ‑
NOTE: The numbers reported under “Actual Achievement” reflect the learners who were enrolled in the learning programme during the year under review. However, training may still be ongoing.
3.11.7.5 Programme 5: Youth development through increased access to workplace learning
Strategic Objectives
Actual Achievement
2013/14
Planned Targets 2014/15
Actual Achievement
2014/15
Deviation from Planned Target
Comments on Deviation and/
or Variance
To place unemployed youth in various forms of workplace learning programmes to enable them to gain work experience and produce work‑ready graduates
5 5 Young people placed in internships
5 ‑ ‑
165 100 Unemployed youth placed in learnerships
100 ‑ ‑
NOTE: The numbers reported under “Actual Achievement” reflect the learners who were enrolled in the learning programme during the year under review. However, training may still be ongoing.
Part B: Performance Information
ETDP SETA Annual Report 2014/15 79
3.11.8 North West Performance
Ms Sibongile NhlabathiActing Provincial Manager
3.11.8.1 Programme 1: Development of a credible ETD Sector Skills Plans
Strategic Objectives
Actual Achievement
2013/14
Planned Targets 2014/15
Actual Achievement
2014/15
Deviation from Planned Target
Comments on Deviation and/
or Variance
Dissemination of the Scarce and Critical Skills Guide
380 Guides were distributed
800 Guides are distributed
800 Guides were distributed
‑ ‑
Training of SDFs/Sector Specialists/LO teachers on use of the Scarce and Critical Skills Guide
204 SDFs and Sector Specialists were trained
270 SDFs/Sector Specialists are trained in the use of the guide
270 SDFs and Sector Specialists were trained
‑ ‑
Mobilisation of employers to increase the submission of WSPs/ATRs
49 Employers submitted WSPs/ATRs
50 Employers are mobilised to submit WSPs/ATRs
49 ‑1 The employer did not submit.
3.11.8.2 Programme 2: Supporting TVET institutions to be responsive to the ETD sector and national priorities
Strategic Objectives
Actual Achievement
2013/14
Planned Targets 2014/15
Actual Achievement
2014/15
Deviation from Planned Target
Comments on Deviation and/
or Variance
TVET Senior Management Personnel are supported in the 2nd year of their Master of Public Administration (MPA) studies
19 Managers were supported to register for MPA
19 Managers supported to register for the 2nd and final of MPA
12 Managers were supported to register for MPA
‑7 Five are still in the first year of the MPA and two resigned and dropped out of the course.
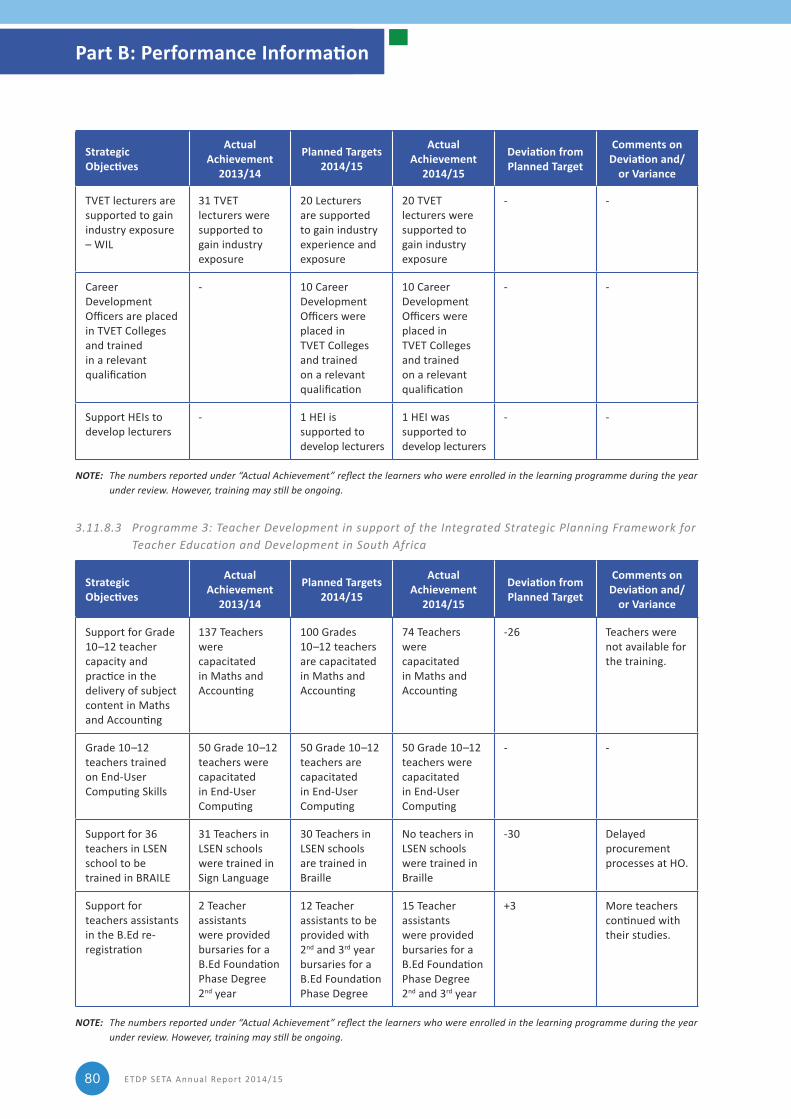
ETDP SETA Annual Report 2014/1580
Strategic Objectives
Actual Achievement
2013/14
Planned Targets 2014/15
Actual Achievement
2014/15
Deviation from Planned Target
Comments on Deviation and/
or Variance
TVET lecturers are supported to gain industry exposure – WIL
31 TVET lecturers were supported to gain industry exposure
20 Lecturers are supported to gain industry experience and exposure
20 TVET lecturers were supported to gain industry exposure
‑ ‑
Career Development Officers are placed in TVET Colleges and trained in a relevant qualification
‑ 10 Career Development Officers were placed in TVET Colleges and trained on a relevant qualification
10 Career Development Officers were placed in TVET Colleges and trained on a relevant qualification
‑ ‑
Support HEIs to develop lecturers
‑ 1 HEI is supported to develop lecturers
1 HEI was supported to develop lecturers
‑ ‑
NOTE: The numbers reported under “Actual Achievement” reflect the learners who were enrolled in the learning programme during the year under review. However, training may still be ongoing.
3.11.8.3 Programme 3: Teacher Development in support of the Integrated Strategic Planning Framework for Teacher Education and Development in South Africa
Strategic Objectives
Actual Achievement
2013/14
Planned Targets 2014/15
Actual Achievement
2014/15
Deviation from Planned Target
Comments on Deviation and/
or Variance
Support for Grade 10–12 teacher capacity and practice in the delivery of subject content in Maths and Accounting
137 Teachers were capacitated in Maths and Accounting
100 Grades 10–12 teachers are capacitated in Maths and Accounting
74 Teachers were capacitated in Maths and Accounting
‑26 Teachers were not available for the training.
Grade 10–12 teachers trained on End-User Computing Skills
50 Grade 10–12 teachers were capacitated in End-User Computing
50 Grade 10–12 teachers are capacitated in End-User Computing
50 Grade 10–12 teachers were capacitated in End-User Computing
‑ ‑
Support for 36 teachers in LSEN school to be trained in BRAILE
31 Teachers in LSEN schools were trained in Sign Language
30 Teachers in LSEN schools are trained in Braille
No teachers in LSEN schools were trained in Braille
‑30 Delayed procurement processes at HO.
Support for teachers assistants in the B.Ed re‑registration
2 Teacher assistants were provided bursaries for a B.Ed Foundation Phase Degree 2nd year
12 Teacher assistants to be provided with 2nd and 3rd year bursaries for a B.Ed Foundation Phase Degree
15 Teacher assistants were provided bursaries for a B.Ed Foundation Phase Degree 2nd and 3rd year
+3 More teachers continued with their studies.
NOTE: The numbers reported under “Actual Achievement” reflect the learners who were enrolled in the learning programme during the year under review. However, training may still be ongoing.
Part B: Performance Information
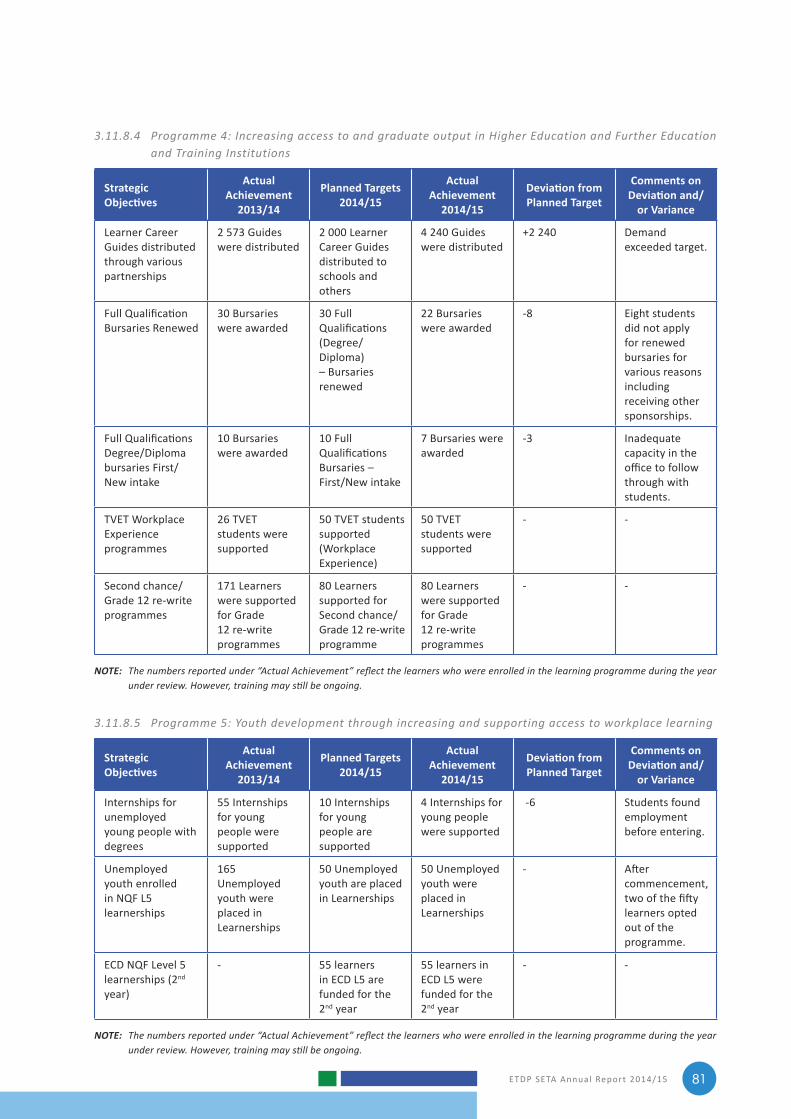
ETDP SETA Annual Report 2014/15 81
3.11.8.4 Programme 4: Increasing access to and graduate output in Higher Education and Further Education and Training Institutions
Strategic Objectives
Actual Achievement
2013/14
Planned Targets 2014/15
Actual Achievement
2014/15
Deviation from Planned Target
Comments on Deviation and/
or Variance
Learner Career Guides distributed through various partnerships
2 573 Guides were distributed
2 000 Learner Career Guides distributed to schools and others
4 240 Guides were distributed
+2 240 Demand exceeded target.
Full Qualification Bursaries Renewed
30 Bursaries were awarded
30 Full Qualifications (Degree/Diploma) – Bursaries renewed
22 Bursaries were awarded
‑8 Eight students did not apply for renewed bursaries for various reasons including receiving other sponsorships.
Full Qualifications Degree/Diploma bursaries First/New intake
10 Bursaries were awarded
10 Full Qualifications Bursaries – First/New intake
7 Bursaries were awarded
‑3 Inadequate capacity in the office to follow through with students.
TVET Workplace Experience programmes
26 TVET students were supported
50 TVET students supported (Workplace Experience)
50 TVET students were supported
‑ ‑
Second chance/Grade 12 re‑write programmes
171 Learners were supported for Grade 12 re‑write programmes
80 Learners supported for Second chance/Grade 12 re‑write programme
80 Learners were supported for Grade 12 re‑write programmes
‑ ‑
NOTE: The numbers reported under “Actual Achievement” reflect the learners who were enrolled in the learning programme during the year under review. However, training may still be ongoing.
3.11.8.5 Programme 5: Youth development through increasing and supporting access to workplace learning
Strategic Objectives
Actual Achievement
2013/14
Planned Targets 2014/15
Actual Achievement
2014/15
Deviation from Planned Target
Comments on Deviation and/
or Variance
Internships for unemployed young people with degrees
55 Internships for young people were supported
10 Internships for young people are supported
4 Internships for young people were supported
‑6 Students found employment before entering.
Unemployed youth enrolled in NQF L5 learnerships
165 Unemployed youth were placed in Learnerships
50 Unemployed youth are placed in Learnerships
50 Unemployed youth were placed in Learnerships
‑ After commencement, two of the fifty learners opted out of the programme.
ECD NQF Level 5 learnerships (2nd year)
‑ 55 learners in ECD L5 are funded for the 2nd year
55 learners in ECD L5 were funded for the 2nd year
‑ ‑
NOTE: The numbers reported under “Actual Achievement” reflect the learners who were enrolled in the learning programme during the year under review. However, training may still be ongoing.
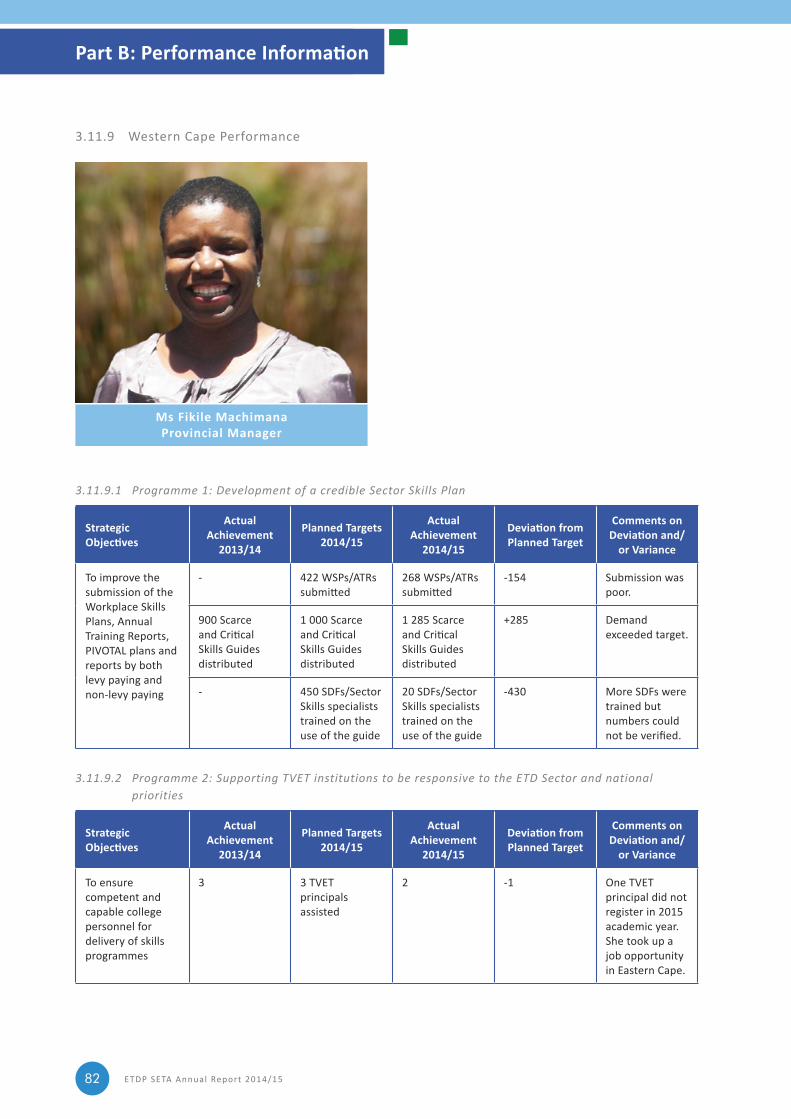
ETDP SETA Annual Report 2014/1582
3.11.9 Western Cape Performance
Ms Fikile MachimanaProvincial Manager
3.11.9.1 Programme 1: Development of a credible Sector Skills Plan
Strategic Objectives
Actual Achievement
2013/14
Planned Targets 2014/15
Actual Achievement
2014/15
Deviation from Planned Target
Comments on Deviation and/
or Variance
To improve the submission of the Workplace Skills Plans, Annual Training Reports, PIVOTAL plans and reports by both levy paying and non‑levy paying
‑ 422 WSPs/ATRs submitted
268 WSPs/ATRs submitted
‑154 Submission was poor.
900 Scarce and Critical Skills Guides distributed
1 000 Scarce and Critical Skills Guides distributed
1 285 Scarce and Critical Skills Guides distributed
+285 Demand exceeded target.
‑ 450 SDFs/Sector Skills specialists trained on the use of the guide
20 SDFs/Sector Skills specialists trained on the use of the guide
‑430 More SDFs were trained but numbers could not be verified.
3.11.9.2 Programme 2: Supporting TVET institutions to be responsive to the ETD Sector and national priorities
Strategic Objectives
Actual Achievement
2013/14
Planned Targets 2014/15
Actual Achievement
2014/15
Deviation from Planned Target
Comments on Deviation and/
or Variance
To ensure competent and capable college personnel for delivery of skills programmes
3 3 TVET principals assisted
2 ‑1 One TVET principal did not register in 2015 academic year. She took up a job opportunity in Eastern Cape.
Part B: Performance Information
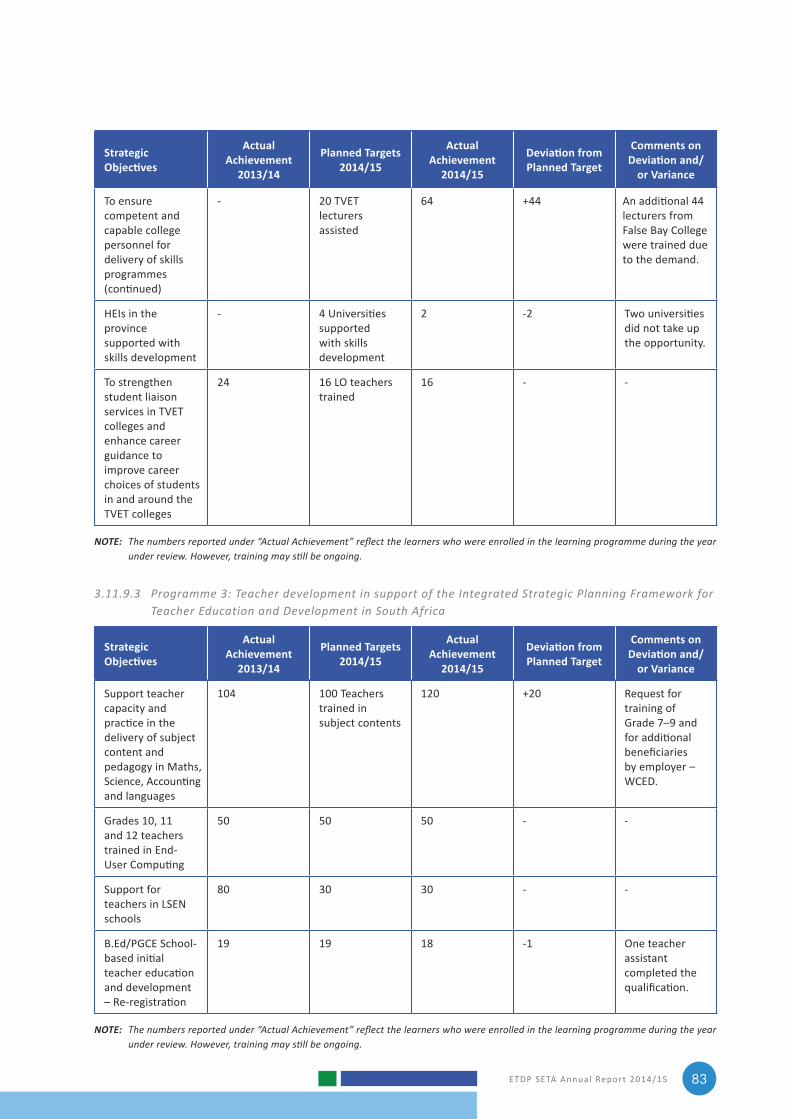
ETDP SETA Annual Report 2014/15 83
Strategic Objectives
Actual Achievement
2013/14
Planned Targets 2014/15
Actual Achievement
2014/15
Deviation from Planned Target
Comments on Deviation and/
or Variance
To ensure competent and capable college personnel for delivery of skills programmes (continued)
‑ 20 TVET lecturers assisted
64 +44 An additional 44 lecturers from False Bay College were trained due to the demand.
HEIs in the province supported with skills development
‑ 4 Universities supported with skills development
2 ‑2 Two universities did not take up the opportunity.
To strengthen student liaison services in TVET colleges and enhance career guidance to improve career choices of students in and around the TVET colleges
24 16 LO teachers trained
16 ‑ ‑
NOTE: The numbers reported under “Actual Achievement” reflect the learners who were enrolled in the learning programme during the year under review. However, training may still be ongoing.
3.11.9.3 Programme 3: Teacher development in support of the Integrated Strategic Planning Framework for Teacher Education and Development in South Africa
Strategic Objectives
Actual Achievement
2013/14
Planned Targets 2014/15
Actual Achievement
2014/15
Deviation from Planned Target
Comments on Deviation and/
or Variance
Support teacher capacity and practice in the delivery of subject content and pedagogy in Maths, Science, Accounting and languages
104 100 Teachers trained in subject contents
120 +20 Request for training of Grade 7–9 and for additional beneficiaries by employer – WCED.
Grades 10, 11 and 12 teachers trained in End‑User Computing
50 50 50 ‑ ‑
Support for teachers in LSEN schools
80 30 30 ‑ ‑
B.Ed/PGCE School‑based initial teacher education and development – Re-registration
19 19 18 ‑1 One teacher assistant completed the qualification.
NOTE: The numbers reported under “Actual Achievement” reflect the learners who were enrolled in the learning programme during the year under review. However, training may still be ongoing.
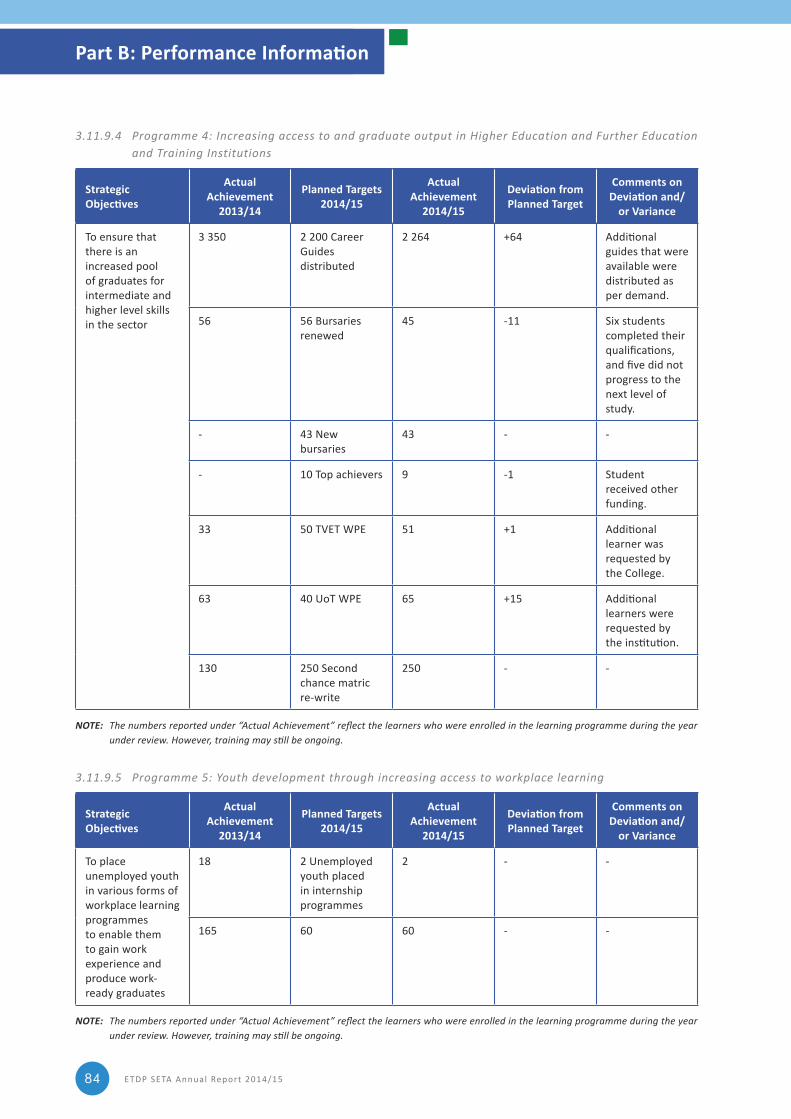
ETDP SETA Annual Report 2014/1584
3.11.9.4 Programme 4: Increasing access to and graduate output in Higher Education and Further Education and Training Institutions
Strategic Objectives
Actual Achievement
2013/14
Planned Targets 2014/15
Actual Achievement
2014/15
Deviation from Planned Target
Comments on Deviation and/
or Variance
To ensure that there is an increased pool of graduates for intermediate and higher level skills in the sector
3 350 2 200 Career Guides distributed
2 264 +64 Additional guides that were available were distributed as per demand.
56 56 Bursaries renewed
45 ‑11 Six students completed their qualifications, and five did not progress to the next level of study.
‑ 43 New bursaries
43 ‑ ‑
‑ 10 Top achievers 9 ‑1 Student received other funding.
33 50 TVET WPE 51 +1 Additional learner was requested by the College.
63 40 UoT WPE 65 +15 Additional learners were requested by the institution.
130 250 Second chance matric re‑write
250 ‑ ‑
NOTE: The numbers reported under “Actual Achievement” reflect the learners who were enrolled in the learning programme during the year under review. However, training may still be ongoing.
3.11.9.5 Programme 5: Youth development through increasing access to workplace learning
Strategic Objectives
Actual Achievement
2013/14
Planned Targets 2014/15
Actual Achievement
2014/15
Deviation from Planned Target
Comments on Deviation and/
or Variance
To place unemployed youth in various forms of workplace learning programmes to enable them to gain work experience and produce work‑ ready graduates
18 2 Unemployed youth placed in internship programmes
2 ‑ ‑
165 60 60 ‑ ‑
NOTE: The numbers reported under “Actual Achievement” reflect the learners who were enrolled in the learning programme during the year under review. However, training may still be ongoing.
Part B: Performance Information
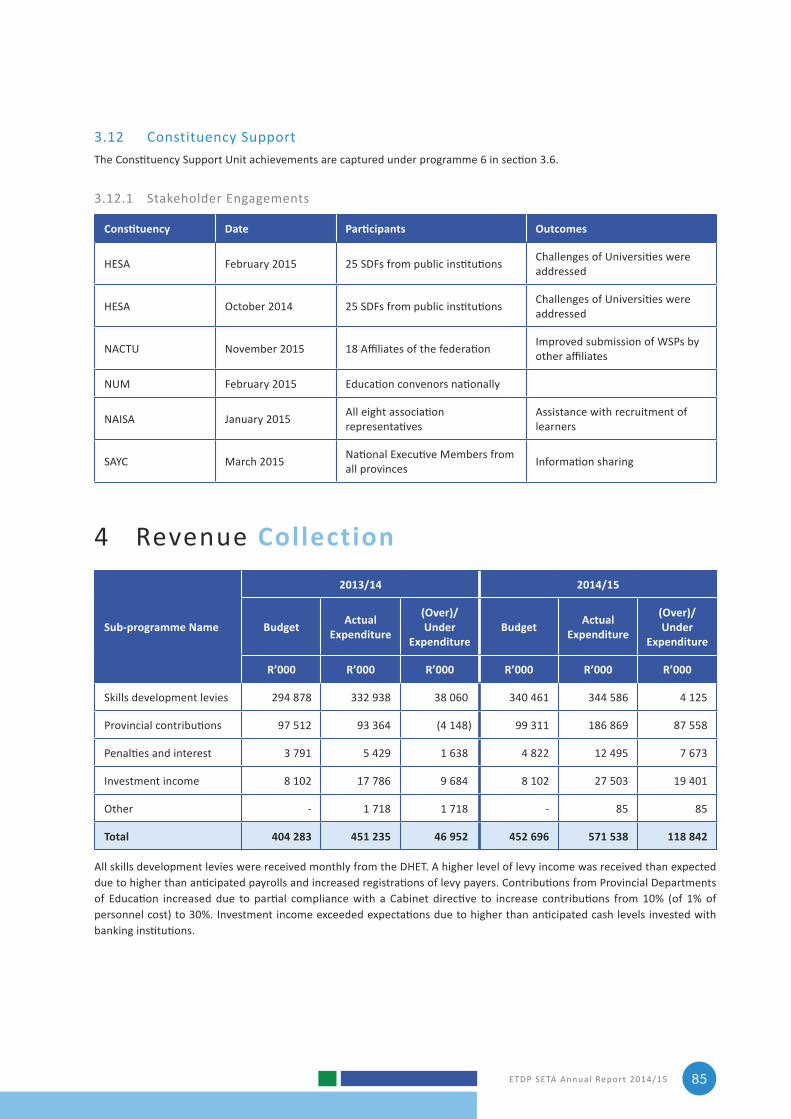
ETDP SETA Annual Report 2014/15 85
3.12 Constituency SupportThe Constituency Support Unit achievements are captured under programme 6 in section 3.6.
3.12.1 Stakeholder Engagements
Constituency Date Participants Outcomes
HESA February 2015 25 SDFs from public institutions Challenges of Universities were addressed
HESA October 2014 25 SDFs from public institutions Challenges of Universities were addressed
NACTU November 2015 18 Affiliates of the federation Improved submission of WSPs by other affiliates
NUM February 2015 Education convenors nationally
NAISA January 2015 All eight association representatives
Assistance with recruitment of learners
SAYC March 2015 National Executive Members from all provinces Information sharing
4 Revenue Collection
Sub-programme Name
2013/14 2014/15
Budget Actual Expenditure
(Over)/Under
ExpenditureBudget Actual
Expenditure
(Over)/Under
Expenditure
R’000 R’000 R’000 R’000 R’000 R’000
Skills development levies 294 878 332 938 38 060 340 461 344 586 4 125
Provincial contributions 97 512 93 364 (4 148) 99 311 186 869 87 558
Penalties and interest 3 791 5 429 1 638 4 822 12 495 7 673
Investment income 8 102 17 786 9 684 8 102 27 503 19 401
Other ‑ 1 718 1 718 ‑ 85 85
Total 404 283 451 235 46 952 452 696 571 538 118 842
All skills development levies were received monthly from the DHET. A higher level of levy income was received than expected due to higher than anticipated payrolls and increased registrations of levy payers. Contributions from Provincial Departments of Education increased due to partial compliance with a Cabinet directive to increase contributions from 10% (of 1% of personnel cost) to 30%. Investment income exceeded expectations due to higher than anticipated cash levels invested with banking institutions.
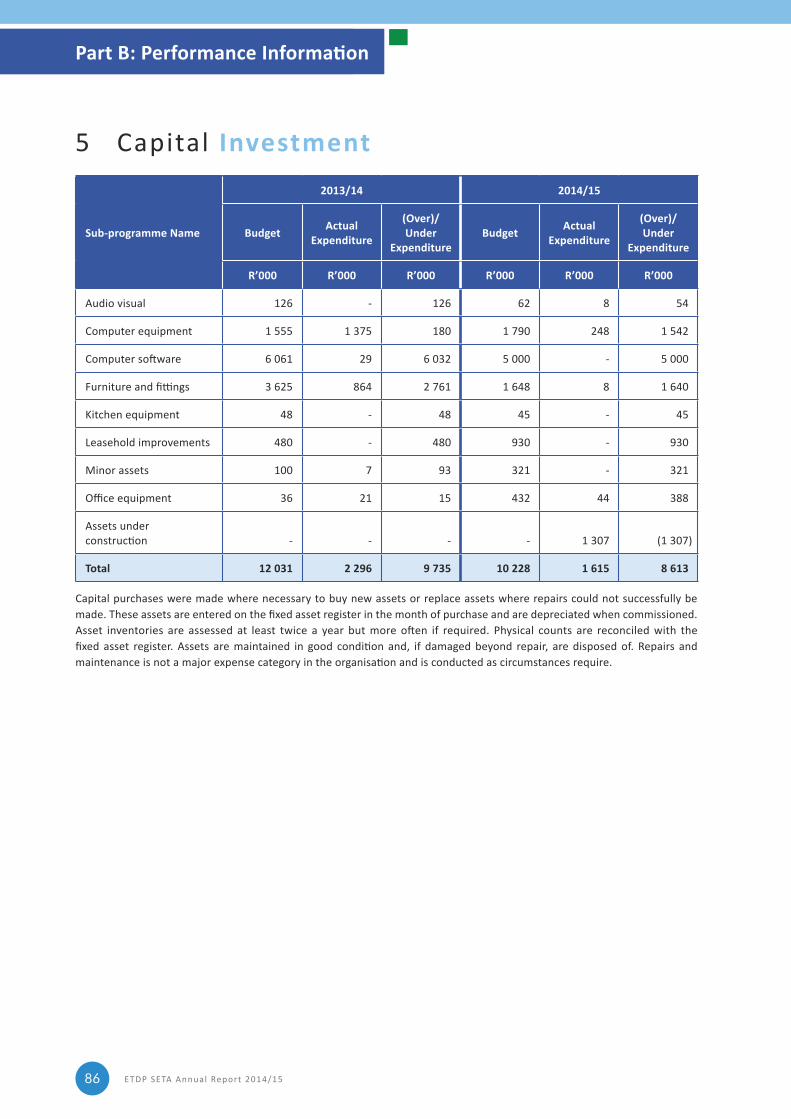
ETDP SETA Annual Report 2014/1586
5 Capital Investment
Sub-programme Name
2013/14 2014/15
Budget Actual Expenditure
(Over)/Under
ExpenditureBudget Actual
Expenditure
(Over)/Under
Expenditure
R’000 R’000 R’000 R’000 R’000 R’000
Audio visual 126 ‑ 126 62 8 54
Computer equipment 1 555 1 375 180 1 790 248 1 542
Computer software 6 061 29 6 032 5 000 ‑ 5 000
Furniture and fittings 3 625 864 2 761 1 648 8 1 640
Kitchen equipment 48 ‑ 48 45 ‑ 45
Leasehold improvements 480 ‑ 480 930 ‑ 930
Minor assets 100 7 93 321 ‑ 321
Office equipment 36 21 15 432 44 388
Assets under construction ‑ ‑ ‑ ‑ 1 307 (1 307)
Total 12 031 2 296 9 735 10 228 1 615 8 613
Capital purchases were made where necessary to buy new assets or replace assets where repairs could not successfully be made. These assets are entered on the fixed asset register in the month of purchase and are depreciated when commissioned. Asset inventories are assessed at least twice a year but more often if required. Physical counts are reconciled with the fixed asset register. Assets are maintained in good condition and, if damaged beyond repair, are disposed of. Repairs and maintenance is not a major expense category in the organisation and is conducted as circumstances require.
Part B: Performance Information

Part C Governance
ETDP SETA Annual Report 2014/1588
1 IntroductionThe ETDP SETA is a Schedule 3A public entity in terms of the Public Finance Management Act (PFMA), 1999 (Act No. 1 of 1999) and it is governed by the standard Constitution which was determined by the Minister of Higher Education and Training and gazetted by Parliament (Government Notice R1399 in Government Gazette No. 24035). There are a number of statutory bodies that play an oversight role over the functioning and performance of the SETAs.
2 Portfolio Committees
The Portfolio Committee on Higher Education and Training exercises its oversight role over the SETAs and may invite a SETA to account on its performance from time to time. The ETDP SETA was not requested to report to the Committee in the 2014/15 financial year. This can be attributed to the ETDP SETA’s good corporate governance as evidenced by both unqualified and clean audit reports in the past years.
3 Executive Authority
The Executive Authority of the ETDP SETA is the Minister of Higher Education and Training, who is responsible for appointing members of the Accounting Authority and determining their remuneration, as per the tariffs recommended by the National Treasury.
The ETDP SETA, on an annual basis, submits its Sector Skills Plan and Annual Performance Plan and signs a service level agreement with the Minister. Quarterly reports are submitted based on the targets attained. The DHET provides quarterly feedback. The SETA successfully addressed all concerns raised during the year, resulting in the DHET giving the SETA a clean report in the final quarter.
4 The Accounting Authority
4.1 IntroductionThe ETDP SETA’s Constitution is the basis on which its Accounting Authority is established. The Accounting Authority comprises 15 members as detailed in section 4.3.
Twelve of the members are equally drawn from organised labour and organised employers, and three are Ministerial appointees, one of whom is the Chairperson. The Accounting Authority provides strategic leadership and guidance. Its functions and powers are outlined in the Constitution as follows:
• Providing effective leadership• Ensuring that the ETDP SETA implements the goals of
the NSDS III• Providing strategic direction and managing institutional
risk• Managing the performance of the ETDP SETA.
4.2 Role of the Accounting AuthorityThe functions and powers of the Accounting Authority are outlined in the ETDP SETA’s Constitution.
The role of the Accounting Authority is: 1. To set a strategic direction for the ETDP SETA and
manage institutional risk;2. To provide effective leadership and ensure that the
ETDP SETA implements the goals of NSDS III and the performance agreement with the Minister of Higher Education and Training;
3. To monitor the performance of the ETDP SETA and ensure compliance with relevant statutory requirements and the requirements of the ETDP SETA Constitution; and
4. To perform its fiduciary responsibilities as per the PFMA.
Accounting Authority Charter and Progress Made on Complying with the CharterThe Accounting Authority has provided strategic direction and leadership by reviewing and approving budgets, plans and strategies as well as monitoring the implementation. It has further monitored that the ETDP SETA’s business is conducted ethically.
The Accounting Authority reports on the SETA’s annual report and confirms that the going concern basis of reporting for the organisation is indicated and confirms whether the ETDP SETA will continue to be a going concern in the foreseeable future.
The Accounting Authority determines the implementation and monitoring of policies, procedures, practices and systems to ensure the integrity of risk management and internal controls in order to protect the organisation’s assets and reputation.
Part C: Governance
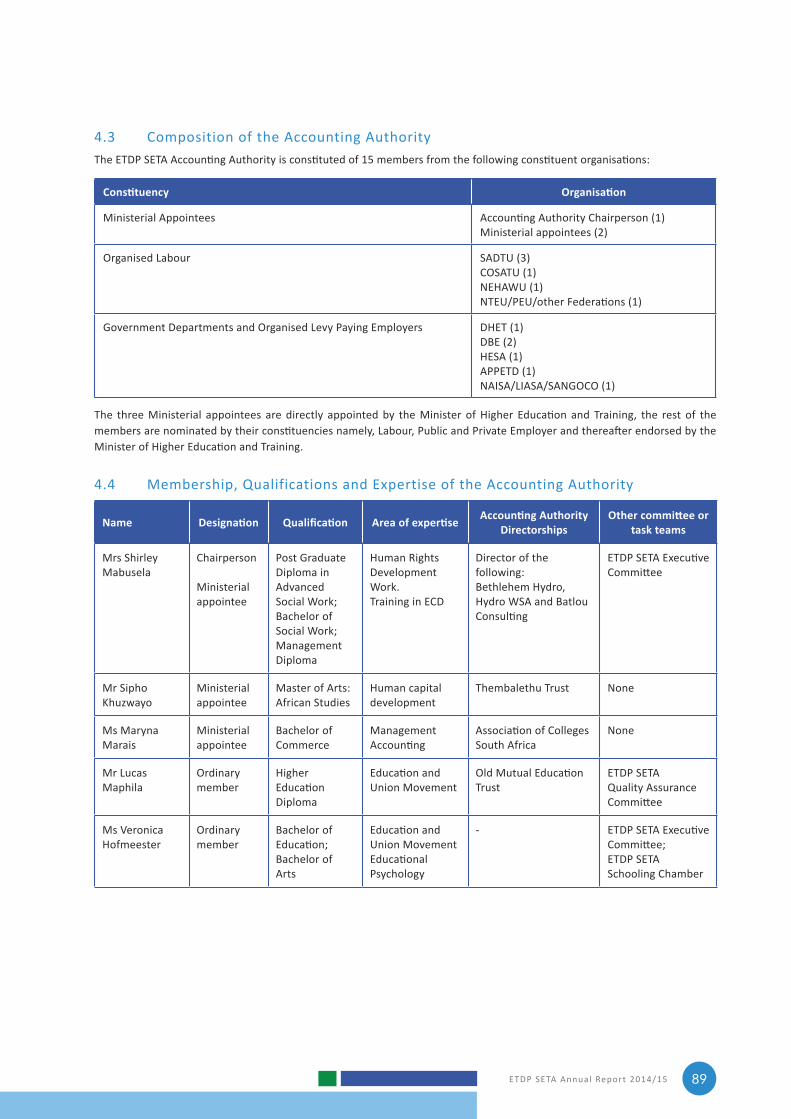
ETDP SETA Annual Report 2014/15 89
4.3 Composition of the Accounting AuthorityThe ETDP SETA Accounting Authority is constituted of 15 members from the following constituent organisations:
Constituency Organisation
Ministerial Appointees Accounting Authority Chairperson (1)Ministerial appointees (2)
Organised Labour SADTU (3)COSATU (1)NEHAWU (1)NTEU/PEU/other Federations (1)
Government Departments and Organised Levy Paying Employers DHET (1)DBE (2)HESA (1)APPETD (1)NAISA/LIASA/SANGOCO (1)
The three Ministerial appointees are directly appointed by the Minister of Higher Education and Training, the rest of the members are nominated by their constituencies namely, Labour, Public and Private Employer and thereafter endorsed by the Minister of Higher Education and Training.
4.4 Membership, Qualifications and Expertise of the Accounting Authority
Name Designation Qualification Area of expertise Accounting Authority Directorships
Other committee or task teams
Mrs Shirley Mabusela
Chairperson
Ministerial appointee
Post Graduate Diploma in Advanced Social Work;Bachelor of Social Work;Management Diploma
Human Rights Development Work. Training in ECD
Director of the following:Bethlehem Hydro, Hydro WSA and Batlou Consulting
ETDP SETA Executive Committee
Mr Sipho Khuzwayo
Ministerial appointee
Master of Arts: African Studies
Human capital development
Thembalethu Trust None
Ms Maryna Marais
Ministerial appointee
Bachelor of Commerce
Management Accounting
Association of Colleges South Africa
None
Mr Lucas Maphila
Ordinary member
Higher Education Diploma
Education and Union Movement
Old Mutual Education Trust
ETDP SETA Quality Assurance Committee
Ms Veronica Hofmeester
Ordinary member
Bachelor of Education; Bachelor of Arts
Education and Union Movement Educational Psychology
‑ ETDP SETA Executive Committee; ETDP SETA Schooling Chamber
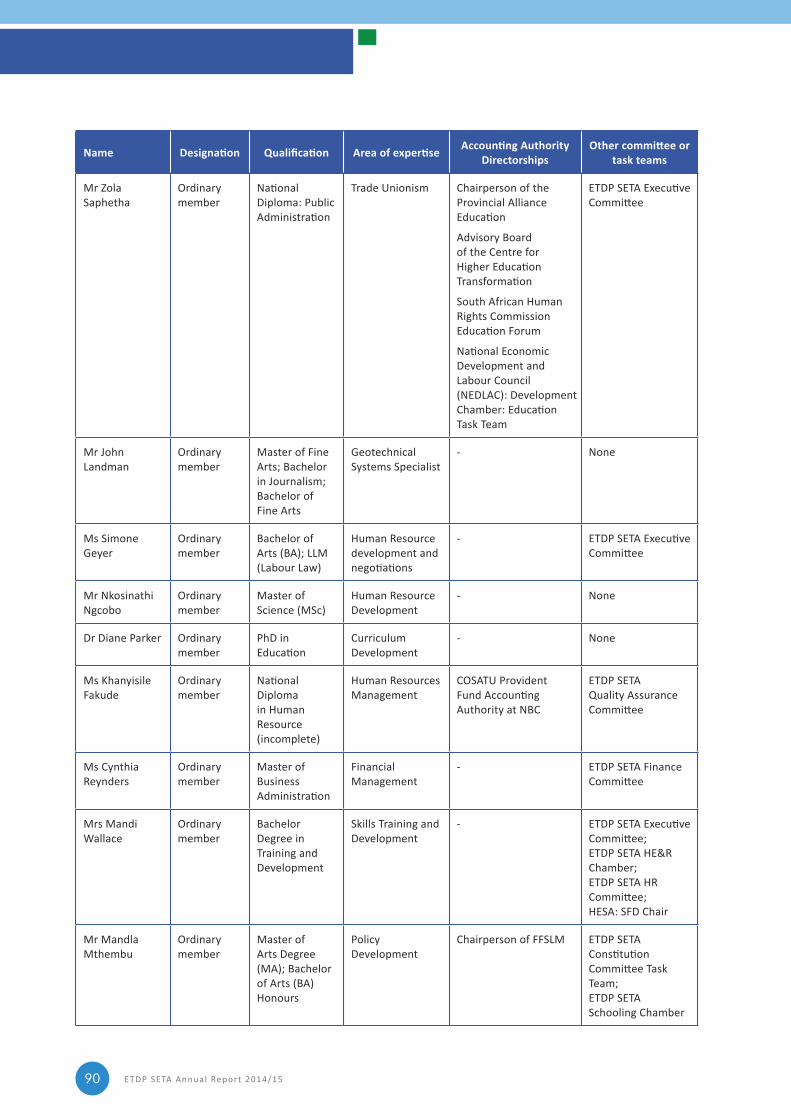
ETDP SETA Annual Report 2014/1590
Name Designation Qualification Area of expertise Accounting Authority Directorships
Other committee or task teams
Mr Zola Saphetha
Ordinary member
National Diploma: Public Administration
Trade Unionism Chairperson of the Provincial Alliance Education
Advisory Board of the Centre for Higher Education Transformation
South African Human Rights Commission Education Forum
National Economic Development and Labour Council (NEDLAC): Development Chamber: Education Task Team
ETDP SETA Executive Committee
Mr John Landman
Ordinary member
Master of Fine Arts; Bachelor in Journalism; Bachelor of Fine Arts
Geotechnical Systems Specialist
‑ None
Ms Simone Geyer
Ordinary member
Bachelor of Arts (BA); LLM (Labour Law)
Human Resource development and negotiations
‑ ETDP SETA Executive Committee
Mr Nkosinathi Ngcobo
Ordinary member
Master of Science (MSc)
Human Resource Development
‑ None
Dr Diane Parker Ordinary member
PhD in Education
Curriculum Development
‑ None
Ms Khanyisile Fakude
Ordinary member
National Diploma in Human Resource (incomplete)
Human Resources Management
COSATU Provident Fund Accounting Authority at NBC
ETDP SETA Quality Assurance Committee
Ms Cynthia Reynders
Ordinary member
Master of Business Administration
Financial Management
‑ ETDP SETA Finance Committee
Mrs Mandi Wallace
Ordinary member
Bachelor Degree in Training and Development
Skills Training and Development
‑ ETDP SETA Executive Committee;ETDP SETA HE&R Chamber;ETDP SETA HR Committee;HESA: SFD Chair
Mr Mandla Mthembu
Ordinary member
Master of Arts Degree (MA); Bachelor of Arts (BA) Honours
Policy Development
Chairperson of FFSLM ETDP SETA Constitution Committee Task Team;ETDP SETA Schooling Chamber
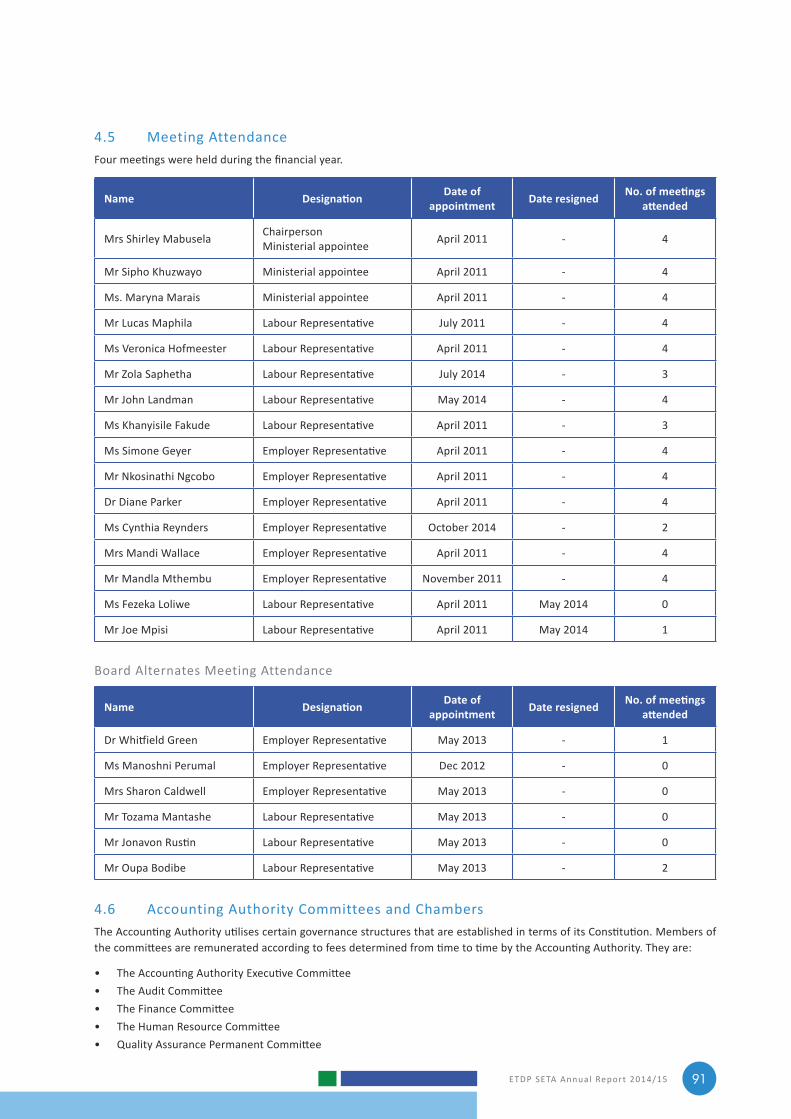
ETDP SETA Annual Report 2014/15 91
Board Alternates Meeting Attendance
Name Designation Date of appointment Date resigned No. of meetings
attended
Dr Whitfield Green Employer Representative May 2013 ‑ 1
Ms Manoshni Perumal Employer Representative Dec 2012 ‑ 0
Mrs Sharon Caldwell Employer Representative May 2013 ‑ 0
Mr Tozama Mantashe Labour Representative May 2013 ‑ 0
Mr Jonavon Rustin Labour Representative May 2013 ‑ 0
Mr Oupa Bodibe Labour Representative May 2013 ‑ 2
4.6 Accounting Authority Committees and ChambersThe Accounting Authority utilises certain governance structures that are established in terms of its Constitution. Members of the committees are remunerated according to fees determined from time to time by the Accounting Authority. They are:
• The Accounting Authority Executive Committee• The Audit Committee• The Finance Committee• The Human Resource Committee• Quality Assurance Permanent Committee
4.5 Meeting Attendance Four meetings were held during the financial year.
Name Designation Date of appointment Date resigned No. of meetings
attended
Mrs Shirley Mabusela Chairperson Ministerial appointee April 2011 ‑ 4
Mr Sipho Khuzwayo Ministerial appointee April 2011 ‑ 4
Ms. Maryna Marais Ministerial appointee April 2011 ‑ 4
Mr Lucas Maphila Labour Representative July 2011 ‑ 4
Ms Veronica Hofmeester Labour Representative April 2011 ‑ 4
Mr Zola Saphetha Labour Representative July 2014 ‑ 3
Mr John Landman Labour Representative May 2014 ‑ 4
Ms Khanyisile Fakude Labour Representative April 2011 ‑ 3
Ms Simone Geyer Employer Representative April 2011 ‑ 4
Mr Nkosinathi Ngcobo Employer Representative April 2011 ‑ 4
Dr Diane Parker Employer Representative April 2011 ‑ 4
Ms Cynthia Reynders Employer Representative October 2014 ‑ 2
Mrs Mandi Wallace Employer Representative April 2011 ‑ 4
Mr Mandla Mthembu Employer Representative November 2011 ‑ 4
Ms Fezeka Loliwe Labour Representative April 2011 May 2014 0
Mr Joe Mpisi Labour Representative April 2011 May 2014 1
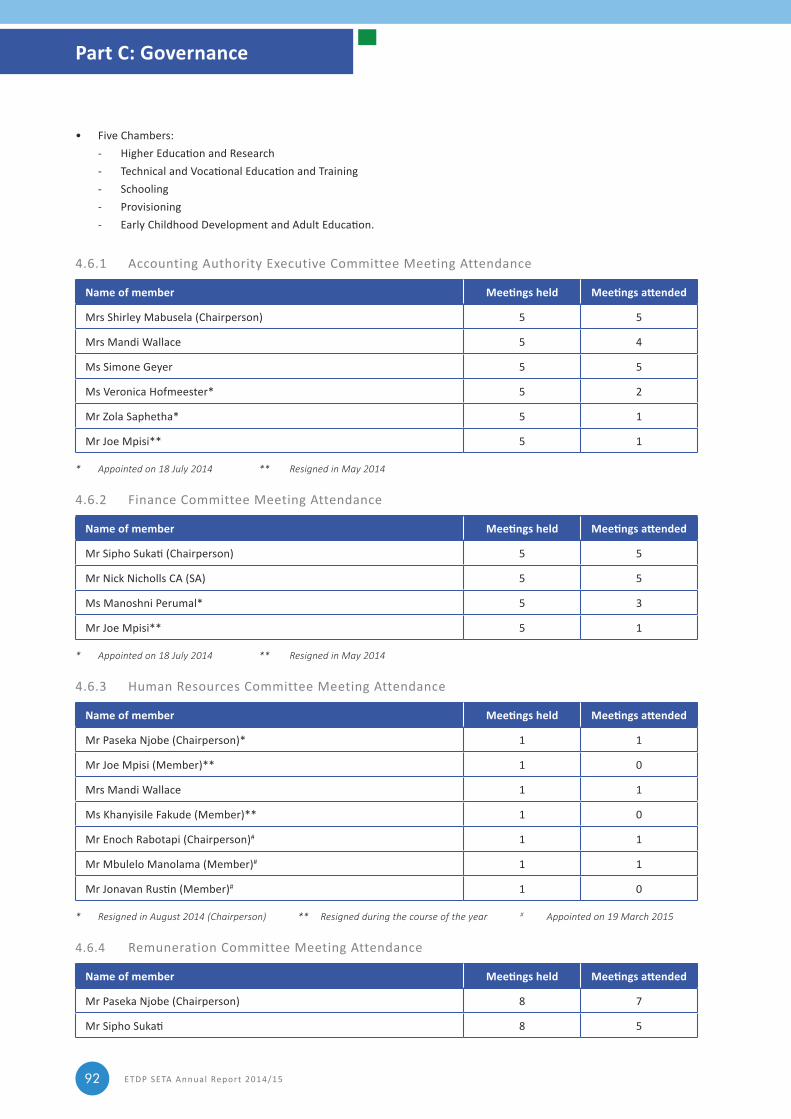
ETDP SETA Annual Report 2014/1592
• Five Chambers: ‑ Higher Education and Research ‑ Technical and Vocational Education and Training ‑ Schooling ‑ Provisioning ‑ Early Childhood Development and Adult Education.
4.6.1 Accounting Authority Executive Committee Meeting Attendance
Name of member Meetings held Meetings attended
Mrs Shirley Mabusela (Chairperson) 5 5
Mrs Mandi Wallace 5 4
Ms Simone Geyer 5 5
Ms Veronica Hofmeester* 5 2
Mr Zola Saphetha* 5 1
Mr Joe Mpisi** 5 1
* Appointed on 18 July 2014 ** Resigned in May 2014
4.6.2 Finance Committee Meeting Attendance
Name of member Meetings held Meetings attended
Mr Sipho Sukati (Chairperson) 5 5
Mr Nick Nicholls CA (SA) 5 5
Ms Manoshni Perumal* 5 3
Mr Joe Mpisi** 5 1
* Appointed on 18 July 2014 ** Resigned in May 2014
4.6.3 Human Resources Committee Meeting Attendance
Name of member Meetings held Meetings attended
Mr Paseka Njobe (Chairperson)* 1 1
Mr Joe Mpisi (Member)** 1 0
Mrs Mandi Wallace 1 1
Ms Khanyisile Fakude (Member)** 1 0
Mr Enoch Rabotapi (Chairperson)# 1 1
Mr Mbulelo Manolama (Member)# 1 1
Mr Jonavan Rustin (Member)# 1 0
* Resigned in August 2014 (Chairperson) ** Resigned during the course of the year # Appointed on 19 March 2015
4.6.4 Remuneration Committee Meeting Attendance
Name of member Meetings held Meetings attended
Mr Paseka Njobe (Chairperson) 8 7
Mr Sipho Sukati 8 5
Part C: Governance
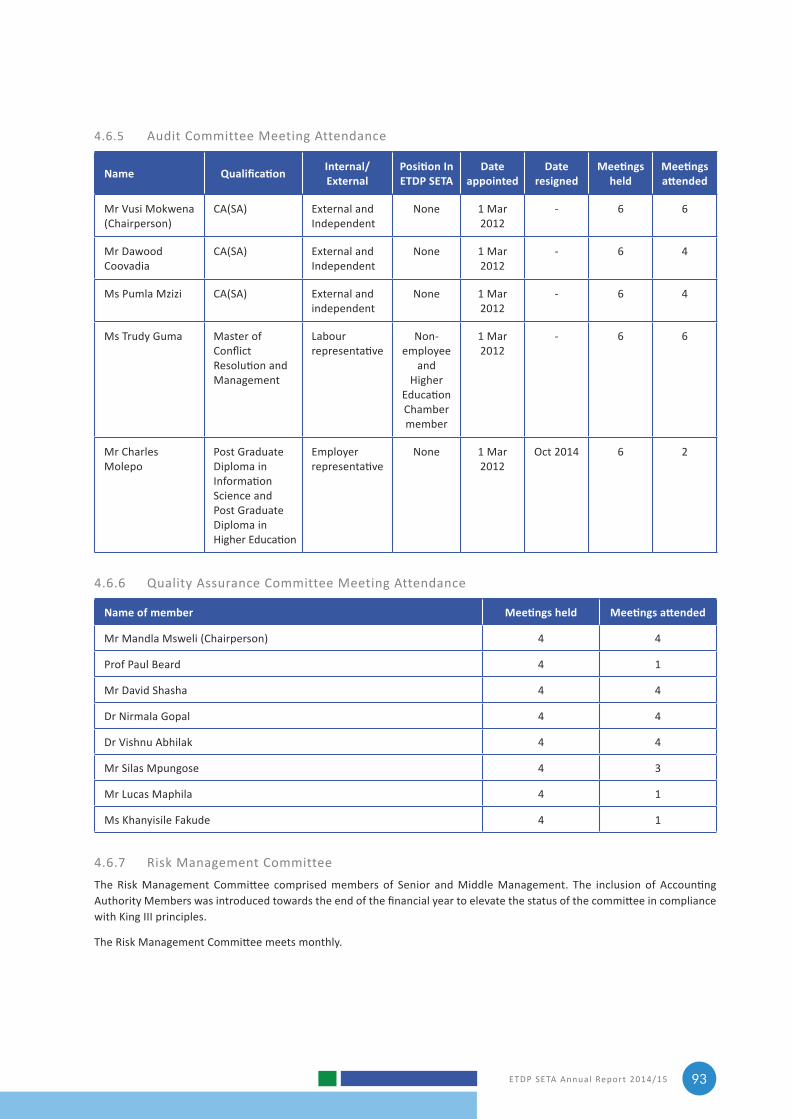
ETDP SETA Annual Report 2014/15 93
4.6.5 Audit Committee Meeting Attendance
Name Qualification Internal/External
Position In ETDP SETA
Date appointed
Date resigned
Meetings held
Meetings attended
Mr Vusi Mokwena (Chairperson)
CA(SA) External and Independent
None 1 Mar 2012
‑ 6 6
Mr Dawood Coovadia
CA(SA) External and Independent
None 1 Mar 2012
‑ 6 4
Ms Pumla Mzizi CA(SA) External and independent
None 1 Mar 2012
‑ 6 4
Ms Trudy Guma Master of Conflict Resolution and Management
Labour representative
Non‑employee
and Higher
Education Chamber member
1 Mar 2012
‑ 6 6
Mr Charles Molepo
Post Graduate Diploma in Information Science and Post Graduate Diploma in Higher Education
Employer representative
None 1 Mar 2012
Oct 2014 6 2
4.6.6 Quality Assurance Committee Meeting Attendance
Name of member Meetings held Meetings attended
Mr Mandla Msweli (Chairperson) 4 4
Prof Paul Beard 4 1
Mr David Shasha 4 4
Dr Nirmala Gopal 4 4
Dr Vishnu Abhilak 4 4
Mr Silas Mpungose 4 3
Mr Lucas Maphila 4 1
Ms Khanyisile Fakude 4 1
4.6.7 Risk Management CommitteeThe Risk Management Committee comprised members of Senior and Middle Management. The inclusion of Accounting Authority Members was introduced towards the end of the financial year to elevate the status of the committee in compliance with King III principles.
The Risk Management Committee meets monthly.
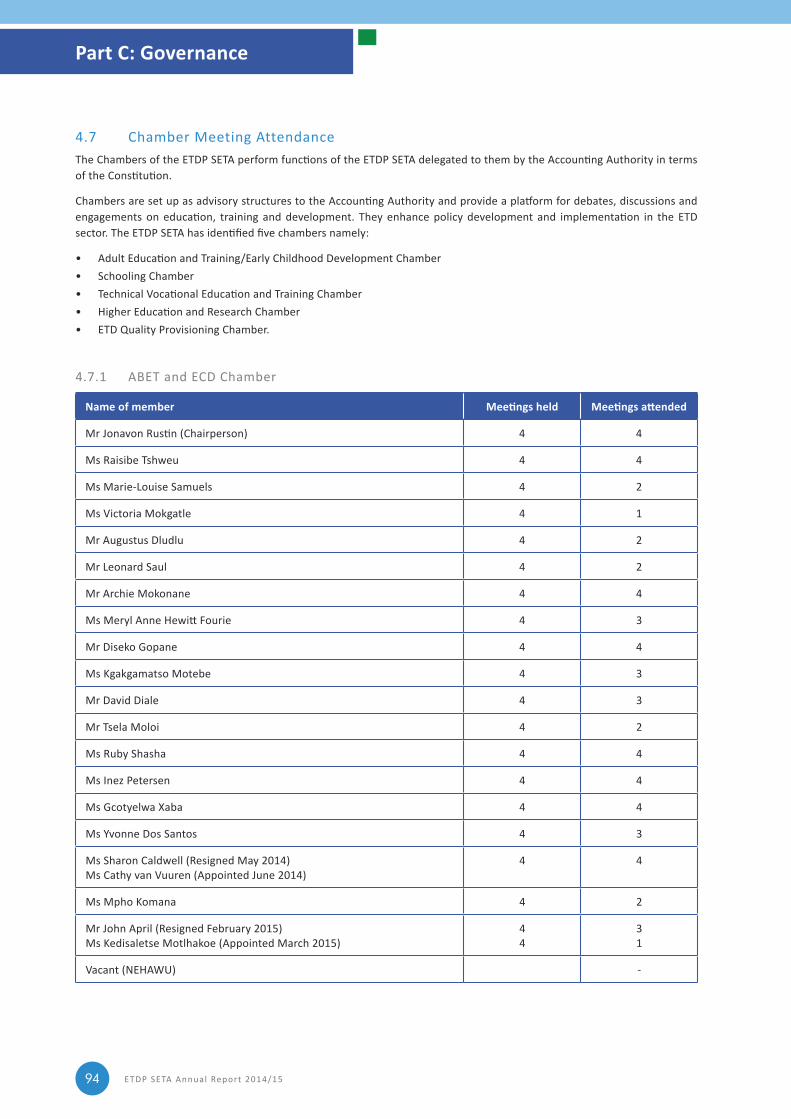
ETDP SETA Annual Report 2014/1594
4.7 Chamber Meeting AttendanceThe Chambers of the ETDP SETA perform functions of the ETDP SETA delegated to them by the Accounting Authority in terms of the Constitution.
Chambers are set up as advisory structures to the Accounting Authority and provide a platform for debates, discussions and engagements on education, training and development. They enhance policy development and implementation in the ETD sector. The ETDP SETA has identified five chambers namely:
• Adult Education and Training/Early Childhood Development Chamber• Schooling Chamber• Technical Vocational Education and Training Chamber• Higher Education and Research Chamber• ETD Quality Provisioning Chamber.
4.7.1 ABET and ECD Chamber
Name of member Meetings held Meetings attended
Mr Jonavon Rustin (Chairperson) 4 4
Ms Raisibe Tshweu 4 4
Ms Marie‑Louise Samuels 4 2
Ms Victoria Mokgatle 4 1
Mr Augustus Dludlu 4 2
Mr Leonard Saul 4 2
Mr Archie Mokonane 4 4
Ms Meryl Anne Hewitt Fourie 4 3
Mr Diseko Gopane 4 4
Ms Kgakgamatso Motebe 4 3
Mr David Diale 4 3
Mr Tsela Moloi 4 2
Ms Ruby Shasha 4 4
Ms Inez Petersen 4 4
Ms Gcotyelwa Xaba 4 4
Ms Yvonne Dos Santos 4 3
Ms Sharon Caldwell (Resigned May 2014)Ms Cathy van Vuuren (Appointed June 2014)
4 4
Ms Mpho Komana 4 2
Mr John April (Resigned February 2015)Ms Kedisaletse Motlhakoe (Appointed March 2015)
44
31
Vacant (NEHAWU) ‑
Part C: Governance
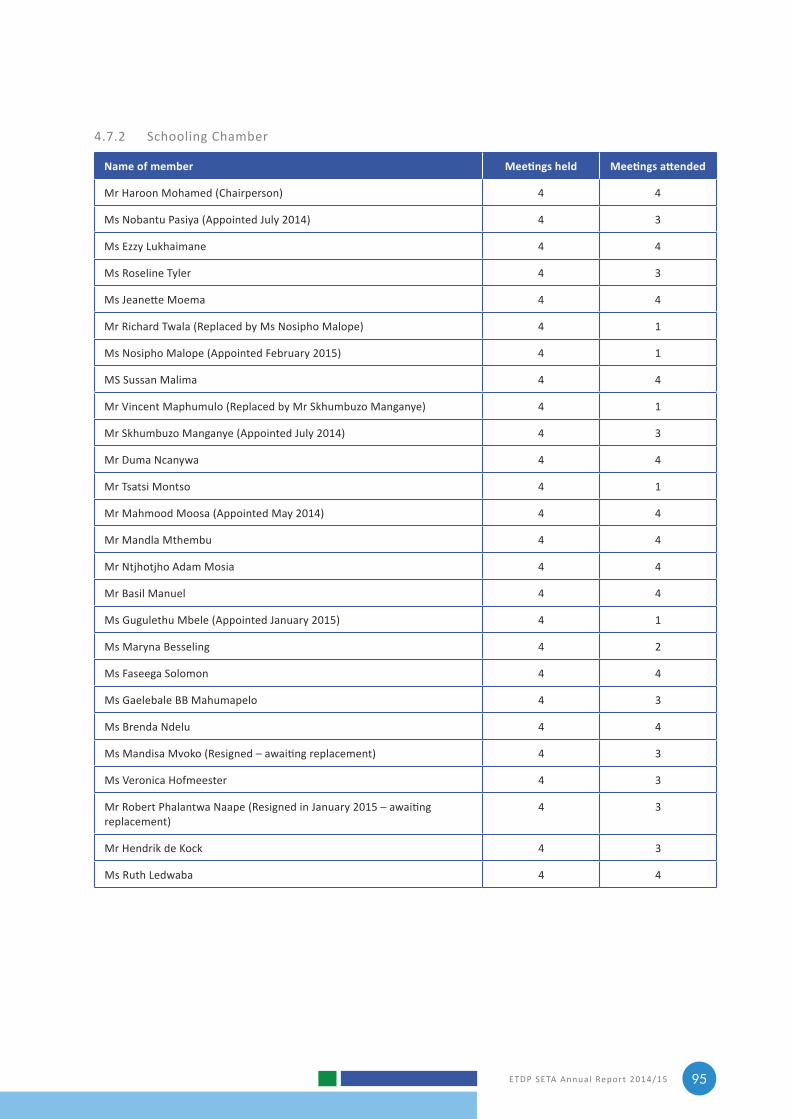
ETDP SETA Annual Report 2014/15 95
4.7.2 Schooling Chamber
Name of member Meetings held Meetings attended
Mr Haroon Mohamed (Chairperson) 4 4
Ms Nobantu Pasiya (Appointed July 2014) 4 3
Ms Ezzy Lukhaimane 4 4
Ms Roseline Tyler 4 3
Ms Jeanette Moema 4 4
Mr Richard Twala (Replaced by Ms Nosipho Malope) 4 1
Ms Nosipho Malope (Appointed February 2015) 4 1
MS Sussan Malima 4 4
Mr Vincent Maphumulo (Replaced by Mr Skhumbuzo Manganye) 4 1
Mr Skhumbuzo Manganye (Appointed July 2014) 4 3
Mr Duma Ncanywa 4 4
Mr Tsatsi Montso 4 1
Mr Mahmood Moosa (Appointed May 2014) 4 4
Mr Mandla Mthembu 4 4
Mr Ntjhotjho Adam Mosia 4 4
Mr Basil Manuel 4 4
Ms Gugulethu Mbele (Appointed January 2015) 4 1
Ms Maryna Besseling 4 2
Ms Faseega Solomon 4 4
Ms Gaelebale BB Mahumapelo 4 3
Ms Brenda Ndelu 4 4
Ms Mandisa Mvoko (Resigned – awaiting replacement) 4 3
Ms Veronica Hofmeester 4 3
Mr Robert Phalantwa Naape (Resigned in January 2015 – awaiting replacement)
4 3
Mr Hendrik de Kock 4 3
Ms Ruth Ledwaba 4 4
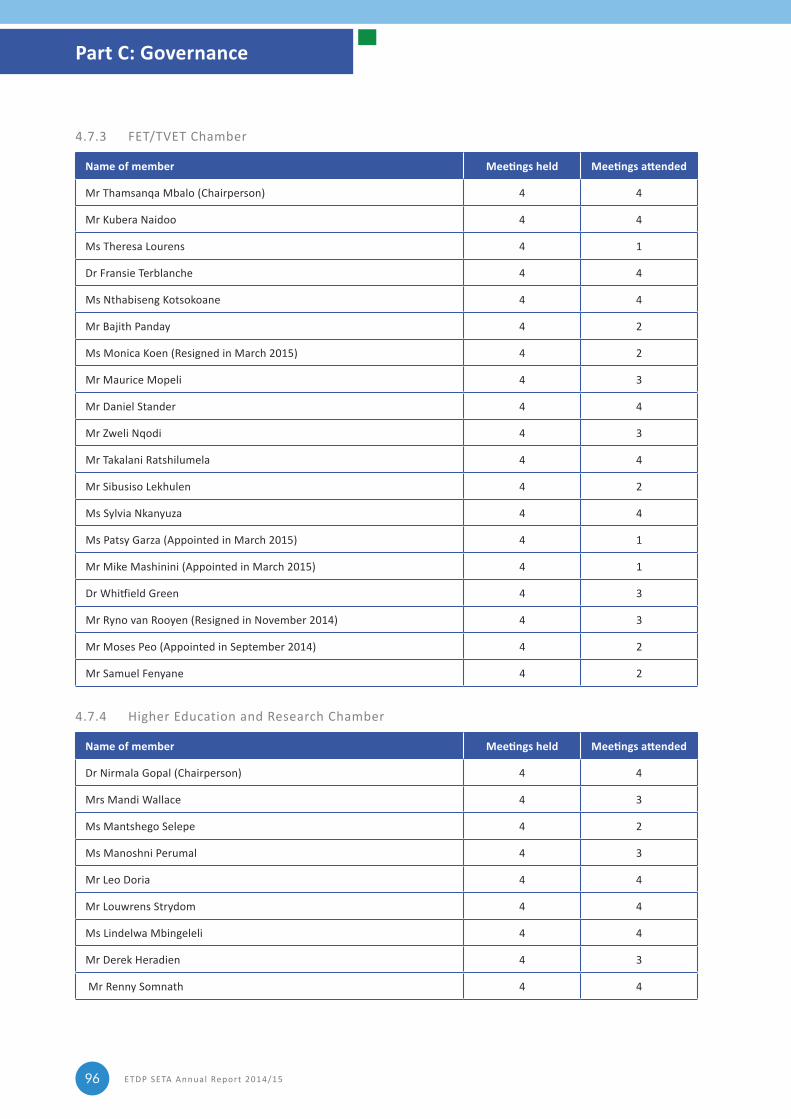
ETDP SETA Annual Report 2014/1596
4.7.3 FET/TVET Chamber
Name of member Meetings held Meetings attended
Mr Thamsanqa Mbalo (Chairperson) 4 4
Mr Kubera Naidoo 4 4
Ms Theresa Lourens 4 1
Dr Fransie Terblanche 4 4
Ms Nthabiseng Kotsokoane 4 4
Mr Bajith Panday 4 2
Ms Monica Koen (Resigned in March 2015) 4 2
Mr Maurice Mopeli 4 3
Mr Daniel Stander 4 4
Mr Zweli Nqodi 4 3
Mr Takalani Ratshilumela 4 4
Mr Sibusiso Lekhulen 4 2
Ms Sylvia Nkanyuza 4 4
Ms Patsy Garza (Appointed in March 2015) 4 1
Mr Mike Mashinini (Appointed in March 2015) 4 1
Dr Whitfield Green 4 3
Mr Ryno van Rooyen (Resigned in November 2014) 4 3
Mr Moses Peo (Appointed in September 2014) 4 2
Mr Samuel Fenyane 4 2
4.7.4 Higher Education and Research Chamber
Name of member Meetings held Meetings attended
Dr Nirmala Gopal (Chairperson) 4 4
Mrs Mandi Wallace 4 3
Ms Mantshego Selepe 4 2
Ms Manoshni Perumal 4 3
Mr Leo Doria 4 4
Mr Louwrens Strydom 4 4
Ms Lindelwa Mbingeleli 4 4
Mr Derek Heradien 4 3
Mr Renny Somnath 4 4
Part C: Governance
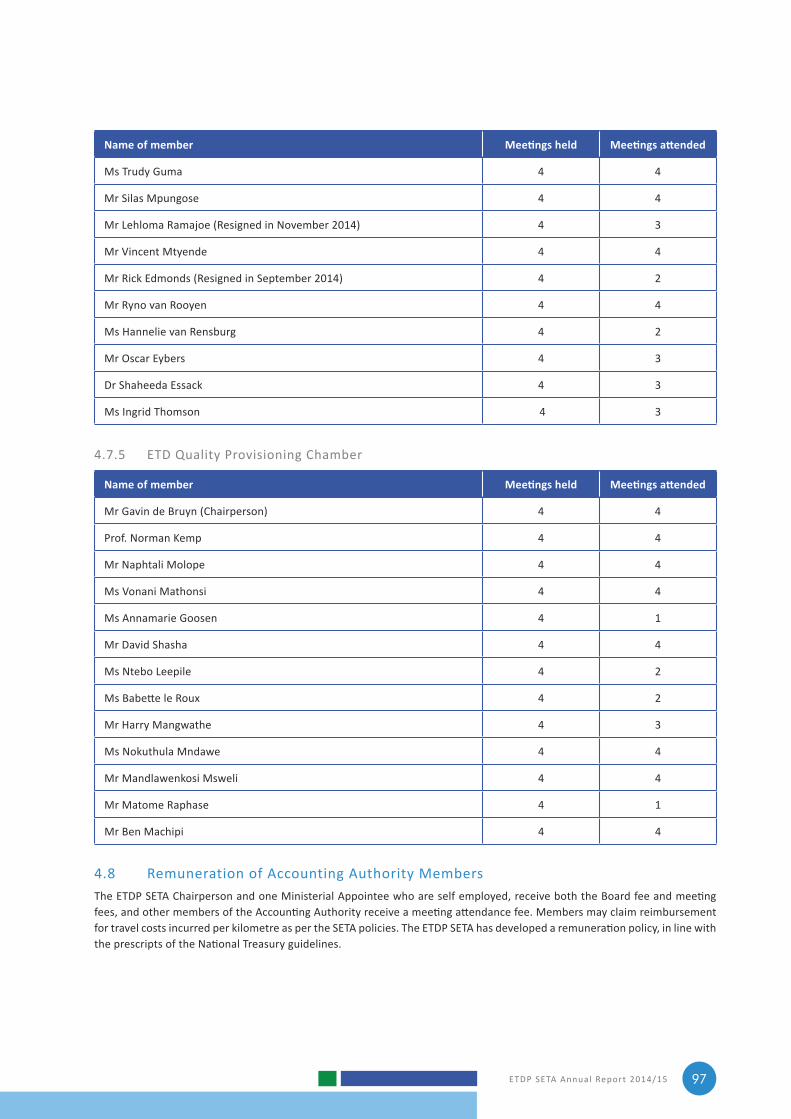
ETDP SETA Annual Report 2014/15 97
Name of member Meetings held Meetings attended
Ms Trudy Guma 4 4
Mr Silas Mpungose 4 4
Mr Lehloma Ramajoe (Resigned in November 2014) 4 3
Mr Vincent Mtyende 4 4
Mr Rick Edmonds (Resigned in September 2014) 4 2
Mr Ryno van Rooyen 4 4
Ms Hannelie van Rensburg 4 2
Mr Oscar Eybers 4 3
Dr Shaheeda Essack 4 3
Ms Ingrid Thomson 4 3
4.7.5 ETD Quality Provisioning Chamber
Name of member Meetings held Meetings attended
Mr Gavin de Bruyn (Chairperson) 4 4
Prof. Norman Kemp 4 4
Mr Naphtali Molope 4 4
Ms Vonani Mathonsi 4 4
Ms Annamarie Goosen 4 1
Mr David Shasha 4 4
Ms Ntebo Leepile 4 2
Ms Babette le Roux 4 2
Mr Harry Mangwathe 4 3
Ms Nokuthula Mndawe 4 4
Mr Mandlawenkosi Msweli 4 4
Mr Matome Raphase 4 1
Mr Ben Machipi 4 4
4.8 Remuneration of Accounting Authority MembersThe ETDP SETA Chairperson and one Ministerial Appointee who are self employed, receive both the Board fee and meeting fees, and other members of the Accounting Authority receive a meeting attendance fee. Members may claim reimbursement for travel costs incurred per kilometre as per the SETA policies. The ETDP SETA has developed a remuneration policy, in line with the prescripts of the National Treasury guidelines.
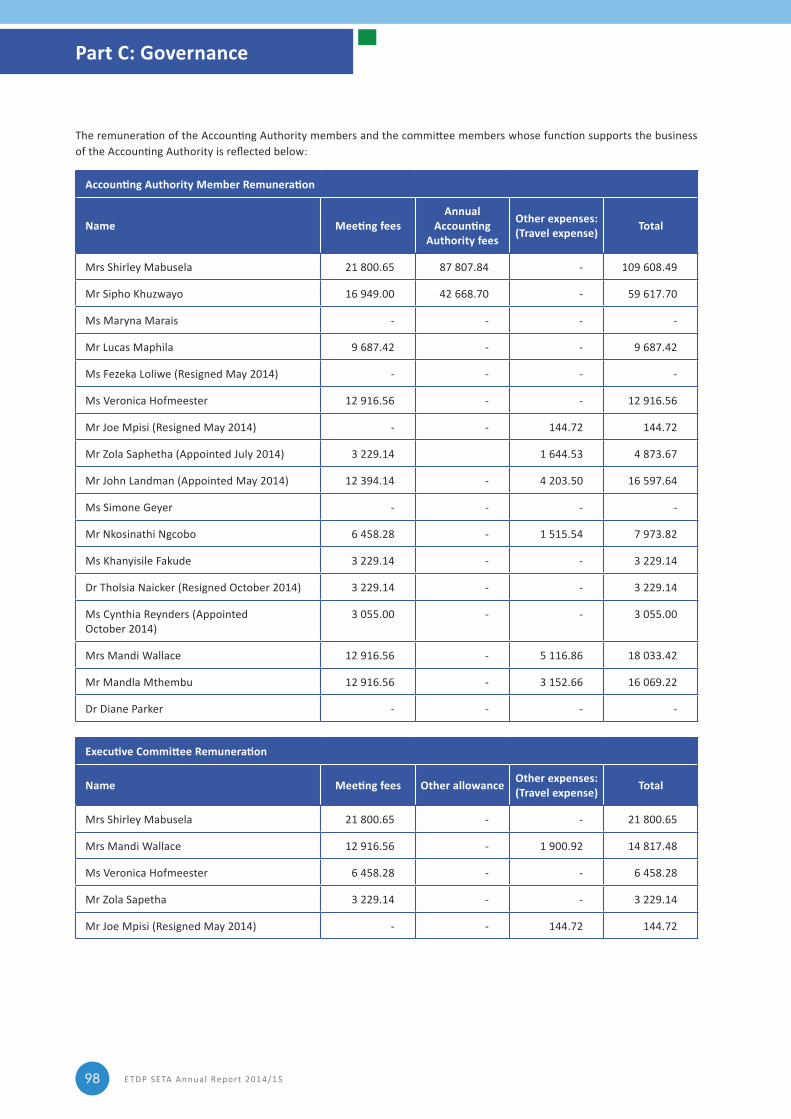
ETDP SETA Annual Report 2014/1598
The remuneration of the Accounting Authority members and the committee members whose function supports the business of the Accounting Authority is reflected below:
Accounting Authority Member Remuneration
Name Meeting feesAnnual
Accounting Authority fees
Other expenses: (Travel expense) Total
Mrs Shirley Mabusela 21 800.65 87 807.84 ‑ 109 608.49
Mr Sipho Khuzwayo 16 949.00 42 668.70 ‑ 59 617.70
Ms Maryna Marais ‑ ‑ ‑ ‑
Mr Lucas Maphila 9 687.42 ‑ ‑ 9 687.42
Ms Fezeka Loliwe (Resigned May 2014) ‑ ‑ ‑ ‑
Ms Veronica Hofmeester 12 916.56 ‑ ‑ 12 916.56
Mr Joe Mpisi (Resigned May 2014) ‑ ‑ 144.72 144.72
Mr Zola Saphetha (Appointed July 2014) 3 229.14 1 644.53 4 873.67
Mr John Landman (Appointed May 2014) 12 394.14 ‑ 4 203.50 16 597.64
Ms Simone Geyer ‑ ‑ ‑ ‑
Mr Nkosinathi Ngcobo 6 458.28 ‑ 1 515.54 7 973.82
Ms Khanyisile Fakude 3 229.14 ‑ ‑ 3 229.14
Dr Tholsia Naicker (Resigned October 2014) 3 229.14 ‑ ‑ 3 229.14
Ms Cynthia Reynders (Appointed October 2014)
3 055.00 ‑ ‑ 3 055.00
Mrs Mandi Wallace 12 916.56 ‑ 5 116.86 18 033.42
Mr Mandla Mthembu 12 916.56 ‑ 3 152.66 16 069.22
Dr Diane Parker ‑ ‑ ‑ ‑
Executive Committee Remuneration
Name Meeting fees Other allowance Other expenses: (Travel expense) Total
Mrs Shirley Mabusela 21 800.65 ‑ ‑ 21 800.65
Mrs Mandi Wallace 12 916.56 ‑ 1 900.92 14 817.48
Ms Veronica Hofmeester 6 458.28 ‑ ‑ 6 458.28
Mr Zola Sapetha 3 229.14 ‑ ‑ 3 229.14
Mr Joe Mpisi (Resigned May 2014) ‑ ‑ 144.72 144.72
Part C: Governance
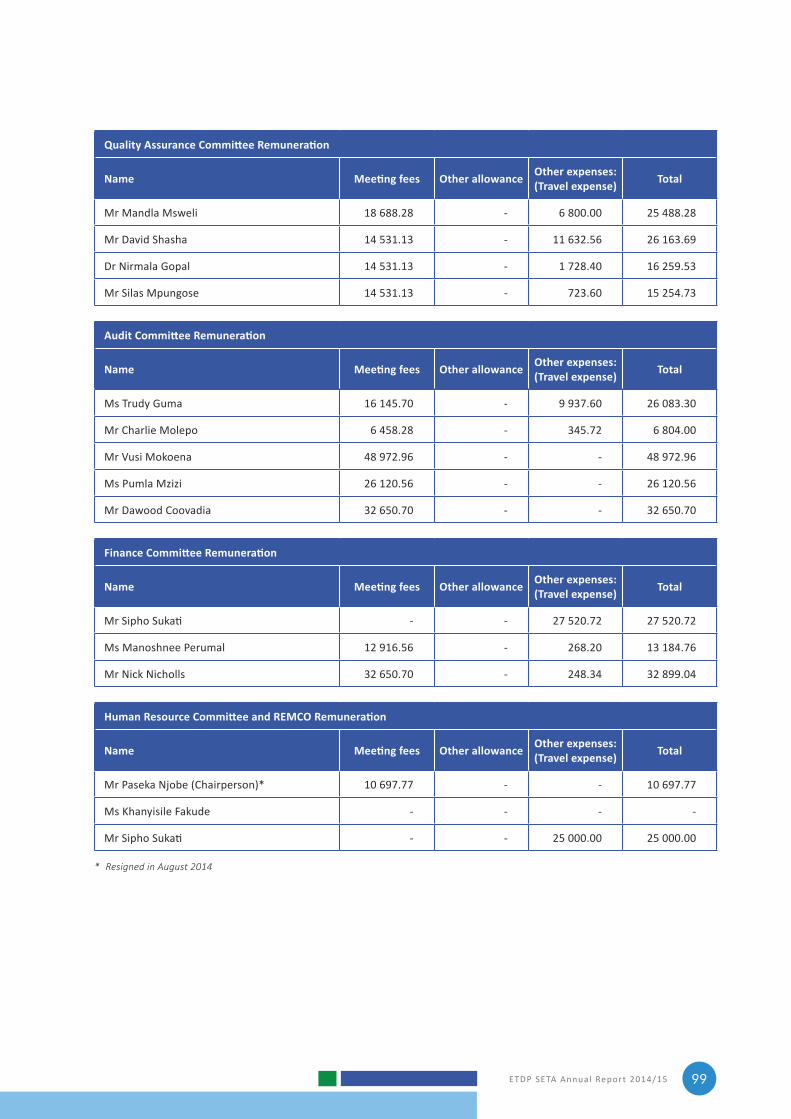
ETDP SETA Annual Report 2014/15 99
Quality Assurance Committee Remuneration
Name Meeting fees Other allowance Other expenses: (Travel expense) Total
Mr Mandla Msweli 18 688.28 ‑ 6 800.00 25 488.28
Mr David Shasha 14 531.13 ‑ 11 632.56 26 163.69
Dr Nirmala Gopal 14 531.13 ‑ 1 728.40 16 259.53
Mr Silas Mpungose 14 531.13 ‑ 723.60 15 254.73
Audit Committee Remuneration
Name Meeting fees Other allowance Other expenses: (Travel expense) Total
Ms Trudy Guma 16 145.70 ‑ 9 937.60 26 083.30
Mr Charlie Molepo 6 458.28 ‑ 345.72 6 804.00
Mr Vusi Mokoena 48 972.96 ‑ ‑ 48 972.96
Ms Pumla Mzizi 26 120.56 ‑ ‑ 26 120.56
Mr Dawood Coovadia 32 650.70 ‑ ‑ 32 650.70
Finance Committee Remuneration
Name Meeting fees Other allowance Other expenses: (Travel expense) Total
Mr Sipho Sukati ‑ ‑ 27 520.72 27 520.72
Ms Manoshnee Perumal 12 916.56 ‑ 268.20 13 184.76
Mr Nick Nicholls 32 650.70 ‑ 248.34 32 899.04
Human Resource Committee and REMCO Remuneration
Name Meeting fees Other allowance Other expenses: (Travel expense) Total
Mr Paseka Njobe (Chairperson)* 10 697.77 ‑ ‑ 10 697.77
Ms Khanyisile Fakude ‑ ‑ ‑ ‑
Mr Sipho Sukati ‑ ‑ 25 000.00 25 000.00
* Resigned in August 2014
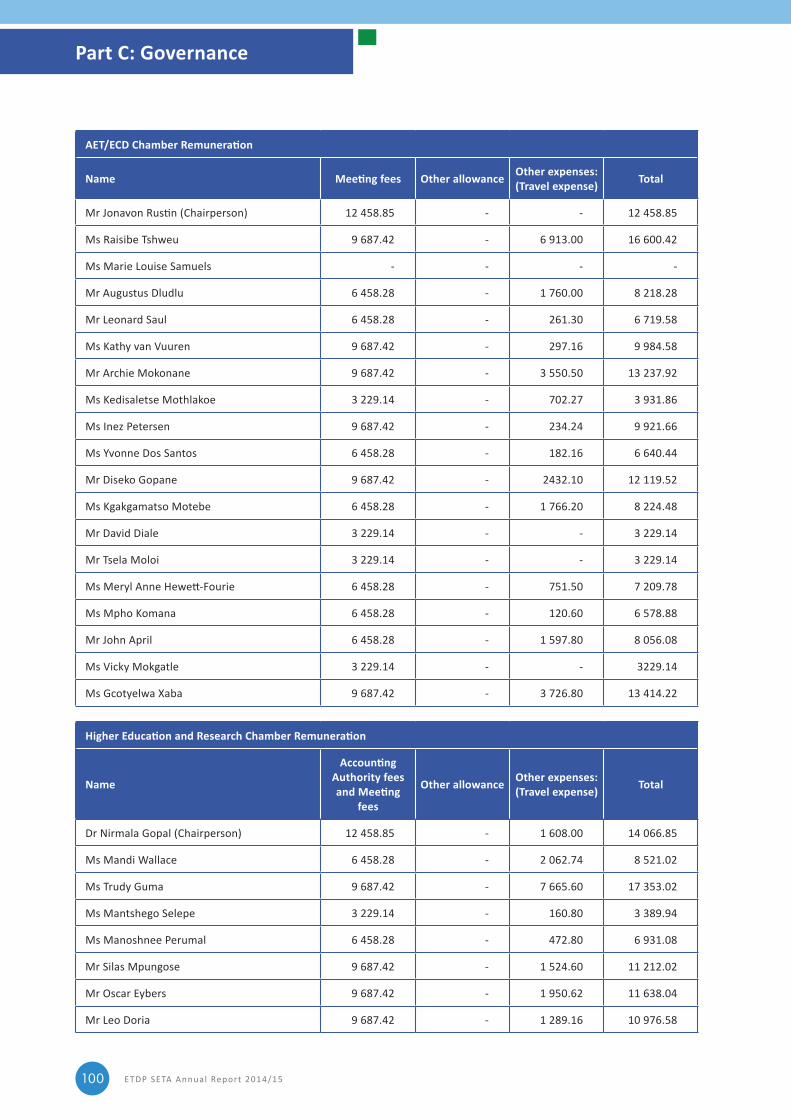
ETDP SETA Annual Report 2014/15100
AET/ECD Chamber Remuneration
Name Meeting fees Other allowance Other expenses: (Travel expense) Total
Mr Jonavon Rustin (Chairperson) 12 458.85 ‑ ‑ 12 458.85
Ms Raisibe Tshweu 9 687.42 ‑ 6 913.00 16 600.42
Ms Marie Louise Samuels ‑ ‑ ‑ ‑
Mr Augustus Dludlu 6 458.28 ‑ 1 760.00 8 218.28
Mr Leonard Saul 6 458.28 ‑ 261.30 6 719.58
Ms Kathy van Vuuren 9 687.42 ‑ 297.16 9 984.58
Mr Archie Mokonane 9 687.42 ‑ 3 550.50 13 237.92
Ms Kedisaletse Mothlakoe 3 229.14 ‑ 702.27 3 931.86
Ms Inez Petersen 9 687.42 ‑ 234.24 9 921.66
Ms Yvonne Dos Santos 6 458.28 ‑ 182.16 6 640.44
Mr Diseko Gopane 9 687.42 ‑ 2432.10 12 119.52
Ms Kgakgamatso Motebe 6 458.28 ‑ 1 766.20 8 224.48
Mr David Diale 3 229.14 ‑ ‑ 3 229.14
Mr Tsela Moloi 3 229.14 ‑ ‑ 3 229.14
Ms Meryl Anne Hewett-Fourie 6 458.28 ‑ 751.50 7 209.78
Ms Mpho Komana 6 458.28 ‑ 120.60 6 578.88
Mr John April 6 458.28 ‑ 1 597.80 8 056.08
Ms Vicky Mokgatle 3 229.14 ‑ ‑ 3229.14
Ms Gcotyelwa Xaba 9 687.42 ‑ 3 726.80 13 414.22
Higher Education and Research Chamber Remuneration
Name
Accounting Authority fees and Meeting
fees
Other allowance Other expenses: (Travel expense) Total
Dr Nirmala Gopal (Chairperson) 12 458.85 ‑ 1 608.00 14 066.85
Ms Mandi Wallace 6 458.28 ‑ 2 062.74 8 521.02
Ms Trudy Guma 9 687.42 ‑ 7 665.60 17 353.02
Ms Mantshego Selepe 3 229.14 ‑ 160.80 3 389.94
Ms Manoshnee Perumal 6 458.28 ‑ 472.80 6 931.08
Mr Silas Mpungose 9 687.42 ‑ 1 524.60 11 212.02
Mr Oscar Eybers 9 687.42 ‑ 1 950.62 11 638.04
Mr Leo Doria 9 687.42 ‑ 1 289.16 10 976.58
Part C: Governance
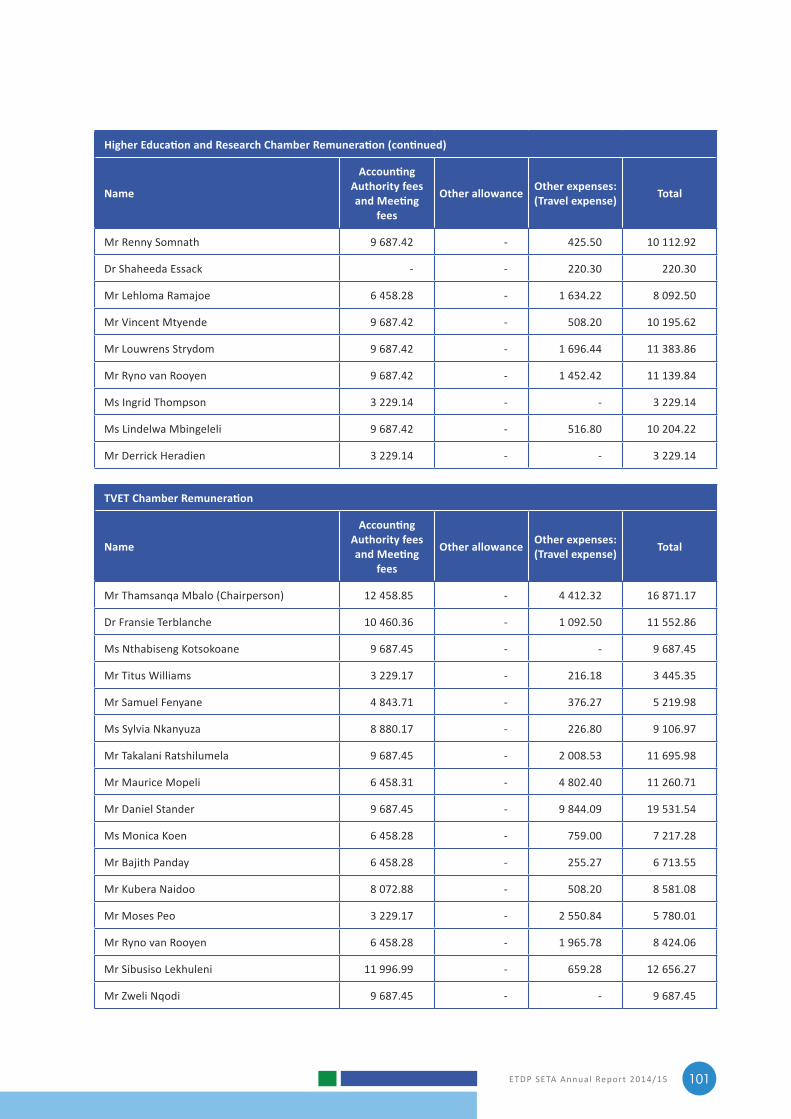
ETDP SETA Annual Report 2014/15 101
Higher Education and Research Chamber Remuneration (continued)
Name
Accounting Authority fees and Meeting
fees
Other allowance Other expenses: (Travel expense) Total
Mr Renny Somnath 9 687.42 ‑ 425.50 10 112.92
Dr Shaheeda Essack ‑ ‑ 220.30 220.30
Mr Lehloma Ramajoe 6 458.28 ‑ 1 634.22 8 092.50
Mr Vincent Mtyende 9 687.42 ‑ 508.20 10 195.62
Mr Louwrens Strydom 9 687.42 ‑ 1 696.44 11 383.86
Mr Ryno van Rooyen 9 687.42 ‑ 1 452.42 11 139.84
Ms Ingrid Thompson 3 229.14 ‑ ‑ 3 229.14
Ms Lindelwa Mbingeleli 9 687.42 ‑ 516.80 10 204.22
Mr Derrick Heradien 3 229.14 ‑ ‑ 3 229.14
TVET Chamber Remuneration
Name
Accounting Authority fees and Meeting
fees
Other allowance Other expenses: (Travel expense) Total
Mr Thamsanqa Mbalo (Chairperson) 12 458.85 ‑ 4 412.32 16 871.17
Dr Fransie Terblanche 10 460.36 ‑ 1 092.50 11 552.86
Ms Nthabiseng Kotsokoane 9 687.45 ‑ ‑ 9 687.45
Mr Titus Williams 3 229.17 ‑ 216.18 3 445.35
Mr Samuel Fenyane 4 843.71 ‑ 376.27 5 219.98
Ms Sylvia Nkanyuza 8 880.17 ‑ 226.80 9 106.97
Mr Takalani Ratshilumela 9 687.45 ‑ 2 008.53 11 695.98
Mr Maurice Mopeli 6 458.31 ‑ 4 802.40 11 260.71
Mr Daniel Stander 9 687.45 ‑ 9 844.09 19 531.54
Ms Monica Koen 6 458.28 ‑ 759.00 7 217.28
Mr Bajith Panday 6 458.28 ‑ 255.27 6 713.55
Mr Kubera Naidoo 8 072.88 ‑ 508.20 8 581.08
Mr Moses Peo 3 229.17 ‑ 2 550.84 5 780.01
Mr Ryno van Rooyen 6 458.28 ‑ 1 965.78 8 424.06
Mr Sibusiso Lekhuleni 11 996.99 ‑ 659.28 12 656.27
Mr Zweli Nqodi 9 687.45 ‑ ‑ 9 687.45
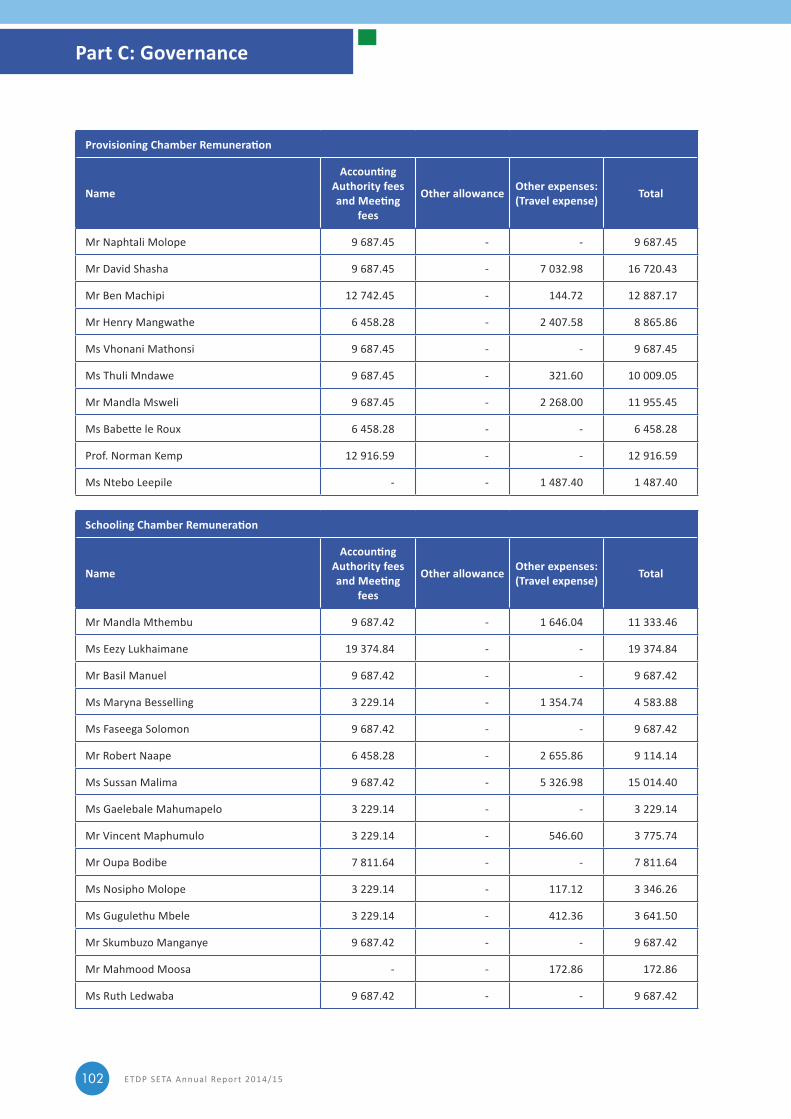
ETDP SETA Annual Report 2014/15102
Provisioning Chamber Remuneration
Name
Accounting Authority fees and Meeting
fees
Other allowance Other expenses: (Travel expense) Total
Mr Naphtali Molope 9 687.45 ‑ ‑ 9 687.45
Mr David Shasha 9 687.45 ‑ 7 032.98 16 720.43
Mr Ben Machipi 12 742.45 ‑ 144.72 12 887.17
Mr Henry Mangwathe 6 458.28 ‑ 2 407.58 8 865.86
Ms Vhonani Mathonsi 9 687.45 ‑ ‑ 9 687.45
Ms Thuli Mndawe 9 687.45 ‑ 321.60 10 009.05
Mr Mandla Msweli 9 687.45 ‑ 2 268.00 11 955.45
Ms Babette le Roux 6 458.28 ‑ ‑ 6 458.28
Prof. Norman Kemp 12 916.59 ‑ ‑ 12 916.59
Ms Ntebo Leepile ‑ ‑ 1 487.40 1 487.40
Schooling Chamber Remuneration
Name
Accounting Authority fees and Meeting
fees
Other allowance Other expenses: (Travel expense) Total
Mr Mandla Mthembu 9 687.42 ‑ 1 646.04 11 333.46
Ms Eezy Lukhaimane 19 374.84 ‑ ‑ 19 374.84
Mr Basil Manuel 9 687.42 ‑ ‑ 9 687.42
Ms Maryna Besselling 3 229.14 ‑ 1 354.74 4 583.88
Ms Faseega Solomon 9 687.42 ‑ ‑ 9 687.42
Mr Robert Naape 6 458.28 ‑ 2 655.86 9 114.14
Ms Sussan Malima 9 687.42 ‑ 5 326.98 15 014.40
Ms Gaelebale Mahumapelo 3 229.14 ‑ ‑ 3 229.14
Mr Vincent Maphumulo 3 229.14 ‑ 546.60 3 775.74
Mr Oupa Bodibe 7 811.64 ‑ ‑ 7 811.64
Ms Nosipho Molope 3 229.14 ‑ 117.12 3 346.26
Ms Gugulethu Mbele 3 229.14 ‑ 412.36 3 641.50
Mr Skumbuzo Manganye 9 687.42 ‑ ‑ 9 687.42
Mr Mahmood Moosa ‑ ‑ 172.86 172.86
Ms Ruth Ledwaba 9 687.42 ‑ ‑ 9 687.42
Part C: Governance
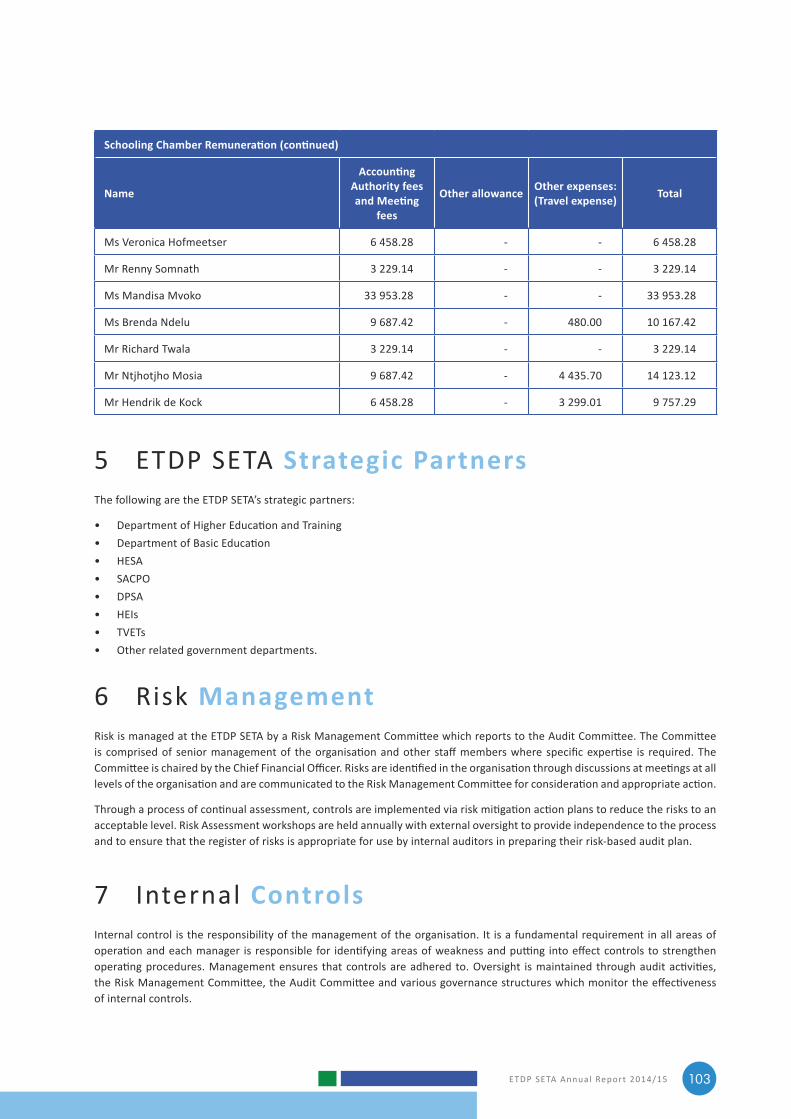
ETDP SETA Annual Report 2014/15 103
Schooling Chamber Remuneration (continued)
Name
Accounting Authority fees and Meeting
fees
Other allowance Other expenses: (Travel expense) Total
Ms Veronica Hofmeetser 6 458.28 ‑ ‑ 6 458.28
Mr Renny Somnath 3 229.14 ‑ ‑ 3 229.14
Ms Mandisa Mvoko 33 953.28 ‑ ‑ 33 953.28
Ms Brenda Ndelu 9 687.42 ‑ 480.00 10 167.42
Mr Richard Twala 3 229.14 ‑ ‑ 3 229.14
Mr Ntjhotjho Mosia 9 687.42 ‑ 4 435.70 14 123.12
Mr Hendrik de Kock 6 458.28 ‑ 3 299.01 9 757.29
5 ETDP SETA Strategic PartnersThe following are the ETDP SETA’s strategic partners:
• Department of Higher Education and Training• Department of Basic Education• HESA• SACPO• DPSA• HEIs• TVETs• Other related government departments.
6 Risk ManagementRisk is managed at the ETDP SETA by a Risk Management Committee which reports to the Audit Committee. The Committee is comprised of senior management of the organisation and other staff members where specific expertise is required. The Committee is chaired by the Chief Financial Officer. Risks are identified in the organisation through discussions at meetings at all levels of the organisation and are communicated to the Risk Management Committee for consideration and appropriate action.
Through a process of continual assessment, controls are implemented via risk mitigation action plans to reduce the risks to an acceptable level. Risk Assessment workshops are held annually with external oversight to provide independence to the process and to ensure that the register of risks is appropriate for use by internal auditors in preparing their risk‑based audit plan.
7 Internal ControlsInternal control is the responsibility of the management of the organisation. It is a fundamental requirement in all areas of operation and each manager is responsible for identifying areas of weakness and putting into effect controls to strengthen operating procedures. Management ensures that controls are adhered to. Oversight is maintained through audit activities, the Risk Management Committee, the Audit Committee and various governance structures which monitor the effectiveness of internal controls.
ETDP SETA Annual Report 2014/15104
8 Internal Audit and Audit Committee
8.1 Internal AuditThe ETDP SETA has strategically outsourced its internal audit function in order to provide the necessary level of expertise and independence to the organisation. The Internal Auditors prepared a risk‑based, three‑year rolling audit plan and a detailed annual audit plan, both of which were approved by the Audit Committee for implementation. The organisation’s risk register was used as a basis for determination of priorities and guided the internal audit function which then directed efforts at high risk areas to determine where corrective action needed to be taken as well as to provide assurance where systems were working well.
In the year under review the focus was on Performance Information, Contractual Commitments, Human Resources, Supply Chain Management and follow‑up of prior audit findings. The performance of internal audit is overseen by the Audit Committee.
8.2 Audit CommitteeThe Audit Committee is a sub-committee of the Accounting Authority and reports to the Accounting Authority. The Audit Committee is responsible for:
• The effectiveness of internal audit and internal controls• Risk management• The adequacy, reliability, accuracy and regularity of
financial information provided to the Accounting Authority
• Any accounting and audit concerns arising from audit• Legal and regulatory compliance.
Refer to Section 4.6.5 for Audit Committee membership and meeting attendance.
9 Compliance with Laws and Regulations
The ETDP SETA is a public entity tasked with the control of certain public funds. It is therefore required to act in compliance with public prescripts. The most significant laws and regulations under which it acts are the Constitution of the Republic of South Africa, 1996 (Act No. 108 of 1996) as
amended, the Public Finance Management Act, 1999 (Act No. 1 of 1999) as amended, Treasury Regulations, the Skills Development Act, 2008 (Act No. 97 of 1998) as amended in 2008, the Skills Development Levies Act, 1999 (Act No. 9 of 1999) the Grant Regulations and NSDS III. The ETDP SETA recognises its duty to comply with these prescripts and they are followed without deviation.
10 Fraud and Corruption
The ETDP SETA has a Fraud Prevention Policy and Plan which are approved by the Accounting Authority and are reviewed annually. The Policy and Plan are made available to staff for easy access and reference. Training is provided on fraud prevention at general staff meetings. The Plan contains a whistle‑blowing procedure and a fraud hotline is in place to allow staff and external parties to anonymously register suspected fraud. Fraudulent activities that are reported are handled by the Chairperson of the Audit Committee, to ensure independence. The Chairperson of the Audit and Risk Committee provides the report to the Accounting Authority and the CEO for implementation.
11 Minimising Conflict of Interest
Governance structure members are required to adhere to the code of conduct, set out in the ETDP SETA’s Constitution. Staff of the organisation have are bound by a code of ethics to a certain level of ethical behaviour. Any conflict of interest that might arise may be reported at meetings or directly to the office of the Chief Executive Officer. Members of governance structures who have declared a conflict of interest on a particular matter are required to recuse themselves from meetings where related matters are discussed. The organisation’s Supply Chain Management Policy specifically forbids governance structure members from participating in bidding processes.
All consultants and service providers providing services to the organisation are required to avoid conflicts with other assignments and their own corporate interests. comply with our bidding procedures and are required to sign the standard bidding documents. A register of declaration of conflicts of interests is circulated in all meetings and members are required to sign. These are kept as part of the organisational records.
Part C: Governance
ETDP SETA Annual Report 2014/15 105
12 Code of ConductThe ETDP SETA’s Code of Conduct, set out in Annexure 2 of its Constitution, is applicable to its Accounting Authority, Chambers and committees. There is also a code of conduct for staff which is included in the organisation’s Human Resource Policy.
13 Health, Safety and Environmental Issues
The Health, Safety and Wellness policies are included in the Human Resources Policy. The organisation has recently developed clear terms of reference which were adopted by both the Human Resources and the Risk Management committees. The aim is to improve the productivity of the organisation.
14 Audit Committee Report
Audit Committee Responsibilities The Audit Committee is responsible for the review of the following:
• The effectiveness of the internal control system• The effectiveness of the internal audit function• The risk areas of the ETDP SETA’s operations to be
covered in the scope of internal and external audit• The adequacy and reliability of the Performance and
Financial information provided by management• Any accounting and auditing concerns identified as a
result of internal and external audits• The ETDP SETA’s compliance with legal and regulatory
provisions• The activities of the internal audit function,
including its annual work programme, co-ordination with external auditors, the reports on significant investigations and the responses of management to specific recommendations
• A review of the annual financial statements and the opinion expressed by the Auditor‑General thereon.
Effectiveness of Internal Control The Audit Committee has reviewed the internal controls for effectiveness and adequacy. Our assessment of internal controls is that they need improvement. This is consistent with the reports of internal auditors as well as the management report of the Auditor‑General South Africa.
Quality of Management and Monthly/Quarterly Reports Submitted in Terms of Legislation The Audit Committee received and reviewed quarterly financial and performance reports. Where performances were below the Annual Performance Plan targets, management provided reasons for such under‑performance and put in place plans to improve identified performance deficiencies.
Evaluation of the Public Entity’s Financial Statements The Audit Committee evaluated the annual financial statements presented in the annual report. The annual financial statements fairly present the financial performance, financial position and results of financial operations.
Principal Activities of the Audit Committee during 2014/15The Audit Committee undertook the following activities (amongst others) during the financial year:
• Reviewed strategic and operational risk management controls in the SETA
• Reviewed the final risk register prepared by the ETDP SETA management
• Reviewed quarterly operational and financial performance information prepared by the ETDP SETA’s management for final approval by its Board
• Reviewed and approved the risk‑based internal audit plan prepared by internal auditors
• Reviewed the Audit Committee Charter to ensure its continuing relevance and presented the same to the Board for their final approval
• Reviewed and approved the Internal Audit Charter• Received periodic internal audit reports on their
findings• Conducted a peer review as well as a review of the
internal audit function• Attended Board meetings to raise any concerns that
the Audit Committee might have had• Received anonymous whistle‑blowing reports from
an independent service provider and followed up the same with management where relevant.
ETDP SETA Annual Report 2014/15106
Internal Audit The Internal Auditors of the ETDP SETA conducted reviews of reports on Predetermined Objectives, commitment schedules, Skills Plan implementation (Learnership and Skills Programme), Supply Chain Management, Human Resources Management and follow‑ups on Governance and the Auditor-General’s Management Report in the financial year. Recommendations were made and incorporated into procedures and controls of the organisation.
External Audit There are no unresolved issues raised by the Auditor‑General.
There are no additional matters that we wish to raise pertaining specifically to the ETDP SETA.
Conclusion This report must be read together with the annual report.
Mr Vusi Mokwena: CA (SA)Audit Committee ChairpersonETDP SETA
Date: 31 July 2015
Part C: Governance

Part D Human Resource Management
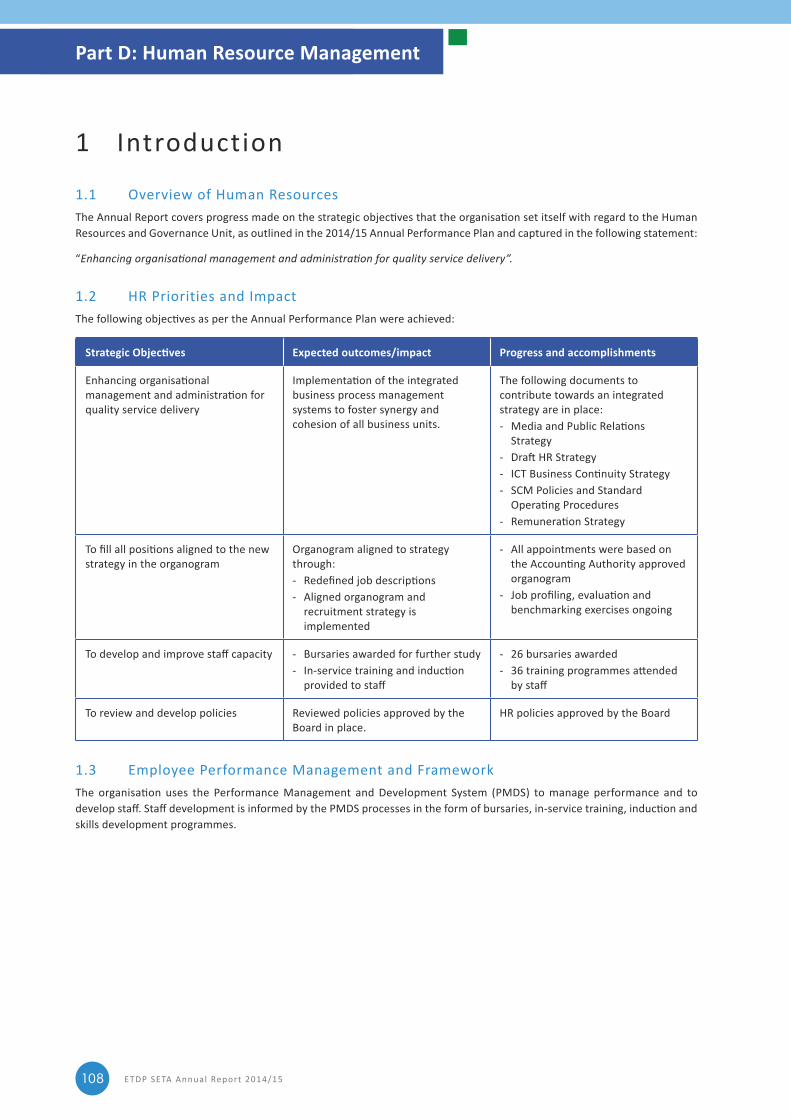
ETDP SETA Annual Report 2014/15108
1 Introduction
1.1 Overview of Human ResourcesThe Annual Report covers progress made on the strategic objectives that the organisation set itself with regard to the Human Resources and Governance Unit, as outlined in the 2014/15 Annual Performance Plan and captured in the following statement:
“Enhancing organisational management and administration for quality service delivery”.
1.2 HR Priorities and ImpactThe following objectives as per the Annual Performance Plan were achieved:
Strategic Objectives Expected outcomes/impact Progress and accomplishments
Enhancing organisational management and administration for quality service delivery
Implementation of the integrated business process management systems to foster synergy and cohesion of all business units.
The following documents to contribute towards an integrated strategy are in place:- Media and Public Relations
Strategy- Draft HR Strategy- ICT Business Continuity Strategy‑ SCM Policies and Standard
Operating Procedures- Remuneration Strategy
To fill all positions aligned to the new strategy in the organogram
Organogram aligned to strategy through:- Redefined job descriptions‑ Aligned organogram and
recruitment strategy is implemented
‑ All appointments were based on the Accounting Authority approved organogram
- Job profiling, evaluation and benchmarking exercises ongoing
To develop and improve staff capacity ‑ Bursaries awarded for further study- In-service training and induction
provided to staff
‑ 26 bursaries awarded- 36 training programmes attended
by staff
To review and develop policies Reviewed policies approved by the Board in place.
HR policies approved by the Board
1.3 Employee Performance Management and FrameworkThe organisation uses the Performance Management and Development System (PMDS) to manage performance and to develop staff. Staff development is informed by the PMDS processes in the form of bursaries, in-service training, induction and skills development programmes.
Part D: Human Resource Management
ETDP SETA Annual Report 2014/15 109
1.4 Employee Wellness ProgrammeThe ETDP SETA has developed a set of principles that forms the basis for the employee assistance programme to be managed by a professional service provider. These principles provide clear guidelines and the scope for the programme that will create a productive workforce.
1.5 Policy DevelopmentThe organisation has in place Policies and Standard Operating Procedures, that provide clear direction to the staff with regard to values, vision, mission, objectives, code of ethics, disciplinary procedures and other regulations. Policies are reviewed on an annual basis, and all policies were approved by the Accounting Authority for the year under review.
1.6 AchievementsProgress was made during the review period in the following areas:
• The Remuneration Strategy is in its final stage of development and the Accounting Authority is providing guidance in this regard
• A multi-year salary adjustment agreement was successfully negotiated with the National Education, Health and Allied Workers’ Union (NEHAWU) which contributes to positive and harmonious labour relations in the organisation
• A Recognition Agreement was concluded and signed by all parties which further regulates and provides the means for engagement and positive co-existence between the employer and employee parties.
1.7 Challenges IdentifiedThe staff turn-over rate during the period was uncomfortably high. This is due to the uncertainty of employment contracts beyond 2016.
1.8 Future Human Resources Plans• Equate the Peromnes system with the Patterson system of the DPSA to align remuneration • Ensure the seamless implementation of the integrated business management process to enable synergy and coherence
for all business units in the organisation• Develop and implement an improved recruitment strategy that will attract the required set of skills within a short period
of time to mitigate of the perceived insecurity in the current SETA landscape.
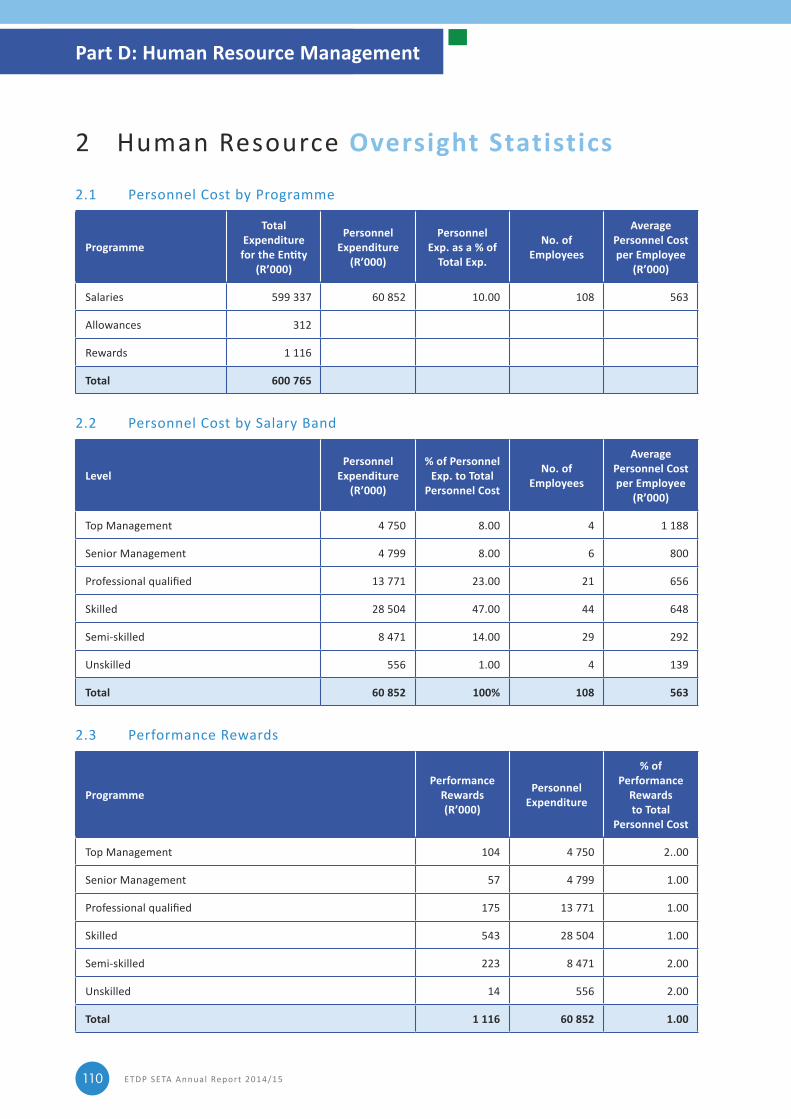
ETDP SETA Annual Report 2014/15110
2 Human Resource Oversight Statistics
2.1 Personnel Cost by Programme
Programme
Total Expenditure for the Entity
(R’000)
Personnel Expenditure
(R’000)
Personnel Exp. as a % of
Total Exp.
No. of Employees
Average Personnel Cost per Employee
(R’000)
Salaries 599 337 60 852 10.00 108 563
Allowances 312
Rewards 1 116
Total 600 765
2.2 Personnel Cost by Salary Band
Level Personnel
Expenditure (R’000)
% of Personnel Exp. to Total
Personnel Cost
No. of Employees
Average Personnel Cost per Employee
(R’000)
Top Management 4 750 8.00 4 1 188
Senior Management 4 799 8.00 6 800
Professional qualified 13 771 23.00 21 656
Skilled 28 504 47.00 44 648
Semi‑skilled 8 471 14.00 29 292
Unskilled 556 1.00 4 139
Total 60 852 100% 108 563
2.3 Performance Rewards
ProgrammePerformance
Rewards (R’000)
Personnel Expenditure
% of Performance
Rewards to Total
Personnel Cost
Top Management 104 4 750 2..00
Senior Management 57 4 799 1.00
Professional qualified 175 13 771 1.00
Skilled 543 28 504 1.00
Semi‑skilled 223 8 471 2.00
Unskilled 14 556 2.00
Total 1 116 60 852 1.00
Part D: Human Resource Management
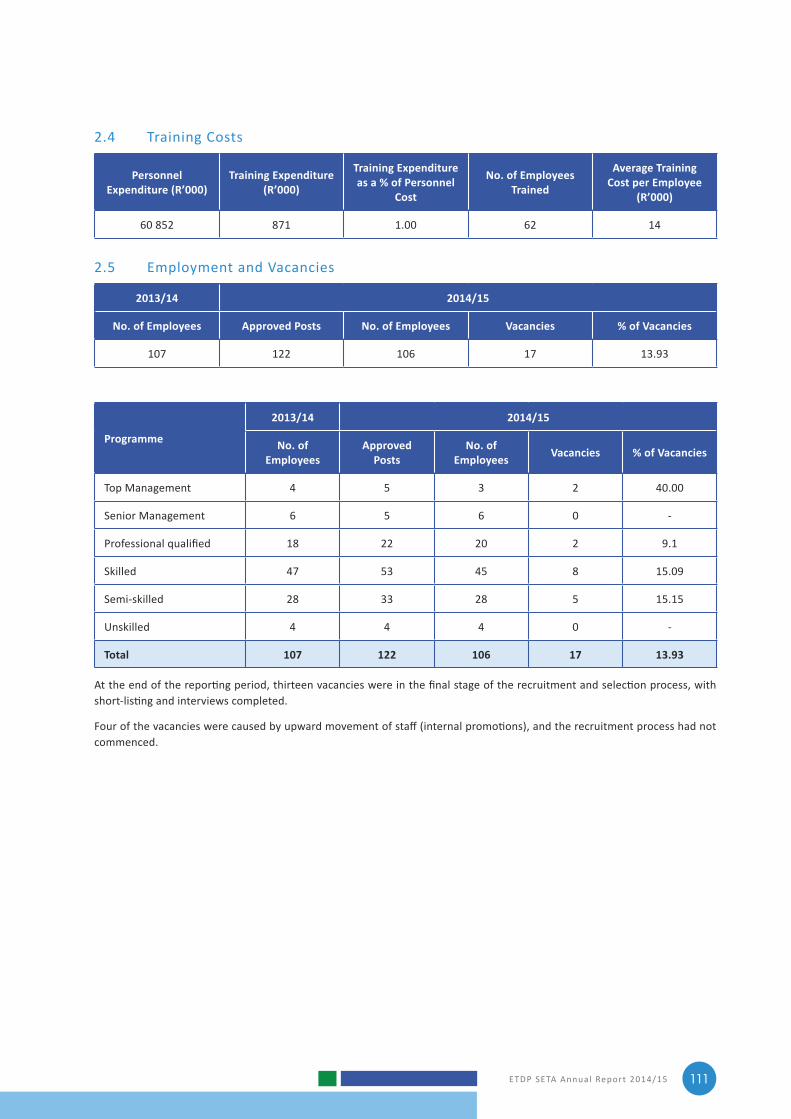
ETDP SETA Annual Report 2014/15 111
2.4 Training Costs
Personnel Expenditure (R’000)
Training Expenditure (R’000)
Training Expenditure as a % of Personnel
Cost
No. of Employees Trained
Average Training Cost per Employee
(R’000)
60 852 871 1.00 62 14
2.5 Employment and Vacancies
2013/14 2014/15
No. of Employees Approved Posts No. of Employees Vacancies % of Vacancies
107 122 106 17 13.93
Programme
2013/14 2014/15
No. of Employees
Approved Posts
No. of Employees Vacancies % of Vacancies
Top Management 4 5 3 2 40.00
Senior Management 6 5 6 0 ‑
Professional qualified 18 22 20 2 9.1
Skilled 47 53 45 8 15.09
Semi‑skilled 28 33 28 5 15.15
Unskilled 4 4 4 0 ‑
Total 107 122 106 17 13.93
At the end of the reporting period, thirteen vacancies were in the final stage of the recruitment and selection process, with short-listing and interviews completed.
Four of the vacancies were caused by upward movement of staff (internal promotions), and the recruitment process had not commenced.
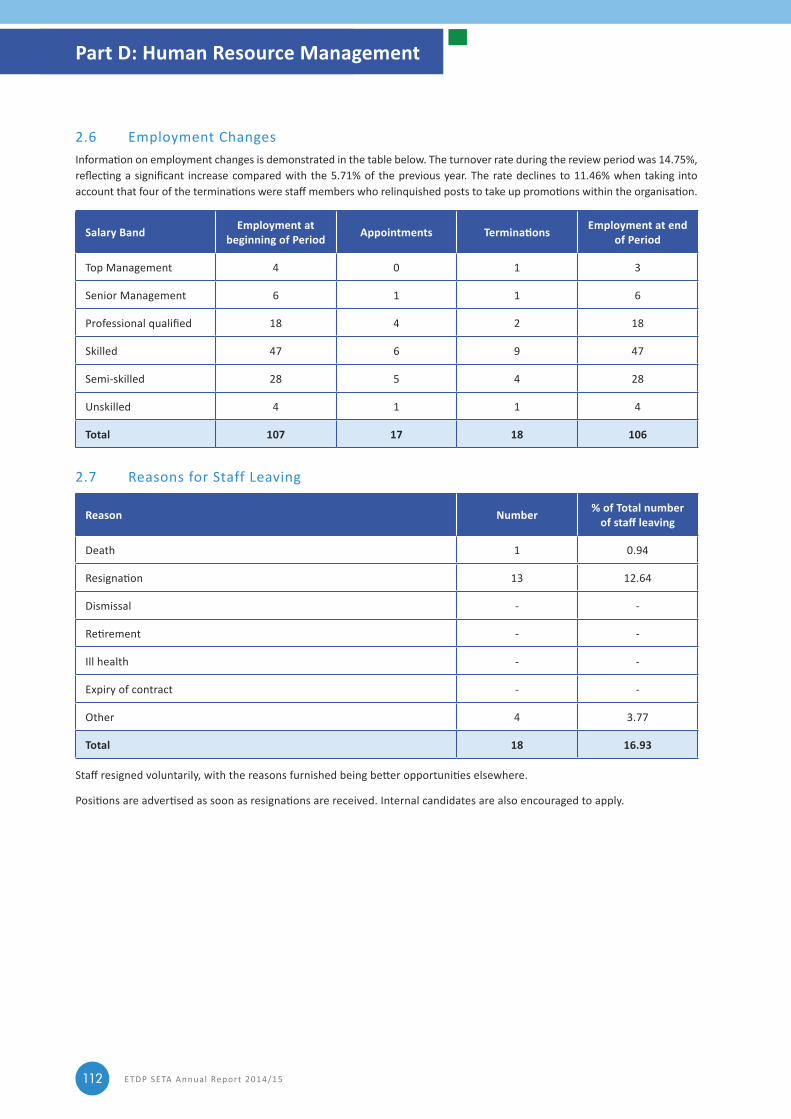
ETDP SETA Annual Report 2014/15112
2.6 Employment ChangesInformation on employment changes is demonstrated in the table below. The turnover rate during the review period was 14.75%, reflecting a significant increase compared with the 5.71% of the previous year. The rate declines to 11.46% when taking into account that four of the terminations were staff members who relinquished posts to take up promotions within the organisation.
Salary Band Employment at beginning of Period Appointments Terminations Employment at end
of Period
Top Management 4 0 1 3
Senior Management 6 1 1 6
Professional qualified 18 4 2 18
Skilled 47 6 9 47
Semi‑skilled 28 5 4 28
Unskilled 4 1 1 4
Total 107 17 18 106
2.7 Reasons for Staff Leaving
Reason Number % of Total number of staff leaving
Death 1 0.94
Resignation 13 12.64
Dismissal ‑ ‑
Retirement ‑ ‑
Ill health ‑ ‑
Expiry of contract ‑ ‑
Other 4 3.77
Total 18 16.93
Staff resigned voluntarily, with the reasons furnished being better opportunities elsewhere.
Positions are advertised as soon as resignations are received. Internal candidates are also encouraged to apply.
Part D: Human Resource Management
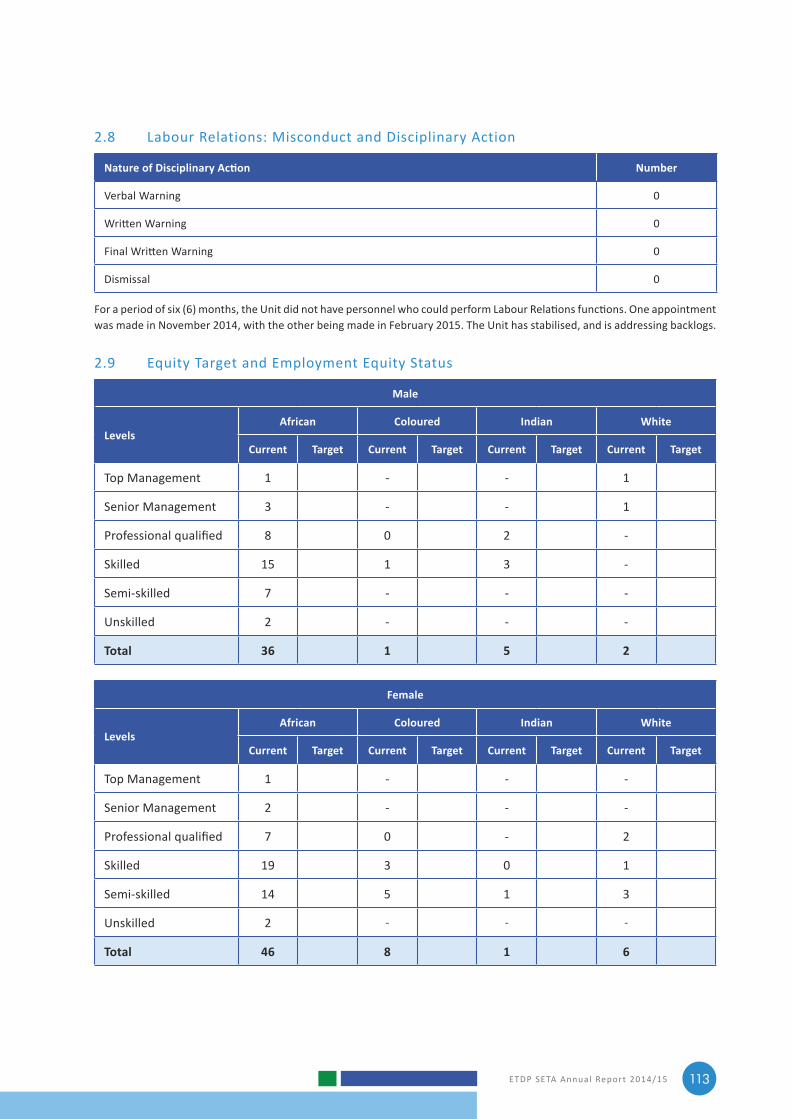
ETDP SETA Annual Report 2014/15 113
2.8 Labour Relations: Misconduct and Disciplinary Action
Nature of Disciplinary Action Number
Verbal Warning 0
Written Warning 0
Final Written Warning 0
Dismissal 0
For a period of six (6) months, the Unit did not have personnel who could perform Labour Relations functions. One appointment was made in November 2014, with the other being made in February 2015. The Unit has stabilised, and is addressing backlogs.
2.9 Equity Target and Employment Equity Status
Male
LevelsAfrican Coloured Indian White
Current Target Current Target Current Target Current Target
Top Management 1 ‑ ‑ 1
Senior Management 3 ‑ ‑ 1
Professional qualified 8 0 2 ‑
Skilled 15 1 3 ‑
Semi‑skilled 7 ‑ ‑ ‑
Unskilled 2 ‑ ‑ ‑
Total 36 1 5 2
Female
LevelsAfrican Coloured Indian White
Current Target Current Target Current Target Current Target
Top Management 1 ‑ ‑ ‑
Senior Management 2 ‑ ‑ ‑
Professional qualified 7 0 ‑ 2
Skilled 19 3 0 1
Semi‑skilled 14 5 1 3
Unskilled 2 ‑ ‑ ‑
Total 46 8 1 6
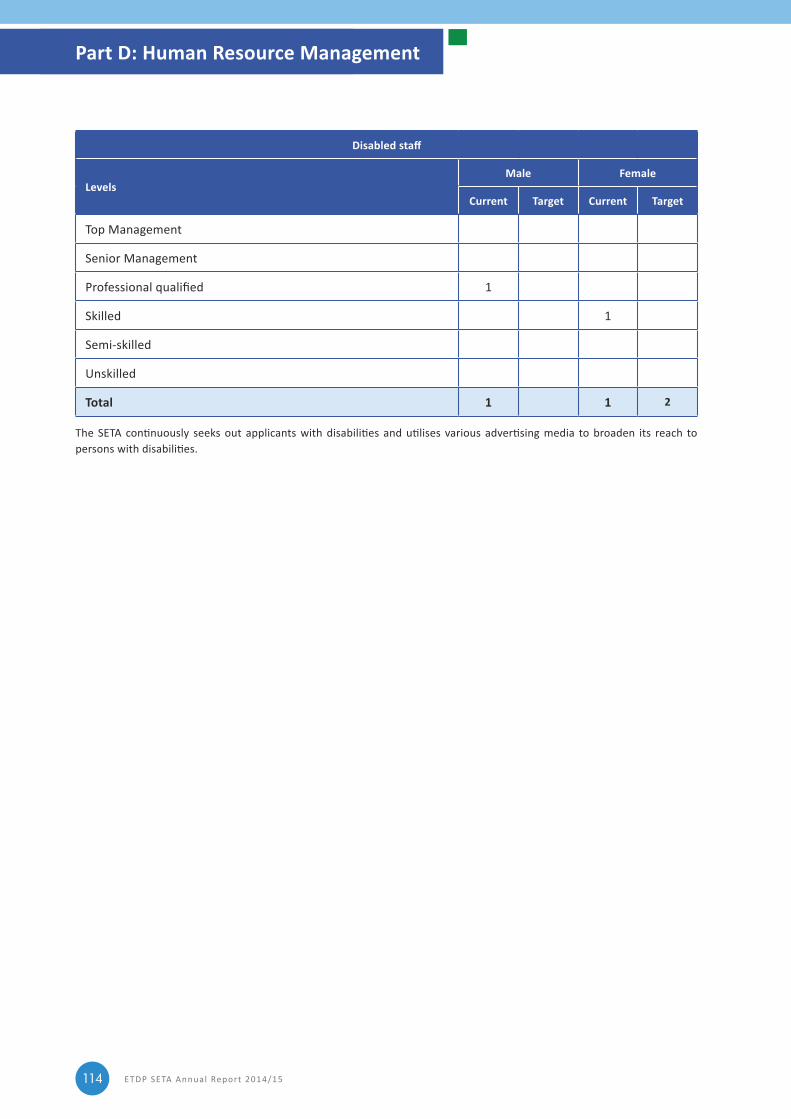
ETDP SETA Annual Report 2014/15114
Disabled staff
LevelsMale Female
Current Target Current Target
Top Management
Senior Management
Professional qualified 1
Skilled 1
Semi‑skilled
Unskilled
Total 1 1 2
The SETA continuously seeks out applicants with disabilities and utilises various advertising media to broaden its reach to persons with disabilities.
Part D: Human Resource Management
Part E Financial Information
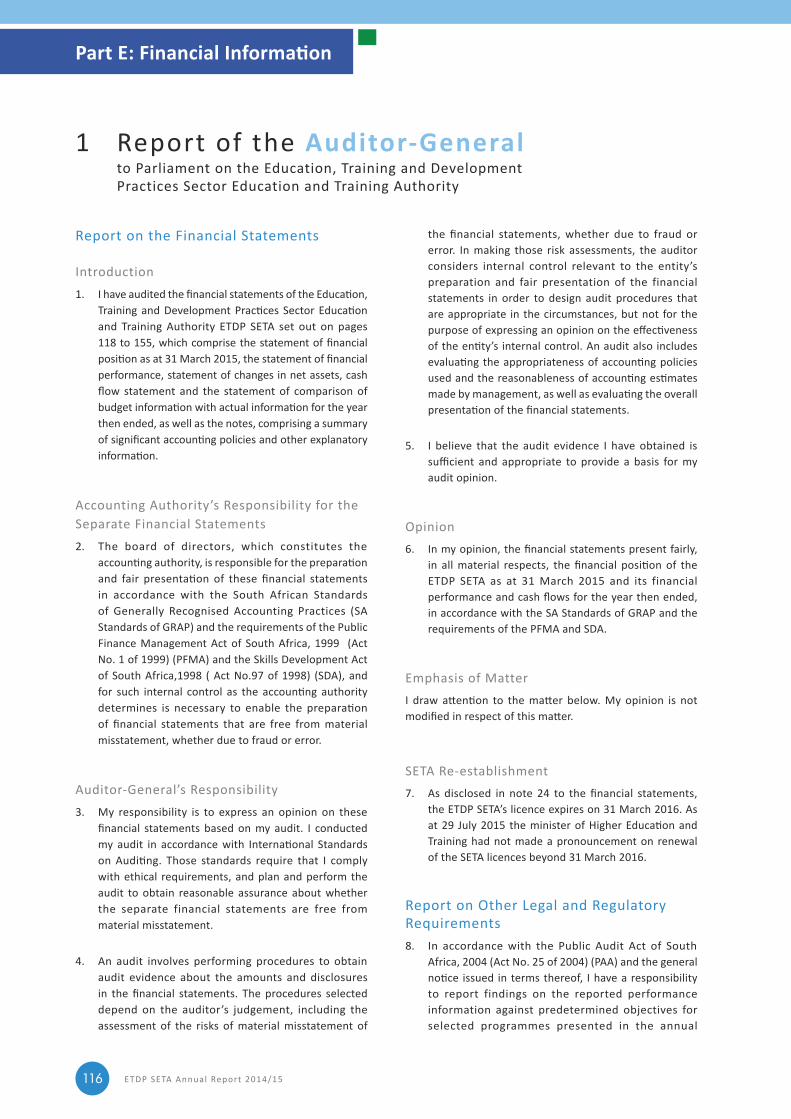
ETDP SETA Annual Report 2014/15116
Report on the Financial Statements
Introduction1. I have audited the financial statements of the Education,
Training and Development Practices Sector Education and Training Authority ETDP SETA set out on pages 118 to 155, which comprise the statement of financial position as at 31 March 2015, the statement of financial performance, statement of changes in net assets, cash flow statement and the statement of comparison of budget information with actual information for the year then ended, as well as the notes, comprising a summary of significant accounting policies and other explanatory information.
Accounting Authority’s Responsibility for the Separate Financial Statements2. The board of directors, which constitutes the
accounting authority, is responsible for the preparation and fair presentation of these financial statements in accordance with the South African Standards of Generally Recognised Accounting Practices (SA Standards of GRAP) and the requirements of the Public Finance Management Act of South Africa, 1999 (Act No. 1 of 1999) (PFMA) and the Skills Development Act of South Africa,1998 ( Act No.97 of 1998) (SDA), and for such internal control as the accounting authority determines is necessary to enable the preparation of financial statements that are free from material misstatement, whether due to fraud or error.
Auditor‑General’s Responsibility3. My responsibility is to express an opinion on these
financial statements based on my audit. I conducted my audit in accordance with International Standards on Auditing. Those standards require that I comply with ethical requirements, and plan and perform the audit to obtain reasonable assurance about whether the separate financial statements are free from material misstatement.
4. An audit involves performing procedures to obtain audit evidence about the amounts and disclosures in the financial statements. The procedures selected depend on the auditor’s judgement, including the assessment of the risks of material misstatement of
the financial statements, whether due to fraud or error. In making those risk assessments, the auditor considers internal control relevant to the entity’s preparation and fair presentation of the financial statements in order to design audit procedures that are appropriate in the circumstances, but not for the purpose of expressing an opinion on the effectiveness of the entity’s internal control. An audit also includes evaluating the appropriateness of accounting policies used and the reasonableness of accounting estimates made by management, as well as evaluating the overall presentation of the financial statements.
5. I believe that the audit evidence I have obtained is sufficient and appropriate to provide a basis for my audit opinion.
Opinion 6. In my opinion, the financial statements present fairly,
in all material respects, the financial position of the ETDP SETA as at 31 March 2015 and its financial performance and cash flows for the year then ended, in accordance with the SA Standards of GRAP and the requirements of the PFMA and SDA.
Emphasis of Matter I draw attention to the matter below. My opinion is not modified in respect of this matter.
SETA Re‑establishment7. As disclosed in note 24 to the financial statements,
the ETDP SETA’s licence expires on 31 March 2016. As at 29 July 2015 the minister of Higher Education and Training had not made a pronouncement on renewal of the SETA licences beyond 31 March 2016.
Report on Other Legal and Regulatory Requirements8. In accordance with the Public Audit Act of South
Africa, 2004 (Act No. 25 of 2004) (PAA) and the general notice issued in terms thereof, I have a responsibility to report findings on the reported performance information against predetermined objectives for selected programmes presented in the annual
1 Report of the Auditor-General to Parliament on the Education, Training and Development
Practices Sector Education and Training Authority
Part E: Financial Information
ETDP SETA Annual Report 2014/15 117
performance report, compliance with legislation and internal control. The objective of my tests was to identify reportable findings as described under each subheading but not to gather evidence to express assurance on these matters. Accordingly, I do not express an opinion or conclusion on these matters.
Predetermined Objectives9. I performed procedures to obtain evidence about the
usefulness and reliability of the reported performance information for the following selected programmes presented in the annual performance report of the public entity for the year ended 31 March 2015:
• Programme 2: Supporting FETs and HEIs to be responsive to ETD sector and national priorities
• Programme 3: Teacher development in support of the integrated strategic planning framework for teacher education and development in South Africa
• Programme 4: Increasing student access to and graduate output in higher and further education institutions
• Programme 5: Youth development for employability.
10. I evaluated the reported performance information against the overall criteria of usefulness and reliability.
11. I evaluated the usefulness of the reported performance information to determine whether it was presented in accordance with the National Treasury’s annual reporting principles and whether the reported performance was consistent with the planned programmes. I further performed tests to determine whether indicators and targets were well defined, verifiable, specific, measurable, time bound and relevant, as required by the National Treasury’s Framework for managing programme performance information (FMPPI).
12. I assessed the reliability of the reported performance information to determine whether it was valid, accurate and complete.
13. I did not raise any material findings on the usefulness and reliability of the reported performance information for the following programmes:
• Programme 2: Supporting FETs and HEIs to be responsive to ETD sector and national priorities
• Programme 3: Teacher development in support of the integrated strategic planning framework
for teacher education and development in South Africa
• Programme 4: Increasing student access to and graduate output in higher and further education institutions
• Programme 5: Youth development for employability.
Additional Matter 14. Although I raised no material findings on the
usefulness and reliability of the reported performance information for the selected programmes, I draw attention to the following matter:
Achievement of Planned Targets15. Refer to the annual performance report on pages 18 to
86 for information on the achievement of the planned targets for the year.
Compliance with Legislation16. I performed procedures to obtain evidence that
the entity had complied with applicable legislation regarding financial matters, financial management and other related matters. I did not identify any instances of material non-compliance with specific matters in key legislation, as set out in the general notice issued in terms of the PAA.
Internal ControlI considered internal control relevant to my audit of the financial statements, the ETDP’s annual performance report and compliance with legislation. I did not identify any significant deficiencies in internal controls.
Pretoria
Date: 31 July 2015
ETDP SETA Annual Report 2014/15118
2 Education, Training and Development Practices Sector Education and Training Authority Annual Financial Statements
for the year ended 31 March 2015
The Annual Financial Statements for the year ended 31 March 2015 have been approved by the Accounting Authority in terms of section 51(1)(f) of the Public Finance Management Act (PFMA), 1999 (Act No. 1 of 1999) on 28 May 2015, and are signed on its behalf by:
Ms Sesi Nombulelo Nxesi Chief Executive Officer ETDP SETA
Date: 31 July 2015
Ms Shirley MabuselaAccounting Authority ChairpersonETDP SETA
Date: 31 July 2015
Part E: Financial Information
ETDP SETA Annual Report 2014/15 119
Contents
Page
Statement of Financial Performance ....................................................................................... 120
Statement of Financial Position .............................................................................................. 121
Statement of Changes in Net Assets ....................................................................................... 122
Cash Flow Statement ............................................................................................................. 123
Notes to the Annual Financial Statements .............................................................................. 124
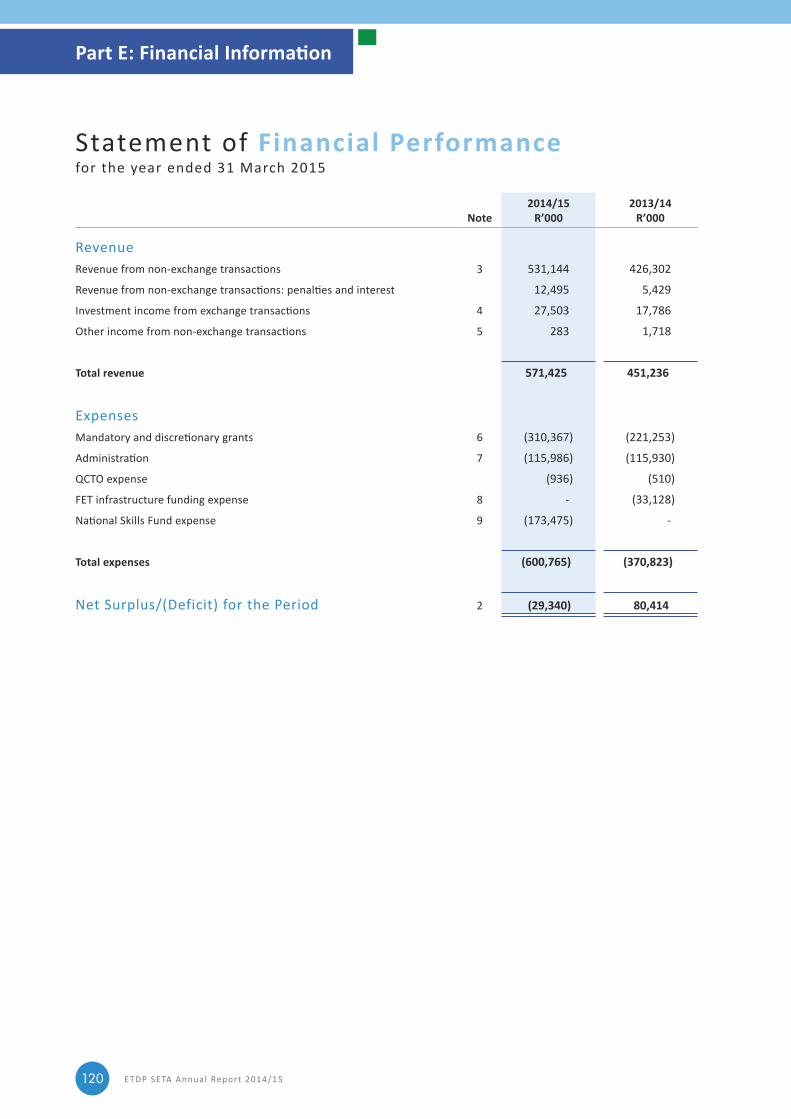
ETDP SETA Annual Report 2014/15120
Note2014/15
R’0002013/14
R’000
RevenueRevenue from non-exchange transactions 3 531,144 426,302
Revenue from non-exchange transactions: penalties and interest 12,495 5,429
Investment income from exchange transactions 4 27,503 17,786
Other income from non-exchange transactions 5 283 1,718
Total revenue 571,425 451,236
ExpensesMandatory and discretionary grants 6 (310,367) (221,253)
Administration 7 (115,986) (115,930)
QCTO expense (936) (510)
FET infrastructure funding expense 8 ‑ (33,128)
National Skills Fund expense 9 (173,475) ‑
Total expenses (600,765) (370,823)
Net Surplus/(Deficit) for the Period 2 (29,340) 80,414
Statement of Financial Performance for the year ended 31 March 2015
Part E: Financial Information
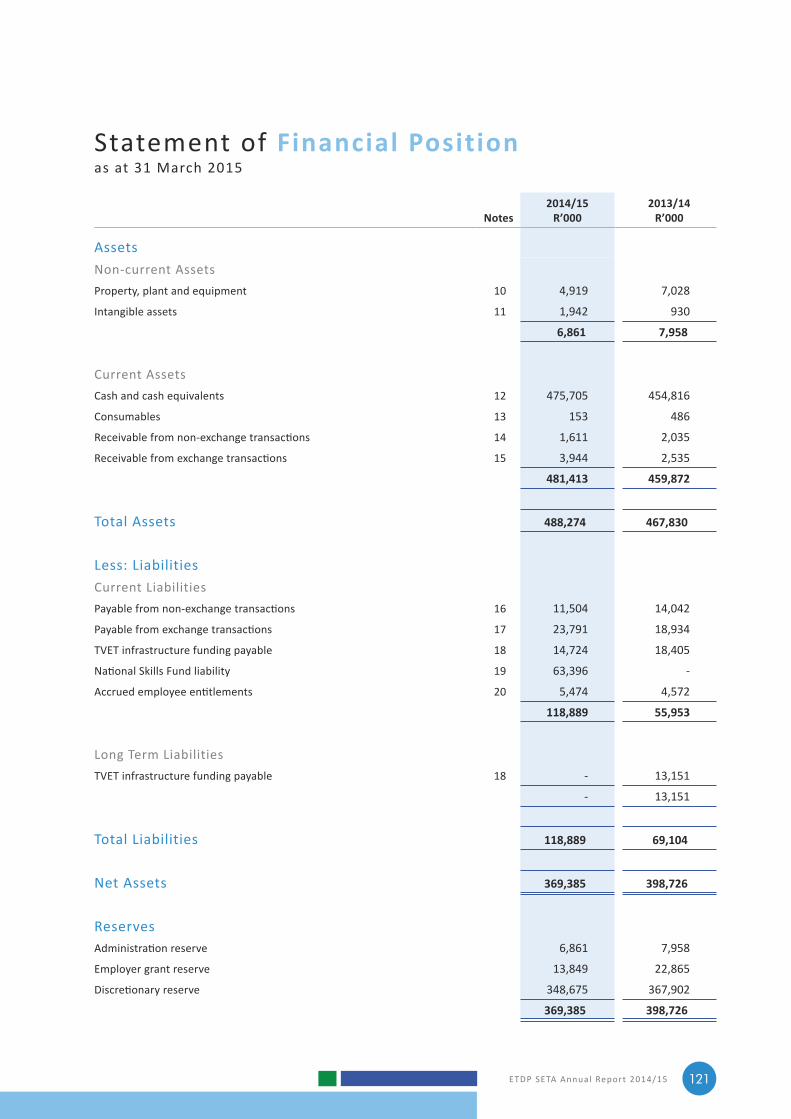
ETDP SETA Annual Report 2014/15 121
Notes2014/15
R’0002013/14
R’000
Assets Non‑current Assets Property, plant and equipment 10 4,919 7,028
Intangible assets 11 1,942 930
6,861 7,958
Current Assets Cash and cash equivalents 12 475,705 454,816
Consumables 13 153 486
Receivable from non-exchange transactions 14 1,611 2,035
Receivable from exchange transactions 15 3,944 2,535
481,413 459,872
Total Assets 488,274 467,830
Less: Liabilities Current Liabilities Payable from non-exchange transactions 16 11,504 14,042
Payable from exchange transactions 17 23,791 18,934
TVET infrastructure funding payable 18 14,724 18,405
National Skills Fund liability 19 63,396 ‑
Accrued employee entitlements 20 5,474 4,572
118,889 55,953
Long Term Liabilities TVET infrastructure funding payable 18 ‑ 13,151
‑ 13,151
Total Liabilities 118,889 69,104
Net Assets 369,385 398,726
Reserves Administration reserve 6,861 7,958
Employer grant reserve 13,849 22,865
Discretionary reserve 348,675 367,902
369,385 398,726
Statement of Financial Position as at 31 March 2015
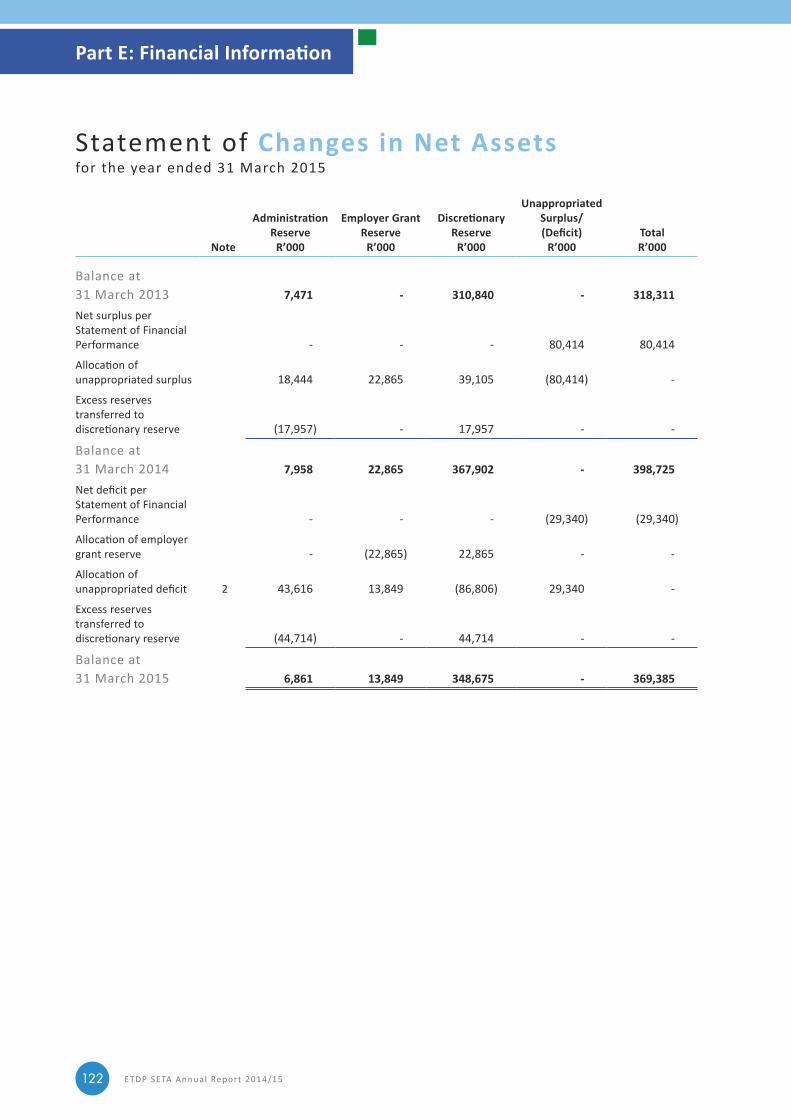
ETDP SETA Annual Report 2014/15122
Note
Administration Reserve
R’000
Employer Grant Reserve
R’000
Discretionary Reserve
R’000
Unappropriated Surplus/(Deficit)
R’000 Total R’000
Balance at 31 March 2013 7,471 - 310,840 - 318,311
Net surplus per Statement of Financial Performance ‑ ‑ ‑ 80,414 80,414
Allocation of unappropriated surplus 18,444 22,865 39,105 (80,414) ‑
Excess reserves transferred to discretionary reserve (17,957) ‑ 17,957 ‑ ‑
Balance at 31 March 2014 7,958 22,865 367,902 - 398,725
Net deficit per Statement of Financial Performance ‑ ‑ ‑ (29,340) (29,340)
Allocation of employer grant reserve ‑ (22,865) 22,865 ‑ ‑
Allocation of unappropriated deficit 2 43,616 13,849 (86,806) 29,340 ‑
Excess reserves transferred to discretionary reserve (44,714) ‑ 44,714 ‑ ‑
Balance at 31 March 2015 6,861 13,849 348,675 - 369,385
Statement of Changes in Net Assets for the year ended 31 March 2015
Part E: Financial Information
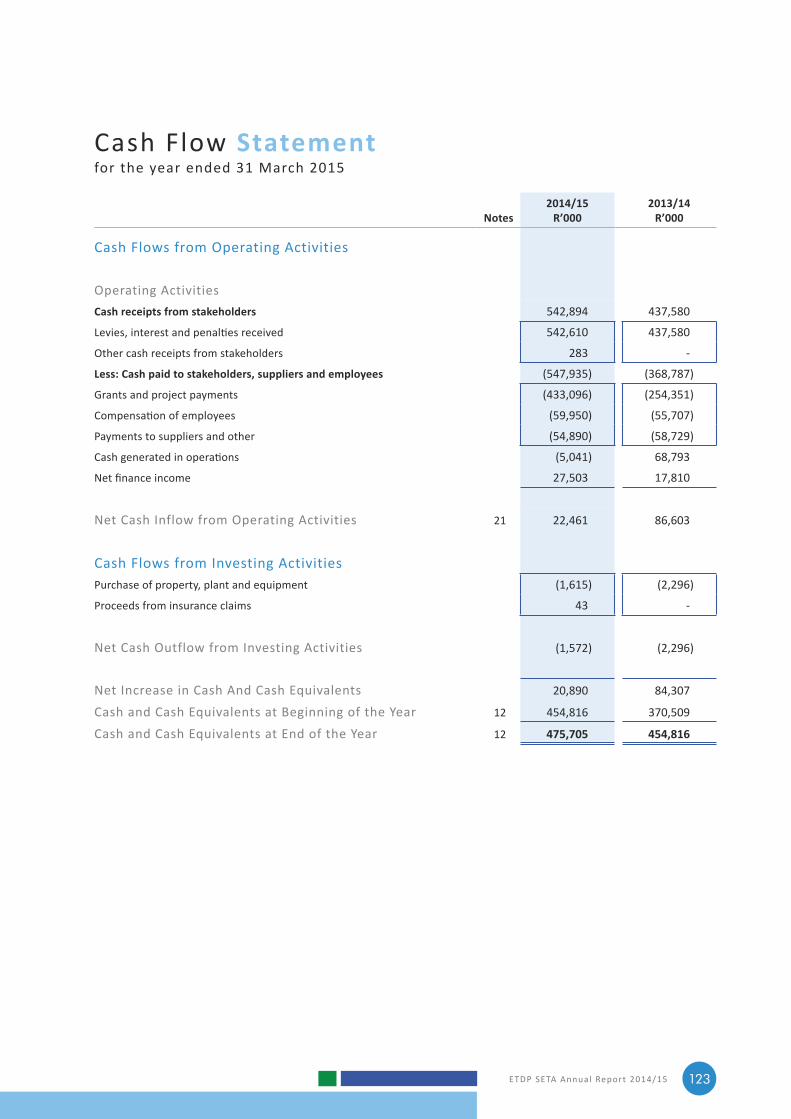
ETDP SETA Annual Report 2014/15 123
Notes2014/15
R’0002013/14
R’000
Cash Flows from Operating Activities
Operating Activities Cash receipts from stakeholders 542,894 437,580
Levies, interest and penalties received 542,610 437,580
Other cash receipts from stakeholders 283 ‑
Less: Cash paid to stakeholders, suppliers and employees (547,935) (368,787)
Grants and project payments (433,096) (254,351)
Compensation of employees (59,950) (55,707)
Payments to suppliers and other (54,890) (58,729)
Cash generated in operations (5,041) 68,793
Net finance income 27,503 17,810
Net Cash Inflow from Operating Activities 21 22,461 86,603
Cash Flows from Investing Activities Purchase of property, plant and equipment (1,615) (2,296)
Proceeds from insurance claims 43 ‑
Net Cash Outflow from Investing Activities (1,572) (2,296)
Net Increase in Cash And Cash Equivalents 20,890 84,307
Cash and Cash Equivalents at Beginning of the Year 12 454,816 370,509
Cash and Cash Equivalents at End of the Year 12 475,705 454,816
Cash Flow Statementfor the year ended 31 March 2015
ETDP SETA Annual Report 2014/15124
1 Accounting Policies The principal accounting policies adopted in the preparation of these financial statements are set out below and are, in all material respects, consistent with those of the previous year, except as otherwise indicated.
1.1 Basis of Preparation The financial statements have been prepared in accordance with the effective South African Standards of Generally Recognised Accounting Practice (Standards of GRAP) including any interpretations, guidelines and directives issued by the Accounting Standards Board.
1.2 Currency and Level of Rounding These financial statements are presented in South African Rands, as this is the currency in which all entity transactions are denominated. Furthermore, all figures presented are rounded to the nearest thousand.
1.3 Revenue Recognition Skills Development Levy transfers are recognised when it is probable that future economic benefits will flow to the Education, Training and Development Practices Sector Education and Training Authority (ETDP SETA) and these benefits can be measured reliably. This occurs when the Department of Higher Education and Training (DHET) either makes an allocation or payment, whichever comes first, to the ETDP SETA as required by Section 8 of the Skills Development Levies Act, 1999 (Act No. 9 of 1999). The Skills Development Levy transfer is measured at the fair value of the consideration received. Contributions from the Departments of Basic Education (DBE) are recognised when cash is received.
1.3.1 Levy Income
In terms of Section 3(1) and 3(4) of the Skills Development Levies Act, 1999 (Act No. 9 of 1999), registered member companies of the ETDP SETA pay a skills development levy of 1% of their total payroll cost to the South African Revenue Service (SARS).
80% of skills development levies are paid over to the ETDP SETA (net of the 20% contribution to the National Skills Fund (NSF)).
Levy income is recognised at the earlier of the allocation of monies by the DHET to the ETDP SETA or when cash is received.
The ETDP SETA refunds amounts to employers in the form of grants, based on information from SARS. Where SARS retrospectively amends the information on levies collected, it may result in grants that have been paid to certain employers that are in excess of the amount the ETDP SETA is permitted to have granted to employers. A receivable relating to the overpayment to the employer in earlier periods is raised at the amount of such grant overpayment, net of bad debts and provision for irrecoverable amounts.
Revenue is adjusted for inter‑SETA transfers due to employers changing SETAs. Such adjustments are separately disclosed as inter‑SETA transfers. The amount of the inter‑SETA adjustment is calculated according to the Standard Operating Procedure issued in October 2006 by the Department of Labour.
When a new employer is transferred to the ETDP SETA, the levies transferred by the former SETA are recognised as revenue and allocated to the respective category to maintain its original identity.
Employers who have annual payrolls below R500,000 have been exempted from further payment of skills development levies. In cases where payments have been made by these employers in error, an accrual has been made for the refund of the levies covering a period of 5 years (Prior year: 5 years).
1.3.2 Contributions by the Departments of Education
The Provincial and National Departments of Education contribute 30% of their annual training budgets to the ETDP SETA, as per a Cabinet decision. The 30% receipt is utilised for administration (one third) and discretionary projects (two thirds).
Contributions by the departments of Education are recognised as revenue when and in the period they are actually received.
1.3.3 Interest and Penalties
Interest and penalties are recognised at the earlier of the allocation by the Department of Higher Education and Training to the ETDP SETA or when cash is received.
1.3.4 Government Grants and Other Donor Income
Conditional government grants and other conditional donor funding received are recorded as deferred income when they become receivable and are then recognised as income on a systematic basis over the period necessary to match the grants with the related costs which they are intended to compensate.
Notes to the Annual Financial Statements for the year ended 31 March 2015
Part E: Financial Information
ETDP SETA Annual Report 2014/15 125
Unconditional grants received are recognised when the amounts have been received.
1.3.5 Investment Income
Interest from investments is recognised when the bank has credited the investment with interest due in line with the maturity date of the investment. Interest from call accounts is accrued on a time proportion basis as advised by the banks at the reporting date.
1.4 Grants and Project ExpenditureA registered organisation may recover a maximum of 20% of its total levy payment as a mandatory grant (excluding penalties and interest) by complying with the criteria in accordance with the Skills Development Regulations issued in terms of the Skills Development Levies Act, 1999 (No. 9 of 1999). Grants and project expenditure are measured at the amounts incurred. These amounts represent the fair value of the transactions.
1.4.1 Mandatory Grant Payments
Mandatory grant expenditure is recognised when the submission by a member organisation of a Workplace Skills Plan (WSP) and the Annual Training Report (ATR) within the agreed cut-off period has been approved by the ETDP SETA for payment. In the case where a WSP/ATR has been approved and transfers from the DHET have been received but actual payment has not been made, an accrual is made for the amounts payable. These grants are measured at the amounts paid/payable which represent the fair value of the transaction. The amount payable is 20% of the levies paid to SARS by the member organisation and remitted to ETDP SETA by the DHET.
1.4.2 Discretionary Grants and Project Payments
Discretionary grants relate to the 49.5% of levies paid to SARS by member organisations and remitted to ETDP SETA by the DHET plus surplus from administration budget, interest earned from the banks and forfeited mandatory grants. This grant is used to fund training and skills enhancing programmes in the sector. The project expenditure is recognised when the training or the skills enhancing programme has been delivered in accordance with the contract of agreement between the ETDP SETA and the training institution or provider. These grants are measured at the amounts paid/payable which represent the fair value of the transaction.
1.4.3 QCTO Expense
An amount determined by the Minister based on QCTO related income received, as per Section 2(4) of the Grant Regulations issued in terms of Government Gazette No. 35940.
1.4.4 TVET Infrastructure Funding Expense
In terms of Skills Development Circular No. 08/2013 SETAs are required to contribute funds to the National Skills Fund for TVET college infrastructure development. Funding agreements between the National Skills Fund and each individual SETA outline the details of each SETAs contribution as per the Skills Development Circular. There are no conditions or restrictions for the SETA and the funding is not refundable.
The TVET College infrastructure development payment is treated as a non-exchange transaction and is recognised as an expense in the period that the payment is incurred or when the funding becomes payable by the SETA as outlined in the agreement, whichever occurs first.
A contractual obligation is triggered on the date that the funding agreement is signed and a liability is recognised to the extent of the amount outstanding.
1.4.5 National Skills Fund Expense
In terms of the SETA Grant Regulations 3(11) and 3(12), any uncommitted discretionary funds must be transferred to the National Skills Fund. This payment is treated as a non-exchange transaction and is recognised as an expense in the period in which it is incurred as outlined in the SETA Grant Regulations.
The obligation is triggered at year-end and the liability is recognised to the extent of the amount outstanding. The amount is calculated as the excess of 5% of total accumulated discretionary funding that is not committed at year end.
1.5 Irregular and Fruitless and Wasteful Expenditure
Irregular expenditure means expenditure incurred in contravention of, or not in accordance with, a requirement of any applicable legislation, including:
• The PFMA; and• The Skills Development Act.
Fruitless and wasteful expenditure means expenditure that was made in vain and could have been avoided had reasonable care been exercised.
All irregular and fruitless and wasteful expenditure is charged against income in the period in which it is incurred.
1.6 ConsumablesConsumables are prepaid stationery, refreshments and cleaning materials and are recognised as an asset at cost on the date of acquisition and are subsequently recognised in surplus or deficit as they are consumed.
ETDP SETA Annual Report 2014/15126
1.7 Property, Plant and EquipmentProperty, plant and equipment is stated at historical cost less accumulated depreciation and adjusted for any impairments. Historical cost includes expenditure that is directly attributable to the acquisition of the items. No assets are held with the primary objective of generating a commercial return; hence all assets are classified as non-cash-generating. Depreciation is calculated on the straight-line method to write-off the cost of each asset to estimated residual value over its estimated useful life as noted below. The assets’ residual values and useful lives are reviewed and adjusted if appropriate at each reporting date.
Range of rates• Audiovisual equipment 16% – 20% • Computer equipment 21% – 33% • Kitchen equipment 14% – 15% • Leasehold improvements 15% – 15% • Office furniture and fittings 11% – 15% • Office equipment 15% – 20% • Minor assets 12% – 100% • Motor Vehicle 13% – 20%
Each part of an item of property, plant and equipment is depreciated separately. Depreciation commences when the items of property, plant and equipment are available for use and ceases at the earlier of the date that asset is classified as held for sale or included in a disposal group classified as held for sale and the date that the asset is derecognised.
The estimated useful life of the assets is limited to the remaining period of the licence issued to the ETDP SETA by the Minister of Higher Education and Training. The remaining period has been extended to March 2016. Where the carrying amount of an asset is greater than the estimated recoverable amount, it is written down immediately to its recoverable amount (i.e. impairment losses are recognised).
Gains and losses on disposal of property, plant and equipment are determined by reference to their carrying amount and are taken into account in determining the operating surplus/deficit.
1.8 Intangible AssetsIntangible assets are stated at historical cost less accumulated amortisation and adjusted for any impairments. Historical cost includes expenditure that is directly attributable to the acquisition of the item. No assets are held with the primary objective of generating a commercial return; hence all assets are classified as non-cash-generating. All software is commercially purchased and no labour component is applicable that may require capitalisation. Amortisation is calculated on the straight-line
method to write-off the cost of each asset to its estimated residual value over its estimated useful life as noted below. Useful lives and residual values of assets are re-estimated annually to finite periods. The assets are then amortised over their re‑assessed useful lives.
Range of rates• Computer software 20% – 33%
The estimated useful life of the assets is limited to the remaining period of the licence issued to the ETDP SETA by the Minister of Higher Education and Training. The remaining period has been extended to March 2016. Where the carrying amount of an asset is greater than the estimated recoverable amount, it is written down immediately to its recoverable amount (i.e. impairment losses are recognised).
• Intangible assets under construction
Until an intangible asset is available for use, it is classified as an asset under construction. Assets under construction are measured at cost.
1.9 LeasingLeases of property plant and equipment where ETDP SETA has substantially all the risks and rewards of ownership are classified as finance leases. Finance leases are capitalised at inception of the lease at the lower of fair value of the leased property or the present value of the minimum lease payments. Each lease payment is allocated between the liability and finance charges so as to achieve a constant rate on the outstanding finance balance. The corresponding rental obligations net of finance charges, are charged to liability. The interest element is charged to the Statement of Financial Performance over the lease period. Leases, where a significant portion of risks and rewards of ownership are retained by the lessor, are classified as operating leases. Operating costs are charged against operating income on a straight‑line basis over the period of the lease.
1.10 Retirement Benefit CostsThe entity operates a defined contribution plan, the assets of which are held in separate trustee‑administered funds. The plan is generally funded by payments from the entity and employees and is managed by external fund managers determined by the members of the fund.
Payments to defined contribution retirement benefit plans are charged to the Statement of Financial Performance in the year to which they relate. When an employee has rendered service during a period, ETDP SETA recognises the contribution payable to a defined contribution plan in exchange for that service: (a) as a liability after deducting any contributions already paid. If the contribution already
Part E: Financial Information
ETDP SETA Annual Report 2014/15 127
paid exceeds the contribution due for the service, the ETDP SETA shall recognise that excess as an asset to the extent that it will lead to a reduction in future payments and (b) as an expense.
The rules of the defined contribution plan determine the following in respect of contributions:
• Contribution by employee = 7.5% of retirement funding income.
• Contribution by employer = 7.5% of retirement funding income.
1.11 Provisions Provisions are recognised when the ETDP SETA has a present obligation as a result of a past event and it is probable that this will result in an outflow of economic benefits that can be estimated reliably. The amount of a provision is the present value of the expenditure expected to be required to settle the obligation.
1.11.1 Provisions for Discretionary Grants and Commitments
No provision is made for projects approved at year‑end, unless the service in terms of the contract has been delivered or the contract is of an onerous nature.
1.12 Financial InstrumentsFinancial assets and financial liabilities are recognised in the Statement of Financial Position when the ETDP SETA becomes a party to the contractual provisions of the instrument.
Financial instruments are initially measured at fair value, including transactional costs. Subsequent to initial recognition these instruments are measured as set out below:
1.12.1 Financial Assets
ETDP SETA’s principal financial assets are receivables and cash and cash equivalents
Accounts and other receivables
Receivables are subsequently measured at their amortised cost using the effective interest rate method and reduced by appropriate allowances for estimated irrecoverable amounts which represents fair value.
Cash and cash equivalents
Cash and cash equivalents are measured at fair value.
Financial assets or a portion thereof are derecognised when the contractual rights to the benefits specified in the contract
expire and ETDP SETA surrenders those rights or otherwise loses control of the contractual rights that comprise the financial asset. On derecognition, the difference between the carrying amount of the financial assets and the sum of the proceeds receivable and any prior adjustment to reflect the fair value of the asset that had been reported in net assets is included in surplus or deficit for the period.
1.12.2 Financial Liabilities
The ETDP SETA’s principal financial liabilities are accounts payable and other payables.
All financial liabilities are measured at amortised cost, comprising original debts less principal payments and amortisations which represents fair value.
Gains and losses arising from a change in the fair value of financial instruments, other than available for sale financial assets, are included in surplus or deficit in the period in which it arises.
A financial liability or part thereof is derecognised when the obligation specified in the contract is discharged, cancelled or expires. On derecognition, the difference between the carrying amount of the financial liability including related unamortised costs, and the amount paid for it is included in surplus or deficit for the period.
The fair values at which financial instruments are carried at the reporting date have been determined using available market values. Where market values are not available, fair values have been calculated by discounting the expected future cash flows at the prevailing interest rates. The fair values have been estimated using available market information and appropriate methodologies but are not necessarily indicative of the amounts that the ETDP SETA could realise in the normal course of business. The carrying amount of financial assets and liabilities with a maturity of less than one year is assumed to approximate their fair value due to the short term trading cycles of these items.
Financial assets and liabilities are offset if there is any intention to realise the asset and settle the liability simultaneously and a legally enforceable right to offset exists.
1.13 Net AssetsThis is represented by reserves as per the restrictions placed on the distribution of monies received in accordance with the Regulations issued in terms of the Skills Development Act, 1998 (Act No. 97 of 1998).
The following reserves are utilised:
• Administration reserve;• Employer grant reserve; and• Discretionary reserve.
ETDP SETA Annual Report 2014/15128
Member employer company levy payments are set aside in terms of the Skills Development Act and the regulations issued in terms of the Act, for the purpose of:
2014/15R’000
2013/14R’000
Administration costs of the ETDP SETA 10.5 10.5
Including 0.5% payable to QCTO
Employer grants 20 20
Discretionary grants and projects 49.5 49.5
80 80
In addition, contributions received from public service employers in the national or provincial spheres of government may be used to pay for administration costs.
Interest and penalties received from SARS as well as interest received on investments are utilised for discretionary grants and projects. Other income received is utilised in accordance with the stipulations of the funder.
The net surplus/deficit is allocated to the Administration reserve, the employer grant reserve and the Discretionary reserve based on the above.
After retaining an amount to cover future depreciation of assets the surplus funds in the Administration reserve are moved to the Discretionary reserve at year end. Employer grant reserve funds that are not provided for specific grants are moved to the Discretionary reserve. Accruals are made for grants to be paid from levies that have not been received at reporting date.
1.14 Impairment of Assets At each reporting period, the ETDP SETA assesses whether there is any indication that an asset may be impaired. If any such indication exists, the ETDP SETA estimates the recoverable amount of the asset. If it is not possible to estimate the recoverable amount of the individual asset, the recoverable amount of the cash generating unit to which the asset belongs is determined.
The recoverable amount of an asset or cash generating unit is the higher of its fair value less cost to sell and its value in use.
If the recoverable amount is less than its carrying amount, the carrying amount is reduced to its recoverable amount. This reduction is the impairment loss. In assessing value in use, the estimated future cash flows are discounted to their present value using a discount rate that reflects current market assessments of the time value of money and the risks specific to the asset. An impairment loss of
assets carried at cost less any accumulated depreciation or amortisation is immediately recognised in surplus or deficit.
A reversal of an impairment loss of assets carried at cost less accumulated depreciation or amortisation other than goodwill is immediately recognised in surplus or deficit.
1.15 Revenue and Expenses from Exchange and Non‑exchange Transactions
Revenue from exchange transactions refers to revenue that accrued to the ETDP SETA directly in return for services rendered, the value of which approximates the consideration received or receivable.
Revenue from non exchange transactions refers to transactions where ETDP SETA received revenue from another party without directly giving approximately equal value in exchange. Revenue from non exchange transactions is generally recognised to the extent that the related receipt or receivable qualifies for recognition as an asset and there is no liability to repay the amount.
1.16 Comparative Figures Where necessary comparative figures have been adjusted to conform to changes in presentation in the current year.
1.17 Related Parties Parties are considered to be related if one party has the ability to control the other party or exercise significant influence over the other party in making financial and operating decisions or if the related party entity and another entity are subject to common control.
Where such a situation exists the nature and type of transactions and relationships between parties are disclosed in the notes to the Annual Financial Statements.
Senior Management staff and members of the Accounting Authority are considered to be Key Management and no transactions take place between these staff members and the ETDP SETA other than the payment of emoluments. Senior Management emoluments are disclosed in the Accounting Authority report. No relationship exists between close members of family of Key Management and the ETDP SETA. No loans are made by the ETDP SETA to Key Management.
1.18 Significant Adjustments and EstimatesIn preparing the financial statements, management is required to make estimates and assumptions that affect the amounts represented and the related disclosures. Use of available information and the application of judgement is inherent in the formation of estimates. Actual results in the future may differ from these estimates. These judgements and estimates include:
Part E: Financial Information
ETDP SETA Annual Report 2014/15 129
Impairment testing: Management uses fair value less cost to sell in identifying the assets that may have been impaired.
Provisions: Management uses available information to determine an estimation for provisions. These are measured at management’s best estimate of the expenditure required to settle the obligation at reporting date.
Fair value measurement of revenue and financial instruments: The fair value of financial liabilities for disclosure purposes is estimated by discounting the future contractual cash flows at the current market interest rate that is available for ETDP SETA’s similar financial instruments.
1.19 New Standards and Interpretations
1.19.1 Standards Issued, but not yet Effective
The entity has not applied the following standards, which have been published and are mandatory for the entity’s accounting periods beginning on or after 01 April 2015 or later periods:
Standard/Interpretation: Effective Date: Years beginning
on or after Expected Impact
GRAP 18: Segment Reporting
01 April 2015 This standard prescribes the disclosure to present more specific and detailed information about major activities undertaken by an entity during a particular period, along with the resources allocated to those activities. ETDP SETA already reports on revenue and expenditure per segment. Although the format of the reporting could change, we do not anticipate that it will be major.
GRAP 20: Related Parties Not yet determined
This standard prescribes the disclosure of information relevant to draw attention to the possibility that the entity's financial position and surplus/deficit may have been affected by the existence of related parties. It is not expected that this standard will significantly impact future disclosures.
GRAP 108: Statutory Receivables
Not yet determined
This standard prescribes the accounting requirements for the recognition, measurement, presentation and disclosure of statutory receivables. It is not expected that this standard will significantly impact future disclosures.
1.19.2 Standards not yet Effective or Relevant
Standard/Interpretation: Effective Date: Years beginning
on or after Expected Impact
GRAP 105: Transfers of Functions between Entities under Common Control
01 April 2015 No significant impact on future disclosures
GRAP 106: Transfers of Functions between Entities not under Common Control
01 April 2015 No significant impact on future disclosures
GRAP 107: Mergers 01 April 2015 No significant impact on future disclosures
GRAP 32: Service Concession Arrangements: Grantor
Not yet determined
No significant impact on future disclosures
IGRAP17: Service Concession Arrangement where a Grantor Controls a Significant Residual Interest in an Asset
01 April 2015 No significant impact on future disclosures
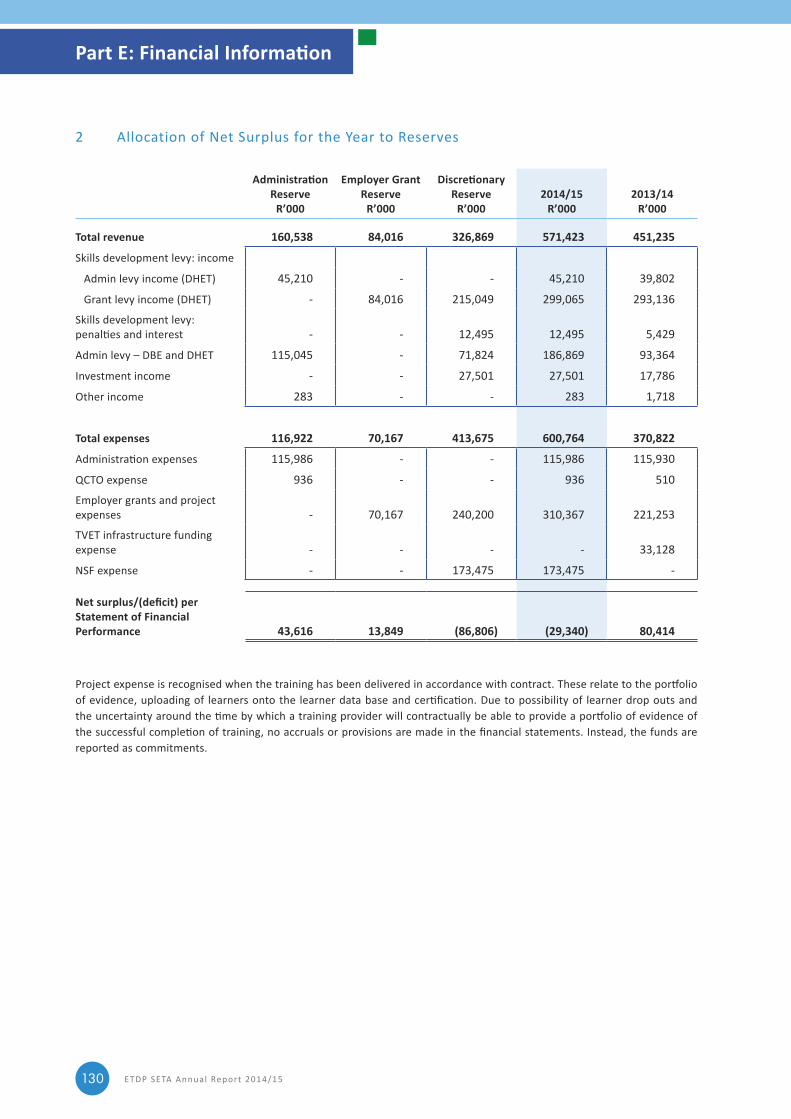
ETDP SETA Annual Report 2014/15130
2 Allocation of Net Surplus for the Year to Reserves
Administration Reserve
R’000
Employer Grant Reserve
R’000
Discretionary Reserve
R’000 2014/15
R’0002013/14
R’000
Total revenue 160,538 84,016 326,869 571,423 451,235
Skills development levy: income
Admin levy income (DHET) 45,210 ‑ ‑ 45,210 39,802
Grant levy income (DHET) ‑ 84,016 215,049 299,065 293,136
Skills development levy: penalties and interest ‑ ‑ 12,495 12,495 5,429
Admin levy – DBE and DHET 115,045 ‑ 71,824 186,869 93,364
Investment income ‑ ‑ 27,501 27,501 17,786
Other income 283 ‑ ‑ 283 1,718
Total expenses 116,922 70,167 413,675 600,764 370,822
Administration expenses 115,986 ‑ ‑ 115,986 115,930
QCTO expense 936 ‑ ‑ 936 510
Employer grants and project expenses ‑ 70,167 240,200 310,367 221,253
TVET infrastructure funding expense ‑ ‑ ‑ ‑ 33,128
NSF expense ‑ ‑ 173,475 173,475 ‑
Net surplus/(deficit) per Statement of Financial Performance 43,616 13,849 (86,806) (29,340) 80,414
Project expense is recognised when the training has been delivered in accordance with contract. These relate to the portfolio of evidence, uploading of learners onto the learner data base and certification. Due to possibility of learner drop outs and the uncertainty around the time by which a training provider will contractually be able to provide a portfolio of evidence of the successful completion of training, no accruals or provisions are made in the financial statements. Instead, the funds are reported as commitments.
Part E: Financial Information
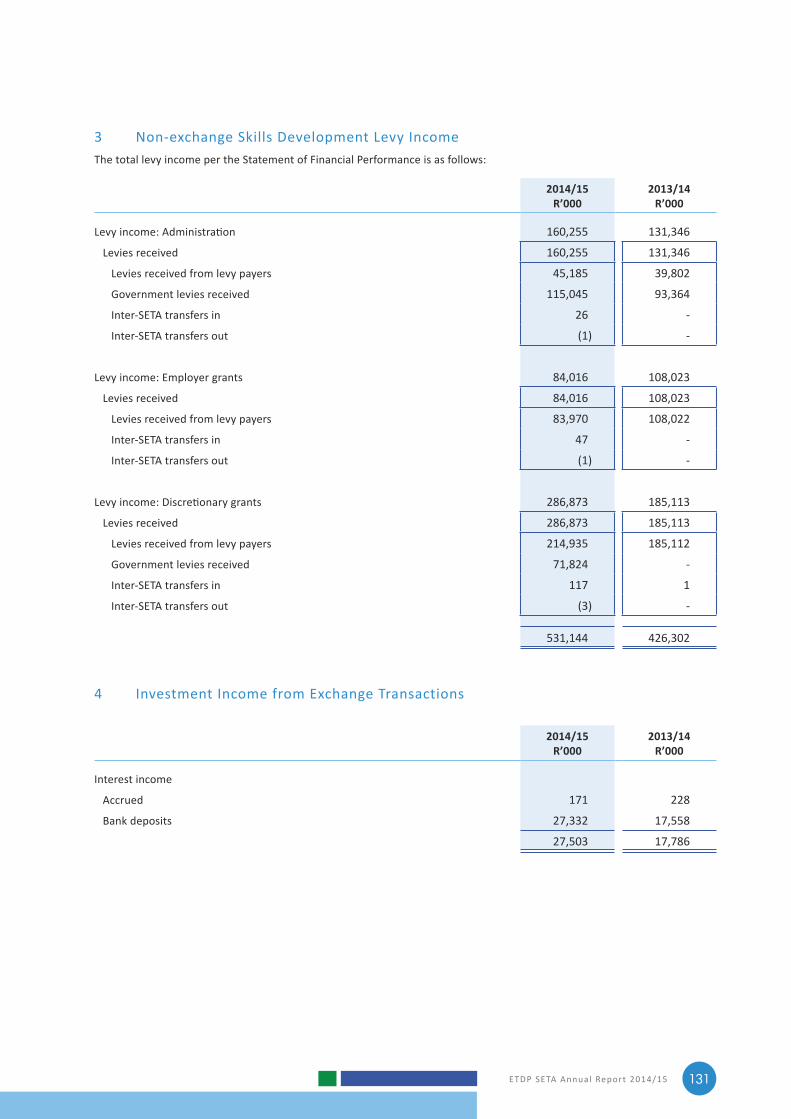
ETDP SETA Annual Report 2014/15 131
3 Non‑exchange Skills Development Levy IncomeThe total levy income per the Statement of Financial Performance is as follows:
2014/15R’000
2013/14R’000
Levy income: Administration 160,255 131,346
Levies received 160,255 131,346
Levies received from levy payers 45,185 39,802
Government levies received 115,045 93,364
Inter‑SETA transfers in 26 ‑
Inter‑SETA transfers out (1) ‑
Levy income: Employer grants 84,016 108,023
Levies received 84,016 108,023
Levies received from levy payers 83,970 108,022
Inter‑SETA transfers in 47 ‑
Inter‑SETA transfers out (1) ‑
Levy income: Discretionary grants 286,873 185,113
Levies received 286,873 185,113
Levies received from levy payers 214,935 185,112
Government levies received 71,824 ‑
Inter‑SETA transfers in 117 1
Inter‑SETA transfers out (3) ‑
531,144 426,302
4 Investment Income from Exchange Transactions
2014/15R’000
2013/14R’000
Interest income
Accrued 171 228
Bank deposits 27,332 17,558
27,503 17,786
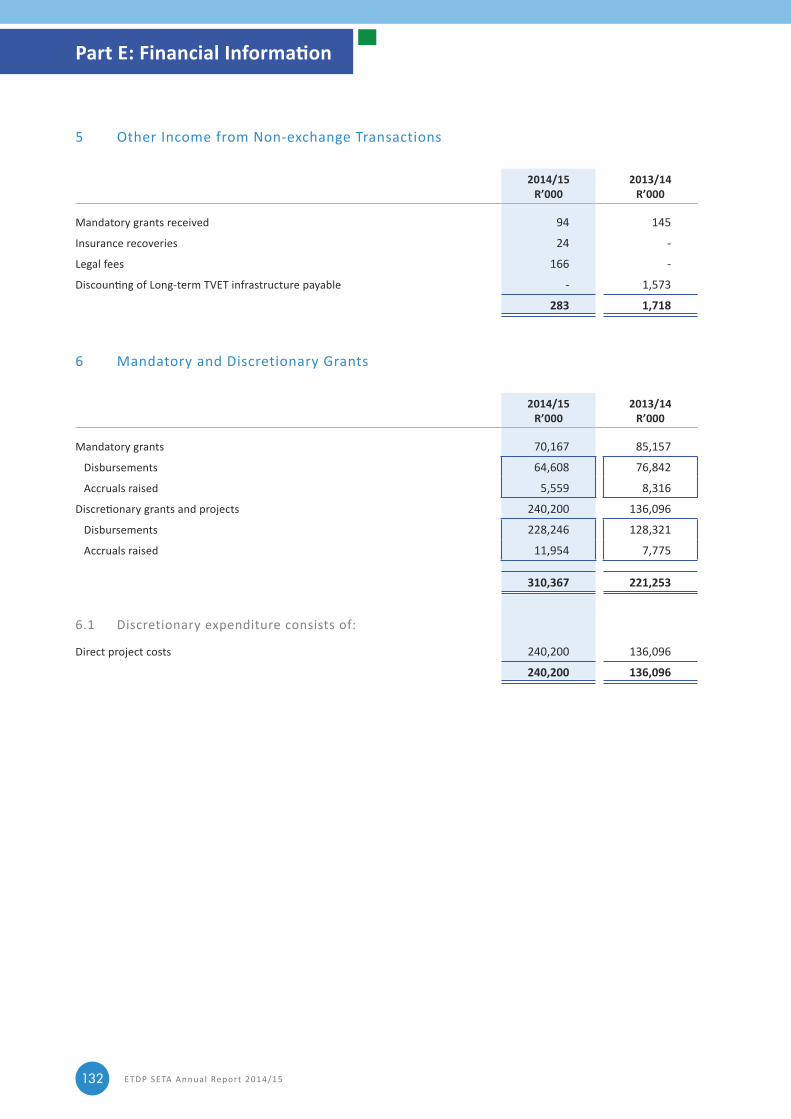
ETDP SETA Annual Report 2014/15132
5 Other Income from Non‑exchange Transactions
2014/15R’000
2013/14R’000
Mandatory grants received 94 145
Insurance recoveries 24 ‑
Legal fees 166 ‑
Discounting of Long-term TVET infrastructure payable ‑ 1,573
283 1,718
6 Mandatory and Discretionary Grants
2014/15R’000
2013/14R’000
Mandatory grants 70,167 85,157
Disbursements 64,608 76,842
Accruals raised 5,559 8,316
Discretionary grants and projects 240,200 136,096
Disbursements 228,246 128,321
Accruals raised 11,954 7,775
310,367 221,253
6.1 Discretionary expenditure consists of:
Direct project costs 240,200 136,096
240,200 136,096
Part E: Financial Information
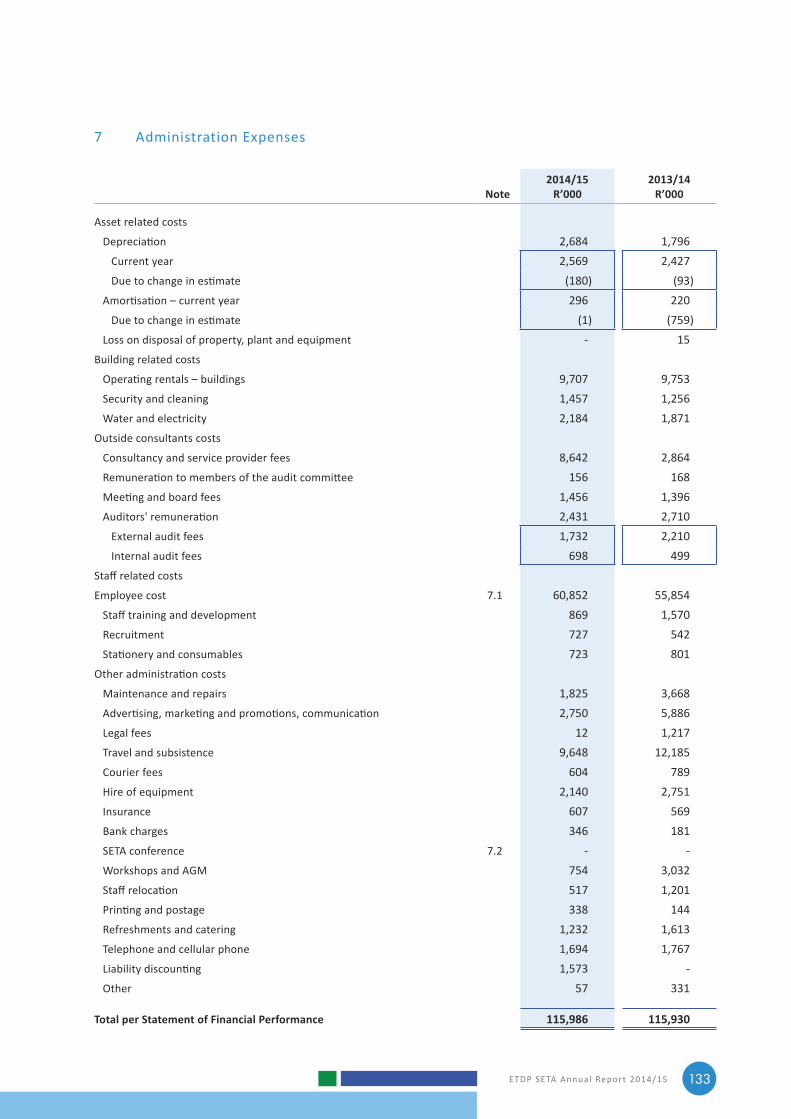
ETDP SETA Annual Report 2014/15 133
7 Administration Expenses
Note2014/15
R’0002013/14
R’000
Asset related costs
Depreciation 2,684 1,796 Current year 2,569 2,427 Due to change in estimate (180) (93) Amortisation – current year 296 220 Due to change in estimate (1) (759) Loss on disposal of property, plant and equipment ‑ 15 Building related costs
Operating rentals – buildings 9,707 9,753 Security and cleaning 1,457 1,256 Water and electricity 2,184 1,871 Outside consultants costs
Consultancy and service provider fees 8,642 2,864 Remuneration to members of the audit committee 156 168 Meeting and board fees 1,456 1,396 Auditors' remuneration 2,431 2,710 External audit fees 1,732 2,210 Internal audit fees 698 499 Staff related costs
Employee cost 7.1 60,852 55,854 Staff training and development 869 1,570 Recruitment 727 542 Stationery and consumables 723 801 Other administration costs
Maintenance and repairs 1,825 3,668 Advertising, marketing and promotions, communication 2,750 5,886 Legal fees 12 1,217 Travel and subsistence 9,648 12,185 Courier fees 604 789 Hire of equipment 2,140 2,751 Insurance 607 569 Bank charges 346 181 SETA conference 7.2 ‑ ‑ Workshops and AGM 754 3,032 Staff relocation 517 1,201 Printing and postage 338 144 Refreshments and catering 1,232 1,613 Telephone and cellular phone 1,694 1,767 Liability discounting 1,573 ‑ Other 57 331
Total per Statement of Financial Performance 115,986 115,930
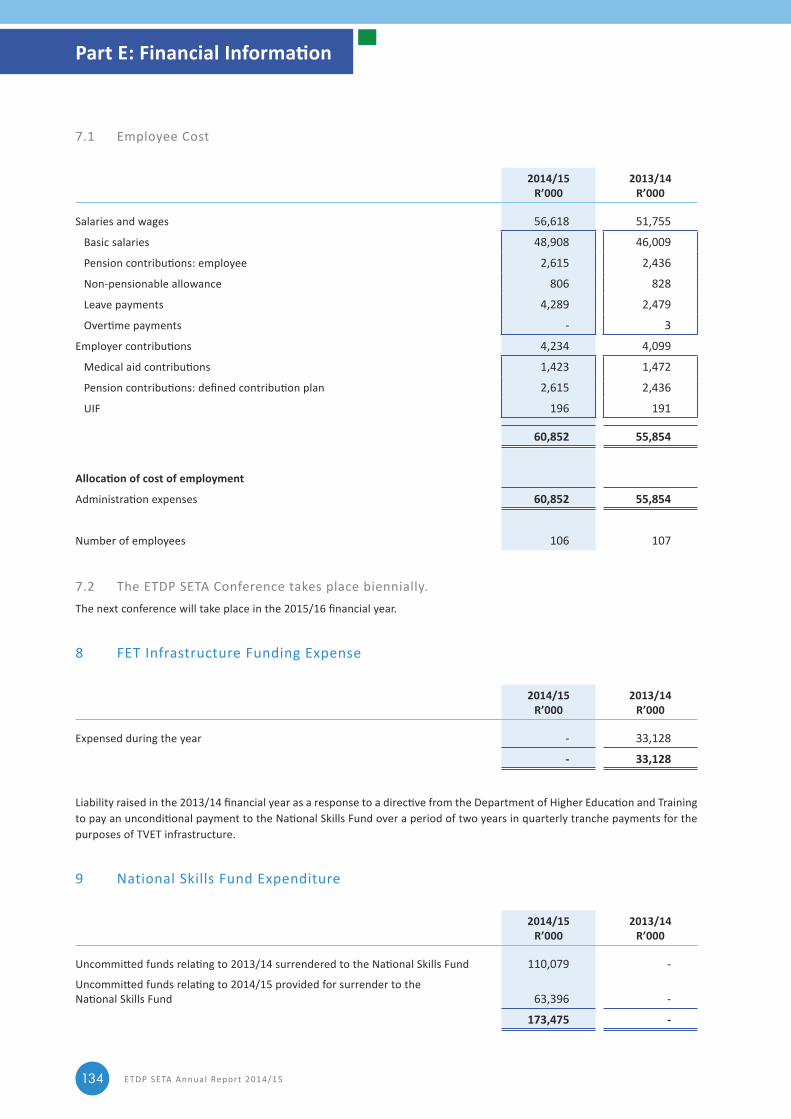
ETDP SETA Annual Report 2014/15134
7.1 Employee Cost
2014/15R’000
2013/14R’000
Salaries and wages 56,618 51,755
Basic salaries 48,908 46,009
Pension contributions: employee 2,615 2,436
Non‑pensionable allowance 806 828
Leave payments 4,289 2,479
Overtime payments ‑ 3
Employer contributions 4,234 4,099
Medical aid contributions 1,423 1,472
Pension contributions: defined contribution plan 2,615 2,436
UIF 196 191
60,852 55,854
Allocation of cost of employment
Administration expenses 60,852 55,854
Number of employees 106 107
7.2 The ETDP SETA Conference takes place biennially.The next conference will take place in the 2015/16 financial year.
8 FET Infrastructure Funding Expense
2014/15R’000
2013/14R’000
Expensed during the year ‑ 33,128
- 33,128
Liability raised in the 2013/14 financial year as a response to a directive from the Department of Higher Education and Training to pay an unconditional payment to the National Skills Fund over a period of two years in quarterly tranche payments for the purposes of TVET infrastructure.
9 National Skills Fund Expenditure
2014/15R’000
2013/14R’000
Uncommitted funds relating to 2013/14 surrendered to the National Skills Fund 110,079 ‑
Uncommitted funds relating to 2014/15 provided for surrender to the National Skills Fund 63,396 ‑
173,475 -
Part E: Financial Information
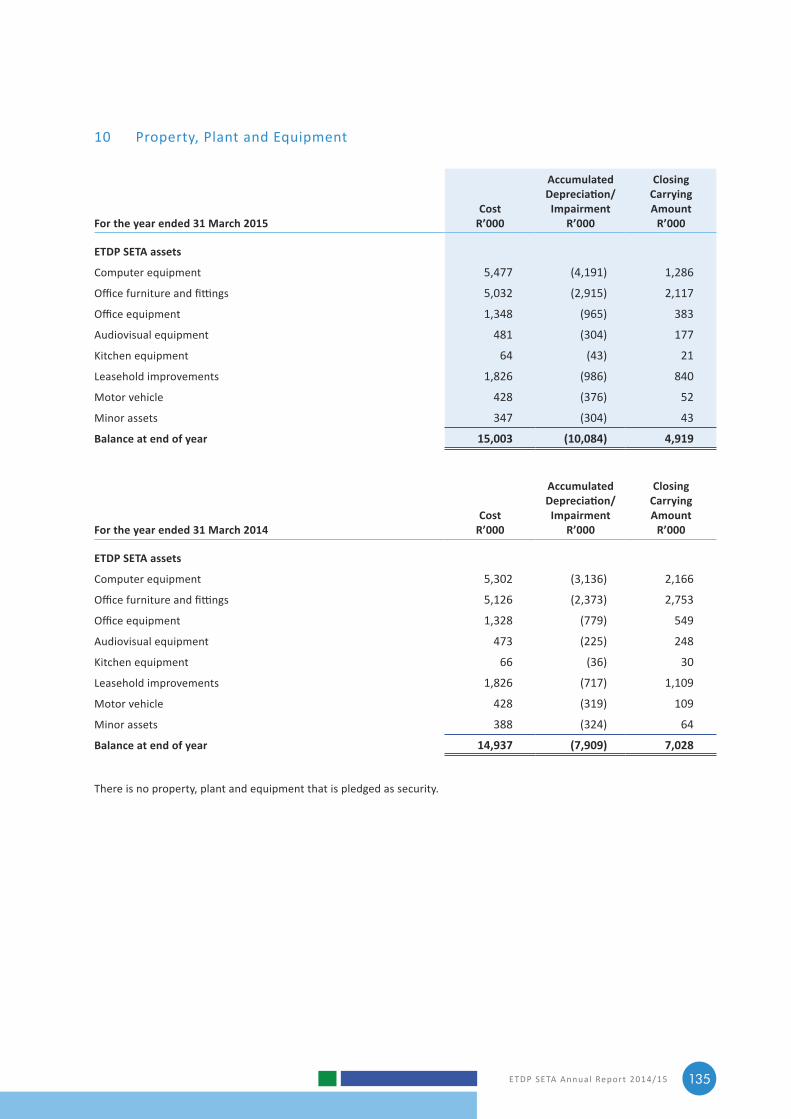
ETDP SETA Annual Report 2014/15 135
10 Property, Plant and Equipment
For the year ended 31 March 2015Cost
R’000
Accumulated Depreciation/Impairment
R’000
Closing Carrying Amount
R’000
ETDP SETA assets
Computer equipment 5,477 (4,191) 1,286
Office furniture and fittings 5,032 (2,915) 2,117
Office equipment 1,348 (965) 383
Audiovisual equipment 481 (304) 177
Kitchen equipment 64 (43) 21
Leasehold improvements 1,826 (986) 840
Motor vehicle 428 (376) 52
Minor assets 347 (304) 43
Balance at end of year 15,003 (10,084) 4,919
For the year ended 31 March 2014Cost
R’000
Accumulated Depreciation/Impairment
R’000
Closing Carrying Amount
R’000
ETDP SETA assets
Computer equipment 5,302 (3,136) 2,166
Office furniture and fittings 5,126 (2,373) 2,753
Office equipment 1,328 (779) 549
Audiovisual equipment 473 (225) 248
Kitchen equipment 66 (36) 30
Leasehold improvements 1,826 (717) 1,109
Motor vehicle 428 (319) 109
Minor assets 388 (324) 64
Balance at end of year 14,937 (7,909) 7,028
There is no property, plant and equipment that is pledged as security.
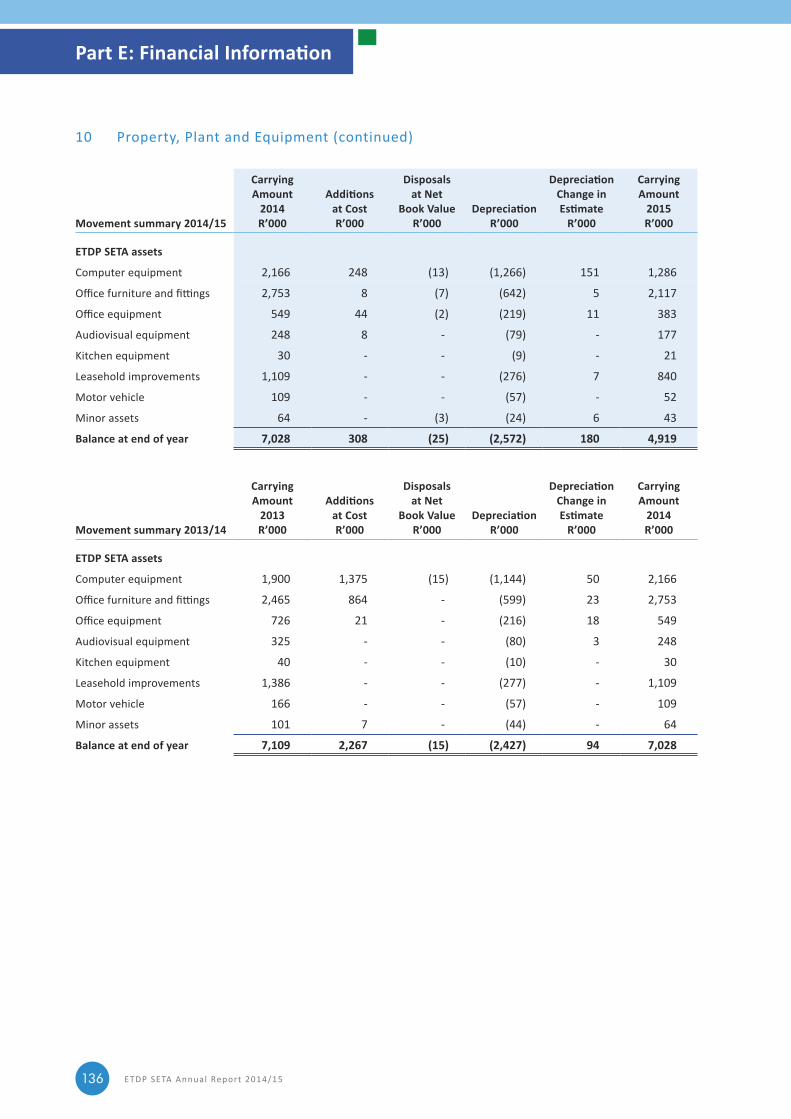
ETDP SETA Annual Report 2014/15136
10 Property, Plant and Equipment (continued)
Movement summary 2014/15
Carrying Amount
2014R’000
Additions at Cost R’000
Disposals at Net
Book Value R’000
Depreciation R’000
Depreciation Change in Estimate
R’000
Carrying Amount
2015R’000
ETDP SETA assets
Computer equipment 2,166 248 (13) (1,266) 151 1,286
Office furniture and fittings 2,753 8 (7) (642) 5 2,117
Office equipment 549 44 (2) (219) 11 383
Audiovisual equipment 248 8 ‑ (79) ‑ 177
Kitchen equipment 30 ‑ ‑ (9) ‑ 21
Leasehold improvements 1,109 ‑ ‑ (276) 7 840
Motor vehicle 109 ‑ ‑ (57) ‑ 52
Minor assets 64 ‑ (3) (24) 6 43
Balance at end of year 7,028 308 (25) (2,572) 180 4,919
Movement summary 2013/14
Carrying Amount
2013R’000
Additions at Cost R’000
Disposals at Net
Book Value R’000
Depreciation R’000
Depreciation Change in Estimate
R’000
Carrying Amount
2014R’000
ETDP SETA assets
Computer equipment 1,900 1,375 (15) (1,144) 50 2,166
Office furniture and fittings 2,465 864 ‑ (599) 23 2,753
Office equipment 726 21 ‑ (216) 18 549
Audiovisual equipment 325 ‑ ‑ (80) 3 248
Kitchen equipment 40 ‑ ‑ (10) ‑ 30
Leasehold improvements 1,386 ‑ ‑ (277) ‑ 1,109
Motor vehicle 166 ‑ ‑ (57) ‑ 109
Minor assets 101 7 ‑ (44) ‑ 64
Balance at end of year 7,109 2,267 (15) (2,427) 94 7,028
Part E: Financial Information
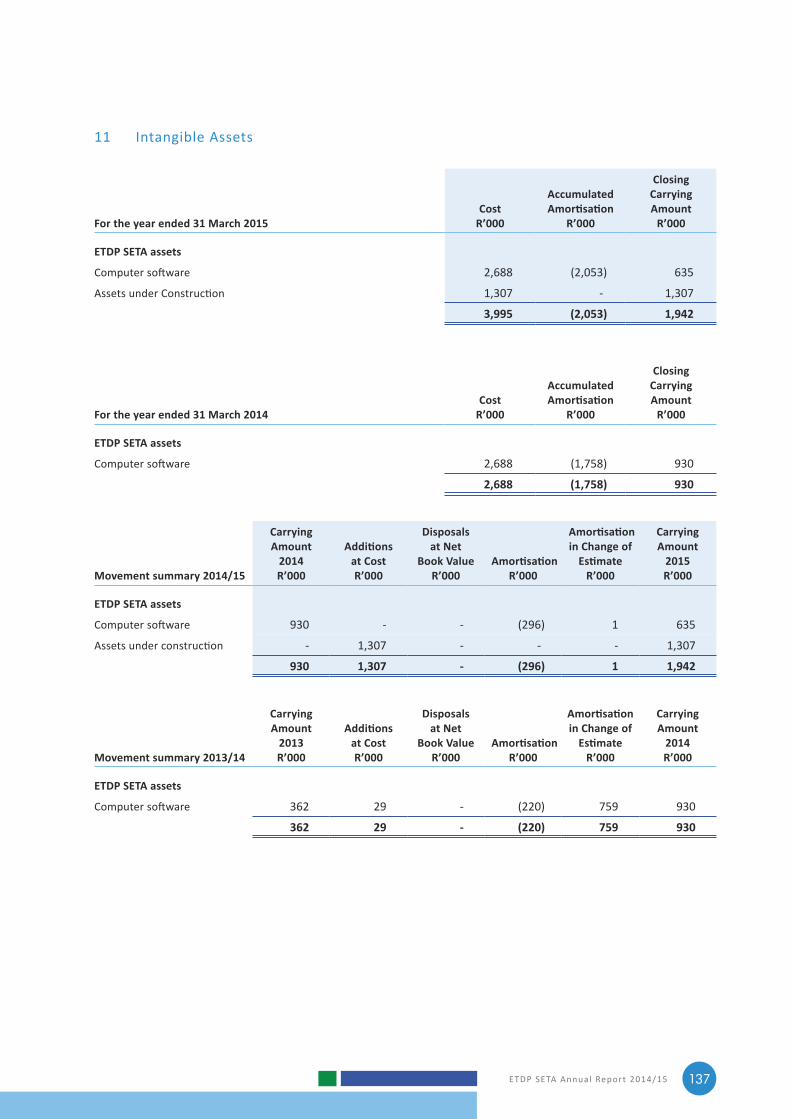
ETDP SETA Annual Report 2014/15 137
11 Intangible Assets
For the year ended 31 March 2015Cost
R’000
Accumulated Amortisation
R’000
Closing Carrying Amount
R’000
ETDP SETA assets
Computer software 2,688 (2,053) 635
Assets under Construction 1,307 ‑ 1,307
3,995 (2,053) 1,942
For the year ended 31 March 2014Cost
R’000
Accumulated Amortisation
R’000
Closing Carrying Amount
R’000
ETDP SETA assets
Computer software 2,688 (1,758) 930
2,688 (1,758) 930
Movement summary 2014/15
Carrying Amount
2014R’000
Additions at Cost R’000
Disposals at Net
Book Value R’000
Amortisation R’000
Amortisation in Change of
EstimateR’000
Carrying Amount
2015R’000
ETDP SETA assets
Computer software 930 ‑ ‑ (296) 1 635
Assets under construction ‑ 1,307 ‑ ‑ ‑ 1,307
930 1,307 - (296) 1 1,942
Movement summary 2013/14
Carrying Amount
2013R’000
Additions at Cost R’000
Disposals at Net
Book Value R’000
Amortisation R’000
Amortisation in Change of
EstimateR’000
Carrying Amount
2014R’000
ETDP SETA assets
Computer software 362 29 ‑ (220) 759 930
362 29 - (220) 759 930
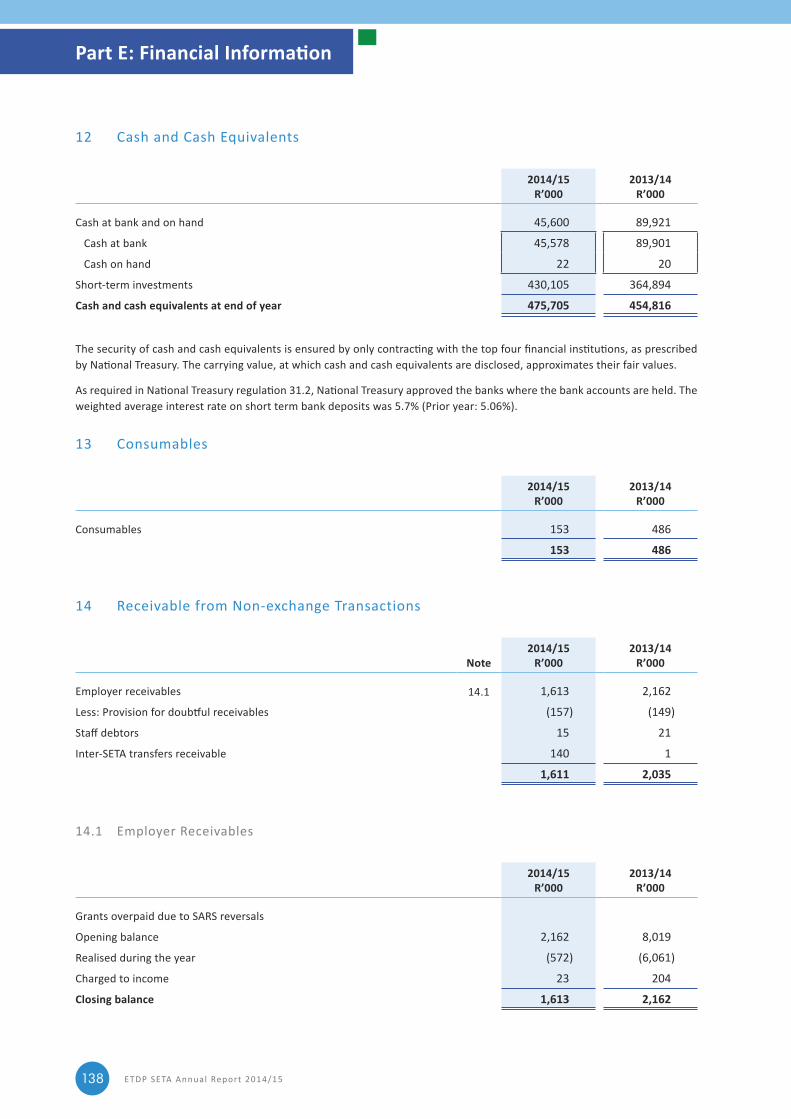
ETDP SETA Annual Report 2014/15138
12 Cash and Cash Equivalents
2014/15R’000
2013/14R’000
Cash at bank and on hand 45,600 89,921
Cash at bank 45,578 89,901
Cash on hand 22 20
Short‑term investments 430,105 364,894
Cash and cash equivalents at end of year 475,705 454,816
The security of cash and cash equivalents is ensured by only contracting with the top four financial institutions, as prescribed by National Treasury. The carrying value, at which cash and cash equivalents are disclosed, approximates their fair values.
As required in National Treasury regulation 31.2, National Treasury approved the banks where the bank accounts are held. The weighted average interest rate on short term bank deposits was 5.7% (Prior year: 5.06%).
13 Consumables
2014/15R’000
2013/14R’000
Consumables 153 486
153 486
14 Receivable from Non‑exchange Transactions
Note2014/15
R’0002013/14
R’000
Employer receivables 14.1 1,613 2,162
Less: Provision for doubtful receivables (157) (149)
Staff debtors 15 21
Inter‑SETA transfers receivable 140 1
1,611 2,035
14.1 Employer Receivables
2014/15R’000
2013/14R’000
Grants overpaid due to SARS reversals
Opening balance 2,162 8,019
Realised during the year (572) (6,061)
Charged to income 23 204
Closing balance 1,613 2,162
Part E: Financial Information
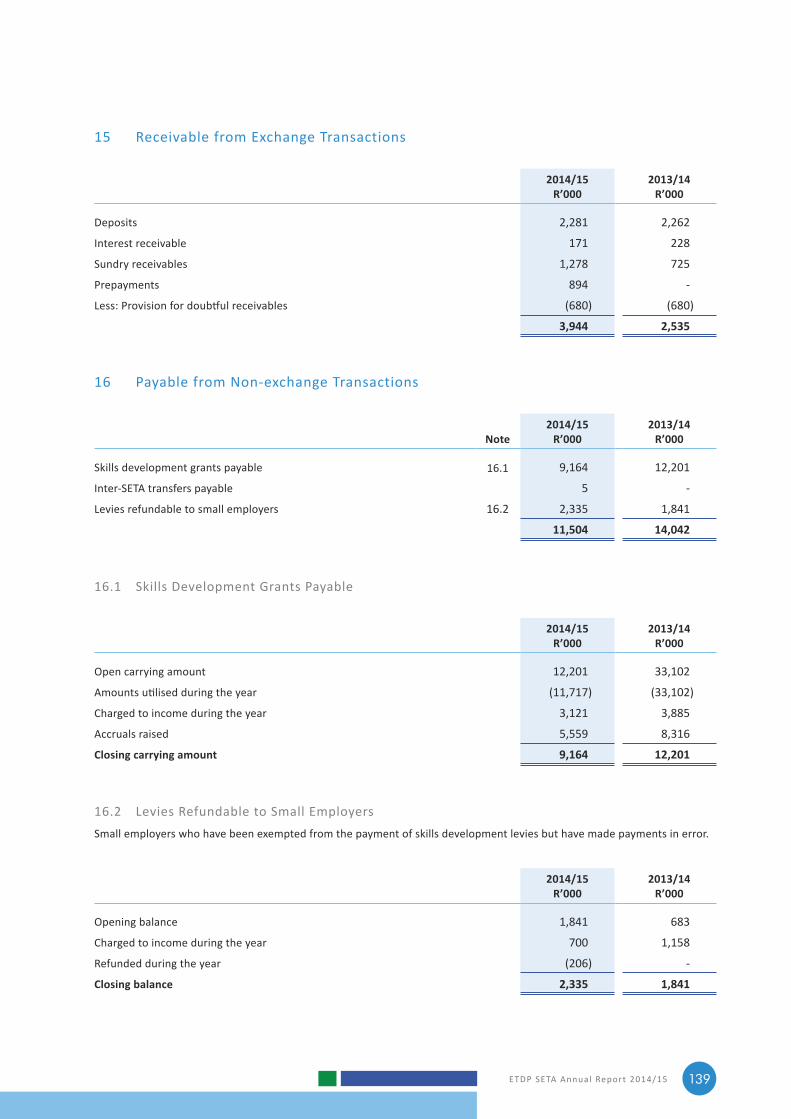
ETDP SETA Annual Report 2014/15 139
15 Receivable from Exchange Transactions
2014/15R’000
2013/14R’000
Deposits 2,281 2,262
Interest receivable 171 228
Sundry receivables 1,278 725
Prepayments 894 ‑
Less: Provision for doubtful receivables (680) (680)
3,944 2,535
16 Payable from Non‑exchange Transactions
Note2014/15
R’0002013/14
R’000
Skills development grants payable 16.1 9,164 12,201
Inter‑SETA transfers payable 5 ‑
Levies refundable to small employers 16.2 2,335 1,841
11,504 14,042
16.1 Skills Development Grants Payable
2014/15R’000
2013/14R’000
Open carrying amount 12,201 33,102
Amounts utilised during the year (11,717) (33,102)
Charged to income during the year 3,121 3,885
Accruals raised 5,559 8,316
Closing carrying amount 9,164 12,201
16.2 Levies Refundable to Small EmployersSmall employers who have been exempted from the payment of skills development levies but have made payments in error.
2014/15R’000
2013/14R’000
Opening balance 1,841 683
Charged to income during the year 700 1,158
Refunded during the year (206) ‑
Closing balance 2,335 1,841
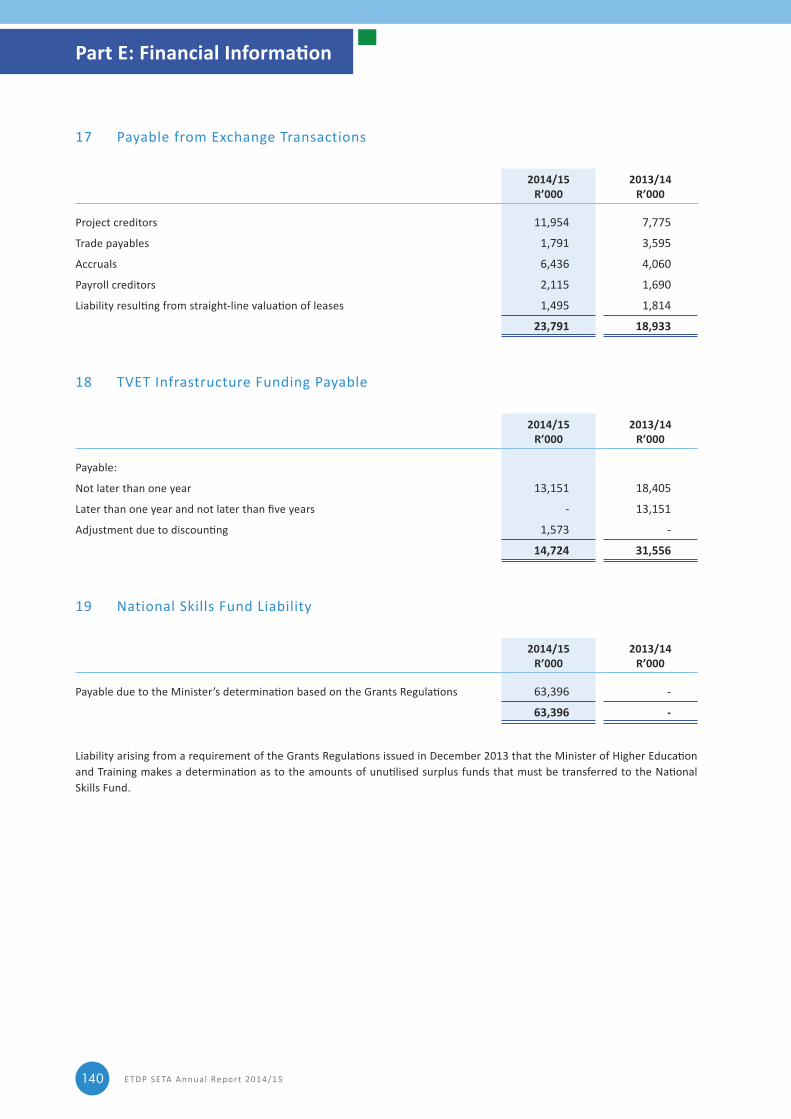
ETDP SETA Annual Report 2014/15140
17 Payable from Exchange Transactions
2014/15R’000
2013/14R’000
Project creditors 11,954 7,775
Trade payables 1,791 3,595
Accruals 6,436 4,060
Payroll creditors 2,115 1,690
Liability resulting from straight-line valuation of leases 1,495 1,814
23,791 18,933
18 TVET Infrastructure Funding Payable
2014/15R’000
2013/14R’000
Payable:
Not later than one year 13,151 18,405
Later than one year and not later than five years ‑ 13,151
Adjustment due to discounting 1,573 ‑
14,724 31,556
19 National Skills Fund Liability
2014/15R’000
2013/14R’000
Payable due to the Minister’s determination based on the Grants Regulations 63,396 ‑
63,396 -
Liability arising from a requirement of the Grants Regulations issued in December 2013 that the Minister of Higher Education and Training makes a determination as to the amounts of unutilised surplus funds that must be transferred to the National Skills Fund.
Part E: Financial Information
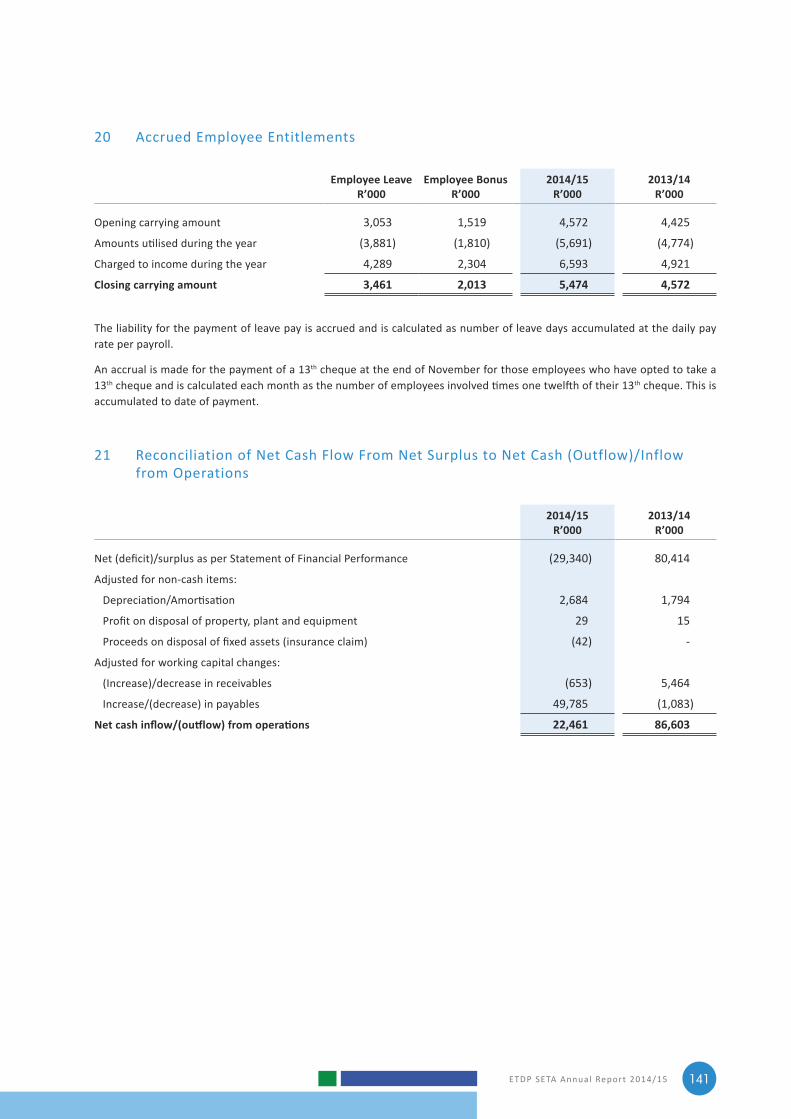
ETDP SETA Annual Report 2014/15 141
20 Accrued Employee Entitlements
Employee LeaveR’000
Employee BonusR’000
2014/15R’000
2013/14R’000
Opening carrying amount 3,053 1,519 4,572 4,425
Amounts utilised during the year (3,881) (1,810) (5,691) (4,774)
Charged to income during the year 4,289 2,304 6,593 4,921
Closing carrying amount 3,461 2,013 5,474 4,572
The liability for the payment of leave pay is accrued and is calculated as number of leave days accumulated at the daily pay rate per payroll.
An accrual is made for the payment of a 13th cheque at the end of November for those employees who have opted to take a 13th cheque and is calculated each month as the number of employees involved times one twelfth of their 13th cheque. This is accumulated to date of payment.
21 Reconciliation of Net Cash Flow From Net Surplus to Net Cash (Outflow)/Inflow from Operations
2014/15R’000
2013/14R’000
Net (deficit)/surplus as per Statement of Financial Performance (29,340) 80,414
Adjusted for non‑cash items:
Depreciation/Amortisation 2,684 1,794
Profit on disposal of property, plant and equipment 29 15
Proceeds on disposal of fixed assets (insurance claim) (42) ‑
Adjusted for working capital changes:
(Increase)/decrease in receivables (653) 5,464
Increase/(decrease) in payables 49,785 (1,083)
Net cash inflow/(outflow) from operations 22,461 86,603
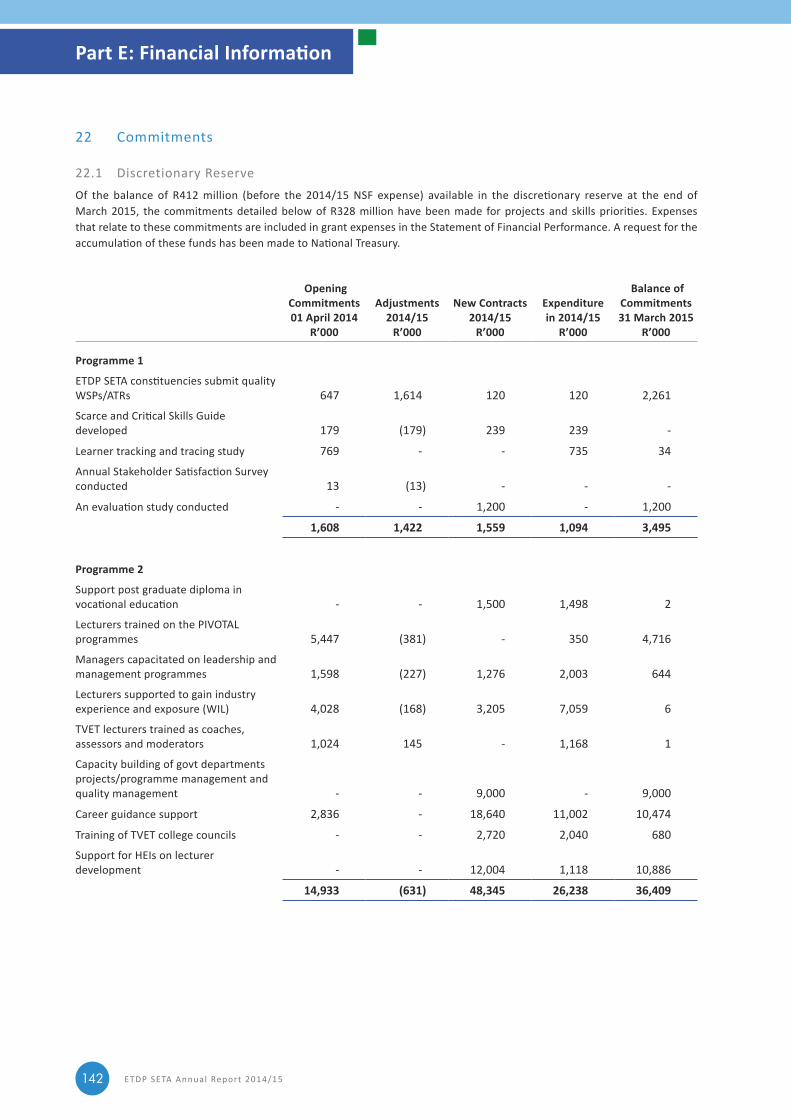
ETDP SETA Annual Report 2014/15142
22 Commitments
22.1 Discretionary ReserveOf the balance of R412 million (before the 2014/15 NSF expense) available in the discretionary reserve at the end of March 2015, the commitments detailed below of R328 million have been made for projects and skills priorities. Expenses that relate to these commitments are included in grant expenses in the Statement of Financial Performance. A request for the accumulation of these funds has been made to National Treasury.
Opening Commitments 01 April 2014
R’000
Adjustments 2014/15
R’000
New Contracts 2014/15
R’000
Expenditure in 2014/15
R’000
Balance of Commitments 31 March 2015
R’000
Programme 1
ETDP SETA constituencies submit quality WSPs/ATRs 647 1,614 120 120 2,261
Scarce and Critical Skills Guide developed 179 (179) 239 239 ‑
Learner tracking and tracing study 769 ‑ ‑ 735 34
Annual Stakeholder Satisfaction Survey conducted 13 (13) ‑ ‑ ‑
An evaluation study conducted ‑ ‑ 1,200 ‑ 1,200
1,608 1,422 1,559 1,094 3,495
Programme 2
Support post graduate diploma in vocational education ‑ ‑ 1,500 1,498 2
Lecturers trained on the PIVOTAL programmes 5,447 (381) ‑ 350 4,716
Managers capacitated on leadership and management programmes 1,598 (227) 1,276 2,003 644
Lecturers supported to gain industry experience and exposure (WIL) 4,028 (168) 3,205 7,059 6
TVET lecturers trained as coaches, assessors and moderators 1,024 145 ‑ 1,168 1
Capacity building of govt departments projects/programme management and quality management ‑ ‑ 9,000 ‑ 9,000
Career guidance support 2,836 ‑ 18,640 11,002 10,474
Training of TVET college councils ‑ ‑ 2,720 2,040 680
Support for HEIs on lecturer development ‑ ‑ 12,004 1,118 10,886
14,933 (631) 48,345 26,238 36,409
Part E: Financial Information
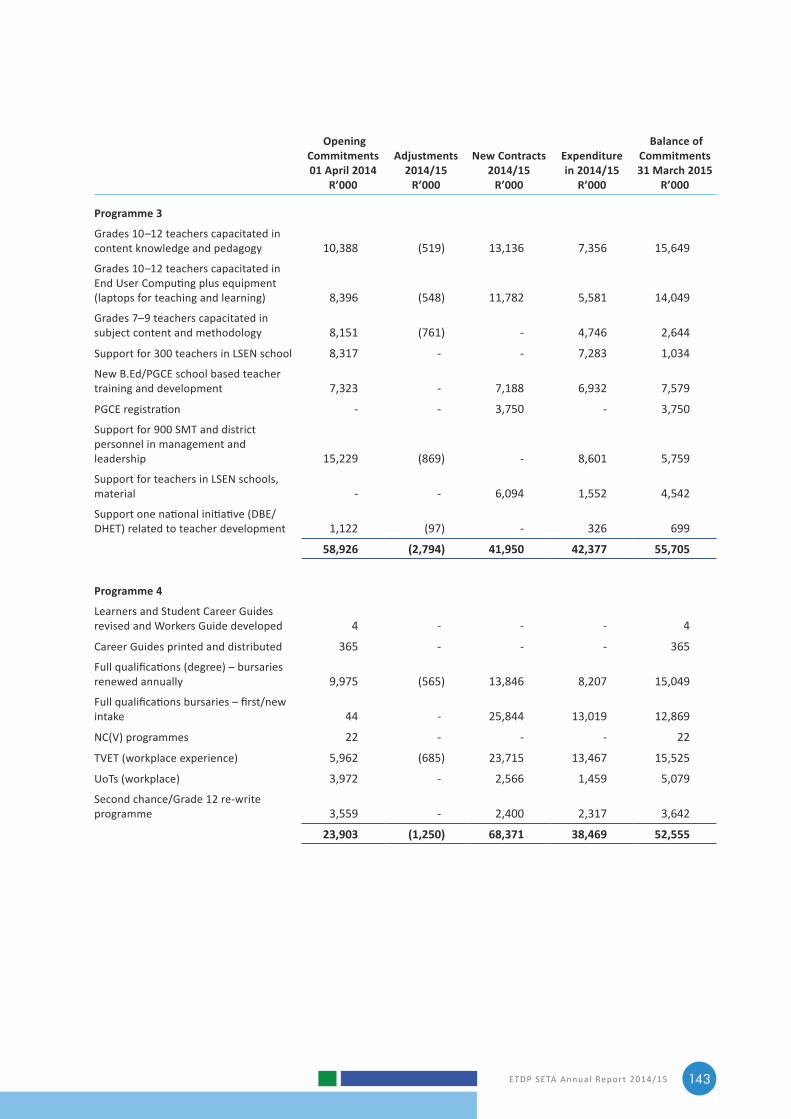
ETDP SETA Annual Report 2014/15 143
Opening Commitments 01 April 2014
R’000
Adjustments 2014/15
R’000
New Contracts 2014/15
R’000
Expenditure in 2014/15
R’000
Balance of Commitments 31 March 2015
R’000
Programme 3
Grades 10–12 teachers capacitated in content knowledge and pedagogy 10,388 (519) 13,136 7,356 15,649
Grades 10–12 teachers capacitated in End User Computing plus equipment (laptops for teaching and learning) 8,396 (548) 11,782 5,581 14,049
Grades 7–9 teachers capacitated in subject content and methodology 8,151 (761) ‑ 4,746 2,644
Support for 300 teachers in LSEN school 8,317 ‑ ‑ 7,283 1,034
New B.Ed/PGCE school based teacher training and development 7,323 ‑ 7,188 6,932 7,579
PGCE registration ‑ ‑ 3,750 ‑ 3,750
Support for 900 SMT and district personnel in management and leadership 15,229 (869) ‑ 8,601 5,759
Support for teachers in LSEN schools, material ‑ ‑ 6,094 1,552 4,542
Support one national initiative (DBE/DHET) related to teacher development 1,122 (97) ‑ 326 699
58,926 (2,794) 41,950 42,377 55,705
Programme 4
Learners and Student Career Guides revised and Workers Guide developed 4 ‑ ‑ ‑ 4
Career Guides printed and distributed 365 ‑ ‑ ‑ 365
Full qualifications (degree) – bursaries renewed annually 9,975 (565) 13,846 8,207 15,049
Full qualifications bursaries – first/new intake 44 ‑ 25,844 13,019 12,869
NC(V) programmes 22 ‑ ‑ ‑ 22
TVET (workplace experience) 5,962 (685) 23,715 13,467 15,525
UoTs (workplace) 3,972 ‑ 2,566 1,459 5,079
Second chance/Grade 12 re‑write programme 3,559 ‑ 2,400 2,317 3,642
23,903 (1,250) 68,371 38,469 52,555
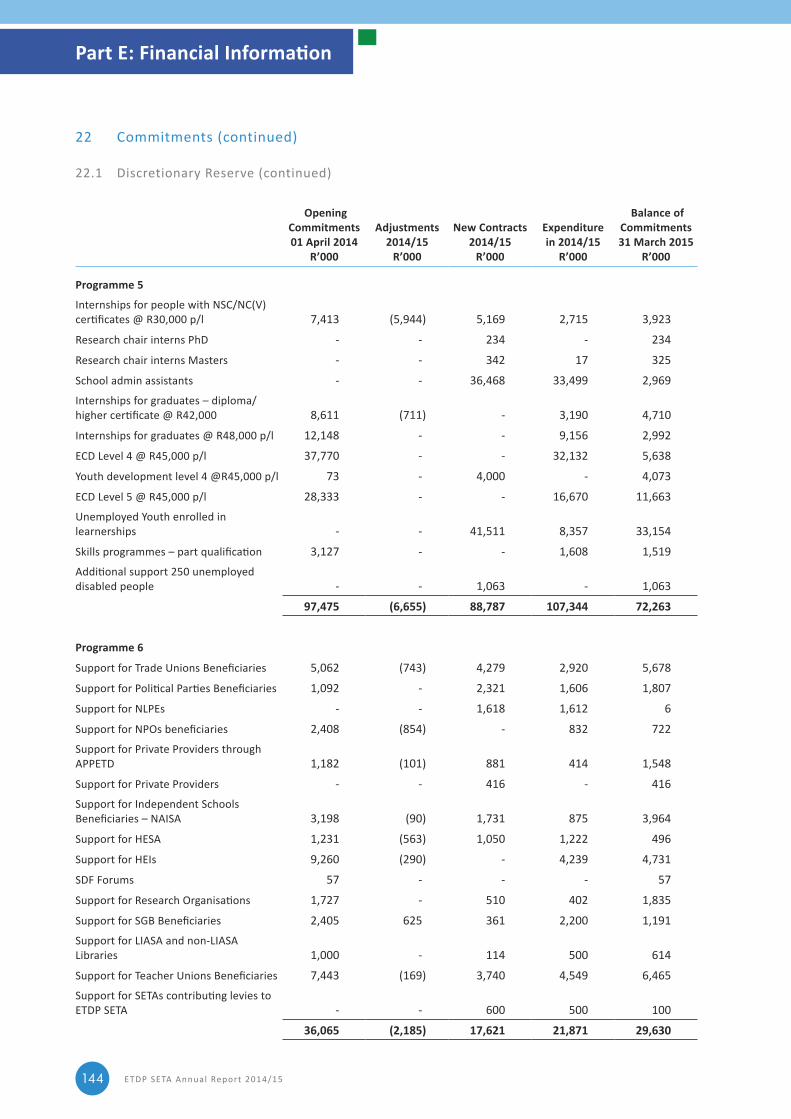
ETDP SETA Annual Report 2014/15144
Opening Commitments 01 April 2014
R’000
Adjustments 2014/15
R’000
New Contracts 2014/15
R’000
Expenditure in 2014/15
R’000
Balance of Commitments 31 March 2015
R’000
Programme 5
Internships for people with NSC/NC(V) certificates @ R30,000 p/l 7,413 (5,944) 5,169 2,715 3,923
Research chair interns PhD ‑ ‑ 234 ‑ 234
Research chair interns Masters ‑ ‑ 342 17 325
School admin assistants ‑ ‑ 36,468 33,499 2,969 Internships for graduates – diploma/higher certificate @ R42,000 8,611 (711) ‑ 3,190 4,710
Internships for graduates @ R48,000 p/l 12,148 ‑ ‑ 9,156 2,992
ECD Level 4 @ R45,000 p/l 37,770 ‑ ‑ 32,132 5,638
Youth development level 4 @R45,000 p/l 73 ‑ 4,000 ‑ 4,073
ECD Level 5 @ R45,000 p/l 28,333 ‑ ‑ 16,670 11,663 Unemployed Youth enrolled in learnerships ‑ ‑ 41,511 8,357 33,154
Skills programmes – part qualification 3,127 ‑ ‑ 1,608 1,519 Additional support 250 unemployed disabled people ‑ ‑ 1,063 ‑ 1,063
97,475 (6,655) 88,787 107,344 72,263
Programme 6
Support for Trade Unions Beneficiaries 5,062 (743) 4,279 2,920 5,678
Support for Political Parties Beneficiaries 1,092 ‑ 2,321 1,606 1,807
Support for NLPEs ‑ ‑ 1,618 1,612 6
Support for NPOs beneficiaries 2,408 (854) ‑ 832 722 Support for Private Providers through APPETD 1,182 (101) 881 414 1,548
Support for Private Providers ‑ ‑ 416 ‑ 416 Support for Independent Schools Beneficiaries – NAISA 3,198 (90) 1,731 875 3,964
Support for HESA 1,231 (563) 1,050 1,222 496
Support for HEIs 9,260 (290) ‑ 4,239 4,731
SDF Forums 57 ‑ ‑ ‑ 57
Support for Research Organisations 1,727 ‑ 510 402 1,835
Support for SGB Beneficiaries 2,405 625 361 2,200 1,191 Support for LIASA and non‑LIASA Libraries 1,000 ‑ 114 500 614
Support for Teacher Unions Beneficiaries 7,443 (169) 3,740 4,549 6,465 Support for SETAs contributing levies to ETDP SETA ‑ ‑ 600 500 100
36,065 (2,185) 17,621 21,871 29,630
22 Commitments (continued)
22.1 Discretionary Reserve (continued)
Part E: Financial Information
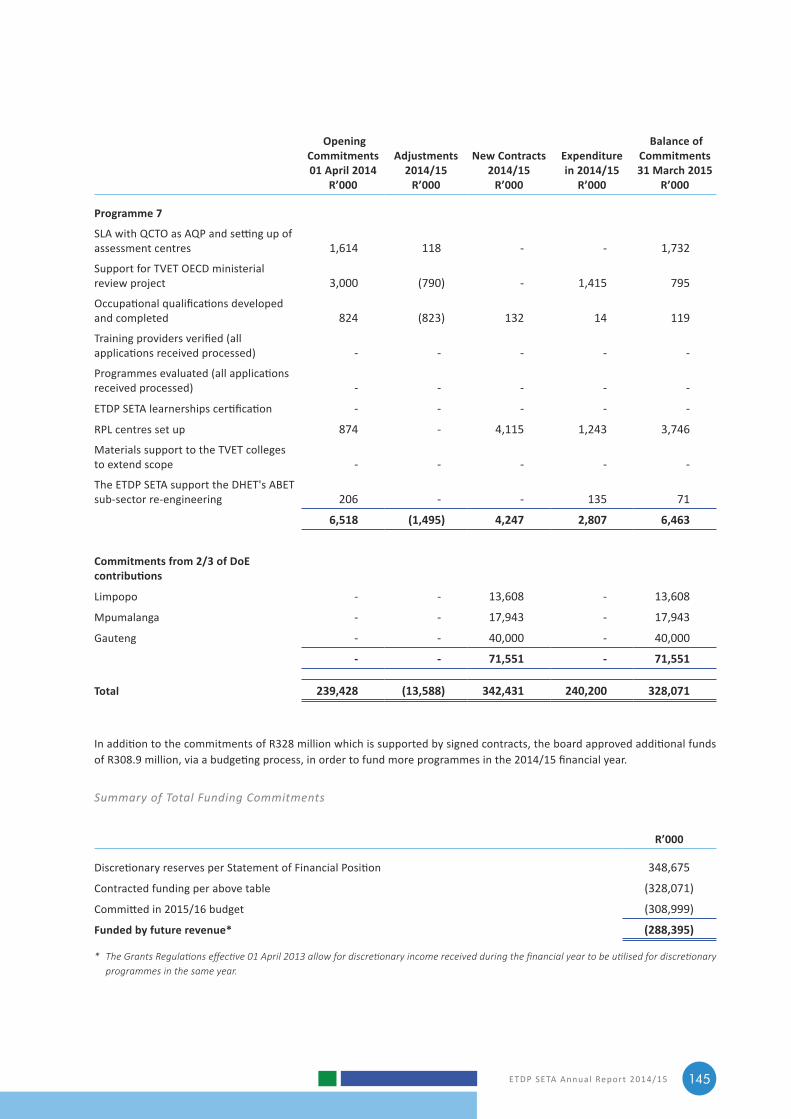
ETDP SETA Annual Report 2014/15 145
Opening Commitments 01 April 2014
R’000
Adjustments 2014/15
R’000
New Contracts 2014/15
R’000
Expenditure in 2014/15
R’000
Balance of Commitments 31 March 2015
R’000
Programme 7
SLA with QCTO as AQP and setting up of assessment centres 1,614 118 ‑ ‑ 1,732
Support for TVET OECD ministerial review project 3,000 (790) ‑ 1,415 795
Occupational qualifications developed and completed 824 (823) 132 14 119
Training providers verified (all applications received processed) ‑ ‑ ‑ ‑ ‑
Programmes evaluated (all applications received processed) ‑ ‑ ‑ ‑ ‑
ETDP SETA learnerships certification ‑ ‑ ‑ ‑ ‑
RPL centres set up 874 ‑ 4,115 1,243 3,746
Materials support to the TVET colleges to extend scope ‑ ‑ ‑ ‑ ‑
The ETDP SETA support the DHET's ABET sub‑sector re‑engineering 206 ‑ ‑ 135 71
6,518 (1,495) 4,247 2,807 6,463
Commitments from 2/3 of DoE contributions
Limpopo ‑ ‑ 13,608 ‑ 13,608
Mpumalanga ‑ ‑ 17,943 ‑ 17,943
Gauteng ‑ ‑ 40,000 ‑ 40,000
- - 71,551 - 71,551
Total 239,428 (13,588) 342,431 240,200 328,071
In addition to the commitments of R328 million which is supported by signed contracts, the board approved additional funds of R308.9 million, via a budgeting process, in order to fund more programmes in the 2014/15 financial year.
Summary of Total Funding Commitments
R’000
Discretionary reserves per Statement of Financial Position 348,675
Contracted funding per above table (328,071)
Committed in 2015/16 budget (308,999)
Funded by future revenue* (288,395)
* TheGrantsRegulationseffective01April2013allowfordiscretionaryincomereceivedduringthefinancialyeartobeutilisedfordiscretionaryprogrammesinthesameyear.
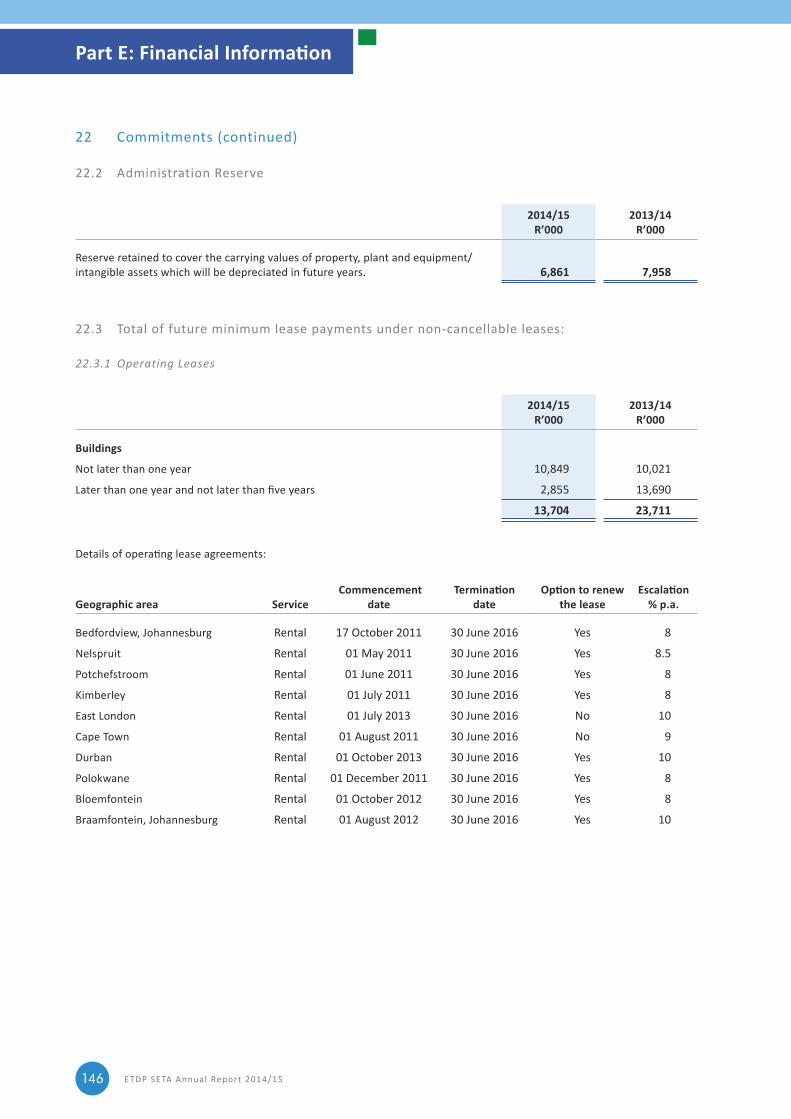
ETDP SETA Annual Report 2014/15146
22 Commitments (continued)
22.2 Administration Reserve
2014/15R’000
2013/14R’000
Reserve retained to cover the carrying values of property, plant and equipment/intangible assets which will be depreciated in future years. 6,861 7,958
22.3 Total of future minimum lease payments under non‑cancellable leases:
22.3.1 Operating Leases
2014/15R’000
2013/14R’000
Buildings
Not later than one year 10,849 10,021
Later than one year and not later than five years 2,855 13,690
13,704 23,711
Details of operating lease agreements:
Geographic area Service Commencement
dateTermination
dateOption to renew
the lease Escalation
% p.a.
Bedfordview, Johannesburg Rental 17 October 2011 30 June 2016 Yes 8
Nelspruit Rental 01 May 2011 30 June 2016 Yes 8.5
Potchefstroom Rental 01 June 2011 30 June 2016 Yes 8
Kimberley Rental 01 July 2011 30 June 2016 Yes 8
East London Rental 01 July 2013 30 June 2016 No 10
Cape Town Rental 01 August 2011 30 June 2016 No 9
Durban Rental 01 October 2013 30 June 2016 Yes 10
Polokwane Rental 01 December 2011 30 June 2016 Yes 8
Bloemfontein Rental 01 October 2012 30 June 2016 Yes 8
Braamfontein, Johannesburg Rental 01 August 2012 30 June 2016 Yes 10
Part E: Financial Information
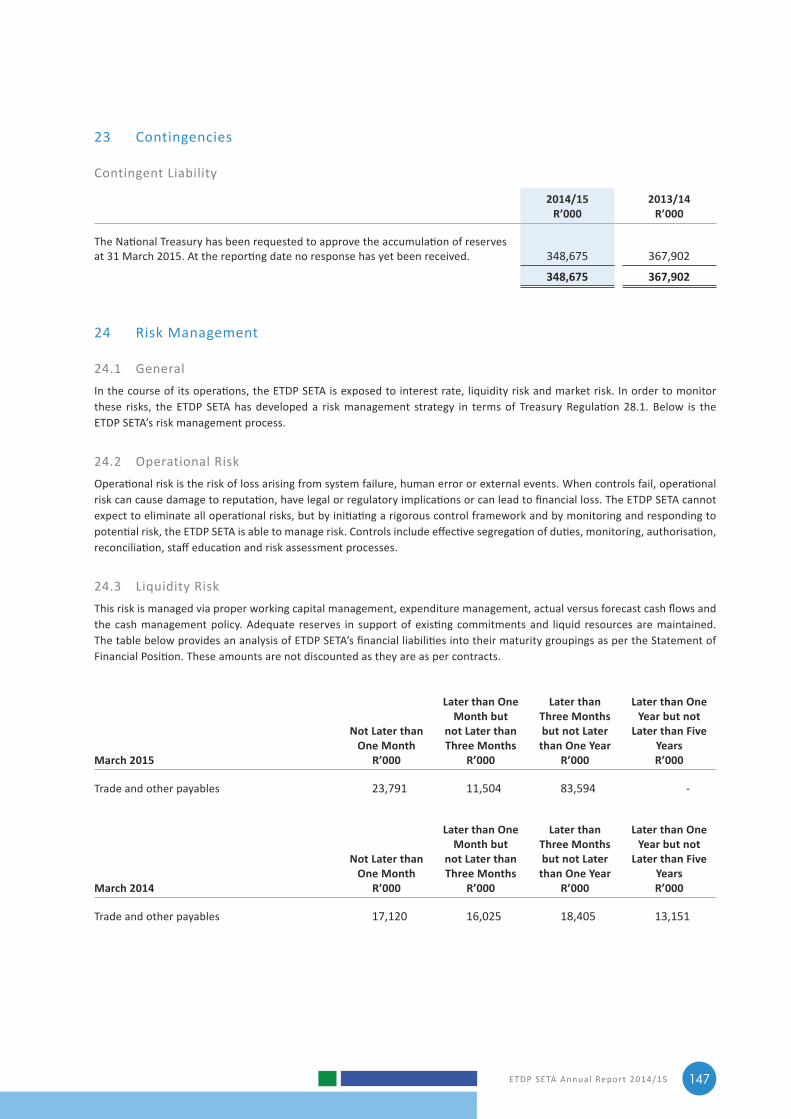
ETDP SETA Annual Report 2014/15 147
23 Contingencies
Contingent Liability
2014/15R’000
2013/14R’000
The National Treasury has been requested to approve the accumulation of reserves at 31 March 2015. At the reporting date no response has yet been received. 348,675 367,902
348,675 367,902
24 Risk Management
24.1 GeneralIn the course of its operations, the ETDP SETA is exposed to interest rate, liquidity risk and market risk. In order to monitor these risks, the ETDP SETA has developed a risk management strategy in terms of Treasury Regulation 28.1. Below is the ETDP SETA’s risk management process.
24.2 Operational RiskOperational risk is the risk of loss arising from system failure, human error or external events. When controls fail, operational risk can cause damage to reputation, have legal or regulatory implications or can lead to financial loss. The ETDP SETA cannot expect to eliminate all operational risks, but by initiating a rigorous control framework and by monitoring and responding to potential risk, the ETDP SETA is able to manage risk. Controls include effective segregation of duties, monitoring, authorisation, reconciliation, staff education and risk assessment processes.
24.3 Liquidity RiskThis risk is managed via proper working capital management, expenditure management, actual versus forecast cash flows and the cash management policy. Adequate reserves in support of existing commitments and liquid resources are maintained. The table below provides an analysis of ETDP SETA’s financial liabilities into their maturity groupings as per the Statement of Financial Position. These amounts are not discounted as they are as per contracts.
March 2015
Not Later than One Month
R’000
Later than One Month but
not Later than Three Months
R’000
Later than Three Months but not Later
than One Year R’000
Later than One Year but not
Later than Five Years R’000
Trade and other payables 23,791 11,504 83,594 ‑
March 2014
Not Later than One Month
R’000
Later than One Month but
not Later than Three Months
R’000
Later than Three Months but not Later
than One Year R’000
Later than One Year but not
Later than Five Years R’000
Trade and other payables 17,120 16,025 18,405 13,151
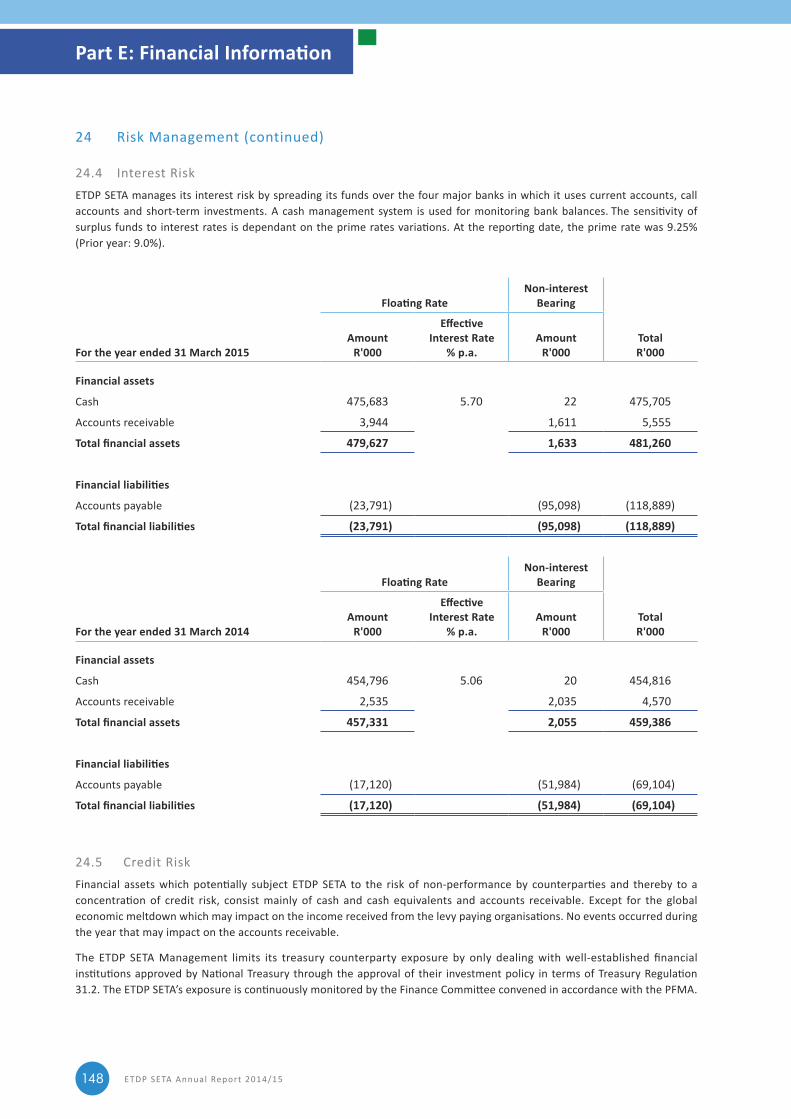
ETDP SETA Annual Report 2014/15148
24 Risk Management (continued)
24.4 Interest RiskETDP SETA manages its interest risk by spreading its funds over the four major banks in which it uses current accounts, call accounts and short-term investments. A cash management system is used for monitoring bank balances. The sensitivity of surplus funds to interest rates is dependant on the prime rates variations. At the reporting date, the prime rate was 9.25% (Prior year: 9.0%).
For the year ended 31 March 2015
Floating RateNon-interest
Bearing
TotalR'000
AmountR'000
Effective Interest Rate
% p.a. Amount
R'000
Financial assets
Cash 475,683 5.70 22 475,705
Accounts receivable 3,944 1,611 5,555
Total financial assets 479,627 1,633 481,260
Financial liabilities
Accounts payable (23,791) (95,098) (118,889)
Total financial liabilities (23,791) (95,098) (118,889)
For the year ended 31 March 2014
Floating RateNon-interest
Bearing
TotalR'000
AmountR'000
Effective Interest Rate
% p.a. Amount
R'000
Financial assets
Cash 454,796 5.06 20 454,816
Accounts receivable 2,535 2,035 4,570
Total financial assets 457,331 2,055 459,386
Financial liabilities
Accounts payable (17,120) (51,984) (69,104)
Total financial liabilities (17,120) (51,984) (69,104)
24.5 Credit RiskFinancial assets which potentially subject ETDP SETA to the risk of non-performance by counterparties and thereby to a concentration of credit risk, consist mainly of cash and cash equivalents and accounts receivable. Except for the global economic meltdown which may impact on the income received from the levy paying organisations. No events occurred during the year that may impact on the accounts receivable.
The ETDP SETA Management limits its treasury counterparty exposure by only dealing with well-established financial institutions approved by National Treasury through the approval of their investment policy in terms of Treasury Regulation 31.2. The ETDP SETA’s exposure is continuously monitored by the Finance Committee convened in accordance with the PFMA.
Part E: Financial Information
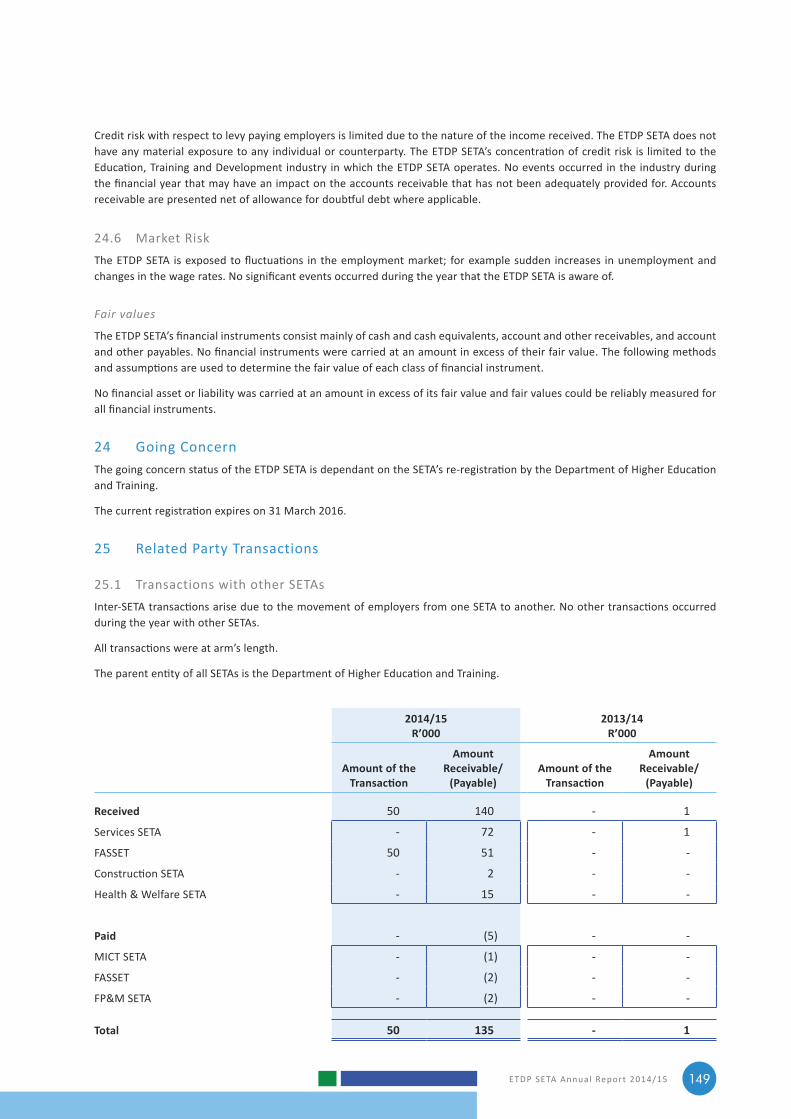
ETDP SETA Annual Report 2014/15 149
Credit risk with respect to levy paying employers is limited due to the nature of the income received. The ETDP SETA does not have any material exposure to any individual or counterparty. The ETDP SETA’s concentration of credit risk is limited to the Education, Training and Development industry in which the ETDP SETA operates. No events occurred in the industry during the financial year that may have an impact on the accounts receivable that has not been adequately provided for. Accounts receivable are presented net of allowance for doubtful debt where applicable.
24.6 Market RiskThe ETDP SETA is exposed to fluctuations in the employment market; for example sudden increases in unemployment and changes in the wage rates. No significant events occurred during the year that the ETDP SETA is aware of.
Fair values
The ETDP SETA’s financial instruments consist mainly of cash and cash equivalents, account and other receivables, and account and other payables. No financial instruments were carried at an amount in excess of their fair value. The following methods and assumptions are used to determine the fair value of each class of financial instrument.
No financial asset or liability was carried at an amount in excess of its fair value and fair values could be reliably measured for all financial instruments.
24 Going ConcernThe going concern status of the ETDP SETA is dependant on the SETA’s re-registration by the Department of Higher Education and Training.
The current registration expires on 31 March 2016.
25 Related Party Transactions
25.1 Transactions with other SETAsInter-SETA transactions arise due to the movement of employers from one SETA to another. No other transactions occurred during the year with other SETAs.
All transactions were at arm’s length.
The parent entity of all SETAs is the Department of Higher Education and Training.
2014/15R’000
2013/14R’000
Amount of the Transaction
Amount Receivable/
(Payable) Amount of the
Transaction
Amount Receivable/
(Payable)
Received 50 140 ‑ 1
Services SETA ‑ 72 ‑ 1
FASSET 50 51 ‑ ‑
Construction SETA ‑ 2 ‑ ‑
Health & Welfare SETA ‑ 15 ‑ ‑
Paid ‑ (5) ‑ ‑
MICT SETA ‑ (1) ‑ ‑
FASSET ‑ (2) ‑ ‑
FP&M SETA ‑ (2) ‑ ‑
Total 50 135 - 1
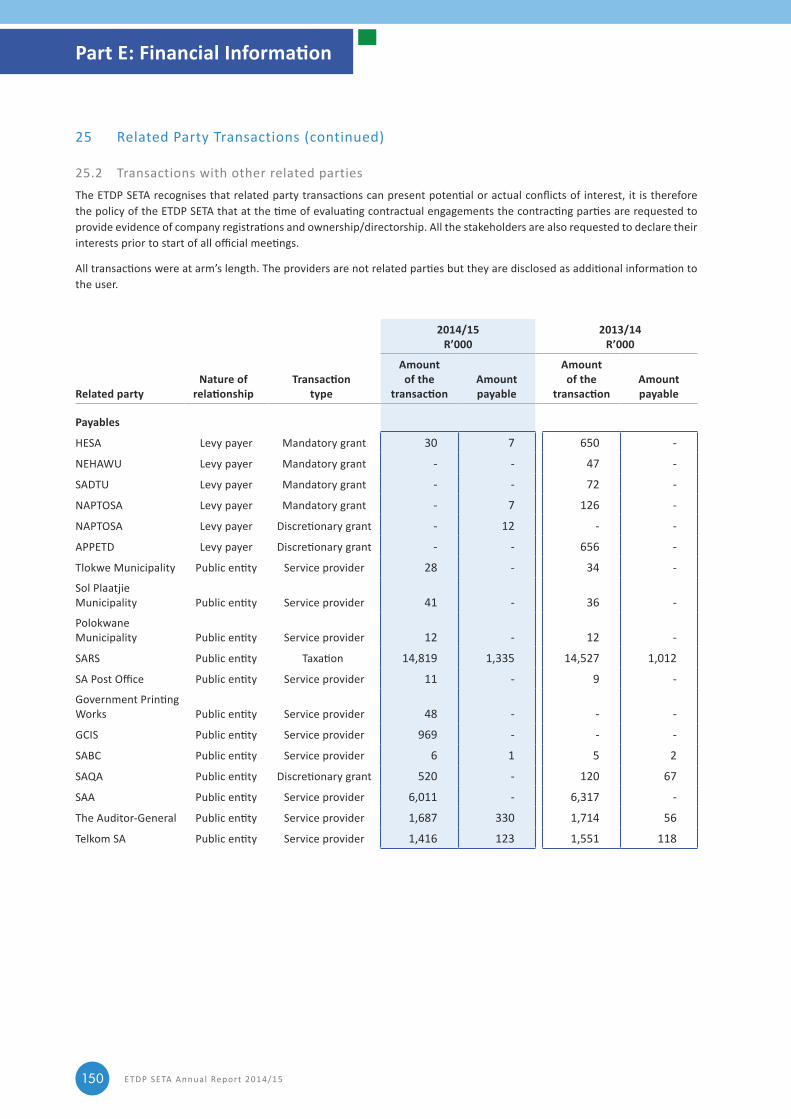
ETDP SETA Annual Report 2014/15150
25 Related Party Transactions (continued)
25.2 Transactions with other related partiesThe ETDP SETA recognises that related party transactions can present potential or actual conflicts of interest, it is therefore the policy of the ETDP SETA that at the time of evaluating contractual engagements the contracting parties are requested to provide evidence of company registrations and ownership/directorship. All the stakeholders are also requested to declare their interests prior to start of all official meetings.
All transactions were at arm’s length. The providers are not related parties but they are disclosed as additional information to the user.
2014/15R’000
2013/14R’000
Related partyNature of
relationship Transaction
type
Amount of the
transaction Amount payable
Amount of the
transaction Amount payable
Payables
HESA Levy payer Mandatory grant 30 7 650 ‑
NEHAWU Levy payer Mandatory grant ‑ ‑ 47 ‑
SADTU Levy payer Mandatory grant ‑ ‑ 72 ‑
NAPTOSA Levy payer Mandatory grant ‑ 7 126 ‑
NAPTOSA Levy payer Discretionary grant ‑ 12 ‑ ‑
APPETD Levy payer Discretionary grant ‑ ‑ 656 ‑
Tlokwe Municipality Public entity Service provider 28 ‑ 34 ‑
Sol Plaatjie Municipality Public entity Service provider 41 ‑ 36 ‑
Polokwane Municipality Public entity Service provider 12 ‑ 12 ‑
SARS Public entity Taxation 14,819 1,335 14,527 1,012
SA Post Office Public entity Service provider 11 ‑ 9 ‑
Government Printing Works Public entity Service provider 48 ‑ ‑ ‑
GCIS Public entity Service provider 969 ‑ ‑ ‑
SABC Public entity Service provider 6 1 5 2
SAQA Public entity Discretionary grant 520 ‑ 120 67
SAA Public entity Service provider 6,011 ‑ 6,317 ‑
The Auditor‑General Public entity Service provider 1,687 330 1,714 56
Telkom SA Public entity Service provider 1,416 123 1,551 118
Part E: Financial Information
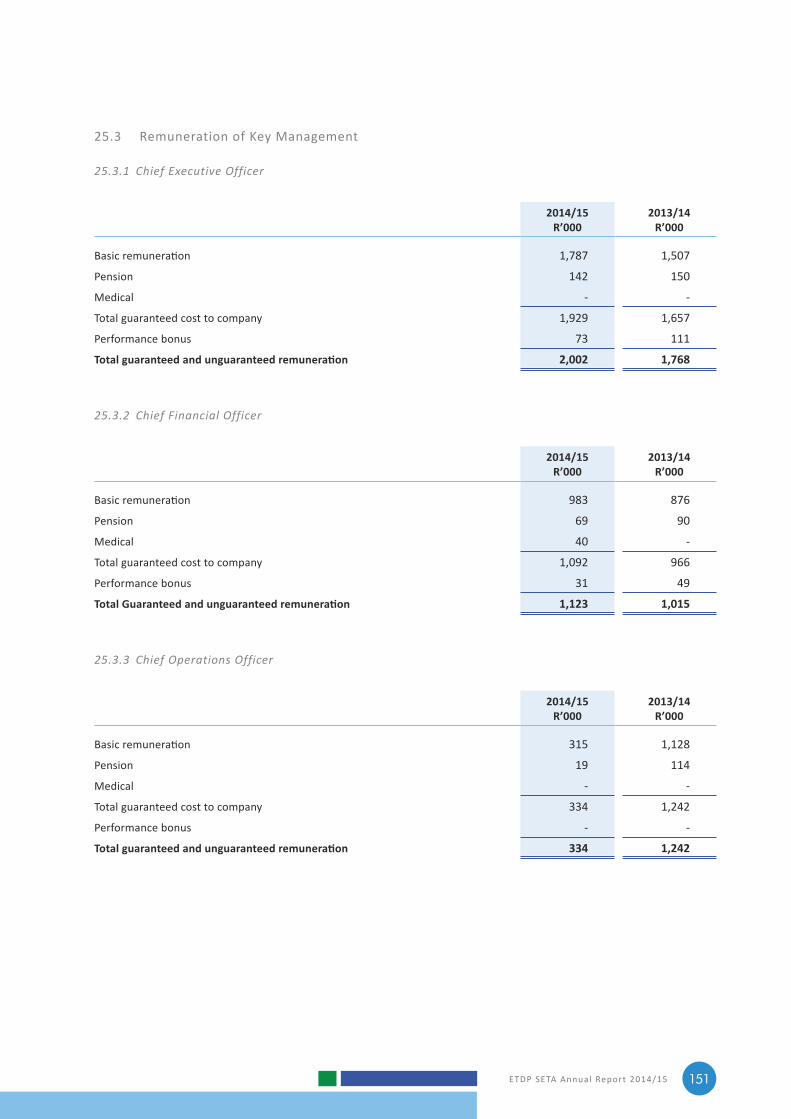
ETDP SETA Annual Report 2014/15 151
25.3 Remuneration of Key Management
25.3.1 Chief Executive Officer
2014/15R’000
2013/14R’000
Basic remuneration 1,787 1,507
Pension 142 150
Medical ‑ ‑
Total guaranteed cost to company 1,929 1,657
Performance bonus 73 111
Total guaranteed and unguaranteed remuneration 2,002 1,768
25.3.2 Chief Financial Officer
2014/15R’000
2013/14R’000
Basic remuneration 983 876
Pension 69 90
Medical 40 ‑
Total guaranteed cost to company 1,092 966
Performance bonus 31 49
Total Guaranteed and unguaranteed remuneration 1,123 1,015
25.3.3 Chief Operations Officer
2014/15R’000
2013/14R’000
Basic remuneration 315 1,128
Pension 19 114
Medical ‑ ‑
Total guaranteed cost to company 334 1,242
Performance bonus ‑ ‑
Total guaranteed and unguaranteed remuneration 334 1,242
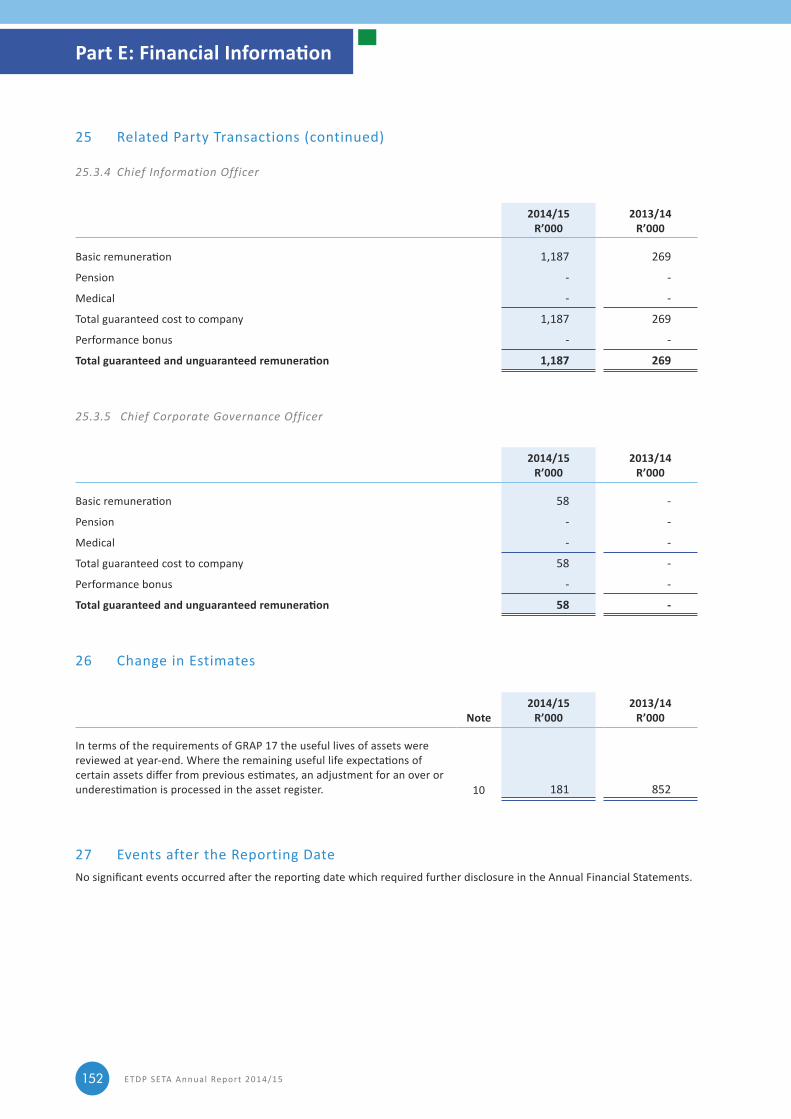
ETDP SETA Annual Report 2014/15152
25 Related Party Transactions (continued)
25.3.4 Chief Information Officer
2014/15R’000
2013/14R’000
Basic remuneration 1,187 269
Pension ‑ ‑
Medical ‑ ‑
Total guaranteed cost to company 1,187 269
Performance bonus ‑ ‑
Total guaranteed and unguaranteed remuneration 1,187 269
25.3.5 Chief Corporate Governance Officer
2014/15R’000
2013/14R’000
Basic remuneration 58 ‑
Pension ‑ ‑
Medical ‑ ‑
Total guaranteed cost to company 58 ‑
Performance bonus ‑ ‑
Total guaranteed and unguaranteed remuneration 58 -
26 Change in Estimates
Note2014/15
R’0002013/14
R’000
In terms of the requirements of GRAP 17 the useful lives of assets were reviewed at year-end. Where the remaining useful life expectations of certain assets differ from previous estimates, an adjustment for an over or underestimation is processed in the asset register. 10 181 852
27 Events after the Reporting DateNo significant events occurred after the reporting date which required further disclosure in the Annual Financial Statements.
Part E: Financial Information
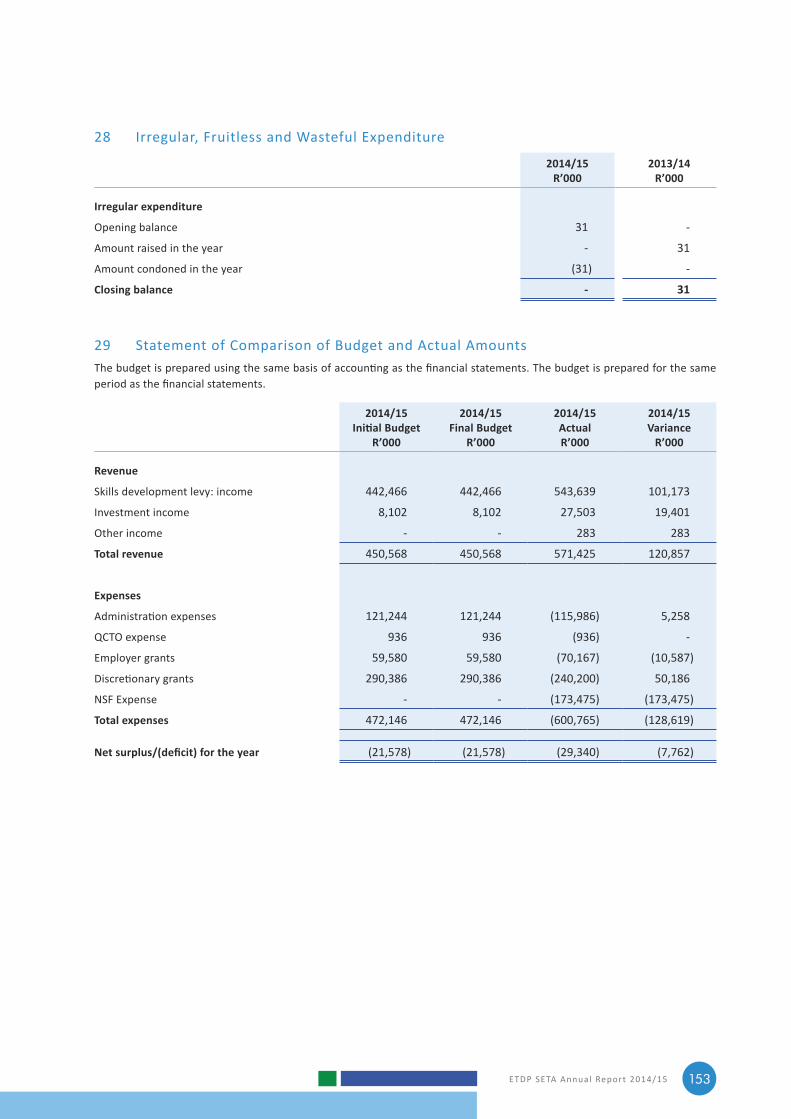
ETDP SETA Annual Report 2014/15 153
28 Irregular, Fruitless and Wasteful Expenditure
2014/15R’000
2013/14R’000
Irregular expenditure
Opening balance 31 ‑
Amount raised in the year ‑ 31
Amount condoned in the year (31) ‑
Closing balance - 31
29 Statement of Comparison of Budget and Actual AmountsThe budget is prepared using the same basis of accounting as the financial statements. The budget is prepared for the same period as the financial statements.
2014/15Initial Budget
R’000
2014/15Final Budget
R’000
2014/15Actual R’000
2014/15Variance
R’000
Revenue
Skills development levy: income 442,466 442,466 543,639 101,173
Investment income 8,102 8,102 27,503 19,401
Other income ‑ ‑ 283 283
Total revenue 450,568 450,568 571,425 120,857
Expenses
Administration expenses 121,244 121,244 (115,986) 5,258
QCTO expense 936 936 (936) ‑
Employer grants 59,580 59,580 (70,167) (10,587)
Discretionary grants 290,386 290,386 (240,200) 50,186
NSF Expense ‑ ‑ (173,475) (173,475)
Total expenses 472,146 472,146 (600,765) (128,619)
Net surplus/(deficit) for the year (21,578) (21,578) (29,340) (7,762)
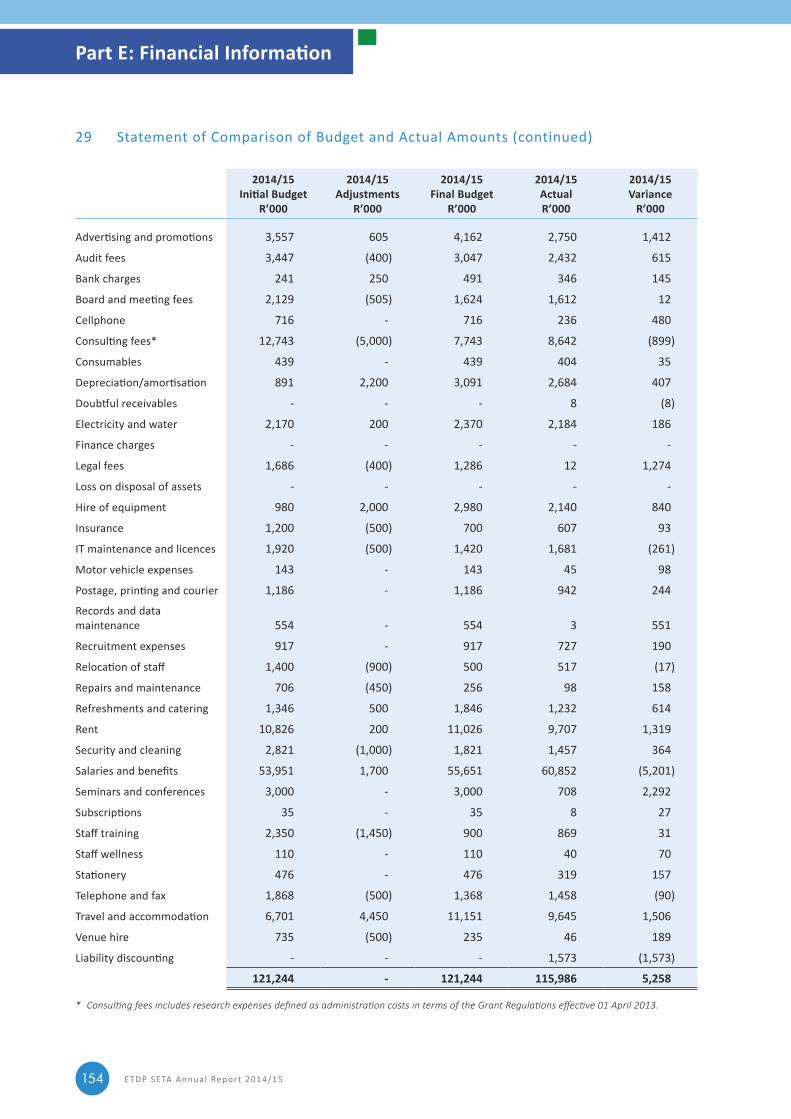
ETDP SETA Annual Report 2014/15154
29 Statement of Comparison of Budget and Actual Amounts (continued)
2014/15Initial Budget
R’000
2014/15 Adjustments
R’000
2014/15Final Budget
R’000
2014/15Actual R’000
2014/15Variance
R’000
Advertising and promotions 3,557 605 4,162 2,750 1,412
Audit fees 3,447 (400) 3,047 2,432 615
Bank charges 241 250 491 346 145
Board and meeting fees 2,129 (505) 1,624 1,612 12
Cellphone 716 ‑ 716 236 480
Consulting fees* 12,743 (5,000) 7,743 8,642 (899)
Consumables 439 ‑ 439 404 35
Depreciation/amortisation 891 2,200 3,091 2,684 407
Doubtful receivables ‑ ‑ ‑ 8 (8)
Electricity and water 2,170 200 2,370 2,184 186
Finance charges ‑ ‑ ‑ ‑ ‑
Legal fees 1,686 (400) 1,286 12 1,274
Loss on disposal of assets ‑ ‑ ‑ ‑ ‑
Hire of equipment 980 2,000 2,980 2,140 840
Insurance 1,200 (500) 700 607 93
IT maintenance and licences 1,920 (500) 1,420 1,681 (261)
Motor vehicle expenses 143 ‑ 143 45 98
Postage, printing and courier 1,186 ‑ 1,186 942 244
Records and data maintenance 554 ‑ 554 3 551
Recruitment expenses 917 ‑ 917 727 190
Relocation of staff 1,400 (900) 500 517 (17)
Repairs and maintenance 706 (450) 256 98 158
Refreshments and catering 1,346 500 1,846 1,232 614
Rent 10,826 200 11,026 9,707 1,319
Security and cleaning 2,821 (1,000) 1,821 1,457 364
Salaries and benefits 53,951 1,700 55,651 60,852 (5,201)
Seminars and conferences 3,000 ‑ 3,000 708 2,292
Subscriptions 35 ‑ 35 8 27
Staff training 2,350 (1,450) 900 869 31
Staff wellness 110 ‑ 110 40 70
Stationery 476 ‑ 476 319 157
Telephone and fax 1,868 (500) 1,368 1,458 (90)
Travel and accommodation 6,701 4,450 11,151 9,645 1,506
Venue hire 735 (500) 235 46 189
Liability discounting ‑ ‑ ‑ 1,573 (1,573)
121,244 - 121,244 115,986 5,258
* ConsultingfeesincludesresearchexpensesdefinedasadministrationcostsintermsoftheGrantRegulationseffective01April2013.
Part E: Financial Information
ETDP SETA Annual Report 2014/15 155
Explanation of material variances between actual results and approved budget
Levies
Skills development levy income is 22% above budget due to new organisations entering the sector and increased level of salaries. We also received 30% contributions from 3 provincial DoEs against a budget of 10% contributions.
Investment income
Investment income is at 339% of the budget due to higher than expected cash balances throughout the financial year. Process delays resulted in commitments not realising as cash payments.
Administration expenses
Advertising and Promotions has not been spent in the year due to revised marketing planning strategy. The next year will see expansion of this area in the organisation.
Legal Fees were underspent due to no litigations in the year.
Salaries and Benefits were overspent due to short‑term contract staff and vacant positions filled.
Seminars and Conferences was underspent to postponement of the Biennial Conference.
Travel and Accommodation was underspent due to cost containment arrangements put in place.
Liability Discounting is an unbudgeted financial adjustment.
Mandatory grants
Grants paid are 17% above budget due to higher levy income received and greater participation by member organisations. Grants in the early part of the year were paid at the higher rate as they still fell under the prior scheme year and hence the old grant regulations.
Discretionary grants
Discretionary grants are 17% underspent for the year. The payment of discretionary grants is dependent on the timing of the mix of programmes implemented in the year. Some projects will only become payable as deliverables are made available in the new year and some projects from the prior year are settled in the current year. Although a great many projects have been committed contractually in the year, it has not been possible to implement them early enough to make all the cash payments that were expected.

ETDP SETA Annual Report 2014/15156
Notes

RP 180/2015 ISBN 978‑0‑261‑43728‑7