part: an attempt in federal performance-based budgeting · an attempt in federal performance-based...
TRANSCRIPT

The Innovation Journal: The Public Sector Innovation Journal, Volume 17(2), 2012, article 5.
1
PART:
An Attempt in Federal Performance-Based
Budgeting
Tiankai Wang, Ph.D. Assistant Professor
Texas State University [email protected]
Sue Biedermann Associate Professor
Texas State University
The Innovation Journal: The Public Sector Innovation Journal, Volume 17(2), 2012, article 5.
2
PART: An Attempt in Federal Performance-based Budgeting
Tiankai Wang and Sue Biedermann
ABSTRACT
The Program Assessment Rating Tool (PART) was the most recent attempt in U.S. federal
performance-based budgeting innovations. This article investigates the development and
implementation of the PART in the federal budgeting process. Over 1000 PART reports
from 2004 to 2008 were retrieved from the PART official website. The effects of the PART
ratings are examined in a set of regression models with a group of control variables that are
known to influence federal budget decisions. The models show positive, but not
statistically significant, results. Therefore, not enough empirical evidence is found that
program appropriation was impacted by the PART ratings.
Keywords: PART, performance-based budgeting, normative budget theory, performance
measurement.
Introduction
Performance-based budgeting is nothing new in public sectors. It derives from a very
simple question – why spend limited funds on some programs or organizations when the
performance measures reveal that other programs or organizations are more effective at
achieving the political objectives behind the budget’s macro allocations? The historical
development of performance-based budgets includes a series of four major government-
wide performance budgeting initiatives attempted since World War II: the Budget and
Accounting Procedures Act of 1950, the Planning-Programming-Budgeting System
implemented in 1965, Management by Objectives initiated in 1973, and Zero-Based
Budgeting initiated in 1977. Each was an analytical technique that embraced one of the
major management concepts of its era with the goal of improving the quality and the
influence of policy decisions. However, all of the reforms were insular, begun and
conducted by the executive branch with Congress given no role and the public screened
from view (U.S. General Accounting Office, 1997). Such reforms generally did not carry
over from one presidential administration to the next.
Federal efforts in rationalizing budget decisions for the intervening decades resulted in the
Program Assessment Rating Tool (PART) under the President’s Management Agenda’s
budget and performance integration initiative (Kettl, 2000; U.S. General Accounting
Office, 2003). The PART was designed as an effort to improve the efficiency of the federal
government (see, e.g., Blanchard, 2008; Breul, 2007b; Redburn et al., 2008; Shea, 2008). But, the PART appears to appeal to a deeply entrenched desire within the public
administration community to find a way to budget “by performance” or “for results”
(White, 2012). The PART was intended to provide a consistent system to evaluate federal
programs as a part of the Presidential budget decision process (U.S. Office of Management
and Budget, 2002) and sought to overcome issues in the Government Performance and
Results Act implementation such as insufficient use of performance information in budget
decisions (Dull, 2006).
The Innovation Journal: The Public Sector Innovation Journal, Volume 17(2), 2012, article 5.
3
The PART was a questionnaire consisting of approximately 30 questions (the number
varies slightly depending on the type of program being evaluated). Federal managers were
required to answer these questions about their program purpose and design, strategic
planning, program management, and program results. Programs were given ratings based
on the answers. These ratings were weighted to a given percentage for each section. The
program purpose and design section was weighted to 20%, the strategic planning section
was weighted to 10%, the program management was weighted to 20%, and the program
results section was weighted to 50%. The ratings weighted to the given percentage were
added together to produce an aggregate score that ranges from 0 to 100. This aggregate
score was indicated in a qualitative rating as follows:
Rating Range
Effective .............................................................. 85-100
Moderately Effective .............................................70-84
Adequate .............................................................. 50-69
Ineffective .............................................................. 0-49
Federal programs were categorized into seven program types, including competitive grant,
block/formula grant, regulatory-based, capital assets and service acquisition, credit,
directed federal, and research & development programs. Some programs, which were
categorized into multiple types, were called mix programs.
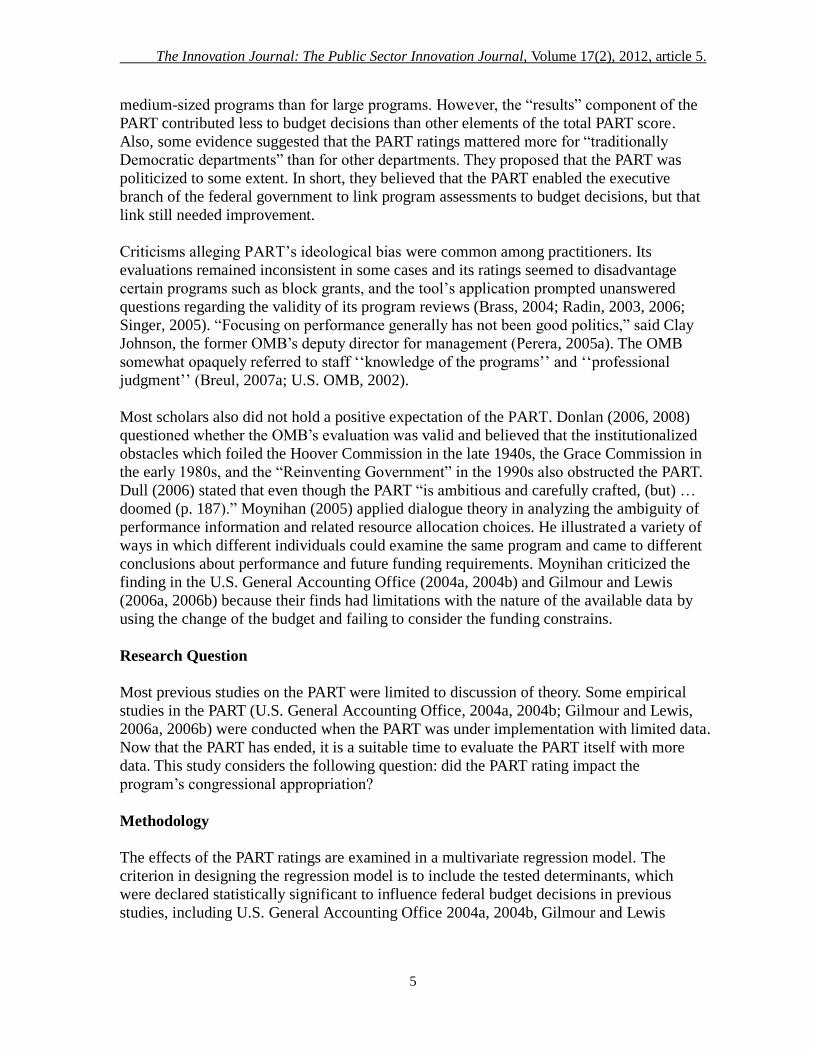
Table 1: Example of PART Worksheet ($ amount in millions)
Agency Program Program
Purpose
Strategic
Planning
Program
Management
Program
Result Rating
FY2006
Actual
FY2008
Request Type
Health
&
Human
Service
Foster
Care 80 88 100 66
Moderate-
ly $4,325 $4,581
Block/
Formula
Grant
Table 1 shows an example of the PART that was for Foster Care in Health & Human
Service for fiscal year 2008. According to the information given in the table, Foster Care in
2008 gained the PART ratings 80, 88, 100 and 66 in program purpose, strategic planning,
program management, and program results respectively. The qualitative rating, “moderately
effective” was based on aggregate score of 77.8 that was calculated by a sum of weighted
four ratings as follows:
(80 × 20%) + (88 × 10%) + (100 × 20%) + (66 × 50%) = 77.8
This study is based on information retrieved from the PART website
(www.expectmore.gov), which includes general information about PART, statistical
summary data of PART ratings, and details about individual PART assessments.
The Innovation Journal: The Public Sector Innovation Journal, Volume 17(2), 2012, article 5.
4
Literature Review
Even before the PART was implemented in 2002, PART advocates began to predict the
success of the forthcoming system. Frank (2002) stated that “the PART provides a better
way for the Office of Management & Budget (OMB) to measure the effectiveness of
federal programs because it introduces an open and understandable review process (p42).”
Mitchell Daniels (2002), the former OMB Director, said that the tool made it possible to
objectively compare the performance of one program to that of another. The new tool was
another important step in the OMB’s work to add more details to the budget decision-
making process, said Bruce McConnell, a former chief of information policy and
technology at the OMB (Frank, 2002). Donna McLean, former chief financial officer at the
Transportation Department, said the PART was a “work in progress,” but it would help
agencies improve program performance over time (Frank and Michael, 2003). Former
House Appropriations Committee spokesman John Scofield said “we actually think a
performance-based budgeting is an excellent idea” (Perera, 2005b: 71).
Mullen (2006) stated that the PART had several successes, including helping structure and
discipline the OMB’s use of performance information over a broad range of programs,
questions, and evidence. The PART also made the OMB’s use of performance information
more transparent in terms of public reporting of judgments and sources, including explicit
recommendations to change management practices and program design in response to the
PART findings. This, in turn, stimulated agencies’ interest in performance and budget
integration and in improving evidence regarding demonstrating program results.
Newcomer (2007) stated that the PART process pushed managers to draw conclusions
about the effectiveness of their programs and substantiate them with evidence. It
underscored the need for managers to report on how they assessed evaluation studies and
applied them to inform program planning and corroborate program results. The move from
simply measuring outputs and outcomes of federal programs to attributing results to the
programs presented a significantly different challenge with much higher requirements for
analysis.
Empirically, U.S. General Accounting Office (2004a, 2004b) found a statistically
significant relationship between the Presidents’s proposed budgetary increases and the
PART ratings for all 234 programs assessed in fiscal year 2004, despite explaining only a
small portion of the variation. The General Accounting Office reports showed that the
PART ratings had no relationship with 27 mandatory programs, however, a positive and
statistically significant effect on funding levels for 196 discretionary programs, suggesting
that federal discretionary programs with better ratings were more likely to receive a higher
level of the proposed budget.
Gilmour and Lewis (2006a, 2006b) studied the 2003 Fiscal Year budget, which was the first
full budget cycle in the Bush Administration. They found that the PART ratings had an
important influence on OMB’s budget decisions, specially the programs with higher PART
ratings received large budget increases. The impact seemed to be greater for small and
The Innovation Journal: The Public Sector Innovation Journal, Volume 17(2), 2012, article 5.
5
medium-sized programs than for large programs. However, the “results” component of the
PART contributed less to budget decisions than other elements of the total PART score.
Also, some evidence suggested that the PART ratings mattered more for “traditionally
Democratic departments” than for other departments. They proposed that the PART was
politicized to some extent. In short, they believed that the PART enabled the executive
branch of the federal government to link program assessments to budget decisions, but that
link still needed improvement.
Criticisms alleging PART’s ideological bias were common among practitioners. Its
evaluations remained inconsistent in some cases and its ratings seemed to disadvantage
certain programs such as block grants, and the tool’s application prompted unanswered
questions regarding the validity of its program reviews (Brass, 2004; Radin, 2003, 2006;
Singer, 2005). “Focusing on performance generally has not been good politics,” said Clay
Johnson, the former OMB’s deputy director for management (Perera, 2005a). The OMB
somewhat opaquely referred to staff ‘‘knowledge of the programs’’ and ‘‘professional
judgment’’ (Breul, 2007a; U.S. OMB, 2002).
Most scholars also did not hold a positive expectation of the PART. Donlan (2006, 2008)
questioned whether the OMB’s evaluation was valid and believed that the institutionalized
obstacles which foiled the Hoover Commission in the late 1940s, the Grace Commission in
the early 1980s, and the “Reinventing Government” in the 1990s also obstructed the PART.
Dull (2006) stated that even though the PART “is ambitious and carefully crafted, (but) …
doomed (p. 187).” Moynihan (2005) applied dialogue theory in analyzing the ambiguity of
performance information and related resource allocation choices. He illustrated a variety of
ways in which different individuals could examine the same program and came to different
conclusions about performance and future funding requirements. Moynihan criticized the
finding in the U.S. General Accounting Office (2004a, 2004b) and Gilmour and Lewis
(2006a, 2006b) because their finds had limitations with the nature of the available data by
using the change of the budget and failing to consider the funding constrains.
Research Question
Most previous studies on the PART were limited to discussion of theory. Some empirical
studies in the PART (U.S. General Accounting Office, 2004a, 2004b; Gilmour and Lewis,
2006a, 2006b) were conducted when the PART was under implementation with limited data.
Now that the PART has ended, it is a suitable time to evaluate the PART itself with more
data. This study considers the following question: did the PART rating impact the
program’s congressional appropriation?
Methodology
The effects of the PART ratings are examined in a multivariate regression model. The
criterion in designing the regression model is to include the tested determinants, which
were declared statistically significant to influence federal budget decisions in previous
studies, including U.S. General Accounting Office 2004a, 2004b, Gilmour and Lewis
The Innovation Journal: The Public Sector Innovation Journal, Volume 17(2), 2012, article 5.
6
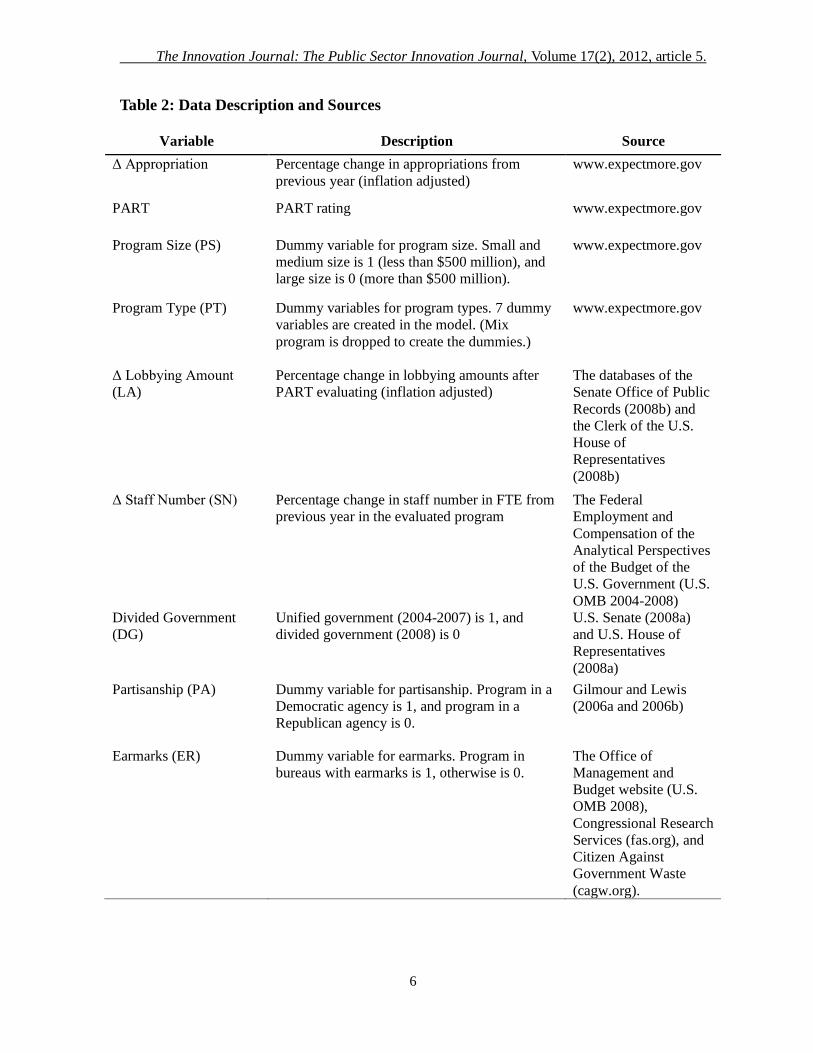
Table 2: Data Description and Sources
Variable Description Source
Δ Appropriation Percentage change in appropriations from
previous year (inflation adjusted)
www.expectmore.gov
PART PART rating www.expectmore.gov
Program Size (PS) Dummy variable for program size. Small and
medium size is 1 (less than $500 million), and
large size is 0 (more than $500 million).
www.expectmore.gov
Program Type (PT) Dummy variables for program types. 7 dummy
variables are created in the model. (Mix
program is dropped to create the dummies.)
www.expectmore.gov
Δ Lobbying Amount
(LA)
Percentage change in lobbying amounts after
PART evaluating (inflation adjusted)
The databases of the
Senate Office of Public
Records (2008b) and
the Clerk of the U.S.
House of
Representatives
(2008b)
Δ Staff Number (SN) Percentage change in staff number in FTE from
previous year in the evaluated program
The Federal
Employment and
Compensation of the
Analytical Perspectives
of the Budget of the
U.S. Government (U.S.
OMB 2004-2008)
Divided Government
(DG)
Unified government (2004-2007) is 1, and
divided government (2008) is 0
U.S. Senate (2008a)
and U.S. House of
Representatives
(2008a)
Partisanship (PA) Dummy variable for partisanship. Program in a
Democratic agency is 1, and program in a
Republican agency is 0.
Gilmour and Lewis
(2006a and 2006b)
Earmarks (ER) Dummy variable for earmarks. Program in
bureaus with earmarks is 1, otherwise is 0.
The Office of
Management and
Budget website (U.S.
OMB 2008),
Congressional Research
Services (fas.org), and
Citizen Against
Government Waste
(cagw.org).

The Innovation Journal: The Public Sector Innovation Journal, Volume 17(2), 2012, article 5.
7
2006a, 2006b. The multivariate regression model is
Δ Appropriation =β0 + β1PART + β2PS + β3PT + β4ΔLA + β5ΔSN + β6DG + β7PA + β8ER
+ ε
The primary data for this study were gathered from the OMB PART website,
www.expectmore.gov. Among the 1004 programs listed in the fiscal year 2009 PART
worksheet, some programs were no longer funded, some had been re-evaluated, and some
budgeting reports were not available. In total, 977 data were valid in this study.
Table 3: Data Descriptive Statistics (Dummy variables are excluded)
Variable Mean Std. Dev. Min Max
Δ Appropriation 7.51% 75.19% -1 11.1
PART 65.63 18.7 10 100
Δ LA (appropriation in millions) 2,643.80 19,712.20 -917 505,062
Δ SN (in FTE) 78.9 136.2 1.1 671
The data were tested with the basic ordinary least squares (OLS) regression model first.
Since the data used in the model cover multiple years and programs, they are panel data.
Panel data sometimes exhibit correlation of regression disturbances over time or between
subjects which violates assumptions on no autocorrelation and homoskedasticity. This
study uses the Wooldridge test for checking serial autocorrelation and the Breusch-Pagan
test for checking the presence of heteroskedasticity.
Table 4: OLS Regression Model output
Variable OLS Estimation
PART 0.08 (0.33) Program Size
Small & Medium (0,1) -3.11
(1.16) ***
Program Type
Block/formula grant (0,1) 1.93
(2.06)
Capital assets & service acquisition (0,1) 6.33
(2.54) **
Competitive grant (0,1) 4.45
(2.22) **

The Innovation Journal: The Public Sector Innovation Journal, Volume 17(2), 2012, article 5.
8
Credit (0,1) -1.9
(6.98)
Directed federal (0,1) 6.02
(2.34) ***
Research & Development (0,1) 4.21
(2.50) *
Regulatory-based (0,1) 5.12
(2.31) ***
Δ Lobbying Amount 0.00 (0.00) *
Δ Staff Number 0.33 (0.12) ***
Divided Government (0.1) 0.09 (0.04) **
Partisanship (0,1) 1.66 (1.33)
Earmarks (0,1) 0.02 (0.06) ***
Constant 30.11
(40.32) *
Autocorrelation 0.03
(0.85)
Heteroskedasticity 46.36
(0.00)
Adj. R-squared 0.13
Note: 1. Level of Significance (two-tail)* p<.10, ** p<.05, *** p<.01, # p<.0001;
2. Figures in parentheses are standard errors;
3. Serial correlation is tested by the Wooldridge test and p-value is in parenthesis.
4. The Breusch-Pagan test for heteroskedasticity is based on basic OLS and p-value is in
parenthesis.
5. In “Program Size”, “Large program” is dropped to create a dummy variable. In “Program
Types”, “Mix program” is dropped to create dummy variables.

The Innovation Journal: The Public Sector Innovation Journal, Volume 17(2), 2012, article 5.
9
In Table 4, the Wooldridge test does not show that autocorrelation exists in the data set;
however, the Breusch-Pagan for heteroskedasticity indicates that the hypothesis of constant
error variance is rejected. Since ignorance of heteroskedasticity leads to biased statistical
inference, this study uses estimated general least square (GLS) (Wang, 2008) and
heteroskedasticity-consistent (HC) standard error estimate (Hayes and Cai, 2007) to correct
heteroskedasticity. The HC estimate contains four methods, HC0, HC1, HC2 and HC3,
which differ in how those squared residuals are used in the estimation process. All four
methods generate very similar outputs. Hereby, only HC3 output is listed in Table 5.
Table 5: GLS Model and HC3 model output
Variable Estimation
GLS HC3
PART 0.06
0.04
(0.02)
(0.05)
Program Size (0,1)
Small & Medium -6.89
-4.47
(2.44) *** (1.72) ***
Program Type
Block/formula grant (0,1) 1.95
5.02
(2.17)
(4.00)
Capital assets & service acquisition (0,1) 5.89
7.38
(2.01) ** (3.59) **
Competitive grant (0,1) 4.90
6.78
(2.12) ** (4.01)
Credit (0,1) -2.01
-10.70 **
(6.81)
(6.98)
Directed federal (0,1) 5.97
7.51
(2.03) *** (3.12) ***
Research & Development (0,1) 4.66
6.21
(2.89) * (4.67)
Regulatory-based (0,1) 5.58
9.45
(2.01) *** (4.53) **
Δ Lobbying Amount 0.00
0.00
(0.00) * (0.00)
Δ Staff Number 0.33
0.92
(0.12) *** (0.14) **
Divided Government (0,1) 0.02
0.00
(0.00) ** (0.00)

The Innovation Journal: The Public Sector Innovation Journal, Volume 17(2), 2012, article 5.
10
Partisanship (0,1) 0.87
1.11
(0.56)
(1.98)
Earmarks (0,1) 0.06
0.00
(0.05) *** (0.00) **
Constant 10.60
18.26
(3.53)
(6.89)
Adj. R-squared 0.96 0.11
Note: 1. Level of Significance (two-tail)* p<.10, ** p<.05, *** p<.01, # p<.0001;
2. Figures in parentheses are standard errors;
3. In “Program Size”, “Large program” is dropped to create a dummy variable. In “Program
Types”, “Mix program” is dropped to create dummy variables.
Discussion and Limitations
From the Table 5 outputs we find that although both models show a positive relationship
between the PART ratings and change in appropriation, the impact is far from being
statistically significant, with p-values equal to 0.7363 and 0.6131, respectively. This means
that not enough empirical evidence was found to indicate that program appropriation was
impacted by the PART ratings. The result is disappointing but it matches many scholars’
expectations. Performance-based budgeting sought to link performance measures to
resource allocations, but such links were often weak (Moynihan, 2003). Past budget reform
failed to significantly influence the budget decision process in part because Congress rarely
used the information in the Congressional authorization and appropriations processes
(Blöndal et al., 2003).
The PART could be regarded as an extension of the long-lasting normative budget reform
attempt by the federal government. Because the PART was a Presidential initiative that
focuses on the budget process in the executive branch, few appropriations staff members
used it in their decision-making process. Some members of the appropriations committees
believed that the PART impinged Congressional authority (Gruber, 2003a, 2003b, 2004) so
most lawmakers depended on the traditional budget justification documents for resource
allocations and paid little attention to the PART ratings. Moe (1987) argued that myopic
focus on the market ignores essential elements of politics and values that were essential to
public administration because public administration could not be a value-neutral doctrine
(Waldo, 1948).
Why was it difficult to implement performance-based budgeting? One reason is that
budgeting is inherently political and legislators are reluctant to cede their budgetary
discretion to a “rational” performance-based budgeting system. But the Government
Performance Project found other reasons legislators were often reluctant to use
performance measures. Distrust of performance data prepared by the executive branch led

The Innovation Journal: The Public Sector Innovation Journal, Volume 17(2), 2012, article 5.
11
many states to create or extend a performance auditing function to verify data. In addition,
legislators were less likely to use performance measures if they were not involved in
creating the measures. Thus some states were increasingly involving legislators in choosing
such measures.
By most counts, more than half of all U.S. cities collect performance measures of some
type (Cope, 1987, 1992; GASB & NAPA, 1997; Poister and Streib, 1994, 1999). Although
many states said that they used this data at some level, there was no standard definition or
process for what it entailed. The link between performance measures and resource
allocations was weak. Performance measures were not used systematically; rather, they
were just one of many factors considered by legislators when approving budgets.
Moreover, legislators were more likely to cite performance measures when they aligned
with constituent interests.
“Under one scenario for performance-based budgeting, resource allocations depend on the
previous year’s performance. In theory, then, agencies that achieve a large portion of their
performance targets receive more funding, while agencies that perform poorly see their
funding cut (Moynihan, 2003: 2-3).” But that usually does not happen. In its response to a
2001 survey by the Government Performance Project, the state of Hawaii offers an even
more compelling reason:
When resources are limited or insufficient, the link between performance measures
and resource allocations becomes blurred. Even if a program “performs well,”
commensurate funding may not be forthcoming if it is considered a marginal
function of government. Conversely, less cost-effective or “poorly-performing”
programs may continue to be funded if these are “essential” government
functions— such as education, welfare or prisons (Moynihan, 2003: 2).
Indeed, the legislators often take into account performance measures when poor
performance outcomes are identified and tied to requests for increased funding. In
Oklahoma, for example, the number of uninsured children was used as an indicator of
health care access. Elected officials quickly determined that this number was unacceptably
high and reallocated state funding from Medicaid — the U.S. government’s health care
entitlement program for poor people — to target young children and pregnant women
(Barczak, 2004).
In quantitative research, the selection of determinants in the regression model impacts the
research output. In PART research, no unanimous agreement on the related determinants
exists. Budgeting is a complex process. Many factors could influence the Congress
appropriation. In this research, the author only adopted the determinants tested by the
previous studies. The data integrity also impacts the outcome’s reliability. The data were
gathered from the same resources to enhance the reliability of the analysis. In this research,
the author mainly gathered the information from the official sources such as the OMB
website. Some information, however, could not be found in the sole source such as the
earmarks information. In this case, three sources were used. It was found that some
information was different from one another.

The Innovation Journal: The Public Sector Innovation Journal, Volume 17(2), 2012, article 5.
12
Conclusion
By studying the relationship between the PART ratings and the program appropriation from
2004 to 2008, no significant result is available to support that the PART contributed to
performance-based budgets. Such a result is predictable because of the obstacles in
fulfilling performance-based budgets.
Like its ancestors, the PART brought about smaller scale changes than initially promised, in
part because the federal political system was likely to militate against any kind of radial
changes (Joyce, 1993a, 1993b). In a sense, however, if a promise of these reform efforts
was a provision of information or methods that allowed budgeters to allocate resources in a
better way, it was likely to be a continuous desire (Radin, 2006) since the continuous
enthusiasm for the normative budget reforms were in part rooted in the lack of budgetary
theory that was what V. O. Key (1940) sought and the lack of facts that was what Lewis
(1952) tried to find (Melkers & Willoughby, 1998).
Although the PART did not reach the promised result, it brought the idea of performance
measurement into the federal level and tried to apply the performance-based budget
principles into the practice. On the plus side, this assessment tool helped establish the
result-oriented evaluation in the public sector, assisted users in gaining experience in
performance-based budget design and paved the path for future studies on normative
budget theory.
About the Authors
Tiankai Wang, PhD, is an Assistant Professor in the Health Information Management
department, Texas State University–San Marcos. Wang can be reached at [email protected].
Sue Biedermann, MSHP, RHIA, FAHIMA, is an Associate Professor and the Chair in the
Health Information Management department, Texas State University-San Marcos.
Biedermann can be reached at [email protected].
References
Barczak, Monica. 2004. “The Uninsured in Oklahoma: Who are they and why don’t they
have insurance?” Community Action Project Issue Paper, May. Tulsa, OK: Oklahoma
Policy Institute.
Blanchard, Lloyd A. 2008. “PART and Performance Budgeting Effectiveness.” In
Performance Management and Budgeting: How Governments Learn from Experience,
edited by F. Stevens Redburn, Robert J. Shea, and Terry F. Buss, 67–91. Armonk,
NY: M. E. Sharpe.
Blöndal, Jón R., Dirk-Jan Kraan and Michael Ruffner. 2003. “Budgeting in the United
States.” OECD Journal on Budgeting, 3(2): 7-53.

The Innovation Journal: The Public Sector Innovation Journal, Volume 17(2), 2012, article 5.
13
Brass, Clinton T. 2004. “The Bush administration’s Program Assessment Rating Tool
(PART).” Congressional Research Service Report for Congress, 5 November.
Washington, DC: Congressional Research Service.
Breul, Jonathan D. 2007a. “GPRA – A Foundation for Performance Budgeting.” Public
Performance & Management Review, 30(3): 312–331.
Breul, Jonathan D. 2007b. “Three Bush Administration Management Initiatives: The
President’s Management Agenda, Freedom to Manage Legislative Proposals, and the
Program Assessment Rating Tool.” Public Administration Review, 67(1): 21–26.
Cope, Glen H. 1987. “Local Government Budgeting and Productivity: Friends or Foes?”
Public Productivity Review, 10(3): 45-57.
Cope, Glen H. 1992. “Walking the Fiscal Tightrope: Local Government Budgeting and
Fiscal Stress.” International Journal of Public Administration, 15(5): 1097-1120.
Daniels, Mitchell. 2002. “Planning for the President’s Fiscal Year 2004 Budget Request.”
Memorandum for Heads of Executive Departments and Agencies, M-02-06, April 24.
Washington, DC: U.S. Office of Management and Budget.
Donlan, Thomas. 2006. “Delusions of Adequacy.” Barron's, 86 (10): 50.
Donlan, Thomas. 2008. “Editorial commentary: ‘Results not demonstrated.’” Barron's, 83
(7): 31.
Dull, Matthew. 2006. “Why PART? The Institutional Politics of Presidential Budget
Reform.” Journal of Public Administration Research and Theory, 16(2):187–215.
Frank, Diane. 2002. “Budgeting tool targets performance.” Federal Computer Week, 16(19):
42.
Frank, Diane and Sara Michael. 2003. “Performance budgeting still a work in progress.”
Federal Computer Week, 17 (12): 28.
Gilmour, John, and David Lewis. 2006a. “Assessing Performance Budgeting at OMB: The
influence of Politics, Performance, and Program Size.” Journal of Public
Administration Research and Theory, 16(2): 169-186.
Gilmour, John, and David Lewis. 2006b. “Does Performance Budgeting Work? An
Examination of the Office of Management and Budget’s PART scores.” Public
Administration Review, 66(5): 742-752.
Governmental Accounting Standards Board (GASB) & National Academy of Public
Administration (NAPA). 1997. Report on Survey of State and Local Government Use
and Reporting of Performance Measure, Washington, DC: Governmental Accounting

The Innovation Journal: The Public Sector Innovation Journal, Volume 17(2), 2012, article 5.
14
Standards Board.
Gruber, Amelia. 2003a. “OMB Ratings Have Little Impact on Hill Budget Decisions.”
Accessed May 1, 2010. http://www.govexec.com/dailyfed/0603/061303a1.htm.
Gruber, Amelia. 2003b. “OMB to Brief Appropriators about Federal Program Ratings.”
Accessed May 1, 2010. http://www.govexec.com/dailyfed/0703/070203a2.htm.
Gruber, Amelia. 2004. “Bush's Management Agenda Lacks Congressional Support,
Executives Say.” Accessed May 1, 2010.
http://www.govexec.com/dailyfed/0703/070203a2.htm.
Hayes, Andrew and Li Cai. 2007. “Using heteroskedasticity-consistent standard error
estimators in OLS regression: An introduction and software implementation.”
Behavior Research Methods, 39(4): 709-22.
Joyce, Philip G. 1993a. “Using Performance Measures for Federal Budgeting: Proposals
and Prospects.” Public Budgeting and Finance, 13(4): 3-17.
Joyce, Philip G. 1993b. “The Reiterative Nature of Budget Reform: Is There Anything
New in Federal Budgeting?” Public Budgeting and Finance, 13(3): 36-48.
Kettl, Donald. 2000. The Global Public Management Revolution: A Report on the
Transformation of Governance. Washington, DC: Brookings Institution.
Key, Vladimer O. 1940. “The Lack of a Budgetary Theory.” American Political Science
Review, 34(6): 1137-1144.
Lewis, Verne B. 1952. “Toward a Theory of Budgeting.” Public Administration Review,
12(1): 42-54.
Melkers, Julia and Katherine Willoughby. 1998. “The State of the States: Performance-
Based Budgeting Systems in 47 of 50.” Public Administration Review, 58(1): 66-73.
Moe, Terry M. 1987. “Congressional Controls of the Bureaucracy: An assessment of the
positive theory of 'Congressional Dominance.’” Legislative Studies Quarterly, 12(4):
475-520.
Moynihan, Donald P. 2003. “Performance-based Budgeting: beyond Rhetoric.” The World
Bank Poverty Reduction and Economic Management Notes, 78: 1-4.
Moynihan, Donald P. 2005. “What Do We Talk About When We Talk About Performance?
Dialogue Theory and Performance Budgeting.” Journal of Public Administration
Research and Theory, 16(2):151–168.

The Innovation Journal: The Public Sector Innovation Journal, Volume 17(2), 2012, article 5.
15
Mullen, Patrick R. 2006. “Performance-Based Budgeting: The Contribution of the Program
Assessment Rating Tool.” Public Budgeting & Finance, 26(4):79-88.
Newcomer, Kathryn E. 2007. “How Does Program Performance Assessment Affect
Program Management in the Federal Government?” Public Performance &
Management Review, 30(3): 332–350.
Perera, David. 2005a. “Getting down to Metrics: OMB Wants Agencies to Take
Architecture Seriously.” Federal Computer Weekly, 19(9): 14.
Perera, David. 2005b. “OMB and Congress at Odds over Budgeting.” Federal Computer
Week, 19(13): 71.
Poister, Theodore H. and Gregory Streib. 1994. “Municipal Management Tools from 1976
to 1993: An Overview and Update.” Public Productivity and Management Review,
18(2): 115-125.
Poister, Theodore H. and Gregory Streib. 1999. “Performance Measurement in Municipal
Government: Assessing the State of the Practice.” Public Administration Review,
59(4): 325-335.
Radin, Beryl A. 2003. “The Future Direction of Public Administration Research.” Public
Management Research Association Newsletter, 1 (1): 14.
Radin, Beryl A. 2006. Challenging the Performance Movement: Accountability,
Complexity, And Democratic Values. Washington, DC: Georgetown University Press.
Redburn, F. Stevens, Robert J. Shea, Terry F. Buss, and Ednilson Quintanilla. 2008.
“Performance-Based Management: How Governments Can Learn from Experience.”
In Performance Management and Budgeting: How Governments Learn from
Experience, edited by F. Stevens Redburn, Robert J. Shea, and Terry F. Buss, 3–18.
Armonk, NY: M. E. Sharpe.
Shea, Robert J. 2008. “Performance Budgeting in the United States.” OECD Journal on
Budgeting, 8(1): 61–73.
Singer, Paul. 2005. “Bush and the Bureaucracy: A Crusade for Control.” National Journal,
March 25.
U.S. General Accounting Office. 1997. Performance budgeting: Past initiatives offer
insights for GPRA implementation. GAO/AIMD-97–46. Washington, DC: General
Accounting Office.
U.S. General Accounting Office. 2003. Management Reform: Continuing Progress in
Implementing Initiatives in the President’s Management Agenda. GAO-03-556T.
Washington, DC: General Accounting Office.
The Innovation Journal: The Public Sector Innovation Journal, Volume 17(2), 2012, article 5.
16
U.S. General Accounting Office. 2004a. Performance Budgeting: Observations on the Use
of OMB's Program Assessment Rating Tool for the Fiscal Year 2004 Budget. GAO-
04-174. Washington, DC: General Accounting Office.
U.S. General Accounting Office. 2004b. Performance Budgeting: OMB’s Performance
Rating Tool Presents Opportunities and Challenges for Evaluating Program
Performance. GAO-04-550T. Washington, DC: General Accounting Office.
U.S. Office of Management and Budget. 2002. “Improving the Measurement of Program
Effectiveness.” Paper presented at OMB/NSF work-shop Strengthening Program
Effectiveness Measurement of Federal Programs, Arlington, Virginia, May 21.
Washington, DC: Office of Management and Budget.
U.S. Office of Management and Budget. 2003-2008. “Analytical Perspectives, Budget of
the United States Government.” Accessed May 1, 2010.
http://www.whitehouse.gov/omb/budget/Analytical_Perspectives.
U.S. Office of Management and Budget. 2008. “Earmarks.” Accessed May 1, 2010.
http://earmarks.omb.gov/download.html.
U.S. Senate. 2008a. “Party Division in the Senate, 1789-Present.” Accessed May 1, 2010.
http://www.senate.gov/pagelayout/history/one_item_and_teasers/partydiv.htm.
U.S. Senate. 2008b. “Lobbying Disclosure Act Reports.” Accessed May 1, 2010.
http://www.senate.gov/legislative/Public_Disclosure/LDA_reports.htm.
U.S. House of Representatives. 2008a. “Party Divisions of the House of Representatives,
1789 - Present.” Accessed May 1, 2010.
http://clerk.house.gov/art_history/house_history/partyDiv.html.
U.S. House of Representatives. 2008b. “Lobbying Closure.” Accessed May 1, 2010.
http://lobbyingdisclosure.house.gov.
Waldo, Dwight. 1948. The Administrative State: A Study of the Political Theory of
American Public Administration. New York, NY: The Ronald Press.
Wang, Tiankai. 2008. Government Fiscal Transparency on Municipal Bond Issuance.
Saarbrücken, Germany: VDM Verlag Dr. Mueller.
White, Joseph. 2012. “Playing the Wrong PART: The Program Assessment Rating Tool
and the Functions of the President’s Budget.” Public Administration Review, 72 (1):
112–121.