part 9 reference paper
TRANSCRIPT
7/22/2019 Part 9 Reference Paper
http://slidepdf.com/reader/full/part-9-reference-paper 1/44
Geotextile containment for hydraulic andenvironmental engineering
C. R. Lawson
Managing Director, Ten Cate Geosynthetics, Suite 3205, 32nd Floor, The Center, 99 Queen’s Road
Central, Hong Kong, Telephone: +852 22804680, Telefax: +852 22950323, E-mail:
Received 4 June 2008, accepted 4 June 2008
ABSTRACT: Historically, geotextile containment has been used to encapsulate sandy soils to
permit their use as flexible, erosion-resistant, mass-gravity structures in hydraulic and marine
applications. More recently, geotextile containment has been used as a means of disposing of, and
dewatering, various waste streams and contaminated sediments. The paper reviews the three main
geotextile containment units in use – geotextile tubes, geotextile containers and geotextile bags –
and analyses their use in a wide range of hydraulic and environmental applications. Special
attention is given to the use of geotextile containment for the isolation, dewatering, and disposal of
specific waste streams and contaminated sediments. Note: This paper is an updated version of the
Giroud Lecture presented by C. R. Lawson at the 8th International Conference on Geosynthetics
held in Yokohama, Japan, in 2006.
KEYWORDS: Geosynthetics, Geotextile containment, Geotextile tubes, Geotextile containers,
Geotextile bags, Dewatering
REFERENCE: Lawson, C. R. (2008). Geotextile containment for hydraulic and environmental
engineering. Geosynthetics International, 15, No. 6, 384–427. [doi: 10.1680/gein.2008.15.6.384]
1. INTRODUCTION
Geotextile containment is used for an increasing range of
applications. Table 1 lists the current three main applica-
tion areas commonly referred to: hydraulic and marine,
foundations, and environmental. In hydraulic and marine
applications geotextile containment prevents the erosion,
and collapse, of sand fill, thereby enabling its use in
erosion-resistant structures. In foundation applications
geotextile containment improves the bearing capacity of
stone and sand columns in low-shear-strength foundation
soils. In environmental applications geotextile containment
enables controlled dewatering of slurry waste and con-
taminated sediments, thereby substantially reducing their
volume and rendering them manageable for disposal. Also,
geotextile containment can be used for the controlled
offshore disposal of contaminated soil and sediments.
The application of geotextile containment in founda-
tions may be considered more a case of geotextile
confinement than of containment, because the aim is to
improve the bearing capacity of the columns by generating
confining tensions in the geotextile skin: consequently,
this application is not considered further in this paper.
Thus the paper will concentrate on two of the applications
of geotextile containment listed in Table 1: hydraulic and
marine applications, and environmental applications.
2. TYPES OF GEOTEXTILECONTAINMENT UNIT
Geotextile containment, in one form or another, has been
used for many years for a wide variety of hydraulic and
marine applications. The most common, and widely used,
geotextile containers are the well-known, ubiquitous sand-
bags that are seen the world over, shoring up flood
defences in times of natural calamity.
Three fundamental types of geotextile containment unitexist, differentiated by geometrical shape and volume:
geotextile tubes, geotextile containers, and geotextile bags.
Geosynthetics International , 2008, 15, No. 6
384
Table 1. Range of applications of geotextile containment
Geotextile containment
applications
Examples
Hydraulic and marine Mass-gravity revetment and dyke
structures
Mass-gravity offshore structures
Surface protection to stream banks
Foundations Encasing of stone and sand columns
Environmental Dewatering of waste and
contaminated sedimentsOffshore disposal of contaminated
soil and sediments
7/22/2019 Part 9 Reference Paper
http://slidepdf.com/reader/full/part-9-reference-paper 2/44
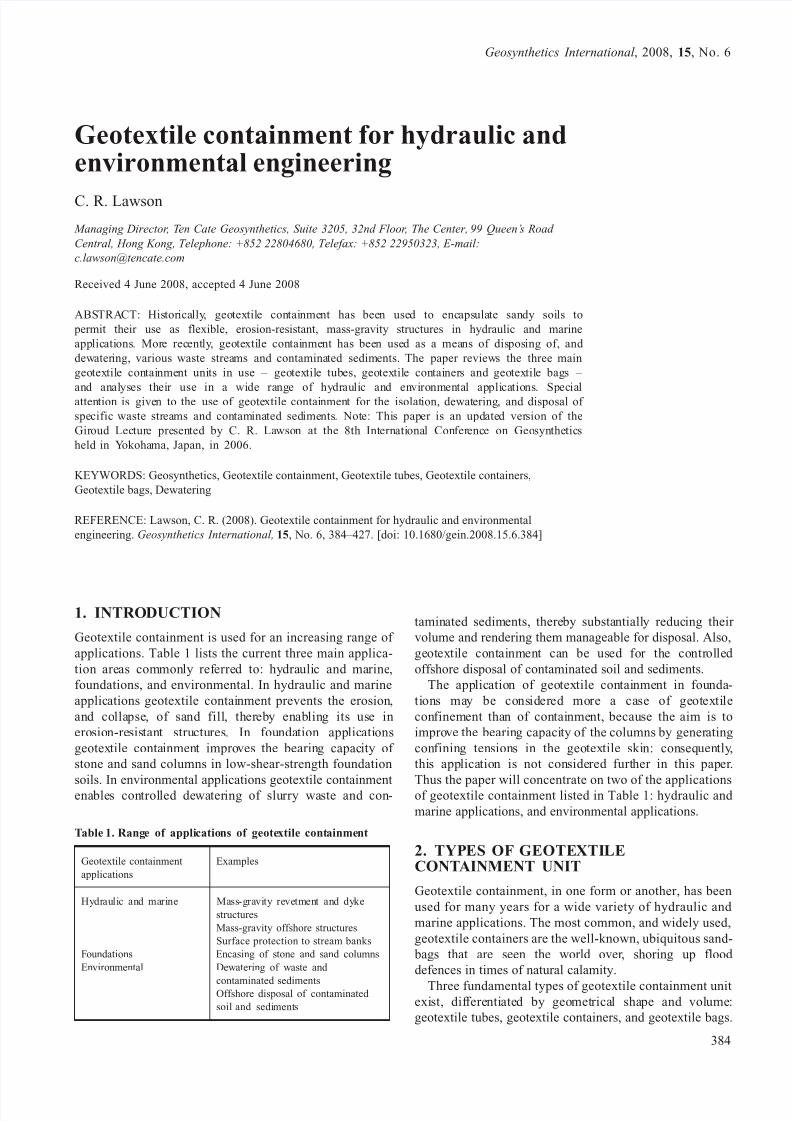
Geotextile tubes (Figure 1a) are tubular containers that are
formed in situ on land or in water. Geotextile containers
(Figure 1b) are large-volume containers that are filled in
barges above water and then deposited into submarine
environments. Geotextile bags (Figure 1c) are small-
volume containers that are filled on land or above water
and then pattern-placed either near water or below water
level.
Geotextile tubes are laid out and filled on site to their
required geometrical form. The tubes are filled by hydrau-
lically pumping fill into the tube. Geotextile tubes range
in size from 1 m to 10 m in diameter, and up to 200 m in
length.
Geotextile containers are large-volume containers that
are filled above water and then positioned and placed at
water depth. The volumes of these containers morecommonly range from 100 m3 to 700 m3, although con-
tainers as large as 1000 m3 have been installed. To
facilitate the installation of geotextile containers of this
magnitude, an efficient and practical installation system
must be utilised. To date, this has been accomplished by
means of split-bottom barges.
Geotextile bags are manufactured in a range of shapes,
and they are installed in a pattern-placed arrangement that
greatly improves their overall stability and performance.
Today, geotextile bags range in volume from 0.05 m3 to
around 5 m3, and may be pillow-shaped, box-shaped or
mattress-shaped, depending on the required application.
When considering geotextile containment, a distinction
must be made between those applications where the
geotextile containment is required only for temporary or
expedient use and those applications that require long-
term performance. For example, for temporary or expedi-
ent works the requirements for the geotextile container are
fairly basic, as it has only a short life expectancy over
which it has to perform; however, for long-term applica-
tions the performance requirements for the geotextile
container are more severe. With regard to long-term
performance, a distinction also must be made according to
the type of hydraulic environment acting on the geotextile
container. For instance, the action of still, or slowlymoving, water will have a different effect on the geotextile
container than the action of breaking waves.
3. GEOTEXTILE TUBES FOR HYDRAULIC AND MARINEAPPLICATIONS
3.1. Fundamentals of geotextile tubes
Geotextile tubes first began to be used for hydraulic and
marine structures in the 1960s. These tubes (Longard tubes) were of small theoretical diameter (less than 2 m),
and proved of limited use owing to their instability,
especially in hydraulic environments. Longard tubes uti-
lised an impermeable inner lining to the woven geotextile
skin in order to pressurise the tube with water before
introduction of the sand fill.
During the 1980s large-diameter geotextile tubes were
developed using strong, woven geotextiles as the tube skin
(and with no impermeable inner liner). The major advan-
tage of these later tubes is that a large encapsulated mass,
a tubular structure, could be designed directly to meet
many hydraulic and marine stability requirements. Also,
during the late 1980s, heavyweight nonwoven geotextileswere developed for geotextile tubes of small theoretical
diameter (less than 1.5 m). Today, geotextile tubes ranging
(a)
(b)
(c)
Figure 1. Types of geotextile containment unit: (a) geotextile
tubes; (b) geotextile containers; (c) geotextile bags
Geotextile containment for hydraulic and environmental engineering 385
Geosynthetics International , 2008, 15, No. 6
7/22/2019 Part 9 Reference Paper
http://slidepdf.com/reader/full/part-9-reference-paper 3/44
in theoretical diameters from 1.0 m to 6.0 m are used in
many hydraulic and marine applications the world over.
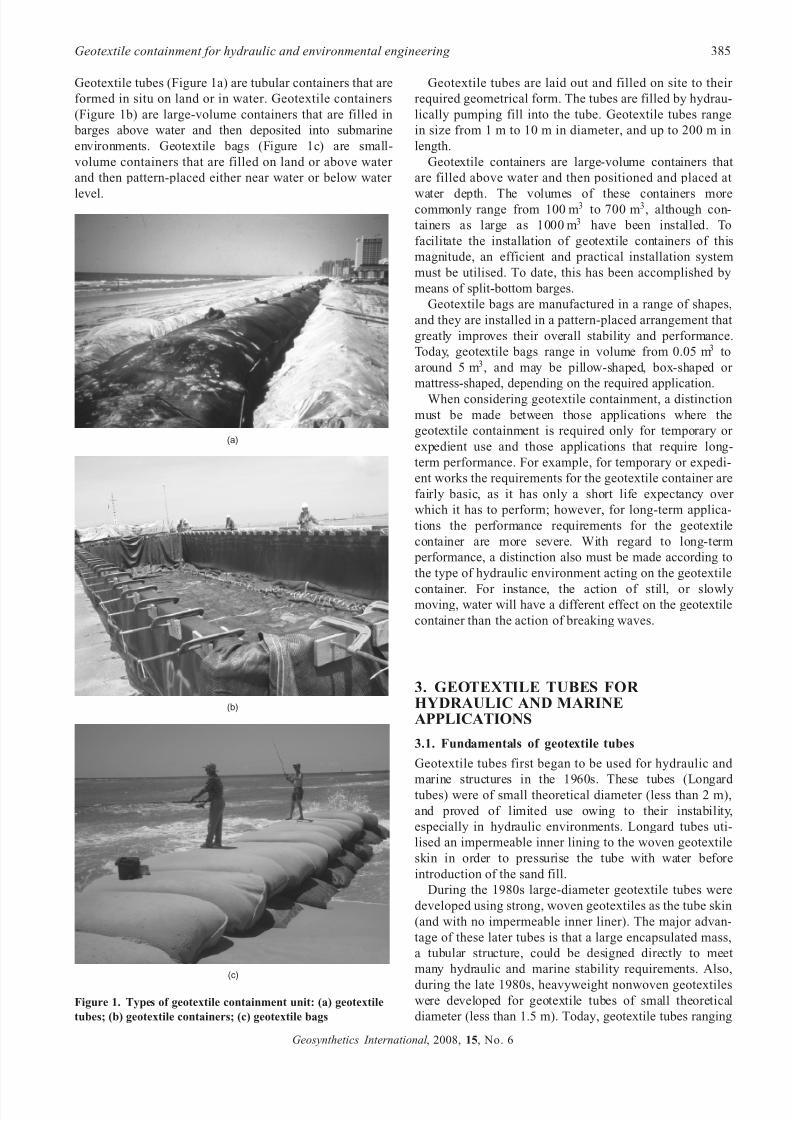
Geotextile tubes are laid out and filled hydraulically on
site to their required geometrical form. The typical
features of a geotextile tube are shown in Figure 2.
Hydraulic fill is pumped into the geotextile tube through
specially manufactured filling ports located at specific
intervals along the top of the tube. During filling, thetube, being permeable, allows the excess water to pass
through the geotextile skin while the retained fill attains a
compacted, stable mass within the tube. For hydraulic and
marine applications the type of fill used is sand, or a
significant percentage of sand. The reasons for this are
that this type of fill can be placed to a good density by
hydraulic means; it has good internal shear strength; and,
once placed, it will not undergo further consolidation,
which would significantly change the filled shape of the
geotextile tube. Once filled, the geotextile tube behaves as
a mass-gravity unit, and can be designed accordingly.
The geotextile skin performs three functions that are
critical to the performance of the f illed geotextile tube.
First, it must have the required tensile strength and
stiffness to resist the mechanical stresses applied during
filling and throughout the life of the units, and must not
continue to deform so that the geotextile tube changes
shape over time. Second, it must have the required
hydraulic properties to retain the sand fill and prevent
erosion under a variety of hydraulic conditions. Third, it
must have the required durability to remain intact over the
design life of the units.
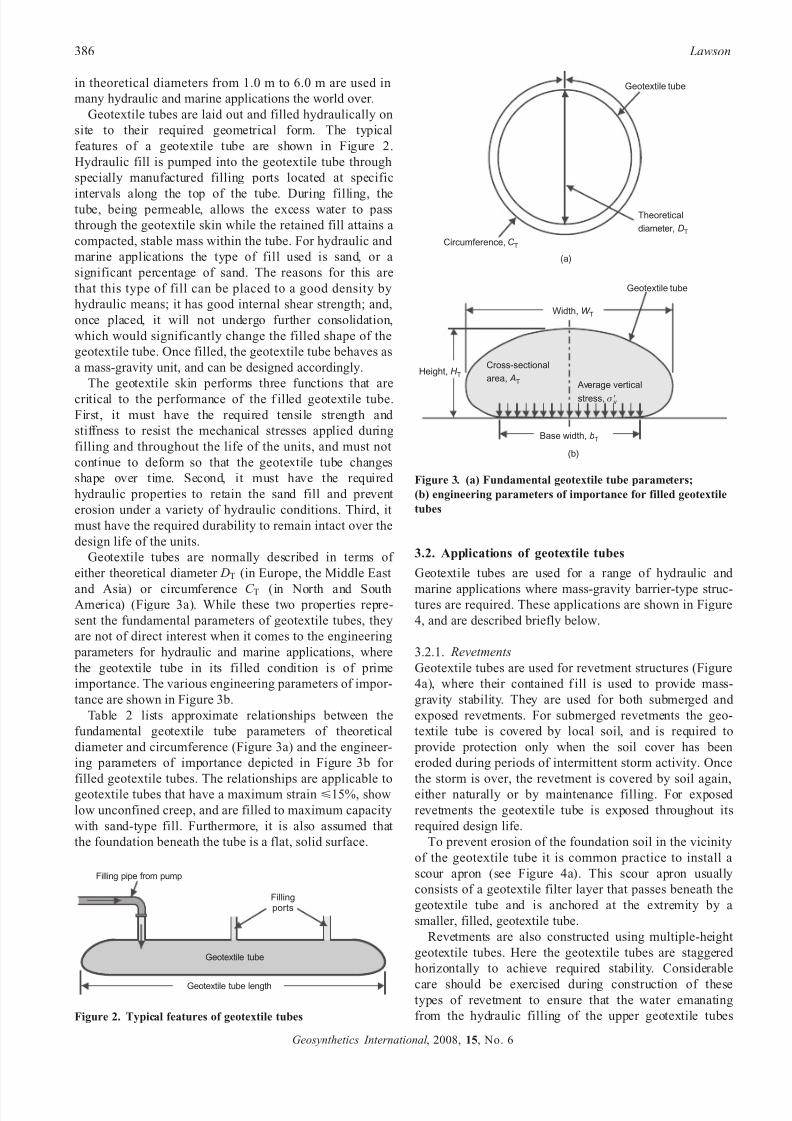
Geotextile tubes are normally described in terms of
either theoretical diameter DT (in Europe, the Middle East
and Asia) or circumference C T (in North and SouthAmerica) (Figure 3a). While these two properties repre-
sent the fundamental parameters of geotextile tubes, they
are not of direct interest when it comes to the engineering
parameters for hydraulic and marine applications, where
the geotextile tube in its filled condition is of prime
importance. The various engineering parameters of impor-
tance are shown in Figure 3b.
Table 2 lists approximate relationships between the
fundamental geotextile tube parameters of theoretical
diameter and circumference (Figure 3a) and the engineer-
ing parameters of importance depicted in Figure 3b for
filled geotextile tubes. The relationships are applicable to
geotextile tubes that have a maximum strain <15%, show
low unconfined creep, and are filled to maximum capacity
with sand-type fill. Furthermore, it is also assumed that
the foundation beneath the tube is a flat, solid surface.
3.2. Applications of geotextile tubes
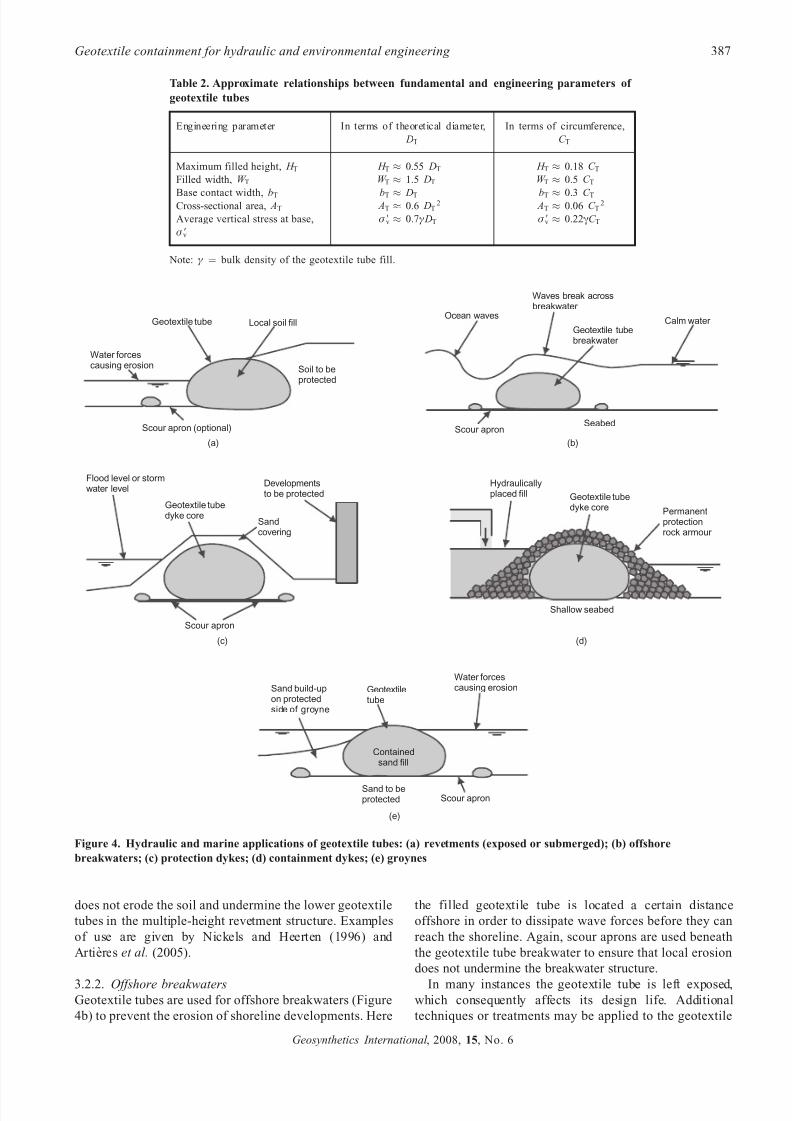
Geotextile tubes are used for a range of hydraulic and
marine applications where mass-gravity barrier-type struc-tures are required. These applications are shown in Figure
4, and are described briefly below.
3.2.1. Revetments
Geotextile tubes are used for revetment structures (Figure
4a), where their contained f ill is used to provide mass-
gravity stability. They are used for both submerged and
exposed revetments. For submerged revetments the geo-
textile tube is covered by local soil, and is required to
provide protection only when the soil cover has been
eroded during periods of intermittent storm activity. Once
the storm is over, the revetment is covered by soil again,
either naturally or by maintenance filling. For exposed
revetments the geotextile tube is exposed throughout its
required design life.
To prevent erosion of the foundation soil in the vicinity
of the geotextile tube it is common practice to install a
scour apron (see Figure 4a). This scour apron usually
consists of a geotextile filter layer that passes beneath the
geotextile tube and is anchored at the extremity by a
smaller, filled, geotextile tube.
Revetments are also constructed using multiple-height
geotextile tubes. Here the geotextile tubes are staggered
horizontally to achieve required stability. Considerable
care should be exercised during construction of thesetypes of revetment to ensure that the water emanating
from the hydraulic filling of the upper geotextile tubes
Geotextile tube length
Filling pipe from pump
Geotextile tube
Fillingports
Figure 2. Typical features of geotextile tubes
Width, W T
Height, H T
Cross-sectional
area, AT
Base width, bT
Average vertical
stress, σ Јv
Geotextile tube
Geotextile tube
Circumference, C T
Theoretical
diameter, DT
(a)
(b)
Figure 3. (a) Fundamental geotextile tube parameters;
(b) engineering parameters of importance for filled geotextile
tubes
386 Lawson
Geosynthetics International , 2008, 15, No. 6
7/22/2019 Part 9 Reference Paper
http://slidepdf.com/reader/full/part-9-reference-paper 4/44
does not erode the soil and undermine the lower geotextile
tubes in the multiple-height revetment structure. Examples
of use are given by Nickels and Heerten (1996) and
Artieres et al. (2005).
3.2.2. Offshore breakwatersGeotextile tubes are used for offshore breakwaters (Figure
4b) to prevent the erosion of shoreline developments. Here
the filled geotextile tube is located a certain distance
offshore in order to dissipate wave forces before they can
reach the shoreline. Again, scour aprons are used beneath
the geotextile tube breakwater to ensure that local erosion
does not undermine the breakwater structure.
In many instances the geotextile tube is left exposed,which consequently affects its design life. Additional
techniques or treatments may be applied to the geotextile
Table 2. Approximate relationships between fundamental and engineering parameters of
geotextile tubes
Engineering parameter In terms of theoretical diameter,
DT
In terms of circumference,
C T
Maximum filled height, H T H T % 0.55 DT H T % 0.18 C TFilled width, W T W T % 1.5 DT W T % 0.5 C T
Base contact width, bT bT % DT bT % 0.3 C TCross-sectional area, AT AT % 0.6 DT
2 AT % 0.06 C T2
Average vertical stress at base,
ó 9v
ó 9v % 0.7ª DT ó 9v % 0.22ªC T
Note: ª ¼ bulk density of the geotextile tube fill.
Soil to beprotected
Water forcescausing erosion
Geotextile tube Local soil fill
Scour apron (optional)
Ocean waves
Waves break acrossbreakwater
Seabed
Calm water Geotextile tubebreakwater
Scour apron
Shallow seabed
Geotextile tubedyke core Permanent
protectionrock armour
Hydraulicallyplaced fill
Water forcescausing erosion
Sand to beprotected
Geotextiletube
Sand build-upon protectedside of groyne
Containedsand fill
Scour apron
Flood level or stormwater level
Developmentsto be protected
Geotextile tubedyke core
Sandcovering
Scour apron
(a)
(c)
(b)
(d)
(e)
Figure 4. Hydraulic and marine applications of geotextile tubes: (a) revetments (exposed or submerged); (b) offshore
breakwaters; (c) protection dykes; (d) containment dykes; (e) groynes
Geotextile containment for hydraulic and environmental engineering 387
Geosynthetics International , 2008, 15, No. 6
7/22/2019 Part 9 Reference Paper
http://slidepdf.com/reader/full/part-9-reference-paper 5/44
tube breakwater to increase its exposed design life. These
are discussed in more detail in Section 3.8. Examples of
use are given by Townsend (2005), Oh and Shin (2006),
Alvarez et al. (2007) and Shin and Oh (2007).
3.2.3. Protection dykes
Geotextile tubes are used for protection dykes (Figure 4c),
where they prevent flood and storm damage to valuablestructures and real estate. Protection dykes also may be
used for river, lake or stream training works.
Where geotextile tube protection dykes are constructed
it is common to cover the geotextile tube with local soil.
The geotextile tube is required to function only intermit-
tently during storm or flood periods when the soil cover is
eroded. The use of the soil cover provides several
advantages to the geotextile tube core. First, it hides the
geotextile tube core, thereby providing an aesthetic envir-
onment and ensuring no damage due to vandalism.
Second, it protects the geotextile tube from long-term
exposure to direct sunlight (UV degradation).
Where geotextile tubes are used for river, lake or stream
training works it is common to leave the tube exposed
except for major structures, where rock armour layers may
be placed over it to dissipate hydraulic forces. Where the
tubes are left exposed, a geotextile shroud may be used
across the top of the tube, or a coating applied, to enhance
its longevity in an exposed environment. Examples of use
are given by Austin (1995), Fowler (1997) and Ghazali et
al. (2006).
3.2.4. Containment dykes
Geotextile tubes are used for the cores of containment
dykes (Figure 4d) where water depths are relativelyshallow. Here, the tube structure contains a filled reclama-
tion area, the reclamation fill being dry-dumped or placed
hydraulically. The advantage of this approach is that the
same hydraulic fill used in the reclamation can also be
used inside the geotextile tubes for the containment dykes,
thus avoiding the need to import rock fill for the dykes.
Containment dykes constructed from geotextile tubes
provide an economic alternative to other forms of con-
struction, such as sheet-piled walls, especially where the
foundation soil is soft. Where water forces dictate, and where longevity is required, rock armouring can be placed
around the geotextile tube core (Figure 4d). Examples of
use are given by de Bruin and Loos (1995), Spelt (2001),
Fowler et al. (2002b), Yee (2002), Yee et al. (2007), Shin
et al. (2008) and Yee and Choi (2008).
3.2.5. Groynes
Geotextile tubes can be used as groynes (Figure 4e) to
prevent the littoral movement of sediment. In most cases
the geotextile tubes are left exposed, but coatings or a
rock covering may be applied, depending on the circum-
stances and the required life expectancy. Examples of use
are given by Jackson (1987) and Fowler et al. (2002b).
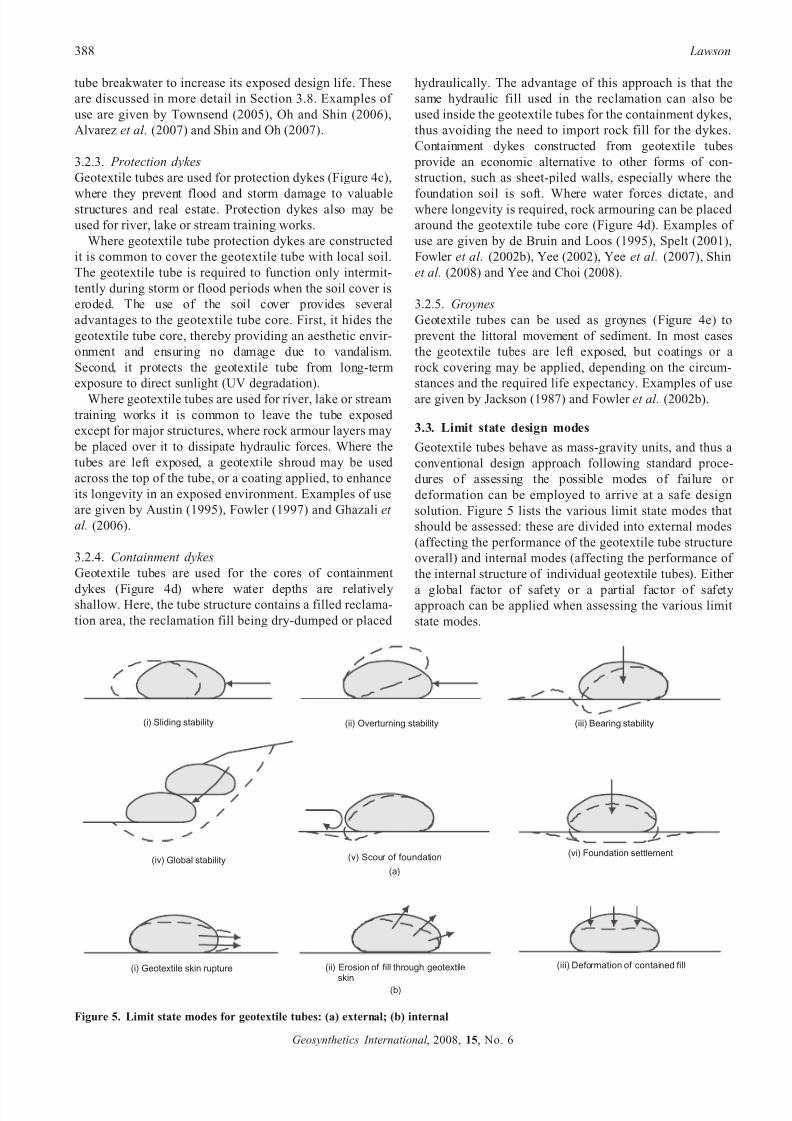
3.3. Limit state design modes
Geotextile tubes behave as mass-gravity units, and thus a
conventional design approach following standard proce-
dures of assessing the possible modes of failure or
deformation can be employed to arrive at a safe design
solution. Figure 5 lists the various limit state modes that
should be assessed: these are divided into external modes
(affecting the performance of the geotextile tube structure
overall) and internal modes (affecting the performance of
the internal structure of individual geotextile tubes). Either
a global factor of safety or a partial factor of safetyapproach can be applied when assessing the various limit
state modes.
(iii) Bearing stability(i) Sliding stability (ii) Overturning stability
(iv) Global stability (v) Scour of foundation (vi) Foundation settlement
(i) Geotextile skin rupture (ii) Erosion of fill through geotextile
skin
(iii) Deformation of contained fill
(a)
(b)
Figure 5. Limit state modes for geotextile tubes: (a) external; (b) internal
388 Lawson
Geosynthetics International , 2008, 15, No. 6
7/22/2019 Part 9 Reference Paper
http://slidepdf.com/reader/full/part-9-reference-paper 6/44
3.3.1. External modes
There are six external limit state modes to be assessed
(Figure 5a): sliding resistance, overturning resistance,
bearing resistance, global stability, scour resistance and
foundation settlement.
Geotextile tubes are very stable units, with high base
contact width to height ratios: for example, from Table 2,
bT/ H T % 1.5. Geotextile tubes should be checked for sliding and overturning stability, especially if they are of
small theoretical diameter, i.e. DT < 2 m. Relationships to
assess the stability of geotextile tubes under a variety of
hydraulic conditions are given by Pilarczyk (2000) and
CUR (2006).
Bearing stability, Figure 5a(iii), may be of importance
if the foundation is very soft and the geotextile tube is
large. However, experience has shown that the distribution
of weight of geotextile tubes on soft foundation soils is
very efficient.
Global stability needs to be taken into account only
when multiple geotextile tubes are used (Figure 5a(iv)).
Here, the stability analysis should take into account
changes in both the external water level and the ground-
water level within the geotextile tube structure. Also,
potential weak planes between adjacent geotextile tubes
should be assessed (e.g. Krahn et al. 2007).
Scour of the foundation around the edges of geotextile
tubes (Figure 5a(v)) can lead to undermining, and the
geotextile tube overturning. Scour may occur either during
the filling process or during the life of the tube. During
filling, a large amount of water is expelled through the
geotextile skin, and this can cause erosion and under-
mining of the geotextile tube if measures are not taken to
prevent this. To prevent scouring of the foundation duringfilling it is common practice to first install a geotextile or
geomembrane layer beneath the geotextile tube prior to
tube placement and filling. This procedure is very im-
portant where multiple-height geotextile tubes are in-
stalled, in order to prevent the filling water of the upper
tubes causing erosion and instability of the lower tubes in
the structure.
Where there is potential for foundation scour during the
life of the geotextile tube structure it is common practice
to install a scour apron during construction (see Figure 4).
The scour apron consists of a geotextile filter anchored at
the extremities by means of a small-diameter geotextile
tube manufactured as an integral part of the geotextile
filter base.
Where geotextile tubes are constructed on compressi-
ble foundations, and where they are required to meet
specific height requirements for hydraulic structures
(e.g. breakwaters), an assessment of the effect of
foundation settlement should be performed (Figure
5a(vi)).
3.3.2. Internal modes
There are three internal stability modes to be assessed
(Figure 5b): geotextile skin rupture resistance, geotextile
skin hydraulic resistance, and deformation of the con-tained fill. These are discussed in detail in Sections 3.4,
3.5 and 3.6.
3.4. Required tensile properties of geotextile tubes
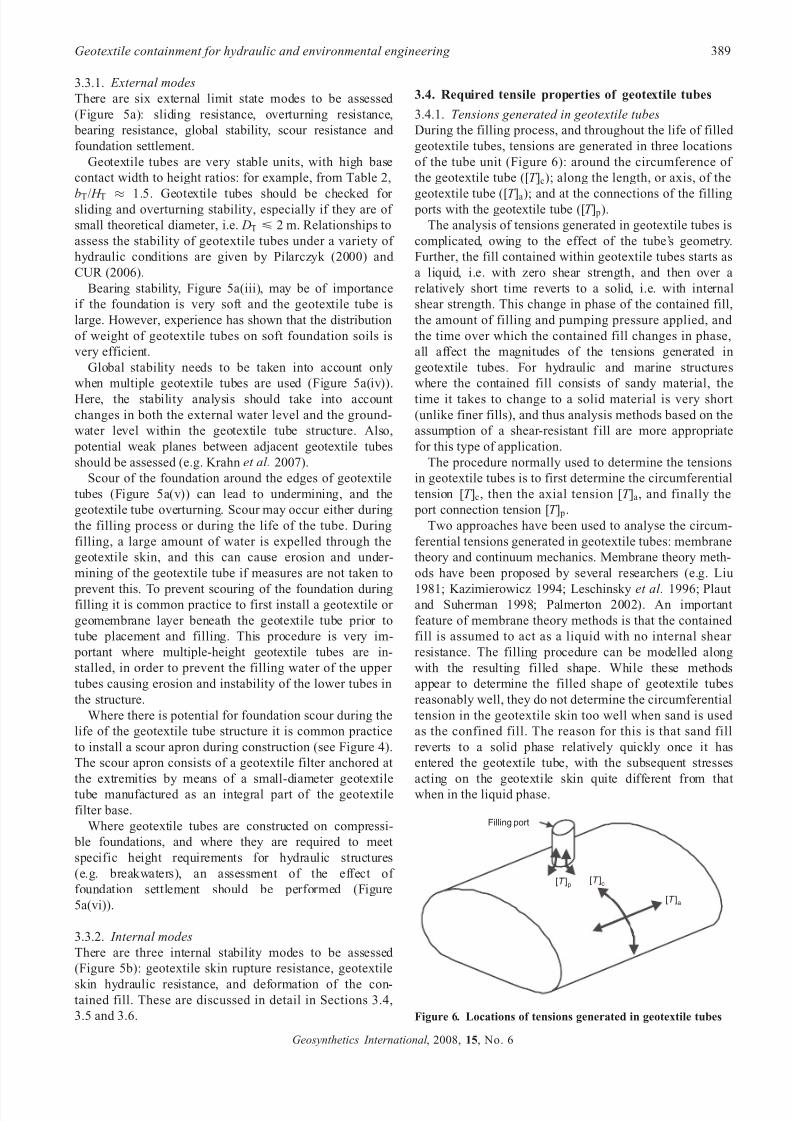
3.4.1. Tensions generated in geotextile tubes
During the filling process, and throughout the life of filled
geotextile tubes, tensions are generated in three locations
of the tube unit (Figure 6): around the circumference of
the geotextile tube ([T ]c); along the length, or axis, of the
geotextile tube ([T ]a); and at the connections of the filling ports with the geotextile tube ([T ] p).
The analysis of tensions generated in geotextile tubes is
complicated, owing to the effect of the tube’s geometry.
Further, the fill contained within geotextile tubes starts as
a liquid, i.e. with zero shear strength, and then over a
relatively short time reverts to a solid, i.e. with internal
shear strength. This change in phase of the contained fill,
the amount of filling and pumping pressure applied, and
the time over which the contained fill changes in phase,
all affect the magnitudes of the tensions generated in
geotextile tubes. For hydraulic and marine structures
where the contained fill consists of sandy material, the
time it takes to change to a solid material is very short
(unlike finer fills), and thus analysis methods based on the
assumption of a shear-resistant f ill are more appropriate
for this type of application.
The procedure normally used to determine the tensions
in geotextile tubes is to first determine the circumferential
tension [T ]c, then the axial tension [T ]a, and finally the
port connection tension [T ] p.
Two approaches have been used to analyse the circum-
ferential tensions generated in geotextile tubes: membrane
theory and continuum mechanics. Membrane theory meth-
ods have been proposed by several researchers (e.g. Liu
1981; Kazimierowicz 1994; Leschinsky et al. 1996; Plautand Suherman 1998; Palmerton 2002). An important
feature of membrane theory methods is that the contained
fill is assumed to act as a liquid with no internal shear
resistance. The filling procedure can be modelled along
with the resulting filled shape. While these methods
appear to determine the filled shape of geotextile tubes
reasonably well, they do not determine the circumferential
tension in the geotextile skin too well when sand is used
as the confined fill. The reason for this is that sand fill
reverts to a solid phase relatively quickly once it has
entered the geotextile tube, with the subsequent stresses
acting on the geotextile skin quite different from that
when in the liquid phase.
[ ]T c
[ ]T a
Filling port
[ ]T p
Figure 6. Locations of tensions generated in geotextile tubes
Geotextile containment for hydraulic and environmental engineering 389
Geosynthetics International , 2008, 15, No. 6
7/22/2019 Part 9 Reference Paper
http://slidepdf.com/reader/full/part-9-reference-paper 7/44
Continuum mechanics have also been used to model
geotextile tube behaviour (e.g. Seay 1998; Cantre 2002).
While this approach can model the tension distribution
around the circumference of a geotextile tube containing a
shear-resistant fill, it is virtually impossible to model the
filling process. As the filling process has a major effect
on the final filled shape of the geotextile tube, it also has
a major effect on the geotextile skin tensions. Wherecontinuum methods have proved very useful is in the
modelling of deformations of geotextile tube structures on
soft foundations, as they can account for the complex
vertical stress distribution at the base of a filled geotextile
tube reasonably well.
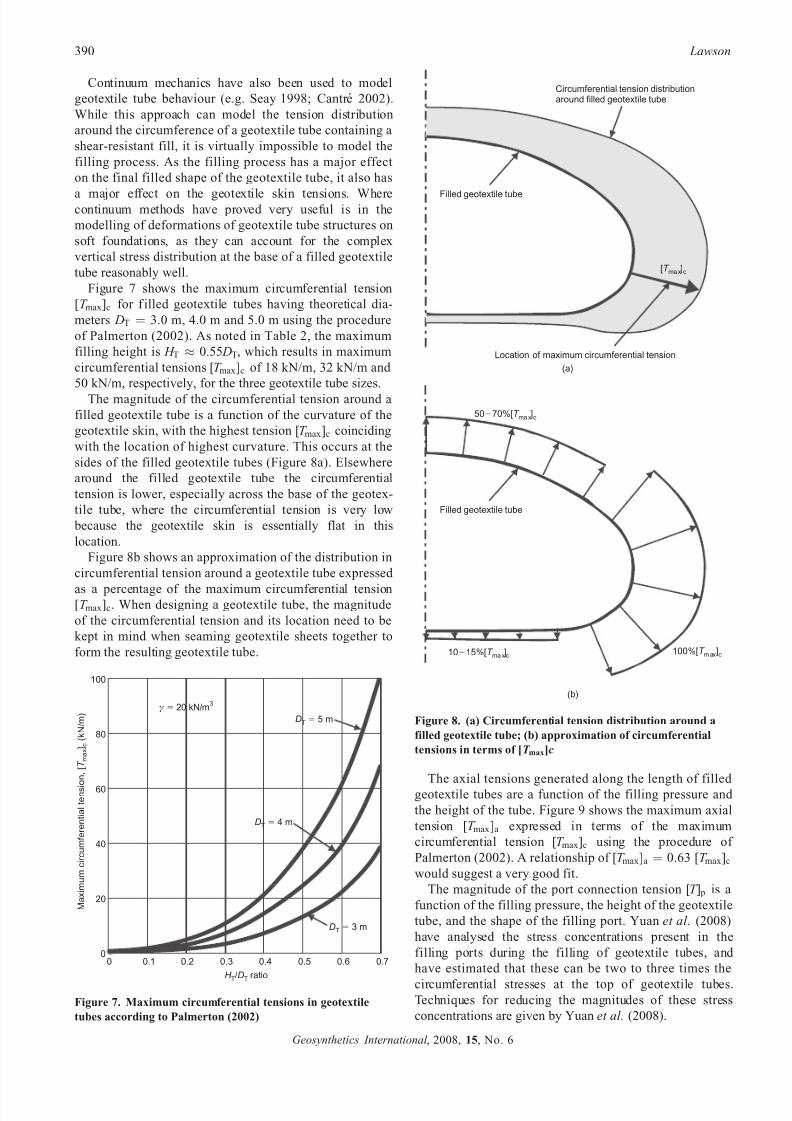
Figure 7 shows the maximum circumferential tension
[T max]c for f illed geotextile tubes having theoretical dia-
meters DT ¼ 3.0 m, 4.0 m and 5.0 m using the procedure
of Palmerton (2002). As noted in Table 2, the maximum
filling height is H T % 0.55 DT, which results in maximum
circumferential tensions [T max]c of 18 kN/m, 32 kN/m and
50 kN/m, respectively, for the three geotextile tube sizes.
The magnitude of the circumferential tension around a
filled geotextile tube is a function of the curvature of the
geotextile skin, with the highest tension [T max]c coinciding
with the location of highest curvature. This occurs at the
sides of the filled geotextile tubes (Figure 8a). Elsewhere
around the filled geotextile tube the circumferential
tension is lower, especially across the base of the geotex-
tile tube, where the circumferential tension is very low
because the geotextile skin is essentially flat in this
location.
Figure 8b shows an approximation of the distribution in
circumferential tension around a geotextile tube expressed
as a percentage of the maximum circumferential tension[T max]c. When designing a geotextile tube, the magnitude
of the circumferential tension and its location need to be
kept in mind when seaming geotextile sheets together to
form the resulting geotextile tube.
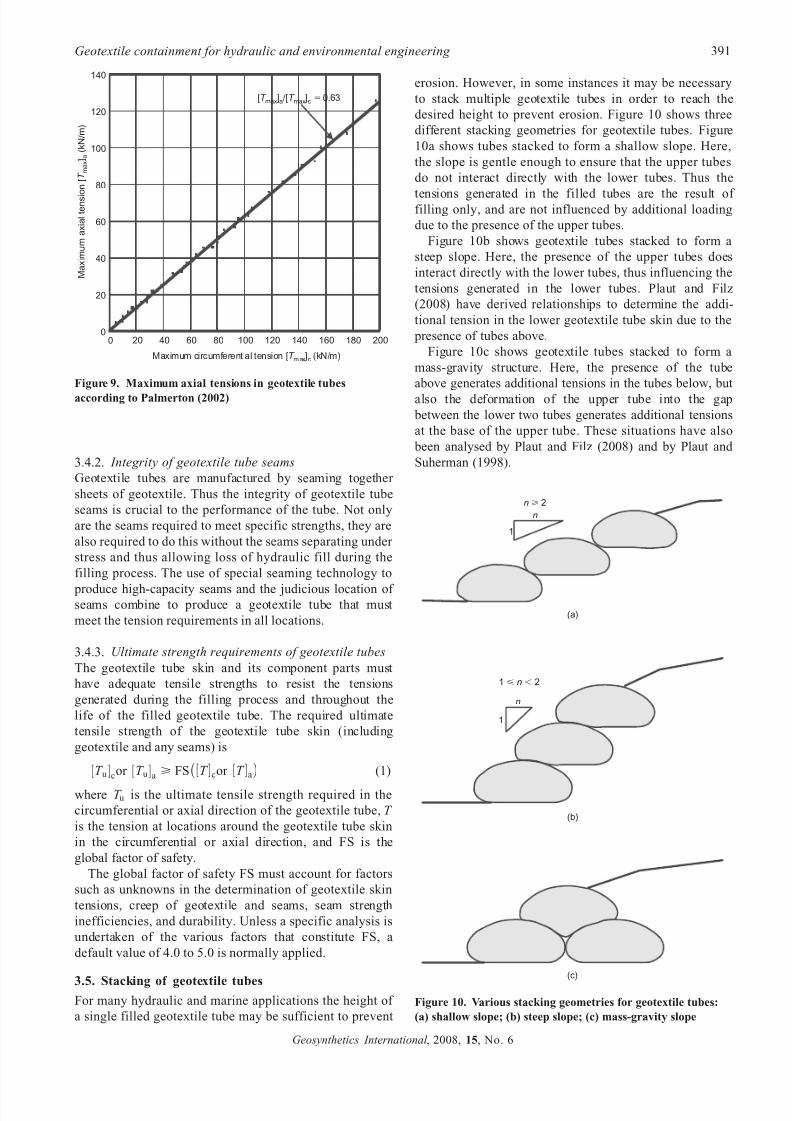
The axial tensions generated along the length of filled
geotextile tubes are a function of the filling pressure and
the height of the tube. Figure 9 shows the maximum axial
tension [T max]a expressed in terms of the maximum
circumferential tension [T max]c using the procedure of
Palmerton (2002). A relationship of [T max]a ¼ 0.63 [T max]c
would suggest a very good fit.
The magnitude of the port connection tension [T ] p is a
function of the filling pressure, the height of the geotextile
tube, and the shape of the filling port. Yuan et al. (2008)
have analysed the stress concentrations present in the
filling ports during the filling of geotextile tubes, and
have estimated that these can be two to three times the
circumferential stresses at the top of geotextile tubes.Techniques for reducing the magnitudes of these stress
concentrations are given by Yuan et al. (2008).
0.60.50.40.30.2
100
80
60
40
20
0
Maximum
circumferentialtensio
n,[
](kN/m)
Tm
a x c
0
H DT T/ ratio
0.1 0.7
DT 3 mϭ
DT 4 mϭ
DT 5 mϭ
γ 20 kN/mϭ3
Figure 7. Maximum circumferential tensions in geotextile
tubes according to Palmerton (2002)
Circumferential tension distributionaround filled geotextile tube
Location of maximum circumferential tension
Filled geotextile tube
[ ]T max c
10 15%[ ]Ϫ T maxc100%[ ]T m ax c
50 70%[ ]Ϫ T max c
Filled geotextile tube
(a)
(b)
Figure 8. (a) Circumferential tension distribution around a
filled geotextile tube; (b) approximation of circumferential
tensions in terms of [T max]c
390 Lawson
Geosynthetics International , 2008, 15, No. 6
7/22/2019 Part 9 Reference Paper
http://slidepdf.com/reader/full/part-9-reference-paper 8/44
7/22/2019 Part 9 Reference Paper
http://slidepdf.com/reader/full/part-9-reference-paper 9/44
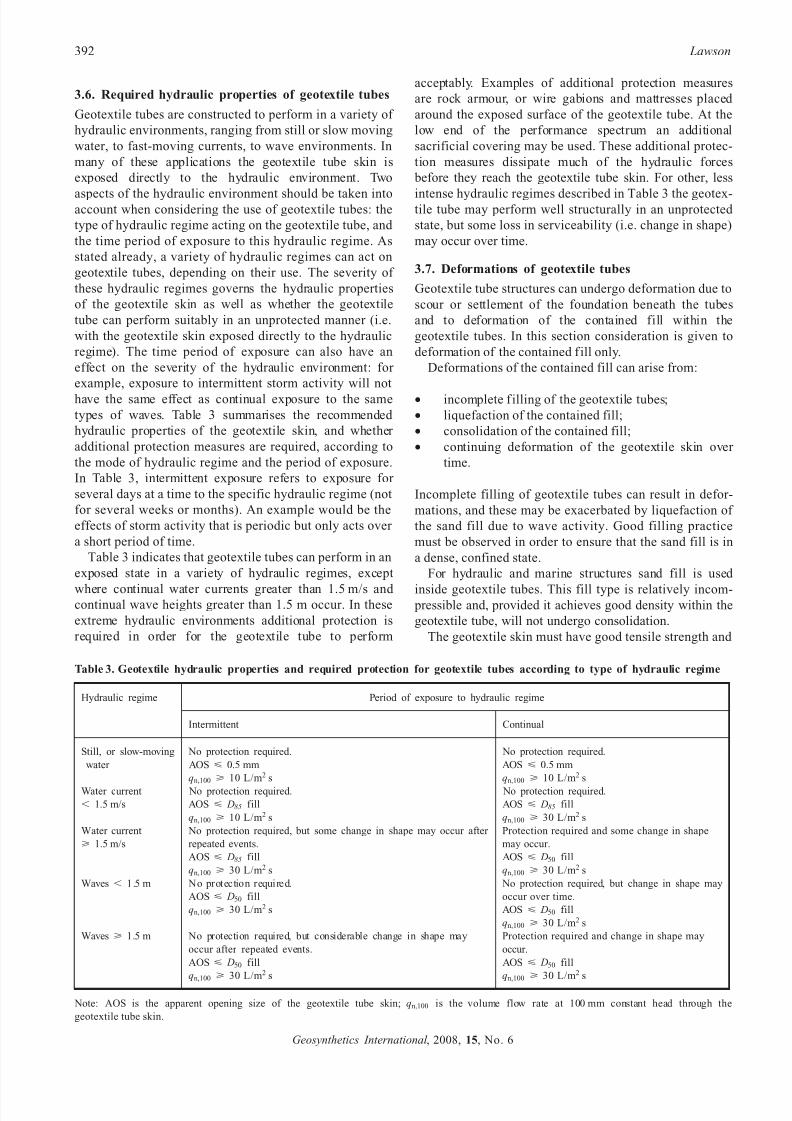
3.6. Required hydraulic properties of geotextile tubes
Geotextile tubes are constructed to perform in a variety of
hydraulic environments, ranging from still or slow moving
water, to fast-moving currents, to wave environments. In
many of these applications the geotextile tube skin is
exposed directly to the hydraulic environment. Two
aspects of the hydraulic environment should be taken intoaccount when considering the use of geotextile tubes: the
type of hydraulic regime acting on the geotextile tube, and
the time period of exposure to this hydraulic regime. As
stated already, a variety of hydraulic regimes can act on
geotextile tubes, depending on their use. The severity of
these hydraulic regimes governs the hydraulic properties
of the geotextile skin as well as whether the geotextile
tube can perform suitably in an unprotected manner (i.e.
with the geotextile skin exposed directly to the hydraulic
regime). The time period of exposure can also have an
effect on the severity of the hydraulic environment: for
example, exposure to intermittent storm activity will not
have the same effect as continual exposure to the same
types of waves. Table 3 summarises the recommended
hydraulic properties of the geotextile skin, and whether
additional protection measures are required, according to
the mode of hydraulic regime and the period of exposure.
In Table 3, intermittent exposure refers to exposure for
several days at a time to the specific hydraulic regime (not
for several weeks or months). An example would be the
effects of storm activity that is periodic but only acts over
a short period of time.
Table 3 indicates that geotextile tubes can perform in an
exposed state in a variety of hydraulic regimes, except
where continual water currents greater than 1.5 m/s and continual wave heights greater than 1.5 m occur. In these
extreme hydraulic environments additional protection is
required in order for the geotextile tube to perform
acceptably. Examples of additional protection measures
are rock armour, or wire gabions and mattresses placed
around the exposed surface of the geotextile tube. At the
low end of the performance spectrum an additional
sacrificial covering may be used. These additional protec-
tion measures dissipate much of the hydraulic forces
before they reach the geotextile tube skin. For other, less
intense hydraulic regimes described in Table 3 the geotex-tile tube may perform well structurally in an unprotected
state, but some loss in serviceability (i.e. change in shape)
may occur over time.
3.7. Deformations of geotextile tubes
Geotextile tube structures can undergo deformation due to
scour or settlement of the foundation beneath the tubes
and to deformation of the contained fill within the
geotextile tubes. In this section consideration is given to
deformation of the contained fill only.
Deformations of the contained fill can arise from:
• incomplete filling of the geotextile tubes;
• liquefaction of the contained fill;
• consolidation of the contained fill;
• continuing deformation of the geotextile skin over
time.
Incomplete filling of geotextile tubes can result in defor-
mations, and these may be exacerbated by liquefaction of
the sand fill due to wave activity. Good filling practice
must be observed in order to ensure that the sand fill is in
a dense, confined state.
For hydraulic and marine structures sand fill is used
inside geotextile tubes. This fill type is relatively incom- pressible and, provided it achieves good density within the
geotextile tube, will not undergo consolidation.
The geotextile skin must have good tensile strength and
Table 3. Geotextile hydraulic properties and required protection for geotextile tubes according to type of hydraulic regime
Hydraulic regime Period of exposure to hydraulic regime
Intermittent Continual
Still, or slow-moving No protection required. No protection required.
water AOS < 0.5 mm AOS < 0.5 mm
qn,100 > 10 L/m2 s qn,100 > 10 L/m2 s
Water current No protection required. No protection required.
, 1.5 m/s AOS < D85 fill AOS < D85 fill
qn,100 > 10 L/m2 s qn,100 > 30 L/m2 s
Water current
> 1.5 m/s
No protection required, but some change in shape may occur after
repeated events.
Protection required and some change in shape
may occur.
AOS < D85 fill AOS < D50 fill
qn,100 > 30 L/m2 s qn,100 > 30 L/m2 s
Waves , 1.5 m No protection required.
AOS < D50 fill
No protection required, but change in shape may
occur over time.
qn,100 > 30 L/m2 s AOS < D50 fill
qn,100 > 30 L/m2 s
Waves > 1.5 m No protection required, but considerable change in shape may
occur after repeated events.
Protection required and change in shape may
occur.
AOS < D50 fill AOS < D50 fill
qn,100 > 30 L/m2 s qn,100 > 30 L/m2 s
Note: AOS is the apparent opening size of the geotextile tube skin; qn,100 is the volume flow rate at 100 mm constant head through the
geotextile tube skin.
392 Lawson
Geosynthetics International , 2008, 15, No. 6
7/22/2019 Part 9 Reference Paper
http://slidepdf.com/reader/full/part-9-reference-paper 10/44
stiffness in order to maintain the sand fill in a confined
state. The geotextile skin should not undergo elongation
or relaxation over time, which would then allow the sand
fill to deform, and the geotextile tube to lose its shape and
height.
3.8. Protection measures applied to geotextile tubes
External protection measures are applied to geotextiletubes for a variety of reasons:
• to reduce the impact of the hydraulic forces acting
directly on the geotextile tube;
• to enhance the design life of the geotextile tube in an
exposed environment;
• to protect from extreme natural occurrences, e.g. ice
flows;
• to protect from vandalism.
Section 3.6 covers the types of protection measures used
to reduce the impact of hydraulic forces.
In many instances geotextile tubes are required to
perform over a relatively long design life in an exposed
environment. In this environment UV degradation can
occur, with the geotextile tube design life dependent on
the level of UV radiation and the resistance of the
geotextile tube skin to this radiation. If the geotextile tube
is located in a marine environment, marine growth
generally occurs quickly on the outer surface, and this
tends to mask the geotextile skin somewhat from the
effects of UV radiation. However, for good long-term
performance in an exposed environment, additional pro-
tection measures are normally required for the geotextile
tube skin. These measures are listed below in order of providing longer-term performance.
• Additional stabiliser packages in the geotextile tube
skin: the enhanced performance of the stabiliser
package improves the performance of the geotextile
tube skin over time.
• More robust, or multi-layer geotextile skin: extra
design life is achieved by the use of more robust or
multi-layer geotextile skins that degrade over a
longer period of time.
• Geotextile shrouds: the outer geotextile shroud
provides protection for the inner geotextile tube skin.The geotextile shroud becomes sacrificial over the
design life of the geotextile tube structure. These are
used where the geotextile tube structure is continu-
ally exposed to the environment, and where the
hydraulic forces are not severe.
• Geotextile coating: a robust coating is applied to the
geotextile tube to protect it. Coatings can be applied
in a variety of colours.
• Soil covering: the geotextile tube is covered by soil
or sand to prevent long-term UV exposure. Here the
geotextile tube structure performs intermittently
during periods of storm activity, and is then covered
over again by soil or sand.• Armour covering: a flexible armour covering is used
around the geotextile tube structure to prevent long-
term exposure to UV light. This is normally used in
hydraulic and marine applications where severe
hydraulic forces occur.
Extreme natural occurrences can also affect the long-
term performance of exposed geotextile tubes. Examples
include the damaging effects of ice flows, and trees
carried in water during floods, on the exposed surface of geotextile tubes. Where this is known to be a problem,
then the geotextile tube structure must be protected. The
form of protection from this type of exposure is normally
armour covering.
Vandalism can also affect the long-term performance of
geotextile tubes. This type of damage is normally in the
form of localised cuts and tears. The best way of protect-
ing against this likelihood is to cover the geotextile tube
so that it is out of sight. Alternatively, robust coatings can
be applied that prevent vandalism. Failing this, a good
maintenance scheme should be put in place to correct any
acts of vandalism.
3.9. Case study 1: Geotextile tubes for containment
dykes at Naviduct Project, Enkhuizen, The
Netherlands
This project, originally reported by Spelt (2001) and
Lawson (2003), is an example where geotextile tubes were
used for containment dykes in an environmentally sensi-
tive lake in The Netherlands.
The Krabbersgat Lock at Enkhuizen is an important
bottleneck in the main network of waterways in The
Netherlands. Owing to an increase in shipping and road
traffic at the lock, significant time delays were occurring
for both shipping and road transport. To ensure smoothmovement of shipping and road traffic it was decided to
construct a combination of an aqueduct and a lock below
which a tunnel for road traffic could pass (this structure is
known as a ‘naviduct’).
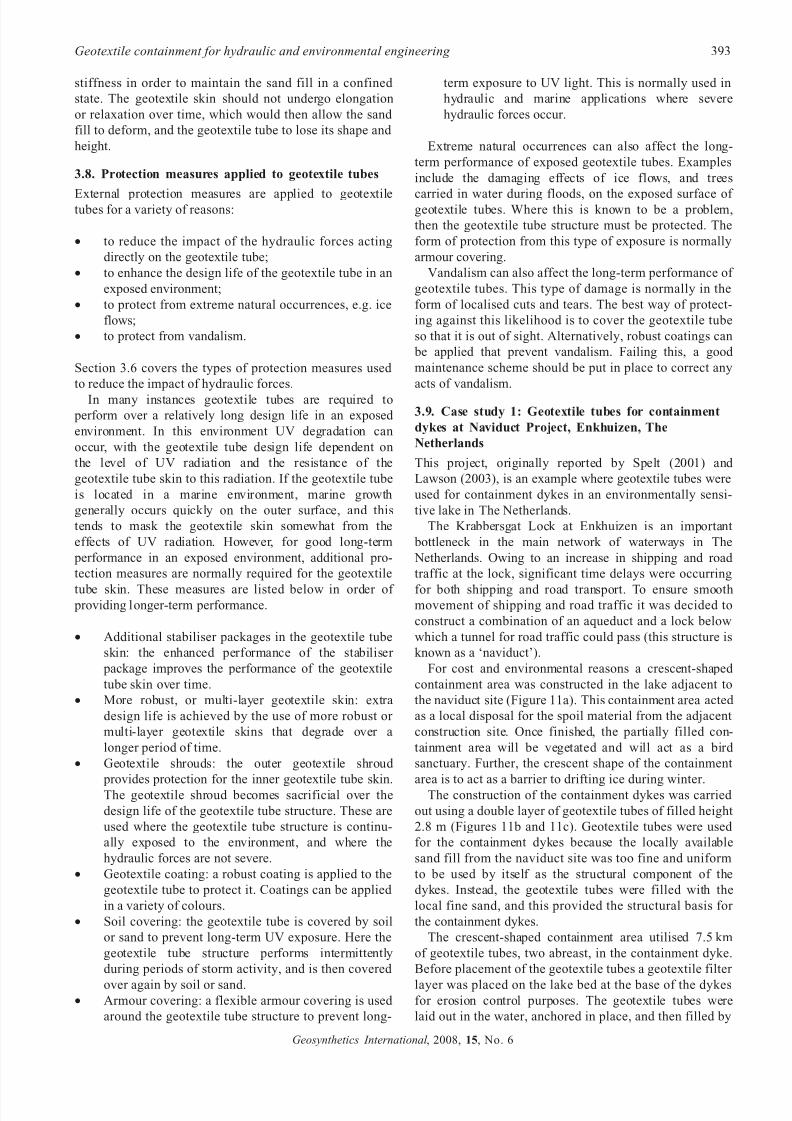
For cost and environmental reasons a crescent-shaped
containment area was constructed in the lake adjacent to
the naviduct site (Figure 11a). This containment area acted
as a local disposal for the spoil material from the adjacent
construction site. Once finished, the partially filled con-
tainment area will be vegetated and will act as a bird
sanctuary. Further, the crescent shape of the containment
area is to act as a barrier to drifting ice during winter.The construction of the containment dykes was carried
out using a double layer of geotextile tubes of filled height
2.8 m (Figures 11b and 11c). Geotextile tubes were used
for the containment dykes because the locally available
sand fill from the naviduct site was too fine and uniform
to be used by itself as the structural component of the
dykes. Instead, the geotextile tubes were filled with the
local fine sand, and this provided the structural basis for
the containment dykes.
The crescent-shaped containment area utilised 7.5 km
of geotextile tubes, two abreast, in the containment dyke.
Before placement of the geotextile tubes a geotextile filter
layer was placed on the lake bed at the base of the dykesfor erosion control purposes. The geotextile tubes were
laid out in the water, anchored in place, and then filled by
Geotextile containment for hydraulic and environmental engineering 393
Geosynthetics International , 2008, 15, No. 6
7/22/2019 Part 9 Reference Paper
http://slidepdf.com/reader/full/part-9-reference-paper 11/44
connecting the exit pipe of the dredger directly into the
inlets of the tubes.
Once filled, the geotextile tubes were covered with a
geotextile shroud to protect the tubes from long-term UV
exposure. On the outside of the containment dyke the
tubes were covered with rock armour for the final protec-
tion. Finally, the reclaimed area was raised to its finished
height by using the local fine sand fill, and vegetated.
3.10. Case study 2: Geotextile tubes for artificial
island at Incheon Grand Bridge Project, KoreaThis case study has been previously reported upon in
detail by Yee et al. (2007). The Incheon Grand Bridge
Project consists of the construction of a freeway connect-
ing the island containing the new Incheon International
Airport to the mainland of Korea to the south-east. In the
area close to the mainland it was planned to construct an
artificial island in order to construct the freeway viaduct
and associated toll gate facilities in the dry. This artificial
island is to be left in place once the freeway viaduct is
completed, as the area will later be enveloped by a largeland reclamation scheme to build a new high-technology
city—Songdo City.
The foundation conditions where the artificial island is
located consist of very soft marine clay to an approximate
depth of 20 m. Further, in this area the tide range is very
high, with a maximum difference in level of 9.3 m. This
results in exposure of the soft clay foundation at low tide
and inundation to around +4.64 m at high tide. As a result
of these conditions it was decided to construct the contain-
ment dyke for the artificial island out of geotextile tubes,
as it was considered that the alternative of using sheet-pile
walls would not be feasible, considering the low shear
strength of the soft foundation and the height to which the
artificial island would have to be raised above high tide
level.
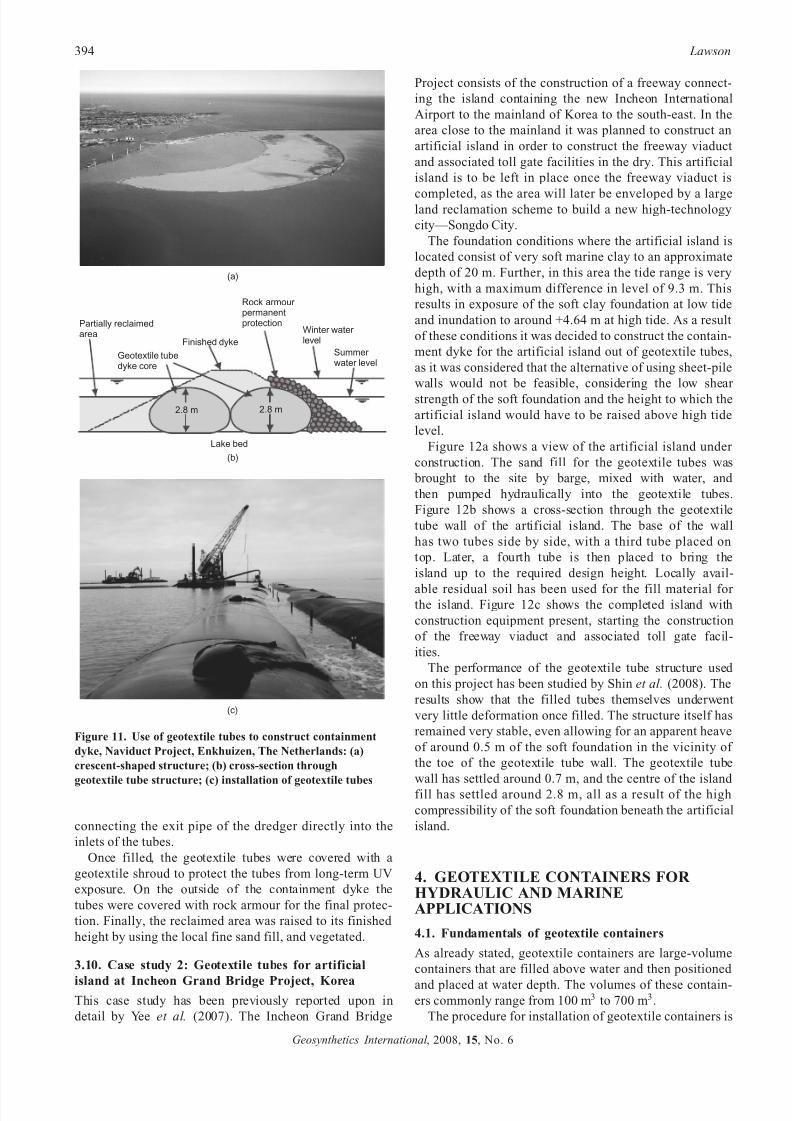
Figure 12a shows a view of the artificial island under
construction. The sand fill for the geotextile tubes was
brought to the site by barge, mixed with water, and
then pumped hydraulically into the geotextile tubes.
Figure 12b shows a cross-section through the geotextile
tube wall of the artificial island. The base of the wall
has two tubes side by side, with a third tube placed on
top. Later, a fourth tube is then placed to bring the
island up to the required design height. Locally avail-
able residual soil has been used for the fill material for the island. Figure 12c shows the completed island with
construction equipment present, starting the construction
of the freeway viaduct and associated toll gate facil-
ities.
The performance of the geotextile tube structure used
on this project has been studied by Shin et al. (2008). The
results show that the filled tubes themselves underwent
very little deformation once filled. The structure itself has
remained very stable, even allowing for an apparent heave
of around 0.5 m of the soft foundation in the vicinity of
the toe of the geotextile tube wall. The geotextile tube
wall has settled around 0.7 m, and the centre of the island
fill has settled around 2.8 m, all as a result of the high
compressibility of the soft foundation beneath the artificial
island.
4. GEOTEXTILE CONTAINERS FOR HYDRAULIC AND MARINEAPPLICATIONS
4.1. Fundamentals of geotextile containers
As already stated, geotextile containers are large-volume
containers that are filled above water and then positioned
and placed at water depth. The volumes of these contain-ers commonly range from 100 m3 to 700 m3.
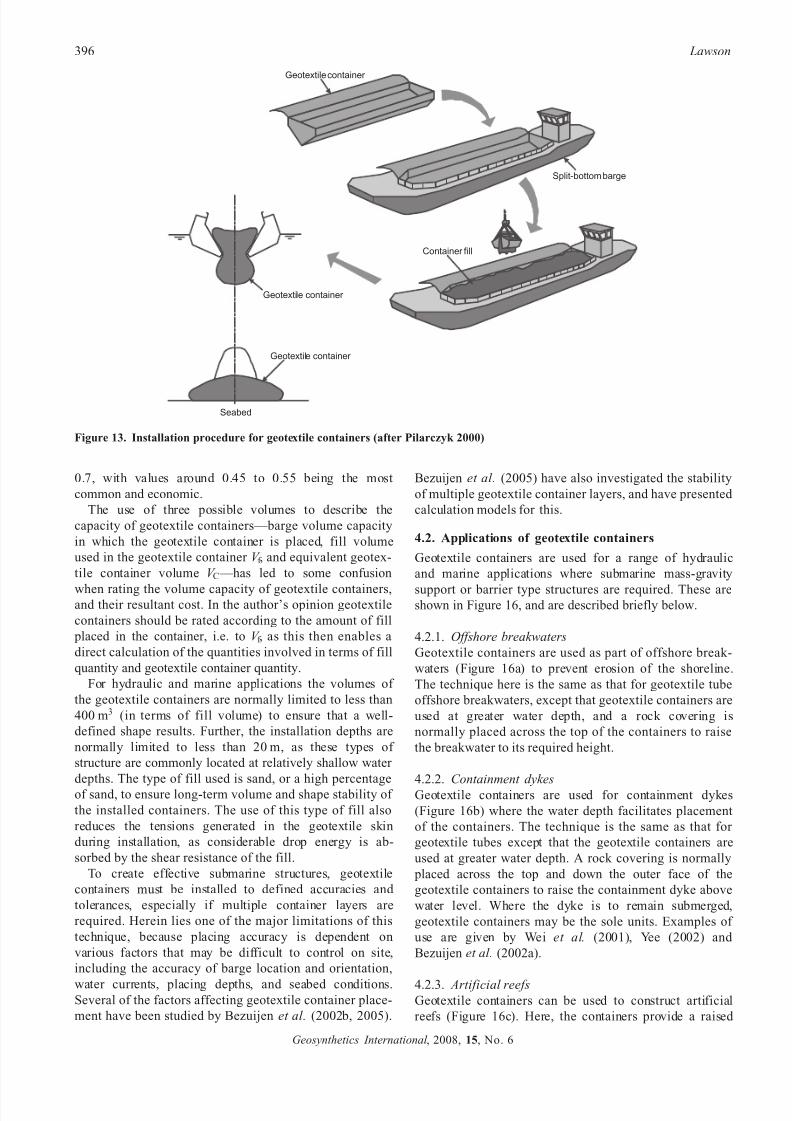
The procedure for installation of geotextile containers is
2.8 m
Geotextile tubedyke core
Rock armour permanentprotection
Finished dykeSummer water level
Winter water level
2.8 m
Lake bed
Partially reclaimedarea
(b)
(c)
(a)
Figure 11. Use of geotextile tubes to construct containment
dyke, Naviduct Project, Enkhuizen, The Netherlands: (a)
crescent-shaped structure; (b) cross-section through
geotextile tube structure; (c) installation of geotextile tubes
394 Lawson
Geosynthetics International , 2008, 15, No. 6
7/22/2019 Part 9 Reference Paper
http://slidepdf.com/reader/full/part-9-reference-paper 12/44
shown in Figure 13. It entails the placing and filling of the
geotextile container in a split-bottom barge; the container
is then sealed and the barge positioned at the correct
dumping location. The split-bottom barge opens, and the
geotextile container passes through and descends through
the water to the seabed. Depending on its source, the
container fill may be dry-dumped, wet-dumped or hydrau-
lically pumped into the container. The types of fill placed
in geotextile containers have ranged from mixed soil
(ranging from small boulders to sandy silt) to sand to
overconsolidated clay.
Geotextile containers are used as mass-gravity, structur-
al components in hydraulic and marine applications. Once
installed, the containers are required to maintain volumeand shape stability over the required design life of the
overall structure.
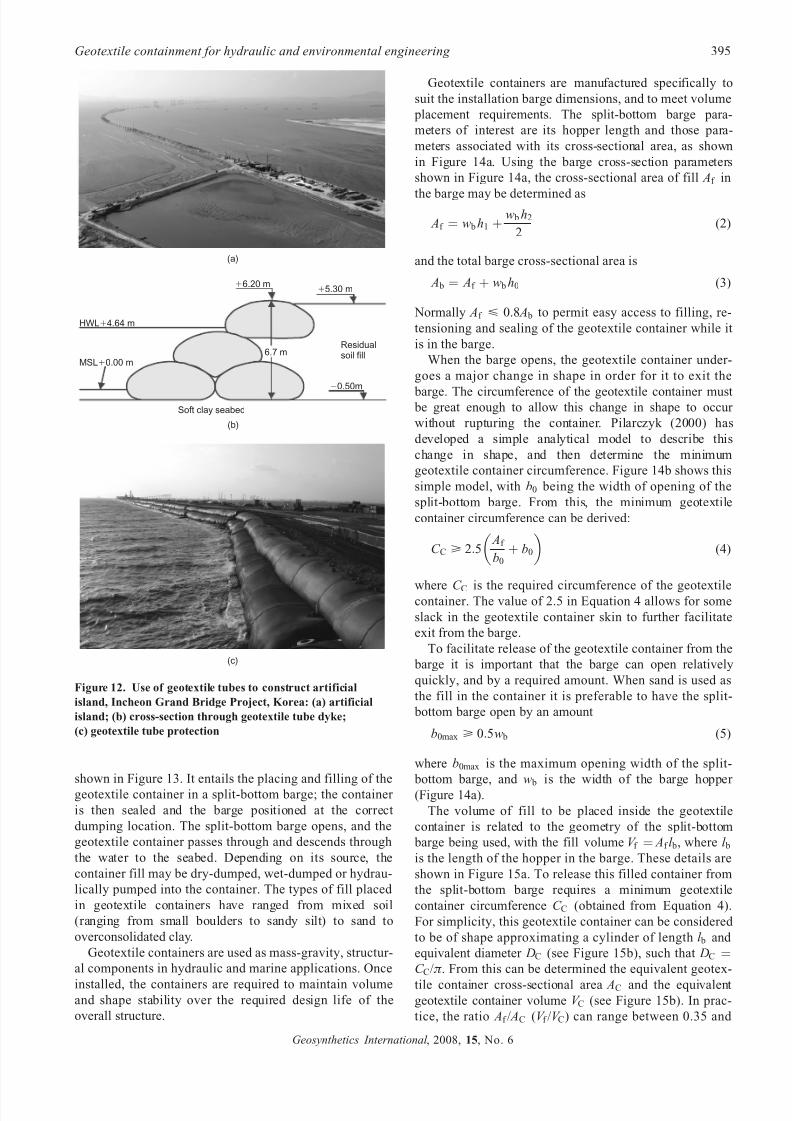
Geotextile containers are manufactured specifically to
suit the installation barge dimensions, and to meet volume
placement requirements. The split-bottom barge para-
meters of interest are its hopper length and those para-
meters associated with its cross-sectional area, as shown
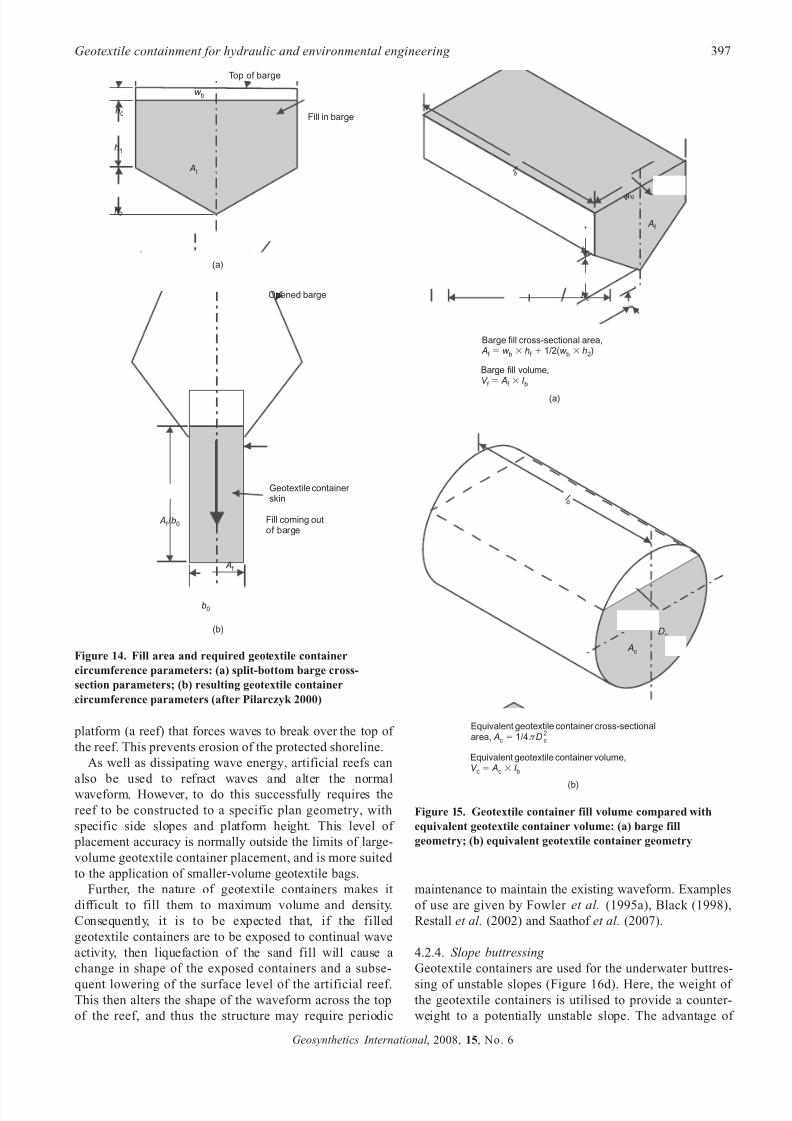
in Figure 14a. Using the barge cross-section parameters
shown in Figure 14a, the cross-sectional area of fill Af in
the barge may be determined as
Af ¼ w b h1 þw b h2
2(2)
and the total barge cross-sectional area is
A b ¼ Af þ w b h0 (3)
Normally Af < 0.8 A b to permit easy access to filling, re-
tensioning and sealing of the geotextile container while it
is in the barge.
When the barge opens, the geotextile container under-
goes a major change in shape in order for it to exit the
barge. The circumference of the geotextile container must be great enough to allow this change in shape to occur
without rupturing the container. Pilarczyk (2000) has
developed a simple analytical model to describe this
change in shape, and then determine the minimum
geotextile container circumference. Figure 14b shows this
simple model, with b0 being the width of opening of the
split-bottom barge. From this, the minimum geotextile
container circumference can be derived:
C C > 2:5Af
b0
þ b0
(4)
where C C is the required circumference of the geotextilecontainer. The value of 2.5 in Equation 4 allows for some
slack in the geotextile container skin to further facilitate
exit from the barge.
To facilitate release of the geotextile container from the
barge it is important that the barge can open relatively
quickly, and by a required amount. When sand is used as
the fill in the container it is preferable to have the split-
bottom barge open by an amount
b0max > 0:5w b (5)
where b0max is the maximum opening width of the split-
bottom barge, and w b is the width of the barge hopper (Figure 14a).
The volume of fill to be placed inside the geotextile
container is related to the geometry of the split-bottom
barge being used, with the fill volume V f ¼ Af l b, where l bis the length of the hopper in the barge. These details are
shown in Figure 15a. To release this filled container from
the split-bottom barge requires a minimum geotextile
container circumference C C (obtained from Equation 4).
For simplicity, this geotextile container can be considered
to be of shape approximating a cylinder of length l b and
equivalent diameter DC (see Figure 15b), such that DC ¼C C/ð . From this can be determined the equivalent geotex-
tile container cross-sectional area AC and the equivalentgeotextile container volume V C (see Figure 15b). In prac-
tice, the ratio Af / AC (V f /V C) can range between 0.35 and
Soft clay seabed
6.7 mMSL 0.00 mϩ
HWL 4.64 mϩ
ϩ6.20 mϩ5.30 m
Residualsoil fill
Ϫ0.50m
(c)
(a)
(b)
Figure 12. Use of geotextile tubes to construct artificial
island, Incheon Grand Bridge Project, Korea: (a) artificial
island; (b) cross-section through geotextile tube dyke;
(c) geotextile tube protection
Geotextile containment for hydraulic and environmental engineering 395
Geosynthetics International , 2008, 15, No. 6
7/22/2019 Part 9 Reference Paper
http://slidepdf.com/reader/full/part-9-reference-paper 13/44
0.7, with values around 0.45 to 0.55 being the most
common and economic.
The use of three possible volumes to describe the
capacity of geotextile containers—barge volume capacity
in which the geotextile container is placed, fill volume
used in the geotextile container V f , and equivalent geotex-
tile container volume V C —has led to some confusion
when rating the volume capacity of geotextile containers,and their resultant cost. In the author’s opinion geotextile
containers should be rated according to the amount of fill
placed in the container, i.e. to V f , as this then enables a
direct calculation of the quantities involved in terms of fill
quantity and geotextile container quantity.
For hydraulic and marine applications the volumes of
the geotextile containers are normally limited to less than
400 m3 (in terms of fill volume) to ensure that a well-
defined shape results. Further, the installation depths are
normally limited to less than 20 m, as these types of
structure are commonly located at relatively shallow water
depths. The type of fill used is sand, or a high percentage
of sand, to ensure long-term volume and shape stability of
the installed containers. The use of this type of fill also
reduces the tensions generated in the geotextile skin
during installation, as considerable drop energy is ab-
sorbed by the shear resistance of the fill.
To create effective submarine structures, geotextile
containers must be installed to defined accuracies and
tolerances, especially if multiple container layers are
required. Herein lies one of the major limitations of this
technique, because placing accuracy is dependent on
various factors that may be difficult to control on site,
including the accuracy of barge location and orientation,
water currents, placing depths, and seabed conditions.Several of the factors affecting geotextile container place-
ment have been studied by Bezuijen et al. (2002b, 2005).
Bezuijen et al. (2005) have also investigated the stability
of multiple geotextile container layers, and have presented
calculation models for this.
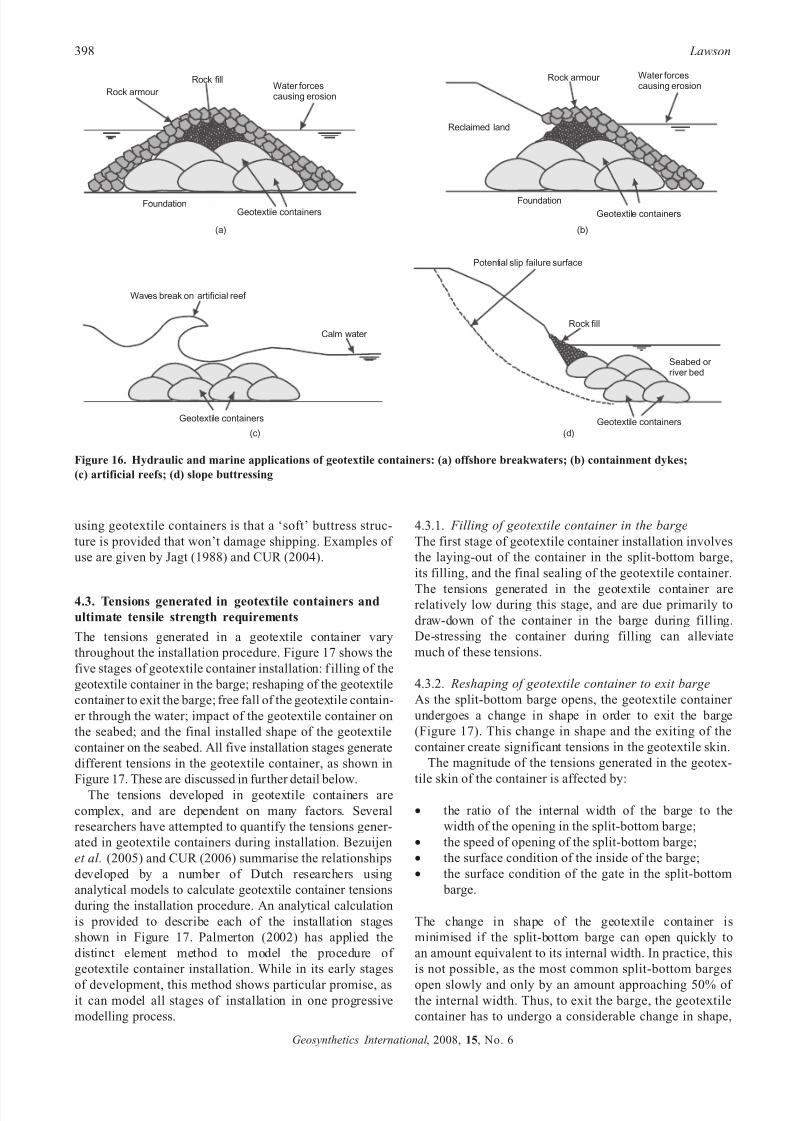
4.2. Applications of geotextile containers
Geotextile containers are used for a range of hydraulic
and marine applications where submarine mass-gravity
support or barrier type structures are required. These areshown in Figure 16, and are described briefly below.
4.2.1. Offshore breakwaters
Geotextile containers are used as part of offshore break-
waters (Figure 16a) to prevent erosion of the shoreline.
The technique here is the same as that for geotextile tube
offshore breakwaters, except that geotextile containers are
used at greater water depth, and a rock covering is
normally placed across the top of the containers to raise
the breakwater to its required height.
4.2.2. Containment dykesGeotextile containers are used for containment dykes
(Figure 16b) where the water depth facilitates placement
of the containers. The technique is the same as that for
geotextile tubes except that the geotextile containers are
used at greater water depth. A rock covering is normally
placed across the top and down the outer face of the
geotextile containers to raise the containment dyke above
water level. Where the dyke is to remain submerged,
geotextile containers may be the sole units. Examples of
use are given by Wei et al. (2001), Yee (2002) and
Bezuijen et al. (2002a).
4.2.3. Artificial reefsGeotextile containers can be used to construct artificial
reefs (Figure 16c). Here, the containers provide a raised
Geotextile container
Geotextile container
Seabed
Geotextile container
Split-bottom barge
Container fill
Figure 13. Installation procedure for geotextile containers (after Pilarczyk 2000)
396 Lawson
Geosynthetics International , 2008, 15, No. 6
7/22/2019 Part 9 Reference Paper
http://slidepdf.com/reader/full/part-9-reference-paper 14/44
platform (a reef) that forces waves to break over the top of
the reef. This prevents erosion of the protected shoreline.
As well as dissipating wave energy, artificial reefs can
also be used to refract waves and alter the normal
waveform. However, to do this successfully requires the
reef to be constructed to a specific plan geometry, with
specific side slopes and platform height. This level of
placement accuracy is normally outside the limits of large-
volume geotextile container placement, and is more suited
to the application of smaller-volume geotextile bags.
Further, the nature of geotextile containers makes it
difficult to fill them to maximum volume and density.
Consequently, it is to be expected that, if the filled
geotextile containers are to be exposed to continual wave
activity, then liquefaction of the sand fill will cause a
change in shape of the exposed containers and a subse-
quent lowering of the surface level of the artificial reef.This then alters the shape of the waveform across the top
of the reef, and thus the structure may require periodic
maintenance to maintain the existing waveform. Examples
of use are given by Fowler et al. (1995a), Black (1998),
Restall et al. (2002) and Saathof et al. (2007).
4.2.4. Slope buttressing
Geotextile containers are used for the underwater buttres-
sing of unstable slopes (Figure 16d). Here, the weight of the geotextile containers is utilised to provide a counter-
weight to a potentially unstable slope. The advantage of
b0
Af
Geotextile container skin
Fill coming outof barge
A bf 0/
Opened barge
h0
h1
h2
w b
At
Fill in barge
Top of barge
(a)
(b)
Figure 14. Fill area and required geotextile container
circumference parameters: (a) split-bottom barge cross-
section parameters; (b) resulting geotextile container
circumference parameters (after Pilarczyk 2000)
w b
h1
h2
l b
Af
Barge fill cross-sectional area,1/2( ) A w h w hf b f b 2ϭ ϫ ϩ ϫ
Barge fill volume,V A I f f bϭ ϫ
(a)
(b)
Dc
Ac
l b
Equivalent geotextile container volume,V A I c c bϭ ϫ
Equivalent geotextile container cross-sectionalarea, 1/4 A Dc
2cϭ π
Figure 15. Geotextile container fill volume compared with
equivalent geotextile container volume: (a) barge fill
geometry; (b) equivalent geotextile container geometry
Geotextile containment for hydraulic and environmental engineering 397
Geosynthetics International , 2008, 15, No. 6
7/22/2019 Part 9 Reference Paper
http://slidepdf.com/reader/full/part-9-reference-paper 15/44
using geotextile containers is that a ‘soft’ buttress struc-
ture is provided that won’t damage shipping. Examples of
use are given by Jagt (1988) and CUR (2004).
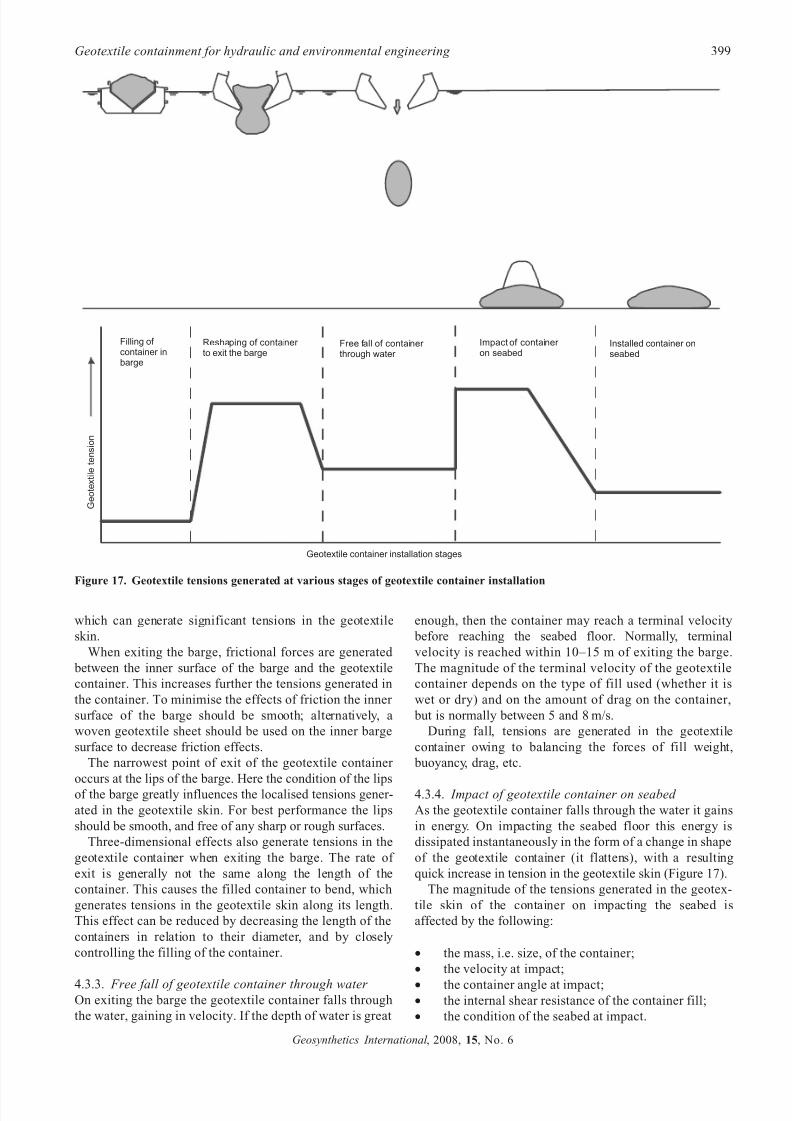
4.3. Tensions generated in geotextile containers and
ultimate tensile strength requirements
The tensions generated in a geotextile container vary
throughout the installation procedure. Figure 17 shows the
five stages of geotextile container installation: f illing of the
geotextile container in the barge; reshaping of the geotextile
container to exit the barge; free fall of the geotextile contain-
er through the water; impact of the geotextile container on
the seabed; and the final installed shape of the geotextile
container on the seabed. All five installation stages generate
different tensions in the geotextile container, as shown in
Figure 17. These are discussed in further detail below.The tensions developed in geotextile containers are
complex, and are dependent on many factors. Several
researchers have attempted to quantify the tensions gener-
ated in geotextile containers during installation. Bezuijen
et al. (2005) and CUR (2006) summarise the relationships
developed by a number of Dutch researchers using
analytical models to calculate geotextile container tensions
during the installation procedure. An analytical calculation
is provided to describe each of the installation stages
shown in Figure 17. Palmerton (2002) has applied the
distinct element method to model the procedure of
geotextile container installation. While in its early stages
of development, this method shows particular promise, asit can model all stages of installation in one progressive
modelling process.
4.3.1. Filling of geotextile container in the barge
The first stage of geotextile container installation involves
the laying-out of the container in the split-bottom barge,
its filling, and the final sealing of the geotextile container.
The tensions generated in the geotextile container arerelatively low during this stage, and are due primarily to
draw-down of the container in the barge during filling.
De-stressing the container during filling can alleviate
much of these tensions.
4.3.2. Reshaping of geotextile container to exit barge
As the split-bottom barge opens, the geotextile container
undergoes a change in shape in order to exit the barge
(Figure 17). This change in shape and the exiting of the
container create significant tensions in the geotextile skin.
The magnitude of the tensions generated in the geotex-
tile skin of the container is affected by:
• the ratio of the internal width of the barge to the
width of the opening in the split-bottom barge;
• the speed of opening of the split-bottom barge;
• the surface condition of the inside of the barge;
• the surface condition of the gate in the split-bottom
barge.
The change in shape of the geotextile container is
minimised if the split-bottom barge can open quickly to
an amount equivalent to its internal width. In practice, this
is not possible, as the most common split-bottom barges
open slowly and only by an amount approaching 50% of the internal width. Thus, to exit the barge, the geotextile
container has to undergo a considerable change in shape,
Water forcescausing erosion
Rock armour
FoundationGeotextile containers
Rock fill Water forcescausing erosion
Rock armour
Foundation
Reclaimed land
Geotextile containers
Potential slip failure surface
Seabed or river bed
Geotextile containers
Rock fill
Waves break on artificial reef
Geotextile containers
Calm water
(b)(a)
(c) (d)
Figure 16. Hydraulic and marine applications of geotextile containers: (a) offshore breakwaters; (b) containment dykes;
(c) artificial reefs; (d) slope buttressing
398 Lawson
Geosynthetics International , 2008, 15, No. 6
7/22/2019 Part 9 Reference Paper
http://slidepdf.com/reader/full/part-9-reference-paper 16/44
which can generate significant tensions in the geotextile
skin.
When exiting the barge, frictional forces are generated
between the inner surface of the barge and the geotextile
container. This increases further the tensions generated in
the container. To minimise the effects of friction the inner
surface of the barge should be smooth; alternatively, a
woven geotextile sheet should be used on the inner barge
surface to decrease friction effects.
The narrowest point of exit of the geotextile container
occurs at the lips of the barge. Here the condition of the lips
of the barge greatly influences the localised tensions gener-
ated in the geotextile skin. For best performance the lips
should be smooth, and free of any sharp or rough surfaces.
Three-dimensional effects also generate tensions in the
geotextile container when exiting the barge. The rate of
exit is generally not the same along the length of the
container. This causes the filled container to bend, which
generates tensions in the geotextile skin along its length.
This effect can be reduced by decreasing the length of the
containers in relation to their diameter, and by closely
controlling the filling of the container.
4.3.3. Free fall of geotextile container through water On exiting the barge the geotextile container falls through
the water, gaining in velocity. If the depth of water is great
enough, then the container may reach a terminal velocity
before reaching the seabed floor. Normally, terminal
velocity is reached within 10–15 m of exiting the barge.
The magnitude of the terminal velocity of the geotextile
container depends on the type of fill used (whether it is
wet or dry) and on the amount of drag on the container,
but is normally between 5 and 8 m/s.
During fall, tensions are generated in the geotextile
container owing to balancing the forces of fill weight,
buoyancy, drag, etc.
4.3.4. Impact of geotextile container on seabed
As the geotextile container falls through the water it gains
in energy. On impacting the seabed floor this energy is
dissipated instantaneously in the form of a change in shape
of the geotextile container (it flattens), with a resulting
quick increase in tension in the geotextile skin (Figure 17).
The magnitude of the tensions generated in the geotex-
tile skin of the container on impacting the seabed is
affected by the following:
• the mass, i.e. size, of the container;
• the velocity at impact;
• the container angle at impact;• the internal shear resistance of the container fill;
• the condition of the seabed at impact.
Geotextiletension
Reshaping of container to exit the barge
Free fall of container through water
Impact of container on seabed
Installed container onseabed
Filling of container inbarge
Geotextile container installation stages
Figure 17. Geotextile tensions generated at various stages of geotextile container installation
Geotextile containment for hydraulic and environmental engineering 399
Geosynthetics International , 2008, 15, No. 6
7/22/2019 Part 9 Reference Paper
http://slidepdf.com/reader/full/part-9-reference-paper 17/44
The size of the container and its velocity at impact
generate energy that is dissipated by a change in shape of
the container and an increase in tensions in the container
skin. The size of the containers is normally decided on the
basis of balancing the geometry of the overall container
structure with the availability of suitable split-bottom
barge sizes. For most hydraulic and marine applications
this results in container sizes ranging between 100 m3
and 700 m3.
The greater the water depth, the greater the velocity of
the geotextile container at impact up until a terminal
velocity is reached. As stated in Section 4.3.3, terminal
velocity occurs at around 10–15 m of water depth: thus
the impact energy should not increase for water depths
greater than this.
If the container remains horizontal during fall, then this
generates lower tensions in the geotextile skin on impact
with the seabed. However, if the container impacts at an
angle then greater localised tensions are generated. For
best performance it is important for the container to
remain near horizontal during fall. Reasons for angled fall
of containers are uneven distribution of fill in the contain-
ers, uneven exit from the split-bottom barge, and water
currents during fall. Obviously, a greater water depth
allows more opportunity for the falling container to
change alignment.
The internal shear resistance of the container fill helps
to dissipate the energy resulting from seabed impact. The
change in shape of the installed container will not be as
extensive if the container fill consists of granular material
compared with soft clay, and thus the tensions generated
will not be as great. For hydraulic and marine structures
the fill within geotextile containers is normally alwaysgranular material, e.g. sand.
If the seabed is soft then there will be some cushioning
for the container when it impacts on the seabed. This
results in lower induced tensions than if the seabed had a
hard and/or rough surface.
4.3.5. Installed shape of geotextile container on seabed
Once settled on the seabed floor the geotextile container
assumes its final shape (Figure 17). The final shape
attained depends on several interrelated factors:
• the volume per unit length of the geotextile container;• the amount of fill placed in the geotextile container
compared with the container volume;
• the internal shear resistance of the container fill;
• the tensile stiffness of the geotextile skin.
The greater the volume per unit length of the geotextile
container, the greater the height of the contained fill on
the seabed (in conjunction with the other factors listed
here); but the greater the volume per unit length, the
greater the tensions generated in the geotextile skin during
installation.
The height of the contained fill on the seabed will bereduced if the amount of fill placed in the geotextile
container is less than the container volume; but the
tensions generated in the geotextile skin will be reduced if
the amount of fill is reduced.
As stated in Section 4.3.4, the internal shear resistance
of the contained fill helps to dissipate the container impact
energy, and so affects the final shape of the contained fill
on the seabed. Sand and other granular fills are used for
hydraulic and marine structures as they have good internal
shear resistance and thus maximise the height of thecontained f ill once installed. In general, installed container
heights of 1.0 to 1.5 m are common.
The geotextile skin should have adequate tensile stiff-
ness to provide some confinement to the contained f ill.
This prevents the contained fill from spreading over time
and the resulting structure losing height.
4.3.6. Ultimate tensile strength requirements of geotex-
tile containers
Figure 17 shows the relative tensions generated in the
geotextile skin of the container during the various installa-
tion stages. The highest tensions are generated during
exiting of the container from the split-bottom barge and
impact of the container on the seabed. Specific individual
circumstances will dictate which of these two stages
generates the higher tensions for a particular project.
As stated previously, the tensions generated in geotex-
tile containers are complex, and depend on many factors.
Analytical solutions that exist to calculate the tensions in
geotextile containers (e.g. Bezuijen et al. 2005; CUR
2006) require the application of large factors of safety
(around 4 to 5) to determine the safe required tensile
strengths of the geotextile skin. This large factor of safety
is to account for the many unknowns. High tensile
strengths are required in both the circumferential and thelongitudinal directions of the geotextile skin. Geotextile
strengths of 100 to 200 kN/m, along with high-capacity
seams, are common for geotextile containers.
4.4. Effect of different hydraulic environments on
geotextile containers
Geotextile containers are required to perform in a variety
of hydraulic environments, as evidenced by the applica-
tions shown in Figure 16. For the majority of applications
the geotextile containers either are part of a larger mass-
gravity structure or are located at some water depth
beneath the surface. In these instances the hydraulic forcesacting directly on the geotextile containers are limited, and
therefore the geotextile skin has to have only limited
hydraulic properties.
However, where geotextile containers are located in the
vicinity of breaking waves and high water flows, special
attention should be paid to the long-term performance of
the containers, for the following reasons. First, geotextile
containers, unlike geotextile tubes, cannot be filled to
maximum density with sand fill, and consequently are
more prone to liquefaction and change of shape over time.
This change in shape may result in a critical loss of height
of the structure. Second, consideration needs to be given to
the required hydraulic properties of the geotextile container skin to ensure that the container fill is not eroded out of the
container. The relationships given in Table 3 for geotextile
400 Lawson
Geosynthetics International , 2008, 15, No. 6
7/22/2019 Part 9 Reference Paper
http://slidepdf.com/reader/full/part-9-reference-paper 18/44
tubes also apply to geotextile containers when subjected to
the same hydraulic conditions.
Where the hydraulic regime is severe, additional protec-
tion measures may be warranted. These normally involve
the use of armour layers to protect the geotextile container
structure. In some instances it may be impractical to use
armour layers to enhance the protection for geotextile
containers. An example of this is where geotextile contain-ers are used for artificial reefs that also serve as surfing
reefs. Here armour protection is a safety hazard to surfers,
and cannot be used. Consequently, a more robust geotex-
tile skin is normally used for the containers in addition to
a commensurate future maintenance programme. For these
types of structure a limited design life is accepted.
4.5. Protection measures applied to geotextile
containers
External protection measures are applied to geotextile
containers for two reasons:
• to reduce the impact of the hydraulic forces acting
directly on the geotextile containers; and
• to enhance the design life of the geotextile container
in an exposed environment.
Section 4.4 discusses the types of protection measures
used to reduce the impact of hydraulic forces.
In some instances geotextile containers may be required
to perform over a relatively long design life in an exposed
environment. In this environment UV degradation can
occur, with the geotextile container design life dependent
on the level of UV radiation and the resistance of the
geotextile container skin to this radiation. If the geotextile
container is located in a healthy aquatic environment,
marine growth generally occurs quickly on the outer
surface, and this tends to mask the geotextile skin from
the effects of UV radiation. However, for good long-term
performance in an exposed environment additional protec-
tion measures are normally required for the geotextile
container skin. These measures are listed below in order
of providing longer-term performance.
• Additional stabiliser packages in the geotextile
container skin: the enhanced performance of the
stabiliser package improves the performance of the
geotextile container skin over time.
• More robust geotextile skin: extra design life is
achieved by the use of more robust geotextile skins
that degrade over a longer period of time.
• Geotextile coating: a robust coating is applied to the
geotextile container to protect it.
• Armour covering: a flexible armour covering is used
around the geotextile container structure to prevent
long-term exposure to UV light. This is normally
used in hydraulic and marine applications wheresevere hydraulic forces are possible, and where long
design life is required.
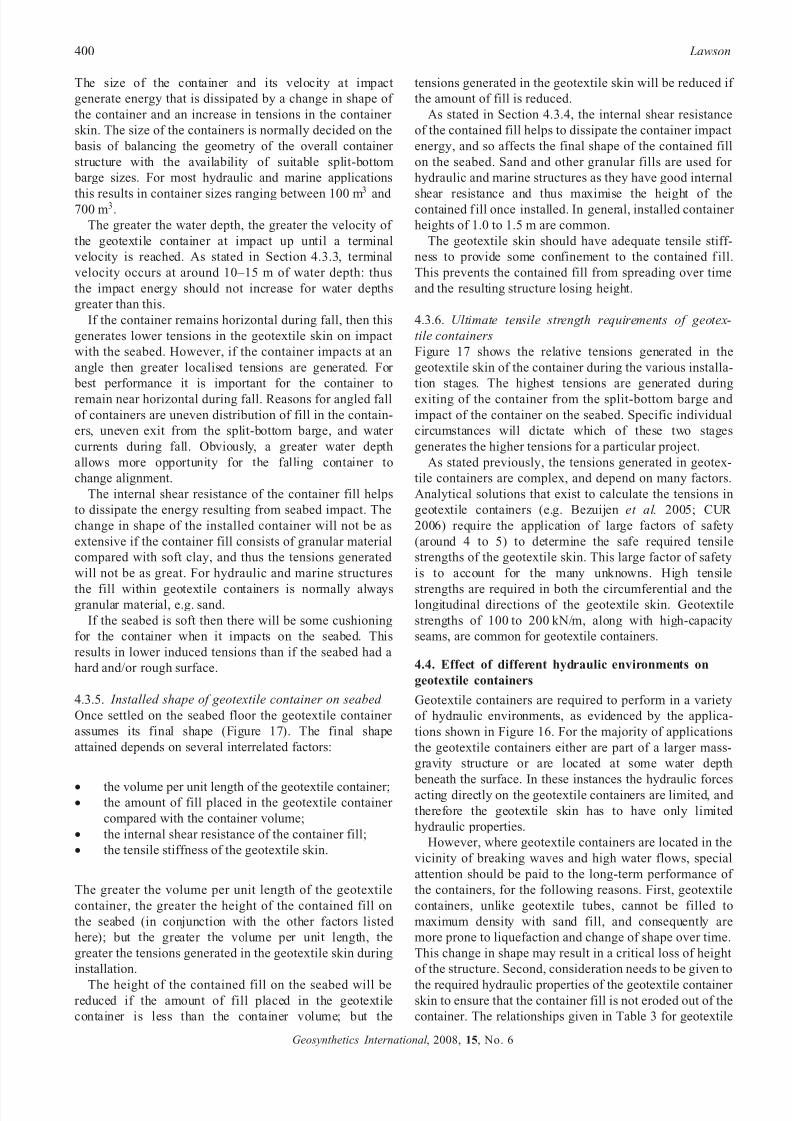
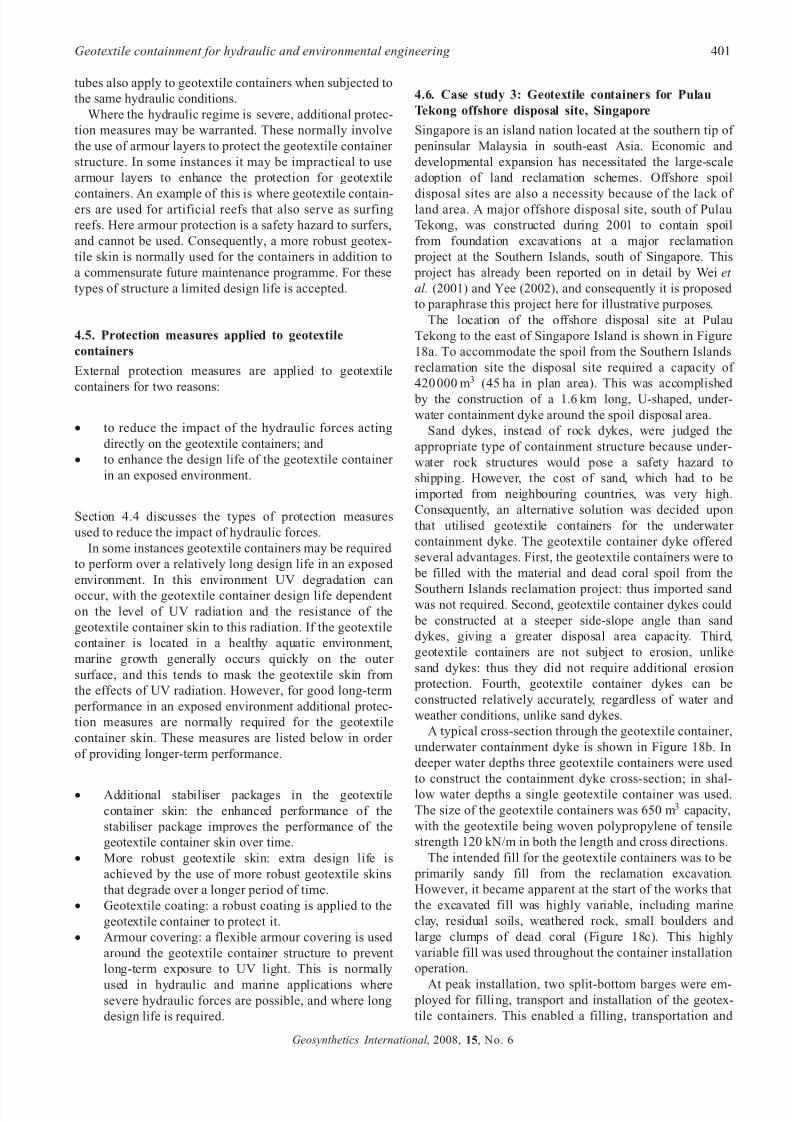
4.6. Case study 3: Geotextile containers for Pulau
Tekong offshore disposal site, Singapore
Singapore is an island nation located at the southern tip of
peninsular Malaysia in south-east Asia. Economic and
developmental expansion has necessitated the large-scale
adoption of land reclamation schemes. Offshore spoil
disposal sites are also a necessity because of the lack of land area. A major offshore disposal site, south of Pulau
Tekong, was constructed during 2001 to contain spoil
from foundation excavations at a major reclamation
project at the Southern Islands, south of Singapore. This
project has already been reported on in detail by Wei et
al. (2001) and Yee (2002), and consequently it is proposed
to paraphrase this project here for illustrative purposes.
The location of the offshore disposal site at Pulau
Tekong to the east of Singapore Island is shown in Figure
18a. To accommodate the spoil from the Southern Islands
reclamation site the disposal site required a capacity of
420 000 m3 (45 ha in plan area). This was accomplished
by the construction of a 1.6 km long, U-shaped, under-
water containment dyke around the spoil disposal area.
Sand dykes, instead of rock dykes, were judged the
appropriate type of containment structure because under-
water rock structures would pose a safety hazard to
shipping. However, the cost of sand, which had to be
imported from neighbouring countries, was very high.
Consequently, an alternative solution was decided upon
that utilised geotextile containers for the underwater
containment dyke. The geotextile container dyke offered
several advantages. First, the geotextile containers were to
be filled with the material and dead coral spoil from the
Southern Islands reclamation project: thus imported sand was not required. Second, geotextile container dykes could
be constructed at a steeper side-slope angle than sand
dykes, giving a greater disposal area capacity. Third,
geotextile containers are not subject to erosion, unlike
sand dykes: thus they did not require additional erosion
protection. Fourth, geotextile container dykes can be
constructed relatively accurately, regardless of water and
weather conditions, unlike sand dykes.
A typical cross-section through the geotextile container,
underwater containment dyke is shown in Figure 18b. In
deeper water depths three geotextile containers were used
to construct the containment dyke cross-section; in shal-
low water depths a single geotextile container was used.
The size of the geotextile containers was 650 m3 capacity,
with the geotextile being woven polypropylene of tensile
strength 120 kN/m in both the length and cross directions.
The intended fill for the geotextile containers was to be
primarily sandy fill from the reclamation excavation.
However, it became apparent at the start of the works that
the excavated fill was highly variable, including marine
clay, residual soils, weathered rock, small boulders and
large clumps of dead coral (Figure 18c). This highly
variable fill was used throughout the container installation
operation.
At peak installation, two split-bottom barges were em- ployed for filling, transport and installation of the geotex-
tile containers. This enabled a filling, transportation and
Geotextile containment for hydraulic and environmental engineering 401
Geosynthetics International , 2008, 15, No. 6
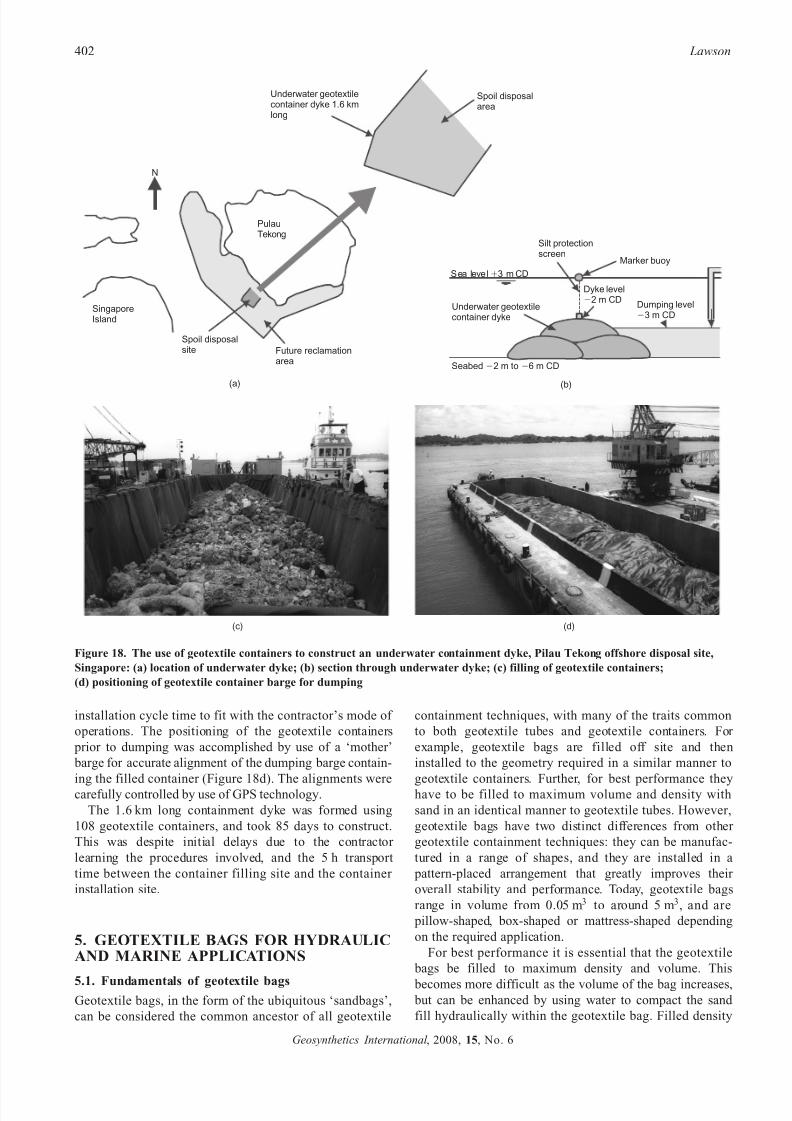
7/22/2019 Part 9 Reference Paper
http://slidepdf.com/reader/full/part-9-reference-paper 19/44
installation cycle time to fit with the contractor’s mode of
operations. The positioning of the geotextile containers
prior to dumping was accomplished by use of a ‘mother’
barge for accurate alignment of the dumping barge contain-
ing the filled container (Figure 18d). The alignments were
carefully controlled by use of GPS technology.
The 1.6 km long containment dyke was formed using
108 geotextile containers, and took 85 days to construct.
This was despite initial delays due to the contractor
learning the procedures involved, and the 5 h transport
time between the container filling site and the container
installation site.
5. GEOTEXTILE BAGS FOR HYDRAULICAND MARINE APPLICATIONS
5.1. Fundamentals of geotextile bagsGeotextile bags, in the form of the ubiquitous ‘sandbags’,
can be considered the common ancestor of all geotextile
containment techniques, with many of the traits common
to both geotextile tubes and geotextile containers. For
example, geotextile bags are filled off site and then
installed to the geometry required in a similar manner to
geotextile containers. Further, for best performance they
have to be filled to maximum volume and density with
sand in an identical manner to geotextile tubes. However,
geotextile bags have two distinct differences from other
geotextile containment techniques: they can be manufac-
tured in a range of shapes, and they are installed in a
pattern-placed arrangement that greatly improves their
overall stability and performance. Today, geotextile bags
range in volume from 0.05 m3 to around 5 m3, and are
pillow-shaped, box-shaped or mattress-shaped depending
on the required application.
For best performance it is essential that the geotextile
bags be filled to maximum density and volume. This
becomes more difficult as the volume of the bag increases, but can be enhanced by using water to compact the sand
fill hydraulically within the geotextile bag. Filled density
Underwater geotextilecontainer dyke
Dumping levelϪ3 m CD
Seabed 2 m to 6 m CDϪ Ϫ
Sea level 3 m CDϩ
SingaporeIsland
PulauTekong
Future reclamationarea
N
Spoil disposalsite
Dyke levelϪ2 m CD
Underwater geotextilecontainer dyke 1.6 kmlong
Spoil disposalarea
Silt protectionscreen
Marker buoy
(a) (b)
(c) (d)
Figure 18. The use of geotextile containers to construct an underwater containment dyke, Pilau Tekong offshore disposal site,
Singapore: (a) location of underwater dyke; (b) section through underwater dyke; (c) filling of geotextile containers;
(d) positioning of geotextile container barge for dumping
402 Lawson
Geosynthetics International , 2008, 15, No. 6
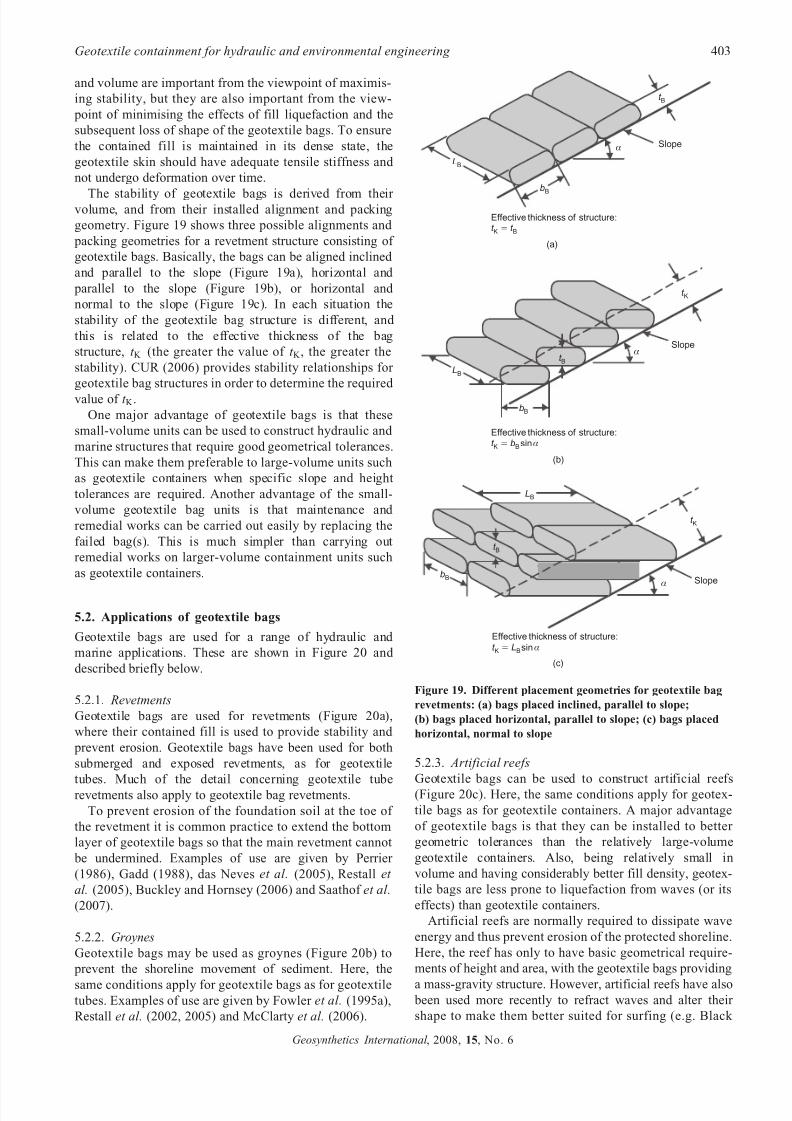
7/22/2019 Part 9 Reference Paper
http://slidepdf.com/reader/full/part-9-reference-paper 20/44
and volume are important from the viewpoint of maximis-
ing stability, but they are also important from the view-
point of minimising the effects of fill liquefaction and the
subsequent loss of shape of the geotextile bags. To ensure
the contained fill is maintained in its dense state, the
geotextile skin should have adequate tensile stiffness and
not undergo deformation over time.
The stability of geotextile bags is derived from their volume, and from their installed alignment and packing
geometry. Figure 19 shows three possible alignments and
packing geometries for a revetment structure consisting of
geotextile bags. Basically, the bags can be aligned inclined
and parallel to the slope (Figure 19a), horizontal and
parallel to the slope (Figure 19b), or horizontal and
normal to the slope (Figure 19c). In each situation the
stability of the geotextile bag structure is different, and
this is related to the effective thickness of the bag
structure, t K (the greater the value of t K , the greater the
stability). CUR (2006) provides stability relationships for
geotextile bag structures in order to determine the required
value of t K .
One major advantage of geotextile bags is that these
small-volume units can be used to construct hydraulic and
marine structures that require good geometrical tolerances.
This can make them preferable to large-volume units such
as geotextile containers when specific slope and height
tolerances are required. Another advantage of the small-
volume geotextile bag units is that maintenance and
remedial works can be carried out easily by replacing the
failed bag(s). This is much simpler than carrying out
remedial works on larger-volume containment units such
as geotextile containers.
5.2. Applications of geotextile bags
Geotextile bags are used for a range of hydraulic and
marine applications. These are shown in Figure 20 and
described briefly below.
5.2.1. Revetments
Geotextile bags are used for revetments (Figure 20a),
where their contained fill is used to provide stability and
prevent erosion. Geotextile bags have been used for both
submerged and exposed revetments, as for geotextile
tubes. Much of the detail concerning geotextile tuberevetments also apply to geotextile bag revetments.
To prevent erosion of the foundation soil at the toe of
the revetment it is common practice to extend the bottom
layer of geotextile bags so that the main revetment cannot
be undermined. Examples of use are given by Perrier
(1986), Gadd (1988), das Neves et al. (2005), Restall et
al. (2005), Buckley and Hornsey (2006) and Saathof et al.
(2007).
5.2.2. Groynes
Geotextile bags may be used as groynes (Figure 20b) to
prevent the shoreline movement of sediment. Here, the
same conditions apply for geotextile bags as for geotextiletubes. Examples of use are given by Fowler et al. (1995a),
Restall et al. (2002, 2005) and McClarty et al. (2006).
5.2.3. Artificial reefs
Geotextile bags can be used to construct artificial reefs
(Figure 20c). Here, the same conditions apply for geotex-
tile bags as for geotextile containers. A major advantage
of geotextile bags is that they can be installed to better
geometric tolerances than the relatively large-volume
geotextile containers. Also, being relatively small in
volume and having considerably better fill density, geotex-
tile bags are less prone to liquefaction from waves (or its
effects) than geotextile containers.
Artificial reefs are normally required to dissipate wave
energy and thus prevent erosion of the protected shoreline.
Here, the reef has only to have basic geometrical require-
ments of height and area, with the geotextile bags providing
a mass-gravity structure. However, artificial reefs have also been used more recently to refract waves and alter their
shape to make them better suited for surfing (e.g. Black
α
t B
bB
LB
Effective thickness of structure:t t K Bϭ
Slope
α
t B
t B
t K
t K
bB
bB
LB
LB
Effective thickness of structure:sint bK Bϭ α
Effective thickness of structure:
sint LK Bϭ α
(a)
Slope
Slope
(b)
(c)
α
Figure 19. Different placement geometries for geotextile bag
revetments: (a) bags placed inclined, parallel to slope;
(b) bags placed horizontal, parallel to slope; (c) bags placed
horizontal, normal to slope
Geotextile containment for hydraulic and environmental engineering 403
Geosynthetics International , 2008, 15, No. 6
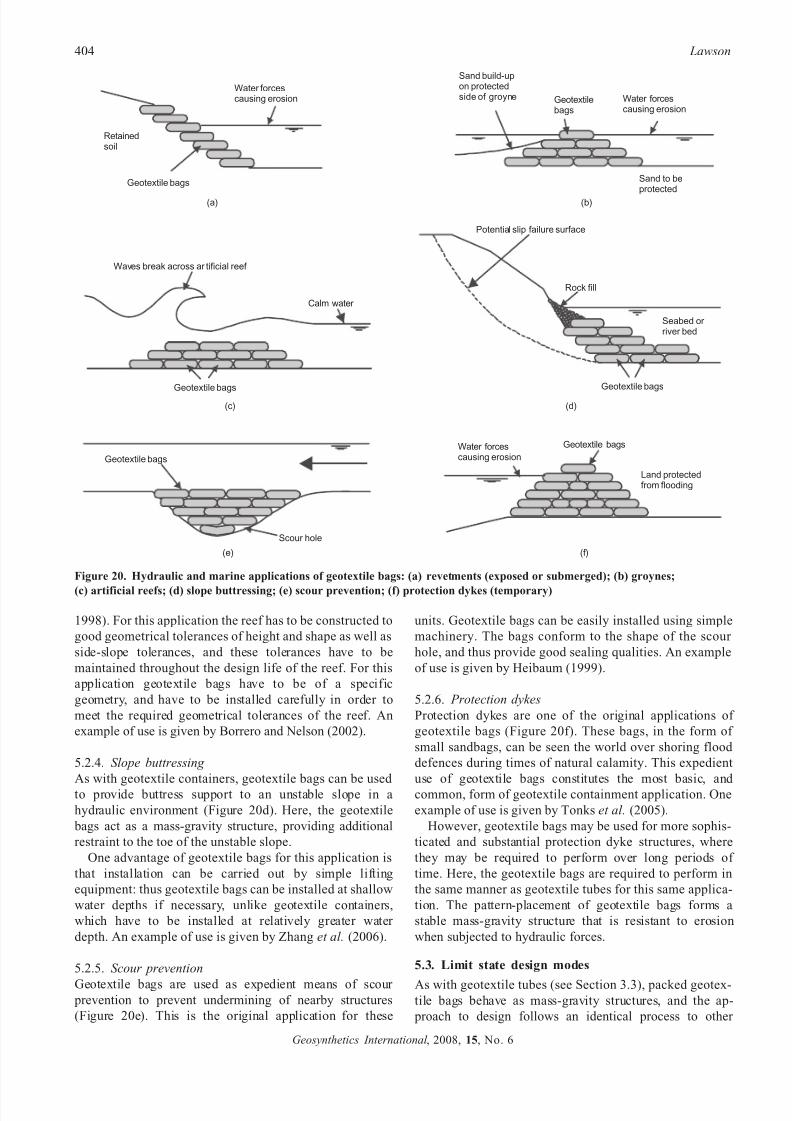
7/22/2019 Part 9 Reference Paper
http://slidepdf.com/reader/full/part-9-reference-paper 21/44
1998). For this application the reef has to be constructed to
good geometrical tolerances of height and shape as well as
side-slope tolerances, and these tolerances have to be
maintained throughout the design life of the reef. For this
application geotextile bags have to be of a specific
geometry, and have to be installed carefully in order to
meet the required geometrical tolerances of the reef. An
example of use is given by Borrero and Nelson (2002).
5.2.4. Slope buttressing
As with geotextile containers, geotextile bags can be used
to provide buttress support to an unstable slope in a
hydraulic environment (Figure 20d). Here, the geotextile
bags act as a mass-gravity structure, providing additional
restraint to the toe of the unstable slope.
One advantage of geotextile bags for this application is
that installation can be carried out by simple lifting
equipment: thus geotextile bags can be installed at shallow
water depths if necessary, unlike geotextile containers,
which have to be installed at relatively greater water
depth. An example of use is given by Zhang et al. (2006).
5.2.5. Scour prevention
Geotextile bags are used as expedient means of scour prevention to prevent undermining of nearby structures
(Figure 20e). This is the original application for these
units. Geotextile bags can be easily installed using simple
machinery. The bags conform to the shape of the scour
hole, and thus provide good sealing qualities. An example
of use is given by Heibaum (1999).
5.2.6. Protection dykes
Protection dykes are one of the original applications of
geotextile bags (Figure 20f). These bags, in the form of
small sandbags, can be seen the world over shoring flood
defences during times of natural calamity. This expedient
use of geotextile bags constitutes the most basic, and
common, form of geotextile containment application. One
example of use is given by Tonks et al. (2005).
However, geotextile bags may be used for more sophis-
ticated and substantial protection dyke structures, where
they may be required to perform over long periods of
time. Here, the geotextile bags are required to perform in
the same manner as geotextile tubes for this same applica-
tion. The pattern-placement of geotextile bags forms a
stable mass-gravity structure that is resistant to erosion
when subjected to hydraulic forces.
5.3. Limit state design modes
As with geotextile tubes (see Section 3.3), packed geotex-tile bags behave as mass-gravity structures, and the ap-
proach to design follows an identical process to other
Waves break across ar tificial reef
Geotextile bags
Calm water
Potential slip failure surface
Seabed or river bed
Geotextile bags
Rock fill
Geotextile bags
Retainedsoil
Water forcescausing erosion Water forces
causing erosion
Sand to beprotected
Geotextilebags
Sand build-upon protectedside of groyne
Geotextile bagsWater forcescausing erosion
Land protectedfrom flooding
Geotextile bags
Scour hole
(b)(a)
(c) (d)
(e) (f)
Figure 20. Hydraulic and marine applications of geotextile bags: (a) revetments (exposed or submerged); (b) groynes;
(c) artificial reefs; (d) slope buttressing; (e) scour prevention; (f) protection dykes (temporary)
404 Lawson
Geosynthetics International , 2008, 15, No. 6
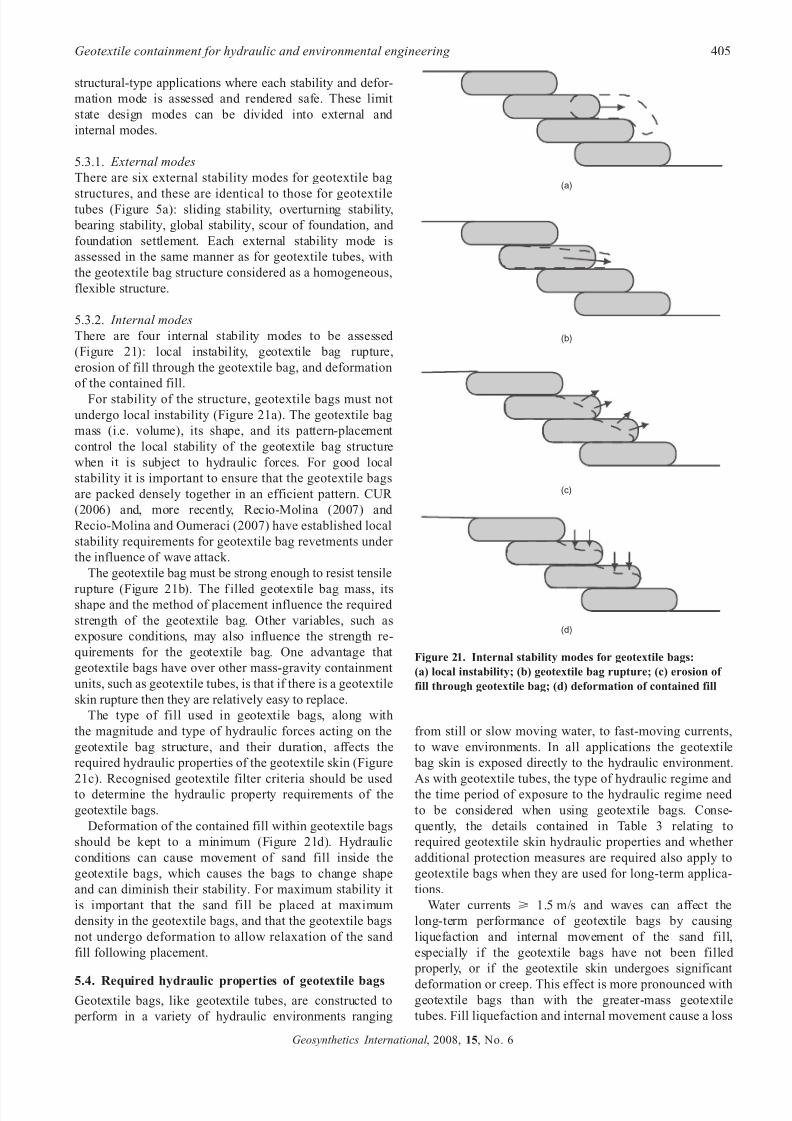
7/22/2019 Part 9 Reference Paper
http://slidepdf.com/reader/full/part-9-reference-paper 22/44
structural-type applications where each stability and defor-
mation mode is assessed and rendered safe. These limit
state design modes can be divided into external and
internal modes.
5.3.1. External modes
There are six external stability modes for geotextile bag
structures, and these are identical to those for geotextiletubes (Figure 5a): sliding stability, overturning stability,
bearing stability, global stability, scour of foundation, and
foundation settlement. Each external stability mode is
assessed in the same manner as for geotextile tubes, with
the geotextile bag structure considered as a homogeneous,
flexible structure.
5.3.2. Internal modes
There are four internal stability modes to be assessed
(Figure 21): local instability, geotextile bag rupture,
erosion of fill through the geotextile bag, and deformation
of the contained fill.
For stability of the structure, geotextile bags must not
undergo local instability (Figure 21a). The geotextile bag
mass (i.e. volume), its shape, and its pattern-placement
control the local stability of the geotextile bag structure
when it is subject to hydraulic forces. For good local
stability it is important to ensure that the geotextile bags
are packed densely together in an efficient pattern. CUR
(2006) and, more recently, Recio-Molina (2007) and
Recio-Molina and Oumeraci (2007) have established local
stability requirements for geotextile bag revetments under
the influence of wave attack.
The geotextile bag must be strong enough to resist tensile
rupture (Figure 21b). The f illed geotextile bag mass, itsshape and the method of placement influence the required
strength of the geotextile bag. Other variables, such as
exposure conditions, may also influence the strength re-
quirements for the geotextile bag. One advantage that
geotextile bags have over other mass-gravity containment
units, such as geotextile tubes, is that if there is a geotextile
skin rupture then they are relatively easy to replace.
The type of fill used in geotextile bags, along with
the magnitude and type of hydraulic forces acting on the
geotextile bag structure, and their duration, affects the
required hydraulic properties of the geotextile skin (Figure
21c). Recognised geotextile filter criteria should be used
to determine the hydraulic property requirements of the
geotextile bags.
Deformation of the contained fill within geotextile bags
should be kept to a minimum (Figure 21d). Hydraulic
conditions can cause movement of sand fill inside the
geotextile bags, which causes the bags to change shape
and can diminish their stability. For maximum stability it
is important that the sand fill be placed at maximum
density in the geotextile bags, and that the geotextile bags
not undergo deformation to allow relaxation of the sand
fill following placement.
5.4. Required hydraulic properties of geotextile bagsGeotextile bags, like geotextile tubes, are constructed to
perform in a variety of hydraulic environments ranging
from still or slow moving water, to fast-moving currents,
to wave environments. In all applications the geotextile
bag skin is exposed directly to the hydraulic environment.
As with geotextile tubes, the type of hydraulic regime and
the time period of exposure to the hydraulic regime need
to be considered when using geotextile bags. Conse-
quently, the details contained in Table 3 relating to
required geotextile skin hydraulic properties and whether
additional protection measures are required also apply to
geotextile bags when they are used for long-term applica-
tions.
Water currents > 1.5 m/s and waves can affect the
long-term performance of geotextile bags by causing
liquefaction and internal movement of the sand fill,
especially if the geotextile bags have not been filled
properly, or if the geotextile skin undergoes significant
deformation or creep. This effect is more pronounced withgeotextile bags than with the greater-mass geotextile
tubes. Fill liquefaction and internal movement cause a loss
(a)
(b)
(c)
(d)
Figure 21. Internal stability modes for geotextile bags:
(a) local instability; (b) geotextile bag rupture; (c) erosion of
fill through geotextile bag; (d) deformation of contained fill
Geotextile containment for hydraulic and environmental engineering 405
Geosynthetics International , 2008, 15, No. 6
7/22/2019 Part 9 Reference Paper
http://slidepdf.com/reader/full/part-9-reference-paper 23/44
of stability in the pattern-placed geotextile bags, which
may lead to premature failure of the overall structure. The
possibility of this needs to be accounted for at the design
stage (see Figure 21d). However, a major advantage of
geotextile bags is that they can be easily replaced should
they show distress under a specific hydraulic regime.
6. GEOTEXTILE CONTAINMENT FOR DEWATERING OF SLURRY WASTE ANDCONTAMINATED SEDIMENTS
6.1. Introduction
Many industries utilise water for processing, and for the
movement and storage of by-products and waste. This
results in large volumes of liquid or slurry-like materials
being stored in containment areas, or being treated before
discharge into lakes, rivers and streams. In the past, many
industry by-products were discharged directly into water
courses, where they have settled and, over time, have
contaminated the sediments of these water courses.
Over time, many of these slurry waste impoundments
require cleaning to remove the sludge, and to enable the
impoundment to accept further waste flows. The removal
and disposal of sludge and waste from lagoons and ponds,
and of contaminated sediments from mines, lakes, rivers
and streams, present a major environmental problem
because of the large volumes involved, and because these
wastes are in liquid form, which presents problems in
handling, transportation and disposal.
With government regulation, liquid or slurry-like wastesnow have to be stored, or disposed of, in special contain-
ment facilities, and cannot be discharged directly into
water courses. This has led to several major environmental
issues: how best to store, or dispose of, these slurry-like
by-products and wastes: and how best to remediate
existing containment facilities and contaminated sediment
sites. Landfilling has become the disposal facility of
choice, but with the huge volumes of slurry-like wastes
and contaminated sediments produced, direct landfilling is
not practical. Thus a preliminary treatment stage has to be
employed in order to significantly reduce the volume of
the slurry waste prior to disposal by landfilling, and torender it manageable for handling, transport and disposal.
Dewatering is commonly applied as this preliminary
treatment.
Dewatering accomplishes two primary objectives with
regard to the treatment and disposal of slurry-like waste
and contaminated sediments. First, a large reduction in
volume of the slurry-like material is achieved as water is
removed from the waste. Second, the consistency of the
waste or contaminated sediment is changed from a liquid
to a semi-solid or solid material that can be easily handled,
transported and disposed of in waste storage facilities.
Dewatering, if done in a controlled manner, may also
achieve two important secondary objectives: retention of the solids, and retention of the contaminants within the
containment medium during the dewatering process.
6.2. Geotextile tubes and bags for dewatering waste
streams and contaminated sediments
Geotextile tubes and bags provide an ideal medium for the
dewatering of slurry-like waste streams and contaminated
sediments, for several reasons. First, they provide a large
contact surface area with the slurry to enable efficient
dewatering. Second, they utilise geotextiles that enableefficient dewatering of the slurry. Third, they can be
fabricated in sizes, and used in numbers, that fit into the
scale of required dewatering operations. Fourth, they are
relatively simple to employ and utilise, unlike other more
complex mechanical dewatering technologies, and are
therefore cheaper. Geotextile tubes are used where the
volume of slurry waste to be dewatered is large, and
geotextile bags are used where the volume of slurry waste
to be dewatered is small. This section will make reference
to the use of geotextile tubes for dewatering, but exactly
the same details will apply to geotextile bags, except that
the scale of operations will be different.
Geotextile tubes were first used for dewatering waste
slurry during the mid 1990s (e.g. Fowler et al. 1996),
where trials involving the dewatering of municipal sewage
sludge were performed. This provided much of the initial
understanding of how geotextile tubes may be employed
for waste-dewatering applications. Since that time, geotex-
tile tubes have been used to dewater many slurry-like
wastes and contaminated sediments.
In many respects the use of geotextile tubes to dewater
waste streams and contaminated sediments is still develop-
ing, with new applications arising frequently. For example,
applications in industries that produce significant quanti-
ties of slurry waste where geotextile tubes have beensuccessfully utilised for dewatering are municipal waste
treatment, agriculture waste treatment, food and food
processing waste treatment, industrial and mining waste
treatment, construction industry waste treatment, and the
treatment of contaminated sediments.
It is important to recognise that geotextile tubes are
used as a component of the system of disposal of slurry-
like waste and contaminated sediments by dewatering.
Figure 22 shows the various stages in the dewatering
process, and the various options involved. Basically, the
slurry is introduced into the system, where it is first mixed
with a dewatering accelerant (if required). The slurry is
then pumped into the geotextile tubes, where dewatering
occurs. Over time, the water passing out of the tubes can
be pumped to a water treatment plant, where it is cleaned
further, or it may be recirculated to the original slurry
ponds, or it may exit directly to the environment (if it is
clean enough). At the end of dewatering the contained
solids within the tubes may be left in place, or they may
be transported to an off-site disposal facility, or they may
be recycled for other uses. The overall system includes
combinations of pumping equipment and pipelines; geo-
textile type, tube sizes and numbers; accelerant additives;
water treatment processes; and specific disposal facilities
for the final dewatered waste stream.To dewater effectively, a geotextile tube dewatering
platform needs to be provided in the manner shown in
406 Lawson
Geosynthetics International , 2008, 15, No. 6
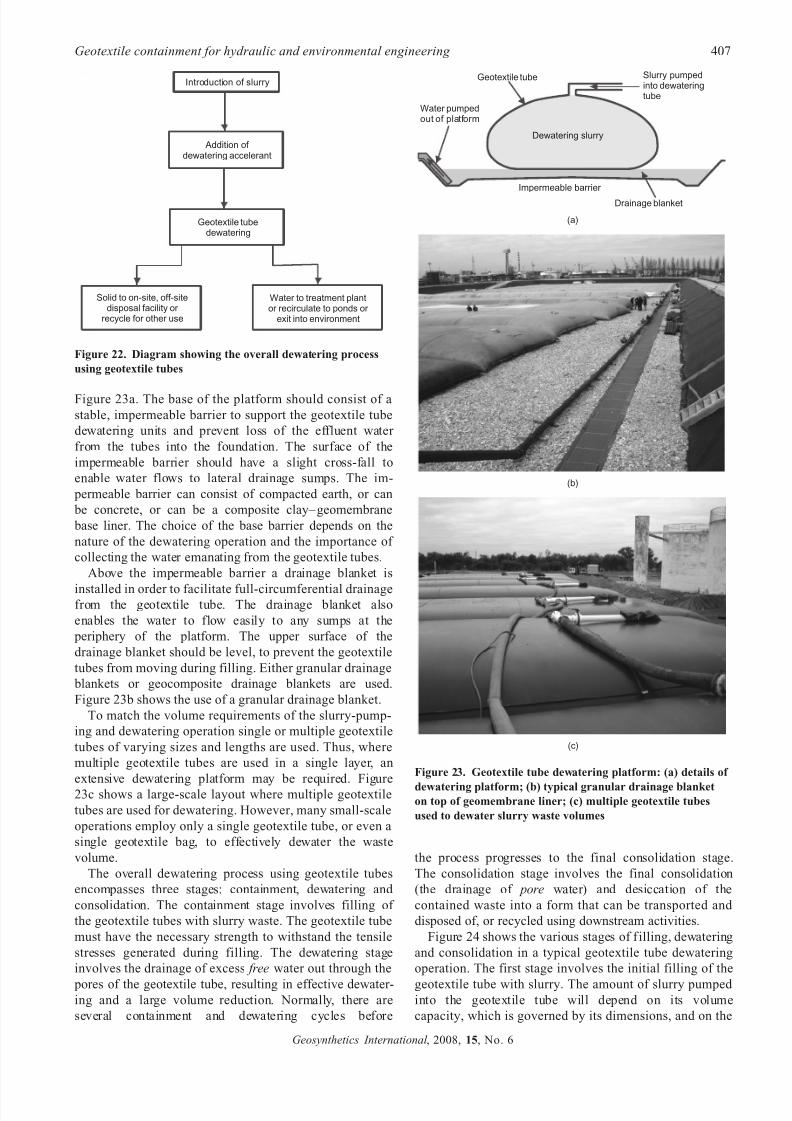
7/22/2019 Part 9 Reference Paper
http://slidepdf.com/reader/full/part-9-reference-paper 24/44
Figure 23a. The base of the platform should consist of a
stable, impermeable barrier to support the geotextile tube
dewatering units and prevent loss of the effluent water
from the tubes into the foundation. The surface of the
impermeable barrier should have a slight cross-fall to
enable water flows to lateral drainage sumps. The im-
permeable barrier can consist of compacted earth, or can
be concrete, or can be a composite clay– geomembrane
base liner. The choice of the base barrier depends on the
nature of the dewatering operation and the importance of
collecting the water emanating from the geotextile tubes.
Above the impermeable barrier a drainage blanket is
installed in order to facilitate full-circumferential drainagefrom the geotextile tube. The drainage blanket also
enables the water to flow easily to any sumps at the
periphery of the platform. The upper surface of the
drainage blanket should be level, to prevent the geotextile
tubes from moving during filling. Either granular drainage
blankets or geocomposite drainage blankets are used.
Figure 23b shows the use of a granular drainage blanket.
To match the volume requirements of the slurry-pump-
ing and dewatering operation single or multiple geotextile
tubes of varying sizes and lengths are used. Thus, where
multiple geotextile tubes are used in a single layer, an
extensive dewatering platform may be required. Figure
23c shows a large-scale layout where multiple geotextile
tubes are used for dewatering. However, many small-scale
operations employ only a single geotextile tube, or even a
single geotextile bag, to effectively dewater the waste
volume.
The overall dewatering process using geotextile tubes
encompasses three stages: containment, dewatering and
consolidation. The containment stage involves filling of
the geotextile tubes with slurry waste. The geotextile tube
must have the necessary strength to withstand the tensile
stresses generated during filling. The dewatering stage
involves the drainage of excess free water out through the
pores of the geotextile tube, resulting in effective dewater-ing and a large volume reduction. Normally, there are
several containment and dewatering cycles before
the process progresses to the final consolidation stage.
The consolidation stage involves the final consolidation
(the drainage of pore water) and desiccation of the
contained waste into a form that can be transported and
disposed of, or recycled using downstream activities.
Figure 24 shows the various stages of filling, dewatering
and consolidation in a typical geotextile tube dewatering
operation. The first stage involves the initial filling of the
geotextile tube with slurry. The amount of slurry pumped into the geotextile tube will depend on its volume
capacity, which is governed by its dimensions, and on the
Introduction of slurry
Addition of dewatering accelerant
Geotextile tubedewatering
Solid to on-site, off-sitedisposal facility or
recycle for other use
Water to treatment plantor recirculate to ponds or
exit into environment
Figure 22. Diagram showing the overall dewatering process
using geotextile tubes
Impermeable barrier
Drainage blanket
Dewatering slurry
Geotextile tube Slurry pumpedinto dewateringtube
Water pumpedout of platform
(a)
(b)
(c)
Figure 23. Geotextile tube dewatering platform: (a) details of
dewatering platform; (b) typical granular drainage blanketon top of geomembrane liner; (c) multiple geotextile tubes
used to dewater slurry waste volumes
Geotextile containment for hydraulic and environmental engineering 407
Geosynthetics International , 2008, 15, No. 6
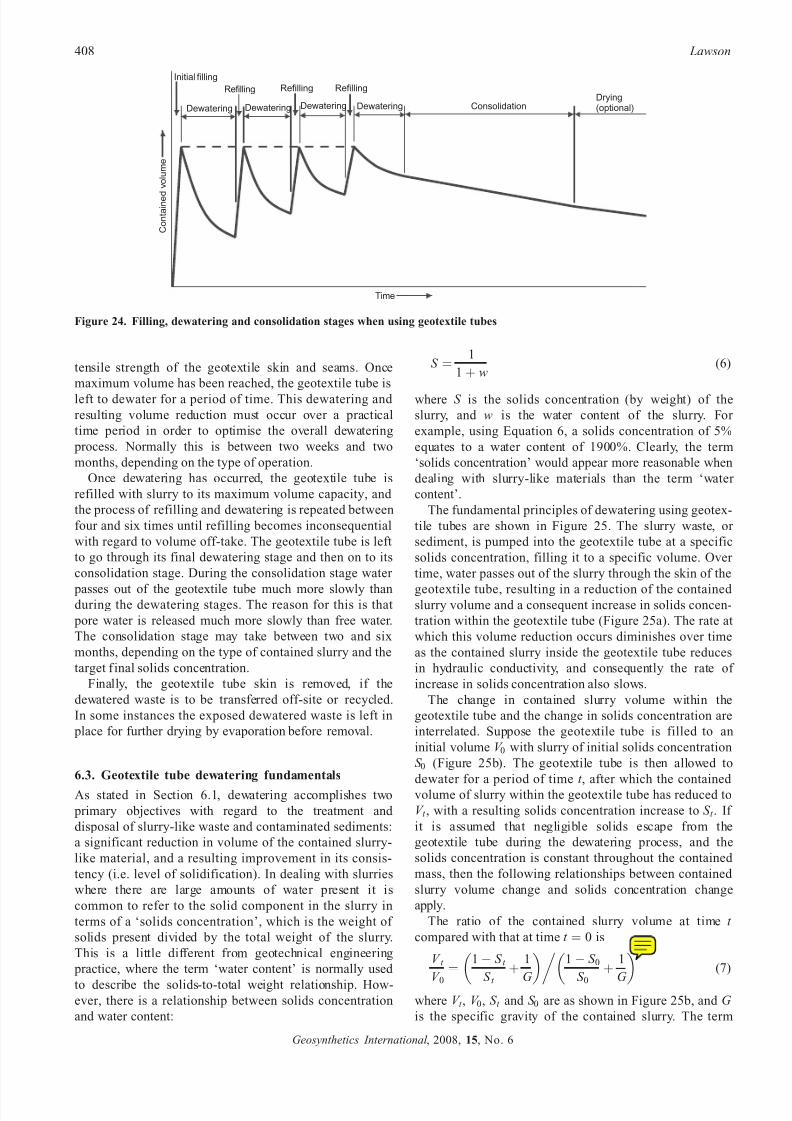
7/22/2019 Part 9 Reference Paper
http://slidepdf.com/reader/full/part-9-reference-paper 25/44
tensile strength of the geotextile skin and seams. Once
maximum volume has been reached, the geotextile tube is
left to dewater for a period of time. This dewatering and
resulting volume reduction must occur over a practical
time period in order to optimise the overall dewatering
process. Normally this is between two weeks and two
months, depending on the type of operation.
Once dewatering has occurred, the geotextile tube is
refilled with slurry to its maximum volume capacity, and
the process of refilling and dewatering is repeated between
four and six times until refilling becomes inconsequential
with regard to volume off-take. The geotextile tube is left
to go through its final dewatering stage and then on to its
consolidation stage. During the consolidation stage water
passes out of the geotextile tube much more slowly thanduring the dewatering stages. The reason for this is that
pore water is released much more slowly than free water.
The consolidation stage may take between two and six
months, depending on the type of contained slurry and the
target final solids concentration.
Finally, the geotextile tube skin is removed, if the
dewatered waste is to be transferred off-site or recycled.
In some instances the exposed dewatered waste is left in
place for further drying by evaporation before removal.
6.3. Geotextile tube dewatering fundamentals
As stated in Section 6.1, dewatering accomplishes two
primary objectives with regard to the treatment and
disposal of slurry-like waste and contaminated sediments:
a significant reduction in volume of the contained slurry-
like material, and a resulting improvement in its consis-
tency (i.e. level of solidification). In dealing with slurries
where there are large amounts of water present it is
common to refer to the solid component in the slurry in
terms of a ‘solids concentration’, which is the weight of
solids present divided by the total weight of the slurry.
This is a little different from geotechnical engineering
practice, where the term ‘water content’ is normally used
to describe the solids-to-total weight relationship. How-ever, there is a relationship between solids concentration
and water content:
S ¼1
1þ w(6)
where S is the solids concentration (by weight) of the
slurry, and w is the water content of the slurry. For
example, using Equation 6, a solids concentration of 5%
equates to a water content of 1900%. Clearly, the term
‘solids concentration’ would appear more reasonable when
dealing with slurry-like materials than the term ‘water
content’.
The fundamental principles of dewatering using geotex-
tile tubes are shown in Figure 25. The slurry waste, or
sediment, is pumped into the geotextile tube at a specific
solids concentration, filling it to a specific volume. Over
time, water passes out of the slurry through the skin of the
geotextile tube, resulting in a reduction of the contained slurry volume and a consequent increase in solids concen-
tration within the geotextile tube (Figure 25a). The rate at
which this volume reduction occurs diminishes over time
as the contained slurry inside the geotextile tube reduces
in hydraulic conductivity, and consequently the rate of
increase in solids concentration also slows.
The change in contained slurry volume within the
geotextile tube and the change in solids concentration are
interrelated. Suppose the geotextile tube is filled to an
initial volume V 0 with slurry of initial solids concentration
S 0 (Figure 25b). The geotextile tube is then allowed to
dewater for a period of timet , after which the contained volume of slurry within the geotextile tube has reduced to
V t , with a resulting solids concentration increase to S t . If
it is assumed that negligible solids escape from the
geotextile tube during the dewatering process, and the
solids concentration is constant throughout the contained
mass, then the following relationships between contained
slurry volume change and solids concentration change
apply.
The ratio of the contained slurry volume at time t
compared with that at time t ¼ 0 is
V t
V 0
¼1À S t
S t
þ1
G 0 1À S 0
S 0
þ1
G (7)
where V t , V 0, S t and S 0 are as shown in Figure 25b, and G
is the specific gravity of the contained slurry. The term
Refilling
Time
Contained
volume
Drying(optional)ConsolidationDewatering Dewatering Dewatering Dewatering
Refilling Refilling
Initial filling
Figure 24. Filling, dewatering and consolidation stages when using geotextile tubes
408 Lawson
Geosynthetics International , 2008, 15, No. 6
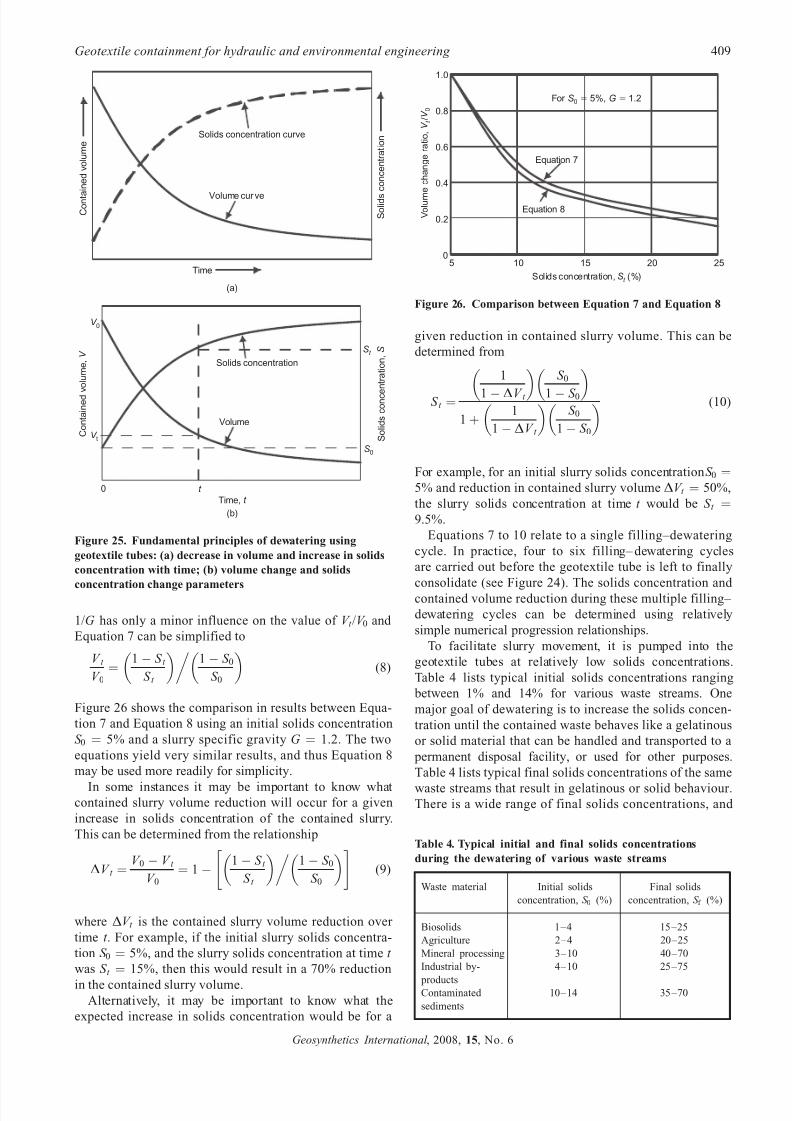
7/22/2019 Part 9 Reference Paper
http://slidepdf.com/reader/full/part-9-reference-paper 26/44
1/G has only a minor influence on the value of V t /V 0 and
Equation 7 can be simplified to
V t
V 0¼
1À S t
S t
01À S 0
S 0
(8)
Figure 26 shows the comparison in results between Equa-
tion 7 and Equation 8 using an initial solids concentration
S 0 ¼ 5% and a slurry specific gravity G ¼ 1.2. The two
equations yield very similar results, and thus Equation 8
may be used more readily for simplicity.
In some instances it may be important to know whatcontained slurry volume reduction will occur for a given
increase in solids concentration of the contained slurry.
This can be determined from the relationship
˜V t ¼V 0 À V t
V 0¼ 1À
1À S t
S t
01À S 0
S 0
" #(9)
where ˜V t is the contained slurry volume reduction over
time t . For example, if the initial slurry solids concentra-
tion S 0 ¼ 5%, and the slurry solids concentration at time t
was S t ¼ 15%, then this would result in a 70% reduction
in the contained slurry volume.Alternatively, it may be important to know what the
expected increase in solids concentration would be for a
given reduction in contained slurry volume. This can be
determined from
S t ¼
1
1À ˜V t S 0
1À S 0
1þ1
1À ˜V t
S 0
1À S 0
(10)
For example, for an initial slurry solids concentration S 0 ¼5% and reduction in contained slurry volume ˜V t ¼ 50%,
the slurry solids concentration at time t would be S t ¼9.5%.
Equations 7 to 10 relate to a single filling–dewatering
cycle. In practice, four to six filling– dewatering cycles
are carried out before the geotextile tube is left to finally
consolidate (see Figure 24). The solids concentration and contained volume reduction during these multiple filling–
dewatering cycles can be determined using relatively
simple numerical progression relationships.
To facilitate slurry movement, it is pumped into the
geotextile tubes at relatively low solids concentrations.
Table 4 lists typical initial solids concentrations ranging
between 1% and 14% for various waste streams. One
major goal of dewatering is to increase the solids concen-
tration until the contained waste behaves like a gelatinous
or solid material that can be handled and transported to a
permanent disposal facility, or used for other purposes.
Table 4 lists typical final solids concentrations of the same
waste streams that result in gelatinous or solid behaviour.There is a wide range of final solids concentrations, and
Time
Conta
inedvolume
Solids
concentration
Volume curve
Solids concentration curve
Time,
(b)
t
Containedv
olume, V
Solidsconce
ntration, S
Volume
Solids concentration
V 0
V t
S t
S 0
t 0
(a)
Figure 25. Fundamental principles of dewatering using
geotextile tubes: (a) decrease in volume and increase in solids
concentration with time; (b) volume change and solids
concentration change parameters
25201510
1.0
0.8
0.6
0.4
0.2
05
Solids concentration, (%)S t
Volum
echangeratio,
/ V
V t
0
Equation 7
Equation 8
For 5%, 1.2S G0 ϭ ϭ
Figure 26. Comparison between Equation 7 and Equation 8
Table 4. Typical initial and final solids concentrations
during the dewatering of various waste streams
Waste material Initial solids
concentration, S 0 (%)
Final solids
concentration, S f (%)
Biosolids 1–4 15–25
Agriculture 2–4 20–25
Mineral processing 3–10 40–70
Industrial by-
products
4–10 25–75
Contaminated
sediments
10–14 35–70
Geotextile containment for hydraulic and environmental engineering 409
Geosynthetics International , 2008, 15, No. 6
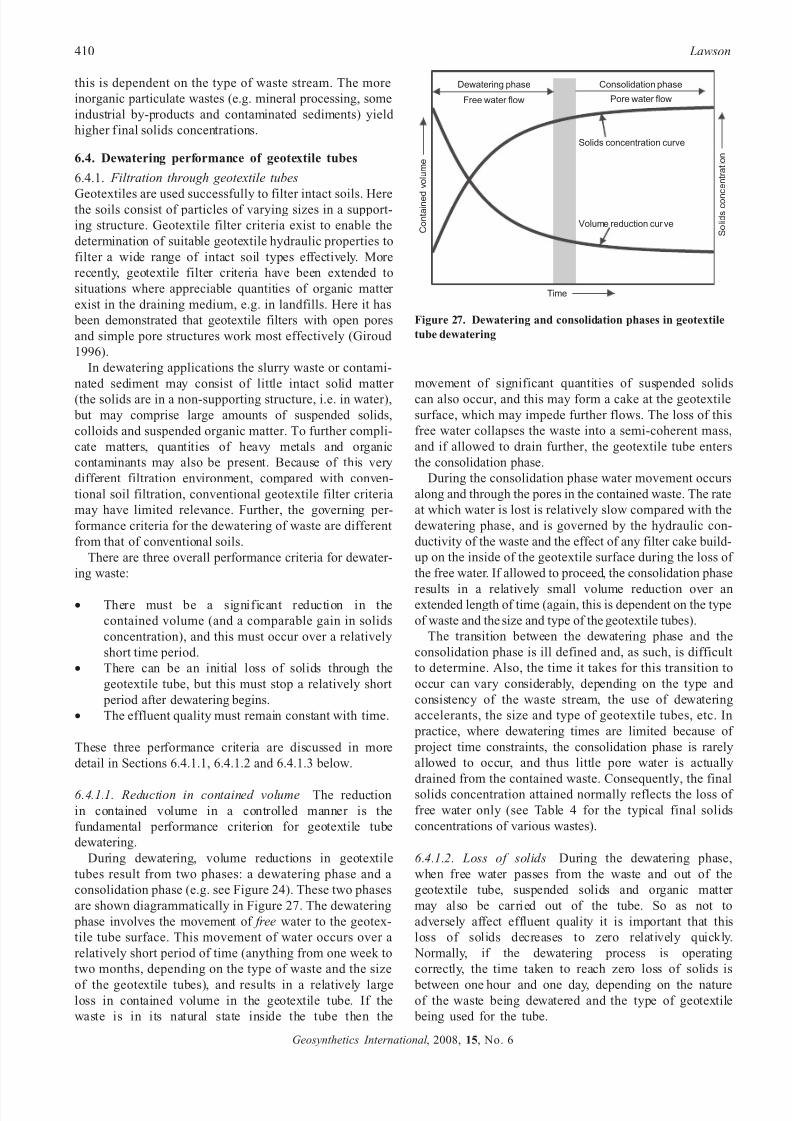
7/22/2019 Part 9 Reference Paper
http://slidepdf.com/reader/full/part-9-reference-paper 27/44
this is dependent on the type of waste stream. The more
inorganic particulate wastes (e.g. mineral processing, some
industrial by-products and contaminated sediments) yield
higher final solids concentrations.
6.4. Dewatering performance of geotextile tubes
6.4.1. Filtration through geotextile tubes
Geotextiles are used successfully to filter intact soils. Herethe soils consist of particles of varying sizes in a support-
ing structure. Geotextile filter criteria exist to enable the
determination of suitable geotextile hydraulic properties to
filter a wide range of intact soil types effectively. More
recently, geotextile filter criteria have been extended to
situations where appreciable quantities of organic matter
exist in the draining medium, e.g. in landfills. Here it has
been demonstrated that geotextile filters with open pores
and simple pore structures work most effectively (Giroud
1996).
In dewatering applications the slurry waste or contami-
nated sediment may consist of little intact solid matter
(the solids are in a non-supporting structure, i.e. in water),
but may comprise large amounts of suspended solids,
colloids and suspended organic matter. To further compli-
cate matters, quantities of heavy metals and organic
contaminants may also be present. Because of this very
different filtration environment, compared with conven-
tional soil filtration, conventional geotextile filter criteria
may have limited relevance. Further, the governing per-
formance criteria for the dewatering of waste are different
from that of conventional soils.
There are three overall performance criteria for dewater-
ing waste:
• There must be a significant reduction in the
contained volume (and a comparable gain in solids
concentration), and this must occur over a relatively
short time period.
• There can be an initial loss of solids through the
geotextile tube, but this must stop a relatively short
period after dewatering begins.
• The effluent quality must remain constant with time.
These three performance criteria are discussed in more
detail in Sections 6.4.1.1, 6.4.1.2 and 6.4.1.3 below.
6.4.1.1. Reduction in contained volume The reduction
in contained volume in a controlled manner is the
fundamental performance criterion for geotextile tube
dewatering.
During dewatering, volume reductions in geotextile
tubes result from two phases: a dewatering phase and a
consolidation phase (e.g. see Figure 24). These two phases
are shown diagrammatically in Figure 27. The dewatering
phase involves the movement of free water to the geotex-
tile tube surface. This movement of water occurs over a
relatively short period of time (anything from one week to
two months, depending on the type of waste and the size
of the geotextile tubes), and results in a relatively largeloss in contained volume in the geotextile tube. If the
waste is in its natural state inside the tube then the
movement of significant quantities of suspended solids
can also occur, and this may form a cake at the geotextile
surface, which may impede further flows. The loss of this
free water collapses the waste into a semi-coherent mass,
and if allowed to drain further, the geotextile tube enters
the consolidation phase.
During the consolidation phase water movement occurs
along and through the pores in the contained waste. The rate
at which water is lost is relatively slow compared with the
dewatering phase, and is governed by the hydraulic con-
ductivity of the waste and the effect of any filter cake build-
up on the inside of the geotextile surface during the loss of
the free water. If allowed to proceed, the consolidation phase
results in a relatively small volume reduction over anextended length of time (again, this is dependent on the type
of waste and the size and type of the geotextile tubes).
The transition between the dewatering phase and the
consolidation phase is ill defined and, as such, is difficult
to determine. Also, the time it takes for this transition to
occur can vary considerably, depending on the type and
consistency of the waste stream, the use of dewatering
accelerants, the size and type of geotextile tubes, etc. In
practice, where dewatering times are limited because of
project time constraints, the consolidation phase is rarely
allowed to occur, and thus little pore water is actually
drained from the contained waste. Consequently, the final
solids concentration attained normally reflects the loss of
free water only (see Table 4 for the typical final solids
concentrations of various wastes).
6.4.1.2. Loss of solids During the dewatering phase,
when free water passes from the waste and out of the
geotextile tube, suspended solids and organic matter
may also be carried out of the tube. So as not to
adversely affect effluent quality it is important that this
loss of solids decreases to zero relatively quickly.
Normally, if the dewatering process is operating
correctly, the time taken to reach zero loss of solids is
between one hour and one day, depending on the natureof the waste being dewatered and the type of geotextile
being used for the tube.
Consolidation phase
Time
Contained
volume
Solidscon
centration
Volume reduction curve
Solids concentration curve
Dewatering phase
Free water flow Pore water flow
Figure 27. Dewatering and consolidation phases in geotextile
tube dewatering
410 Lawson
Geosynthetics International , 2008, 15, No. 6
7/22/2019 Part 9 Reference Paper
http://slidepdf.com/reader/full/part-9-reference-paper 28/44
If solids and suspended organic matter continually flow
out of the geotextile tube with the effluent water, this may
have implications on any downstream effluent treatment.
As downstream effluent treatment processes can be rel-
atively costly it is important to minimise suspended solids
and suspended organic matter loss from the dewatering
tubes.
6.4.1.3. Effluent quality Effluent quality is governed by
the presence of suspended matter and dissolved solids
and compounds. The effluent quality determines
whether further downstream effluent treatment is
required before the water is passed into the environment
or recirculated.
To best control effluent quality it is important that no
suspended solids and organic matter are allowed to pass
out of the geotextile tubes during dewatering. One way of
achieving this is to use chemical dewatering accelerants
in the contained waste to collapse any suspended matter
and prevent its loss. This has an important secondary
effect, as the collapsed waste structure also reduces
significantly the loss of other pollutants (e.g. heavy
metals, organic compounds) from the tubes, thus improv-
ing effluent quality.
6.4.2. Evaluating geotextile tube performance
Wastes and their behaviour vary considerably, not only
between different waste streams but also from site to site.
Consequently, each new dewatering application undergoes
an evaluation programme in order to arrive at the optimal
geotextile tube dewatering solution. Figure 28 shows the
three stages of evaluation in order of complexity: initial
scoping (e.g. cone test), semi-performance (e.g. hanging bag test or geotextile tube dewatering test), and full
performance (e.g. full-scale prototype test).
Initial scoping tests, such as the cone test (Figure 28a),
are simple empirical laboratory or field tests that are used
for screening waste stream/chemical accelerant combina-
tions, and can also be used to give insight into final
percentage solids concentration, effluent quality and con-
tained volume reduction. They are simple to perform, and
multiple tests can be carried out easily.
Once the simple scoping tests have been done, it is
normal to continue to the next level of testing, the semi-
performance tests. These tests are carried out in the field,and attempt to model on a small scale the likely in-
service condition. To date, two semi-performance tests
have been developed: the hanging bag test (Figure 28b(i))
and the geotextile tube dewatering test (Figure 28b(ii)).
The hanging bag test (HBT) has been in existence for a
number of years: it utilises a piece of the planned
dewatering geotextile, 1.7 m long by 0.6 m wide, fash-
ioned into a bag. The slurry waste is poured into the top
of the bag and the amount of effluent, its quality and the
contained volume (or solids concentration) are recorded
over time. A draft ASTM standard exists for this test as
well as a draft GRI standard test method (GRI GT12
2004). This test is normally always used at the evaluationstage of every planned geotextile tube dewatering project.
It provides valuable performance information relating to
dewatering rates and effluent quality. A recent appraisal
of the hanging bag test is given by Koerner and Koerner
(2006). A more recent development of the semi-perform-
ance test is the geotextile tube dewatering test (Figure
28b(ii)). This test is simpler to operate than the hanging
bag test while providing the same performance data. The
test utilises a small cushion-shaped geotextile container,
with the slurry introduced via a pipe into the container.For new projects it is normal to carry out full perform-
ance testing, either by using a separate prototype tube or
by combining this testing with the first dewatering tube of
the project. The scale of the prototype testing can range
from a small-size tube to the full-size planned dewatering
tube (Figure 28c). The full performance testing is used to
confirm, or modify, the design assumptions derived from
smaller scale testing, e.g. HBT, and to allow the new
assumptions to be incorporated into the main project.
6.4.3. Rate of dewatering
The rate at which the dewatering process occurs is
dependent on the change in hydraulic conductivity of the
contained waste during dewatering and the filtration per-
formance of the geotextile skin in the geotextile tube. The
filtration performance is dependent on the hydraulic prop-
erties of the geotextile, the nature of the pore structures
within the geotextile, and its interaction with the contained
slurry waste. Several researchers have begun to analyse the
filtration rates of slurry wastes with various geotextile
filters in order to quantify performance parameters (e.g.
Moo-Young et al. 2002; Kutay and Aydilek 2004; Muthu-
kumaran and Ilamparuthi 2006; Huang and Luo 2007; Liao
and Bhatia 2008). To date, this research work has concen-
trated on the dewatering of natural sediments.An important dewatering performance parameter is the
time over which dewatering occurs. The dewatering time
must be consistent with the overall dewatering operation.
Normal dewatering operations require the dewatering time
to be between one and two months. Longer dewatering
times constrain the speed of waste processing and the
volumes that can be treated.
Maintaining the dewatering period within a relatively
short time frame normally requires the use of dewatering
accelerants, as the time frame associated with the dewater-
ing of sludges under normal conditions can be long and
the process inefficient.
6.5. Use of dewatering accelerants
Slurry wastes and contaminated sediments consist of little
intact solid matter, but comprise large amounts of sus-
pended solids, colloids and (possibly) suspended organic
matter. Also present can be significant quantities of heavy
metals and/or organic contaminants. To dewater effi-
ciently, the geotextile tube must retain much of the solids
and organic matter and control the passage of any heavy
metals and organic contaminants, while allowing the water
to pass. Further, for practical purposes, the loss of water
must occur in a relatively short time period. Meeting thesetwo conflicting requirements has led to the common use
of dewatering accelerants.
Geotextile containment for hydraulic and environmental engineering 411
Geosynthetics International , 2008, 15, No. 6
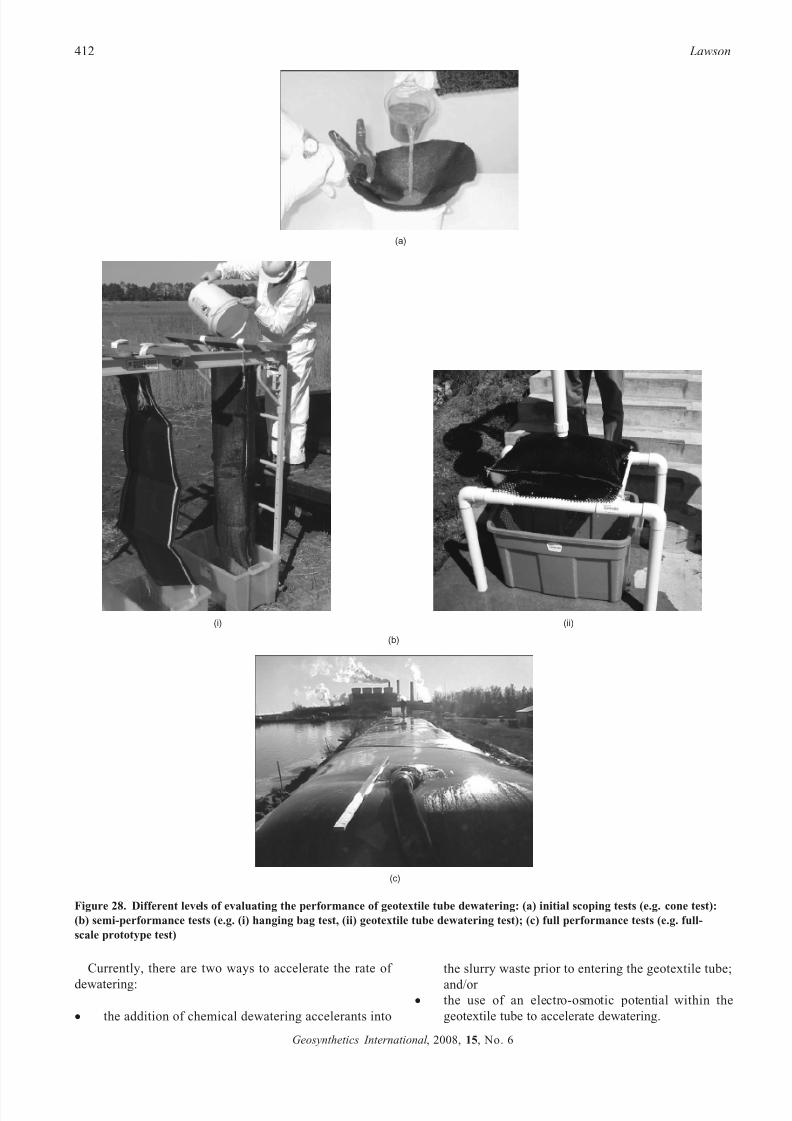
7/22/2019 Part 9 Reference Paper
http://slidepdf.com/reader/full/part-9-reference-paper 29/44
Currently, there are two ways to accelerate the rate of
dewatering:
• the addition of chemical dewatering accelerants into
the slurry waste prior to entering the geotextile tube;
and/or • the use of an electro-osmotic potential within the
geotextile tube to accelerate dewatering.
(ii)
(c)
(i)
(b)
(a)
Figure 28. Different levels of evaluating the performance of geotextile tube dewatering: (a) initial scoping tests (e.g. cone test):
(b) semi-performance tests (e.g. (i) hanging bag test, (ii) geotextile tube dewatering test); (c) full performance tests (e.g. full-
scale prototype test)
412 Lawson
Geosynthetics International , 2008, 15, No. 6
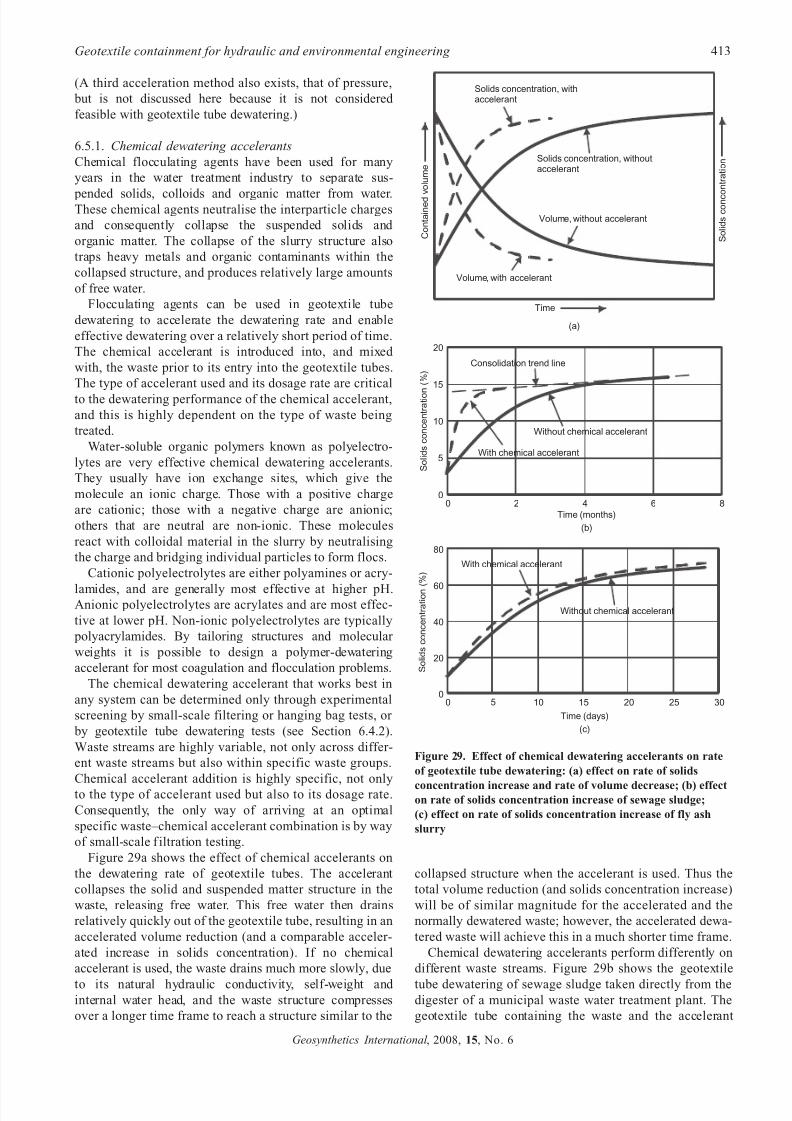
7/22/2019 Part 9 Reference Paper
http://slidepdf.com/reader/full/part-9-reference-paper 30/44
(A third acceleration method also exists, that of pressure,
but is not discussed here because it is not considered
feasible with geotextile tube dewatering.)
6.5.1. Chemical dewatering accelerants
Chemical flocculating agents have been used for many
years in the water treatment industry to separate sus-
pended solids, colloids and organic matter from water.These chemical agents neutralise the interparticle charges
and consequently collapse the suspended solids and
organic matter. The collapse of the slurry structure also
traps heavy metals and organic contaminants within the
collapsed structure, and produces relatively large amounts
of free water.
Flocculating agents can be used in geotextile tube
dewatering to accelerate the dewatering rate and enable
effective dewatering over a relatively short period of time.
The chemical accelerant is introduced into, and mixed
with, the waste prior to its entry into the geotextile tubes.
The type of accelerant used and its dosage rate are critical
to the dewatering performance of the chemical accelerant,
and this is highly dependent on the type of waste being
treated.
Water-soluble organic polymers known as polyelectro-
lytes are very effective chemical dewatering accelerants.
They usually have ion exchange sites, which give the
molecule an ionic charge. Those with a positive charge
are cationic; those with a negative charge are anionic;
others that are neutral are non-ionic. These molecules
react with colloidal material in the slurry by neutralising
the charge and bridging individual particles to form flocs.
Cationic polyelectrolytes are either polyamines or acry-
lamides, and are generally most effective at higher pH.Anionic polyelectrolytes are acrylates and are most effec-
tive at lower pH. Non-ionic polyelectrolytes are typically
polyacrylamides. By tailoring structures and molecular
weights it is possible to design a polymer-dewatering
accelerant for most coagulation and flocculation problems.
The chemical dewatering accelerant that works best in
any system can be determined only through experimental
screening by small-scale filtering or hanging bag tests, or
by geotextile tube dewatering tests (see Section 6.4.2).
Waste streams are highly variable, not only across differ-
ent waste streams but also within specific waste groups.
Chemical accelerant addition is highly specific, not only
to the type of accelerant used but also to its dosage rate.
Consequently, the only way of arriving at an optimal
specific waste–chemical accelerant combination is by way
of small-scale f iltration testing.
Figure 29a shows the effect of chemical accelerants on
the dewatering rate of geotextile tubes. The accelerant
collapses the solid and suspended matter structure in the
waste, releasing free water. This free water then drains
relatively quickly out of the geotextile tube, resulting in an
accelerated volume reduction (and a comparable acceler-
ated increase in solids concentration). If no chemical
accelerant is used, the waste drains much more slowly, due
to its natural hydraulic conductivity, self-weight and internal water head, and the waste structure compresses
over a longer time frame to reach a structure similar to the
collapsed structure when the accelerant is used. Thus the
total volume reduction (and solids concentration increase)
will be of similar magnitude for the accelerated and the
normally dewatered waste; however, the accelerated dewa-
tered waste will achieve this in a much shorter time frame.
Chemical dewatering accelerants perform differently on
different waste streams. Figure 29b shows the geotextile
tube dewatering of sewage sludge taken directly from thedigester of a municipal waste water treatment plant. The
geotextile tube containing the waste and the accelerant
Time
Containedvolume
Solidsconcontration
Volume, without accelerant
Volume, with accelerant
Solids concentration, withoutaccelerant
Solids concentration, withaccelerant
86
30252015
20
15
10
5
0
Solidsconcentration
(%)
0 2 4
Time (months)
(b)
Without chemical accelerant
With chemical accelerant
Consolidation trend line
80
60
40
20
0
Solidsconcentration(%)
0 5 10
Time (days)
(c)
Without chemical accelerant
With chemical accelerant
(a)
Figure 29. Effect of chemical dewatering accelerants on rate
of geotextile tube dewatering: (a) effect on rate of solids
concentration increase and rate of volume decrease; (b) effecton rate of solids concentration increase of sewage sludge;
(c) effect on rate of solids concentration increase of fly ash
slurry
Geotextile containment for hydraulic and environmental engineering 413
Geosynthetics International , 2008, 15, No. 6
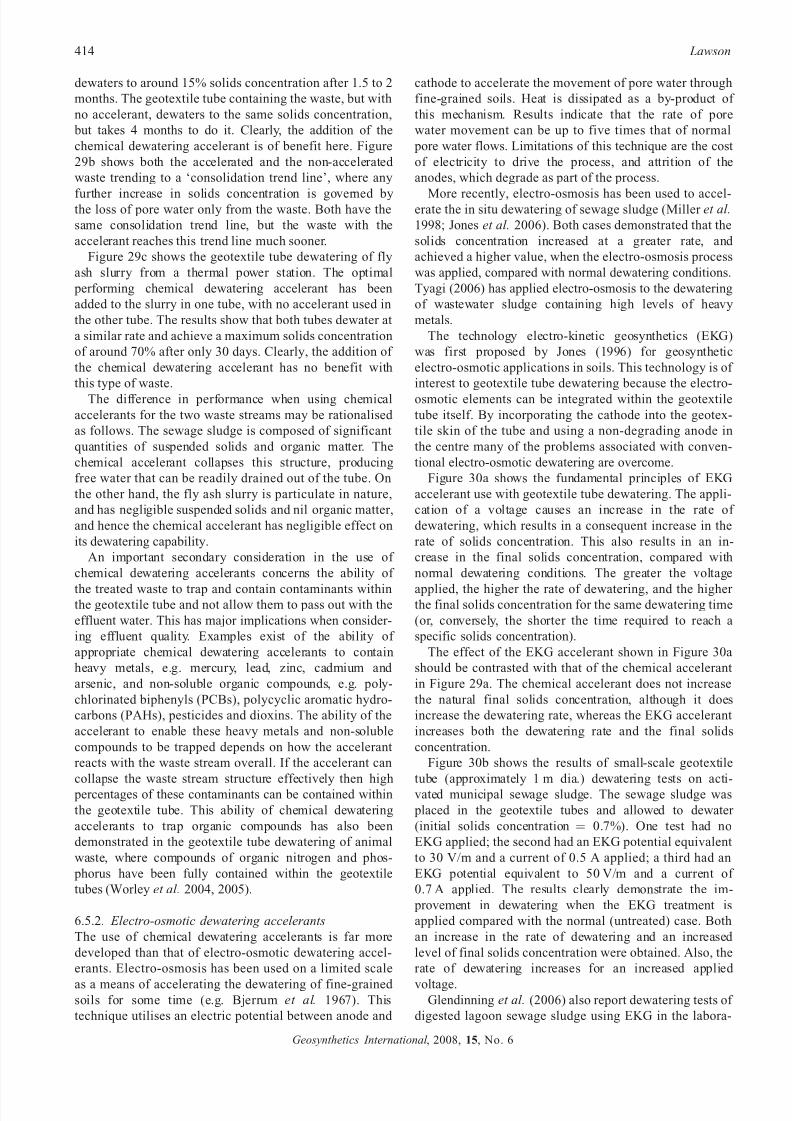
7/22/2019 Part 9 Reference Paper
http://slidepdf.com/reader/full/part-9-reference-paper 31/44
dewaters to around 15% solids concentration after 1.5 to 2
months. The geotextile tube containing the waste, but with
no accelerant, dewaters to the same solids concentration,
but takes 4 months to do it. Clearly, the addition of the
chemical dewatering accelerant is of benefit here. Figure
29b shows both the accelerated and the non-accelerated
waste trending to a ‘consolidation trend line’, where any
further increase in solids concentration is governed bythe loss of pore water only from the waste. Both have the
same consolidation trend line, but the waste with the
accelerant reaches this trend line much sooner.
Figure 29c shows the geotextile tube dewatering of fly
ash slurry from a thermal power station. The optimal
performing chemical dewatering accelerant has been
added to the slurry in one tube, with no accelerant used in
the other tube. The results show that both tubes dewater at
a similar rate and achieve a maximum solids concentration
of around 70% after only 30 days. Clearly, the addition of
the chemical dewatering accelerant has no benefit with
this type of waste.
The difference in performance when using chemical
accelerants for the two waste streams may be rationalised
as follows. The sewage sludge is composed of significant
quantities of suspended solids and organic matter. The
chemical accelerant collapses this structure, producing
free water that can be readily drained out of the tube. On
the other hand, the fly ash slurry is particulate in nature,
and has negligible suspended solids and nil organic matter,
and hence the chemical accelerant has negligible effect on
its dewatering capability.
An important secondary consideration in the use of
chemical dewatering accelerants concerns the ability of
the treated waste to trap and contain contaminants withinthe geotextile tube and not allow them to pass out with the
effluent water. This has major implications when consider-
ing effluent quality. Examples exist of the ability of
appropriate chemical dewatering accelerants to contain
heavy metals, e.g. mercury, lead, zinc, cadmium and
arsenic, and non-soluble organic compounds, e.g. poly-
chlorinated biphenyls (PCBs), polycyclic aromatic hydro-
carbons (PAHs), pesticides and dioxins. The ability of the
accelerant to enable these heavy metals and non-soluble
compounds to be trapped depends on how the accelerant
reacts with the waste stream overall. If the accelerant can
collapse the waste stream structure effectively then high
percentages of these contaminants can be contained within
the geotextile tube. This ability of chemical dewatering
accelerants to trap organic compounds has also been
demonstrated in the geotextile tube dewatering of animal
waste, where compounds of organic nitrogen and phos-
phorus have been fully contained within the geotextile
tubes (Worley et al. 2004, 2005).
6.5.2. Electro-osmotic dewatering accelerants
The use of chemical dewatering accelerants is far more
developed than that of electro-osmotic dewatering accel-
erants. Electro-osmosis has been used on a limited scale
as a means of accelerating the dewatering of fine-grained soils for some time (e.g. Bjerrum et al. 1967). This
technique utilises an electric potential between anode and
cathode to accelerate the movement of pore water through
fine-grained soils. Heat is dissipated as a by-product of
this mechanism. Results indicate that the rate of pore
water movement can be up to five times that of normal
pore water flows. Limitations of this technique are the cost
of electricity to drive the process, and attrition of the
anodes, which degrade as part of the process.
More recently, electro-osmosis has been used to accel-erate the in situ dewatering of sewage sludge (Miller et al.
1998; Jones et al. 2006). Both cases demonstrated that the
solids concentration increased at a greater rate, and
achieved a higher value, when the electro-osmosis process
was applied, compared with normal dewatering conditions.
Tyagi (2006) has applied electro-osmosis to the dewatering
of wastewater sludge containing high levels of heavy
metals.
The technology electro-kinetic geosynthetics (EKG)
was first proposed by Jones (1996) for geosynthetic
electro-osmotic applications in soils. This technology is of
interest to geotextile tube dewatering because the electro-
osmotic elements can be integrated within the geotextile
tube itself. By incorporating the cathode into the geotex-
tile skin of the tube and using a non-degrading anode in
the centre many of the problems associated with conven-
tional electro-osmotic dewatering are overcome.
Figure 30a shows the fundamental principles of EKG
accelerant use with geotextile tube dewatering. The appli-
cation of a voltage causes an increase in the rate of
dewatering, which results in a consequent increase in the
rate of solids concentration. This also results in an in-
crease in the final solids concentration, compared with
normal dewatering conditions. The greater the voltage
applied, the higher the rate of dewatering, and the higher the final solids concentration for the same dewatering time
(or, conversely, the shorter the time required to reach a
specific solids concentration).
The effect of the EKG accelerant shown in Figure 30a
should be contrasted with that of the chemical accelerant
in Figure 29a. The chemical accelerant does not increase
the natural final solids concentration, although it does
increase the dewatering rate, whereas the EKG accelerant
increases both the dewatering rate and the final solids
concentration.
Figure 30b shows the results of small-scale geotextile
tube (approximately 1 m dia.) dewatering tests on acti-
vated municipal sewage sludge. The sewage sludge was
placed in the geotextile tubes and allowed to dewater
(initial solids concentration ¼ 0.7%). One test had no
EKG applied; the second had an EKG potential equivalent
to 30 V/m and a current of 0.5 A applied; a third had an
EKG potential equivalent to 50 V/m and a current of
0.7 A applied. The results clearly demonstrate the im-
provement in dewatering when the EKG treatment is
applied compared with the normal (untreated) case. Both
an increase in the rate of dewatering and an increased
level of final solids concentration were obtained. Also, the
rate of dewatering increases for an increased applied
voltage.Glendinning et al. (2006) also report dewatering tests of
digested lagoon sewage sludge using EKG in the labora-
414 Lawson
Geosynthetics International , 2008, 15, No. 6
7/22/2019 Part 9 Reference Paper
http://slidepdf.com/reader/full/part-9-reference-paper 32/44
tory. Using an applied voltage of 100 V/m, solids concen-
tration increased from around 14% (initially) to 23% and
27% (for the two tests) after 21 days. This results in a
volume reduction of 40% and 50%, respectively, for the
two tests.
Fourie et al. (2002, 2004) have used the EKG technique
to dewater in situ fine-grained residue from mineral sands
processing, diamond mine tailings and lead–zinc mine
tailings. All results showed increased dewatering rates and
higher final solids concentration when the EKG technique
was applied. While the test programme did not include
geotextile tubes, it is considered that the results would be
comparable had they been used as the containment/
dewatering medium.
Accelerated dewatering using the EKG technique with
geotextile tubes has very interesting potential. However,
more work is required to quantify the performance
benefits for a range of slurry-like waste streams.
6.6. Volumes of slurry dewatered and flow ratesTo ensure that a dewatering operation proceeds as planned,
a volume or rate balance between the amount of slurry
entering the geotextile tube dewatering system and the
amounts of liquid and solids exiting the system must be
maintained. The whole dewatering system has to be
designed in an effective hydraulic manner to ensure this
balance is maintained.
The amount of slurry waste to be dewatered and treated
is normally expressed in terms of a total volume or a
known flow rate. Volume amounts are usually given if aspecific volume is to be removed from lagoons, digesters,
lakes, rivers, etc. Alternatively, known flow rates are
usually given if it involves output from a process such as
an industrial or mining operation or a treatment plant.
The characteristics of the waste slurry should be known,
such as the specific gravity, the solids concentration
during pumping, the solids concentration in place in the
geotextile tubes, the target dewatered solids concentration,
the dewatering rate, and the concentration of coarse
material (sand, etc.). The target dewatered solids concen-
tration and dewatering rate should be derived from an
evaluation of geotextile tube dewatering performance with
the specific waste stream (see Section 6.4.2), and should
account for the effect of dewatering accelerants etc., if
relevant. Coarse material in the waste does not undergo a
volume change during dewatering, but does affect the total
volume of dewatered solids produced.
The above parameters enable the determination of the
dewatered solids volume and rate of effluent water
production. The dewatered solids can be disposed of on
site or off site, or may be recycled, etc. The quality of the
effluent water produced determines its use and whether
further downstream treatment is required. The effluent
water may be recirculated or, if it is of good quality, can
be passed to the environment.The above parameters also enable the determination of
the quantity and sizes of geotextile tubes required to
dewater the waste stream. The capacity of the geotextile
tubes is also affected by the heights to which they can be
filled. The allowable geotextile tube filling height also
influences the size of tube used, as this governs the
magnitude of the tensions generated in the tube during
filling, and affects the required ultimate tensile strength of
the geotextile skin. This is discussed in the section below.
While geotextile tubes are the most common means of
dewatering, geotextile bags have also been used if the
volumes are small. In some instances, to aid portability,
geotextile bags are maintained inside steel containers
during filling and transport to an off-site disposal facility.
6.7. Filling heights and tensions generated in
geotextile tubes during dewatering, and ultimate
tensile strength requirements
The tensions generated in geotextile tubes for dewatering
are similar to those for hydraulic and marine applications
(Section 3.4.1). During f illing, tensions are generated in
three locations in the tube units: around the circumference
of the tubes, along the length of the tubes, and at
the connection of the filling ports with the tubes (see
Figure 6).When slurry waste is used for filling the tubes, the
tensions generated in the circumferential and longitudinal
Time
Solidsconcentration
Solids concentration, without EKG
Solids concentration, with EKGIncreasing voltage
80604020
40
30
20
10
0
Solidsconcentration(%)
0
Time (h)
(b)
Without EKG
With EKG, 30 V/m
With EKG, 50 V/m
(a)
Figure 30. Effect of EKG accelerant on rate of geotextile
tube dewatering: (a) effect on rate of solids concentration
increase; (b) effect on dewatering rate of sewage sludge
Geotextile containment for hydraulic and environmental engineering 415
Geosynthetics International , 2008, 15, No. 6
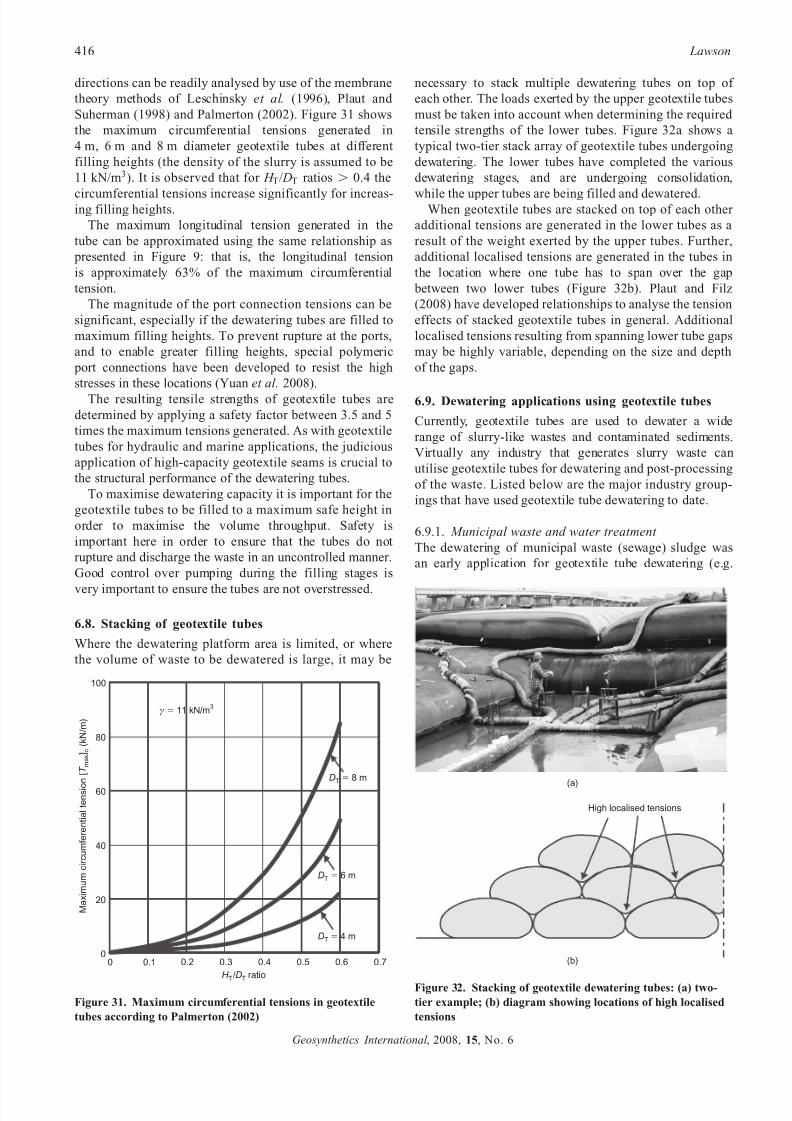
7/22/2019 Part 9 Reference Paper
http://slidepdf.com/reader/full/part-9-reference-paper 33/44
directions can be readily analysed by use of the membrane
theory methods of Leschinsky et al. (1996), Plaut and
Suherman (1998) and Palmerton (2002). Figure 31 shows
the maximum circumferential tensions generated in
4 m, 6 m and 8 m diameter geotextile tubes at different
filling heights (the density of the slurry is assumed to be
11 kN/m3). It is observed that for H T/ DT ratios . 0.4 the
circumferential tensions increase significantly for increas-ing filling heights.
The maximum longitudinal tension generated in the
tube can be approximated using the same relationship as
presented in Figure 9: that is, the longitudinal tension
is approximately 63% of the maximum circumferential
tension.
The magnitude of the port connection tensions can be
significant, especially if the dewatering tubes are filled to
maximum filling heights. To prevent rupture at the ports,
and to enable greater filling heights, special polymeric
port connections have been developed to resist the high
stresses in these locations (Yuan et al. 2008).
The resulting tensile strengths of geotextile tubes are
determined by applying a safety factor between 3.5 and 5
times the maximum tensions generated. As with geotextile
tubes for hydraulic and marine applications, the judicious
application of high-capacity geotextile seams is crucial to
the structural performance of the dewatering tubes.
To maximise dewatering capacity it is important for the
geotextile tubes to be filled to a maximum safe height in
order to maximise the volume throughput. Safety is
important here in order to ensure that the tubes do not
rupture and discharge the waste in an uncontrolled manner.
Good control over pumping during the filling stages is
very important to ensure the tubes are not overstressed.
6.8. Stacking of geotextile tubes
Where the dewatering platform area is limited, or where
the volume of waste to be dewatered is large, it may be
necessary to stack multiple dewatering tubes on top of
each other. The loads exerted by the upper geotextile tubes
must be taken into account when determining the required
tensile strengths of the lower tubes. Figure 32a shows a
typical two-tier stack array of geotextile tubes undergoing
dewatering. The lower tubes have completed the various
dewatering stages, and are undergoing consolidation,
while the upper tubes are being filled and dewatered.When geotextile tubes are stacked on top of each other
additional tensions are generated in the lower tubes as a
result of the weight exerted by the upper tubes. Further,
additional localised tensions are generated in the tubes in
the location where one tube has to span over the gap
between two lower tubes (Figure 32b). Plaut and Filz
(2008) have developed relationships to analyse the tension
effects of stacked geotextile tubes in general. Additional
localised tensions resulting from spanning lower tube gaps
may be highly variable, depending on the size and depth
of the gaps.
6.9. Dewatering applications using geotextile tubes
Currently, geotextile tubes are used to dewater a wide
range of slurry-like wastes and contaminated sediments.
Virtually any industry that generates slurry waste can
utilise geotextile tubes for dewatering and post-processing
of the waste. Listed below are the major industry group-
ings that have used geotextile tube dewatering to date.
6.9.1. Municipal waste and water treatment
The dewatering of municipal waste (sewage) sludge was
an early application for geotextile tube dewatering (e.g.
0.70.60.50.40.30.2
100
80
60
40
20
0
Maximum
circumferentialtension
[
](kN/m)
Tm
a x c
0
H DT T/ ratio
0.1
DT 4 mϭ
DT 6 mϭ
DT 8 mϭ
γ 11 kN/mϭ3
Figure 31. Maximum circumferential tensions in geotextile
tubes according to Palmerton (2002)
(b)
(a)
High localised tensions
Figure 32. Stacking of geotextile dewatering tubes: (a) two-
tier example; (b) diagram showing locations of high localised
tensions
416 Lawson
Geosynthetics International , 2008, 15, No. 6
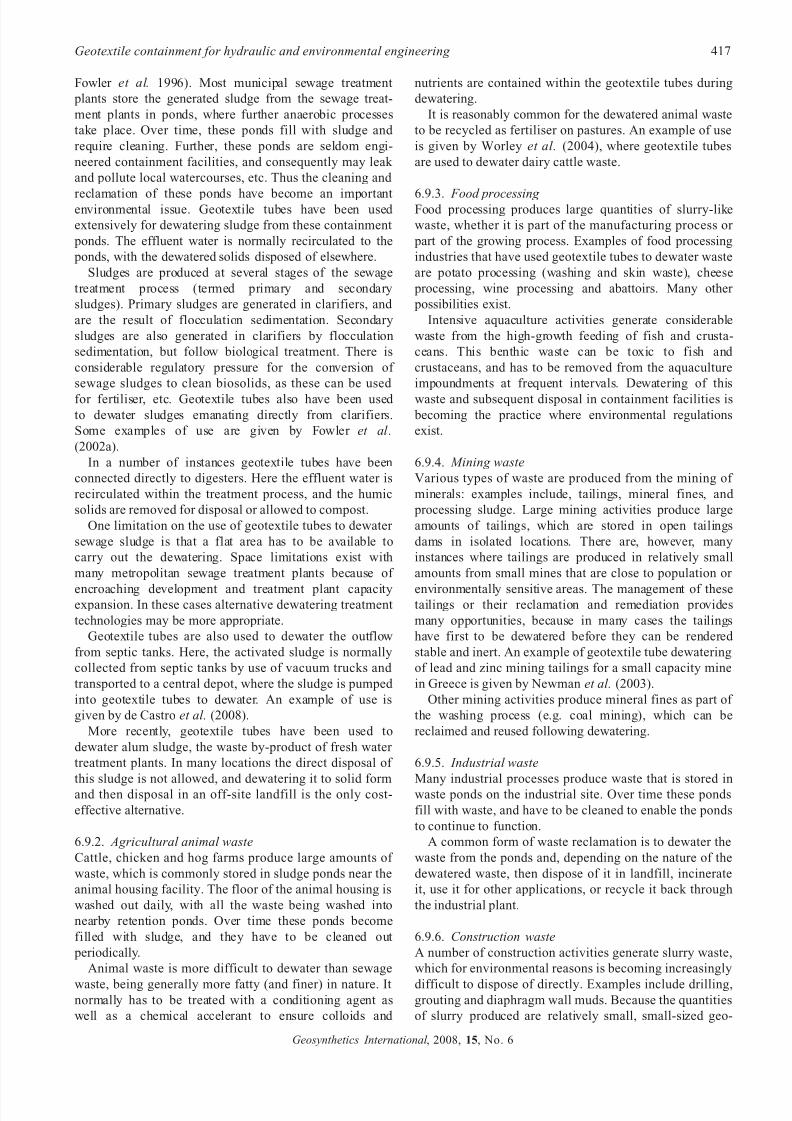
7/22/2019 Part 9 Reference Paper
http://slidepdf.com/reader/full/part-9-reference-paper 34/44
Fowler et al. 1996). Most municipal sewage treatment
plants store the generated sludge from the sewage treat-
ment plants in ponds, where further anaerobic processes
take place. Over time, these ponds fill with sludge and
require cleaning. Further, these ponds are seldom engi-
neered containment facilities, and consequently may leak
and pollute local watercourses, etc. Thus the cleaning and
reclamation of these ponds have become an importantenvironmental issue. Geotextile tubes have been used
extensively for dewatering sludge from these containment
ponds. The effluent water is normally recirculated to the
ponds, with the dewatered solids disposed of elsewhere.
Sludges are produced at several stages of the sewage
treatment process (termed primary and secondary
sludges). Primary sludges are generated in clarifiers, and
are the result of flocculation sedimentation. Secondary
sludges are also generated in clarifiers by flocculation
sedimentation, but follow biological treatment. There is
considerable regulatory pressure for the conversion of
sewage sludges to clean biosolids, as these can be used
for fertiliser, etc. Geotextile tubes also have been used
to dewater sludges emanating directly from clarifiers.
Some examples of use are given by Fowler et al.
(2002a).
In a number of instances geotextile tubes have been
connected directly to digesters. Here the effluent water is
recirculated within the treatment process, and the humic
solids are removed for disposal or allowed to compost.
One limitation on the use of geotextile tubes to dewater
sewage sludge is that a flat area has to be available to
carry out the dewatering. Space limitations exist with
many metropolitan sewage treatment plants because of
encroaching development and treatment plant capacityexpansion. In these cases alternative dewatering treatment
technologies may be more appropriate.
Geotextile tubes are also used to dewater the outflow
from septic tanks. Here, the activated sludge is normally
collected from septic tanks by use of vacuum trucks and
transported to a central depot, where the sludge is pumped
into geotextile tubes to dewater. An example of use is
given by de Castro et al. (2008).
More recently, geotextile tubes have been used to
dewater alum sludge, the waste by-product of fresh water
treatment plants. In many locations the direct disposal of
this sludge is not allowed, and dewatering it to solid form
and then disposal in an off-site landfill is the only cost-
effective alternative.
6.9.2. Agricultural animal waste
Cattle, chicken and hog farms produce large amounts of
waste, which is commonly stored in sludge ponds near the
animal housing facility. The floor of the animal housing is
washed out daily, with all the waste being washed into
nearby retention ponds. Over time these ponds become
filled with sludge, and they have to be cleaned out
periodically.
Animal waste is more difficult to dewater than sewage
waste, being generally more fatty (and finer) in nature. Itnormally has to be treated with a conditioning agent as
well as a chemical accelerant to ensure colloids and
nutrients are contained within the geotextile tubes during
dewatering.
It is reasonably common for the dewatered animal waste
to be recycled as fertiliser on pastures. An example of use
is given by Worley et al. (2004), where geotextile tubes
are used to dewater dairy cattle waste.
6.9.3. Food processing Food processing produces large quantities of slurry-like
waste, whether it is part of the manufacturing process or
part of the growing process. Examples of food processing
industries that have used geotextile tubes to dewater waste
are potato processing (washing and skin waste), cheese
processing, wine processing and abattoirs. Many other
possibilities exist.
Intensive aquaculture activities generate considerable
waste from the high-growth feeding of fish and crusta-
ceans. This benthic waste can be toxic to fish and
crustaceans, and has to be removed from the aquaculture
impoundments at frequent intervals. Dewatering of this
waste and subsequent disposal in containment facilities is
becoming the practice where environmental regulations
exist.
6.9.4. Mining waste
Various types of waste are produced from the mining of
minerals: examples include, tailings, mineral fines, and
processing sludge. Large mining activities produce large
amounts of tailings, which are stored in open tailings
dams in isolated locations. There are, however, many
instances where tailings are produced in relatively small
amounts from small mines that are close to population or
environmentally sensitive areas. The management of thesetailings or their reclamation and remediation provides
many opportunities, because in many cases the tailings
have first to be dewatered before they can be rendered
stable and inert. An example of geotextile tube dewatering
of lead and zinc mining tailings for a small capacity mine
in Greece is given by Newman et al. (2003).
Other mining activities produce mineral fines as part of
the washing process (e.g. coal mining), which can be
reclaimed and reused following dewatering.
6.9.5. Industrial waste
Many industrial processes produce waste that is stored in
waste ponds on the industrial site. Over time these ponds
fill with waste, and have to be cleaned to enable the ponds
to continue to function.
A common form of waste reclamation is to dewater the
waste from the ponds and, depending on the nature of the
dewatered waste, then dispose of it in landfill, incinerate
it, use it for other applications, or recycle it back through
the industrial plant.
6.9.6. Construction waste
A number of construction activities generate slurry waste,
which for environmental reasons is becoming increasingly
difficult to dispose of directly. Examples include drilling,grouting and diaphragm wall muds. Because the quantities
of slurry produced are relatively small, small-sized geo-
Geotextile containment for hydraulic and environmental engineering 417
Geosynthetics International , 2008, 15, No. 6
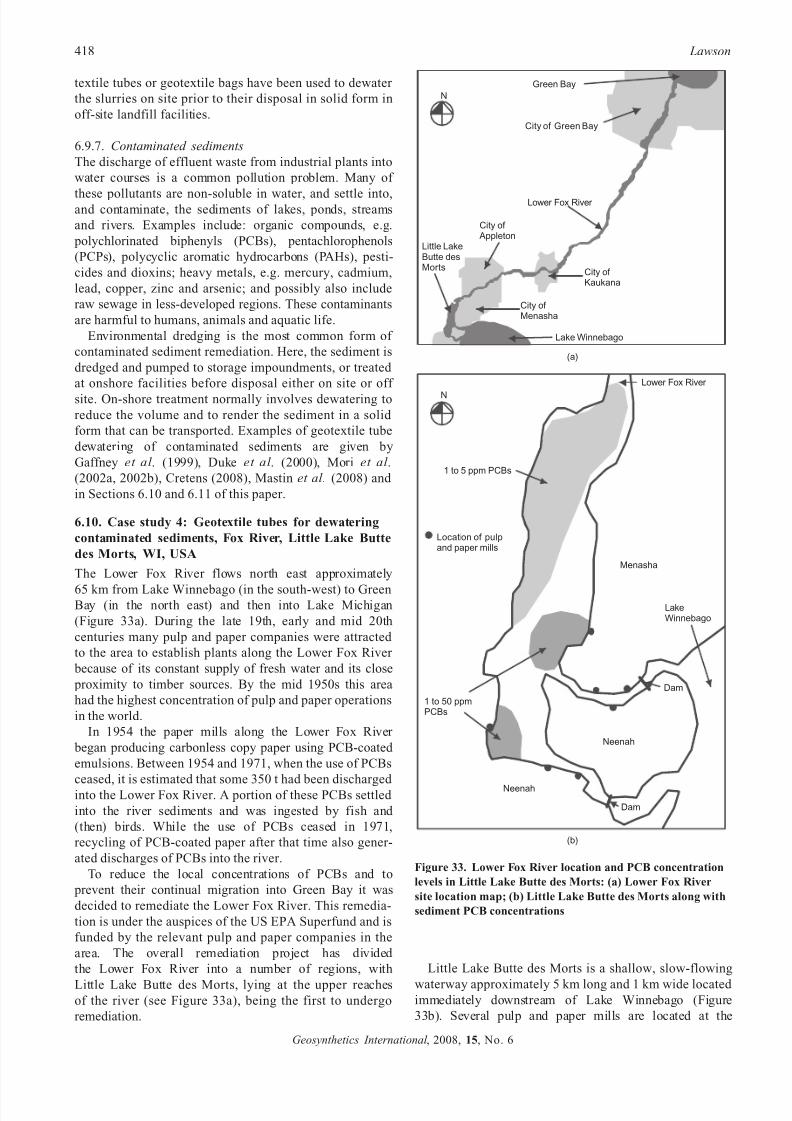
7/22/2019 Part 9 Reference Paper
http://slidepdf.com/reader/full/part-9-reference-paper 35/44
textile tubes or geotextile bags have been used to dewater
the slurries on site prior to their disposal in solid form in
off-site landfill facilities.
6.9.7. Contaminated sediments
The discharge of effluent waste from industrial plants into
water courses is a common pollution problem. Many of
these pollutants are non-soluble in water, and settle into,and contaminate, the sediments of lakes, ponds, streams
and rivers. Examples include: organic compounds, e.g.
polychlorinated biphenyls (PCBs), pentachlorophenols
(PCPs), polycyclic aromatic hydrocarbons (PAHs), pesti-
cides and dioxins; heavy metals, e.g. mercury, cadmium,
lead, copper, zinc and arsenic; and possibly also include
raw sewage in less-developed regions. These contaminants
are harmful to humans, animals and aquatic life.
Environmental dredging is the most common form of
contaminated sediment remediation. Here, the sediment is
dredged and pumped to storage impoundments, or treated
at onshore facilities before disposal either on site or off
site. On-shore treatment normally involves dewatering to
reduce the volume and to render the sediment in a solid
form that can be transported. Examples of geotextile tube
dewatering of contaminated sediments are given by
Gaffney et al . (1999), Duke et al . (2000), Mori et al .
(2002a, 2002b), Cretens (2008), Mastin et al. (2008) and
in Sections 6.10 and 6.11 of this paper.
6.10. Case study 4: Geotextile tubes for dewatering
contaminated sediments, Fox River, Little Lake Butte
des Morts, WI, USA
The Lower Fox River flows north east approximately
65 km from Lake Winnebago (in the south-west) to GreenBay (in the north east) and then into Lake Michigan
(Figure 33a). During the late 19th, early and mid 20th
centuries many pulp and paper companies were attracted
to the area to establish plants along the Lower Fox River
because of its constant supply of fresh water and its close
proximity to timber sources. By the mid 1950s this area
had the highest concentration of pulp and paper operations
in the world.
In 1954 the paper mills along the Lower Fox River
began producing carbonless copy paper using PCB-coated
emulsions. Between 1954 and 1971, when the use of PCBs
ceased, it is estimated that some 350 t had been discharged into the Lower Fox River. A portion of these PCBs settled
into the river sediments and was ingested by fish and
(then) birds. While the use of PCBs ceased in 1971,
recycling of PCB-coated paper after that time also gener-
ated discharges of PCBs into the river.
To reduce the local concentrations of PCBs and to
prevent their continual migration into Green Bay it was
decided to remediate the Lower Fox River. This remedia-
tion is under the auspices of the US EPA Superfund and is
funded by the relevant pulp and paper companies in the
area. The overall remediation project has divided
the Lower Fox River into a number of regions, with
Little Lake Butte des Morts, lying at the upper reachesof the river (see Figure 33a), being the first to undergo
remediation.
Little Lake Butte des Morts is a shallow, slow-flowing
waterway approximately 5 km long and 1 km wide located immediately downstream of Lake Winnebago (Figure
33b). Several pulp and paper mills are located at the
City of Green Bay
Green Bay
City of Appleton
City of Menasha
Lower Fox River
City of Kaukana
Lake Winnebago
Little LakeButte desMorts
N
Menasha
LakeWinnebago
Lower Fox River
Location of pulpand paper mills
1 to 5 ppm PCBs
1 to 50 ppmPCBs
N
(a)
(b)
Neenah
Neenah
Dam
Dam
Figure 33. Lower Fox River location and PCB concentration
levels in Little Lake Butte des Morts: (a) Lower Fox River
site location map; (b) Little Lake Butte des Morts along with
sediment PCB concentrations
418 Lawson
Geosynthetics International , 2008, 15, No. 6
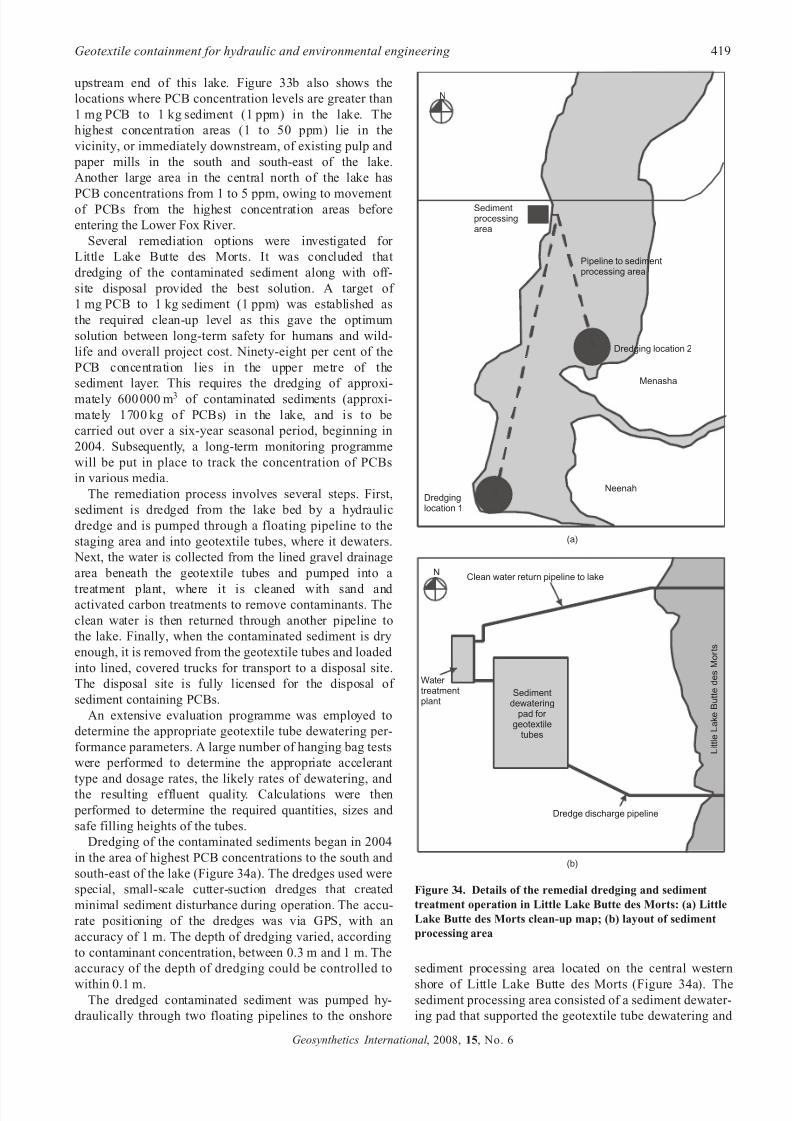
7/22/2019 Part 9 Reference Paper
http://slidepdf.com/reader/full/part-9-reference-paper 36/44
upstream end of this lake. Figure 33b also shows the
locations where PCB concentration levels are greater than
1 mg PCB to 1 kg sediment (1 ppm) in the lake. The
highest concentration areas (1 to 50 ppm) lie in the
vicinity, or immediately downstream, of existing pulp and
paper mills in the south and south-east of the lake.
Another large area in the central north of the lake has
PCB concentrations from 1 to 5 ppm, owing to movementof PCBs from the highest concentration areas before
entering the Lower Fox River.
Several remediation options were investigated for
Little Lake Butte des Morts. It was concluded that
dredging of the contaminated sediment along with off-
site disposal provided the best solution. A target of
1 mg PCB to 1 kg sediment (1 ppm) was established as
the required clean-up level as this gave the optimum
solution between long-term safety for humans and wild-
life and overall project cost. Ninety-eight per cent of the
PCB concentration lies in the upper metre of the
sediment layer. This requires the dredging of approxi-
mately 600 000 m3 of contaminated sediments (approxi-
mately 1700 kg of PCBs) in the lake, and is to be
carried out over a six-year seasonal period, beginning in
2004. Subsequently, a long-term monitoring programme
will be put in place to track the concentration of PCBs
in various media.
The remediation process involves several steps. First,
sediment is dredged from the lake bed by a hydraulic
dredge and is pumped through a floating pipeline to the
staging area and into geotextile tubes, where it dewaters.
Next, the water is collected from the lined gravel drainage
area beneath the geotextile tubes and pumped into a
treatment plant, where it is cleaned with sand and activated carbon treatments to remove contaminants. The
clean water is then returned through another pipeline to
the lake. Finally, when the contaminated sediment is dry
enough, it is removed from the geotextile tubes and loaded
into lined, covered trucks for transport to a disposal site.
The disposal site is fully licensed for the disposal of
sediment containing PCBs.
An extensive evaluation programme was employed to
determine the appropriate geotextile tube dewatering per-
formance parameters. A large number of hanging bag tests
were performed to determine the appropriate accelerant
type and dosage rates, the likely rates of dewatering, and
the resulting effluent quality. Calculations were then
performed to determine the required quantities, sizes and
safe filling heights of the tubes.
Dredging of the contaminated sediments began in 2004
in the area of highest PCB concentrations to the south and
south-east of the lake (Figure 34a). The dredges used were
special, small-scale cutter-suction dredges that created
minimal sediment disturbance during operation. The accu-
rate positioning of the dredges was via GPS, with an
accuracy of 1 m. The depth of dredging varied, according
to contaminant concentration, between 0.3 m and 1 m. The
accuracy of the depth of dredging could be controlled to
within 0.1 m.The dredged contaminated sediment was pumped hy-
draulically through two floating pipelines to the onshore
sediment processing area located on the central western
shore of Little Lake Butte des Morts (Figure 34a). Thesediment processing area consisted of a sediment dewater-
ing pad that supported the geotextile tube dewatering and
N
N
Neenah
Menasha
Dredging location 2
Dredginglocation 1
Sedimentprocessingarea
Pipeline to sedimentprocessing area
LittleLakeButtedesMorts
Dredge discharge pipeline
Sedimentdewatering
pad for geotextile
tubes
Clean water return pipeline to lake
Water treatmentplant
(a)
(b)
Figure 34. Details of the remedial dredging and sediment
treatment operation in Little Lake Butte des Morts: (a) Little
Lake Butte des Morts clean-up map; (b) layout of sediment
processing area
Geotextile containment for hydraulic and environmental engineering 419
Geosynthetics International , 2008, 15, No. 6
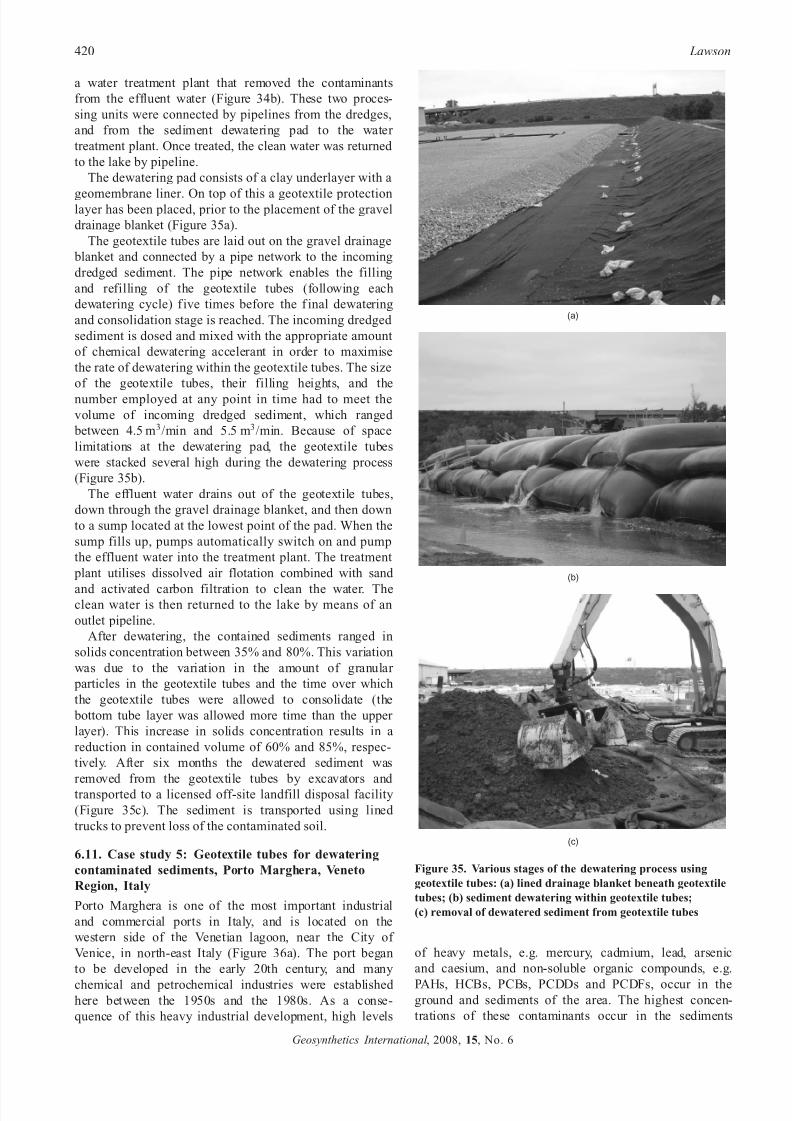
7/22/2019 Part 9 Reference Paper
http://slidepdf.com/reader/full/part-9-reference-paper 37/44
a water treatment plant that removed the contaminants
from the effluent water (Figure 34b). These two proces-
sing units were connected by pipelines from the dredges,
and from the sediment dewatering pad to the water
treatment plant. Once treated, the clean water was returned
to the lake by pipeline.
The dewatering pad consists of a clay underlayer with a
geomembrane liner. On top of this a geotextile protectionlayer has been placed, prior to the placement of the gravel
drainage blanket (Figure 35a).
The geotextile tubes are laid out on the gravel drainage
blanket and connected by a pipe network to the incoming
dredged sediment. The pipe network enables the filling
and refilling of the geotextile tubes (following each
dewatering cycle) five times before the f inal dewatering
and consolidation stage is reached. The incoming dredged
sediment is dosed and mixed with the appropriate amount
of chemical dewatering accelerant in order to maximise
the rate of dewatering within the geotextile tubes. The size
of the geotextile tubes, their filling heights, and the
number employed at any point in time had to meet the
volume of incoming dredged sediment, which ranged
between 4.5 m3/min and 5.5 m3/min. Because of space
limitations at the dewatering pad, the geotextile tubes
were stacked several high during the dewatering process
(Figure 35b).
The effluent water drains out of the geotextile tubes,
down through the gravel drainage blanket, and then down
to a sump located at the lowest point of the pad. When the
sump fills up, pumps automatically switch on and pump
the effluent water into the treatment plant. The treatment
plant utilises dissolved air flotation combined with sand
and activated carbon filtration to clean the water. Theclean water is then returned to the lake by means of an
outlet pipeline.
After dewatering, the contained sediments ranged in
solids concentration between 35% and 80%. This variation
was due to the variation in the amount of granular
particles in the geotextile tubes and the time over which
the geotextile tubes were allowed to consolidate (the
bottom tube layer was allowed more time than the upper
layer). This increase in solids concentration results in a
reduction in contained volume of 60% and 85%, respec-
tively. After six months the dewatered sediment was
removed from the geotextile tubes by excavators and
transported to a licensed off-site landfill disposal facility
(Figure 35c). The sediment is transported using lined
trucks to prevent loss of the contaminated soil.
6.11. Case study 5: Geotextile tubes for dewatering
contaminated sediments, Porto Marghera, Veneto
Region, Italy
Porto Marghera is one of the most important industrial
and commercial ports in Italy, and is located on the
western side of the Venetian lagoon, near the City of
Venice, in north-east Italy (Figure 36a). The port began
to be developed in the early 20th century, and many
chemical and petrochemical industries were established here between the 1950s and the 1980s. As a conse-
quence of this heavy industrial development, high levels
of heavy metals, e.g. mercury, cadmium, lead, arsenic
and caesium, and non-soluble organic compounds, e.g.
PAHs, HCBs, PCBs, PCDDs and PCDFs, occur in theground and sediments of the area. The highest concen-
trations of these contaminants occur in the sediments
(a)
(b)
(c)
Figure 35. Various stages of the dewatering process using
geotextile tubes: (a) lined drainage blanket beneath geotextile
tubes; (b) sediment dewatering within geotextile tubes;
(c) removal of dewatered sediment from geotextile tubes
420 Lawson
Geosynthetics International , 2008, 15, No. 6
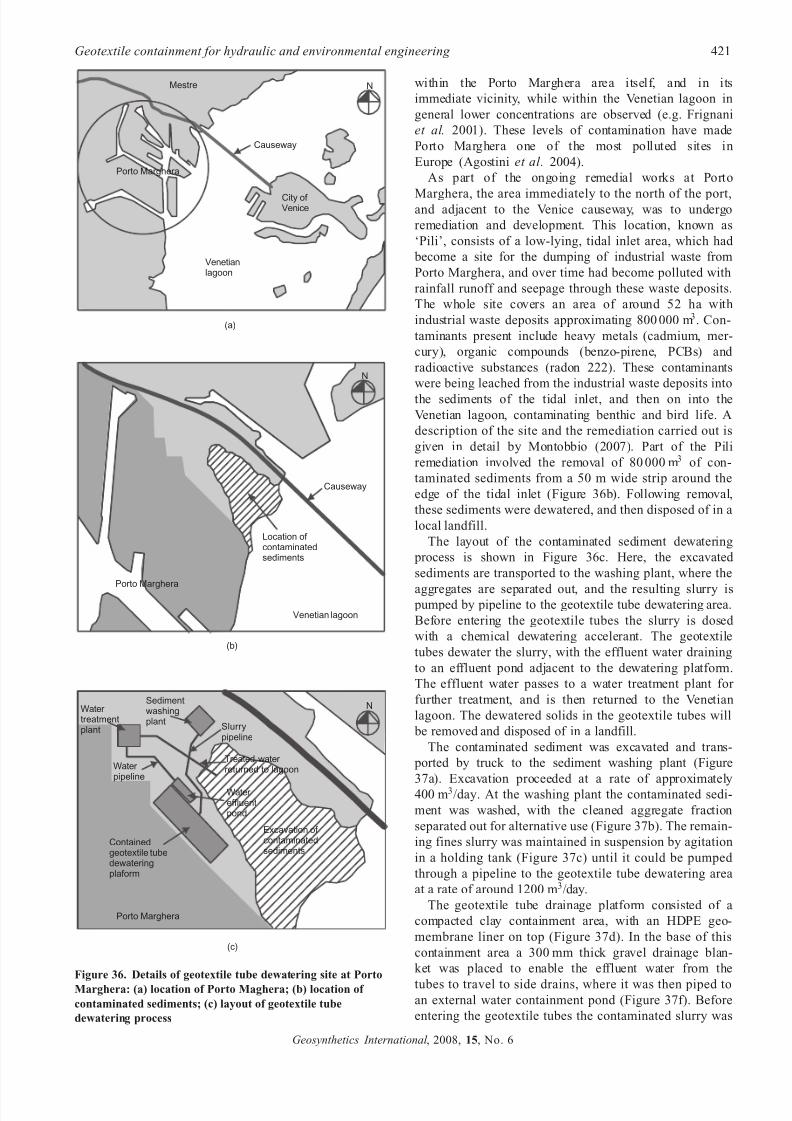
7/22/2019 Part 9 Reference Paper
http://slidepdf.com/reader/full/part-9-reference-paper 38/44
within the Porto Marghera area itself, and in its
immediate vicinity, while within the Venetian lagoon in
general lower concentrations are observed (e.g. Frignani
et al. 2001). These levels of contamination have made
Porto Marghera one of the most polluted sites in
Europe (Agostini et al. 2004).
As part of the ongoing remedial works at Porto
Marghera, the area immediately to the north of the port,and adjacent to the Venice causeway, was to undergo
remediation and development. This location, known as
‘Pili’, consists of a low-lying, tidal inlet area, which had
become a site for the dumping of industrial waste from
Porto Marghera, and over time had become polluted with
rainfall runoff and seepage through these waste deposits.
The whole site covers an area of around 52 ha with
industrial waste deposits approximating 800 000 m3. Con-
taminants present include heavy metals (cadmium, mer-
cury), organic compounds (benzo-pirene, PCBs) and
radioactive substances (radon 222). These contaminants
were being leached from the industrial waste deposits into
the sediments of the tidal inlet, and then on into the
Venetian lagoon, contaminating benthic and bird life. A
description of the site and the remediation carried out is
given in detail by Montobbio (2007). Part of the Pili
remediation involved the removal of 80 000 m3 of con-
taminated sediments from a 50 m wide strip around the
edge of the tidal inlet (Figure 36b). Following removal,
these sediments were dewatered, and then disposed of in a
local landfill.
The layout of the contaminated sediment dewatering
process is shown in Figure 36c. Here, the excavated
sediments are transported to the washing plant, where the
aggregates are separated out, and the resulting slurry is pumped by pipeline to the geotextile tube dewatering area.
Before entering the geotextile tubes the slurry is dosed
with a chemical dewatering accelerant. The geotextile
tubes dewater the slurry, with the effluent water draining
to an effluent pond adjacent to the dewatering platform.
The effluent water passes to a water treatment plant for
further treatment, and is then returned to the Venetian
lagoon. The dewatered solids in the geotextile tubes will
be removed and disposed of in a landfill.
The contaminated sediment was excavated and trans-
ported by truck to the sediment washing plant (Figure
37a). Excavation proceeded at a rate of approximately
400 m3/day. At the washing plant the contaminated sedi-
ment was washed, with the cleaned aggregate fraction
separated out for alternative use (Figure 37b). The remain-
ing fines slurry was maintained in suspension by agitation
in a holding tank (Figure 37c) until it could be pumped
through a pipeline to the geotextile tube dewatering area
at a rate of around 1200 m3/day.
The geotextile tube drainage platform consisted of a
compacted clay containment area, with an HDPE geo-
membrane liner on top (Figure 37d). In the base of this
containment area a 300 mm thick gravel drainage blan-
ket was placed to enable the effluent water from the
tubes to travel to side drains, where it was then piped toan external water containment pond (Figure 37f). Before
entering the geotextile tubes the contaminated slurry was
(a)
N
City of Venice
Venetianlagoon
Causeway
Porto Marghera
Mestre
(b)
N
Porto Marghera
Causeway
Venetian lagoon
Location of contaminatedsediments
(c)
Porto Marghera
Excavation of contaminatedsediments
Containedgeotextile tubedewateringplaform
Sedimentwashingplant
Water treatmentplant Slurry
pipeline
Water pipeline
Water effluentpond
N
Treated water returned to lagoon
Figure 36. Details of geotextile tube dewatering site at Porto
Marghera: (a) location of Porto Maghera; (b) location of
contaminated sediments; (c) layout of geotextile tube
dewatering process
Geotextile containment for hydraulic and environmental engineering 421
Geosynthetics International , 2008, 15, No. 6
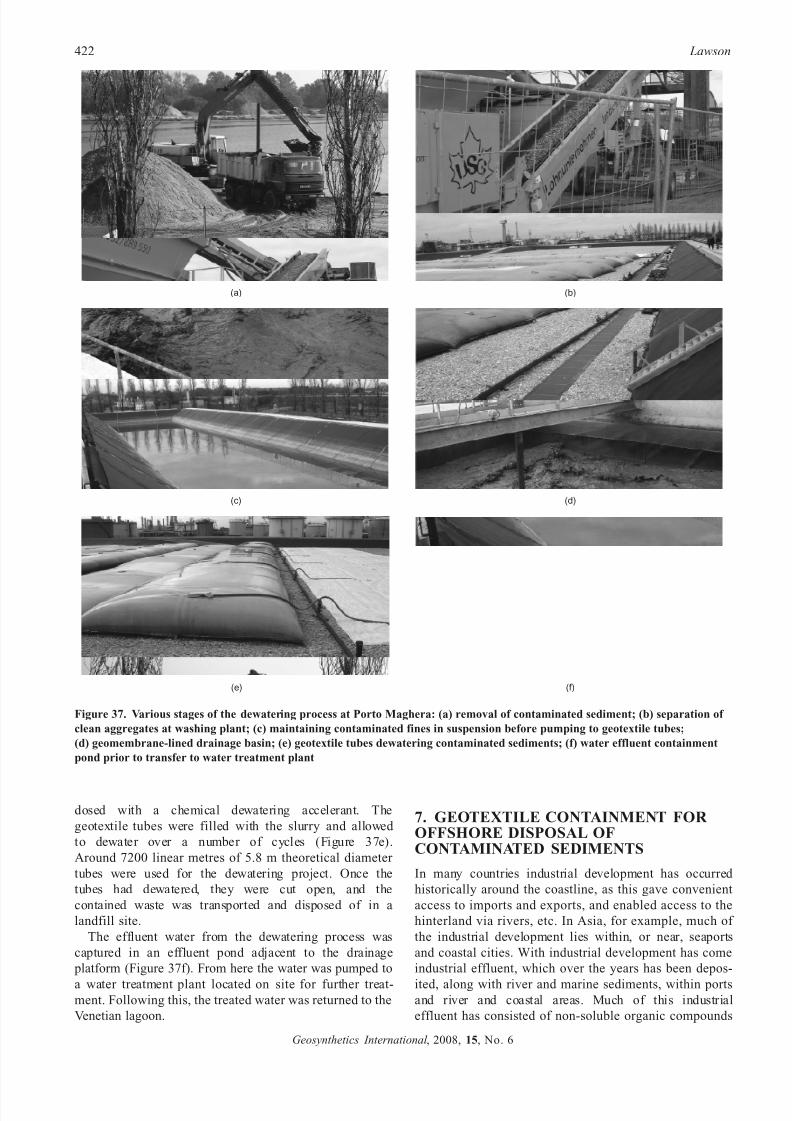
7/22/2019 Part 9 Reference Paper
http://slidepdf.com/reader/full/part-9-reference-paper 39/44
dosed with a chemical dewatering accelerant. The
geotextile tubes were filled with the slurry and allowed
to dewater over a number of cycles (Figure 37e).
Around 7200 linear metres of 5.8 m theoretical diameter
tubes were used for the dewatering project. Once the
tubes had dewatered, they were cut open, and the
contained waste was transported and disposed of in a
landfill site.
The effluent water from the dewatering process was
captured in an effluent pond adjacent to the drainage
platform (Figure 37f). From here the water was pumped to
a water treatment plant located on site for further treat-ment. Following this, the treated water was returned to the
Venetian lagoon.
7. GEOTEXTILE CONTAINMENT FOR OFFSHORE DISPOSAL OFCONTAMINATED SEDIMENTS
In many countries industrial development has occurred
historically around the coastline, as this gave convenient
access to imports and exports, and enabled access to the
hinterland via rivers, etc. In Asia, for example, much of
the industrial development lies within, or near, seaports
and coastal cities. With industrial development has come
industrial effluent, which over the years has been depos-
ited, along with river and marine sediments, within portsand river and coastal areas. Much of this industrial
effluent has consisted of non-soluble organic compounds
(b)
(d)
(f)
(a)
(e)
(c)
Figure 37. Various stages of the dewatering process at Porto Maghera: (a) removal of contaminated sediment; (b) separation of
clean aggregates at washing plant; (c) maintaining contaminated fines in suspension before pumping to geotextile tubes;
(d) geomembrane-lined drainage basin; (e) geotextile tubes dewatering contaminated sediments; (f) water effluent containment
pond prior to transfer to water treatment plant
422 Lawson
Geosynthetics International , 2008, 15, No. 6
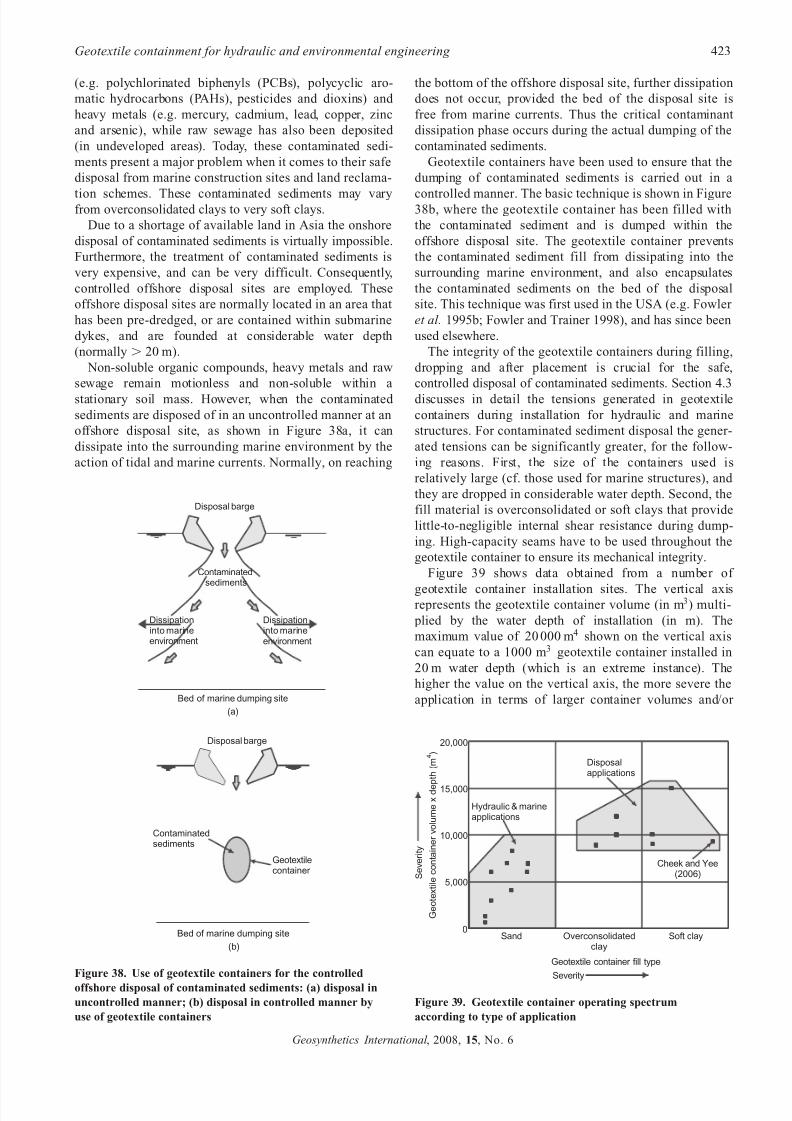
7/22/2019 Part 9 Reference Paper
http://slidepdf.com/reader/full/part-9-reference-paper 40/44
(e.g. polychlorinated biphenyls (PCBs), polycyclic aro-
matic hydrocarbons (PAHs), pesticides and dioxins) and
heavy metals (e.g. mercury, cadmium, lead, copper, zinc
and arsenic), while raw sewage has also been deposited
(in undeveloped areas). Today, these contaminated sedi-
ments present a major problem when it comes to their safe
disposal from marine construction sites and land reclama-
tion schemes. These contaminated sediments may varyfrom overconsolidated clays to very soft clays.
Due to a shortage of available land in Asia the onshore
disposal of contaminated sediments is virtually impossible.
Furthermore, the treatment of contaminated sediments is
very expensive, and can be very difficult. Consequently,
controlled offshore disposal sites are employed. These
offshore disposal sites are normally located in an area that
has been pre-dredged, or are contained within submarine
dykes, and are founded at considerable water depth
(normally . 20 m).
Non-soluble organic compounds, heavy metals and raw
sewage remain motionless and non-soluble within a
stationary soil mass. However, when the contaminated
sediments are disposed of in an uncontrolled manner at an
offshore disposal site, as shown in Figure 38a, it can
dissipate into the surrounding marine environment by the
action of tidal and marine currents. Normally, on reaching
the bottom of the offshore disposal site, further dissipation
does not occur, provided the bed of the disposal site is
free from marine currents. Thus the critical contaminant
dissipation phase occurs during the actual dumping of the
contaminated sediments.
Geotextile containers have been used to ensure that the
dumping of contaminated sediments is carried out in a
controlled manner. The basic technique is shown in Figure38b, where the geotextile container has been filled with
the contaminated sediment and is dumped within the
offshore disposal site. The geotextile container prevents
the contaminated sediment fill from dissipating into the
surrounding marine environment, and also encapsulates
the contaminated sediments on the bed of the disposal
site. This technique was first used in the USA (e.g. Fowler
et al. 1995b; Fowler and Trainer 1998), and has since been
used elsewhere.
The integrity of the geotextile containers during filling,
dropping and after placement is crucial for the safe,
controlled disposal of contaminated sediments. Section 4.3
discusses in detail the tensions generated in geotextile
containers during installation for hydraulic and marine
structures. For contaminated sediment disposal the gener-
ated tensions can be significantly greater, for the follow-
ing reasons. First, the size of the containers used is
relatively large (cf. those used for marine structures), and
they are dropped in considerable water depth. Second, the
fill material is overconsolidated or soft clays that provide
little-to-negligible internal shear resistance during dump-
ing. High-capacity seams have to be used throughout the
geotextile container to ensure its mechanical integrity.
Figure 39 shows data obtained from a number of
geotextile container installation sites. The vertical axisrepresents the geotextile container volume (in m3) multi-
plied by the water depth of installation (in m). The
maximum value of 20 000 m4 shown on the vertical axis
can equate to a 1000 m3 geotextile container installed in
20 m water depth (which is an extreme instance). The
higher the value on the vertical axis, the more severe the
application in terms of larger container volumes and/or Bed of marine dumping site
(a)
Contaminatedsediments
Disposal barge
Dissipationinto marineenvironment
Dissipationinto marineenvironment
Bed of marine dumping site
(b)
Contaminatedsediments
Geotextilecontainer
Disposal barge
Figure 38. Use of geotextile containers for the controlled
offshore disposal of contaminated sediments: (a) disposal in
uncontrolled manner; (b) disposal in controlled manner by
use of geotextile containers
Overconsolidatedclay
20,000
15,000
10,000
5,000
0
Geotextilecontainervolumexdep
th(m
) 4
Severity
Sand Soft clay
Geotextile container fill type
Severity
Hydraulic & marineapplications
Disposalapplications
Cheek and Yee(2006)
Figure 39. Geotextile container operating spectrum
according to type of application
Geotextile containment for hydraulic and environmental engineering 423
Geosynthetics International , 2008, 15, No. 6
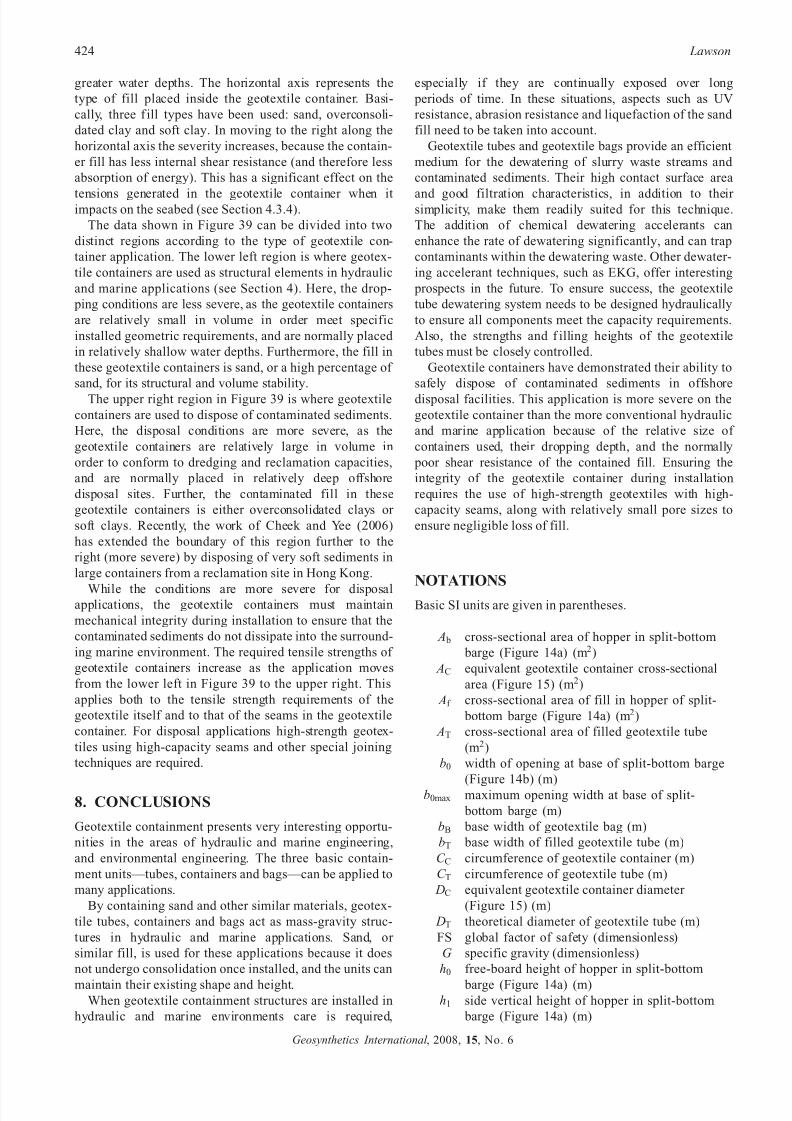
7/22/2019 Part 9 Reference Paper
http://slidepdf.com/reader/full/part-9-reference-paper 41/44
greater water depths. The horizontal axis represents the
type of fill placed inside the geotextile container. Basi-
cally, three f ill types have been used: sand, overconsoli-
dated clay and soft clay. In moving to the right along the
horizontal axis the severity increases, because the contain-
er fill has less internal shear resistance (and therefore less
absorption of energy). This has a significant effect on the
tensions generated in the geotextile container when itimpacts on the seabed (see Section 4.3.4).
The data shown in Figure 39 can be divided into two
distinct regions according to the type of geotextile con-
tainer application. The lower left region is where geotex-
tile containers are used as structural elements in hydraulic
and marine applications (see Section 4). Here, the drop-
ping conditions are less severe, as the geotextile containers
are relatively small in volume in order meet specific
installed geometric requirements, and are normally placed
in relatively shallow water depths. Furthermore, the fill in
these geotextile containers is sand, or a high percentage of
sand, for its structural and volume stability.
The upper right region in Figure 39 is where geotextile
containers are used to dispose of contaminated sediments.
Here, the disposal conditions are more severe, as the
geotextile containers are relatively large in volume in
order to conform to dredging and reclamation capacities,
and are normally placed in relatively deep offshore
disposal sites. Further, the contaminated fill in these
geotextile containers is either overconsolidated clays or
soft clays. Recently, the work of Cheek and Yee (2006)
has extended the boundary of this region further to the
right (more severe) by disposing of very soft sediments in
large containers from a reclamation site in Hong Kong.
While the conditions are more severe for disposalapplications, the geotextile containers must maintain
mechanical integrity during installation to ensure that the
contaminated sediments do not dissipate into the surround-
ing marine environment. The required tensile strengths of
geotextile containers increase as the application moves
from the lower left in Figure 39 to the upper right. This
applies both to the tensile strength requirements of the
geotextile itself and to that of the seams in the geotextile
container. For disposal applications high-strength geotex-
tiles using high-capacity seams and other special joining
techniques are required.
8. CONCLUSIONS
Geotextile containment presents very interesting opportu-
nities in the areas of hydraulic and marine engineering,
and environmental engineering. The three basic contain-
ment units—tubes, containers and bags—can be applied to
many applications.
By containing sand and other similar materials, geotex-
tile tubes, containers and bags act as mass-gravity struc-
tures in hydraulic and marine applications. Sand, or
similar fill, is used for these applications because it does
not undergo consolidation once installed, and the units can
maintain their existing shape and height.When geotextile containment structures are installed in
hydraulic and marine environments care is required,
especially if they are continually exposed over long
periods of time. In these situations, aspects such as UV
resistance, abrasion resistance and liquefaction of the sand
fill need to be taken into account.
Geotextile tubes and geotextile bags provide an efficient
medium for the dewatering of slurry waste streams and
contaminated sediments. Their high contact surface area
and good filtration characteristics, in addition to their simplicity, make them readily suited for this technique.
The addition of chemical dewatering accelerants can
enhance the rate of dewatering significantly, and can trap
contaminants within the dewatering waste. Other dewater-
ing accelerant techniques, such as EKG, offer interesting
prospects in the future. To ensure success, the geotextile
tube dewatering system needs to be designed hydraulically
to ensure all components meet the capacity requirements.
Also, the strengths and f illing heights of the geotextile
tubes must be closely controlled.
Geotextile containers have demonstrated their ability to
safely dispose of contaminated sediments in offshore
disposal facilities. This application is more severe on the
geotextile container than the more conventional hydraulic
and marine application because of the relative size of
containers used, their dropping depth, and the normally
poor shear resistance of the contained fill. Ensuring the
integrity of the geotextile container during installation
requires the use of high-strength geotextiles with high-
capacity seams, along with relatively small pore sizes to
ensure negligible loss of fill.
NOTATIONS
Basic SI units are given in parentheses.
A b cross-sectional area of hopper in split-bottom
barge (Figure 14a) (m2)
AC equivalent geotextile container cross-sectional
area (Figure 15) (m2)
Af cross-sectional area of fill in hopper of split-
bottom barge (Figure 14a) (m2)
AT cross-sectional area of filled geotextile tube
(m2)
b0 width of opening at base of split-bottom barge
(Figure 14b) (m)b0max maximum opening width at base of split-
bottom barge (m)
bB base width of geotextile bag (m)
bT base width of filled geotextile tube (m)
C C circumference of geotextile container (m)
C T circumference of geotextile tube (m)
DC equivalent geotextile container diameter
(Figure 15) (m)
DT theoretical diameter of geotextile tube (m)
FS global factor of safety (dimensionless)
G specific gravity (dimensionless)
h0 free-board height of hopper in split-bottom
barge (Figure 14a) (m)h1 side vertical height of hopper in split-bottom
barge (Figure 14a) (m)
424 Lawson
Geosynthetics International , 2008, 15, No. 6
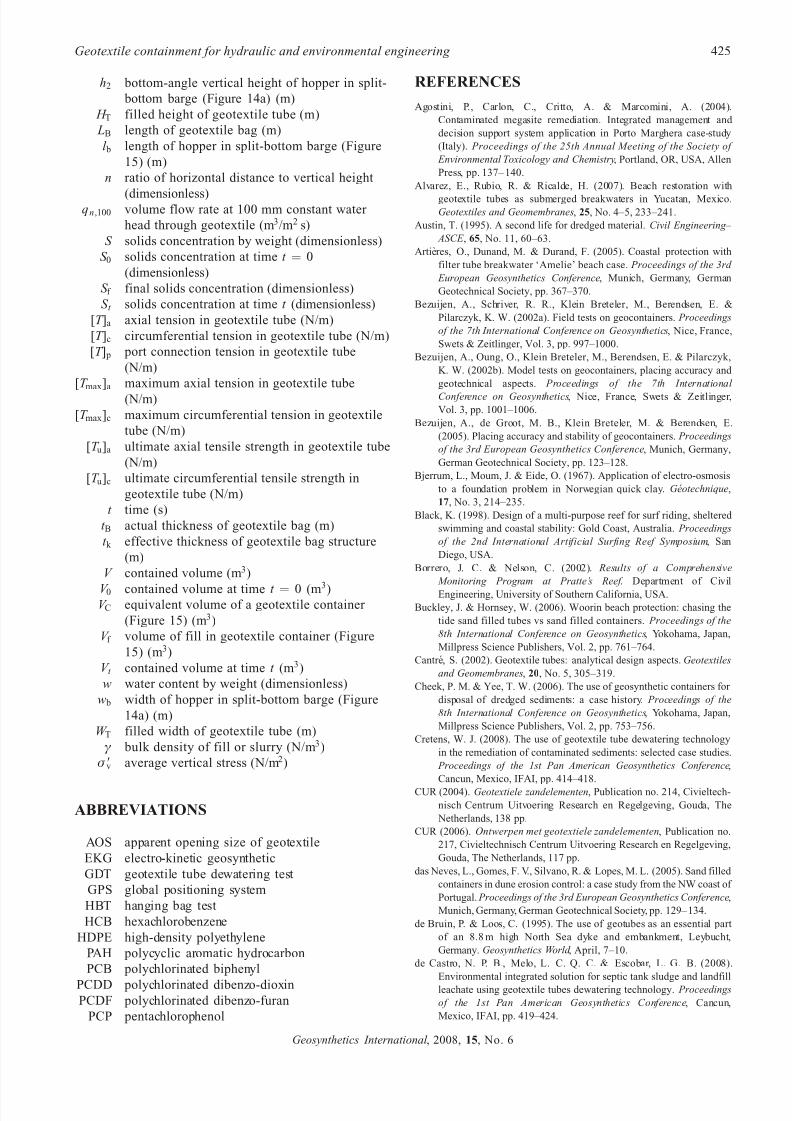
7/22/2019 Part 9 Reference Paper
http://slidepdf.com/reader/full/part-9-reference-paper 42/44
h2 bottom-angle vertical height of hopper in split-
bottom barge (Figure 14a) (m)
H T filled height of geotextile tube (m)
LB length of geotextile bag (m)
l b length of hopper in split-bottom barge (Figure
15) (m)
n ratio of horizontal distance to vertical height
(dimensionless)qn,100 volume flow rate at 100 mm constant water
head through geotextile (m3/m2 s)
S solids concentration by weight (dimensionless)
S 0 solids concentration at time t ¼ 0
(dimensionless)
S f final solids concentration (dimensionless)
S t solids concentration at time t (dimensionless)
[T ]a axial tension in geotextile tube (N/m)
[T ]c circumferential tension in geotextile tube (N/m)
[T ] p port connection tension in geotextile tube
(N/m)
[T max]a maximum axial tension in geotextile tube
(N/m)
[T max]c maximum circumferential tension in geotextile
tube (N/m)
[T u]a ultimate axial tensile strength in geotextile tube
(N/m)
[T u]c ultimate circumferential tensile strength in
geotextile tube (N/m)
t time (s)
t B actual thickness of geotextile bag (m)
t k effective thickness of geotextile bag structure
(m)
V contained volume (m3)
V 0 contained volume at time t ¼ 0 (m3)V C equivalent volume of a geotextile container
(Figure 15) (m3)
V f volume of fill in geotextile container (Figure
15) (m3)
V t contained volume at time t (m3)
w water content by weight (dimensionless)
w b width of hopper in split-bottom barge (Figure
14a) (m)
W T filled width of geotextile tube (m)
ª bulk density of fill or slurry (N/m3)
ó 9v average vertical stress (N/m2)
ABBREVIATIONS
AOS apparent opening size of geotextile
EKG electro-kinetic geosynthetic
GDT geotextile tube dewatering test
GPS global positioning system
HBT hanging bag test
HCB hexachlorobenzene
HDPE high-density polyethylene
PAH polycyclic aromatic hydrocarbon
PCB polychlorinated biphenyl
PCDD polychlorinated dibenzo-dioxinPCDF polychlorinated dibenzo-furan
PCP pentachlorophenol
REFERENCES
Agostini, P., Carlon, C., Critto, A. & Marcomini, A. (2004).
Contaminated megasite remediation. Integrated management and
decision support system application in Porto Marghera case-study
(Italy). Proceedings of the 25th Annual Meeting of the Society of
Environmental Toxicology and Chemistry, Portland, OR, USA, Allen
Press, pp. 137– 140.
Alvarez, E., Rubio, R. & Ricalde, H. (2007). Beach restoration with
geotextile tubes as submerged breakwaters in Yucatan, Mexico.Geotextiles and Geomembranes, 25, No. 4–5, 233–241.
Austin, T. (1995). A second life for dredged material. Civil Engineering–
ASCE , 65, No. 11, 60–63.
Artieres, O., Dunand, M. & Durand, F. (2005). Coastal protection with
filter tube breakwater ‘Amelie’ beach case. Proceedings of the 3rd
European Geosynthetics Conference, Munich, Germany, German
Geotechnical Society, pp. 367–370.
Bezuijen, A., Schriver, R. R., Klein Breteler, M., Berendsen, E. &
Pilarczyk, K. W. (2002a). Field tests on geocontainers. Proceedings
of the 7th International Conference on Geosynthetics, Nice, France,
Swets & Zeitlinger, Vol. 3, pp. 997–1000.
Bezuijen, A., Oung, O., Klein Breteler, M., Berendsen, E. & Pilarczyk,
K. W. (2002b). Model tests on geocontainers, placing accuracy and
geotechnical aspects. Proceedings of the 7th International
Conference on Geosynthetics, Nice, France, Swets & Zeitlinger,
Vol. 3, pp. 1001–1006.
Bezuijen, A., de Groot, M. B., Klein Breteler, M. & Berendsen, E.
(2005). Placing accuracy and stability of geocontainers. Proceedings
of the 3rd European Geosynthetics Conference, Munich, Germany,
German Geotechnical Society, pp. 123–128.
Bjerrum, L., Moum, J. & Eide, O. (1967). Application of electro-osmosis
to a foundation problem in Norwegian quick clay. Ge otechnique,
17, No. 3, 214–235.
Black, K. (1998). Design of a multi-purpose reef for surf riding, sheltered
swimming and coastal stability: Gold Coast, Australia. Proceedings
of the 2nd International Artificial Surfing Reef Symposium, San
Diego, USA.
Borrero, J. C. & Nelson, C. (2002). Results of a Comprehensive
Monitoring Program at Pratte’s Reef . Department of Civil
Engineering, University of Southern California, USA.
Buckley, J. & Hornsey, W. (2006). Woorin beach protection: chasing the
tide sand filled tubes vs sand filled containers. Proceedings of the
8th International Conference on Geosynthetics, Yokohama, Japan,
Millpress Science Publishers, Vol. 2, pp. 761–764.
Cantre, S. (2002). Geotextile tubes: analytical design aspects. Geotextiles
and Geomembranes, 20, No. 5, 305–319.
Cheek, P. M. & Yee, T. W. (2006). The use of geosynthetic containers for
disposal of dredged sediments: a case history. Proceedings of the
8th International Conference on Geosynthetics, Yokohama, Japan,
Millpress Science Publishers, Vol. 2, pp. 753–756.
Cretens, W. J. (2008). The use of geotextile tube dewatering technology
in the remediation of contaminated sediments: selected case studies.
Proceedings of the 1st Pan American Geosynthetics Conference,
Cancun, Mexico, IFAI, pp. 414–418.
CUR (2004). Geotextiele zandelementen, Publication no. 214, Civieltech-
nisch Centrum Uitvoering Research en Regelgeving, Gouda, The
Netherlands, 138 pp.
CUR (2006). Ontwerpen met geotextiele zandelementen, Publication no.
217, Civieltechnisch Centrum Uitvoering Research en Regelgeving,
Gouda, The Netherlands, 117 pp.
das Neves, L., Gomes, F. V., Silvano, R. & Lopes, M. L. (2005). Sand filled
containers in dune erosion control: a case study from the NW coast of
Portugal. Proceedings of the 3rd European Geosynthetics Conference,
Munich, Germany, German Geotechnical Society, pp. 129– 134.
de Bruin, P. & Loos, C. (1995). The use of geotubes as an essential part
of an 8.8 m high North Sea dyke and embankment, Leybucht,
Germany. Geosynthetics World , April, 7–10.
de Castro, N. P. B., Melo, L. C. Q. C. & Escobar, L. G. B. (2008).
Environmental integrated solution for septic tank sludge and landfill
leachate using geotextile tubes dewatering technology. Proceedings
of the 1st Pan American Geosynthetics Conference, Cancun,
Mexico, IFAI, pp. 419–424.
Geotextile containment for hydraulic and environmental engineering 425
Geosynthetics International , 2008, 15, No. 6
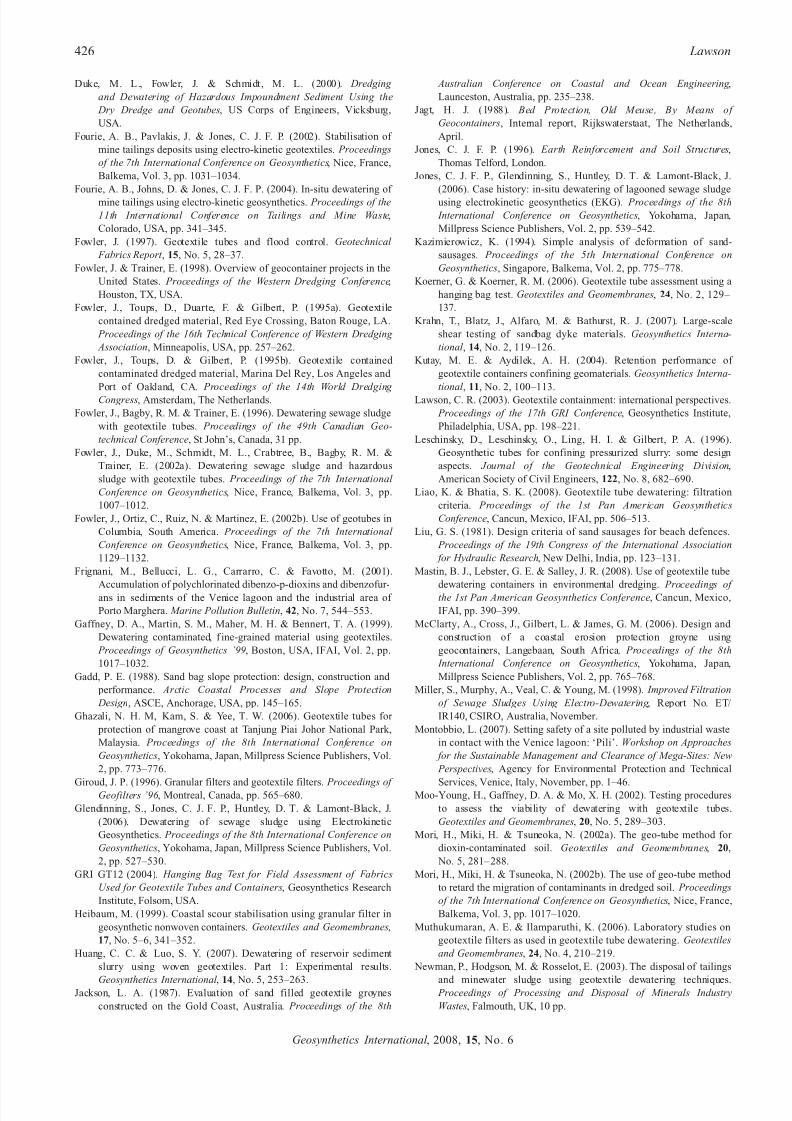
7/22/2019 Part 9 Reference Paper
http://slidepdf.com/reader/full/part-9-reference-paper 43/44
Duke, M. L., Fowler, J. & Schmidt, M. L. (2000). Dredging
and Dewatering of Hazardous Impoundment Sediment Using the
Dry Dredge and Geotubes, US Corps of Engineers, Vicksburg,
USA.
Fourie, A. B., Pavlakis, J. & Jones, C. J. F. P. (2002). Stabilisation of
mine tailings deposits using electro-kinetic geotextiles. Proceedings
of the 7th International Conference on Geosynthetics, Nice, France,
Balkema, Vol. 3, pp. 1031–1034.
Fourie, A. B., Johns, D. & Jones, C. J. F. P. (2004). In-situ dewatering of
mine tailings using electro-kinetic geosynthetics. Proceedings of the
11th International Conference on Tailings and Mine Waste,
Colorado, USA, pp. 341–345.
Fowler, J. (1997). Geotextile tubes and flood control. Geotechnical
Fabrics Report , 15, No. 5, 28–37.
Fowler, J. & Trainer, E. (1998). Overview of geocontainer projects in the
United States. Proceedings of the Western Dredging Conference,
Houston, TX, USA.
Fowler, J., Toups, D., Duarte, F. & Gilbert, P. (1995a). Geotextile
contained dredged material, Red Eye Crossing, Baton Rouge, LA.
Proceedings of the 16th Technical Conference of Western Dredging
Association, Minneapolis, USA, pp. 257–262.
Fowler, J., Toups, D. & Gilbert, P. (1995b). Geotextile contained
contaminated dredged material, Marina Del Rey, Los Angeles and
Port of Oakland, CA. Proceedings of the 14th World Dredging
Congress, Amsterdam, The Netherlands.
Fowler, J., Bagby, R. M. & Trainer, E. (1996). Dewatering sewage sludge
with geotextile tubes. Proceedings of the 49th Canadian Geo-
technical Conference, St John’s, Canada, 31 pp.
Fowler, J., Duke, M., Schmidt, M. L., Crabtree, B., Bagby, R. M. &
Trainer, E. (2002a). Dewatering sewage sludge and hazardous
sludge with geotextile tubes. Proceedings of the 7th International
Conference on Geosynthetics, Nice, France, Balkema, Vol. 3, pp.
1007–1012.
Fowler, J., Ortiz, C., Ruiz, N. & Martinez, E. (2002b). Use of geotubes in
Columbia, South America. Proceedings of the 7th International
Conference on Geosynthetics, Nice, France, Balkema, Vol. 3, pp.
1129–1132.
Frignani, M., Bellucci, L. G., Carrarro, C. & Favotto, M. (2001).
Accumulation of polychlorinated dibenzo-p-dioxins and dibenzofur-ans in sediments of the Venice lagoon and the industrial area of
Porto Marghera. Marine Pollution Bulletin, 42, No. 7, 544–553.
Gaffney, D. A., Martin, S. M., Maher, M. H. & Bennert, T. A. (1999).
Dewatering contaminated, f ine-grained material using geotextiles.
Proceedings of Geosynthetics ’99, Boston, USA, IFAI, Vol. 2, pp.
1017–1032.
Gadd, P. E. (1988). Sand bag slope protection: design, construction and
performance. Arctic Coastal Processes and Slope Protection
Design, ASCE, Anchorage, USA, pp. 145–165.
Ghazali, N. H. M, Kam, S. & Yee, T. W. (2006). Geotextile tubes for
protection of mangrove coast at Tanjung Piai Johor National Park,
Malaysia. Proceedings of the 8th International Conference on
Geosynthetics, Yokohama, Japan, Millpress Science Publishers, Vol.
2, pp. 773–776.
Giroud, J. P. (1996). Granular filters and geotextile filters. Proceedings of Geofilters ’96 , Montreal, Canada, pp. 565–680.
Glendinning, S., Jones, C. J. F. P., Huntley, D. T. & Lamont-Black, J.
(2006). Dewatering of sewage sludge using Electrokinetic
Geosynthetics. Proceedings of the 8th International Conference on
Geosynthetics, Yokohama, Japan, Millpress Science Publishers, Vol.
2, pp. 527–530.
GRI GT12 (2004). Hanging Bag Test for Field Assessment of Fabrics
Used for Geotextile Tubes and Containers, Geosynthetics Research
Institute, Folsom, USA.
Heibaum, M. (1999). Coastal scour stabilisation using granular filter in
geosynthetic nonwoven containers. Geotextiles and Geomembranes,
17, No. 5–6, 341–352.
Huang, C. C. & Luo, S. Y. (2007). Dewatering of reservoir sediment
slurry using woven geotextiles. Part 1: Experimental results.
Geosynthetics International , 14, No. 5, 253–263.Jackson, L. A. (1987). Evaluation of sand filled geotextile groynes
constructed on the Gold Coast, Australia. Proceedings of the 8th
Australian Conference on Coastal and Ocean Engineering ,
Launceston, Australia, pp. 235–238.
Jagt, H. J. (1988). Bed Protection, Old Meuse, By Means of
Geocontainers, Internal report, Rijkswaterstaat, The Netherlands,
April.
Jones, C. J. F. P. (1996). Earth Reinforcement and Soil Structures,
Thomas Telford, London.
Jones, C. J. F. P., Glendinning, S., Huntley, D. T. & Lamont-Black, J.
(2006). Case history: in-situ dewatering of lagooned sewage sludge
using electrokinetic geosynthetics (EKG). Proceedings of the 8th
International Conference on Geosynthetics, Yokohama, Japan,
Millpress Science Publishers, Vol. 2, pp. 539–542.
Kazimierowicz, K. (1994). Simple analysis of deformation of sand-
sausages. Proceedings of the 5th International Conference on
Geosynthetics, Singapore, Balkema, Vol. 2, pp. 775–778.
Koerner, G. & Koerner, R. M. (2006). Geotextile tube assessment using a
hanging bag test. Geotextiles and Geomembranes, 24, No. 2, 129–
137.
Krahn, T., Blatz, J., Alfaro, M. & Bathurst, R. J. (2007). Large-scale
shear testing of sandbag dyke materials. Geosynthetics Interna-
tional , 14, No. 2, 119–126.
Kutay, M. E. & Aydilek, A. H. (2004). Retention performance of
geotextile containers confining geomaterials. Geosynthetics Interna-
tional , 11, No. 2, 100–113.
Lawson, C. R. (2003). Geotextile containment: international perspectives.
Proceedings of the 17th GRI Conference, Geosynthetics Institute,
Philadelphia, USA, pp. 198–221.
Leschinsky, D., Leschinsky, O., Ling, H. I. & Gilbert, P. A. (1996).
Geosynthetic tubes for confining pressurized slurry: some design
aspects. Journal of the Geotechnical Engineering Division,
American Society of Civil Engineers, 122, No. 8, 682–690.
Liao, K. & Bhatia, S. K. (2008). Geotextile tube dewatering: filtration
criteria. Proceedings of the 1st Pan American Geosynthetics
Conference, Cancun, Mexico, IFAI, pp. 506–513.
Liu, G. S. (1981). Design criteria of sand sausages for beach defences.
Proceedings of the 19th Congress of the International Association
for Hydraulic Research, New Delhi, India, pp. 123–131.
Mastin, B. J., Lebster, G. E. & Salley, J. R. (2008). Use of geotextile tube
dewatering containers in environmental dredging. Proceedings of the 1st Pan American Geosynthetics Conference, Cancun, Mexico,
IFAI, pp. 390–399.
McClarty, A., Cross, J., Gilbert, L. & James, G. M. (2006). Design and
construction of a coastal erosion protection groyne using
geocontainers, Langebaan, South Africa. Proceedings of the 8th
International Conference on Geosynthetics, Yokohama, Japan,
Millpress Science Publishers, Vol. 2, pp. 765–768.
Miller, S., Murphy, A., Veal, C. & Young, M. (1998). Improved Filtration
of Sewage Sludges Using Electro-Dewatering , Report No. ET/
IR140, CSIRO, Australia, November.
Montobbio, L. (2007). Setting safety of a site polluted by industrial waste
in contact with the Venice lagoon: ‘Pili’. Workshop on Approaches
for the Sustainable Management and Clearance of Mega-Sites: New
Perspectives, Agency for Environmental Protection and Technical
Services, Venice, Italy, November, pp. 1–46.Moo-Young, H., Gaffney, D. A. & Mo, X. H. (2002). Testing procedures
to assess the viability of dewatering with geotextile tubes.
Geotextiles and Geomembranes, 20, No. 5, 289–303.
Mori, H., Miki, H. & Tsuneoka, N. (2002a). The geo-tube method for
dioxin-contaminated soil. Geotextiles and Geomembranes, 20,
No. 5, 281– 288.
Mori, H., Miki, H. & Tsuneoka, N. (2002b). The use of geo-tube method
to retard the migration of contaminants in dredged soil. Proceedings
of the 7th International Conference on Geosynthetics, Nice, France,
Balkema, Vol. 3, pp. 1017–1020.
Muthukumaran, A. E. & Ilamparuthi, K. (2006). Laboratory studies on
geotextile filters as used in geotextile tube dewatering. Geotextiles
and Geomembranes, 24, No. 4, 210–219.
Newman, P., Hodgson, M. & Rosselot, E. (2003). The disposal of tailings
and minewater sludge using geotextile dewatering techniques. Proceedings of Processing and Disposal of Minerals Industry
Wastes, Falmouth, UK, 10 pp.
426 Lawson
Geosynthetics International , 2008, 15, No. 6
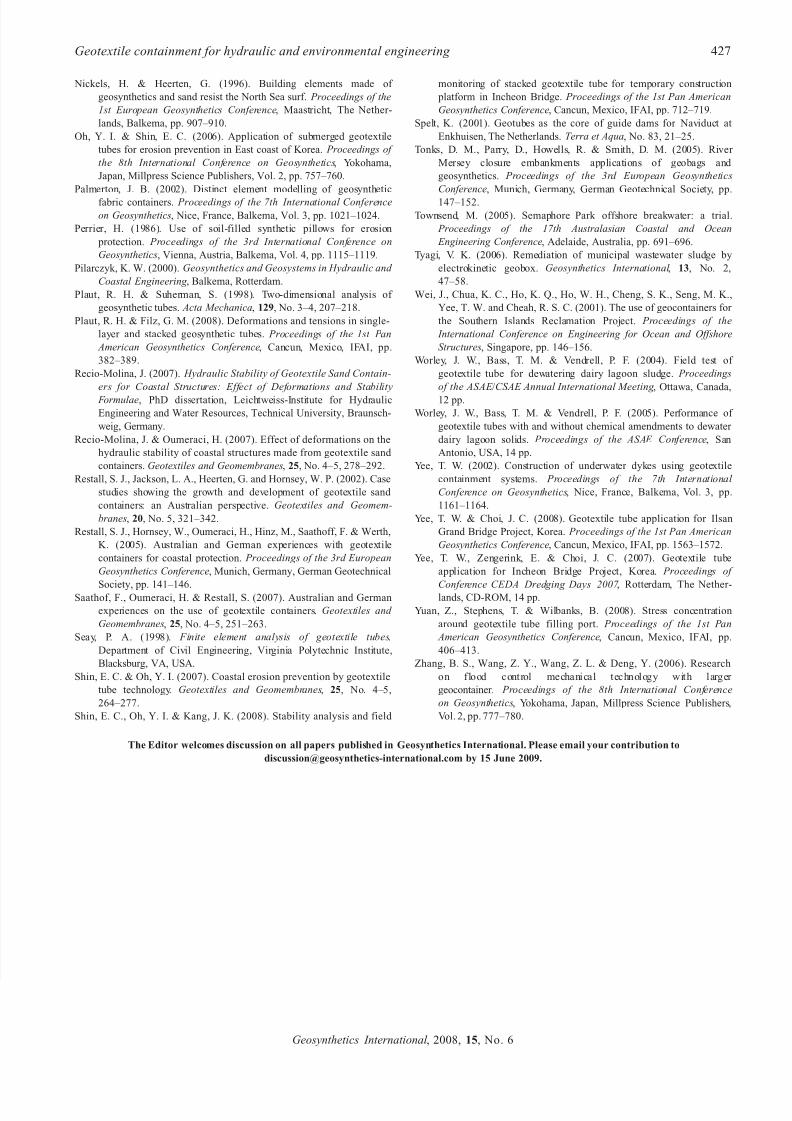
7/22/2019 Part 9 Reference Paper
http://slidepdf.com/reader/full/part-9-reference-paper 44/44
Nickels, H. & Heerten, G. (1996). Building elements made of
geosynthetics and sand resist the North Sea surf. Proceedings of the
1st European Geosynthetics Conference, Maastricht, The Nether-
lands, Balkema, pp. 907–910.
Oh, Y. I. & Shin, E. C. (2006). Application of submerged geotextile
tubes for erosion prevention in East coast of Korea. Proceedings of
the 8th International Conference on Geosynthetics, Yokohama,
Japan, Millpress Science Publishers, Vol. 2, pp. 757–760.
Palmerton, J. B. (2002). Distinct element modelling of geosynthetic
fabric containers. Proceedings of the 7th International Conference
on Geosynthetics, Nice, France, Balkema, Vol. 3, pp. 1021–1024.
Perrier, H. (1986). Use of soil-filled synthetic pillows for erosion
protection. Proceedings of the 3rd International Conference on
Geosynthetics, Vienna, Austria, Balkema, Vol. 4, pp. 1115–1119.
Pilarczyk, K. W. (2000). Geosynthetics and Geosystems in Hydraulic and
Coastal Engineering , Balkema, Rotterdam.
Plaut, R. H. & Suherman, S. (1998). Two-dimensional analysis of
geosynthetic tubes. Acta Mechanica, 129, No. 3–4, 207–218.
Plaut, R. H. & Filz, G. M. (2008). Deformations and tensions in single-
layer and stacked geosynthetic tubes. Proceedings of the 1st Pan
American Geosynthetics Conference, Cancun, Mexico, IFAI, pp.
382–389.
Recio-Molina, J. (2007). Hydraulic Stability of Geotextile Sand Contain-
ers for Coastal Structures: Effect of Deformations and Stability
Formulae, PhD dissertation, Leichtweiss-Institute for Hydraulic
Engineering and Water Resources, Technical University, Braunsch-
weig, Germany.
Recio-Molina, J. & Oumeraci, H. (2007). Effect of deformations on the
hydraulic stability of coastal structures made from geotextile sand
containers. Geotextiles and Geomembranes, 25, No. 4–5, 278–292.
Restall, S. J., Jackson, L. A., Heerten, G. and Hornsey, W. P. (2002). Case
studies showing the growth and development of geotextile sand
containers: an Australian perspective. Geotextiles and Geomem-
branes, 20, No. 5, 321–342.
Restall, S. J., Hornsey, W., Oumeraci, H., Hinz, M., Saathoff, F. & Werth,
K. (2005). Australian and German experiences with geotextile
containers for coastal protection. Proceedings of the 3rd European
Geosynthetics Conference, Munich, Germany, German Geotechnical
Society, pp. 141–146.Saathof, F., Oumeraci, H. & Restall, S. (2007). Australian and German
experiences on the use of geotextile containers. Geotextiles and
Geomembranes, 25, No. 4–5, 251–263.
Seay, P. A. (1998). Finite element analysis of geotextile tubes.
Department of Civil Engineering, Virginia Polytechnic Institute,
Blacksburg, VA, USA.
Shin, E. C. & Oh, Y. I. (2007). Coastal erosion prevention by geotextile
tube technology. Geotextiles and Geomembranes, 25, No. 4–5,
264–277.
Shin, E. C., Oh, Y. I. & Kang, J. K. (2008). Stability analysis and field
monitoring of stacked geotextile tube for temporary construction
platform in Incheon Bridge. Proceedings of the 1st Pan American
Geosynthetics Conference, Cancun, Mexico, IFAI, pp. 712–719.
Spelt, K. (2001). Geotubes as the core of guide dams for Naviduct at
Enkhuisen, The Netherlands. Terra et Aqua, No. 83, 21–25.
Tonks, D. M., Parry, D., Howells, R. & Smith, D. M. (2005). River
Mersey closure embankments applications of geobags and
geosynthetics. Proceedings of the 3rd European Geosynthetics
Conference, Munich, Germany, German Geotechnical Society, pp.
147–152.
Townsend, M. (2005). Semaphore Park offshore breakwater: a trial.
Proceedings of the 17th Australasian Coastal and Ocean
Engineering Conference, Adelaide, Australia, pp. 691–696.
Tyagi, V. K. (2006). Remediation of municipal wastewater sludge by
electrokinetic geobox. Geosynthetics International , 13, No. 2,
47–58.
Wei, J., Chua, K. C., Ho, K. Q., Ho, W. H., Cheng, S. K., Seng, M. K.,
Yee, T. W. and Cheah, R. S. C. (2001). The use of geocontainers for
the Southern Islands Reclamation Project. Proceedings of the
International Conference on Engineering for Ocean and Offshore
Structures, Singapore, pp. 146–156.
Worley, J. W., Bass, T. M. & Vendrell, P. F. (2004). Field test of
geotextile tube for dewatering dairy lagoon sludge. Proceedings
of the ASAE /CSAE Annual International Meeting , Ottawa, Canada,
12 pp.
Worley, J. W., Bass, T. M. & Vendrell, P. F. (2005). Performance of
geotextile tubes with and without chemical amendments to dewater
dairy lagoon solids. Proceedings of the ASAE Conference, San
Antonio, USA, 14 pp.
Yee, T. W. (2002). Construction of underwater dykes using geotextile
containment systems. Proceedings of the 7th International
Conference on Geosynthetics, Nice, France, Balkema, Vol. 3, pp.
1161–1164.
Yee, T. W. & Choi, J. C. (2008). Geotextile tube application for Ilsan
Grand Bridge Project, Korea. Proceedings of the 1st Pan American
Geosynthetics Conference, Cancun, Mexico, IFAI, pp. 1563–1572.
Yee, T. W., Zengerink, E. & Choi, J. C. (2007). Geotextile tube
application for Incheon Bridge Project, Korea. Proceedings of
Conference CEDA Dredging Days 2007 , Rotterdam, The Nether-lands, CD-ROM, 14 pp.
Yuan, Z., Stephens, T. & Wilbanks, B. (2008). Stress concentration
around geotextile tube filling port. Proceedings of the 1st Pan
American Geosynthetics Conference, Cancun, Mexico, IFAI, pp.
406–413.
Zhang, B. S., Wang, Z. Y., Wang, Z. L. & Deng, Y. (2006). Research
on flood control mechanical technology with larger
geocontainer. Proceedings of the 8th International Conference
on Geosynthetics, Yokohama, Japan, Millpress Science Publishers,
Vol. 2, pp. 777–780.
The Editor welcomes discussion on all papers published in Geosynthetics International. Please email your contribution to
[email protected] by 15 June 2009.
Geotextile containment for hydraulic and environmental engineering 427