part 75 cems field audit manual: appendix a - … · part 75 cems field audit manual: appendix a...
TRANSCRIPT

PART 75 CEMS FIELD AUDIT MANUAL:Appendix A - Example Audit Forms and Guide Sheets

[This page intentionally left blank.]

July 16, 2003
Part 75 CEMS Field Audit Manual: Appendix A - Example Audit Forms and Guide Sheets
Table of Contents
Page€
Pre-Audit Preparation Checklist . . . . . . . . . . . . . . . . . . . . . . . . . . . . . . . . . . . . . . . . . . . . . A-1€
CEMS Inspection Sheet . . . . . . . . . . . . . . . . . . . . . . . . . . . . . . . . . . . . . . . . . . . . . . . . . . . A-2€
Daily Calibration Error Test Observation Sheet . . . . . . . . . . . . . . . . . . . . . . . . . . . . . . . . A-12€
Linearity Test Observation Sheet . . . . . . . . . . . . . . . . . . . . . . . . . . . . . . . . . . . . . . . . . . . A-13€
Gas RATA Observation Sheet . . . . . . . . . . . . . . . . . . . . . . . . . . . . . . . . . . . . . . . . . . . . . A-14€
Flow RATA Observation Sheet . . . . . . . . . . . . . . . . . . . . . . . . . . . . . . . . . . . . . . . . . . . . A-22€
Relative Accuracy Equations . . . . . . . . . . . . . . . . . . . . . . . . . . . . . . . . . . . . . . . . . . . . . . A-28€
Appendix D Inspection Sheet . . . . . . . . . . . . . . . . . . . . . . . . . . . . . . . . . . . . . . . . . . . . . . A-29€
Appendix E Inspection Sheet . . . . . . . . . . . . . . . . . . . . . . . . . . . . . . . . . . . . . . . . . . . . . . A-31€
Sample Standard Operating Procedure for Linearity Tests . . . . . . . . . . . . . . . . . . . . . . . . A-32€
Sample Calibration Gas Cylinder Tracking Form . . . . . . . . . . . . . . . . . . . . . . . . . . . . . . . A-37€
Part 75 Field Audit Manual - July 16, 2003 Page A- i€

[This page intentionally left blank.]

Appendix A Pre-Audit Checklist
Pre-Audit Preparation Checklist
1. Electronic Data Review
a. Quarterly Feedback Reports
Review ETS feedback report. Download from the EPA mainframe (if you have access rights) or you can request a copy of the feedback from your CAMD contact. Also obtain a copy of the MDC feedback report available from your CAMD contact.
b. Using MDC Software
1.� Print out a copy of Monitoring Plan from the MDC software to bring with you to the plant.
2.� Generate and review MDC QA test evaluation reports. Also look for repeated QA tests during a quarter.
3.� Print out a copy of electronic RATA and linearity reports for comparison with on-site hard copy data.
4. Review exemption and grace period reports.
5.� Review reports of recertification events and, if submitted, of missing data events.
6. Use MDC Hourly to check hourly calculations and missing data periods.
7.� Use MDC Hourly graphing functions to chart emission trends for comparison to monitor spans, and for unusual data trends (abrupt changes or constant emission rate).
2. Hard Copy File Review
a. Review correspondence, petitions, and previous audit/inspection reports.
b.� If available, compare hard copy linearity test and RATA reports to the electronic reports in MDC. Also review the hard copy RATA test report with a focus on reference method documentation that can not be checked electronically with MDC.
c. Check that the unit has the required Acid Rain or operating permit.
Part 75 Field Audit Manual - July 16, 2003 Page A-1

CEMS Inspection Sheet Appendix A
CEMS Inspection Sheet
1. Plant and Audit Information
Plant Name:
ORIS Code:
City:
State:
Plant Contact:
Contact Phone Number:
Inspector Name:
Audit Date:
2. Probe and Probe Location Checks
What to Check Observations
Probe locations in the stack or duct are in the same location as in the monitoring plan?
Has the duct or stack location been modified? s)
Have the probe or probe components (e.g., dilution probe orifice) been changed?
(Dimension
Page A-2 Part 75 Field Audit Manual - July 16, 2003

Appendix A CEMS Inspection Sheet
3. Flow Monitors
What to Check Observations
Ask the source to perform a daily interference check or review the results of the most recent test. App. B § 2.1.2 requires a daily interference check for flow monitors. The interference check procedure and criteria are not defined by rule in Part 75. should be described in the QA/QC Plan.
When were the filters or transducers last replaced? ow does this compare to the QA/QC Plan?
Ask what the QA/QC procedures are for any temperature and stack pressure monitors used in conjunction with the flow monitor. Have there been any problems? Compare to the QA/QC plan and maintenance records.
Check if there have been any changes to kfactors and polynomial coefficients since the
last RATA. Changes to correction factors should be recorded in the maintenance log. A three load RATA is required following any change to flow monitor k-factors
(§75.20(b)). Also see Table 8 - DAHS.
What is the status of the control panel lights, indicators and alarms? isplays will vary by analyzer, so ask the source what the displays are and what they mean.
Check range settings, and compare to the monitoring plan. Has the source done the annual span/range check required by App. A?
It
H
D
Part 75 Field Audit Manual - July 16, 2003 Page A-3€

CEMS Inspection Sheet Appendix A
4. Dilution Air Systems (Including Air Cleaning Subsystem)
What to Check Observations
Has the dilution probe orifice been changed? e has been changed, ask if there is a procedure for changing the orifice in the QA/QC Plan, what prompts a change, and how the dilution ratio is verified.
Is the dilution probe ejector pump vacuum at or below the certification value? often is it checked?
What is the dilution ratio? heck the dilution air and analyzer flow settings. How are these set and verified? should all be described in the QA/QC plan.
Are correction factors applied to the dilution ratio for changes in pressure, temperature, or molecular weight? these been changed since the last RATA? Changes to correction factors should be recorded in the maintenance log,. testing may also be required . so see Table 8 - DAHS).
Check the inlet and outlet pressures of CO2 air cleaner filter. vels to the QA/QC Plan.
How often are the air cleaning filters and drying agents replaced? ompare to the QA/QC plan.
If the orific
How
C
These
Have
QA (Al
Compare le
C
5. Source Level Extractive Systems
What to Check Observations
Check the umbilical lines entering the CEMS shelter for condensation (visible water drops).
For a dry system using chillers check the chiller temperature. at is the proper temperature range, and how often is it verified? Compare against the QA/QC Plan.
Wh
Page A-4€ Part 75 Field Audit Manual - July 16, 2003

Appendix A CEMS Inspection Sheet
6. Analyzers
What to Check Observations
Ask the source if there have been any changes since the last audit or certification/recertification. Document the serial numbers and compare to those in the monitoring plan.
What is the status of the control panel lights, indicators and alarms? Displays will vary by analyzer, so ask the source what the displays are and what they mean.
Check range settings, and compare to the monitoring plan. Has the source done the annual span/range check required by App. A?
Compare the sample flow rate, if displayed by a rotameter (or a digital reading), to the QA/QC Plan.
Have there been any changes to correction factors (NOx quenching and moisture monitors) since the last RATA? Changes to correction factors should be recorded in the maintenance log, and the QA/QC Plan should outline the procedures for changing the correction factors (Appendix B, Section 1.1.3). QA testing may also be required (See §75.20(b), and Recertification and Diagnostic Testing Policy).
Part 75 Field Audit Manual - July 16, 2003 Page A-5€

CEMS Inspection Sheet Appendix A
7. Calibration Gases
What to Inspect Observations
Spot check the cylinder certificates versus the cylinder numbers engraved on the cylinder. Table A may be used to record information for each cylinder.
Verify that gases meet calibration gas definition in § 72.2. e Table B.
Check the expiration date of gas in cylinders. e of an expired cylinder is not in compliance with § 75.21(c).
Check the concentration values for each cylinder. e concentration ranges correct ? inearity test point ranges are shown below: Point 1: % - 30% of span Point 2: 50% - 60% of span Point 3: % - 100% of span
Check the zero air gas documentation. (Supplier certification): SO2, NOx and THC � 0.1 ppm CO � 1 ppm, and CO2 � 400 ppm [See § 72.2 and Policy Manual 10.2, 10.3]
Record the concentration values to check against the values recorded by the DAHS for calibration error and linearity tests.
Read the cylinder regulator pressure. Cylinder pressure should not be < 150 psi.
Check the regulator outlet pressure. The pressure or calibration gas flow rate should be set as specified in the QA test procedures in the QA/QC plan.
Are stainless steel regulators used for SO2
cylinders?
Se
Us
Arfor the span L
20
80
Page A-6€ Part 75 Field Audit Manual - July 16, 2003

Appendix A CEMS Inspection Sheet€
Table A:Calibration Gas Records
Gas Cylinder No.
Certificate Concentration
Type of Cal Gas (e.g., SRM, PRM,
etc.,)
Cylinder Pressure
Expiration Date
Certificat e
on File
Table B:Part 75 Calibration Gases (§ 72.2)
Calibration Gas Type Abbr. Description
NIST - standard reference material SRM Calibration gas obtained from the National Institute of Standards and Technology (NIST)
NIST - standard reference materialequivalent compressed gas primary reference material
PRM Listed in a declaration of equivalence with "EPA Traceability Protocol for Assay and Certification of Gaseous Calibration Standards," September 1997, EPA600/R-97/121[Traceability Protocol]
NIST - traceable reference material NTRM Tested and certified by NIST
NIST/EPA-approved certified reference materials
CRM Approved by EPA and NIST as evidenced by a certificate or other documentation issued by a certifying standard-setting body
Gas manufacturer’s intermediate standard
GMIS Assayed and certified by direct comparison to one of the other NIST standards listed in this table according to section 2.1.2.1 of th e Traceability Protocol
EPA protocol gas Protocol Vendor-certified to be within 2.0 percent of the cylinder label concentration [See Traceability Protocol]
Zero air material Zero Air Calibration gas certified by gas vendor: SO2, NOx and Total Hydrocarbons � 0.1 ppm, CO � 1 ppm, or CO2
� 400 ppm. mixture, other components certified not to interfere with target compound.
If a
Research gas mixture RGM NIST analyzed and certified as "NIST traceable.''
Part 75 Field Audit Manual - July 16, 2003 Page A-7

CEMS Inspection Sheet Appendix A
8. DAHS
What to Check Observations
Make sure that the version used is previously certified/recertified by checking against the Monitoring Plan.
Ask to see and check the DAHS verification test for the missing data and calculation routines. Verification test results for the missing data routines and emissions calculations are required to be kept on site by §§ 75.20(c)(9) and 75.63(a)(2)(iii). A vendor certification that the software meets Part 75 requirements is sufficient for missing data routines.
Ask the source what type of correction factors are applied, and how they are entered into the DAHS (pressure/temperature compensation, flow and moisture monitoring polynomials, sonic velocity correction factors, NOx quenching correction factors, dilution ratio settings).
Also ask if any changes have been made. Changes to correction factors should be recorded in the maintenance log, and the QA/QC Plan should outline the procedures for changing the correction factors (Appendix B, Section 1.1.3). QA testing may also be required (See §75.20(b), and Recertification and Diagnostic Testing Policy).
How are the RATA results recorded? RATA reference method data and RATA results can be input by han d. Review some recent tests to ver ify
that hard copy and electronic data match. Check that the dates and time, linearity error, relative accuracy, and bias adjustment factors (BAF) match. (See the RATA review sheet for additional checks.)
Is any other data input by hand? If so spot check to see that the DAHS data agree with hard copy data.
The following types of data may be entered manually: -Negative (< 0) emission values -Err oneous emission values (if significant must be approved by EPA) -SO2 concentration < 2.0 ppm -Reference method back-up data -RATA reference method data and RATA results -Leak checks, 7-day calibration error tests, and cycle time tests -Operating data (load and time) -Add-on control equipment operation during missing data periods [See item 8, below]
Page A-8€ Part 75 Field Audit Manual - July 16, 2003

Appendix A CEMS Inspection Sheet
9. Optional Control Equipment Parameter Monitoring (§ 75.34)
What to Check Observations
Check the QA/QC Plan which will identify add-on SO2 or NOx control equipment parameters and acceptable ranges if the source is using add-on control equipment missing data options. Parameters and acceptable ranges are required by App B, § 1.1.1.
Review control equipment parameter monitoring records for a number of missing data periods. mpare the parameter data to the acceptable ranges in the QA/QC Plan. tify any periods when the range is exceeded and how the missing data period was flagged in the DAHS (control operating properly or not operating properly).
Ask the source how it enters proper control equipment operation for missing data periods into the DAHS. nual entry of missing data period information is allowed by Part 75.
Co
Iden
Ma
Part 75 Field Audit Manual - July 16, 2003 Page A-9€

CEMS Inspection Sheet Appendix A
10. Maintenance Log Review
What to Check Observation
Do the log entries sufficiently describe the action taken? e entries understandable?
Does the log show maintenance checks at the frequency identified in the QA/QC Plan? Are all records available (see Table C)?
Identify recurring failures or malfunctions recorded in the log.
Are malfunctions resolved as specified in the QA/QC Plan?
Do events in the maintenance log correspond to reported missing data periods in the quarterly reports?
Are there repeated adjustments to the zero or span?
Have system parts or components been replaced? If so has the proper recertification or diagnostic testing been performed?
Does the log show any pre-RATA adjustments?
Are th
Table C:Maintenance Record Requirements (Appendix B § 1.1.3)
The following records are required by the QA/QC Plan provisions of Part 75:
! date, time, and description of any testing, adjustment, repair, replacement, or preventive maintenance action performed on any monitoring system.
! records of any corrective actions associated with a monitor’s outage period.
! any adjustment that changes a system’s ability to record and report emissions data (e.g., changing of flow monitor or moisture monitoring system polynomial coefficients, K factors or mathematical algorithms, changing of temperature and pressure coefficients and dilution ratio settings).
! a written explanation of the procedures used to make the adjustment(s) shall be kept.
Page A-10 Part 75 Field Audit Manual - July 16, 2003
Appendix A CEMS Inspection Sheet
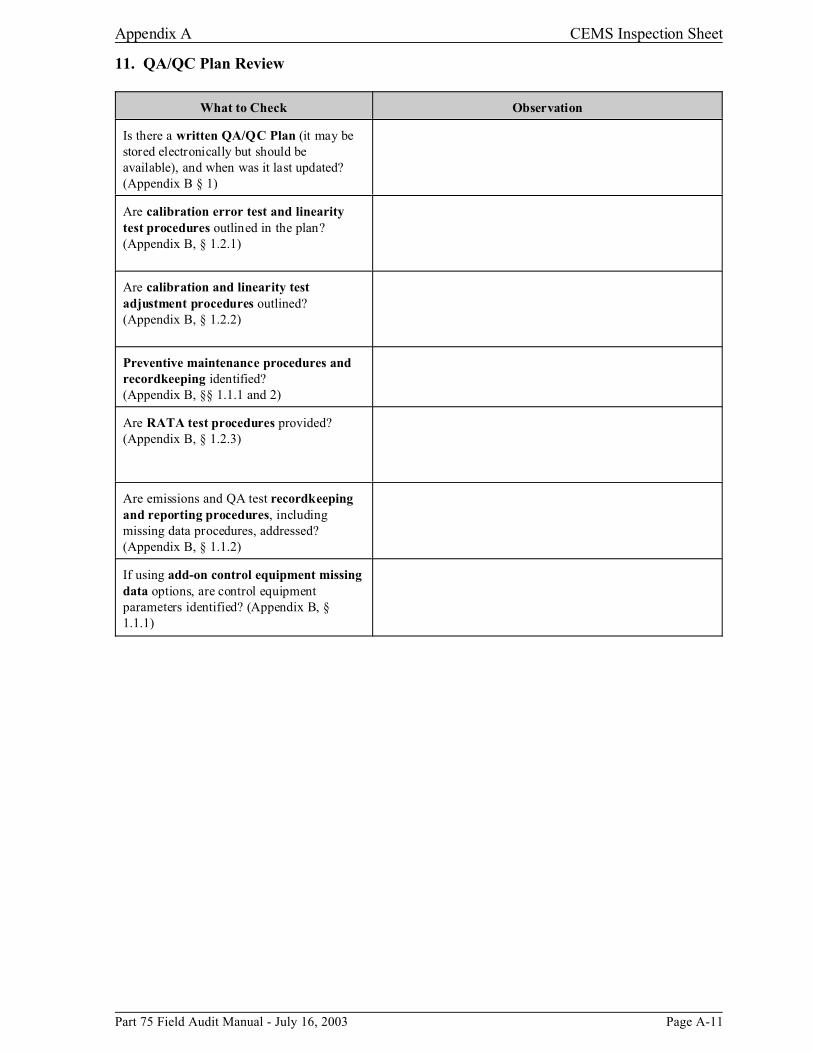
11. QA/QC Plan Review
What to Check Observation
Is there a written QA/QC Plan (it may be stored electronically but should be available), and when was it last updated? (Appendix B § 1)
Are calibration error test and linearity test procedures outlined in the plan? (Appendix B, § 1.2.1)
Are calibration and linearity test adjustment procedures outlined? (Appendix B, § 1.2.2)
Preventive maintenance procedures and recordkeeping identified? (Appendix B, §§ 1.1.1 and 2)
Are RATA test procedures provided? (Appendix B, § 1.2.3)
Are emissions and QA test recordkeeping and reporting procedures, including missing data procedures, addressed? (Appendix B, § 1.1.2)
If using add-on control equipment missing data options, are control equipment parameters identified? (Appendix B, § 1.1.1)
Part 75 Field Audit Manual - July 16, 2003 Page A-11€

CEMS Inspection Sheet Appendix A
Daily Calibration Error Test Observation
If offline calibrations are done, was the offline-online test passed? ____________________
System /Component ID: ____________________ ameter Monitored: _____________________ Value, S: ________
Date/time Ca libra tion V alu e, R CE M Re sponse, A
CE Resu lts
Par Span
(ppm, %, SCFH or fpm) (ppm, %, SCFH or fpm) (% of span) R - A
(ppm, %, SCFH or fpm)
Zero level check
Upscale check
System /Component ID: ____________________ ameter Monitored: _____________________ Value, S: ________
Date/time Ca libra tion V alu e, R CE M Re sponse, A
CE Resu lts
Par Span
(ppm, %, SCFH or fpm) (% of span) R - A
(ppm, %, SCFH or fpm)
(ppm, %, SCFH or fpm)
Zero level check
Upscale check
System /Component ID: ____________________ ameter Monitored: _____________________ Value, S: ________
Date/time Ca libra tion V alu e, R CE M Re sponse, A
CE Resu lts
Par Span
(ppm, %, SCFH or fpm) (% of span) R - A
(ppm, %, SCFH or fpm)
(ppm, %, SCFH or fpm)
Zero level check
Upscale check
System /Component ID: ____________________ ameter Monitored: _____________________ Value, S: ________
Date/time Ca libra tion V alu e, R CE M Re sponse, A
CE Resu lts
Par Span
(ppm, %, SCFH or fpm) (% of span) R - A
(ppm, %, SCFH or fpm)
(ppm, %, SCFH or fpm)
Zero level check
Upscale check
For NOX and SO2:
For CO2 and O2:
where:�CE = Calibration Error (% of span) A = Actual CEMS Response R = Reference Gas Value S = CEMS Span Value
Page A-12 Part 75 Field Audit Manual - July 16, 2003

Appendix A Linearity Test Observation Sheet
Linearity Test Observation
1. Plant and Audit Information
Plant Name: ORIS Code:
State: State Plant ID:
Plant Contact: Phone Number:
Inspector Name: Audit Date:
2. System Information
Parameter Monitored:
System/Component ID:
Span Value:
3. Observations
Certified calibration gases?
Are the cal gas concentrations appropriate for each range?
Low 20% - 30%
Mid 50%- 60%
High 80 - 100%
Were gases injected nonconsecutively?
Concentration stable before recording? (not to exceed 15 minutes)?
4. Test Results
Gas Range Low Mid High
Cal Gas Value (R)
Gas Cylinder ID No.
Run #
1
2
3
Mean Response (A)
| R - A |
Linearity Result (LE)
where LE = Percent Linearity Error€R = Reference value of calibration gas€A = Average of monitoring system response€
Part 75 Field Audit Manual - July 16, 2003 Page A-13

Gas RATA Observation Sheet Appendix A
Gas RATA Observation
1. Plant and RATA Information
Plant Name: ORIS Code:
State: State Plant ID:
Plant Contact: Phone Number:
Test Firm: Crew Chief:
Inspector Name: RATA Date:
2. Unit/System Information
Stack/Unit ID:
Parameter Monitored:
System/Component ID:
Span Value:
3. RATA Observations
RATA Checks Observations
Unit Operation Conditions: Check and record unit fuel and operating load. the load level stable
Fuel Burned: Is
throughout the RATA test? Load During Test (Run/Load):
The fuel should be a normal fuel listed in the monitoring plan (App. A, § 6.5(a))
RATA should be performed at normal load. Check the load against the monitoring plan normal load.
CEMS Calibration Error Test (Prior to the RATA) Zero Result: Upscale Result:
Were any pre-RATA adjustments made to the CEMS?
Pre-RATA non-routine adjustments are allowed by Part 75. Adjustments may not be made between runs at a load level or between load levels except for routine adjustments as a result of the calibration error test (App. B § 2.1.3).
(cont.)
Page A-14 Part 75 Field Audit Manual - July 16, 2003

Appendix A Gas RATA Observation Sheet
3. RATA Observations (cont.)
RATA Checks Observations
Does the stack test equipment setup match that required by the reference method?
O2/CO2/MW- RM3 or RM3a H2O - RM4 (wet bulb-dry bulb technique may not be used to correct dry basis measurements in determining emission rate) SO2 - RM6 or RM6c NOx - RM7, RM7E, or RM20
Check the traverse point locations for the reference method tests, and the sampling location dimension s. The stack dimension s should be based on measurements not drawings. Gas tests should use at least 3 traverse points. Check PS2 in Part 60, App. B. Units with wet scrubbers may use a shorter measurement line than required by PS2 if minimal stratification is demonstrated, and moisture and gas systems may use a single point if the stratification test is passed (App. A, § 6.5.6).
Has a stratification test been performed and passed? Stratification testing is required for units wishing to use fewer traverse points under the alternatives allowed by App. A, § 6.5.6(a) and (b). Stratification testing is described in App. A, §6.5.6.1 - 6.5.6.3.
For a NOx RATA using the instrumental RM 7E, is the NOx converter efficiency documented through a performance test? A NOx converter efficiency test is required if the NO2 concentration is greater than 5 ppm. The efficiency test is described in RM 20.
Check the reference method calibration gases used for instrumental methods. The calibration gas certificate sh ould show: ! EPA Protocol gases or other Part 75 certified gases. ! Concentrations which match that used in the bias/drift check
calculations. ! Expiration date after the RATA
The regulator gauge should show a cylinder pressure >150 psi.
Check the results of the pretest linearity check of the reference method analyzer. Were the calibration gases injected at the same pressure and temperature as the stack gases? Difference between the calibration gas value and response should be within 2% of th e span for the linearity test. Otherwise the test is repeated until passed. No adjustments can be made to the analyzer after the linearity check.
Record and check the span of the reference method analyzers. A test run is invalid if a measured concentration exceeds the span. (Method 6C, Sec. 2.1)
(cont.)
Part 75 Field Audit Manual - July 16, 2003 Page A-15€

Gas RATA Observation Sheet Appendix A
3. RATA Observations (cont.)
RATA Checks Observations
Record and independently calculate the bias/drift checks performed on the reference method sampling system before and after each run that you observe (Use Table in 4). The response should be stable before it is recorded. For bias/drift checks the sampling system bias must be within 5% of th e span, and the calibration drift must be within 3% of span.
Check that the CEMS data periods and reference method data run times match. Also check that run times meet the required minimum 21 minutes.
Observe post-test leak check. Wet chemistry reference methods require a post-test leak check -- if failed the run is not valid.
Record or obtain a copy of the results if test calculations are performed on site. You should also perform your own calculations on site directly from the test data to compare to the tester’s results. (See Tables 5 and 6).
Page A-16€ Part 75 Field Audit Manual - July 16, 2003

Appendix A Gas RATA Observation Sheet
4. Reference Method System Calibration Bias and Drift Checks
Gas: Run: Analyzer
Calibration Response
Initial Values Final Values Drift
(percent of span)
Instrument Span: System Calibration Response
System Cal. Bias (percent of
span)
System Calibration Response
System Cal. Bias (percent of
span)
Zero Gas:
Upscale Gas:
Gas: Run: Initial Values Final Values Analyzer Drift
Instrument Calibration
System System Cal. System System Cal. (percent of
Span: Response�
Calibration Bias (percent of Calibration Bias (percent of span)
Response span) Response span)
Zero Gas:
Upscale Gas:
Gas: Run: Analyzer
Calibration Response
Initial Values Final Values Drift
(percent of span)
Instrument Span: System Calibration Response
System Cal. Bias (percent of
span)
System Calibration Response
System Cal. Bias (percent of
span)
Zero Gas:
Upscale Gas:
Part 75 Field Audit Manual - July 16, 2003 Page A-17

�
�
Gas RATA Observation Sheet Appendix A
5. Reference Method Calculations
For sampling run durations of less than 1 hour, measurements at 1-minute intervals or a minimum of 30
measurements, whichever is less restrictive, shall be used.
a. Percent by volume
Use equation 6C-1 from Method 6C to calculate the run percent by volume (ppm or %)
Eq. 6C-1
Cgas = Effluent gas concentration, dry basis, ppm.
Cavg = Average gas concentration indicated by gas analyzer, dry basis, ppm or %.
Co = Average of initial and final system calibration bias check responses for the zero gas, ppm, or %
Cm = Average of initial and final system calibration bias check responses for the upscale calibration gas, ppm or %.
Cma = Actual concentration of the upscale calibration gas, ppm or %.
b. Percent by volume (O2 with low-level calibration gas)
For O2 analyzers that use a low-level calibration gas in place of a zero gas, calculate the effluent gas concentration using Equation 3A-1.
Cma - Coa
Cgas = ————————— (C - Cm) + Cma Eq. 3A-1 Cm - Co
Cma = Actual concentration of the upscale calibration gas, percent
Coa = Actual concentration of the low-level calibration gas, percent.
Cm = Average of initial and final system calibration bias check responses for the upscale calibration gas, percent.
Co = Average of initial and final system calibration bias check responses for the low level gas, percent.
C = Average gas concentration indicated by the gas analyzer, dry basis, percent.
Page A-18 Part 75 Field Audit Manual - July 16, 2003

Appendix A Gas RATA Observation Sheet
c. NOx lbs/mmBtu Calculation
O2 Diluent - When the NOx continuous emission monitoring system uses O2 as the diluent, and measurements are performed on a dry basis, use the following conversion procedure
When measurements are performed on a wet basis, use the equations in method 19 in appendix A of part 60.
CO2 Diluent - When the NOx continuous emission monitoring system uses CO2 as the diluent, use the following conversion procedure:
When CO2 and NOx measurements are performed on a different moisture basis, use the equations in method 19 in appendix A of part 60.
Where:
E = Pollutant emissions during unit operation, lb/mmBtu
K = 1.194 × 10⁻⁷ (lb/dscf)/ppm NOx.
Ch = Hourly average pollutant concentration during unit operation, ppm.
%O2, %CO2 = Oxygen or carbon dioxide volume during unit operation (expressed as percent O2 or CO2).
F, Fc = a factor representing a ratio of the volume of dry flue gases generated to the caloric value of the fuel combusted (F), and a factor representing a ratio of the volume of CO2 generated to the calorific value of the fuel combusted (Fc), respectively.
Fuel
Coal (as defined by ASTM D388-92):
F- AND FC-FACTORS1
F-factor (dscf/mmBtu)
FC-factor (scf CO2/mmBtu)
Anthracite 10,100 1,970
Bituminous and subbituminous 9,780 1,800
Lignite 9,860 1,910
Oil 9,190 1,420
Gas:
Natural gas 8,710 1,040
Propane 8,710 1,190
Butane 8,710 1,250
Wood:
Bark 9,600 1,920
Wood residue 9,240 1,830 1 Determined at standard conditions: 20 °C (68 °F) and 29.92 inches of mercury.
Part 75 Field Audit Manual - July 16, 2003 Page A-19

Gas RATA Observation Sheet Appendix A
6. Relative Accuracy Calculations
a. RELATIVE ACCURACY DETERMINATION (POLLUTANT CONCENTRATION MONITORS)
Run No. Date and
time
SO2 (ppmc) Date and time
CO2 (Pollutant) (ppmc)
RMa Mb Diff RMa Mb Diff
1.
2.
3.
4.
5.
6.
7.
8.
9.
10.
11.
12.
Arithmetic Mean Difference (Eq. A-7):
Standard Deviation (Eq. A-8):
Confidence Coefficient (Eq. A-9):
Relative Accuracy (Eq. A-10):
a RM means "reference method data." b M means "monitor data."
Make sure the RM and M data are on a consistent basis, either wet or dry.
Page A-20 Part 75 Field Audit Manual - July 16, 2003
c

Appendix A Gas RATA Observation Sheet
b. RELATIVE ACCURACY DETERMINATION (NOX/DILUENT COMBINED SYSTEM)
Run N o. Date and
time
Reference method data NOx system (lb/mmBtu)
NOx( )a O2/CO2% RM M Difference
1.
2.
3.
4.
5.
6.
7.
8.
9.
10.
11.
12.
Arithmetic Mean Difference (Eq. A-7).
Standard Deviation (Eq. A-8):
Confidence Coefficient (Eq. A-9).
Relative Accuracy (Eq. A-10):
a Specify units; ppm, lb/dscf, mg/dscm.
Part 75 Field Audit Manual - July 16, 2003 Page A-21

Flow RATA Observation Sheet Appendix A
Flow RATA Observation
Note - The RATA observations suggested in this checklist, beginning with item 4, are for flow RATAs performed using Method 2. A detailed observer checklist is available and should be used for new Reference Methods 2F, 2G, and 2H. See CAMD’s website at: http://www.epa.gov/airmarkets/monitoring/index.html
1. Plant and RATA Information
Plant Name: ORIS Code:
State: State Plant ID:
Plant Contact: Phone Number:
Test Firm: Crew Chief:
Inspector Name: RATA Date:
2. Unit/System Information
Stack/Unit ID: Stack Diameter:
System/Component ID: Stack Area:
Span Value: Normal Load Levels (circle)
H M L
3. RATA Observations
RATA Checks Observations
Unit Operation Conditions: Fuel Burned: Check and record unit fuel and operating load. Is the load level stable throughout the RATA test?
The fuel should be a normal fuel listed in the€monitoring plan (App. A, § 6.5(a)).
Load During Test (Run/Load):
For certification and recertification, must perform€flow RATA at three loads for most units (only one€load level is required for peaking units or bypass€stacks). Regular QA Flow RATAs must be€performed at a minimum of 2 loads (one load for:€peaking units or bypass stacks; alternate tests if€conducted semiannually; or units that conduct€supporting 1-load test analysis) (App. A, § 6.5.2).€
Daily Calibration Error Test performed prior to the RATA
Zero Result:
Upscale Result:
(cont.)
Page A-22 Part 75 Field Audit Manual - July 16, 2003

Appendix A Flow RATA Observation Sheet
3. RATA Observations (cont.)
RATA Checks Observations
Were any pre-RATA adjustments made to the CEMS?
Pre-RATA non -routine adjustmen ts are allowed by Part 75. Adjustments may not be made between runs at a load level or between load levels except for routine adjustmen ts as a result of the calibration error test (App. B, § 2.1.3).
4. RATA Observations (Method 2)
RATA Checks Observations
Does the stack test equipment setup match that required by the reference method? Circle reference methods below:
Velocity and Volumetric Flow - Method 2, 2F, 2G, 2H O2/CO2/MW- RM3 or RM3a H2O - RM4 (condensation or wet bulb - dry bulb)
If Method 2F, 2G, or 2H is used, you should use the inspection checklists developed specifically for those methods available at CAMD’s website (See Note at top of the checklist)
Check the traverse point locations (RM 1) for the reference method tests, and the sampling location dimensions. Are the sampling points correctly marked on the pitot tube? A flow test should use at least 12 traverse points, unless also using RM 2H which requires at least 16 points (Part 60, Appendix B).
Stack Dimensions Measured: Yes No Stack Dimensions: Number of Traverse Point:
Was a pre-test leak check performed? This is optional.
Observe the pitot tube position at the sample points. It should match the sample point markings on the tube or probe. Is the pitot aligned perpendicular to the stack/duct centerline?
Are the �p readings stable before recorded?
Observe post-test leak check. Leak checks are required after each flow method run -- if failed the run is not valid.
How many moisture measurements are taken?
Are monitor and reference method data corrected to wet standard conditions?
(cont.)
Part 75 Field Audit Manual - July 16, 2003 Page A-23

Flow RATA Observation Sheet Appendix A
4. RATA Observations (Method 2) (cont.)
RATA Checks Observations
Record calibration data and stack data in Tables 5 and 6.
Record or obtain a copy of the results if test calculations are performed on site. Check the RATA calculations (see 8 and 9). Verify that the CEMS data and reference method data are for the same runs.
5. Equipment Calibration Data
Probe Type:
Value Calibration Date
Pitot Cp (or F2 at zero pitch angle for 3D probe)
DGM Y Factor (if RM4 - condensation method)
6. Stack Data
Run Number:
a. barometric pressure (in Hg):
b. stack static pressure (in H2O):
c. stack temperature (F)
d. impinger vol (ml):
e. silica gel �wt (g)
f. total moisture wt (g) (b + c)
g. CO2 (% dry volume)
h. O2 (% dry volume)
Page A-24 Part 75 Field Audit Manual - July 16, 2003

Appendix A Flow RATA Observation Sheet
7. Example Velocity Traverse Data Sheet (Method 2)
Traverse Pt. No.
Vel. Hd., �p (in.) H2O
Stack Temperature Pg
(in.Hg) (�p)1/2
Ts, (°F)
Ts, °K (°R)
Average
Part 75 Field Audit Manual - July 16, 2003 Page A-25€

Flow RATA Observation Sheet Appendix A
8. Reference Method 2 Calculations
Molecular Weight of Stack Gas Ms = Md (1 - Bws) + 18.0 Bws
Average Stack Gas Velocity
Average Stack Gas Volumetric Flow Rate
A = Cross-sectional area of stack, m2 (ft2). Bws = Water vapor in the gas stream [from Method 4 (reference method) or Method 5],
proportion by volume. Cp = Pitot tube coefficient, dimensionless. Kp = Velocity equation constant (English Units = 85.49) Md = Molecular weight of stack gas, dry basis (see Section 8.6), g/g-mole (lb/lb-mole). Ms = Molecular weight of stack gas, wet basis, g/g-mole (lb/lb-mole). Pg = Stack static pressure,(in. Hg). Ps = Absolute stack pressure (Pbar + Pg),(in. Hg), Pstd = Standard absolute pressure,(29.92 in. Hg). Q = Volumetric stack gas flow rate corrected to standard conditions (scf/hr). Ts = Stack temperature,(°F).
Ts(abs) = Absolute stack temperature,(°R) (460 + Ts)
Tstd = Standard absolute temperature, (528 °R). conditions, vs = Average stack gas velocity, m/sec (ft/sec). W = Width. �p = Velocity head of stack gas,(in. H20). 3600 = Conversion Factor, sec/hr.
Page A-26€ Part 75 Field Audit Manual - July 16, 2003
Appendix A Flow RATA Observation Sheet
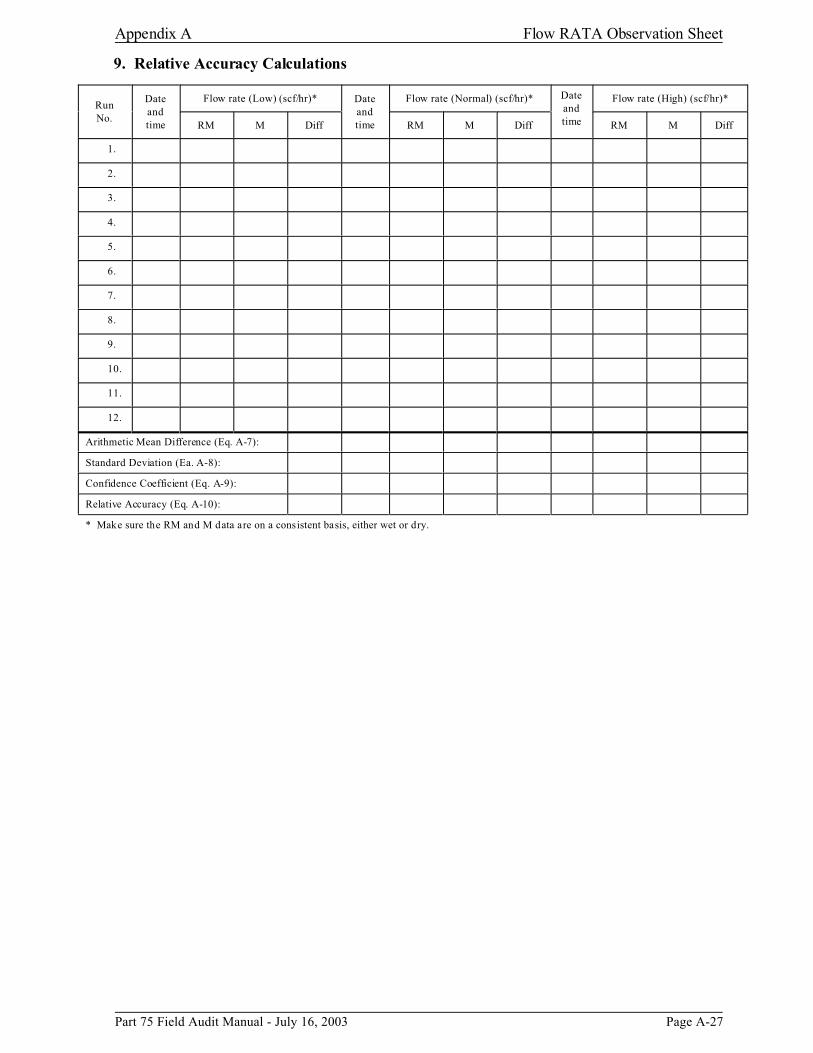
9. Relative Accuracy Calculations
Run No.
Date and time
Flow rate (Low) (scf/hr)* Date and time
Flow rate (Normal) (scf/hr)* Date and time
Flow rate (High) (scf/hr)*
RM M Diff RM M Diff RM M Diff
1.
2.
3.
4.
5.
6.
7.
8.
9.
10.
11.
12.
Arithmetic Mean Difference (Eq. A-7):
Standard Deviation (Ea. A-8):
Confidence Coefficient (Eq. A-9):
Relative Accuracy (Eq. A-10):
* Make sure the RM and M data are on a consistent basis, either wet or dry.
Part 75 Field Audit Manual - July 16, 2003 Page A-27€

1
2
3
4
5
6
7
8
9
10
11
Relative Accuracy Equations Appendix A
Relative Accuracy Equations
Equation ID Equation Variables€
Arithmetic d = Diff = RM - M for each run€Mean n = Number of runs€Difference Sd = Standard deviation€Eq. A-7 t0.025 = t value (see table)€
Standard€Deviation€Eq. A-8€
Confidence€Coefficient€Eq. A-9€
Relative€Accuracy€Eq. A-10€
CC = Confidence coefficient€RM = Arithmetic mean of reference method€values€RA = Relative accuracy€
Table of T-values
n-1 t0.025 n-1 t0.025 n-1 t0.025
12.706 12 2.179 23 2.069
4.303 13 2.160 24 2.064
3.182 14 2.145 25 2.060
2.776 15 2.131 26 2.056
2.571 16 2.120 27 2.052
2.447 17 2.110 28 2.048
2.365 18 2.101 29 2.045
2.306 19 2.093 30 2.042
2.262 20 2.086 40 2.021
2.228 21 2.080 60 2.000
2.201 22 2.074 >60 1.960
Page A-28 Part 75 Field Audit Manual - July 16, 2003

Appendix A Appendix D Inspection Sheets
Appendix D Inspection Sheets
1. Plant and Audit Information
Plant Name:
ORIS Code:
City:
State:
Plant Contact:
Contact Phone Number:
Inspector Name:
Audit Date:
2. Fuel Sampling and Analysis Review
Fuel Sampling and Analysis Checks Observations
How is fuel sampling data (sulfur content, density, GCV) entered into the DAHS? es the electronic data match hardcopy data? to pull up the fuel data in the DAHS (or bring a pr intout of MDC Hourly fuel data) tcheck the electronic data by comparing to the hardcopy fuel sampling and analysis data.
Are the fuel sampling and analysis procedures outlined in the QA/QC plan and do they match plant practices? e QA/QC plan should include:
• Standard fuel sampling procedures used by source or supplier. ld specify ASTM method or other approved methods
• For oil, procedures for splitting and storing samples, and sen ding samples off-site for analysis.
• ASTM methods used to analyze samples for sulfur, GCV, and density.
Do the sample analysis methods meet Part 75 requirements? Record sample analysis methods for sulfur, GCV, and density, and compare to Appendix D.
Do the oil or gas sampling methods and frequencies meet the requirements in the QA/QC
Plan meet Appendix D requirements? Record sampling and analysis frequency and methods (Print a copy of Table D-4 or Table D-5 in Appendix D bring to the inspection).
DoAsk the source
and spo
Th
Shou
Part 75 Field Audit Manual - July 16, 2003 Page A-29

Appendix D Inspection Sheets Appendix A
3. Fuel Flowmeter Checks
Fuel Flowmeter Checks Observations
Is the fuel flow meter a designated billing meter? Billing meters are exempt from quality assurance requirements. illing meter designation should be in the electronic monitoring plan. No further checks are necessary.
Billing Meter: Yes No
Are the fuel flow meter test procedures and the transducer or transmitter accuracy test procedures outlined in the plan? e source how often (and how) the tests are performed, and compare to the plan and Part 75 requirements.
Ask the source for a copy of the fuel flowmeters accuracy test report, which should be in a format similar to Part 75, Appendix D, Table D-1 or D-2. You can verify the test calculations.
Check that the hardcopy fuel flowmeter accuracy test results match the electronic values reported in the EDR. DC can provide a copy of the electronic report that you can bring to the plant.
What types of maintenance checks are performed on the fuel flow meters? What are the primary element inspection procedures? Have there been any problems and how were the problems resolved? Do the procedures match those in the QA/QC plan.
Have fuel flow meters been replaced? sk and compare the fuel flow meters to those identified in the monitoring plan. Replaced fuel flow meters require recertification.
Check the fuel flowmeter, transducer, or transmitter calibration and maintenance records for QA tests, maintenance, and for malfunctions that may have caused missing data.
The b
Ask th
M
A
4. DAHS Checks
Fuel Flowmeter Checks
Check the current DAHS version against the monitoring plan, and check records confirming that DAHS verification tests were conducted for the missing data routines. The latest test should have occurred no earlier than when the unit began using EDR v2.1 (or v2.2, when applicable).
Observations
How are missing data period data entered into the DAHS? entered by hand, spot check the data with supporting hardcopy information.
If
Page A-30€ Part 75 Field Audit Manual - July 16, 2003

Appendix A Appendix E Inspection Sheets
Appendix E Inspection Sheets
1. Plant and Audit Information
Plant Name:
ORIS Code:
City:
State:
Plant Contact:
Contact Phone Number:
Inspector Name:
Audit Date:
2. QA/QC Operating Parameters
What to Check Observations
Check and record the recommended range of QA/QC parameters in the QA/QC plan. re should be at least 4 parameters for turbines or reciprocating engines, and oxygen for boilers. (Appendix E, § 2.3.2).
Spot check the hourly parameter records to identify any parameter deviation periods. sk that the electronic data for that period be brought up on the DAHS to verify that the electronic data correctly identified a missing data period.
Also request that the source identify any parameter deviations, and ensure that proper missing data procedures are used for those hours. urce is required to redetermine the App. E correlation if a single deviation period exceeds 16 operating hours.
The
A
The so
3. NOx Emission Rate Testing
What to Check Observations
Check that the test procedures are described in the QA/QC plan. s is a required component of the QA/QC plan. e procedures should match the test requirements in Appendix E, § 2.1.
If not done prior to the visit, check hardcopy test results to verify that fuels, loads, and NOx rates match those reported electronically in the EDR monitoring plan. e MDC to pr int out a copy of the monitoring plan prior to your visit.)
ThiTh
(Us
Part 75 Field Audit Manual - July 16, 2003 Page A-31

Sample Linearity Test Standard Operating Procedure Appendix A
Sample Standard Operating Procedure
Planning and Performing a Part 75 Linearity Test*
Pre- Audit Survey:
In preparation for the performance of a linearity test, it is important that the following information be obtained through a phone call to the facility's environmental coordinator:
1.� How close (in feet) is it possible to back the test trailer to a point that can be used to introduce the test gases to the CEMS? [Usually a point near the daily calibration gases for the unit.]
2.� Can connection to the CEMS calibration sample injection point be made through the use of 1/4” swagelock nut fitting? If not what type of connector is required?
3.� What is the normal sample flow rate to the analyzers at the sample point? [That is, what are the flow rates used to perform the daily calibrations? What sample flow rates are used to perform the quarterly linearities?] OR, what is the usual sample delivery pressure used in conducting the quarterly linearities or daily calibrations?
4. What are the span values for the NOx, SO2, and CO2 monitors to be evaluated?
5.� Is the CEMS a dilution or source level extractive system? Are single or multiblend gases typically used for daily calibrations?
6.� What is the normal response time experienced when the facility runs its quarterly linearities?
7.� What additional safety requirements might be of concern in the area in which the audit is to be performed?
8.� What is the plant’s policy for the use of walkie talkie equipment, if needed? Can we use our own or do we need to ask for plant equipment?
9.� Remember to mention the "Hands Off" policy and that a plant representative will be required for hooking the audit delivery line to the CEMS. Also, plant personnel will be required to retrieve the data from the CEMS.
* This sample procedure was adapted from a procedure prepared by the Florida Department of Environmental Protection.
Pre-Audit Preparation:
10.�Select the proper gases to perform the audit based on the span values for the monitors to be evaluated. Gas values for each pollutant must be selected such that a low range gas of 20% - 30% of the span value, a mid range gas of 50% - 60% of the span value, and a high range gas of greater than 80% of span are selected.
Page A-32 Part 75 Field Audit Manual - July 16, 2003

Appendix A Sample Linearity Test Standard Operating Procedure
11.�Make sure that each of the cylinders have not expired, and obtain a copy of each of the certification sheets.
12.�Check that the cylinder cap is not stuck and that it will be possible to remove it easily in the field.
13.�For each gas loaded into the audit trailer keep the cylinder certification sheets in a folder to be placed in the cab of the truck and a log sheet summarizing the contents and concentrations of each cylinder.
14. Select the proper regulator for each of the cylinders to be used.
14.a � Identify the regulator. Check the label and the inlet and outlet gauges. Ascertain that the high-pressure gauge is suitable for the pressure of the cylinder value outlet.
14.b� Inspect the regulator. Check the regulator for evidence of damage or contamination. If there is any evidence of physical damage, or foreign material inside the regulator, contact the customer service representative for return or repair information.
15. Gather all equipment needed for performing the audit.
16.�Check the condition of the tires on the audit trailer and inspect the tow vehicle prior to departure. Check for tire pressures, condition, oil level, belt conditions, etc.
17.�At the appropriate facility (such as a calibration test equipment center), attach the regulators to each cylinder to check the cylinder tank pressures. If any tank has a pressure less than 700 psi it should not be used for the linearity test audit.
Pre-Inspection Meeting:
During the pre-inspection meeting, review the test procedure and address any special circumstances of safety issues for working in the designated area for that day.
Part 75 Field Audit Manual - July 16, 2003 Page A-33

Sample Linearity Test Standard Operating Procedure Appendix A
Setup:
18. Back the trailer into position.
19. Open the tail gate.
20. Uncap the cylinder gases.
21. Attach the regulators.
21.a.� Inspect the regulator. Check the regulator for evidence of damage or contamination. If there is any evidence of physical damage, or foreign material inside the regulator, do not use the regulator for the test.
21.b.� Inspect the cylinder valve. Check the cylinder valve for evidence of damage or contamination. Remove any foreign material before attaching the regulator.
21.c.� Attach the regulator. Fasten the regulator to the cylinder and tighten the inlet nut securely. (Do not over tighten the inlet nut or damage to the threads may occur)
21.d.� Close the regulator. To close the regulator turn the adjusting knob to the full counter-clockwise position. The regulator must be closed before opening the cylinder valve.
21.e.� With the regulator adjusting knob turned fully counter-clockwise, place both hands on the cylinder valve and open it slowly, allowing the pressure to rise gradually in the regulator. Stand as shown (see figure) with the cylinder valve between you and the regulator. Never stand in front of the adjusting knob.
21.f.� When the high-pressure gauge indicates maximum pressure, open the cylinder valve fully.
Page A-34 Part 75 Field Audit Manual - July 16, 2003

Appendix A Sample Linearity Test Standard Operating Procedure
22. Connect each regulator to the gas delivery manifold.
23.�Connect the gas delivery manifold to the gas delivery line and have plant personnel attach the line to the CEMS system at the proper injection point. The injection point should direct the cylinder gases through all components of the sampling system and conditioning systems.
Linearity Test Procedure:
24.�Start the flow of the low range gas to the system at a rate equal to the rate normally used to perform linearities and daily calibration.
25. Wait for the readings on the analyzer(s) to become stable.
26. Record the concentration displayed by the analyzer.
27. Repeat Steps 24 - 26 for the mid range gas.
28. Repeat Steps 24 - 26 for the high range gas.
29. Repeat Steps 24 - 28 for Run 2
30. Repeat Steps 24 - 28 for Run 3
31. Repeat Steps 24-30 for each gas monitor to be evaluated.
32.�Using the Linearity Test Audit spreadsheet calculate the average percentage error at each gas concentration level for each gas tested.
32.a.� The error in linearity for each calibration gas concentration (low-, mid-, and highlevels) shall not exceed or deviate from the reference value by more than 5.0 percent as calculated by the equation: LE=(|R-A|/R)*100% , or
32.b.� The absolute value of the difference between the average of the monitor response values and the average of the reference values, |R-A| shall be less than or equal to 0.5 percent CO2 or O2, whichever is less restrictive.
33. The linearity requirements are located in 40 CFR 75, Appendix A.
Packing up:
34.�Have the plant personnel detach the line from the CEMS injection point. Disconnect the gas delivery manifold from the gas delivery line and pack the delivery line.
Part 75 Field Audit Manual - July 16, 2003 Page A-35

Sample Linearity Test Standard Operating Procedure Appendix A
35. Detach the regulators as follows:
35.a Close the cylinder valve.
35.b.� Vent the gas in the regulator by turning the adjusting knob clockwise so that no pressure is trapped inside the regulator.
35.c� Close the regulator. After relieving all the gas pressure, turn the adjusting knob counterclockwise as far as it will go.
35.d Disconnect each regulator from the gas delivery manifold.
35.e. Disconnect the regulator.
35.f.� Protect the regulator by packing it so that the fittings will not be exposed to dirt, contamination, or mechanical damage.
35.g. Replace the cylinder valve cap.
Post-Inspection Meeting:
During the post-inspection meeting, review the test result and make a printout of the data and results obtained from the linearity to give to the source.
Page A-36 Part 75 Field Audit Manual - July 16, 2003

Appendix A Sample Linearity Test Standard Operating Procedure
Sample Calibration Gas Cylinder Tracking Form
Cylinder No.: Date Ordered:
Contents: Date Received:
Cert Concentration: Initial Pressure:
Expiration date: Gas Vendor:
Do not use if cylinder pressure is below 150 psig
Date Used at what Audited Facility Initial Pressure
(psig)
Final Pressure
(psig)
Checked by
Part 75 Field Audit Manual - July 16, 2003 Page A-37€