part 2 corridor selection - saana consulting · danida atwa stage 1 report part 2 – corridor...
TRANSCRIPT

DANIDA
ATWA Stage 1 Report
Part 2 – Corridor Selection
November 2015
Final report
Prepared

Accelerating Trade in West Africa (ATWA) – Stage 1 Final Report
i
Table of Contents
1. INTRODUCTION ............................................................................................................ 1
2. WEST AFRICAN CORRIDORS: OVERVIEW ................................................................ 2
2.1.1 Transit Corridors ................................................................................................. 2
2.1.2 Intraregional corridors ......................................................................................... 4
3. CORRIDOR PERFORMANCE COMPARISON .............................................................. 7
3.1 Corridor performance review: detailed findings ....................................................... 10
3.2 Notes and comments - general ............................................................................... 11
3.3 Notes - Specificities of the various reports .............................................................. 12
4. WHERE SHOULD ATWA START? NAVIGATING COMPLEXITY ............................... 14
5. GROUP 1: BENIN, NIGER, NIGERIA .......................................................................... 16
5.1 Summary of Group 1 ............................................................................................... 16
5.2 BENIN ..................................................................................................................... 18
5.2.1 Cotonou Port .................................................................................................... 18
5.2.2 Cotonou-Niamey corridor .................................................................................. 20
5.2.3 Traffic ............................................................................................................... 20
5.2.4 Procedures and border posts at Benin-Niger border ......................................... 20
5.2.5 Inland cargo processing .................................................................................... 21
5.2.6 Road description ............................................................................................... 22
5.2.7 Road governance ............................................................................................. 22
5.2.8 Summary Of findings ........................................................................................ 22
5.3 NIGER .................................................................................................................... 23
5.3.1 Corridors ........................................................................................................... 23
5.3.2 Traffic ............................................................................................................... 24
5.3.3 Customs procedures......................................................................................... 25
5.3.4 Transport sector ............................................................................................... 25
5.3.5 Road Network ................................................................................................... 25
5.3.6 Rail sector ........................................................................................................ 25
5.3.7 Transport services ............................................................................................ 26
5.4 NIGERIA ................................................................................................................. 27
5.4.1 Lagos ports ....................................................................................................... 27
5.4.2 Traffic and operations ....................................................................................... 27
5.4.3 Major planned investments ............................................................................... 27
5.4.4 Lagos-Kano-Jibiya corridor ............................................................................... 28
5.4.5 Traffic ............................................................................................................... 29
5.4.6 Road conditions ................................................................................................ 29

Accelerating Trade in West Africa (ATWA) – Stage 1 Final Report
ii
5.4.7 Cargo allocation ................................................................................................ 30
5.4.8 Checkpoints ...................................................................................................... 30
5.4.9 Rail ................................................................................................................... 31
5.4.10 Inland container depots (ICD) ......................................................................... 31
5.4.11 Border clearance in the port ............................................................................ 31
5.4.12 Institutional & Regulatory Environment ........................................................... 32
5.4.13 Major planned investments ............................................................................. 32
5.4.14 Issues and recommendations ........................................................................ 32
6. GROUP 2 A: BURKINA FASO, COTE D’IVOIRE, GHANA ......................................... 34
6.1 Summary of Group 2 a ............................................................................................ 34
6.2 BURKINA FASO ..................................................................................................... 36
6.2.1 Corridors ........................................................................................................... 36
6.2.2 Traffic ............................................................................................................... 36
6.2.3 Customs procedures......................................................................................... 37
6.2.4 Transport sector .............................................................................................. 38
6.3 GHANA ................................................................................................................... 38
6.3.1 Tema Port ......................................................................................................... 38
6.3.2 Tema-Ouagadougou corridor ............................................................................ 40
6.3.3 Takoradi port .................................................................................................... 42
6.4 CÔTE D’IVOIRE ..................................................................................................... 43
6.4.1 Abidjan port ...................................................................................................... 43
6.4.2 Abidjan-Bamako corridor and Abidjan-Ouagadougou corridor .......................... 45
6.4.3 Summary of key findings .................................................................................. 47
6.4.4 San Pedro Port ................................................................................................. 48
7. GROUP 2 B: MALI, SENEGAL, TOGO........................................................................ 49
7.1 Summary ................................................................................................................ 50
7.1.1 Option 1: Adding Mali and Senegal to Group 2a ............................................... 50
7.1.2 Option 2: Adding Togo to Group 2a .................................................................. 51
7.2 MALI ....................................................................................................................... 53
7.2.1 Corridors ........................................................................................................... 53
7.2.2 Traffic ............................................................................................................... 53
7.2.3 Customs Procedures ........................................................................................ 54
7.2.4 Transport sector ............................................................................................... 54
7.3 SENEGAL ............................................................................................................... 55
7.3.1 Dakar port ......................................................................................................... 55
7.3.2 Dakar-Bamako corridor ..................................................................................... 57

Accelerating Trade in West Africa (ATWA) – Stage 1 Final Report
iii
7.3.3 Bamako-Ouagadougou section of the TAH 5 corridor ....................................... 60
7.4 TOGO .................................................................................................................... 61
7.4.1 Port Autonome de Lomé ................................................................................... 61
7.4.2 Recent developments ....................................................................................... 62
7.4.3 Planned investments ........................................................................................ 62
7.4.4 Issues and recommendations ........................................................................... 62
7.4.5 Lomé-Ouagadougou corridor ............................................................................ 64
8. GROUP 3: THE GAMBIA, GUINEA, GUINEA BISSAU, LIBERIA, SIERRA LEONE ..... 67
8.1 Group 3: Summary .................................................................................................. 67
8.2 GUINEA .................................................................................................................. 68
8.2.1 Conakry port ..................................................................................................... 68
9. Corridor not included in country groupings: the DAKAR- AbIDJAN AND Abidjan-Lagos Corridor .................................................................................................................. 69
9.1 A. Dakar-Abidjan corridor ........................................................................................ 69
9.2 The Abidjan-Lagos corridor ..................................................................................... 71
9.2.1 Road network ................................................................................................... 72
9.2.2 Traffic ............................................................................................................... 72
9.3 Border crossings ..................................................................................................... 73
9.3.1 The Seme-Krake border crossing ..................................................................... 75
10. CONCLUSION ........................................................................................................... 75
11. NEXT STEPS ............................................................................................................. 76
11.1.1 Corridor diagnostic.......................................................................................... 76
11.1.2 Thinking and working politically on ATWA ...................................................... 77
11.1.3 Including a focus on informal trade in ATWA Stage 2 ..................................... 77
11.1.4 Collaboration with the proposed regional transport & facilitation observatory .. 78
12. REFERENCES ........................................................................................................... 79

Accelerating Trade in West Africa (ATWA) – Stage 1 Final Report
iv
List of Tables
Table 1 - West African corridors: overview of main features ................................................. 6
Table 2 - West African corridors: main performance indictors. ............................................... 8
Table 3 - Export basket for Group 1 countries ..................................................................... 16
Table 5 - Cotonou port: Total traffic (‘000 tonnes) ................................................................ 18
Table 6 - Cotonou container traffic ..................................................................................... 18
Table 7 - Transit traffic through Cotonou port ..................................................................... 20
Table 8 - Niger border crossing procedures and border crossing times .............................. 21
Table 9 - Niger corridors ...................................................................................................... 23
Table 10 - Niger imports (‘000 tonnes) ................................................................................ 24
Table 11 - Volume of cargo through Lagos .......................................................................... 27
Table 12 - Comparison of LAKAJI and Tema-Ouaga corridors ............................................ 28
Table 13 - Commodities on the LAKAJI corridor .................................................................. 29
Table 14 - Checkpoints along the LAKAJI corridor .............................................................. 30
Table 15 - Export basket Group 2a countries ...................................................................... 34
Table 16 - Intra-regional trade amongst Group 1 countries .................................................. 35
Table 17 - Burkina Faso corridors ....................................................................................... 36
Table 18 - Burkinabé imports (‘000 tonnes) ........................................................................ 37
Table 19 - Total Traffic through Tema Port .......................................................................... 38
Table 20 - Inward transit traffic through Tema port .............................................................. 41
Table 21 - Takoradi - total traffic (‘000 tonnes) ................................................................... 42
Table 22 - Abidjan - Total traffic (‘000 tonnes) .................................................................... 43
Table 23 - Abidjan - Total import transit traffic (‘000 tonnes) ............................................... 45
Table 24 - San Pedro port traffic (‘000 tonnes) .................................................................... 48
Table 25 - Export basket of Mali and Senegal ..................................................................... 50
Table 26 - Intra-regional trade amongst Group 2a countries, Mali and Senegal .................. 50
Table 27 - Export basket of Togo ........................................................................................ 52
Table 28 - Interregional trade amongst Group 2a countries and Togo ................................. 52
Table 29 - Mali corridors ...................................................................................................... 53
Table 30 - Mali imports (‘000 tonnes) ................................................................................. 54
Table 31 - Dakar port - total traffic (‘000 tonnes) ................................................................. 55
Table 32 - Dakar port total transit traffic (‘000 tonnes) ........................................................ 58
Table 33 - Travel and turnaround times on the Ouagadougou-Bamako corridor .................. 60
Table 34 - Lomé – total traffic (‘000 tonnes) ....................................................................... 61

Accelerating Trade in West Africa (ATWA) – Stage 1 Final Report
v
Table 35 - Lomé: Transit traffic ............................................................................................ 64
Table 36 - Export basket Group 3 countries ........................................................................ 67
Table 37 - Conakry Port - Total Traffic (‘000 tonnes) .......................................................... 69
Table 38 - ECOWAS priority projects in Dakar-Abidjan corridor countries ........................... 70
Table 39 - Traffic along the Abidjan-Lagos corridor ............................................................. 73
Table 40 - Border crossing times along the Abidjan-Lagos and Cotonou-Niamey corridors . 74
Table 41 - Selected Abidjan-Lagos corridor border crossings – working hours and services
present ................................................................................................................................ 74
List of Figures
Figure 1 - West African corridors and potential groups………………………………………… 15
Figure 2 - San Pedro-Bamako corridor……………………………………………………………49
Figure 3: Satellite view of Kidira-Diboli congestion………………………………………………58
Figure 4: Ouagadougou-Bamako routes………………………………………………………….59
Figure 5: Dakar-Abidjan stretch of TAH 7…………………………………………………………69
Figure 6: Abidjan-Lagos corridor – port dwell time and border crossing time (ALCO)……….73

Accelerating Trade in West Africa (ATWA) – Stage 1 Final Report
vi
List of Acronyms
AfDB African Development Bank
ALCO Abidjan-Lagos Corridor Organisation
ALTTFP Abidjan-Lagos Trade and Transport Facilitation Project
APMT APM Terminal (Maersk Group)
ASYCUDA Automated System of Customs Data
ATWA Accelerating Trade in West Africa
AU African Union
BF Burkina Faso
BJ Benin
BOT Build, operate and transfer
CAFER Caisse autonome de financement de l’entretien routier
CCECC China Civil engineering Construction Company
CET Common external tariff
CI Côte d’Ivoire
CISS Comprehensive Import Supervision Scheme
CNUT Conseil des utilisateurs de transports public
COMSESA Common Market for Eastern and Southern Africa
ECOWAS Economic Community of West African States
EM Entrepôts maliens
GDP Gross domestic product
GH Ghana
GPHA Ghana Ports and Harbours Authority
GPS Global positioning system
ICD Inland container terminal
IFC International Finance Corporation
ISRT (IST) ECOWAS Economic Convention on Interstate Road Transit of Goods

Accelerating Trade in West Africa (ATWA) – Stage 1 Final Report
vii
JBP Joint border post
JICA Japan International Cooperation Agency
LAKAJI Lagos-Kano-Jibiya transport corridor
MSC Mediterranean Shipping Company
ML Mali
NCS Nigeria Customs Service
NE Niger
NEXTT Nigeria Expanded Trade and Transport
NG Nigeria
NGN Nigerian naira
NPA Nigeria Ports Authority
NCTTCA Northern Corridor Transit Transport Coordination Authority
OPA Observatoire des pratiques anormales
PAA Port autonome d’Abidjan
PAC Port autonome de Conakry
PAC Port autonome de Cotonou
PAD Port autonome de Dakar
PAL Port autonome de Lomé
PoAI Port of Amsterdam International
PPP Public-private partnership
PSI Preshipment inspection
SBC Société Benin Contrôle
SEGUB Benin Electronic Single Window System
SN Senegal
SSI Scanning Systems International
TAH Trans-Africa highway
TEU Twenty-foot equivalent unit (container)
Accelerating Trade in West Africa (ATWA) – Stage 1 Final Report
viii
TG Togo
TMEA TradeMark East Africa
TRCB Terminaux routiers à conteneurs du Burkina Faso
TTFA Trade and Transit Facilitation Assessment
UEMOA Union économique et monétaire ouest-africaine (West African
Economic and Monetary Union)
USAID United States Agency for International Development
USD United States dollar
WATH West Africa Trade Hub
XOF West African CFA Franc
Accelerating Trade in West Africa (ATWA) – Stage 1 Final Report
1
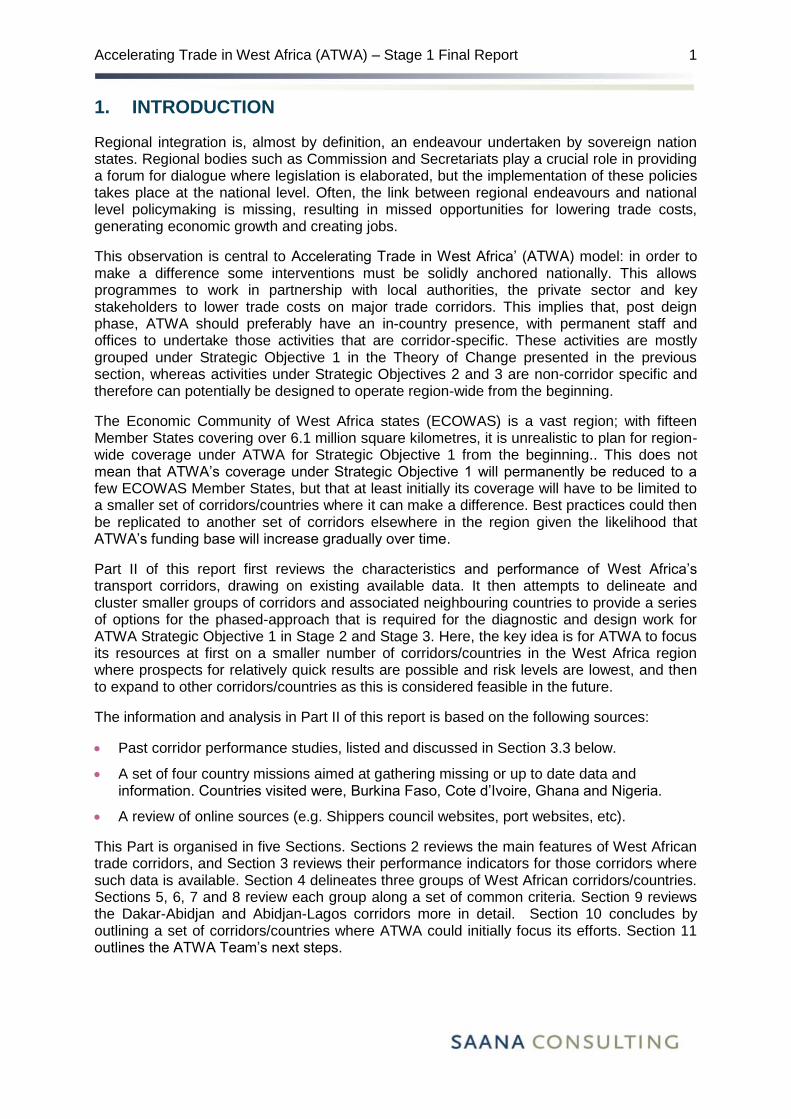
1. INTRODUCTION
Regional integration is, almost by definition, an endeavour undertaken by sovereign nation states. Regional bodies such as Commission and Secretariats play a crucial role in providing a forum for dialogue where legislation is elaborated, but the implementation of these policies takes place at the national level. Often, the link between regional endeavours and national level policymaking is missing, resulting in missed opportunities for lowering trade costs, generating economic growth and creating jobs.
This observation is central to Accelerating Trade in West Africa’ (ATWA) model: in order to make a difference some interventions must be solidly anchored nationally. This allows programmes to work in partnership with local authorities, the private sector and key stakeholders to lower trade costs on major trade corridors. This implies that, post deign phase, ATWA should preferably have an in-country presence, with permanent staff and offices to undertake those activities that are corridor-specific. These activities are mostly grouped under Strategic Objective 1 in the Theory of Change presented in the previous section, whereas activities under Strategic Objectives 2 and 3 are non-corridor specific and therefore can potentially be designed to operate region-wide from the beginning.
The Economic Community of West Africa states (ECOWAS) is a vast region; with fifteen Member States covering over 6.1 million square kilometres, it is unrealistic to plan for region-wide coverage under ATWA for Strategic Objective 1 from the beginning.. This does not mean that ATWA’s coverage under Strategic Objective 1 will permanently be reduced to a few ECOWAS Member States, but that at least initially its coverage will have to be limited to a smaller set of corridors/countries where it can make a difference. Best practices could then be replicated to another set of corridors elsewhere in the region given the likelihood that ATWA’s funding base will increase gradually over time.
Part II of this report first reviews the characteristics and performance of West Africa’s transport corridors, drawing on existing available data. It then attempts to delineate and cluster smaller groups of corridors and associated neighbouring countries to provide a series of options for the phased-approach that is required for the diagnostic and design work for ATWA Strategic Objective 1 in Stage 2 and Stage 3. Here, the key idea is for ATWA to focus its resources at first on a smaller number of corridors/countries in the West Africa region where prospects for relatively quick results are possible and risk levels are lowest, and then to expand to other corridors/countries as this is considered feasible in the future.
The information and analysis in Part II of this report is based on the following sources:
Past corridor performance studies, listed and discussed in Section 3.3 below.
A set of four country missions aimed at gathering missing or up to date data and information. Countries visited were, Burkina Faso, Cote d’Ivoire, Ghana and Nigeria.
A review of online sources (e.g. Shippers council websites, port websites, etc).
This Part is organised in five Sections. Sections 2 reviews the main features of West African trade corridors, and Section 3 reviews their performance indicators for those corridors where such data is available. Section 4 delineates three groups of West African corridors/countries. Sections 5, 6, 7 and 8 review each group along a set of common criteria. Section 9 reviews the Dakar-Abidjan and Abidjan-Lagos corridors more in detail. Section 10 concludes by outlining a set of corridors/countries where ATWA could initially focus its efforts. Section 11 outlines the ATWA Team’s next steps.
Accelerating Trade in West Africa (ATWA) – Stage 1 Final Report
2
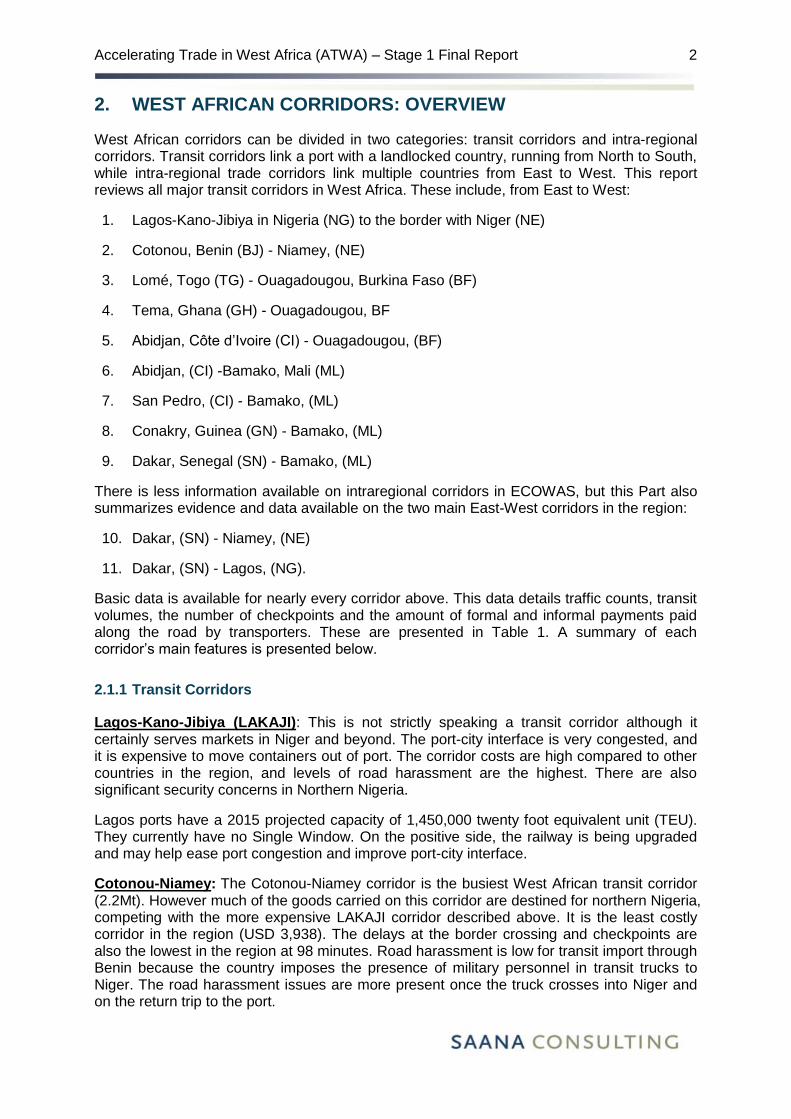
2. WEST AFRICAN CORRIDORS: OVERVIEW
West African corridors can be divided in two categories: transit corridors and intra-regional corridors. Transit corridors link a port with a landlocked country, running from North to South, while intra-regional trade corridors link multiple countries from East to West. This report reviews all major transit corridors in West Africa. These include, from East to West:
1. Lagos-Kano-Jibiya in Nigeria (NG) to the border with Niger (NE)
2. Cotonou, Benin (BJ) - Niamey, (NE)
3. Lomé, Togo (TG) - Ouagadougou, Burkina Faso (BF)
4. Tema, Ghana (GH) - Ouagadougou, BF
5. Abidjan, Côte d’Ivoire (CI) - Ouagadougou, (BF)
6. Abidjan, (CI) -Bamako, Mali (ML)
7. San Pedro, (CI) - Bamako, (ML)
8. Conakry, Guinea (GN) - Bamako, (ML)
9. Dakar, Senegal (SN) - Bamako, (ML)
There is less information available on intraregional corridors in ECOWAS, but this Part also summarizes evidence and data available on the two main East-West corridors in the region:
10. Dakar, (SN) - Niamey, (NE)
11. Dakar, (SN) - Lagos, (NG).
Basic data is available for nearly every corridor above. This data details traffic counts, transit volumes, the number of checkpoints and the amount of formal and informal payments paid along the road by transporters. These are presented in Table 1. A summary of each corridor’s main features is presented below.
2.1.1 Transit Corridors
Lagos-Kano-Jibiya (LAKAJI): This is not strictly speaking a transit corridor although it certainly serves markets in Niger and beyond. The port-city interface is very congested, and it is expensive to move containers out of port. The corridor costs are high compared to other countries in the region, and levels of road harassment are the highest. There are also significant security concerns in Northern Nigeria.
Lagos ports have a 2015 projected capacity of 1,450,000 twenty foot equivalent unit (TEU). They currently have no Single Window. On the positive side, the railway is being upgraded and may help ease port congestion and improve port-city interface.
Cotonou-Niamey: The Cotonou-Niamey corridor is the busiest West African transit corridor (2.2Mt). However much of the goods carried on this corridor are destined for northern Nigeria, competing with the more expensive LAKAJI corridor described above. It is the least costly corridor in the region (USD 3,938). The delays at the border crossing and checkpoints are also the lowest in the region at 98 minutes. Road harassment is low for transit import through Benin because the country imposes the presence of military personnel in transit trucks to Niger. The road harassment issues are more present once the truck crosses into Niger and on the return trip to the port.

Accelerating Trade in West Africa (ATWA) – Stage 1 Final Report
3
On the negative side, Customs convoys, quotas and the tour-de-rôle system are still in place, suggesting that a reform of the transport sector is needed if reduction of costs along the corridor is to be passed on to consumers. The corridor also exhibits the highest truck turn-around time (19.7 days).
The Cotonou port was recently upgraded and has a projected 2015 capacity of 400,000 TEU. A Single Window is in place since 2013. The Dutch Embassy will sponsor the development of a port master plan to be undertaken by the Port of Amsterdam (although this activity was temporarily suspended because of embezzlement of Dutch funds in Benin, but is set to resume shortly).
Informal trade and smuggling between Benin and Nigeria, and possibly also between Niger and Nigeria, is very high. The Netherlands have been sponsoring a project focusing on formalizing informal trade between the two countries.
A Joint Border Post (JBP) is being built on this corridor between Benin and Niger (Malanville).
Lomé-Ouagadougou: This is the most important transit corridor for Burkina Faso. Costs are lower than average at USD 4,092, and it has the lowest truck turn-around time (11.6 days). The delays at border crossings and checkpoints are also below average at 122 minutes, and harassment levels for transit import through Togo are low because gendarmerie checkpoints have been abolished. They are however quite high in Burkina Faso. GPS tracking is used in Togo, but police convoys are still used in Burkina Faso. Quotas and tour-de-rôle are loosely implemented to allocate cargos to truckers, if at all. Informal payments are the highest recorded (USD 349) – 8.5% of total logistics costs.1
The Lomé Port is being expanded and has a 2015 projected capacity of 1,25 million TEU. A Single Window was launched in 2014, and important set of expansion projects is under way.
The region’s first JBP was built on this corridor between Togo and Burkina Faso (Cinkassé). The JBP is operational but the customs systems either side of the border are not interconnected and few processes have been harmonized and simplified.
Tema-Ouagadougou: The Port of Tema complains that is has lost importance as transit port (transit to Burkina Faso has dropped to 358,000t) because Ghana has been implementing axle load control regulations for longer and more stringently than any other country in West Africa. Current low transit figures may therefore not reflect the true potential of the corridor.
Performance indicators are mixed with a lower than average corridor cost (USD 4,058), lower than average truck turn-around time (13.1 days), but above average delays at border crossings and checkpoints (265 min). The corridor has high level of controls (particularly in Ghana) but the lowest overall level of reported bribes and informal payments along roads and in ports and terminals (USD 125) – 3 percent of total logistics costs.
The Port of Tema has a billion-dollar expansion project and has a 2015 projected capacity of 800,000 TEU. The Single Window was launched in 2002, and is the first Single Window in West Africa. The port has also recently installed a modern gate system. Ghana customs uses GPS tracking and quotas and tour-de-rôle are no longer enforced. The Ghana customs authorities have an agreement with Burkina Faso and Mali customs authorities to implement a single customs guarantee.
Abidjan-Ouagadougou/Abidjan-Bamako: Abidjan-Ouagadougou has both a road and a rail corridor. With road and rail combined, this is the second most important corridor for Burkina Faso (848,000t) and will probably grow if the railway is upgraded and extended to Niamey
1 We do not have information on informal payments on all corridors.

Accelerating Trade in West Africa (ATWA) – Stage 1 Final Report
4
and Cotonou, as planned. Abidjan-Dakar is the second most important corridor for Bamako (700,000t).
The corridors have higher than average costs (USD 5,095 to Ouaga and USD 4,870 to Bamako), about average truck turn-around times (17.5 days for Ouaga and 15 days for Bamako), but below average delays at border crossings and checkpoints (165 min and 234 min respectively). The corridors have high levels of controls (21 and 37 respectively) and above average levels of bribes at controls (XOF 39,300 and 47,000 respectively). Mali reportedly has the highest level of harassment and bribes among countries participating in the Observatoire des Pratiques Anormales (OPA) described in the previous section.
The Port of Abidjan has a large expansion project and a 2015 projected capacity of 1,000,000 TEU. A Single Window was launched in 2013, and the Côte d’Ivoire customs authorities use GPS tracking in partnership with the Chamber of Commerce. The tour-de-rôle and freight sharing quotas are present on paper but not fully enforced due to a lack of trucks in Cote d’Ivoire.
The Côte d’Ivoire customs authorities have an agreement with Burkina Faso, Mali and Senegal customs authorities to inter-connect their systems and a costed project ready to be implemented (estimated at USD 7.6 million). Cote d’Ivoire and Burkina Faso also have agreed with the World Bank to implement transport sector services reforms in return for a USD 50 million Development Policy Operation (DPO) loan.
Dakar-Bamako: Dakar-Bamako, like Abidjan-Bamako, has both a road and a rail corridor, but the rail corridor is dilapidated. The company Transrail obtained a concession for the railway in 2003 but has not invested in the line.
The Mali Transport Observatory reports that 288,000t were transported by rail in 2013. The United States Agency for International Development (USAID) Projet de Croissance Économique (PCE) project reported that the rail corridor was the least expensive of all West African corridors (USD 2,703) but it is not sustainable as the line is not being maintained.
The Dakar-Bamako corridor is the second busiest transit corridor (1.7 Mt) in West Africa. In 2015, a second, southern route was opened. Corridor costs are lower than average (USD 4,160). Truck turn-around time is below average (14 days) but delays at border crossings and checkpoints are the highest among transit corridors (316 min). The corridor has a high number of controls (27) and above average levels of bribes at controls (XOF 40,000).
The Dakar port container terminal has been upgraded and has a 2015 projected capacity of 600,000 TEU. The port has had a Single Window since 2006.
2.1.2 Intraregional corridors
Bamako-Ouaga and Ouaga-Niamey: These corridors are part of the Trans-Sahelian Highway (Trans-African Highway, TAH 5) from Dakar to N’djamena in Chad. The Bamako-Ouagadougou corridor is rather similar in performance to transit corridors. For the Ouaga-Niamey corridor we do not have much information but expect it to be similar to Bamako-Ouaga.
The Abidjan-Lagos corridor: is part of the Trans-Coast Highway from Dakar to Lagos. The Abidjan-Lagos corridor connects the major urban centres in West Africa - with a total combined population of 37 million. It carries much local cargo traffic, and international traffic is dominated by passenger traffic.
The average traffic count across borders on the Abidjan-Lagos corridor is 196 trucks per day, which is lower than the average transit corridors where 212 trucks pass per day. The busiest

Accelerating Trade in West Africa (ATWA) – Stage 1 Final Report
5
border crossing for cargo is between Ghana and Togo with 493 trucks per day, which is more than the busiest transit corridor, Cotonou-Niamey with 308 trucks per day. This might be due to clinker shipments being shipped from the Port of Lomé to a cement factory in Ghana close to border. The traffic survey this report relies on counted only 29 trucks per day at the Seme-Krake border crossing between Benin and Nigeria, which is surprisingly low.
As for passenger traffic, the average Abidjan-Lagos border crossing sees some 7,500 people crossing per day whereas the average transit corridor only sees 2,100 (not shown in Table 2).
The Abidjan-Lagos corridor has a very high density of checkpoints with a total of 62 on a distance of less than 1,000 km. On average, a loaded truck must expect to spend 32 hours at a border crossing on this corridor, from a “best” of 7 hours at the border from Benin to Togo and a “worst” of 63 hours crossing from Nigeria to Benin.
There are currently two JBPs being built on the Abidjan-Lagos corridor: between Nigeria and Benin (Seme-Krake) and between Togo and Ghana (Noepe). It was announced in May 2015 that a third JBP would be built between Ghana and Côte d’Ivoire (Noe).

Accelerating Trade in West Africa (ATWA) – Stage 1 Final Report
6
Table 1 - West African corridors: overview of main features 2
TRANSIT CORRIDORS Le
ngt
h (
Km
)
Po
rt T
raff
ic
(mill
ion
To
nn
es
- M
t)
Po
rt T
raff
ic
TEU
(‘0
00
)
An
nu
al c
orr
ido
r tr
affi
c -
tran
sit
Mt
Dai
ly t
raff
ic c
ou
nt,
tru
cks
Tota
l lo
gist
ics
cost
s (p
ort
s,
goo
ds
cle
aran
ce a
nd
ter
min
al
cost
s) U
SD/T
EU
Co
rrid
or
tim
e, i
ncl
ud
ing
po
rts
& c
lear
ance
(D
ays)
Ro
ad t
rave
l tim
e, i
mp
ort
(Day
s)
Ro
ad t
rave
l tim
e, E
xpo
rt (
Day
s)
Tru
ck t
urn
aro
un
d t
ime
, Im
p
(Day
s)
Bo
rder
Cro
ssin
g, Im
po
rt
(ho
urs
)
Co
ntr
ols
, Im
po
rt
Info
rmal
pay
me
nts
to
tal (
USD
)
Bri
be
s o
n r
oad
s, Im
po
rt (
‘00
0
XO
F)
De
lays
incl
ud
ing
bo
rde
rs,
Imp
ort
(m
inu
tes)
Lagos-Kano-Jibiya 1,200 77.1 995 ? ? 4,552 19.6 5.4 5.4 ? n/a 54 162 $132 ?
Cotonou-Niamey 1,041 7.4 210 2,200 308 3,938 19.7 ? ? ? 0.1 11 ? 15.1 98
Lomé-Ouaga 1,010 7.8 350 850 275 4,092 11.6 4.5 2.6 22 0.8 19 349 15.6 122
Tema-Ouaga 1,057 18.8 750 358 130 4,058 13.1 4.3 2.6 26 3.1 24 125 13.5 265
Abidjan-Ouaga, road
1,228 24.9 546 210 82 5,095 17.5 5.2 2.6 15 1.1 21 ? 39.3 165
Abidjan-Ouaga, rail
1,228 same
same 638 n/a 4,377 19 n/a n/a ? ? n/a ? n/a n/a
Abidjan-Bamako 1,238 same
same 700 ? 4,870 15 4.6 2.4 14 1.5 37 ? 47.8 234
Dakar-Bamako, road
1,382 11.9 600 1,668 264 4,160 ? 4.1 3.0 14 2.5 27 169 40.0 316
Dakar-Baamko, rail
1,382 same
same 288 n/a 2,703 ? n/a n/a ? ? n/a ? n/a n/a
Average, road 1,165 998 212 4,395 16.1 4.7 3.1 18 1.5 28 201 28.6 240
INTRA-REGIONAL CORRIDORS
Bamako-Ouaga (S) 1,049 n/a n/a 240*
84%***
n/a n/a 3.9 3.2 17 0.7 22 ? 29.1 103
Ouaga-Niamey 522 n/a n/a 540**
33%***
? n/a ? ? ? ? ? ? ? ?
Abidjan-Lagos 942 Port dwell time (days)
Daily Traffic Check points
Border crossing
(hrs) Vehicles Trucks Cargo Passengers
Côte-d’Ivoire 166 13 9 W-E
E-W
Ghana CI-GH 512 20 2,304 69 1,100t 9,000 20 34 32
Togo GH-TG 103 12 1,174 493 17,100t 7,700 2 22 42
Benin TG-BJ 90 13 2,752 193 4,600t 10,200 15 30 7
Nigeria BJ-NG 71 25 715 29 200t 3,300 16 24 63
Average 17 1,736 196 5,750t 7,550 Tot: 62 28 36
2 Note: * 1,200t/day extrapolated to 240,000t per year; ** 2,700t/day extrapolated to 540,000t *** Share of regional (non-transit) trucks

Accelerating Trade in West Africa (ATWA) – Stage 1 Final Report
7
3. CORRIDOR PERFORMANCE COMPARISON
A number of studies have attempted to measure the performance of the following corridors:
The Dakar-Bamako road & rail corridor, by USAID PCE project3
The Abidjan-Bamako corridor, by Nathan Associates 4
The Abidjan-Ouagadougou road & rail corridor, by Nathan Associates5
The Tema-Ouagadougou-Bamako, by USAID West Africa Trade Hub (WATH).6
The Lomé-Ouagadougou corridor, by USAID WATH7
The Cotonou-Niamey corridor, by Nathan Associate8
The Lagos-Kano-Jibiya (LAKAJI) corridor, by the USAID Nigeria Expanded Trade and Transport (NEXTT) project.9
Corridor reports document the time and costs involved and procedural and technical hurdles encountered while moving a consignment along different stages of a trade corridor. The corridor stages usually include for imports: vessel arriving and cargo unloading in a port; port yard and gate operations; road leg from port to border; border crossings; road leg to inland terminal in landlocked country; and clearance procedures for consumption. For exports it is in general the same stages in reverse.
It has long been recognized that good, reliable, efficient and inexpensive transport is essential for development and that transport in Sub-Saharan Africa lacks these essential characteristics, being among the costliest and least reliable in the world.
Corridor studies have confirmed the high cost, time wasting and unpredictable nature of transport in West Africa, but they also serve to:
Identify and quantify hurdles and bottlenecks along the corridor;
Improve operations by helping governments and the private sector to find solutions to issues encountered on the corridor;
Provide evidence:
o To assist policy makers in designing evidence-based policies;
o To assist donors and financing bodies in designing development programmes;
o To support private sector operators with the information they need for evidence-based advocacy;
Provide benchmarks against which to gauge progress.
The interest in comparing corridor performances is primarily to a) identify good practices on one corridor that could be applied to other corridors, or b) to identify particularly bad practices that can be improved. The table below summarizes the results from recent studies of seven corridors.
3 USAID PCE - Etude Des Couts Du Transport Sur Le Corridor Dakar – Bamako (2011) 4 World Bank - Logistics Cost Study of Transport Corridors in Central and West Africa (2013), Nathan Ass 5 Ibid. 6 USAID West Africa Trade Hub - Trends in Transport And Logistics on The Tema-Ouagadougou-Bamako Corridor (2013) 7 USAID West Africa Trade Hub - Transport and Logistics Costs on the Lomé-Ouagadougou Corridor (2012 8 World Bank - Logistics Cost Study of Transport Corridors in Central and West Africa (2013), Nathan Ass 9 USAID NEXTT - Lagos-Kano-Jibiya Corridor Performance: Baseline Assessment Report on Time and Cost to Transport Goods (2013)
Accelerating Trade in West Africa (ATWA) – Stage 1 Final Report
8
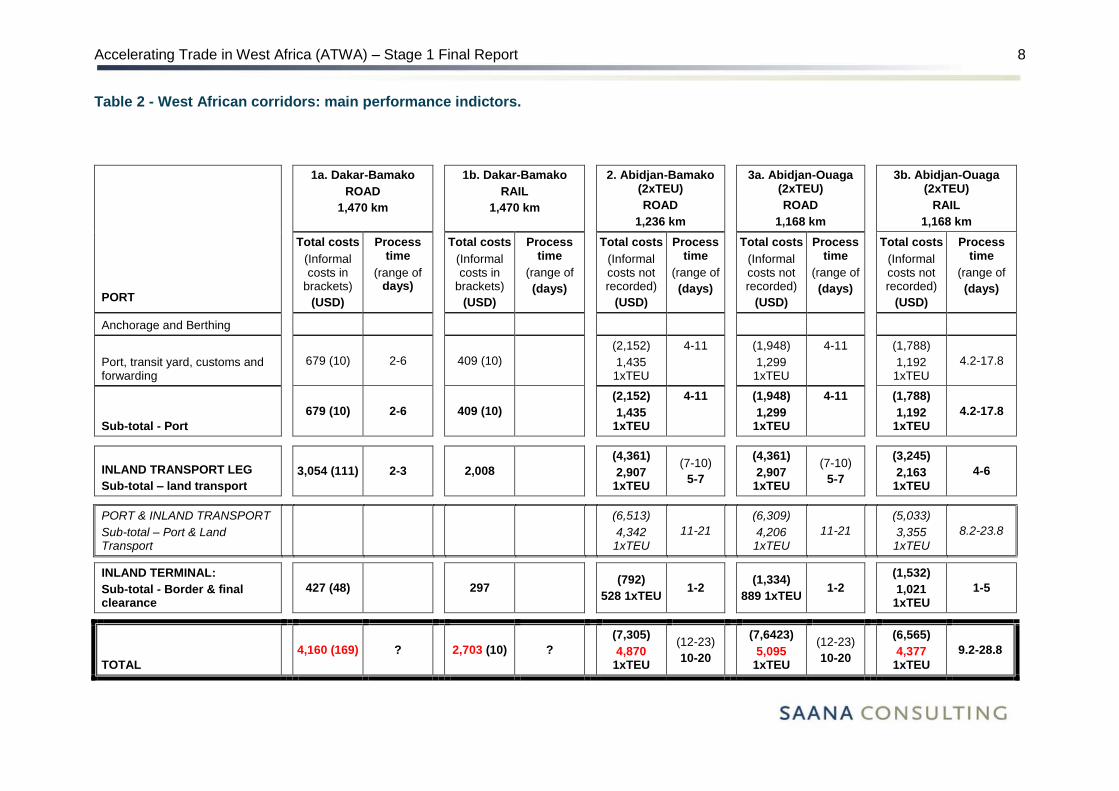
Table 2 - West African corridors: main performance indictors.
PORT
1a. Dakar-Bamako
ROAD
1,470 km
1b. Dakar-Bamako
RAIL
1,470 km
2. Abidjan-Bamako (2xTEU)
ROAD
1,236 km
3a. Abidjan-Ouaga (2xTEU)
ROAD
1,168 km
3b. Abidjan-Ouaga (2xTEU)
RAIL
1,168 km
Total costs
(Informal costs in
brackets)
(USD)
Process time
(range of days)
Total costs
(Informal costs in
brackets)
(USD)
Process time
(range of
(days)
Total costs
(Informal costs not recorded)
(USD)
Process time
(range of
(days)
Total costs
(Informal costs not recorded)
(USD)
Process time
(range of
(days)
Total costs
(Informal costs not recorded)
(USD)
Process time
(range of
(days)
Anchorage and Berthing
Port, transit yard, customs and forwarding
679 (10) 2-6
409 (10)
(2,152)
1,435 1xTEU
4-11 (1,948)
1,299 1xTEU
4-11 (1,788)
1,192 1xTEU
4.2-17.8
Sub-total - Port
679 (10) 2-6
409 (10)
(2,152)
1,435 1xTEU
4-11 (1,948)
1,299 1xTEU
4-11 (1,788)
1,192 1xTEU
4.2-17.8
INLAND TRANSPORT LEG
Sub-total – land transport
3,054 (111) 2-3
2,008
(4,361)
2,907 1xTEU
(7-10)
5-7
(4,361)
2,907 1xTEU
(7-10)
5-7
(3,245)
2,163 1xTEU
4-6
PORT & INLAND TRANSPORT
Sub-total – Port & Land Transport
(6,513)
4,342 1xTEU
11-21
(6,309)
4,206 1xTEU
11-21
(5,033)
3,355 1xTEU
8.2-23.8
INLAND TERMINAL:
Sub-total - Border & final clearance
427 (48)
297
(792)
528 1xTEU 1-2
(1,334)
889 1xTEU 1-2
(1,532)
1,021 1xTEU
1-5
TOTAL
4,160 (169) ?
2,703 (10) ?
(7,305)
4,870 1xTEU
(12-23)
10-20
(7,6423)
5,095 1xTEU
(12-23)
10-20
(6,565)
4,377 1xTEU
9.2-28.8

Accelerating Trade in West Africa (ATWA) – Stage 1 Final Report
9
PORT
4. Tema-Ouaga
ROAD
1,057 km
5. Lomé-Ouaga
ROAD
1,020 km
6. Cotonou-Niamey (2xTEU)
ROAD
1,050 km
7. LAKAJI (Nigeria)
ROAD
1,225 km
Total costs
(Informal costs in
brackets)
(USD)
Process time
(range of
(days)
Total costs
(Informal costs in
brackets)
(USD)
Process time
(range of
(days)
Total costs
(Informal costs not recorded)
(USD)
Process time
(range of
(days)
Total costs
(Informal costs in brackets)
(USD)
Process time
(range of
(days)
Anchorage and Berthing n/a 1.7-5.6 n/a 0.8-1.8 n/a 1-4 185 (n/a) 2.2
Port, transit yard, customs and forwarding
443 (19) 1.3-2.7 882 (138) 2.9-6.1
(2,305)
1,537 1xTEU
4-6.9 2,042 (70) 12
Sub-total – Port 443 (19) 3.0-8.3 882 (138) 3.7-7.9
(2,305)
1,537 1xTEU
5-10.9 2,227 (70) 14.2
ROAD TRANSPORT LEG
Sub-total – land transport 2,622 (14) 3.8-4.6 2,037 (49) 3.0-3.2
(3,042)
2,028 1xTEU
4.5-7.3 2,510 (92) 5.4
PORT & INLAND TRANSPORT
Sub-total – Port & Land Transport
3,065 (33) 6.8-12.9 2,919 6.7-11.1
(5,347)
3,565 1xTEU
9.5-18.2 4,552 (162) 19.6
INLAND TERMINAL:
Sub-total - Border & final
clearance
993 (92) 2.1-4.4 1,173 (162) 1.7-3.6 (560)
373 1xTEU 4.0-7.8 n/a
Transport of 1x20ft container: TOTAL
4,058 (125) 8.9-17.3 4,092 (349) 8.4-14.7
(5,907)
3,938 1xTEU
13.5-26
n/a

Accelerating Trade in West Africa (ATWA) – Stage 1 Final Report
10
3.1 Corridor performance review: detailed findings
Costs:
To get a sense of transport costs in West Africa in relation to the developed world we take the example from a 2013 USAID report and compare the cost of moving a container from Tema to Ouaga with the cost of moving a similar container from Newark to Chicago and find that transport and logistics costs in West Africa are about 2.5 times higher than in North America, the time 2 to 3 times longer and uncertainty much more pronounced.10
Rail from Dakar to Bamako is the least expensive option at USD 2,703 per TEU by a good margin. Unfortunately the Dakar-Bamako railway is very dilapidated and traffic volumes are falling. Transrail, the concessionaire, has not fulfilled its contractual obligations and the rail link is deteriorating.
The Cotonou-Niamey, Lome-Ouaga, Tema-Ouga, Dakar-Bamako corridors are all close to USD 4,000 per TEU in spite of Dakar-Bamako being 40 percent longer than the other corridors. The Abidjan corridors are more expensive - about USD 5,000 per TEU by road and USD 4,400 per TEU by rail - because of higher port costs. Lagos-Kano-Jibiya is expensive at USD 4,500 per TEU for the Nigerian domestic leg alone. The cost therefore does not include border-crossing and inland clearance costs which would add anywhere from 300 USD to 1200 USD per TEU.
Port costs:
Lagos stands out as very expensive at USD 2,227 per TEU, one issue being the high cost of moving containers to an inland terminal in Lagos for clearance.
After Lagos comes Cotonou at USD 1,537 per TEU and Abidjan at about USD 1,300 per TEU.
The least expensive is Dakar for rail at USD 409 per TEU. Otherwise Tema is the least expensive at USD 443 per TEU.
Road leg:
The most expensive road leg is Dakar-Bamako at USD 3,054, which is not surprising as it is the longest corridor (1,470 km).
The Abidjan corridors at USD 2,907 (distance about 1,200 km) are the second most expensive while the least expensive ones are the Cotonou-Niamey and Lomé-Ouaga corridors at about USD 2,030.
Border Crossing and clearing:
Ouagadougou corridors are the most expensive at around USD 1,000, while Niamey and Bamako come in at around USD 500 per TEU.
Informal payments:
The Lomé-Ouaga corridor had the highest level of informal payments at 8.5 percent of total costs, while on the Tema-Ouaga corridor informal payments are relatively low at 3.5 percent of total costs (the Nathan corridor studies do not include informal payments).
10 USAID West Africa Trade Hub - Trends in Transport And Logistics on The Tema-Ouagadougou-Bamako Corridor (2013)

Accelerating Trade in West Africa (ATWA) – Stage 1 Final Report
11
On the Lomé-Ouaga corridor informal payments occur mostly in the port and in the inland terminal.
On the Dakar-Bamako corridor reported informal payments are particularly high along the road. We suspect that informal payments in the port are under-reported.
Time and uncertainty:
The best performance appears to be on the Lomé-Ouaga corridor, with a processing and travel time range of 8-15 days while the Cotonou-Niamey and the Abidjan corridors have ranges of 12-25.
The Abidjan-Ouaga rail corridor is less expensive than the road corridor but has higher level of uncertainty with a processing and travel time range of 9-29 days.
The biggest delays and uncertainties are in the ports.
Overall the Lagos-Jibiya corridor is probably the worst performing with its high costs and long delays. The lowest cost corridor is Dakar-Bamako by rail, but the corridor seems to be hardly operating at all. After that the best-performing corridors are Cotonou-Niamey, Lome-Ouaga and Tema-Ouaga. The Abidjan-Bamako and Abidjan-Ouaga corridors are the most expensive after the Lagos corridor.
3.2 Notes and comments - general
Shortcomings of perception data: It should be noted that the information in all the corridor reports on which this study draws was gathered through interviews with stakeholders and is thus perception-based information, which has the serious weakness that stakeholders’ perception of reality is not always accurate. It is however difficult to do a corridor report any other way as operational data that would be more accurate is very difficult to collect.
Different approaches to data: All of the quoted reports were done for different purposes and had different approaches to collecting, presenting and analysing the data. Comparisons of the results have therefore been difficult and have required interpretation, adjustments and sometimes interpolations and approximations. Furthermore, the data were not collected at the same time and comparisons may therefore not accurately represent the actual situation today. Inflation and currency fluctuations also affect costs and prices and must be kept in mind when comparing data collected at different times.
Time: Time is an important variable, which can be difficult to interpret unambiguously. In most, if not all, of the studies below, the time and time range refer to processing time, i.e. the time which it takes to accomplish various operational and clearance procedures plus the time it takes “waiting for service”. However, processing time is not necessarily the actual time it takes to move cargo because the transporter and/or shipper may themselves delay the transport for reasons such as:
It may be convenient, and cheaper, to leave goods in the port rather than moving them to a warehouse outside the port;
The transporter and/or shipper may not have the necessary documents when required;
The transporter/shipper may not have the necessary funds, or the appropriate currency on hand;
The driver may have his own business that he wishes to attend to.
It is therefore important to be clear what kind of “time” is being reported. Both “processing time” and “total time” are important variables. “Processing time” is an indication of the

Accelerating Trade in West Africa (ATWA) – Stage 1 Final Report
12
efficiency of procedures and transactions. “Total time” is important in order to identify congestion problems and transporters’ operating efficiency. Furthermore, if one wishes to translate hours into days one must know whether reported time is based on 24-hour days or 8-hour working days, something which the reports are not good at specifying.
3.3 Notes - Specificities of the various reports
Corridor 1: Dakar-Bamako
Source: USAID PCE - Etude Des Coûts Du Transport Sur Le Corridor Dakar – Bamako (2011).
20-ft container road and rail. Neither value nor weight given.
Formal cost appears comprehensive.
Incomplete information on informal costs.
Incomplete information on time and uncertainty.
Corridors 2,3 & 6: Abidjan-Bamako; Abidjan-Ouagadougou & Cotonou-Niamey
Source: World Bank - Logistics Cost Study of Transport Corridors in Central and West Africa
(2013), done by Nathan Associates.
Four case studies per corridor.
For the sake of this comparison we use case 1b: 2xTEU loaded with edible oil; value USD 30,000; weight 22 tonnes per TEU.
The report calculates transport costs assuming two containers carried on one truck. That is considerably cheaper than transporting a single 20-ft container on a truck but complicates corridor performance comparisons as other reports have used 1xTEU per truck. We have therefore established a comparison transport price equal to 2/3 of the price of carrying 2x20ft containers which is shown in brackets (This was the relationship of 2x20ft versus 1x20ft transport prices found in the 2010 USAID report Transport and Logistics Costs on the Tema-Ouagadougou Corridor).
Informal costs are not included.
For travel time, round trips are considered. Again, in order to compare with other corridors where only one-way trips were used, we establish a comparison time, shown in brackets, of approximately 2/3 the round trip value. This is based on the observation confirmed in several of the reports that the return leg is quicker because empty trucks are subjected to less processing and harassment.
Process time is given as three numbers: “minimum” – “most frequent” – “maximum”. For comparison we use the minimum and maximum values as the range.
Nathan’s reports also include:
o Analysis of transport costs versus prices; and
o Calculated dollar-values of “hidden costs”, i.e. costs caused by delays and uncertainty but which do not involve money changing hands. “Hidden costs” are not considered in the comparison.

Accelerating Trade in West Africa (ATWA) – Stage 1 Final Report
13
Corridor 4: Tema-Ouagadougou
Source: USAID WATH - Trends in Transport And Logistics on The Tema-Ouagadougou-
Bamako Corridor (2013) & USAID WATH - Transport and Logistics Costs on the Tema-
Ouagadougou Corridor (2010).
Eight case studies per corridor in the 2010 report including comparisons between loads of 1x20ft and 2x20ft containers.
The 2013 study has 2 cases, containers transported door-to-door and container stripped in port and the goods transported as break-bulk from Tema. The latter situation is more common, but more difficult to use for comparisons as a truck carrying break-bulk will quite likely carry the content of several containers.
For the comparison we use 1x20ft container loaded with cooking oil, value USD 22,000; weight 17 tonnes.
Process time is given as “Standard time” which is specified as the time a transaction takes if all goes well and “Total time, including delays” which is the time it actually takes including “waiting for service”. In the comparison table this is given as a range.
The WATH documents process steps, formal and informal costs, and processing time in great detail, which should facilitate future monitoring as it is easy to identify where changes have taken place.
Corridor 5: Lomé-Ouagadougou
Source: USAID WATH - Transport & Logistics Costs on the Lomé-Ouagadougou Corridor
(2012).
The report considers 8 cases. For the comparison we use as example 1x20ft container door-to-door loaded with textiles; value USD 16,610; weight 15 tonnes.
For other comments see corridor 4 above.
Corridor 7: Lagos-Kano-Jibiya
Source: USAID NEXTT - Lagos-Kano-Jibiya (Lakaji) Corridor Performance: Baseline
Assessment Report on The Time And Cost to Transport Goods (2013).
The report considers a single case: One 1x20ft container door-to-door loaded with a basket of goods (rice, paper & powdered milk) with a CIF value of USD 76,058.70; weight 17 tonnes.
The report considers the corridor within Nigeria only.
The particularity of the NEXTT report is that it includes a calculated dollar-value of the savings a shipper would gain if the corridor performed to the same standard as a high performing benchmark corridor such as Durban.

Accelerating Trade in West Africa (ATWA) – Stage 1 Final Report
14
4. WHERE SHOULD ATWA START? NAVIGATING COMPLEXITY
As demonstrated in Section 3, there are differences between the West African corridors in terms of their main features and performance levels, but these are differences of degree rather than fundamental differences. From an international benchmark perspective, all West African corridors are about 2.5 times more expensive than a North American equivalent, take at least twice as long and involve much greater uncertainty.
The cost difference between the best performing corridor and the worst performing corridor in West Africa is of about 30%, whilst the time required to move a consignment from arrival in port to clearance for consumption at destination is on average 16 days with a high of 19.7 for Cotonou-Niamey and a low of 11.6 days for Lomé-Ouagadougou. All transit corridors act as lifelines to the external world for some of the world’s poorest countries, such as Niger and Mali.
In order to delineate different sub-groups of corridors (and by implication the countries through which they pass) that ATWA could potentially initially focus under Strategic Objective 1, this Stage 1 Report makes the following assumptions:
In order to have an in-country presence and work at significant scale post design phase, ATWA can only focus on a maximum of 2-3 corridors and 3-5 countries initially.
That these 2-3 corridors and 3-5 countries should encompass both Union Économique et Monétaire Ouest Africaine (UEMOA) and ECOWAS Member States.
That the sub-groups delineated should include at least one North-South corridor.
With these three assumptions in mind, one can divide the corridors of the West Africa region into several sub-groups, with the associated countries. These are shown in Figure 1 below. In the rest of this section, we then review each corridors/countries group’s main characteristics in terms of:
Export basket composition: what do the countries export and what does this tell us about the potential for export led pro-poor growth?
Intraregional trade: how much do the countries trade with each other on the corridors in question?
Basic poverty profile: how many people living below the poverty line could we be expected to reach?
Finally, each corridor/country is reviewed in detail in terms of ports, customs systems, regulatory environment, ports, planned investment, etc. The broader environment in terms of relations between countries, languages spoken, reforms underway is also addressed where relevant.
This allows us to come up with a proposal for a phased approach to diagnostic and design work for ATWA Strategic Objective 1 in Stage 2 and Stage 3: initially focusing on a limited number of corridors/countries in the West Africa region where prospects for relatively quick results are possible and risk levels are lowest, and then expanding to other countries and corridors as results and resources materialize.

Accelerating Trade in West Africa (ATWA) – Stage 1 Final Report
15
Figure 1 - West African corridors and potential groups

Accelerating Trade in West Africa (ATWA) – Stage 1 Final Report
16
5. GROUP 1: BENIN, NIGER, NIGERIA
5.1 Summary of Group 1
This group encompasses the Cotonou-Niamey corridor, the LAKAJI corridor and a section of the Abidjan-Lagos corridor. It includes the busiest transit corridor under review (Cotonou/Niamey), a section of the Abidjan Lagos corridor and Nigeria’s most important internal corridor, which we assume might serve some parts of Niger as well. The LAKAJI corridor is also probably the most expensive corridor in the region if the cost of crossing into to Niger was to be added to total costs.
Nigeria is very much the pulling force of trade and transit flows in this group. The Cotonou-Niamey corridor is the busiest transit corridor in the region, but as explained above this is probably because it serves Northern Nigeria as well. With high trade flows, higher than average trade costs, and a section of the Abidjan Lagos Corridor linking Nigeria to West Africa’s major urban centres it could also be the key to integrating Nigeria with the rest of ECOWAS to a greater extent. Niger is also one of the poorest countries in the region, and the two transit corridors serve some of the poorest parts of Nigeria, suggesting a high poverty reducing potential.
Export profile
A closer look at the export profile of countries in this region reveals however that they are heavily concentrated in exports originating from the extractive sector – with 73% of Niger’s exports concentrated in ores, minerals and fuels and 88% of Nigeria’s exports being petroleum. This could be a significant downside factor and limitation in terms of potential for impact on poverty reduction from improving trade facilitation along the corridors in this group.
Table 3 - Export basket for Group 1 countries
Country Total Merchandise exports (USD million)
Food Aggregate Raw Materials
Fuels Ores and Metals
Manufactures
Benin 2,010 30% 49% 0% 4% 20%
Niger 1,500 11% 1% 27% 46% 12%
Nigeria 98,000 5% 3% 88% 1% 3%
Intra-regional trade
Apart from transit trade flows, how do Group 1 countries trade with each other on the corridors in question? The answer is that trade amongst Group 1 countries is very much one way with Niger and Benin exporting a significant share of their regional exports to Nigeria, while importing relatively little from it. 60% of Benin’s regional exports are destined to Niger and Nigeria (mostly to Nigeria), while only 1.53% and 10.25% of Niger’s and Benin’s imports come from their Group 1 neighbours.

Accelerating Trade in West Africa (ATWA) – Stage 1 Final Report
17
Table 4 - Intra-regional trade amongst Group 1 countries
Country Exports from Group 1 as % of regional exports
Imports from Group 1 as % of regional imports
Benin 60.86 1.53
Niger 39.24 10.25
Niger 0.07 9.95
As detailed below, the countries in this group also have particularly complex relationships when it comes to trade with each other. There are reportedly high levels of informal trade and smuggling taking place between Benin and Nigeria (and presumably Niger). Several key goods such as rice and cloth are known to be transhipped from Benin to Nigeria in order to bypass prohibitive Nigerian import duties and restrictive quotas. The Nigerian business community regularly calls for the closure of the border with Benin, which has happened in the recent past.
Poverty profile
Representing 64% of regional GDP, Nigeria is by far the largest and wealthiest country in the ECOWAS region. It does however have a high proportion its population living with less than 1.25 USD per day (62%). Benin and Niger are much smaller and, in GDP/capita terms, much poorer. Key poverty related indicators of this group are as follows:
In Benin, Niger and Nigeria 116.92 million people live below the poverty line of USD 1.25 per day.
This represents 59.6% of the group’s total population of 196.1 million people.
The weighted average GDP/capita in this region is USD 2,819, but this hides significant differences between Nigeria (3,185 USD), Benin (825 USD) and Niger (USD 441). Niger is the second poorest country in capita/GDP terms in ECOWAS, and the poorest in UEMOA.
Trade facilitation
The border crossing between Benin and Nigeria (Seme/Krake) has a reputation of being the most difficult and complex in all of ECOWAS. It takes on average 63 hours to cross from Benin into Nigeria, by far the worst performing border crossing in the region. JBPs are being built at Seme/Krake (Nigeria/Benin) and at Malanville (Benin/Niger) but they are not operational yet. Furthermore convoys, quotas and tour de rôle appear to still be enforced in Benin and Niger suggesting that a reform of the trucking industry is a prior condition for the reduction of costs to be passed on to consumers in this sub-region.
Summary of considerations for Group 1
Opportunities for ATWA:
High transit trade volumes on Cotonou-Niamey. Lagos ports also handle, by far, the most traffic.
High costs on the LAKAJI corridor, suggesting that there is ample room for improvement and cost reduction.
Very high number of people living below poverty line. Corridors reach into remote region with high poverty ratios.

Accelerating Trade in West Africa (ATWA) – Stage 1 Final Report
18
Presence of Nigeria, accounting for 64% of regional GDP.
Limitations/challenges for ATWA:
Export profile concentrated in extractive sector goods.
Problematic trade regime and trade patterns between Benin and Nigeria, very complex border crossing.
Source of costs on the LAKAJI corridors appear to be in the ports, potentially requiring costly physical investments for decongestion.
Sub-region is very unbalanced economically.
Tour de Role and quotas still in force to allocate cargo between Benin and Niger.
Insecurity in Northern Nigeria, where both corridors end.
5.2 BENIN
5.2.1 Cotonou Port11
The “Port Autonome de Cotonou” (PAC) is the only commercial port in Benin. Transit cargo is the most important PAC activity. This fits well with the perception of Benin as a warehouse economy servicing Nigeria. In 2008, re-exports to Nigeria accounted for about 62% of Benin’s GDP.12 Much cargo is transported (often smuggled, presumably) from Benin to Nigeria, including via Niger and from there to Northern Nigeria. Traffic through the port has been fairly stable over the period 2008-2012 as shown in the table below.
Table 5 - Cotonou port: Total traffic (‘000 tonnes)13
Description 2008 2009 2010 2011 2012
Import Benin 2,724 2,723 2,363 2,270 2,921
Import transit 3,411 3,244 3,877 3,487 3,354
Export Benin 860 727 711 1,031 1,141
Export transit 3 4 9 16 24
Total 7,000 6,700 6,961 6,807 7,441
The PAC container terminal is leased to Bolloré Africa Logistics and traffic is shown below.
Table 6 - Cotonou container traffic 14
Port Traffic
Containers (TEU) 2005 2006 2007 2008 2009 2010 2011
Total 140,500 167,800 312,000 299,500 305,000
11 Sources: World Bank - Logistics Cost Study of Transport Corridors in Central and West Africa, by Nathan Ass (2013); and the PAC website http://www.portdecotonou.com except when other source given 12 Golub, S. (2008) Entrepot trade and Smuggling in West Africa: Benin, Togo and Nigeria. 13 Source: Port statistics 14 Source: Market study on container terminals in West and Central Africa, MLTC/CATRAM, Jan 2013
Accelerating Trade in West Africa (ATWA) – Stage 1 Final Report
19
Containers are usually stripped at the port and cargo from several containers is loaded as break-bulk on heavy trucks for onward transport to Burkina Faso, Niger or Nigeria. Port dwell time varied between 12 and 27 days between 2011 and 2014 with no clear trend.15
Pirates from Nigeria sometimes threaten vessels calling at Cotonou, which is why ships that have to anchor while waiting for a berthing window often sail to Lomé in Togo, which is safer.
Inland container depot (ICD)
APTM (Maersk) has established an ICD near the port, which operates as an extension of the port yard. Containers are transferred from the port by train and undergo customs clearance at the ICD.
Single window and other customs practices
Benin has implemented an electronic single window system (System Electronique du Guichet Unique Béninois - SEGUB) and hired Société Bénin Contrôle (SBC) for the task of goods valuation before customs declaration. The perception is that processes are slower now than before, but that in the medium term, cost and time to clear customs will be lower. The services of SBC have been suspended, but SEGUB is still in place.
The Government has recently signed an agreement with Solutions Technologiques pour le Transport au Bénin (STTB) to help control the flow of trucks in the city of Cotonou.
Recent developments
The US Millennium Challenge Corporation invested USD 180 million in a new wharf and other developments in the port between 2006 and 2011 including dredging the channel to 15m to accommodate West Africa MAX vessels with a draught of 13.5m. The new container terminal is leased to Bolloré for a period of 25 years, with a commitment by Bolloré to invest a further USD 256 million in private investments.
Planned investments
Port Master plan: Port of Amsterdam International (PoAI) has been contracted by the Netherlands Embassy in Benin to help revitalize the Port of Cotonou. PoAI will assist the Dutch Embassy in developing a strategic master plan in conjunction with an action plan and technical specifications for the port’s renovation and restructuring of operations16.
Issues and recommendations:17
Insufficient equipment for piloting and tug boat services;
Lack of space at quays, with too-narrow working and traffic areas;
Lack of coordination between port services;
Lack of adequate equipment for general cargo and bulk handling;
Yards have limited space and are constantly congested with containers and trucks;
Low cargo storage costs at port encourage lengthy dwell times;
Manual interface procedures causing delays and adding costs;
15 ALCO/WB Projet ALTTFP Rapport An 4: Juillet 2013 – Juin 2014 16 http://worldmaritimenews.com/archives/150143/benin-seeks-dutch-expertise-on-port-de-cotonou-project/ 17 World Bank - Logistics Cost Study of Transport Corridors in Central and West Africa, by Nathan Ass (2013);

Accelerating Trade in West Africa (ATWA) – Stage 1 Final Report
20
Lack of equipment for the GPS tracking system.
5.2.2 Cotonou-Niamey corridor
The 1,070 km long Cotonou-Niamey corridor starts from the Port of Cotonou and passes through the border posts of Malanville, Benin and Gaya, Niger on the way to Niamey. However much cargo never reaches Niamey but is transported east from Dosso, about 100 km south of Niamey, to Nigeria, or other destinations. This transit corridor once included a rail service from Cotonou to Parakou, in Benin. The service was stopped in 2000 but will now be upgraded under the Cotonou-Niamey rail project (see the Rail section in Part 1 of this report).
5.2.3 Traffic
Cotonou is important for transit traffic with a total of 3.3 million tonnes in 2012. Of this two thirds, or 2,2 million tonnes were destined for Niger, very possibly for onward transport to northern Nigeria. Cotonou is also important for transit traffic directly to Nigeria (494,000t), presumably mostly via the Abidjan-Lagos corridor, and to Burkina Faso (355,000t).
Table 7 - Transit traffic through Cotonou port 18
Transit - import (‘000 t) 2008 2009 2010 2011 2012
Chad 27 33 29 29 6
Niger 2,203 2,074 2,486 2,170 2,249
Burkina Faso 226 315 437 353 355
Mali 108 140 194 258 175
Nigeria 836 643 615 573 494
Togo 4 6 6 15 6
Other (Ghana, Côte d'Ivoire & transhipment) 8 33 110 90 67
TOTAL Transit import 3,411 3,244 3,877 3,487 3,354
According to the Traffic Survey undertaken by the Japanese International Cooperation Agency (JICA) the Benin-Niger border crossing was the busiest crossing between any coastal and landlocked country in West Africa with an average of 997 vehicles per day of which 31 percent (309) were heavy trucks carrying about 13,000t per day. International traffic on the corridor is made up of transit traffic from the Port (64 percent) and inter-regional traffic (36 percent)19.
5.2.4 Procedures and border posts at Benin-Niger border
Benin is one of the few countries in West Africa where a cargo sharing quota system is still enforced (as of 2012). This means that cargo destined for Niger is divided between transporters from Niger and Benin in the proportion two thirds/one third, except that “strategic cargo” is supposed to be allocated entirely to Nigerien transporters. A large volume of cargo
18 Source: Compiled by the author from port and shipper council statistics 19 JICA Traffic Survey (2012).

Accelerating Trade in West Africa (ATWA) – Stage 1 Final Report
21
including strategic cargo is however transported by Beninese trucks registered in Niger and employing drivers from Niger.
A military agent escorts each loaded truck to Malanville for which the transporter is charged XOF 100,000 per truck. The trucker may have to wait for the escort but it should be available within two days at most. In general, shippers and transporters like the current escort system, because the presence of a military agent on the truck prevents harassment and demands for bribes at checkpoints.
A GPS tracking system introduced in 2010 was discontinued, but will presumably be started again with a different operator. 20
Malanville, 760 km from Cotonou, is the border post between Benin and Niger. The table below describes the customs procedures in Niger and border crossing times at the Malanville-Gaya crossing. It is worth noting how much time it takes to import goods to Niger. Exporting is much quicker although one should keep in mind that most trucks traveling south are empty.
Table 8 - Niger border crossing procedures and border crossing times 21
Ma
lanvill
e,
BJ
Ga
ya, N
G
Ma
lanvill
e,
BJ
Ga
ya, N
G
13h 46h 0h41 0h16
15h 48h 0h42 0h10
5.2.5 Inland cargo processing
A customs escort is required in both Benin and Niger. After the cargo leaves the port the main activity occurs at the border, and for customs clearance at the main office in Niamey. There are currently no dry ports in Niger and no special inland terminals; but a dry port is being constructed at Dosso, south of Niamey.
20 An Arrêt clarifying Decret 2011-106 du mars 22, portant institution d’un Programme de Verifications des Importations, specified a GPS tracking system to be operated by La Société Benin Control at a cost of almost
XOF 100,000 per transit, about 4 times what GCNet Ghana charged. It was all very odd and eventually the contract was cancelled, but appears to be under litigation – See JA Patrice Talon fait condamner le Bénin, 22 May 2014. 21 Source: JICA Traffic Survey & ALCO “Passage des postes frontières” Sep 2014; compiled by author.

Accelerating Trade in West Africa (ATWA) – Stage 1 Final Report
22
5.2.6 Road description
Traffic in and around Cotonou is very congested and the road between Cotonou and Bohicon is poor. Otherwise the road from Bohicon to Malanville at the border with Niger is good even though part of the road that was newly built in 2013 is already damaged - most likely because it was poorly built.
In Niger the road between Gaya, the border with Benin and Dosso is poor while from Dosso to Niamey it is good. Dosso is the take-off point to Birnin Konni, Maradi and Zinder for traffic going to northern Nigeria.
Since 1999, Niger’s roads have been maintained by Caisse Autonome de Financement de l'Entretien Routier (CAFER), with funding coming from road tolls and a XOF 30 per litre tax on fuel.
5.2.7 Road governance
The 23rd Road Governance Report covering the 1st quarter of 2013 shows that Mali had the most controls and highest level of bribes among the 8 countries covered by OPA.22 A close second was Niger with 2.1 controls and bribes equivalent to USD 6.28 per 100 km for legal trucks, i.e. trucks, drivers and cargo meeting all legal requirements.
For trucks, drivers and cargoes that are not necessarily in order - usually carrying perishable agricultural goods - the numbers of checkpoints are about the same but the bribes increase by more than 1,000 percent to the alarming equivalent of USD 78.83 per 100 km.
We are not aware of the government of Niger having taken any action to improve the situation, but in Benin, the government has issued decree 2013-546, which fixes the number of joint checkpoints – i.e. all agencies to be at the same checkpoint - as follows:
Cotonou-Malanville (Niger): 3 Checkpoints.
Cotonou-Porga (Burkina): 3 Checkpoints.
Cotonou-Hillacondji (Togo): 1 Checkpoint.
Cotonou-Kraké (Nigeria): 1 Checkpoint.
Cotonou-Igolo (Nigeria): 1 Checkpoint.
The decree furthermore specifies that the duration of each joint control should not exceed five minutes per vehicle except in cases of suspected fraud or illicit cargo.
This, if properly implemented, would be an improvement to the situation described but does not meet the UEMOA rule that there should be no checkpoints at all for transit traffic other than at origin, border crossings, and destination.
5.2.8 Summary Of findings
Most of inefficiencies and factors increasing the total logistics cost on Cotonou–Niamey corridor are common to all West African corridors. The corridor’s main inefficiencies are as follows: 23
Trucking industry inefficiencies:
22 Published jointly by UEMOA and USAID West Africa and include Agribusiness Trade Development Project data. 23 World Bank - Logistics Cost Study of Transport Corridors in Central and West Africa, by Nathan Ass (2013)

Accelerating Trade in West Africa (ATWA) – Stage 1 Final Report
23
Current incentives are to strip containers and overload trucks;
Trucking freight rates are “black box” types of pricing, with predominantly fixed costs and very limited variable costs;
Trade imbalance: imports exceed exports leading to a scarcity of backload cargo;
Seasonal demand: freight rates can be greatly influenced by export commodity season, like cotton and onions;
Transport demand exceeding supply in most periods of the year, especially for high-value strategic products;
Quota system inducing excessive regulation and limiting competition;
Lack of market transparency in business practices;
Old and obsolete fleet operated by poorly qualified truckers;
Low annual mileage per truck due to long wait times at the Port of Cotonou;
Unfair competition from non-professional truckers operating old vehicles, which leads the entire profession to be able to charge only low freight rates that do not guarantee sufficient income for fleet renewal;
Poor roads causing frequent breakdowns and high vehicle operating costs.
Transport and trade facilitation inefficiencies:
High port handling charges and shipping line charges;
Lack of professionalism of freight forwarders;
Unreliable Internet connection going down frequently, which delays the clearing processes;
Bribes and non-official fees are required to accomplish transactions;
Truck overloading increases load factors and reduces rates;
Too many checkpoints along the corridor and informal payments and corruption.
5.3 NIGER
5.3.1 Corridors
Like all landlocked countries in West Africa, Niger is connected to the sea through several corridors. Table 9 below shows all corridors linking Niger to a Seaport.
Table 9 - Niger corridors
Corridor Distance (km) Comment
Lagos-Niamey 1,166 Very little transit through Lagos
Cotonou-Niamey 1,035 Niger’s most important transit port (75%)
Lomé-Niamey 1,075 Second most important transit port (22%)

Accelerating Trade in West Africa (ATWA) – Stage 1 Final Report
24
Tema-Niamey 1,175 Third transit port (9%)
Abidjan-Ouagadougou-Niamey
1,631 May become interesting if railway completed
Dakar-Bamako-Ouagadougou-Niamey
2,709 Part of TAH 5
Source: http://www.distancesfrom.com
5.3.2 Traffic
Imports to Niger for the 2005-2011 period as reported by the Conseil Nigérien des Utilisateurs des Transports publics (CNUT) are summarized in the table below. Niger, together with Mali, are the two countries in West Africa with the most unbalanced trade pattern as export volumes amounts to only 10 percent of import volumes.
Table 10 - Niger imports (‘000 tonnes)
2005 2006 2007 2008 2009 2010 2011
Nigeria 107 130 59 64 123 166 106
Bénin 619 713 919 967 765 871 994
Togo 192 140 204 196 173 308 365
Ghana 330 266 254 403 146 148 157
Cote d'Ivoire
52 39 33 32 35 33 36
Burkina 32 41 33 28 69 53 19
Mali 14 1 1 1 - 4 1
Total 1,346 1,330 1,504 1,690 1,310 1,585 1,677
Source: Conseil National des Utilisateurs des Transports Publics (CNUT)
Existing traffic statistics are confusing however, as Cotonou port reports that 2.2 million tonnes of transit cargo destined for Niger passed through the port in 2011 compared to the 994,000t reported by CNUT. 24 The confusion is compounded by the fact that the JICA 2012 Traffic Survey reports that international traffic on the Cotonou-Niamey corridor is 64 percent transit and 36 percent inter-regional traffic. If the Port and JICA are correct, traffic to Niger should be around 3,4 million tonnes. However, JICA also reports that the daily average volume crossing the Benin/Niger border is about 14,000 tonnes which, if correct, would give 4.6 million tonnes per year taking into account that exports are equivalent to about 10 percent of import volume.
We do not know if or how these discrepancies can be explained but cargo diversion and smuggling may have something to do with the confusing and contradictory statistics. As explained above, the smuggling is induced by tariff and taxation policy differences between Nigeria and Benin.
24 For port statistics see Cotonou Port section

Accelerating Trade in West Africa (ATWA) – Stage 1 Final Report
25
5.3.3 Customs procedures
Customs clearance takes place at the main office in Niamey. There are currently no dry ports in Niger and no special inland terminals, but a dry port is being constructed at Dosso, 125 km south of Niamey, where the road East to Maradi, Zinder and Nigeria takes off.
5.3.4 Transport sector
Information on Niger is generally difficult to come by. The best overview of the Niger transport sector we have found is in the 2012 JICA Traffic Survey. However, CAFER (Caisse Autonome de Financement de l’Entretien Routier) has a good website with what appears to be up-to-date information on the Niger road network. 25
Road transport accounts for at least 95 percent of the transport market in Niger. The transport sector has several structural and organizational problems among which are:
Low profitability of transport companies;
Overcapacity in transport supply;
Obsolescence of the equipment;
Lack of supervision and training facilities;
Road insecurity;
Low professional qualifications of operators.
5.3.5 Road Network
The Caisse Autonome de Financement de l’Entretien Routier (CAFER), reports that the total length of roads of all categories in Niger is 19,711 km of which 4,225 are paved. The condition of the paved network has improved significantly since implementation of the maintenance program in 2013. CAFER reports that in 2009, 51 percent of paved roads were in good condition, 40 percent in fair and 9 percent in poor condition.
CAFER is responsible for financing road maintenance and is funded from road tolls, fines from overloaded trucks and a tax on fuel. CAFER became operational in 2001 and was designed to be a so-called 2nd generation road fund, which means that road charges are collected directly from users to fund the maintenance of the road network. CAFER is also dependent on a tax on fuel, which is collected by the government for transfer to CAFER. Although there is a significant improvement in CAFER revenues, these still cover only about 40 percent of the real need for road maintenance26.
5.3.6 Rail sector
Niger does not have a railroad but it has been the co-owner with Benin, of the 438 km rail network in Benin, managed by the l’Organisation Commune Benin-Niger des Chemins de Fer et des Transports. Recently, the Bolloré Group has signed a concession with the Benin and Niger governments to build and operate a rail line from Niamey to Parakou. The work on the 574 km that connects Niamey, Niger's capital, to the city of Parakou, in the center of Benin started in April 2014. The rest of the railway line connecting Parakou to Cotonou
25 http://www.cafer-niger.org 26 CAFER Exec. Director quoted in INFOROUTES - Le Magazine d’Information de la CAFER- N°30 - Janvier 2015

Accelerating Trade in West Africa (ATWA) – Stage 1 Final Report
26
already exists but will be renovated as part of this project. The line will carry mostly freight. Passengers should represent only a fifth of the activity.27
5.3.7 Transport services28
In Niger (mainly in Niamey) 122 large companies with 4,241 trucks dominate the transport sector and control most of the truck fleet. The Niger fleet is generally dilapidated, with an average truck age of more than 25 years.
Niger has concluded road transport and transit agreements with its neighbours Benin, Burkina Faso, Togo, Ivory Coast, Ghana, Mali and Nigeria, specifying:
The distribution of road freight transit traffic between carriers of both countries;
The axle load and weight of eligible vehicles;
Vehicle documents;
The permitted routes for these vehicles in the two countries.
The road transport agreements signed between Niger and Benin (October 1977) and between Niger and Togo (1975), the two main partners of Niger, distribute cargo according to the following quotas:
1. Imported goods:
Lorries registered in Niger: 2/3 tonnage;
Lorries registered in Benin and Togo: 1/3 tonnage.
2. Bilateral trade:
Lorries registered in Niger: 50 percent of the tonnage;
Lorries registered in Benin and Togo: 50 percent of the tonnage.
In all these agreements cabotage within one of the contracting countries is not permitted for a carrier from the other country. Moreover, strategic products such as hydrocarbons and mining products are exclusively transported by Niger transporters. These provisions are typical for all bilateral transport agreements.
However the agreements are not respected and Beninese and Togolese trucks often transport over 55 percent of freight instead of the 33 percent accorded in the agreements. In 2007 Niger officially ended the “tour de rôle” (first come first served) system for allocating freight to trucks29. However a “tour de rôle” system controlled by unions in Niger, Benin or Togo is still in force in the ports of Cotonou and Lomé.
The Law requires vehicles to be tested regularly for roadworthiness and heavy trucks should be inspected every six months 30 . Since 2010, this operation is managed by a private company, the Société Nigérienne de Contrôle Automobile.
27 L’Economiste - Ligne ferroviaire Cotonou-Niamey : Bolloré va investir 700 milliards XOF dans BENI Rail, 12 avril 2015 28 The information in this section is from ALCO - Industrie des transports au Niger et au Benin, Dec 2014 29 Article 2 of the Decree No. 09 / MT / DTT-MF of 13 February 2007 states: "Regarding the 2/3 tonnage quota for trucks registered in Niger, the importer is authorized to move his goods using its own trucks or any Nigerien transporter of his choice with trucks registered in Niger (ticket and registration cards as proof)" 30 Roadworthiness testing is governed by Order No. 0026/MTT/A/DTT/MF May 14, 2010

Accelerating Trade in West Africa (ATWA) – Stage 1 Final Report
27
Niger has no formal system for the disposal or recycling of old vehicles, which is done by informal operators with very basic facilities (manual cutting and using torches)
5.4 NIGERIA
5.4.1 Lagos ports31
Nigeria has six ports, but for the purpose of this report we consider only the ports in Lagos, which serve the Lagos-Kano-Jibiya corridor to Niger and the Abidjan-Lagos-Dakar corridor along the coast. Lagos currently has two ports:
Lagos Port Complex in Apapa;
Tin Can Island Port Complex.
New billion dollar green-field ports are being developed near Lagos:
Lekki Port, in the Lagos Free Zone area, 65km east of Lagos city;
Badagry Port, 55 km west of Lagos city.
5.4.2 Traffic and operations
Approximately 85 percent of all Nigerian non-oil cargo passes through the ports of Lagos.32
Table 11 - Volume of cargo through Lagos33
Volume of Cargo Throughput (Million Metric Tons)
Port 2009 2010 2011 2012
Lagos Port Complex 21.1 22 23.4 21
Tin Can Island Port Complex
14.1 13 15.4 15
Containers (TEU)
2005 2006 2007 2008 2009 2010 2011
-Total 587,600 711,100 947,400 710,800 1,128171 1,413,276
All terminals are leased to private operators. The container terminals are operated by APMT (Apapa) and Bolloré (Tin Can Island). The Apapa container terminal has regular rail services to the interior cities of Kaduna and Kano.
5.4.3 Major planned investments
The Port at Lekki is a new seaport in the Lagos Free Trade Zone, 65km east of Lagos city. Construction was due to commence in 2015 and to be completed by 2018. When in service,
31 Sources: USAID NEXTT - Lagos-Kano-Jibiya Corridor Performance: Baseline Assessment Report on Time And Cost to Transport Goods (2013); Nigeria Port Authority (NPA) website; 32 http://www.mynewswatchtimesng.com/badagry-mega-port-hope-take/ 33 Source: http://www.nigerianports.org/dynamicdata/uploads/NPA%20Operational%20Statistics.pdf, Source: Market study on container terminals in West and Central Africa (2013) MLTC/CATRAM.
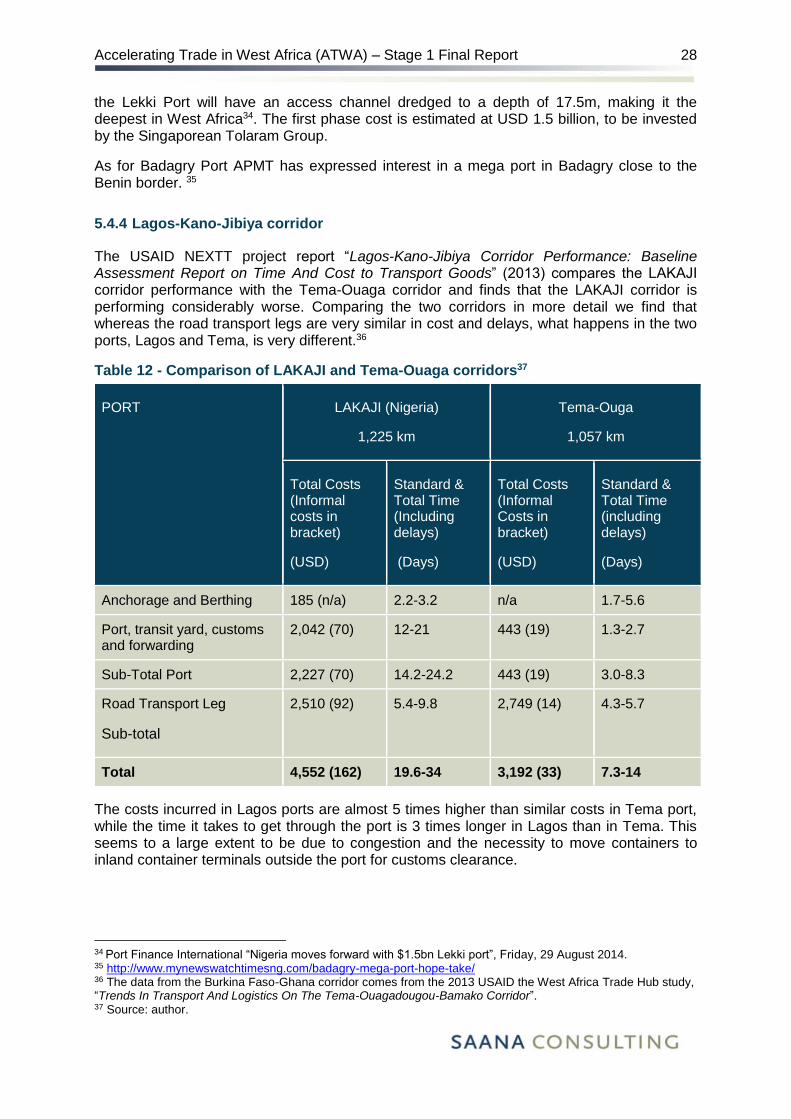
Accelerating Trade in West Africa (ATWA) – Stage 1 Final Report
28
the Lekki Port will have an access channel dredged to a depth of 17.5m, making it the deepest in West Africa34. The first phase cost is estimated at USD 1.5 billion, to be invested by the Singaporean Tolaram Group.
As for Badagry Port APMT has expressed interest in a mega port in Badagry close to the Benin border. 35
5.4.4 Lagos-Kano-Jibiya corridor
The USAID NEXTT project report “Lagos-Kano-Jibiya Corridor Performance: Baseline Assessment Report on Time And Cost to Transport Goods” (2013) compares the LAKAJI corridor performance with the Tema-Ouaga corridor and finds that the LAKAJI corridor is performing considerably worse. Comparing the two corridors in more detail we find that whereas the road transport legs are very similar in cost and delays, what happens in the two ports, Lagos and Tema, is very different.36
Table 12 - Comparison of LAKAJI and Tema-Ouaga corridors37
PORT LAKAJI (Nigeria)
1,225 km
Tema-Ouga
1,057 km
Total Costs (Informal costs in bracket)
(USD)
Standard & Total Time (Including delays)
(Days)
Total Costs (Informal Costs in bracket)
(USD)
Standard & Total Time (including delays)
(Days)
Anchorage and Berthing 185 (n/a) 2.2-3.2 n/a 1.7-5.6
Port, transit yard, customs and forwarding
2,042 (70) 12-21 443 (19) 1.3-2.7
Sub-Total Port 2,227 (70) 14.2-24.2 443 (19) 3.0-8.3
Road Transport Leg
Sub-total
2,510 (92) 5.4-9.8 2,749 (14) 4.3-5.7
Total 4,552 (162) 19.6-34 3,192 (33) 7.3-14
The costs incurred in Lagos ports are almost 5 times higher than similar costs in Tema port, while the time it takes to get through the port is 3 times longer in Lagos than in Tema. This seems to a large extent to be due to congestion and the necessity to move containers to inland container terminals outside the port for customs clearance.
34 Port Finance International “Nigeria moves forward with $1.5bn Lekki port”, Friday, 29 August 2014. 35 http://www.mynewswatchtimesng.com/badagry-mega-port-hope-take/ 36 The data from the Burkina Faso-Ghana corridor comes from the 2013 USAID the West Africa Trade Hub study, “Trends In Transport And Logistics On The Tema-Ouagadougou-Bamako Corridor”. 37 Source: author.

Accelerating Trade in West Africa (ATWA) – Stage 1 Final Report
29
5.4.5 Traffic
The LAKAJI Corridor is a 1,225 km transport route that runs from Lagos in the South through Kano in the North, to Jibiya at the border on to Maradi in Niger. The corridor is the main transport route for imports to and exports from northern Nigeria. The corridor links the country’s largest agricultural market in the north (Kano) and the largest consumer market in the south (Lagos). In the north, Kano serves as the transhipment hub linking Nigeria to the Sahel countries.
Table 13 - Commodities on the LAKAJI corridor
Major commodity flows along the LAKAJI corridor
Northbound Southbound
Rice Live Cattle
Sugar Maize
Palm Oil Sorghum
Fish Millet
Packaged foods Groundnuts
Fuel Cashews
Fertilizer Shea Butter
Cement Cocoa
Construction material Cotton
Sesame
About 80 percent of cargo passing through Apapa Port is destined for the Lagos area, and only around 1 percent is destined directly for Kano. This is because the majority of cargo for Kano is transhipped in Lagos before moving north. The origin of exports through Lagos ports is about 20 percent from Lagos, 7 percent from Kano, 7 percent from Ogun, 7 percent from Oyo, and 1 percent from Kaduna.
5.4.6 Road conditions
Lagos ports to the Lagos metropolitan area (25 km): The road network in the Lagos metropolitan area is characterized by poor conditions and heavy and disorganized traffic, with the arteries to the ports constantly blocked.
Lagos metropolitan area to Ibadan (115km): An estimated 20 million people live in the Lagos Metropolitan Area. The distance between Lagos and Ibadan is 115 km on a dual carriageway in fair condition, with two lanes and a very narrow emergency lane in each direction. Trucks park inappropriately on both sides of the road near urban areas, causing congestion and sometimes leaving only one lane operational in each direction. Drainage along this segment seems inadequate, and when rainfall is heavy sections of the road flood.
Ibadan to Illorin (155 km): The Ibadan urban area - and all urban areas along the corridor - is heavily congested with disabled vehicles constantly blocking the road, and informal

Accelerating Trade in West Africa (ATWA) – Stage 1 Final Report
30
commercial activities abounding on the roadside. However “dualization” of road linking Ibadan to Ilorin has significantly reduced traffic congestion.
Illorin to Kaduna (485 km): This segment is reportedly the worst maintained stretch of road along the corridor. It is a single carriageway, with one lane in each direction and no emergency lane, with surfacing mainly consisting of paved gravel and dirt. Disabled trucks blocking one of the two available lanes are common.
Kaduna to Kano (230 km): The road from Kaduna and Kano is a dual carriageway in good condition, with two lanes and an adequate emergency lane. A bypass 58 km from Kaduna allows drivers to avoid entering the urban area of Zaria. When surveyed the bypass had no major delay or congestion. However, road and traffic conditions in and around Kano are poor. The roads are heavily congested and the main routes are visibly deteriorated.
Kano to Jibiya (215 km): The road from Kano to Jibiya is a single carriageway with one lane in each direction and an emergency lane wide enough for disabled vehicles to stop without blocking traffic. This segment has a paved surface in fair condition. Although there is a sparse flow of trucks and cargo, traveling this segment took far longer than the Kaduna to Kano segment because of the high number of security checkpoints. The USAID NEXTT team encountered 21 checkpoints between Katsina town and Jibiya.
5.4.7 Cargo allocation
Transport of domestic cargo appears to be an open market. Freight forwarders and clearing agents charge on average USD 750 (NGN 150,000) for customs clearance for a 20-foot container. This service includes processing the importer’s Form M and handling issuance of the Risk Assessment Report for NGN 50,000 and handling all administrative processes, and arranging for transport for NGN 100,000. Trucking costs are paid by the shipper directly.
5.4.8 Checkpoints
The level of road harassment on the LAKAJI corridor where informal fees amounted to USD 11.5 per 100 km is worse than the worst case recorded by OPA, namely Mali, where drivers pay the equivalent of USD 7.60 per 100 km.38, 39
Table 14 - Checkpoints along the LAKAJI corridor
Length (km)
Segment Checkpoints Informal fees
(USD)
Informal fees per 100km
Checkpoints per 100km
115 Lagos to Ibadan 1 3 2.6 0.9
155 Ibadan to Ilorin 2 5 3.2 1.3
485 Ilorin to Kaduna 20 51 10.5 4.1
230 Kaduna to Kano 10 25 10.9 4.3
215 Kano to Jibiya 21 54 25.1 9.8
1200 Total Lagos Area to Jibiya
54 138 11.5 4.5
38 23rd Road Governance Report UEMOA - Survey Results for the first quarter of 2013 39 The NEXTT reports total informal payments along the road as USD 92 in one place and USD 132 in another.

Accelerating Trade in West Africa (ATWA) – Stage 1 Final Report
31
5.4.9 Rail
Nigeria’s rail service from Lagos to Kano was re-launched in early 2013, after improvements costing USD 166 million. There are now 27-30 round-trip trains currently operating per day, which move both people and freight. Commodities moving north by rail include wheat (which comes directly from flour mills in Lagos), salt, sugar, fertilizer and cement. Commodities moving south by rail are mainly livestock and agricultural produce such as grains, maize, millet, beans and sorghum. The trip takes on average 30-48 hours, with trains travelling at speeds between 40-50 km/h. Demand for freight service is high, as is the demand for passenger service, and the Nigeria Rail Corporation’s target is to achieve 80-120 trains per day.
The cost of rail transport from Lagos to Kano is currently USD 0.045 per tkm (NGN 7.1 per tkm), plus cost of insurance at 0.25 percent of consignment value. Keeping all other conditions constant on the corridor, including the vehicle transport cost from Kano to Jibiya and the informal fees along the way, using rail from Lagos to Kano could save the shipper USD 1,195 per consignment. The cost savings would come from the reduced transport fee, in addition to savings incurred by avoiding transhipping in Lagos, and avoiding informal fees on the long haul to Kano.
5.4.10 Inland container depots (ICD)
There are six customs-bonded ICDs in Nigeria, located in Ibadan, Kano, Isiala-Ngwa, Jos, Maiduguri and Funtua. Two of these are located on the LAKAJI Corridor (Ibadan and Kano). NEXTT researchers found a functioning ICD in Kano, but shippers interviewed had little knowledge of the criteria for its usage. Shippers had higher hopes for the Ibadan ICD, leased to Catamaran Logistics, although not yet functional. If the improvements to the rail line come to fruition, containers could avoid congestion in Lagos and travel under Nigerian Customs Service (NCS) control by rail to Kano and Ibadan ICD sites and be cleared there.
An earlier USAID study found that transfer from a marine terminal to an ICD cost as much as USD 400 for one 40-ft container or USD 300 for one 20-ft container, and took several days when trucks were not available.
5.4.11 Border clearance in the port
The entire border clearance process in the port takes 240 hours (10 days), beginning when cargo is moved from the terminal to the yard, and ending when customs release is issued. Included in these 10 days is time spent completing the Single Goods Declaration, customs assessment of the level of inspection required, booking and waiting for a window for physical inspection, and the inspection process itself, which usually takes several days.
Nigeria’s goal is to clear goods within 48 hours. NEXTT interviewees said that in the latter half of 2012, customs clearance time had in fact fallen to 48 hours for scanned cargo. According to NCS approximately 60 percent of containers are physically examined, 30 percent are scanned, and 10 percent are Fast-Tracked. Freight forwarders remarked that containers might be re-examined multiple times by different agencies. In 2011, the Minister of Finance reduced the number of agencies at the ports from fourteen to six.
Destination inspection (Comprehensive Import Supervision Scheme - CISS) still applied at the time of the survey, for a fee set at 1 percent of the FOB value of the shipment. Destination inspection programmes were scheduled to expire in 2013.
According to the Nigeria Shippers Council, NCS has a single window in the Lagos ports, which is however not connected to other agencies. NCS has implemented the concept of

Accelerating Trade in West Africa (ATWA) – Stage 1 Final Report
32
“authorized economic operators” who receive certain privileges such as fast-track clearance. NCS also has pre-arrival processing and accepts electronic documents and payments. However escort is used for transit goods. 40
5.4.12 Institutional & Regulatory Environment
Federal Ministry of Transport is responsible for marine transport (ports and inland waterways), railways, and federal mass transit.
Nigerian Ports Authority (NPA) was created under the Nigerian Ports Authority Act No. 38, giving it powers and duties to manage and administer Nigerian ports.
Nigerian Maritime Administration and Safety Agency is responsible for regulatory and promotional maritime mandates.
Nigerian Shippers Council was established by the Nigerian Shippers Council Act of 1977 to promote and defend Nigerian shippers’ interests in matters affecting the shipment of imports and exports to and from Nigeria.
National Transport Commission is part of a Bill that continues to undergo consideration before passage into law.
NCS is the government agency responsible for collecting Customs and excise duties and other fees, charges, and levies associated with international trade.
5.4.13 Major planned investments
The Lagos-Kano railway project: In December 2014, China Civil and Engineering Construction Company (CCECC) completed the 186 km Abuja-Kaduna standard gauge rail project estimated to cost USD 874m. The line has nine stations and features both passenger and cargo trains. The passenger trains on the line can operate at a speed between 200km/h and 250km/h. The travel time between Abuja and Kaduna will be reduced to one hour and each passenger train can carry up to 5,000 commuters. The cargo trains, carrying 800t of goods, will take one and a half hours to travel between the two cities.41
5.4.14 Issues and recommendations 42
The USAID NEXTT Team made the following recommendations, most of which we believe to be still valid today:
At ports:
To streamline border clearance and yard handling procedures:
Implement Single Window and/or electronic dashboard for customs to enable monitoring of clearance processes;
Reform of Customs risk evaluation system;
Support development of new (or replicate existing) container tracking systems.
During transportation:
To reduce congestion and delays:
40 From interview with NSC by ATWA local consultant – July 2015 41 http://www.railway-technology.com/projects/abuja-kaduna-rail-line/ 42 USAID NEXTT - Lagos-Kano-Jibiya Corridor Performance: Baseline Assessment Report on Time And Cost to Transport Goods (2013);

Accelerating Trade in West Africa (ATWA) – Stage 1 Final Report
33
Improve use of multimodal transport systems;
Extend rail lines into port terminals, requiring private concessions of rail lines;
Development and use of ICDs in Ibadan and Kano;
Consider investment in loading parks;
Consider policies to encourage use of containers for transport to final destination point;
Revisit truck movement policies in Lagos;
Look into development/implementation of container deposit insurance;
Consider improved or incentive-based trucking safety standards regulation and enforcement;
Encourage GPS monitoring systems for trucks;
Issue mandates to eliminate unauthorized/unnecessary checkpoints & appropriate enforcement of these.
At national level:
To improve transparency and efficiency of transport and logistics value chain:
Control piracy in the gulf of Guinea;43
Encourage leadership to conduct more frequent data collection of costs and delays (including informal fees) along the Corridor;
Identify and communicate locations/sources of demands for informal fees to address these appropriately;
Increase private sector involvement to advocate improved transparency in the transport and logistics industry (i.e. Corridor Management Group, Nigerian Chapter of Borderless Alliance);
Improve outreach on the legal processes and fees for imports and exports among transport and logistics value chain actors (i.e. Replicate WATH experiences);
Develop policies (public and private) to encourage more efficient use of trucks and backhauling;
Improve coordination of cargo movements (via freight exchange or similar mechanism);
Revisit policies related to registration and operation of freight forwarders;
Encourage transparency through increased use of platforms for sharing data (i.e. websites, reports, etc.);
Review and replicate international “best practices” in corridor management.
43 Combating Piracy in the Gulf of Guinea, The Africa Center for Strategic Studies, February 2015

Accelerating Trade in West Africa (ATWA) – Stage 1 Final Report
34
6. GROUP 2 A: BURKINA FASO, COTE D’IVOIRE, GHANA
6.1 Summary of Group 2 a
The corridors in this group are somewhat more efficient than those in Group 1, but not significantly so. The volume of transit on them is however lower than on other transit corridors in West Africa. Together the Tema-Ouaga and Abidjan-Ouaga handle 1,206 Mt of transit annually, lower than Cotonou-Niamey or Dakar-Bamako alone. This represents about 44% of Burkina Faso’s import volume from international markets.
Burkina Faso is an important transit country for goods traveling onwards to Niger, with 10% of transit traffic destined to Niger passing through the country. The rail link between Abidjan and Ouagadougou is being upgraded by the company Bolloré Logistics.
Export profile
The export profile of the countries in this group heavily features agricultural products (Ghana and Cote d’Ivoire are the world’s two largest exporters of Cocoa, and Burkina Faso is a significant Cotton producer). Ghana is a recent oil exporter, with fuels now accounting for 43% of its exports.
Table 15 - Export basket Group 2a countries
Intraregional trade
How much inter-regional trade goes on amongst Group 2a countries? The table below shows that roughly 30% of Group 2a countries’ regional exports go to each other. In terms of imports, Burkina Faso concentrates almost 70% of its regional imports from Cote d’Ivoire and Ghana, while the figure stands at 21% for Ghana, and 4 % for Cote d’Ivoire (Cote d’Ivoire regional imports are dominated by oil imports from Nigeria, which take place by sea). Ghana and Cote d’Ivoire are both the second and the third largest regional exporters, with 20.6% and 13.3% of their total exports going to the wider ECOWAS region.
Country Total Merchandise exports (USD
million)
Food Aggregate Raw
Materials
Fuels Ores and Metals
Manufactures
Burkina Faso 2,436 27% 43% 12% 9% 11%
Cote D’Ivoire 12,783 52% 9% 22% 0% 16%
Ghana 12,548 32% 4% 43% 4% 17%

Accelerating Trade in West Africa (ATWA) – Stage 1 Final Report
35
Table 16 - Intra-regional trade amongst Group 2a countries
Country Exports to Group 2 as % of regional exports
Imports from Group 2 as % of regional imports
Burkina Faso 36.63 68.52
Cote d'Ivoire 26.02 4.38
Ghana 24.75 21.88
Poverty profile
Cote d’Ivoire and Ghana are the two largest economies in ECOWAS after Nigeria, and some of the top economic performers in the region. In per capita terms, Cote d’Ivoire is the second most export oriented country in the region (the first being Nigeria, but Nigeria’s export basket is dominated by oil). Key poverty indicators in this region are as follows:
21.52 million people live below the poverty line in Group 2a countries, or 34.8% of the population of Burkina Faso, Cote d’Ivoire and Ghana living below the poverty line.
GDP per capita stands at a weighted average of 1,313 USD (730 USD for Burkina Faso, 1,646 USD and 1,462 USD for Cote d’Ivoire and Ghana respectively).
Trade Facilitation
The countries in this sub-group stand out for the interest and commitment they have shown to trade facilitation reforms over the years. On customs matters, Burkina Faso, Côte d’Ivoire, Mali and Senegal have a costed program (USD 7.6 million) for interconnecting their customs systems – but have not yet obtained the financing. Burkina Faso, Ghana and Mali have an agreement in place to use a single customs guarantee.
Ghana is in the forefront in implementing axle load controls, and in 2002 it established the first Single Window in West Africa in Tema and Takoradi ports. Ghana has also recently put in place a modern gate control system at Tema port.
Importantly, Burkina Faso and Côte d’Ivoire have agreed with the World Bank to implement reforms to their transport services industries under a Development Policy Operation involving USD 50 million loans to each country.
Summary of considerations for Group 2a
Opportunities for ATWA:
Most reform oriented grouping, from which best practices could be shared with the rest of ECOWAS.
Interesting trade facilitation projects already prepared that ATWA could support or complement.
Balanced export profile of countries.
Balanced intra-regional trade patterns.
Railway link between Abidjan and Ouagadougou.

Accelerating Trade in West Africa (ATWA) – Stage 1 Final Report
36
Limitations/challenges for ATWA:
Relatively low transit volumes on corridors in this group when compared to other corridors.
Recent political instability in Burkina Faso.
Group 2a is already receiving considerably support from development partners in the area of transport and trade facilitation (USAID, JICA and World Bank).
Lesser proportion of people living in poverty than in Group 1.
6.2 Burkina Faso
6.2.1 Corridors
Burkina Faso has five corridors and plays a central role in transit to Niger and Mali as goods to those countries from Tema, Ghana and Lomé, Togo, have to travel through Burkina Faso. The corridors are discussed in detail in the section below.
Table 17 - Burkina Faso corridors
Corridor Distance (km) Comment – relative importance in 2014
Cotonou-Ouagadougou
1,017 Carries 15% of Burkina import
Lomé-Ouagadougou 954 1st with 40% of traffic
Tema-Ouagadougou 929 Carries 16% of traffic
Abidjan-Ouaga, road & rail 1,118 2nd (combined) with 29% of traffic
Dakar-Bamako-Ouagadougou
2,190 Very little international traffic
Source: http://www.distancesfrom.com
6.2.2 Traffic
The most important corridor for Burkinabé imports is Lomé which has 40 percent of the traffic, followed by the road & rail corridors from Abidjan with 29 percent of traffic. Tema Port, which complains bitterly that its competitive position for transit traffic has been severely weakened because Ghana has been implementing axle load regulations for longer and more stringently than other countries, still comes in 3rd place. Burkinabé imports have increased by more than 100 percent in the last 5 years. Export is equivalent to about 12 percent of import volumes, mostly through Abidjan.
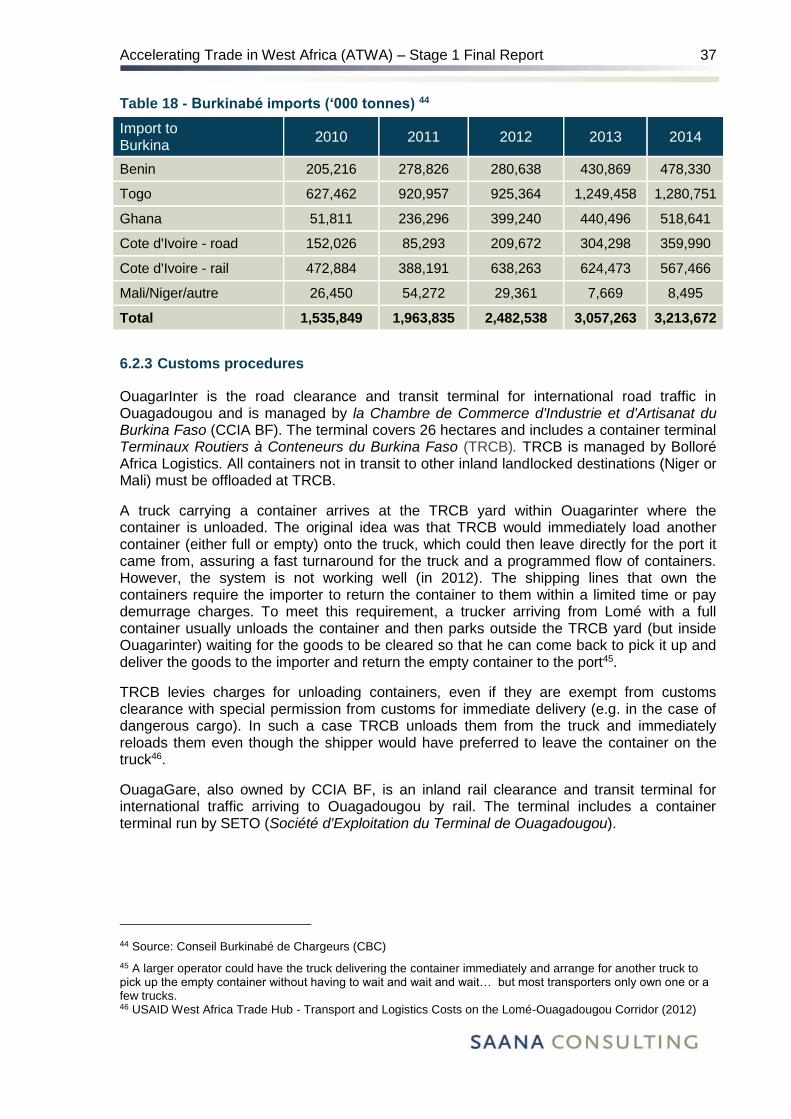
Accelerating Trade in West Africa (ATWA) – Stage 1 Final Report
37
Table 18 - Burkinabé imports (‘000 tonnes) 44
Import to Burkina
2010 2011 2012 2013 2014
Benin 205,216 278,826 280,638 430,869 478,330
Togo 627,462 920,957 925,364 1,249,458 1,280,751
Ghana 51,811 236,296 399,240 440,496 518,641
Cote d'Ivoire - road 152,026 85,293 209,672 304,298 359,990
Cote d'Ivoire - rail 472,884 388,191 638,263 624,473 567,466
Mali/Niger/autre 26,450 54,272 29,361 7,669 8,495
Total 1,535,849 1,963,835 2,482,538 3,057,263 3,213,672
6.2.3 Customs procedures
OuagarInter is the road clearance and transit terminal for international road traffic in Ouagadougou and is managed by la Chambre de Commerce d'Industrie et d'Artisanat du Burkina Faso (CCIA BF). The terminal covers 26 hectares and includes a container terminal Terminaux Routiers à Conteneurs du Burkina Faso (TRCB). TRCB is managed by Bolloré Africa Logistics. All containers not in transit to other inland landlocked destinations (Niger or Mali) must be offloaded at TRCB.
A truck carrying a container arrives at the TRCB yard within Ouagarinter where the container is unloaded. The original idea was that TRCB would immediately load another container (either full or empty) onto the truck, which could then leave directly for the port it came from, assuring a fast turnaround for the truck and a programmed flow of containers. However, the system is not working well (in 2012). The shipping lines that own the containers require the importer to return the container to them within a limited time or pay demurrage charges. To meet this requirement, a trucker arriving from Lomé with a full container usually unloads the container and then parks outside the TRCB yard (but inside Ouagarinter) waiting for the goods to be cleared so that he can come back to pick it up and deliver the goods to the importer and return the empty container to the port45.
TRCB levies charges for unloading containers, even if they are exempt from customs clearance with special permission from customs for immediate delivery (e.g. in the case of dangerous cargo). In such a case TRCB unloads them from the truck and immediately reloads them even though the shipper would have preferred to leave the container on the truck46.
OuagaGare, also owned by CCIA BF, is an inland rail clearance and transit terminal for international traffic arriving to Ouagadougou by rail. The terminal includes a container terminal run by SETO (Société d'Exploitation du Terminal de Ouagadougou).
44 Source: Conseil Burkinabé de Chargeurs (CBC)
45 A larger operator could have the truck delivering the container immediately and arrange for another truck to pick up the empty container without having to wait and wait and wait… but most transporters only own one or a few trucks. 46 USAID West Africa Trade Hub - Transport and Logistics Costs on the Lomé-Ouagadougou Corridor (2012)

Accelerating Trade in West Africa (ATWA) – Stage 1 Final Report
38
6.2.4 Transport sector 47
The Burkina Faso road network is 15,296 km in length, divided into three categories: national roads, regional roads and the country roads. With a length of 6,728 km, the national roads connect the main towns of the regions and ensure a link with the road networks of border countries. 45 percent of national roads are asphalted; the remainder consist primarily of ordinary earth roads. In 2011, 54 percent of paved roads were in good condition while 21 percent were in fair and 24 percent in poor condition.
It is estimated that the Burkinabé vehicle fleet will triple around every 12 years. Vehicles are characterized by a high average age with almost 55 percent of the vehicles being more than 20 years old. Vehicles less than 5 years old represent barely 5 percent of the fleet.
6.3 GHANA
6.3.1 Tema Port
Tema Port has ideal nautical conditions and is rarely affected by poor weather conditions (rain, fog). However, although the port is not very old (it dates back to 1962), its design is poorly adapted to container traffic with limited draught and, above all, a drastic lack of space. The container terminal is saturated, not only on the quays, but also in the yard and on the access routes.48
Meridian Port Services (MPS), a joint venture of Bolloré, APM and the Ghana Ports and Harbour Authority (GPHA), handles more than 80% of the container traffic in the port. The productivity achieved on the MPS quay is considered to be amongst the best in West Africa, with an average of 35 quay movements per hour.
Traffic and operations
Total traffic through Tema port is summarized below in Table 19.
Table 19 - Total Traffic through Tema Port
Description 2008 2009 2010 2011 2012 2013 2014
Imports 6,260 5,694 6,823 8,432 9,383 10,014 8,923
Exports 1,305 981 1,155 1,532 1,477 1,494 1,463
Transhipment 195 193 237 171 50 97 317
Transit-INWD 841 495 437 595 517 610 565
Transit- OUTWD 23 15 10 19 13 11 13
Total 8,727 7,406 8,697 10,749 11,469 12,181 11,126
TEU 555,009 525,694 590,147 756,899 824,238 841,989 732,382
Recent developments
Optical character recognition systems at main gates: Eight optical character recognition systems are being installed at the main gates of the port to capture, store and distribute data concerning container and vehicle movements in and out. This facility will ensure the
47 The information in this section is from the JICA Traffic Survey 48 Market study on container terminals in West and Central Africa, MLTC/CATRAM, Jan 2013

Accelerating Trade in West Africa (ATWA) – Stage 1 Final Report
39
safety and efficient and smooth management of container and vehicular movements to and from the port. Trucks and drivers not registered with the system cannot enter the port. The project cost is around USD 448,000.00. It was reported to be 80 percent complete in April 2015. 49
Customs Interconnection: Under the World Bank West Africa Regional Transport and Transit Facilitation Project, which involved Mali, Burkina Faso and Ghana, the customs services from the three countries have worked together to finalize the interconnection of their customs management systems, which was expected to be partly operational by June 2015. Furthermore, the Government of Burkina Faso has selected a service provider to offer cargo tracking services on its portion of the Tema-Ouaga-Bamako corridor. Mali is still in the process of testing its cargo tracking system on its section of the Corridor. (The World Bank project closed June 30, 2015).50
Planned investments
GPHA has announced that a USD 1.5 billion expansion to Tema port will make it the largest port in West Africa and allow it to reduce congestion. Construction of four deep-water berths, an access channel and the installation of high-capacity container equipment will begin in early 2015 and be completed within four years. The expansion, funded by Meridian Port Services, APM Terminals and Bolloré Africa Logistics, will bring Tema's capacity from 1 million TEU to 3.5 million TEU51.
Issues and recommendations52
Improving the capacity and efficiency of Tema’s container terminal:
The USAID report “Trends In Transport And Logistics On The Tema-Ouagadougou-Bamako Corridor (2013)” noted that standard port processing times for both containerized cargo and break-bulk had improved considerably over the 2008-2012 period, by 55 percent for containers, and 40 percent for break-bulk cargo. Interviews with stakeholders suggest that these improvements in clearance times could be attributed to improved coordination between agencies at the port and to streamlining of port clearance processes. Total delays had however not reduced by much because increased port congestion caused by significant traffic growth had introduced new delays.
SWOT analysis of the port of Tema 53
Strengths
The existence of a critical mass of import-export traffic;
Advantages vis-à-vis transit traffic to Burkina Faso in terms of the distance to Ouagadougou.
Weaknesses
49 http://gbcghana.com/1.2823038 50 WB- West Africa Regional Transport and Transit Facilitation Project, Implementation Status & Results Report April 8, 2015 51 Ghana port to triple capacity with $1.5 billion expansion | JOC.com 52 USAID West Africa Trade Hub: Trends In Transport And Logistics On The Tema-Ouagadougou-Bamako Corridor (2013) 53 Market study on container terminals in West and Central Africa, MLTC/CATRAM, Jan 2013
Accelerating Trade in West Africa (ATWA) – Stage 1 Final Report
40
Archaic port regulation and control (originally designed for a ‘service port’);
Insufficient draught available;
Lack of space behind the quays in the container terminal, and a general lack of space available in the port;
Lack of equipment on the conventional quays and poor maintenance of the available equipment (not including MPS);
Congestion on access roads;
Private investment is discouraged by unreliable profitability: the GPHA fixes the rates of private operators, sometimes in Cedi (which falls in value without any change in the tariffs);
Procedures are too cumbersome, costing time and money;
No rail service;
Too many licences granted to operators and freight forwarders, who are too numerous and incompetent;
General lack of resources and a climate which is averse to open competition.
Opportunities
The Ghanaian economy has entered a phase of sustainable growth;
Industrial diversification is possible into the oil and gas industry;
Landlocked countries are seeking to secure their supplies by diversifying routes.
Threats
All ports want to become regional hubs;
Some of the neighbouring ports have greater opportunities to develop their infrastructure at a limited cost;
Threats to maritime security in the Gulf of Guinea;
Poor cooperation between the city and the port;
Underdeveloped logistics sector, insufficient competence of operators.
6.3.2 Tema-Ouagadougou corridor
The Tema-Ouga corridor is 1,057 km long of which 881 km is in Ghana and 176 in Burkina Faso. The corridor serves mainly local Ghanaian traffic but is an important transit corridor for Burkina and to a lesser extent for Niger (border crossing at Bawku) and Mali (border crossing at Hamile).
Traffic
International traffic on the Tema-Ouaga corridor is made up of transit traffic through Tema Port to the landlocked countries, which amounts to about 450,000t per year, plus bilateral trade between Ghana and the landlocked country and other intra-regional trade. Inward transit traffic from Tema port from 2008 to 2012 is summarized in Table 20 below.
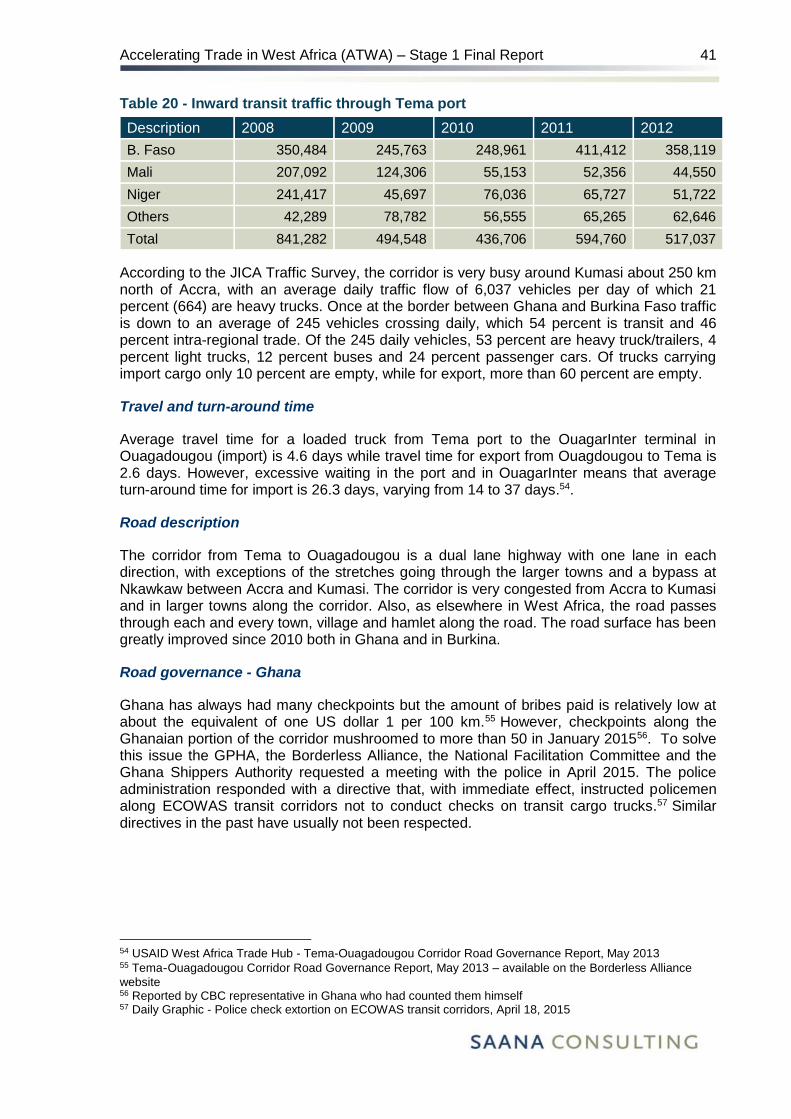
Accelerating Trade in West Africa (ATWA) – Stage 1 Final Report
41
Table 20 - Inward transit traffic through Tema port
Description 2008 2009 2010 2011 2012
B. Faso 350,484 245,763 248,961 411,412 358,119
Mali 207,092 124,306 55,153 52,356 44,550
Niger 241,417 45,697 76,036 65,727 51,722
Others 42,289 78,782 56,555 65,265 62,646
Total 841,282 494,548 436,706 594,760 517,037
According to the JICA Traffic Survey, the corridor is very busy around Kumasi about 250 km north of Accra, with an average daily traffic flow of 6,037 vehicles per day of which 21 percent (664) are heavy trucks. Once at the border between Ghana and Burkina Faso traffic is down to an average of 245 vehicles crossing daily, which 54 percent is transit and 46 percent intra-regional trade. Of the 245 daily vehicles, 53 percent are heavy truck/trailers, 4 percent light trucks, 12 percent buses and 24 percent passenger cars. Of trucks carrying import cargo only 10 percent are empty, while for export, more than 60 percent are empty.
Travel and turn-around time
Average travel time for a loaded truck from Tema port to the OuagarInter terminal in Ouagadougou (import) is 4.6 days while travel time for export from Ouagdougou to Tema is 2.6 days. However, excessive waiting in the port and in OuagarInter means that average turn-around time for import is 26.3 days, varying from 14 to 37 days.54.
Road description
The corridor from Tema to Ouagadougou is a dual lane highway with one lane in each direction, with exceptions of the stretches going through the larger towns and a bypass at Nkawkaw between Accra and Kumasi. The corridor is very congested from Accra to Kumasi and in larger towns along the corridor. Also, as elsewhere in West Africa, the road passes through each and every town, village and hamlet along the road. The road surface has been greatly improved since 2010 both in Ghana and in Burkina.
Road governance - Ghana
Ghana has always had many checkpoints but the amount of bribes paid is relatively low at about the equivalent of one US dollar 1 per 100 km.55 However, checkpoints along the Ghanaian portion of the corridor mushroomed to more than 50 in January 201556. To solve this issue the GPHA, the Borderless Alliance, the National Facilitation Committee and the Ghana Shippers Authority requested a meeting with the police in April 2015. The police administration responded with a directive that, with immediate effect, instructed policemen along ECOWAS transit corridors not to conduct checks on transit cargo trucks.57 Similar directives in the past have usually not been respected.
54 USAID West Africa Trade Hub - Tema-Ouagadougou Corridor Road Governance Report, May 2013 55 Tema‐Ouagadougou Corridor Road Governance Report, May 2013 – available on the Borderless Alliance
website 56 Reported by CBC representative in Ghana who had counted them himself 57 Daily Graphic - Police check extortion on ECOWAS transit corridors, April 18, 2015
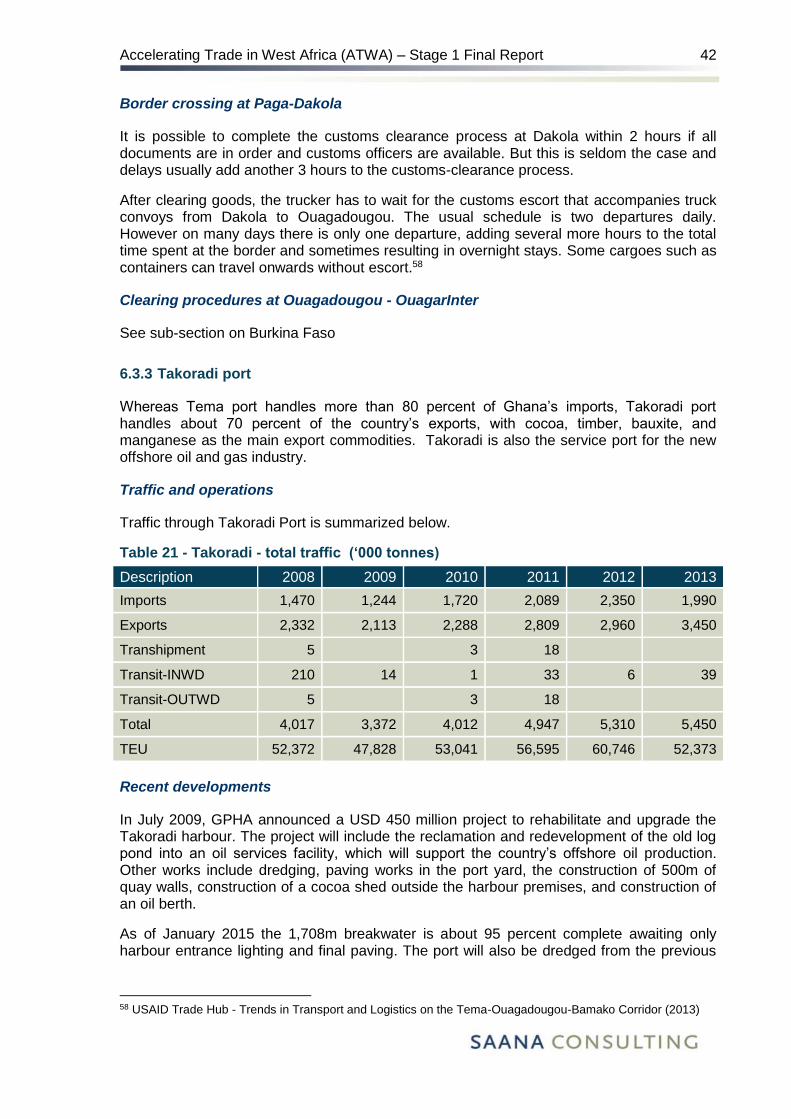
Accelerating Trade in West Africa (ATWA) – Stage 1 Final Report
42
Border crossing at Paga-Dakola
It is possible to complete the customs clearance process at Dakola within 2 hours if all documents are in order and customs officers are available. But this is seldom the case and delays usually add another 3 hours to the customs-clearance process.
After clearing goods, the trucker has to wait for the customs escort that accompanies truck convoys from Dakola to Ouagadougou. The usual schedule is two departures daily. However on many days there is only one departure, adding several more hours to the total time spent at the border and sometimes resulting in overnight stays. Some cargoes such as containers can travel onwards without escort.58
Clearing procedures at Ouagadougou - OuagarInter
See sub-section on Burkina Faso
6.3.3 Takoradi port
Whereas Tema port handles more than 80 percent of Ghana’s imports, Takoradi port handles about 70 percent of the country’s exports, with cocoa, timber, bauxite, and manganese as the main export commodities. Takoradi is also the service port for the new offshore oil and gas industry.
Traffic and operations
Traffic through Takoradi Port is summarized below.
Table 21 - Takoradi - total traffic (‘000 tonnes)
Description 2008 2009 2010 2011 2012 2013
Imports 1,470 1,244 1,720 2,089 2,350 1,990
Exports 2,332 2,113 2,288 2,809 2,960 3,450
Transhipment 5 3 18
Transit-INWD 210 14 1 33 6 39
Transit-OUTWD 5 3 18
Total 4,017 3,372 4,012 4,947 5,310 5,450
TEU 52,372 47,828 53,041 56,595 60,746 52,373
Recent developments
In July 2009, GPHA announced a USD 450 million project to rehabilitate and upgrade the Takoradi harbour. The project will include the reclamation and redevelopment of the old log pond into an oil services facility, which will support the country’s offshore oil production. Other works include dredging, paving works in the port yard, the construction of 500m of quay walls, construction of a cocoa shed outside the harbour premises, and construction of an oil berth.
As of January 2015 the 1,708m breakwater is about 95 percent complete awaiting only harbour entrance lighting and final paving. The port will also be dredged from the previous
58 USAID Trade Hub - Trends in Transport and Logistics on the Tema-Ouagadougou-Bamako Corridor (2013)
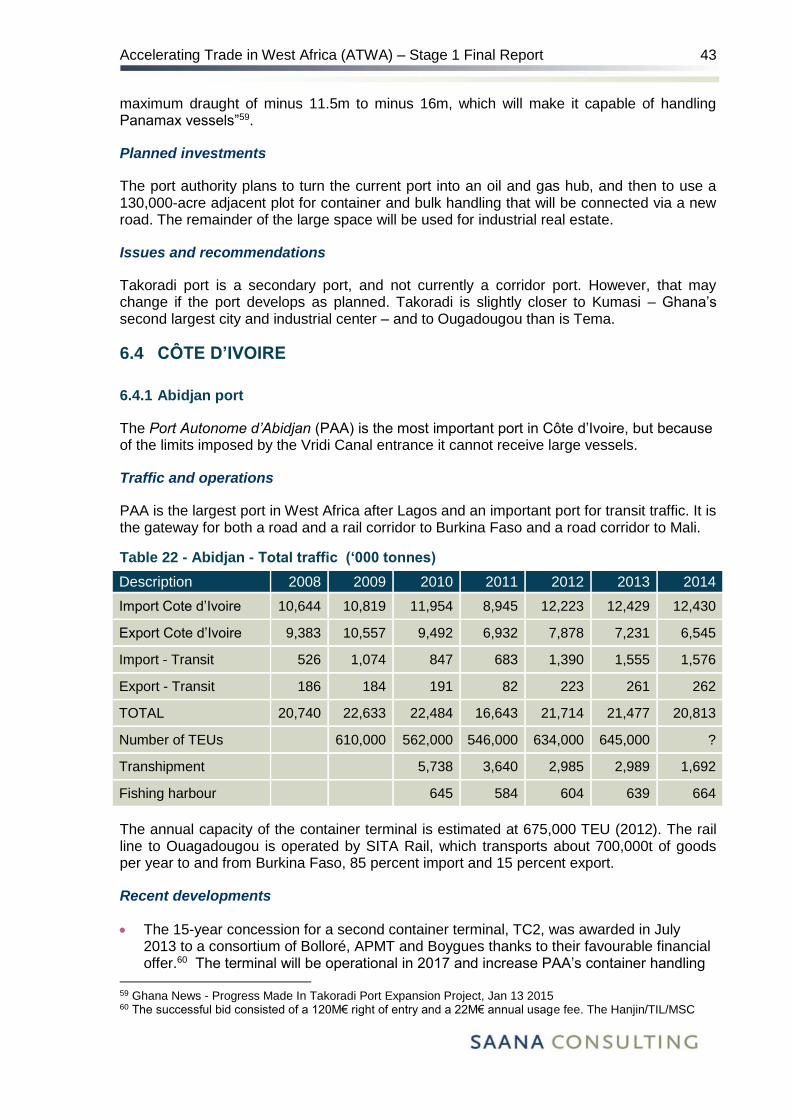
Accelerating Trade in West Africa (ATWA) – Stage 1 Final Report
43
maximum draught of minus 11.5m to minus 16m, which will make it capable of handling Panamax vessels”59.
Planned investments
The port authority plans to turn the current port into an oil and gas hub, and then to use a 130,000-acre adjacent plot for container and bulk handling that will be connected via a new road. The remainder of the large space will be used for industrial real estate.
Issues and recommendations
Takoradi port is a secondary port, and not currently a corridor port. However, that may change if the port develops as planned. Takoradi is slightly closer to Kumasi – Ghana’s second largest city and industrial center – and to Ougadougou than is Tema.
6.4 CÔTE D’IVOIRE
6.4.1 Abidjan port
The Port Autonome d’Abidjan (PAA) is the most important port in Côte d’Ivoire, but because of the limits imposed by the Vridi Canal entrance it cannot receive large vessels.
Traffic and operations
PAA is the largest port in West Africa after Lagos and an important port for transit traffic. It is the gateway for both a road and a rail corridor to Burkina Faso and a road corridor to Mali.
Table 22 - Abidjan - Total traffic (‘000 tonnes)
Description 2008 2009 2010 2011 2012 2013 2014
Import Cote d’Ivoire 10,644 10,819 11,954 8,945 12,223 12,429 12,430
Export Cote d’Ivoire 9,383 10,557 9,492 6,932 7,878 7,231 6,545
Import - Transit 526 1,074 847 683 1,390 1,555 1,576
Export - Transit 186 184 191 82 223 261 262
TOTAL 20,740 22,633 22,484 16,643 21,714 21,477 20,813
Number of TEUs 610,000 562,000 546,000 634,000 645,000 ?
Transhipment 5,738 3,640 2,985 2,989 1,692
Fishing harbour 645 584 604 639 664
The annual capacity of the container terminal is estimated at 675,000 TEU (2012). The rail line to Ouagadougou is operated by SITA Rail, which transports about 700,000t of goods per year to and from Burkina Faso, 85 percent import and 15 percent export.
Recent developments
The 15-year concession for a second container terminal, TC2, was awarded in July 2013 to a consortium of Bolloré, APMT and Boygues thanks to their favourable financial offer.60 The terminal will be operational in 2017 and increase PAA’s container handling
59 Ghana News - Progress Made In Takoradi Port Expansion Project, Jan 13 2015 60 The successful bid consisted of a 120M€ right of entry and a 22M€ annual usage fee. The Hanjin/TIL/MSC
Accelerating Trade in West Africa (ATWA) – Stage 1 Final Report
44
capacity to 2.5 million TEU annually. The Ivorian government will invest XOF 380 billion (EUR 580 million) and the Consortium will contribute up to XOF 160 billion.61
Both the IFC and the US MCC have recently been exploring opportunities for technical co-operation with PAA.62
Planned investments
PAA has announced that by 2020, it will invest more than EUR 2 billion in the development of its infrastructure, mostly in the form of public-private partnerships.63 This includes the TC2 container terminal mentioned above as well as:
Expansion of the Vridi channel to allow vessels 250m long and with a 16m draught to enter the port;
Building a new bulk terminal for minerals;
Building a new grain terminal;
Building a modern Fishing Harbour; and
Developing the land around the Vridi Bay for industrial and commercial purposes.
SWOT analysis for the port of Abidjan 64
Strengths
Operation of the container terminal;
Service to landlocked countries by rail and road.
Weaknesses
Limited draught and vessel length in the Vridi Canal;
Congestion on port access roads;
Cost of port handling and stevedore services;
Obsolescence of some equipment;
Discrepancy between pre-booking and final loading list.
Opportunities
Potential for traffic related to domestic consumption, genuine hinterland;
Political stabilization is underway which should allow the return of some traffic taken by Tema and Lomé;
Launch of the tender process for CT2;
Possible complementarity with the port of San Pedro in terms of the type of traffic and the management of port congestion.
consortium and the ICTSI/CMA CGM consortium had respectively offered a right of entry of 80M€ and 76M€, and an annual usage fee of 8M€ and 7.5M€. The APMT/Bolloré consortium also committed to handling at least 450,000 TEUs of transshipping traffic from the start of operations, and promised to lower the upper limit tariff by 40% compared to the port’s current tariff. 61 Jeune Afrique, Côte d'Ivoire : les ports se remettent à flot, 17 février 2014 62 PAA Newsletter 16 Février 2015 & 27 Février 2015 63 PAA Website - http://www.portabidjan.ci/fr 64 Market study on container terminals in West and Central Africa, MLTC/CATRAM, Jan 2013
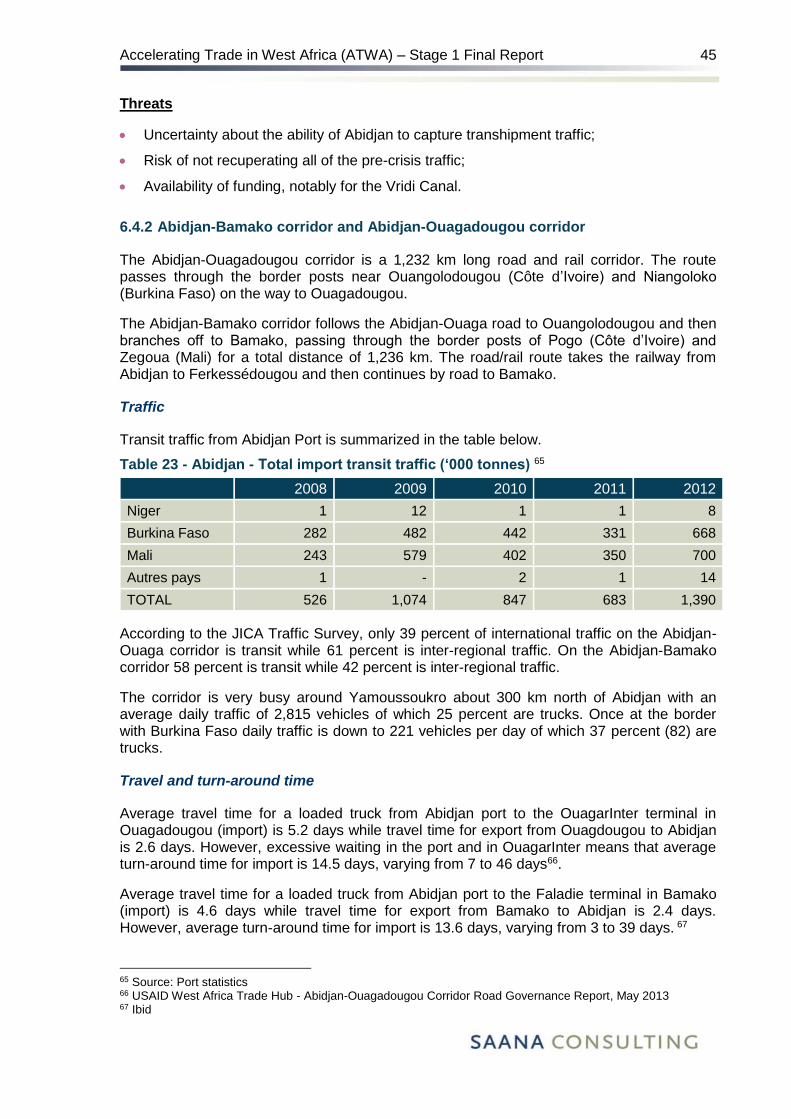
Accelerating Trade in West Africa (ATWA) – Stage 1 Final Report
45
Threats
Uncertainty about the ability of Abidjan to capture transhipment traffic;
Risk of not recuperating all of the pre-crisis traffic;
Availability of funding, notably for the Vridi Canal.
6.4.2 Abidjan-Bamako corridor and Abidjan-Ouagadougou corridor
The Abidjan-Ouagadougou corridor is a 1,232 km long road and rail corridor. The route passes through the border posts near Ouangolodougou (Côte d’Ivoire) and Niangoloko (Burkina Faso) on the way to Ouagadougou.
The Abidjan-Bamako corridor follows the Abidjan-Ouaga road to Ouangolodougou and then branches off to Bamako, passing through the border posts of Pogo (Côte d’Ivoire) and Zegoua (Mali) for a total distance of 1,236 km. The road/rail route takes the railway from Abidjan to Ferkessédougou and then continues by road to Bamako.
Traffic
Transit traffic from Abidjan Port is summarized in the table below.
Table 23 - Abidjan - Total import transit traffic (‘000 tonnes) 65
2008 2009 2010 2011 2012
Niger 1 12 1 1 8
Burkina Faso 282 482 442 331 668
Mali 243 579 402 350 700
Autres pays 1 - 2 1 14
TOTAL 526 1,074 847 683 1,390
According to the JICA Traffic Survey, only 39 percent of international traffic on the Abidjan-Ouaga corridor is transit while 61 percent is inter-regional traffic. On the Abidjan-Bamako corridor 58 percent is transit while 42 percent is inter-regional traffic.
The corridor is very busy around Yamoussoukro about 300 km north of Abidjan with an average daily traffic of 2,815 vehicles of which 25 percent are trucks. Once at the border with Burkina Faso daily traffic is down to 221 vehicles per day of which 37 percent (82) are trucks.
Travel and turn-around time
Average travel time for a loaded truck from Abidjan port to the OuagarInter terminal in Ouagadougou (import) is 5.2 days while travel time for export from Ouagdougou to Abidjan is 2.6 days. However, excessive waiting in the port and in OuagarInter means that average turn-around time for import is 14.5 days, varying from 7 to 46 days66.
Average travel time for a loaded truck from Abidjan port to the Faladie terminal in Bamako (import) is 4.6 days while travel time for export from Bamako to Abidjan is 2.4 days. However, average turn-around time for import is 13.6 days, varying from 3 to 39 days. 67
65 Source: Port statistics 66 USAID West Africa Trade Hub - Abidjan-Ouagadougou Corridor Road Governance Report, May 2013 67 Ibid

Accelerating Trade in West Africa (ATWA) – Stage 1 Final Report
46
Road governance
Côte d’Ivoire was not a good performer in regard to road governance, being third from the bottom after Mali and Niger, with 1.9 controls and the equivalent of USD 5.38 collected in bribes per 100 km. Mali is worst with 2.6 controls and USD 7.60 collected in bribes per 100 km, while Burkina Faso is somewhat better with 1.6 controls and bribes of USD 4.31per 100 km.68
Road description 69
The road network in Côte d’Ivoire for the majority of the segments assessed along the two corridors is in fair to poor condition. The road from Ouangolodougou to Ferkessédougou (45 km) is in extremely bad condition because road has not been maintained for more than 10 years (mainly because of a lack of rehabilitation during the political unrest that ended in the mid-2000s).
Procedures and border posts 70
Ivorian Customs has upgraded its declaration system to ASYCUDA World, replaced the paper Interstate Road Transit (ISRT) log book with road a transit transport declaration form, and replaced escorts with satellite tracking devices attached to each transit truck. The Chamber of Commerce installs a tracking device at the port and the truck travels to the border without escort. The Chamber also manages the ECOWAS IRST customs guarantee system (Fonds de Garantie Routier), with a one-time payment of 0.5 percent of the cargo customs value.
The national quota system for trucks carrying transit cargo is no longer implemented for cargo going to either Burkina or Mali. It appears that shippers are free to use any West African truck to transport transit cargo to Mali, whereas for Burkina shippers are free to find a suitable Ivorian or Burkinabé truck. Shippers who cannot find a truck or who do not have a direct contract with a trucking company are assisted by the Burkinabé Shippers Council and truckers associations, which will then apply the cargo sharing system between Côte d’Ivoire and Burkina Faso.
Ivorian-Burkinabé border. Trucks with transit cargo destined for Burkina Faso stop at Ouangolodougou, Côte d’Ivoire, some 35 km from the border itself to have their declarations processed by customs. A customs office also operates at Ouangolodougou railway station for cargo travelling by rail.
The Burkinabé border post is at Niangoloko where the customs office partially processes the customs transit declaration. Cargo must proceed to Bobo Dioulasso or Ouagadougou for final clearance. Customs escorts for trucks not carrying containers are organized twice a day (11 a.m. and 3 p.m.) to Bobo Dioulasso or Ouagadougou inland terminals.
Ivorian-Malian Border. The Côte d’Ivoire Chamber of Commerce collects a single customs guarantee bond covering Côte d’Ivoire and Mali and follows the transit truck by satellite tracking to monitor the cargo’s departure from Ivorian territory. The Côte d’Ivoire customs border post is in Pogo, 2.5 km from the actual border with Mali. It processes the customs clearance and organizes two escorts daily (11 a.m. and 3 p.m.) to the border for non-containerized transit cargo. Mali’s customs border post is at Zegoua, 3.4 km from the border with Côte d’Ivoire. It organizes escorts to Sikasso, where all trucks that are not empty are scanned.
68 Ibid. 69 WB - Logistics Cost Study of Transport Corridors in Central and West Africa, Nathan (2013) 70 World Bank - Logistics Cost Study of Transport Corridors in Central and West Africa, Nathan (2013)
Accelerating Trade in West Africa (ATWA) – Stage 1 Final Report
47
Railway operations along the corridor
The railway is operated by Sitarail. Sitarail is a consortium owned by the governments of Côte d’Ivoire and Burkina Faso (15 percent each), the French group Bolloré (67 percent), and Sitarail staff (3 percent). It manages railway operations from Abidjan to Ouagadougou.
The railway network is in relatively good condition and consists of 1,263 km of main line linking the Port of Abidjan to Ouagadougou, via Bobo Dioulasso with the final stop at Kaya, 100 km northeast of Ouagadougou. The gauge is metric (1,000 mm) and there are 622 km of railways in Burkina Faso. Sitarail organizes three daily departures from Abidjan and 95 percent of shipments are loaded at the SETV terminal in the port (container and bulk), where there is a side rack. Waiting time for loading at the port can be up to 10 days and the trains reach Ouagadougou 48 to 55 hours after departure, providing reliable service during normal operations. Sitarail transported about 23 percent of Burkina’s total transit traffic and 60 percent of transit traffic on the Abidjan-Ouagadougou corridor in 2014.
In theory transit cargo inbound to Mali could use the railway to Ferkessédougou, Côte d’Ivoire (about half the distance to Bamako from Abidjan), and then be loaded onto trucks for the final destination, but because of a lack of rolling stock, Sitarail is not accepting goods for unloading at Ferkessédougou en route to Mali.
6.4.3 Summary of key findings71
Most of the inefficiencies and factors increasing the total logistics cost on the Abidjan corridors are common to all West African corridors. We conclude that the corridor’s main inefficiencies are as follows:
Gateway inefficiencies
Lack of effective single windows;
Low cargo storage costs at port encouraging lengthy dwell times;
Customs clearance of cargo is a mixed of electronic and manual processes (physical submission of cargo invoices and packing lists) Lack of equipment for the GPS tracking system.
Trucking industry inefficiencies
Trade imbalance: imports exceed exports leading to a scarcity of backload cargo;
Seasonal demand: tariffs can be greatly influenced by seasonal commodity exports;
Transport demand exceeding supply during most of the year, especially for high-value products;
Current incentives are to strip containers and overload trucks;
Powerful transport unions, where trucking freight rates are “black box” types of pricing, with predominant fixed costs and very limited variable costs;
Lack of market transparency in business practices;
Old and obsolete fleets operated by poorly qualified truckers;
Low annual mileage per truck due to long wait times for obtaining freight;
71 Summarized from – World Bank: Logistics Cost Study of Transport Corridors in Central and West Africa, by Nathan Ass. (2013)

Accelerating Trade in West Africa (ATWA) – Stage 1 Final Report
48
Unfair competition from non-professional truckers which leads to the entire profession having to charge low freight rates that do not guarantee sufficient income for fleet renewal.
Rail inefficiencies
Insufficient number of wagons to serve existing demand;
Excessive delays to load wagons;
Low speed of train because of the poor state of the rails due to low maintenance;
Excessive delays to discharge the wagons;
Poor exchange of information with Abidjan Terminal.
Transport and trade facilitation inefficiencies
High levels of port handling charges and shipping line charges;
Lack of professionalism of freight forwarders;
Unreliable Internet connection going down frequently delaying the clearing processes;
Trucks overloading increases load factors and reduces rates;
Too many checkpoints along Abidjan-Ouagadougou corridor, probably the highest number compared to other West Africa corridors assessed;
Informal payments and corruption.
6.4.4 San Pedro Port
The Port Autonome de San Pedro is the second Ivorian port. For many years it handled little more than a million tonnes a year, mostly exports of raw material such as cocoa. In 2008 the Mediterranean Shipping Company obtained the concession for the container terminal for a period of 15 years72 and traffic, in particular transhipment, has grown rapidly since then.
Traffic and operations
Traffic through San Pedro Port is summarized below. What is striking is the rapid growth of over 350 percent during the last 5 years and the focus on transhipment.
Table 24 - San Pedro port traffic (‘000 tonnes)
Description 2010 2011 2012 2013 2014
Import 300 200 300 200 300
Export 800 900 1,000 1,200 1,300
Transhipment 200 700 1,900 2,900 3,100
Total Traffic (1,000 Tonnes)
1,322 1,805 3,230 4,325 4,738
Total (TEU)
77,730 118,071 246,187 333,334 336,767
72 Jeune Afrique: Mediterranean Shipping Company peut-il réanimer le port de San Pedro? 04 Dec 2014

Accelerating Trade in West Africa (ATWA) – Stage 1 Final Report
49
Recent development
MSC, the terminal operator, has invested about EUR 15.2 million in order to increase the port’s operational efficiency, thereby increasing container movements from 18 an hour to a current rate of between 38 and 48 movements per hour.
Planned investments
A new container terminal with 700m of quayside, 15m draught and 23 hectares of yard space, and a new bulk terminal to cater to mines being developed in Côte d’Ivoire, Bukina Faso and Mali.
The port hopes to raise XOF 180 billion from international development and financial institutions and mobilize XOF 720 billion as BOT (Build, Operate & Transfer) concessions as part of public private partnerships73.
San Pedro-Bamako corridor
Running south to north in the western part of Côte d’Ivoire, this corridor (1,060 km) connects the port of San Pedro and Bamako and is UEMOA priority corridor
number 10. The corridor is about 200 km shorter than the Abidjan-Bamako corridor and 300 km shorter than the Dakar-Bamako corridor.
The project, with an estimated cost of USD 241 million, is being funded by the African Development Bank74. The project includes upgrading and asphalting of the only remaining earth sections on the corridor as well as a number of trade facilitation measures such as:
Construction and equipment of a JBP, including a weighing station;
Support for the interconnection of customs IT systems between the two countries;
Establishment of a goods tracking system.
Issues and recommendations
San Pedro is a secondary port, which has already gained importance as a transhipment port. It is likely to increase further in importance as a transit port when the road to Bamako is completed.
7. GROUP 2 B: MALI, SENEGAL, TOGO.
Countries in Group 2b do not necessarily possess any intrinsic commonalities except for the fact that they could potentially be fairly easily added-on to Group 2a described above for the purposes of programme design, analysis and implementation. There are two foreseeable options: Option 1, which would add Mali and Senegal to Burkina Faso, Cote d’Ivoire and Ghana (Group 2 a above), or adding Togo to the same countries (Option 2).
73 Jeune Afrique: Le Port de San Pedro cherche à lever 180 milliards de XOF, 05 mars 2015 74 AfDB: Project of Road Upgrading and Transport Facilitation on the Corridor Bamako-Zantiebougou-San Pedro - Project Nº: P-Z1-DB0-152
Figure 1 - San Pedro- Bamako corridor Figure 2 - San Pedro-Bamako corridor
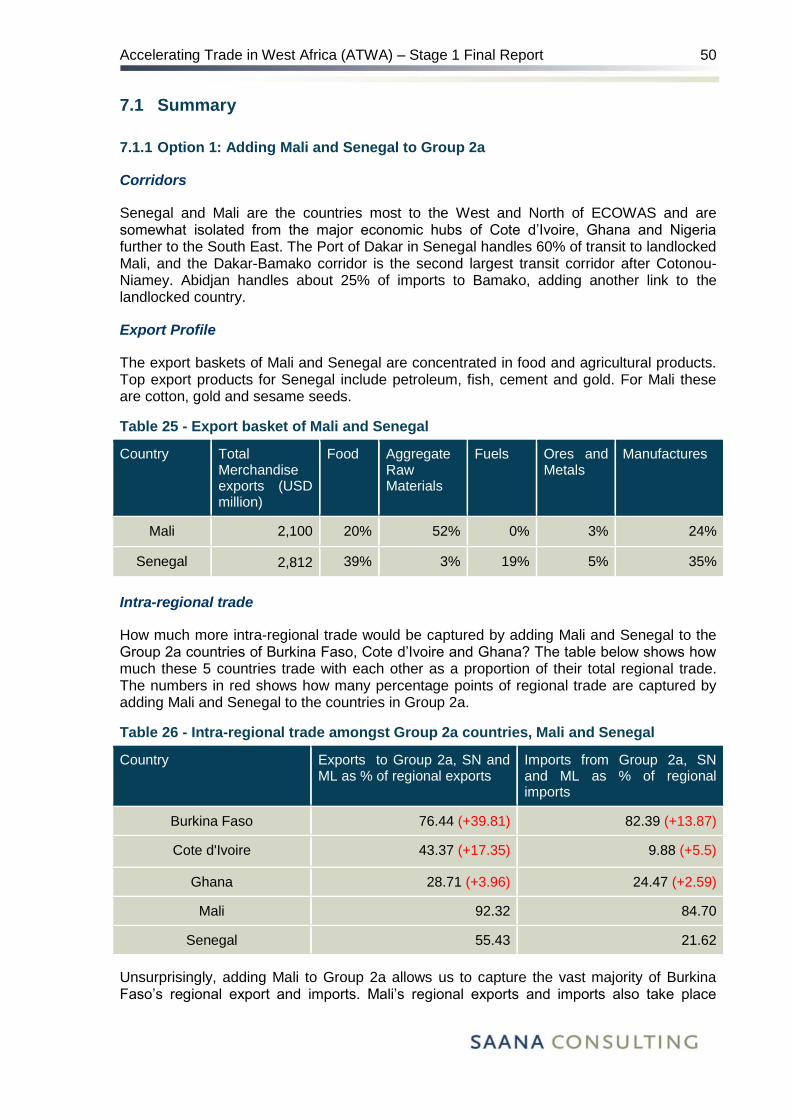
Accelerating Trade in West Africa (ATWA) – Stage 1 Final Report
50
7.1 Summary
7.1.1 Option 1: Adding Mali and Senegal to Group 2a
Corridors
Senegal and Mali are the countries most to the West and North of ECOWAS and are somewhat isolated from the major economic hubs of Cote d’Ivoire, Ghana and Nigeria further to the South East. The Port of Dakar in Senegal handles 60% of transit to landlocked Mali, and the Dakar-Bamako corridor is the second largest transit corridor after Cotonou-Niamey. Abidjan handles about 25% of imports to Bamako, adding another link to the landlocked country.
Export Profile
The export baskets of Mali and Senegal are concentrated in food and agricultural products. Top export products for Senegal include petroleum, fish, cement and gold. For Mali these are cotton, gold and sesame seeds.
Table 25 - Export basket of Mali and Senegal
Country Total Merchandise exports (USD million)
Food Aggregate Raw Materials
Fuels Ores and Metals
Manufactures
Mali 2,100 20% 52% 0% 3% 24%
Senegal 2,812 39% 3% 19% 5% 35%
Intra-regional trade
How much more intra-regional trade would be captured by adding Mali and Senegal to the Group 2a countries of Burkina Faso, Cote d’Ivoire and Ghana? The table below shows how much these 5 countries trade with each other as a proportion of their total regional trade. The numbers in red shows how many percentage points of regional trade are captured by adding Mali and Senegal to the countries in Group 2a.
Table 26 - Intra-regional trade amongst Group 2a countries, Mali and Senegal
Country Exports to Group 2a, SN and ML as % of regional exports
Imports from Group 2a, SN and ML as % of regional imports
Burkina Faso 76.44 (+39.81) 82.39 (+13.87)
Cote d'Ivoire 43.37 (+17.35) 9.88 (+5.5)
Ghana 28.71 (+3.96) 24.47 (+2.59)
Mali 92.32 84.70
Senegal 55.43 21.62
Unsurprisingly, adding Mali to Group 2a allows us to capture the vast majority of Burkina Faso’s regional export and imports. Mali’s regional exports and imports also take place

Accelerating Trade in West Africa (ATWA) – Stage 1 Final Report
51
almost exclusively with the other four other countries in this group. A combination of these five countries would allow ATWA to work across a group of countries where trade networks are already well developed, and where it can be safely assumed that a large portion of regional trade takes place on the corridors that ATWA would focus on.
Poverty profile
Key poverty indicators for Group 2b are:
Senegal and Mali have 12.2 million people or 42.6% of their combined population living below the poverty line.
In GDP/capita terms, the group is slightly poorer than countries in Group 2a, with an average GDP/ capita of 901 USD (1,071 USD for Senegal and 766 USD for Mali).
Summary of considerations for adding Mali and Senegal to Group 2a
Opportunities for ATWA:
Adding Senegal and Mali would increase total potential poverty impact by adding a group of poorer countries to the geographical intervention area.
ATWA would work on the two corridors leading to Mali (Abidjan and Bamako), one of the poorest countries in ECOWAS, further increasing potential poverty impact.
Dakar-Bamako is the second highest volume transit corridor in the region.
This group would open up the possibility of working on the Bamako-Ouaga corridor, which has the highest recorded level of intra-regional truck traffic in the entire region (84%).
Limitations/challenges for ATWA:
The intervention area might be too large and ATWA’s resources /interventions/capacity could be spread too thinly, with a total of almost 5,000 km of roads covered (6,000 km if Bamako-Ouaga is added) and two railways.
7.1.2 Option 2: Adding Togo to Group 2a
Corridors
Togo, neighbouring Ghana, is also a potential candidate for inclusion in Group 2a because its port handles most of Burkina Faso’s import volume and also serves Ghana. Like Benin, it is often described as a “warehouse economy” and its port handles the largest share of transit flows to Burkina Faso (40%). Almost half of Lome transit traffic is clinker cargo destined for a Ghanaian cement plant located close to the border. The Port of Lomé handles about 22% of Niger’s transit traffic.
Export Profile
Togo is a slight outlier in the region as its manufactured exports account for over half of its total export. This is composed of plastic bags, bitumen, cement, and beauty products.

Accelerating Trade in West Africa (ATWA) – Stage 1 Final Report
52
Table 27 - Export basket of Togo
Country Total Merchandise exports (USD million)
Food Aggregate Raw Materials
Fuels Ores and Metals
Manufactures
Togo 1,350 23% 9% 1% 3% 64%
Intra-regional trade
How much does adding Togo to Group 2a contribute in terms of capturing additional intra-regional trade? The table below shows how much Burkina Faso, Cote d’Ivoire, Ghana and Togo trade with each other as a percentage of their total regional trade. Figures in red show added percentage points resulting from adding Togo in Group 2a.
Table 28 - Interregional trade amongst Group 2a countries and Togo
Country Exports to Group 2a and Togo as % of regional exports
Imports from Group 2a and Togo as % of regional imports
Burkina Faso 43.16 (+6.53) 81.62 (+13.1)
Cote d'Ivoire 30.29 (+4.27) 5.15 (+0.77)
Ghana 72.78 (+48.03) 23.81 (+19.43)
Togo 43.78 87.44
Adding Togo to Group 2a would add some substantial trade flows going from Ghana into Togo. This consists almost entirely of refined petroleum, Ghana being one of the seven West African countries possessing refining capacity.
Poverty profile
Key poverty indicators for Togo are as follows:
Out of its 6.6 million inhabitants, 51% live below the poverty line.
It is the poorest of countries in groups 2a and 2b, with a GDP/capita of 646 USD.
Summary of considerations for adding Togo to Group 2a
Opportunities for ATWA:
Adding Togo would mean that the ATWA intervention area covers nearly all transit volume to Burkina Faso (84%). Lomé is the most important port for imports to Burkina Faso.
The Group 2a + Togo area is more compact geographically than if Mali and Senegal were added.
The region’s first JBP is at the Togo/ Burkina Faso border, although it is facing operational issues.
Togo’s export basket features transformed products quite heavily; a good sign that export-led transformative industrial development might be a possibility.
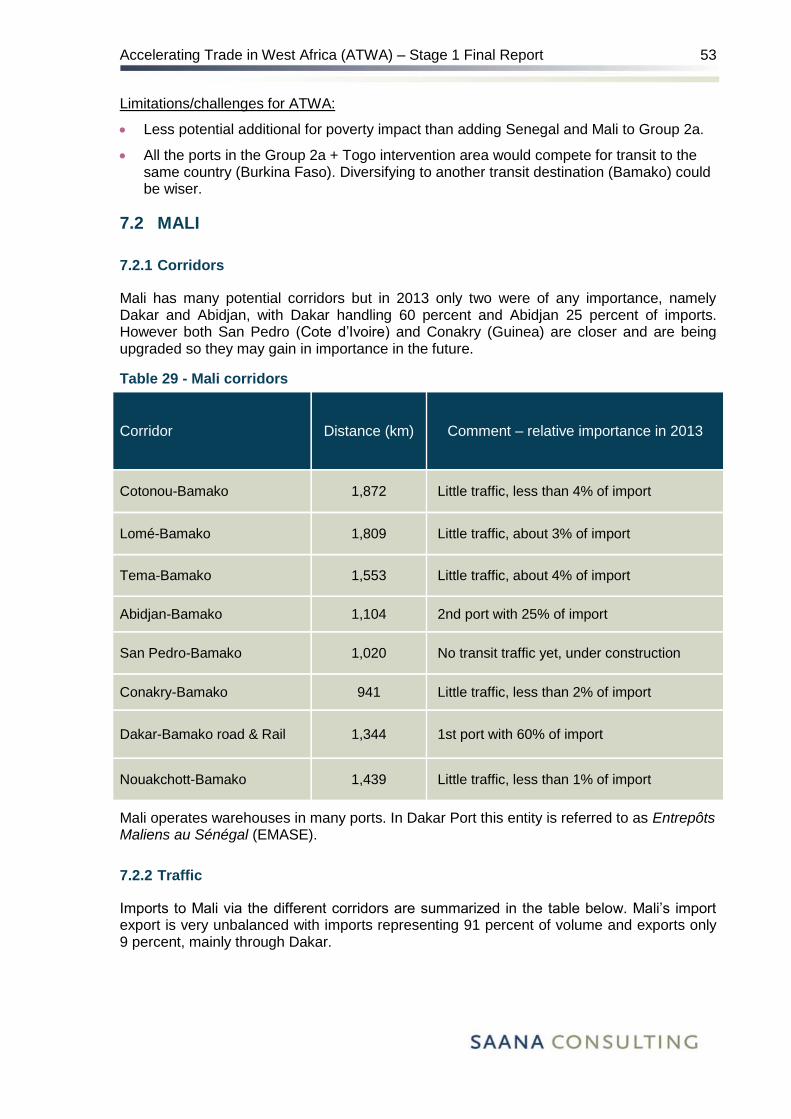
Accelerating Trade in West Africa (ATWA) – Stage 1 Final Report
53
Limitations/challenges for ATWA:
Less potential additional for poverty impact than adding Senegal and Mali to Group 2a.
All the ports in the Group 2a + Togo intervention area would compete for transit to the same country (Burkina Faso). Diversifying to another transit destination (Bamako) could be wiser.
7.2 MALI
7.2.1 Corridors
Mali has many potential corridors but in 2013 only two were of any importance, namely Dakar and Abidjan, with Dakar handling 60 percent and Abidjan 25 percent of imports. However both San Pedro (Cote d’Ivoire) and Conakry (Guinea) are closer and are being upgraded so they may gain in importance in the future.
Table 29 - Mali corridors
Corridor Distance (km) Comment – relative importance in 2013
Cotonou-Bamako 1,872 Little traffic, less than 4% of import
Lomé-Bamako 1,809 Little traffic, about 3% of import
Tema-Bamako 1,553 Little traffic, about 4% of import
Abidjan-Bamako 1,104 2nd port with 25% of import
San Pedro-Bamako 1,020 No transit traffic yet, under construction
Conakry-Bamako 941 Little traffic, less than 2% of import
Dakar-Bamako road & Rail 1,344 1st port with 60% of import
Nouakchott-Bamako 1,439 Little traffic, less than 1% of import
Mali operates warehouses in many ports. In Dakar Port this entity is referred to as Entrepôts Maliens au Sénégal (EMASE).
7.2.2 Traffic
Imports to Mali via the different corridors are summarized in the table below. Mali’s import export is very unbalanced with imports representing 91 percent of volume and exports only 9 percent, mainly through Dakar.
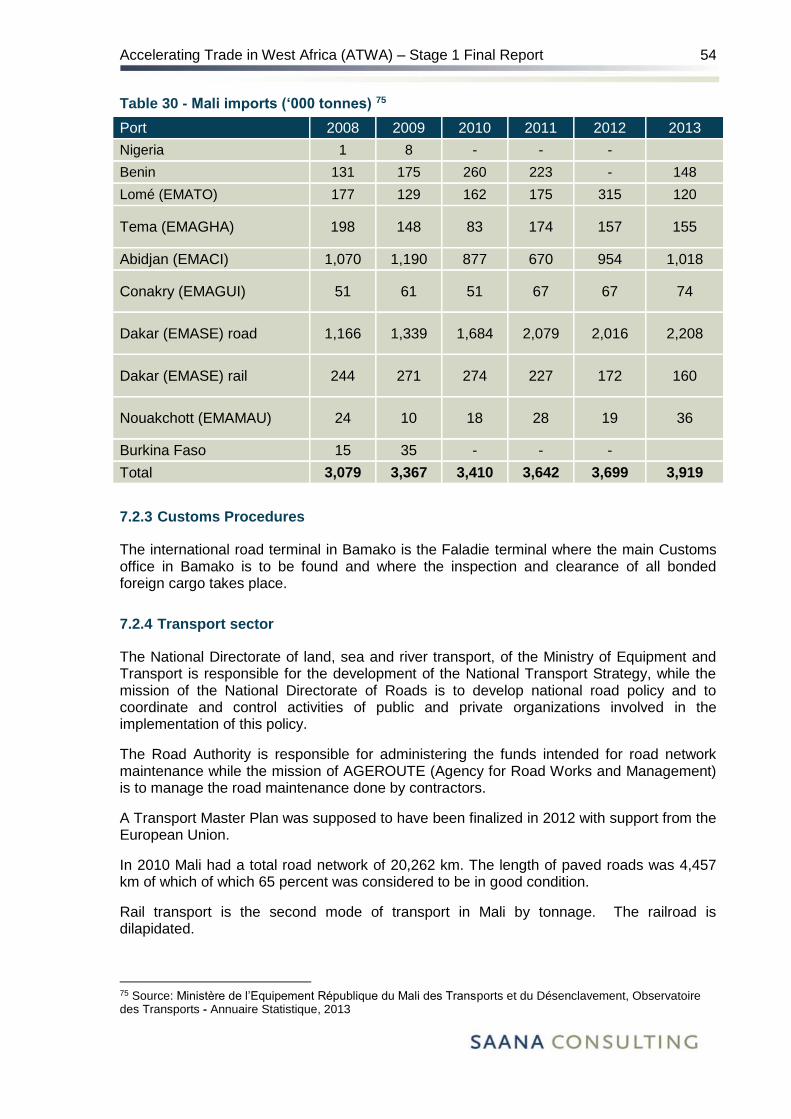
Accelerating Trade in West Africa (ATWA) – Stage 1 Final Report
54
Table 30 - Mali imports (‘000 tonnes) 75
Port 2008 2009 2010 2011 2012 2013
Nigeria 1 8 - - -
Benin 131 175 260 223 - 148
Lomé (EMATO) 177 129 162 175 315 120
Tema (EMAGHA) 198 148 83 174 157 155
Abidjan (EMACI) 1,070 1,190 877 670 954 1,018
Conakry (EMAGUI) 51 61 51 67 67 74
Dakar (EMASE) road 1,166 1,339 1,684 2,079 2,016 2,208
Dakar (EMASE) rail 244 271 274 227 172 160
Nouakchott (EMAMAU) 24 10 18 28 19 36
Burkina Faso 15 35 - - -
Total 3,079 3,367 3,410 3,642 3,699 3,919
7.2.3 Customs Procedures
The international road terminal in Bamako is the Faladie terminal where the main Customs office in Bamako is to be found and where the inspection and clearance of all bonded foreign cargo takes place.
7.2.4 Transport sector
The National Directorate of land, sea and river transport, of the Ministry of Equipment and Transport is responsible for the development of the National Transport Strategy, while the mission of the National Directorate of Roads is to develop national road policy and to coordinate and control activities of public and private organizations involved in the implementation of this policy.
The Road Authority is responsible for administering the funds intended for road network maintenance while the mission of AGEROUTE (Agency for Road Works and Management) is to manage the road maintenance done by contractors.
A Transport Master Plan was supposed to have been finalized in 2012 with support from the European Union.
In 2010 Mali had a total road network of 20,262 km. The length of paved roads was 4,457 km of which of which 65 percent was considered to be in good condition.
Rail transport is the second mode of transport in Mali by tonnage. The railroad is dilapidated.
75 Source: Ministère de l’Equipement République du Mali des Transports et du Désenclavement, Observatoire des Transports - Annuaire Statistique, 2013

Accelerating Trade in West Africa (ATWA) – Stage 1 Final Report
55
7.3 SENEGAL
7.3.1 Dakar port
The Port autonome de Dakar (PAD) is the only large port in Senegal. Dakar is the gateway port for two Trans-Africa-Highways: TAH 5 from Dakar to Ndjamena in Chad, also known as the Trans-Sahelian Highway; and TAH 7 from Dakar to Lagos, also known as the Trans-Coastal Highway.
Traffic and operations
Traffic through Dakar Port is summarized below.
Table 31 - Dakar port - total traffic (‘000 tonnes)
Description 2008 2009 2010 2011 2012 2013
Import Senegal 6,753 6,076 6,871 6,663 7,079 7,236
Export Senegal 1,787 1,268 1,676 1,957 1,941 1,795
Import - Transit 724 673 896 1,353 1,439 1,658
Export - Transit 42 27 43 162 286 229
Transhipment 520 499 566 971 730 956
Fishing harbour 177 199 219 302 395 345
TOTAL 10,003 8,743 10,271 11,409 11,870 12,218
Number of TEUs 347,000 331,000 349,000 416,000 402,000 454,000
Customs- single window
The Senegalese single window, ORBUS, is developed and operated by GAINDE 2000 (Gestion automatisée des informations douanières et des échanges), a Public Private Partnership (PPP) established in 2002. The single window started its operations in 2004 and by 2014 its service coverage spanned pre-clearance formalities and coordination; electronic manifests; customs management supporting functions; e-payment for customs duties, taxes and service fees; release operations; and some basic marketing information exchange. Documentation requirements for pre-clearance and customs clearance are managed electronically through ORBUS interfaces, covering nearly all relevant government agencies and their formalities of importation and exportation.
According to the AACE Single Window Peer Review, the strengths of ORBUS include:
1. Laws for legalizing electronic documents and electronic signature, and also for data protection have been enacted; and
2. Trust in GAINDE 2000 has gradually been built among government and business stakeholders.
Weaknesses include:
3. Some government agencies, such as the Port Authority, are not yet sufficiently committed, limiting the service coverage; and
4. There is no mid-term or long-term policy objective, i.e. trade facilitation strategy, to which GAINDE 2000 objectives can be aligned76.
76 Alliance africaine pour le commerce électronique – Senegal, AACE Single Window Peer Review (2014)

Accelerating Trade in West Africa (ATWA) – Stage 1 Final Report
56
Recent developments
In 2007, DP World (DPW) won a competitive tender for a 25-year, renewable concession. The new terminal became fully operational in 2013. The theoretical maximum capacity of the terminal is estimated at 800,000 TEU. Adopting a similar model, the government of Senegal entered into a PPP to develop a toll road in Dakar in 201077.
In April 2015, the Port Authority and Dakar Terminal, a subsidiary of Bolloré Africa Logistics launched the development and rehabilitation of the ro-ro terminal, for a total investment of XOF 64 billion78.
Planned investments
The “port du futur” (Port of the Future) is a potential project that was negotiated between the port of Dakar and DP World during the award of the concession for the port. It includes 1,150m of quays with a draught of 15m. Some 90 percent of its activity will come from transhipment traffic. The required investment has been estimated at EUR 300 million and the capacity of the new terminal would be 1.5m TEU. Some ship owners however believe the proximity of Dakar to the hubs of Tangiers in Morocco and Algeciras in Portugal is highly disadvantageous for transhipment in Dakar.
Issues and recommendations
The 2011 USAID report “Etude Des Couts Du Transport Sur Le Corridor Dakar – Bamako (2011)” made the following obervations and recommnedations regarding PAD :
The port charges are unanimously considered high, especially for containerized cargo, and more so for Senegalese imports (29 percent of total transport and logistics costs for Senegalese imports against 9 percent for Malian imports);
Since the arrival of DPW, port operations have greatly improved but port costs are still considered high;
Small amounts – corruption/facilitation payments - paid to speed up deliveries;
Delays :
Terminal congestion => 3-4 days in port;
50 percent inspection rate of goods by customs;
Customs clearance in 24 hours (between 2 and 48 hours);
The inefficiency of agents and processing of paper documents cause delivery delays.
SWOT analysis for the port of Dakar79
Strengths
Efficiency of port operations;
Quality of facilities;
Fixed arrival windows.
77 http://www.pidg.org/resource-library/case-studies/pidg-case-study-dakar-container-terminal.pdf 78 http://www.senenews.com/2015/04/30/port-autonome-de-dakar-les-investissements-de-modernisation-evalues-a-64-milliards_124912.html 79 Market study on container terminals in West and Central Africa, MLTC/CATRAM, Jan 2013

Accelerating Trade in West Africa (ATWA) – Stage 1 Final Report
57
Weaknesses
GDP growth in Senegal is rather low in comparison with neighbouring countries;
Rail service - lacks frequency and reliability, precarious financial health of the stakeholders;
Port handling costs.
Opportunities
Capture of traffic destined for Mali.
Threats
Monopoly of the port handling of containers;
Feasibility and use of the port du futur project.
7.3.2 Dakar-Bamako corridor
The Dakar-Bamako corridor is the first leg of the TAH 5 from Dakar in Senegal to Ndjamena in Chad. TAH 5 is 4,496 km long and about 80 percent complete80. The Dakar-Bamako stretch of the TAH 5 is 1,327 km long of which 682 km are in Senegal and 700 km in Mali.
The Dakar-Bamako corridor crosses the border to Mali at Kidira and passes through Kayes, Mali’s second city. This corridor was heavily congested with about 700 heavy trucks per day and in 2012 a southern alternative that crosses the Mali/Senegal border at Saraya, Senegal and Falemé, Mali was completed. For unknown reasons this corridor was not opened to trucks from Mali until February 201581. This new alternative corridor is about 180 km shorter than the northern corridor and should be in excellent condition as it is new.
There is also a rail corridor from Dakar to Bamako, which runs parallel to the northern route through Kayes. The company Transrail obtained the concession to operate the Dakar-Bamako rail line in 2003 but has not complied with its operating contract, which required Transrail to develop and implement an investment plan for maintenance and repairs. The Mali Transport Observatory reports that 288,000t of goods was transported to Mali in 2013, while 95,000 passengers travelled by rail within Mali in the same year.
Corridor traffic
Transit traffic through Dakar Port is almost exclusively for Mali. Available statistics are, as is often the case when we have more than one source, somewhat confusing. According to the JICA Traffic Survey, transit traffic on the corridor represents only 18 percent of total international traffic on the route whereas inter-regional traffic, which must be bi-lateral traffic from Senegal, represents 82 percent of total international traffic. On the other hand, the 2011 USAID corridor study reports that in 2009, inbound transit traffic to Mali amounted to about 740,000t while traffic from Senegal amounted to about 830,000t; in other words 47 percent transit versus 53 percent bilateral traffic82.
80 https://en.wikipedia.org/wiki/Trans-African_Highway_network 81 http://www.afribone.com/spip.php?article55972 82 USAID PCE Etude Des Coûts du Transport Sur le Corridor Dakar – Bamako (2011)

Accelerating Trade in West Africa (ATWA) – Stage 1 Final Report
58
Table 32 - Dakar port total transit traffic (‘000 tonnes)
2008 2009 2010 2011 2012
Niger - - - - -
Burkina Faso - - - 1 3
Mali 664 603 886 1,457 1,668
Gambia 6 15 8 15 14
Guinee Bissau 21 14 12 11 14
Guinee Conakry 6 5 4 6 5
Mauritania 69 62 29 26 21
TOTAL 766 700 939 1,515 1,725
Source: Dakar port statistics
The JICA Survey counted 440 vehicles per day at the Kadira border crossing of which 60 percent (264) were heavy trucks. According to the Mali Transport Observatory, Mali imported a total of 3.9 million tonnes of goods in 2013 of which 2.2 million were transported on the Dakar-Bamako road corridor and 160,000t by rail. The three most important cargoes transported on the corridor, cement (605,000t), petroleum products (604,000t) and fertilizer (202,000t), represented 60 percent of all traffic.
Travel and turn-around time
Average travel time for a loaded truck from Dakar port to the Faladie terminal in Bamako (import) is 4.1 days while travel time for exports from Bamako to Dakar is 3.0 days. However, excessive waiting in the port and in Faladie means that average turn-around time for import is 14.5 days, varying from 7 to 23 days83.
Road governance
Senegal is in the middle among the eight countries participating in OPA, with 1.4 controls per 100 km and the equivalent of USD 3.50 paid in bribes per 100 km. That is for legal trucks. When it comes to informal trade the harassment increases substantially and bribes reach the equivalent of USD 12.30 per 100 km84.
Procedures and border crossings
Border customs facilities in Senegal are of two types, according to traffic volume handled and location: customs offices and border posts. Goods not exceeding XOF 500,000 in value can be declared at a border post while customs declarations exceeding that amount have to
83 USAID West Africa Trade Hub - Dakar-Bamako Corridor Road Governance Report, May 2013 84 USAID Trade Hub & UEMOA - 23rd Road Governance Report, Survey Results for the first quarter of 2013
Figure 3: Satellite view of Kidira-Diboli congestion

Accelerating Trade in West Africa (ATWA) – Stage 1 Final Report
59
travel to a customs office under escort for clearance85 . Border customs are open and operate 365 days a year, 24 hours a day.
The design of the new Dakar-Bamako “par le sud” corridor included a number of facilitation features such as a radio communication system along the length of the corridor’s 1,200 km, to make it easier for operators to communicate; border crossing stations equipped with scanners to speed-up crossing times; axle load scales along the corridor; and the use of a single transit logbook, rather than multiple logbooks86. It is not known to what extent these features have been implemented, nor how well they work if they were implemented.
Road conditions
The Senegal road network includes 10,000 km of unpaved roads and 4,805 km of paved roads (2005). Of this total, 5,786.2 km are of earth roads which have never been improved. The remaining network of about 9,020 km is divided as follows87:
Paved roads: 4805 km (53.3 percent);
Earth roads: 4214 km (46.7 percent).
The JICA Traffic Survey found 362 km of road in good condition, 600 km in fair condition and 420 km in bad condition. The investment budget of the Road Maintenance Program in 2014 was XOF 44.5 billion (about USD 90 million)88.
Issues and recommendations89
The Kidira-Diboli border crossing needs a parking lot to alleviate congestion caused by trucks parked on both side of the rather narrow road built on a berm between the two countries, particularly on the Mali side, leaving only a tight one-lane “passage” for trucks to drive through. The governments of Senegal and Mali are considering integrating customs operations and procedures and creating JBPs at Kidira-Diboli and at the border crossing along the new southern road.
Rail transport: Although Dakar is the only port with a railway connection to Bamako, Senegal has severely neglected this asset. Where in the past, 80 percent of freight was transported to Mali by rail and 20 percent by road, in the last five years the trend has reversed to 20 percent by rail and 80 percent by road.
85 http://www.douanes.sn/sites/default/files/fichiers/OUVERTURE-DU-CORRIDOR-DAKAR-BAMAKO-PAR-LE-SUD.pdf 86 AfDB Mali/Senegal: Road Development and Transport Facilitation Project: The Southern Bamako-Dakar Corridor 87 http://www.ageroute.sn 88 Rapport de Presentation du Budget du Programme d’Entretien Routier Annuel (Pera) 2014 89 USAID PCE Etude Des Coûts du Transport Sur le Corridor Dakar – Bamako (2011)
Figure 4: Ouagadougou-Bamako routes
Source: USAID Trade Hub - Tema-Ouagadougou-Bamako Corridor (2013)

Accelerating Trade in West Africa (ATWA) – Stage 1 Final Report
60
7.3.3 Bamako-Ouagadougou section of the TAH 5 corridor
The second leg of the TAH 5 or Trans-Sahelian Highway is the Bamako-Ouagadougou section.
This corridor has two alternative routes between Bobo Dioulasso and Bamako: a) The northern route which passes through the Faramano (Burkina) and Koury (Mali) border points and is 1,035 km long of which 547km are in Mali and 488km in Burkina Faso; and b) the southern route which passes through the Koloko (Burkina) and Heremakokno (Mali) border points and is 934km long with 432km in Mali and 502 km in Burkina.
Travel and turn-around time
Average travel and turnaround times for loaded trucks from Ouaga to Bamako and vice versa are summarized below90.
Table 33 - Travel and turnaround times on the Ouagadougou-Bamako corridor
Route & direction Average travel time &
range (days) Average turn-around time &
range (days)
Ouaga-Bamako northern route 3.3 (2-6) 19.4 (10-29)
Ouaga-Bamako southern route 3.2 (1-5)
Bamako-Ouaga, northern route 4.0 (1-9) 18.6 (9-38)
Bamako-Ouaga, southern route 3.9 (1-9) 16.9 (10-28)
As on most corridors in West Africa, trucks spend less than 25 percent of their time travelling. The rest is spent waiting, both before departure and after arrival91.
Traffic
The JICA Traffic Survey at the Koloko border crossing – the southern route, which handles about 25 percent of total traffic between Bamako and Ouagadougou - recorded average daily vehicle traffic of 182 vehicles per day of which 40 percent (73) were heavy trucks. Interestingly, 84 percent is intra-regional traffic and only 16 percent is transit, presumably from Tema Port.
Customs and border crossings
Trucks from Tema or Lomé proceed from their respective borders under escort to OuagarInter where they complete transit formalities. At Ouagarinter, another convoy is formed and a new escort is assigned for the journey to the dry port in Bobo Dioulasso. The escort is again changed in Bobo and the convoy continues to the Burkina/Mali border. Since May 2009, containerized cargo and certain specific commodities 92 are exempted from travelling in convoy and may proceed directly to the Burkina/Mali border.
90 USAID Trade Hub, Ouagadougou-Bamako Corridor Road Governance Report, May 2013 91 Ibid. 92 Exemptions from convoys now include containers, refrigerated trucks, vehicles and heavy engines, vehicles on temporary importation into the country, chemical products, salt, cement, rice and medicines

Accelerating Trade in West Africa (ATWA) – Stage 1 Final Report
61
Convoys and escorts
There is an estimated 48 hours of delay in Burkina Faso as a result of the escort system. A customs agent accompanies a limited number of trucks (ten in Burkina Faso) in a tight convoy to ensure that none of the trucks deviates from the prescribed route and that they all reach the intended destination. Customs agents retain possession of the documents of all trucks under the care of the escort until they reach the next station, where a new customs agent is assigned to take over possession of the documents. Documents are retained by Burkina customs until the point of exit.
If cargo is destined for Bamako, the truck proceeds to Faladie, the international terminal in Bamako, where the importer clears the goods and pays customs duties before finally taking possession. If Bamako is not the final destination, customs clearance can be done at a number of major towns in Mali.
Road description
The southern route is to 80 percent in fair condition, even on hilly stretches. On this route there is only one truck rest area at the Burkinabé–Malian border.
The northern route in Mali is in fair to poor condition for about half of its length, but it is still popular despite being longer and less well maintained than the southern route. One of the reasons is the possibility to load or offload cargo destined for northern Mali in Ségou. Another reason is the presence of a weighbridge at Hérémakono on the southern route where the control is done per axle and fines therefore are more likely to be imposed. Finally, the northern route is less hilly, which reduces fuel consumption. In 2010 approximately 70-80 percent of trucks used the northern Faramana/Kouri route93.
Road governance
Mali, with 2.6 checkpoints per 100 km and bribes equivalent to USD 7.60 per 100 km, has the highest density of controls and level of bribes among the countries monitored by OPA. That applies to “legal” trucks. Trucks, which carry perishable agricultural products, which are seldom correctly documented, are also faced with 2.6 checkpoints per 100 km but have to pay bribes equivalent to almost USD 27 per 100 km in Burkina Faso94.
7.4 TOGO 95
7.4.1 Port Autonome de Lomé
The “Port Autonome de Lomé” (PAL) is the only commercial port in Togo. PAL’s strength has historically been its 14m draught, which is the deepest natural depth of any port in West Africa. This advantage is now being threatened as other West African ports are dredging their access channels to even deeper depths.
Table 34 - Lomé – total traffic (‘000 tonnes)
2008 2009 2010 2011 2012 2013*
Import Togo 3,027 3,054 3,299 3,282 3,460 4,284
Import transit 1,973 1,684 2,205 2,600 2,841 2,292
93 USAID Trade Hub - Trends in Transport and Logistics on the Tema-Ouagadougou-Bamako Corridor (2013) & Nathan - Ouagadougou–Bamako Transport Corridor Logistics Analysis (2012) 94 USAID Trade Hub & UEMOA - 23rd Road Governance Report, Survey Results for the first quarter of 2013 95 Sources: USAID West Africa Trade Hub - Transport and Logistics Costs on the Lomé-Ouagadougou Corridor (2012)
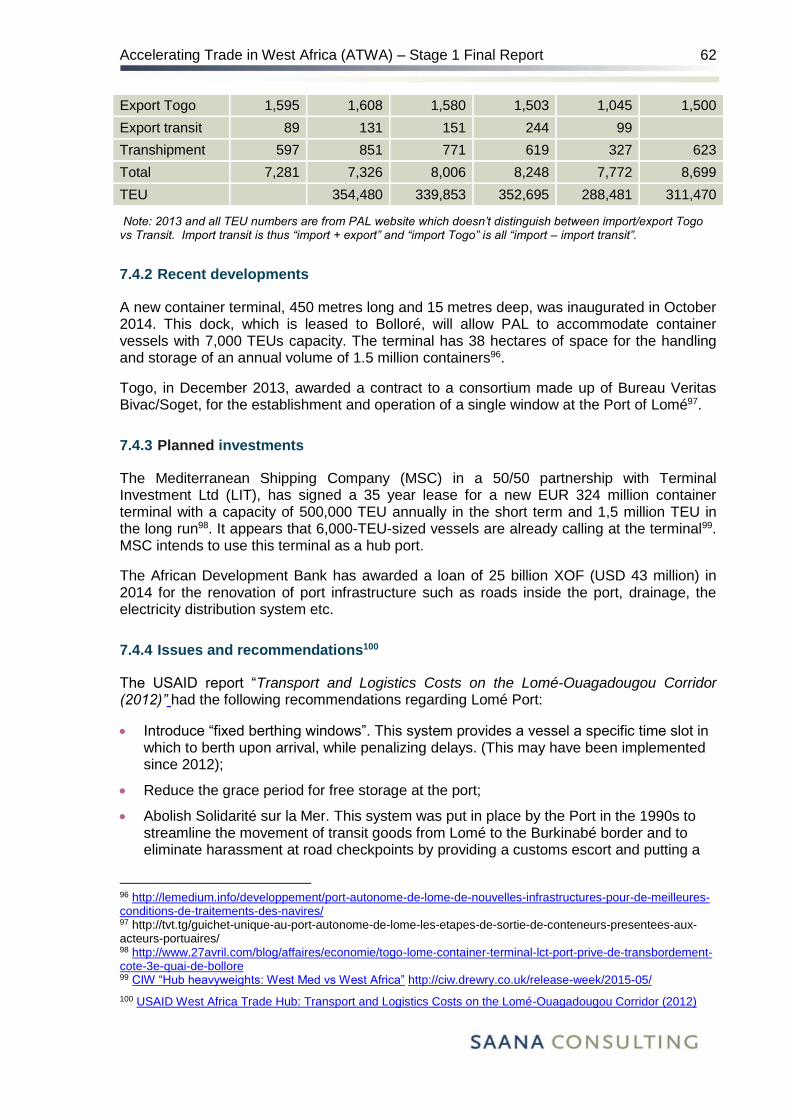
Accelerating Trade in West Africa (ATWA) – Stage 1 Final Report
62
Export Togo 1,595 1,608 1,580 1,503 1,045 1,500
Export transit 89 131 151 244 99
Transhipment 597 851 771 619 327 623
Total 7,281 7,326 8,006 8,248 7,772 8,699
TEU 354,480 339,853 352,695 288,481 311,470
Note: 2013 and all TEU numbers are from PAL website which doesn’t distinguish between import/export Togo vs Transit. Import transit is thus “import + export” and “import Togo” is all “import – import transit”.
7.4.2 Recent developments
A new container terminal, 450 metres long and 15 metres deep, was inaugurated in October 2014. This dock, which is leased to Bolloré, will allow PAL to accommodate container vessels with 7,000 TEUs capacity. The terminal has 38 hectares of space for the handling and storage of an annual volume of 1.5 million containers96.
Togo, in December 2013, awarded a contract to a consortium made up of Bureau Veritas Bivac/Soget, for the establishment and operation of a single window at the Port of Lomé97.
7.4.3 Planned investments
The Mediterranean Shipping Company (MSC) in a 50/50 partnership with Terminal Investment Ltd (LIT), has signed a 35 year lease for a new EUR 324 million container terminal with a capacity of 500,000 TEU annually in the short term and 1,5 million TEU in the long run98. It appears that 6,000-TEU-sized vessels are already calling at the terminal99. MSC intends to use this terminal as a hub port.
The African Development Bank has awarded a loan of 25 billion XOF (USD 43 million) in 2014 for the renovation of port infrastructure such as roads inside the port, drainage, the electricity distribution system etc.
7.4.4 Issues and recommendations100
The USAID report “Transport and Logistics Costs on the Lomé-Ouagadougou Corridor (2012)” had the following recommendations regarding Lomé Port:
Introduce “fixed berthing windows”. This system provides a vessel a specific time slot in which to berth upon arrival, while penalizing delays. (This may have been implemented since 2012);
Reduce the grace period for free storage at the port;
Abolish Solidarité sur la Mer. This system was put in place by the Port in the 1990s to streamline the movement of transit goods from Lomé to the Burkinabé border and to eliminate harassment at road checkpoints by providing a customs escort and putting a
96 http://lemedium.info/developpement/port-autonome-de-lome-de-nouvelles-infrastructures-pour-de-meilleures-conditions-de-traitements-des-navires/ 97 http://tvt.tg/guichet-unique-au-port-autonome-de-lome-les-etapes-de-sortie-de-conteneurs-presentees-aux-acteurs-portuaires/ 98 http://www.27avril.com/blog/affaires/economie/togo-lome-container-terminal-lct-port-prive-de-transbordement-cote-3e-quai-de-bollore 99 CIW “Hub heavyweights: West Med vs West Africa” http://ciw.drewry.co.uk/release-week/2015-05/
100 USAID West Africa Trade Hub: Transport and Logistics Costs on the Lomé-Ouagadougou Corridor (2012)

Accelerating Trade in West Africa (ATWA) – Stage 1 Final Report
63
sticker on inspected trucks to indicate that no further inspections were required. The Initiative however lost its original effectiveness and became just another bureaucratic obstacle and a source of revenue for PAL. (It appears that Solidarité sur la Mer has been abolished since 2012);
Single window. Togolese customs should speed up the introduction of a single window in Lomé Port. (A contract to establish a single window was awarded in 2013, but it is not known how effective it is).
SWOT analysis for the port of Lomé 101
Strengths
The port offers broad expansion possibilities: there is land available and possibilities for construction behind the port (car parking etc.);
The port can easily achieve the water depths necessary for large container ships (complementary with the implementation of the two projects mentioned);
A welcoming, stable port offering flexibility in procedures (including transhipment) when compared to Benin (too much political influence in the port of Cotonou);
The introduction of berthing windows, which have considerably reduced ship waiting times;
Very good productivity: currently close to 35 movements per hour/ship, one of the best in Africa;
No congestion in the port;
Free port: ability to import, add value added tax and re-export without paying customs duties.
Weaknesses
The existing container terminal facilities are not rational: the yard is at some distance, which implies additional handling
Less commercial flexibility since Getma is no longer licensed to handle containers;
Port roads are in a very poor state;102
Speed at which imported goods are cleared: four to five days minimum;
Inefficient banking system.
Opportunities
Easy communication between Togo and neighbouring countries: same currency, same language etc. (Except for Ghana);
The port opens the way to good quality links for services to Burkina Faso and Niger, unencumbered by a multitude of informal tolls;
In the future the port could also offer services to the hinterland of Ghana (infrastructure undersized to meet growth in flows) and Nigeria (Nigerian ports can suffer from congestion);
New competition in the container sector (Bolloré’s terminal and the MSC/China
101 Market study on container terminals in West and Central Africa, MLTC/CATRAM, Jan 2013 102 We believe this state of affair has since been corrected through the World Bank ALTTF project

Accelerating Trade in West Africa (ATWA) – Stage 1 Final Report
64
Merchants terminal) could lead to more competitive offers of service;
Renovation of the Lomé-Blita railway?
Third quay and MSC dock.
Threats
State of the roads: the Aledjo fault etc.
Piracy (principally concerning oil tankers).
7.4.5 Lomé-Ouagadougou corridor
The Lomé-Ouagadougou corridor is approximately 970 km and is the shortest route from Ouagadougou to a seaport.
Travel and turn-around time
The average travel time for imports to Burkina Faso is 4.5 days while it is 2.6 days for exports. However, because of excessive waiting time in the port and in the inland terminal, the average turn-around time for a loaded truck from Lomé to Ouaga (import) is 22 days, varying from 9 to 47. For a loaded truck travelling from Ouaga to Lomé (export) average turn-around time is 12.6 days varying from 4 and 21 days103.
Traffic
The composition of Lomé Port’s transit traffic is unusual in that more than half is for a neighbouring coastal country, Ghana, namely clinker for a cement plant located close to the border.
The Lomé-Ouaga corridor carries transit cargo to Mali and Niger plus intra-regional traffic in the same amount as transit traffic. This would make for a total of about 2.7 million tonnes (2012) per year as far as the town of Koupela in Burkina Faso; from there traffic to Niger travels east to Niamey or beyond while traffic to Mali goes through Ouagadougou. The border crossing at Cinkassé sees 598 vehicles of which 46 percent (275) are heavy trucks, carrying about 16,000t per day.104
Table 35 - Lomé: Transit traffic
2008 2009 2010 2011 2012 2013
Burkina Faso 488,990 643,247 789,427 911,592 678,214 849,716
Niger 194,183 237,924 318,853 436,146 572,716 319,367
Mali 83,012 94,726 138,895 178,757 109,732 93,927
Chad 741 1,140 3,043 3,015 2,138
Ghana 1,025,233 558,238 857,222 1,029,229 1,413,833 1,029,776
Cote d'Ivoire 31,388 69,323 21,046 48,358 12,378
Benin 122,085 132,204 179,550 124,731 81,789
Nigeria 115,663 77,291 48,588 112,400 69,383
Total 2,061,295 1,814,093 2,356,624 2,844,228 2,940,183 2,292,786
103 USAID WATH: Lomé-Ouagadougou Corridor Road Governance Report, May 2013 104 JICA Traffic Survey 2012

Accelerating Trade in West Africa (ATWA) – Stage 1 Final Report
65
Road conditions
The terrain along the corridor varies considerably: long flat stretches contrast with 300 km of hilly topography from Tsétvie to Sokode, culminating in 75 km of mountainous road between Sokode and Kara with the spectacular Faille d’Aledjo. Of 14 broken-down vehicles seen along the length of the corridor, the road inventory noted 13 on the hilly/mountainous section in central Togo. The route is asphalted from end to end, and its condition varies from average to severely degraded depending on the section. For example, the condition between Bittou and Cinkansé is very poor. Traffic conditions along the entire corridor were deemed average overall in 2012, but as several road improvement projects have been underway since then, including a detour around the Faille d’Aledjo, road conditions should now be good, at least in the northern half of the country105.
Road governance
Togo abolished checkpoints manned by the Gendarmerie in 2011. Road harassment in Togo is therefore very low with only customs checkpoints along the corridor. Togolese authorities have complained that traffic accidents have increased after the removal of the checkpoints but we have not been able to obtain any evidence to verify that.
Customs and border crossings
The first JBP in the ECOWAS region was established by UEMOA in Cinkassé in October 2011. However, it is not operating as expected, as the two customs information systems have not yet been interconnected (See Box 1).
It used to be the case that customs, in collaboration with PAL, the police and the gendarmerie organized convoys of trucks that had left the port and parked at the Terminal du Sahel about 15 km north of Lomé. The customs officers informally charged the drivers XOF 5,000 per truck as a “call-up” fee. Once all the trucks on the port list had arrived, the convoy would leave for the Cinkassé border post. Officially, convoys left each Tuesday, Thursday and Saturday between 14:00 and 18:00. In practice, they may have left only twice a week. This may have changed since 2012 as JICA reports that trucks no longer travel in convoys, but are now fitted with GPS at the port and tracked on the route to Cinkasse106.
Box 1 – The situation at Cinkassé – February 2014107
105 JICA Traffic Survey 2012 106 JICA – Etude sur les Procedures et Operations Douanières du Corridor Lomé-Ouagadougou (2014) 107 JICA – Etude sur les Procedures et Operations Douanières du Corridor Lomé-Ouagadougou (2014)
The customs declaration for transit from Lomé to Ouagadougou, including the ISRT customs guarantee payment (customs bond), is done twice1, first at the port of Lomé for the stretch through Togo and then again in Bitou located in Burkina Faso 38 km northwest of Cinkassé for the stretch through Burkina Faso.
In January 2013, the customs administrations of the two countries signed a transit agreement, which envisages that the transit procedure including payment of the ISRT guarantee should be done once only, at the port of Lomé. The two customs authorities have successfully tested the interconnection that allows the unification of the transit document between the two countries. However, discussions among the Chambers of Commerce and Industry and Customs of the two countries on the single guarantee continue.
A GPS device is put on the loaded trucks in Lomé so that Togo customs can track the consignment as it travels to the Burkina border. There are no gendarmerie checkpoints between Lomé and Cinkassé while there are five between Cinkasé and Ouagadougou. There is as yet no GPS tracking between Cinkassé and Ouagadougou, and trucks, except for certain

Accelerating Trade in West Africa (ATWA) – Stage 1 Final Report
66
Ouagadougou - OuagarInter
See Sub-section on Burkina Faso.
Recommendations
The WATH report identified a number of issues, discussed below, which would improve the performance of the Lomé–Ouagadougou corridor considerably. However, many problems and opportunities related to international and regional West Africa trade are not corridor-specific. Only those relating directly to the Lomé-Ouaga corridor are listed below.
Corridor-specific issues/recommendations
Reduce container-handling charges at Ouagarinter container terminal;
Recommendation: TRCB should stop mandatory unloading, and related charges, of containers that the cargo owner or transporter would prefer to leave on the truck in order to be able to return the container quickly to the shipping line.
Customs—Togo and Burkina Faso
Modernize and depersonalize customs operations;
Customs officers’ availability (Ensure there always is one senior customs officer with necessary signatory powers available);
Improve ASYCUDA access at borders
Recommendation: Improve ASYCUDA access at borders by improving connectivity, the reliability of the power supply and the number of computer consoles.
Reduce overtime payments at customs posts
Recommendation: Burkinabé Customs should charge overtime only for actual hours worked outside normal working hours, and eliminate the practice of requiring overtime payments for accepting import declarations outside the 07:00–08:00am period.
Burkinabè cargo insurance
categories such as containers, travel in convoys. It appears that Burkina Customs is getting ready to introduce GPS tracking after which it has committed to removing checkpoints for trucks in transit. The JICA report does not mention how transit documents are transported, so it is possible that they travel with the drivers.
Some procedures and controls at Cinkassé such as checks of trucks’ registration documents and the removal of the Togolese GPS device occur outside the JBP, which increases the number of stops and the time spent in the border area
Cinkassé was established as a PPP and an Ivorian company, Scanning Systems International (SSI), is managing the concession. SSI has completed the construction and installation of equipment and is responsible for its maintenance and employs a hundred people to perform this task. In return, SSI receives XOF 25.000 (about USD 50) per loaded truck1. However, SSI has been unable to collect the fee because users say they get no value for their money and refuse to pay. The transit procedures in Bitou take around 8 hours and cost the equivalent of USD 120 including the escort fee, to which one should add informal payments – about USD 4 - at checkpoints. Traders and transporters want to see the escort/convoy and checkpoints eliminated and the transit procedures moved to Cinkassé. This may have happened since 2013.

Accelerating Trade in West Africa (ATWA) – Stage 1 Final Report
67
Recommendation: Eliminate the Burkinabé customs requirement for a Burkinabé insurance certificate as a pre-condition for clearance even though the goods have already arrived in Ouaga.
Customs - Togo
Togolese customs should withdraw the PEA tax for goods in transit.
8. GROUP 3: THE GAMBIA, GUINEA, GUINEA BISSAU, LIBERIA, SIERRA LEONE
8.1 Group 3: Summary
Corridors
There are no important transit corridors in Group 3 at this time. The Port of Conakry did handle 93,000 tonnes of transit to Bamako in 2013, but not much is known about this corridor. Corridors in this region may become more important in the future as missing links on the Trans-Coastal Highway from Dakar to Abidjan are completed and as the Conakry-Bamako corridor is improved.
Export profile
Unfortunately the World Bank database we rely on does not have data as to the composition of exports for most of the Group 3 countries. However, from other sources we can gather the following basic information:
More than half of the Gambia’s exports are woven fabrics.
Guinea’s exports mainly consist of petroleum, aluminium ore and gold.
Guinea-Bissau’s exports are concentrated on a few agricultural products (cashew nuts and fish) and wood.
Liberia’s exports are composed of iron ore, natural rubber and wood.
Sierra Leone’s exports are almost entirely dominated by iron ore (84%).
Table 36 - Export basket Group 3 countries
Country Total Merchandise exports (USD million)
Food Aggregate Raw Materials
Fuels Ores and Metals
Manufactures
Gambia, The 87 49% 0% 0% 3% 48%
Guinea 1,428 n.a. n.a. n.a. n.a. n.a.
Guinea-Bissau 162
n.a n.a n.a n.a n.a
Liberia 583 n.a. n.a. n.a. n.a. n.a.
Sierra Leone 1,886 n.a. n.a. n.a. n.a. n.a.

Accelerating Trade in West Africa (ATWA) – Stage 1 Final Report
68
Intra-regional trade
The database we use does not show any recorded trade taking place between Group 3 countries. Other databases show small amounts of trade in agricultural products between Liberia and Guinea, but mostly there is little recorded trade between Group 3 countries. Informal trade flows however could be important.
Poverty profile
Countries in Group 3 have small economies and population sizes. It is, in GDP/capita terms, the poorest group by far out of the ones considered here:
11.5 million people in Guinea, Liberia and Sierra Leone live with less than 1.25 USD per day, or about 53% of the total population.108
The weighted GDP/captia of the region stands at 567 USD, far below all the other Groups considered. Sierra Leone has the highest GDP/capita at 788 while The Gambia the lowest at 423, the lowest value of all the countries considered.
Summary of considerations for Group 3
Opportunities for ATWA:
High poverty rates and low GDP/capita, suggesting that these countries are in need of assistance and that successful interventions could have high poverty reduction impact.
Limitations/challenges for ATWA:
Linguistically complex: three official languages spoken (French, English and Portuguese).
No major transit corridor.
Very concentrated export baskets dominated by goods from extractive industries.
Quasi non-existent formal regional trade.
Low institutional capacity.
8.2 Guinea
8.2.1 Conakry port
Guinea has two ports, Port autonome de Conakry (PAC) which is the major port, and Port Kamsar which is a mineral port serving primarily the Guinea Alumina Corporation.
Traffic and operations
Traffic through the Conakry port is summarized in the table below.
108 We do not have data for data for Guinea Bissau or The Gambia on people living below the poverty line.

Accelerating Trade in West Africa (ATWA) – Stage 1 Final Report
69
Table 37 - Conakry Port - Total Traffic (‘000 tonnes)
Description 2008 2009 2010 2011 2012 2013
Import Conakry 3,274 3,731
Export Conakry 3,647 3,467
Import - Transit 114 93
Export - Transit - -
Transhipment
Fishing harbour
Total 7,036 7,292
Number of TEUs 147,466 147,255
Recent development
Bolloré, which has a 25-year concession, inaugurated a modern terminal with a draft of 13 metres and a 340m long quay in November 2014. The terminal now has 600 linear metres of quay and over 226,000m2 of storage area. The terminal has improved its stevedoring capacity from 19 movements in 2011 to 35 in 2014. The Bolloré group plans a total investment of 500 million euros over the period of the concession109.
Planned investments
The Conakry-Bamako road corridor was UEMOA priority project number 4 (out of four) in 2004 and the Guinea and Mali governments have agreed to establish a working group to realize a Conakry-Bamako rail corridor110. It appears that there is some funding available for the road project, but to our knowledge there is no committed funding for the rail corridor yet.
Issues and recommendations
The Port of Conakry may grow in importance as a transit (to Bamako, Mali) and/or trans-shipment port.
9. CORRIDOR NOT INCLUDED IN COUNTRY GROUPINGS: THE DAKAR- ABIDJAN AND ABIDJAN-LAGOS CORRIDOR
9.1 A. Dakar-Abidjan corridor
The area bordered by Côte d’Ivoire, Mali and Senegal and the Bay of Guinea, which includes the Manu River countries Sierra Leone, Liberia, Guinea and Côte d'Ivoire, seems to have been left behind the rest of the ECOWAS region – partially because of the vicious civil
109 http://www.bollore-africAbidjan-Lagosogistics.com/medias/communiques-de-presse/conakry-terminal-inaugure-un-nouveau-quai-de-340-m-de-long.html 110 http://guineenews.org/construction-du-chemin-de-fer-conakry-kankan-bamako-le-demarrage-du-projet-en-2015/
Figure 5: Dakar-Abidjan stretch of TAH 7

Accelerating Trade in West Africa (ATWA) – Stage 1 Final Report
70
wars in Liberia and Sierra Leone, which only came to an end in 2003. The outbreak of Ebola fever in 2014-2015 has furthermore put enormous strain on governments in Guinea, Liberia and Sierra Leone.
Therefore, many ECOWAS priority projects in the area of road transport address issues along the Dakar-Abidjan corridor.
One such project is a study started in March 2015 of Dakar-Lagos Corridor missing links.111 Specific objectives are to: i) Undertake an assessment of the economic viability of the Lagos-Dakar corridor for investment considerations; ii) Establish a complete inventory of the missing links with a description of the road assets, condition and location; iii) Design comprehensive and reliable interventions on the missing links and upgrading of existing ones. The Table below lists ECOWAS priority projects in the Dakar-Abidjan corridor countries.
Table 38 - ECOWAS priority projects in Dakar-Abidjan corridor countries
Title of Project Actor In Charge
Cost (Millions USD)
Financing Available (Millions USD)
Financing to be Sought for (Millions USD)
Ratio Gap of Financing/Cost
Upgrading of Bandajuma-Liberia Border road and Construction of 3 bridges in Sierra Leone.
ECOWAS 122.0 0.0 122.0 100.0%
Establishment of joint border posts in the region of the MANO river.
MRU 0.6 0.0 0.6 100.0%
Regional program for the development of trans-border interconnection of road infrastructures in the Mano River region of the Union.
MRU 1,505.4 250.0 1,255.4 83.4%
CU18 development and asphalting project of the road at the Guinea border-Sirana-Odienne-Boundiali (CI)
UEMOA 151.9 0.0 151.9 100.0%
CU11 Rehabilitation and widening of the Gabu-Bafata/Bafata-Bantandjan road: 89 Km (GB)
UEMOA 48.0 0.0 48.0 100.0%
CU11 Guinea Bissau Special Program (development and asphalting of 397kms, development of 237 kms
UEMOA 195.6 0.0 195.6 100.0%
111 Consultant: AFRIC CONSULT/GAIC Duration: 8 months.

Accelerating Trade in West Africa (ATWA) – Stage 1 Final Report
71
secondary roads, including the Farim bridge) (GB)
CU11/CU2B interconnection road between Conakry-Dakar (CU11) and the Bamako- Dakar corridor through the South and through Kedougou-Dindifferlo-Mali-Labe (Sn)
UEMOA 30.6 0.0 30.6 100.0%
CU1 Construction of the second bridge on Ziguinchor on the Dakar-Lagos trans-costal road (Sn)
UEMOA 71.4 0.6 70.9 99.2%
Banjul-Barra Bridge (The Gambia)
The Gambia
400.0 0.0 400.0 100.0%
Construction of the road linking Buba (Guinee-Bissau) to Balea (Mali)
Guinea Bissau
37.8 0.0 37.8 100.0%
Gbarnga-Voinjama-Mendikoma Road Project
Liberia 378.0 1.0 377.0 99.7%
Paynesville-Gbarnga-Ganta Road Project
Liberia 255.5 245.6 9.9 3.9%
Pendembu Kailahun Road Sierra Leone
25.6 15.0 10.6 41.4%
Bo-Bandajuma Road Sierra Leone
33.6 0.0 33.6 100.0%
Rehabilitation of the Makeni-Kamakwe-Madina Oula Road
Sierra Leone
103.3 14.9 88.3 85.5%
9.2 The Abidjan-Lagos corridor
The Abidjan Lagos Corridor links the major population centres of five ECOWAS countries: Ivory Coast, Ghana, Togo, Benin and Nigeria, with a combined population of 37 million. The Abidjan-Lagos Corridor as a whole is not included as a corridor in its own right in the in country groupings above, but is split in two between Group 1 and 2.
This is a conscious choice given that Trucks and goods do not travel from point A to point B and back between Abidjan and Lagos. Transit traffic from Abidjan to Lagos is limited to fewer than five trucks a day. Rather, traffic is more or less dense between different sections of the corridor depending on bilateral trade and transit flows. Specific features of the Abidjan-Lagos Corridor are presented below.
Summary: The average traffic count across borders on the Abidjan-Lagos corridor is 196 trucks per day, which is lower than the average transit corridors where 212 trucks pass per day. The busiest border crossing for cargo is between Ghana and Togo with 493 trucks per

Accelerating Trade in West Africa (ATWA) – Stage 1 Final Report
72
day, which is more than the busiest transit corridor, Cotonou-Niamey with 308 trucks per day. JICA on the other hand counted only 29 trucks per day at the Seme-Krake border crossing between Benin and Nigeria.
As for passenger traffic, the average Abidjan-Lagos border crossing sees some 7,500 people crossing per day whereas the average transit corridor only sees 2,100 (not shown in the table).
Checkpoints: The Abidjan-Lagos corridor has a very high density of checkpoints with a total of 62 on a distance of less than 1,000 km.
Border crossing times: On average a loaded truck must expect to spend 32 hours at a border crossing on the Abidjan-Lagos Corridor, from a “best” of 7 hours at the border from Benin to Togo and a “worst” of 63 hours crossing from Nigeria to Benin.
Joint Border Posts. There are currently two JBPs being built on the Abidjan-Lagos corridor: Between Nigeria and Benin (Seme-Krake) and between Togo and Ghana (Noepe). It was announced in May 2015 that a third JBP will be built between Ghana and Côte d’Ivoire (Noe).
9.2.1 Road network
The infrastructure along the Abidjan-Lagos corridor consists of coastal roads linking Abidjan, Tema, Lomé, Cotonou, and Lagos. The roads have more capacity the closer they are to the cities (e.g., 2x2 lanes in the accesses to Tema, Lomé, Cotonou and Lagos), and between Cotonou and the border with Nigeria (Semé-Kraké). Otherwise most roads on the corridor have only two lanes. Many segments of the corridor have been improved by the AfDB or as part of the World Bank Abidjan-Lagos Trade and Transport Facilitation Project (ALTTFP), but it appears that the segment between Cotonou and Lagos is still in bad condition, especially close to the border112.
9.2.2 Traffic
Traffic along the Abidjan-Lagos corridor is diverse with trucks of widely differing sizes. In the Benin section of the corridor, heavy vehicles make up about 9 percent of traffic in the less dense segments, with small vehicles prevailing close to the urban areas. Traffic density and mix changes noticeably the closer one gets to Cotonou.
Passengers conducting informal border trade dominate traffic along the corridor. It has been estimated that two-thirds of international trade in West Africa is generated between neighbouring countries. Transit traffic from Abidjan to Lagos is limited to fewer than five trucks a day. Almost 50 percent of passengers cross the border at least once each week, mostly to trade on the other side113.
The JICA Traffic Survey counted traffic at four points along the Abidjan-Lagos corridor: at Elubo in Ghana at the border with Côte d’Ivoire, at Aflao in Ghana at the border with Togo, at Sanveecondji in Togo at the border with Benin, and at Seme in Nigeria at the border with Benin. The results are summarized in the table below
112 Nathan – Corridors in West & Central Africa (2013) 113 Ibid.

Accelerating Trade in West Africa (ATWA) – Stage 1 Final Report
73
Table 39 - Traffic along the Abidjan-Lagos corridor
Survey point Border crossing
Vehicles Heavy trucks Cargo Passengers
Elubo CI-GH 2,304 3% (69) 1,100t 9,000
Aflao GH-TG 1,174 42% (493) 17,100t 7,700
Sanveecondji TG-BJ 2,752 7% (193) 4,600t 10,200
Seme BJ-NG 715 4% (29) 200t 3,300
Source: JICA Traffic Survey – compiled by author
International traffic along the Abidjan-Lagos Corridor is much busier than at the border crossings to the landlocked countries, where vehicle traffic on average is less than 500 vehicles per day. The Abidjan-Lagos corridor in addition carries much local traffic making it very congested, particularly near urban centres and on the Tema-Accra-Takoradi stretch in Ghana. Seme border crossing sees a rather low level of traffic in spite of being the gateway to Nigeria: only 200 tonnes of cargo and 3,300 passengers per day. This may be because the Seme-Krake border crossing is known to be particularly difficult to cross.
9.3 Border crossings
The very real difficulty for commercial trucks to transport goods to another country in West Africa is confirmed by the excessively long time it takes to cross most land borders, particularly along the Lagos-Abidjan corridor114. The time to cross borders, and dwell time in ports, are shown on the map below prepared by the Abidjan-Lagos Corridor Organization (ALCO).
Figure 6: Abidjan-Lagos corridor – port dwell time and border crossing time (ALCO)
Source: ALCO - RAPPORT AN 4: JUILLET 2013 – JUIN 2014
114 For private vehicles with papers in order, crossing borders in West Africa is not difficult. The writer’s personal experience from crossing borders between GH-TG, TG-BJ, BJ-BF, BF-GH, BF-ML, BF-CI, CI-GH with a private Ghana-registered vehicle in 2013 and 2014 is very positive. He encountered no harassment and the process was usually fairly fast (about 30 minutes per border). It was confusing, however, with at least three offices on either side of each border with no signs explaining what to do and where to go, and lots of people milling around trying to convince travellers that they needed help to get through the border.

Accelerating Trade in West Africa (ATWA) – Stage 1 Final Report
74
Border crossing time as recorded by ALCO and WATH is summarized in the tables below. It should be noted that a survey conducted by the Borderless Alliance shows that only about 50 percent of the time spent at border crossings is processing time. The rest is time spent by the driver waiting for service, or because something is missing – incomplete paperwork or lack of funds for example - or for his own reasons. (See also Customs – Section 1 above: Cross-Cutting Issues)
Table 40 - Border crossing times along the Abidjan-Lagos and Cotonou-Niamey corridors
No
ë,
CI
Elu
bo
, G
H
Afla
o, G
H
Ko
djo
via
kop
e,
TG
Sa
nve
e K
ond
ji, T
G
Hill
ary
ko
nd
ji, B
J
Kra
ke, B
J
Se
me
, N
G
Direction of trade flow
Average 32h 34h 42h 22h 7h 30h 63h 23h34
Median 18h55 29h 25h21 20h49 3h41 12h48 33h29 10h10
Source: ALCO - RAPPORT AN 4: JUILLET 2013 – JUIN 2014
According to ALCO surveys, clearing a truck coming from Nigeria in Krake, BJ takes on average 63 hours. The sample however must include a number of extreme outliers, as the median crossing time is 33.5 hours; though that is still a very long time.115
JBPs are being built at the Krake, BJ - Seme, NG and the Aflao, GH - Kodjoviakope, TG border crossings. ALCO, with World Bank funding, has produced a report on the status of these JBPs as of 2014. The JBPs were not operational at the time of the ALCO report and, to the best of our knowledge, are still not operational. Working hours and services involved in the clearance process at the existing border crossings are summarized below.
Table 41 - Selected Abidjan-Lagos corridor border crossings – working hours and services present
Customs Office Working hours
Aflao, Ghana Kodjoviakope, TG
Krake, Benin Seme, Nigeria
Monday to Friday 6am-5pm 7-12 & 2:30-5:30pm
8-12:30 & 3-6pm 8am-6pm
Saturday & Sunday
Sat: 6am-5pm Sat: 7:30-12:00 Sat: 8-12, exceptionally
Reduced service
Services present Customs + 12116 Customs + 9117 Customs + 3118 Customs +9119
Source: ALCO ECOWAS Joint Border Program (July 2014) – Compiled by author
115 The Borderless sample is smaller than ALCO’s – 40 versus 570. This may explain the differences in measures 116Ghana Immigration Service; Bureau of National Investigation; National Security; Ghana Standards Board; BIVAC; Food and Drugs Authority; GC Net; Port Health; State Insurance Company; Plant Quarantine; Ministry of Trade and Industry; Scan 117 Police; Immigration; General Services; Drug Enforcement Agency; PhytoSanitary; Health; Veterinary; Tax Services; COTECNA 118 Police; Phytosanitary; Veterinary – Benin exit formalities are conducted by all the administrations listed. 119 NCS - Nigeria Customs Service; ANCLA - Association Of Nigerian Licensed Customs Agents, SON - Standards Organization of Nigeria; NQS - Nigeria Quarantine Service; NPF - Nigeria Police Force; NDLEA -; National Drug Law Enforcement Agency; NAFDAC - National Agency for Food and Drug Administration and Control; NIS - Nigeria Immigration Service; Port Health Authority. SSS - State Security Services

Accelerating Trade in West Africa (ATWA) – Stage 1 Final Report
75
We are highlighting working hours because stakeholders often mention the lack of coordination of working hours as a factor that slows down crossing borders. As for the great number of agencies, in addition to customs, who are involved in the clearance process, it does not take much imagination to understand the challenge of coordination when all want to inspect a shipment.
9.3.1 The Seme-Krake border crossing
The situation at this border is very particular because the major part of the traffic is transhipped from Benin trucks to Nigerian trucks. The reason for this is linked to customs and law enforcement practices in Nigeria. The transhipment practice does not concern trucks coming from other countries on the Abidjan-Lagos corridor, only those loaded in Benin and with transit goods passing through the port of Cotonou.
Goods destined to Nigeria are cleared at the border, and instead of using the value of the goods as the basis for calculating duties, Nigeria Customs applies a lump sum formula: 1.9 million Naira (around USD 11,400) per truck. This creates the perverse incentive to load as much cargo as physically possible on a single truck. It was customary a few years ago to combine three Benin truckloads into a single Nigerian truck (a feat, considering that Benin trucks were already significantly overloaded). However, it seems that the Government of Nigeria is no longer authorizing such oversized trucks, and the current dimensions are closer to normal. It is however still common to combine the loads of two Benin trucks into one Nigerian truck.
Law enforcement officers in Nigeria tend to assume that Benin trucks are carrying goods that have been diverted from Lagos to Cotonou and therefore harass truck drivers from Benin more frequently than drivers from other countries. According to truck drivers’ unions, the issue of harassment by law enforcement is considered by most drivers a sufficient threat to justify avoiding driving in Nigeria altogether. However, drivers and trucks of other nationalities (Togo, Ghana and even Cote d’Ivoire) routinely drive through Nigeria.
10. CONCLUSION
Each of the delineated groups of corridors and associated countries reviewed has its opportunities and limitations/challenges as candidates for ATWA’s initial geographical intervention focus area under Strategic Objective 1.
Group 1 is clearly the sub-group with the busiest corridors, the most economic activity, and the largest proportion of people living in poverty. On the other hand, its export basket is problematic in that it consists mostly of petroleum products. Regional trade flows in this subgroup are heavily skewed towards Nigeria. Congestion in Lagos port could be hard to overcome, and we have no indication of how much transit trade from Lagos goes into Niger. The environment is also difficult with the Benin/Nigeria border being extremely complex, extensive smuggling taking place between the three countries, and insecurity in Northern Nigeria.
Group 2a’s corridors are not as busy, suggesting that cutting costs on them could have – relatively speaking – less impact on growth and poverty reduction. Yet the export basket of Group 2a countries is much less concentrated in fuels and minerals, and regional trade patterns are relatively more balanced. It is also the region where the ATWA team has identified most on-going reforms, projects and best practices related to trade facilitation. Adding Senegal and Mali to this group would allow ATWA to capture a greater volume of ECOWAS regional trade, add another transit destination to the geographical intervention area and work on the second busiest transit corridor in the

Accelerating Trade in West Africa (ATWA) – Stage 1 Final Report
76
region. Adding Togo on the other hand would allow ATWA to concentrate interventions on trade flows to Burkina Faso.
Group 3 is the poorest of all Groups considered and it is also the most complex operationally from a programme like ATWA to deliver interventions. Group 3 exports little, and most of the exports are products from extractive industries. These countries also show no, or very little, recorded intra-regional trade.
ATWA will adopt a staged approach to the diagnostic and design work for Strategic Objective 1, and start with the group of corridors and associated countries that presents the most potential for quick results, lowest levels of risks, opportunities for partnership and where it could build on an existing momentum for reform. The corridors/countries that most fit this description are those of Group 2a, namely Cote d’Ivoire, Burkina Faso and Ghana. In order to capture most of the transit trade to Burkina Faso and increase poverty focus while keeping the intervention area manageable, we will add the Lomé-Ouagadougou corridor to our focus corridors. Specifically then, we will cover the following trade routes:
Abidjan - Ouagadougou
Tema – Ouagadougou
Lomé-Ouagadougou
In the future, this initial group of under Strategic Objective 1 will be expanded by adding the other countries in Group 2b: Mali and Senegal. As noted above this would add another landlocked destination, allow ATWA to capture more intraregional trade and reach a large amount of people living below the poverty line. While there is strong evidence in favour of adding Senegal and Mali to our scoping and design efforts, the geographical area covered is judged to be to wide for ATWA to focus on initially.
We will therefore cover these countries and corridors at a later stage, once results and resources materialise, as a first step towards broader coverage of the ECOWAS region under Strategic Objective 1.
11. NEXT STEPS
The next step will be to move to AWTA Stage 2 and in particular to undertake more detailed performance measurement of the corridors selected above. In carrying out this work, the ATWA project team will need to engage with national and regional authorities at a much more sustained level than has been the case up to now.
In addition, the ATWA project team believes that an expanded focus on political economy analysis and informal cross-border trade would complement the corridor diagnostic work in Stage 2. Finally, consideration could also be given at this stage to collaborative work with the proposed regional trade & transport observatory. Each of these elements is briefly discussed below.
11.1.1 Corridor diagnostic
There are two main ways this workstream could be approached: by undertaking a Trade and Transit Facilitation Assessment (TTFA) and/or by undertaking a Corridor Diagnostic. These approaches are not mutually exclusive: the diagnostic places an emphasis on quantifiable measurements while the TTFA is more oriented towards consultation and programming.

Accelerating Trade in West Africa (ATWA) – Stage 1 Final Report
77
The ATWA project team is considering how to best combine the most relevant aspect of each method, whilst also drawing on the extensive previous experience of TradeMark East Africa (TMEA) in this area. Once this is finalized, the ATWA project team will prepare a detailed methodology, workplan and budget for completion of this technical workstream in the agreed delineated initial focus geographical area for ATWA Strategic Objective 1.
11.1.2 Thinking and working politically on ATWA
Political economy analysis is increasingly recognised as being an essential component of realistic and smart regional trade and integration programming. Many cross-border trade environments have strong political economy issues such as cartels, protected industries and rent seeking. Relations between regional organisations and Member States are also complex and require a certain degree of understanding for a donor-funded programme to work effectively in furthering regional integration.
There are two possible options for undertaking this workstream in the next stage of ATWA’s design which the ATWA project team is considering:
A set of sector specific PEAs to understand the particular functioning of a sector. Ideally this sector should focus on regulatory issues such as transport, Common External Tariff implementation or standards development. This will allow ATWA to understand the major drivers and blockers of positive change and design interventions accordingly.
The second option would be to undertake a set of country based PEAs. These analyses do not necessarily go into particular sectoral issues but provide an overview of the country’s political economy, going into issues such as power between various ministries, societal groups and parties. They are generally less useful for overall programming but give greater background and analysis on the country in questions.
Originally, ATWA considered that sectoral PEAs would be most useful to the development of the programme. It might be however that a basic understanding of country context is more important at the outset.
11.1.3 Including a focus on informal trade in ATWA Stage 2
Despite being the backbone of trade in the region, informal trade is not a well-understood phenomenon in ECOWAS. To our knowledge very few donor programmes try to engage with informal traders and largely overlook the issue. This is a gap which ATWA could potentially address.
Informal cross-border trade (ICBT) plays an important role in diversifying local economies, delivering food and energy security, encouraging entrepreneurial activity, generating jobs and alleviating poverty, particularly in the presence of high barriers to formal trade and absence of formal employment opportunities. ICBT also has an important gender dimension - women represent between 70-85% of informal traders in Sub-Saharan Africa and the income earned through these activities is critical to their household, including the education and health of their children. Female traders, often branded as smugglers and prostitutes by customs officials, are particularly vulnerable to higher levels of corruption and sexual harassment.
In Stage 2, ATWA could potentially include a specific focus on informal cross-border trade. The first step would be data collection at key border crossings to understand the breadth of volumes traded, the nature of the goods traded and the way borders are crossed. From this information it can be determined why traders avoid border posts or regular customs procedures, and how the legal framework could be accommodated to take informal trade

Accelerating Trade in West Africa (ATWA) – Stage 1 Final Report
78
into account. ECOWAS already has special, very liberal, provision in place for agricultural trade but in spite of these special provisions, informal trade is still very much present in the region.
Interesting examples exist in other regions, such as in the Common Market for Eastern and Southern Africa (COMESA), on special trade regimes for low-volume cross-border trade. The feasibility of replicating these special regimes could be explored by ATWA in ECOWAS and UEMOA in partnership with the regional commissions.
11.1.4 Collaboration with the proposed regional transport & facilitation observatory
A project with which ATWA could collaborate with (and potentially support) in Stage 2 and Stage 3 at an early stage would the proposed Regional Transport and Facilitation Observatory which has been agreed by ECOWAS and UEMOA but which has not yet been established. In East Africa, TMEA has established a strategic collaboration with observatory of the Northern Corridor Transit Transport Coordination Authority (NCTTCA) in Mombasa, Kenya.
The West Africa region is in great need for timely and reliable information on trade flows, transport infrastructure, corridor performance and trends. The information presented in this Stage 1 main report may give the impression that there is extensive data on the performance and features of key corridors. However, it took the ATWA project team several months to gather and compare this information from various sources, and some of it is several years old. Most corridor data has been collected by one-off studies by different organizations for different purposes, at different times, making the data confusing and contradictory and often difficult to compare and interpret,.
The Observatory will aim to a large extent to collect data through partners such as Ports, Customs, Ministries of Transport, Road Agencies, Chambers of Commerce and Shippers Councils, and to that effect establish partnerships with these entities. These partnerships will provide the foundation for further cooperation and give ATWA the opportunity to undertake additional corridor diagnostics and design future interventions in cooperation with these entities.
The specific modalities for ATWA to collaborate and support the proposed new regional observatory would need to be discussed with ECOWAS, UEMOA and other organisations in greater depth. It would also potentially require extra funding depending on the nature of ATWA’s involvement.

Accelerating Trade in West Africa (ATWA) – Stage 1 Final Report
79
12. REFERENCES
The primary references for this Part of the report are the corridor studies below undertaken by USAID and World Bank (by Nathan Ass):
Corridor: Dakar-Bamako
USAID PCE - Etude Des Couts Du Transport Sur Le Corridor Dakar, Bamako, 2011
Corridors: Abidjan-Bamako; Abidjan-Ouagadougou & Cotonou-Niamey
World Bank - Logistics Cost Study of Transport Corridors in Central and West Africa, Nathan Ass, 2013
Corridor: Tema-Ouagadougou
USAID West Africa Trade Hub (WATH):
Trends in Transport And Logistics on The Tema-Ouagadougou-Bamako Corridor, 2013
Transport and Logistics Costs on the Tema-Ouagadougou Corridor, 2010
Corridor: Lomé-Ouagadougou
USAID WATH - Transport and Logistics Costs on the Lomé-Ouagadougou Corridor, 2012
Corridor: Lagos-Kano-Jibiya
USAID NEXTT - Lagos-Kano-Jibiya (Lakaji) Corridor Performance: Baseline Assessment Report on The Time And Cost to Transport Goods, 2013)
In addition, the following reports on corridor projects prepared by the African Development Bank (AfDB) have been helpful:
Afdb: Project for Construction of the Dori-Tera Road and Transport Facilitation on the Ouagdougou-Dori-Tera-Niamey Corridor – July 2008
AfDB Mali/Senegal: Road Development and Transport Facilitation Project: The Southern Bamako-Dakar Corridor
AfDB: Project of Road Upgrading and Transport Facilitation on the Corridor Bamako-Zantiebougou-San Pedro - Project Nº: P-Z1-DB0-152
Progress reports on the World Bank corridor projects have also been useful:
WB-West Africa Regional Transport and Transit Facilitation Project, Implementation Status & Results Report April 8, 2015 (Bamako-Ouagadougou-Tema corridor)
ALCO/WB Projet Abidjan-Lagos Transport and Trade Facilitation Projects (ALTTFP) Rapport An 4: Juillet 2013 – Juin 2014
Information on road harassment and checkpoints come from USAID West Africa Trade Hub – these reports are available from the Borderless Alliance Website:
UEMOA/ West Africa Trade Hub, 23rd Road Governance Report - Survey Results for the first quarter of 2013
USAID Trade Hub, Lomé-Ouagadougou Corridor Road Governance Report, May 2013
USAID Trade Hub, Tema-Ouagadougou Corridor Road Governance Report, May 2013
USAID Trade Hub, Abidjan-Ouagadougou Corridor Road Governance Report, May 2013

Accelerating Trade in West Africa (ATWA) – Stage 1 Final Report
80
USAID Trade Hub, Dakar-Bamako Corridor Road Governance Report, May 2013
USAID Trade Hub, Ouagadougou-Bamako Corridor Road Governance Report, May 2013
Additional information was obtained from the Internet and newspaper articles, some of which are listed here:
Port Finance International, Nigeria moves forward with $1.5bn Lekki port, Friday, 29 August 2014
Combating Piracy in the Gulf of Guinea, The Africa Center for Strategic Studies, February 2015
Jeune Afrique, Côte d'Ivoire : les ports se remettent à flot, 17 février 2014
Jeune Afrique: Mediterranean Shipping Company peut-il réanimer le port de San Pedro? 04 Dec 2014
Jeune Afrique: Le Port de San Pedro cherche à lever 180 milliards de FCFA, 05 mars 2015
L’Economiste - Ligne ferroviaire Cotonou-Niamey : Bolloré va investir 700 milliards FCFA dans BENI Rail, 12 avril 2015
Daily Graphic - Police check extortion on ECOWAS transit corridors, April 18, 2015
Ghana News - Progress Made In Takoradi Port Expansion Project, Jan 13 2015