part 2 (ch9-12) - comfauna
TRANSCRIPT

PART II
Economic Considerations
Part 2 (ch9-12) 5/7/04 2:24 PM Page 137

Part 2 (ch9-12) 5/7/04 2:24 PM Page 138

9Economic Incentives for Sustainable Community Management
of Fishery Resources in the Mamirauá Sustainable Development Reserve, Amazonas, Brazil
JOÃO PAULO VIANA, JOSÉ MARIA B. DAMASCENO, LEANDRO CASTELLO,
AND WILLIAM G. R. CRAMPTON
The increasing demand for and degradation of limited resources by the rising hu-man population of the Amazon basin has precipitated a great deal of discussionabout the sustainable use of its natural resources (Hall 1997; Ayres et al. 1999). Forthe most part the fisheries of the Amazon basin are underexploited, and fishingpressure is concentrated on only a few species (Bayley and Petrere 1989; Cramptonand Viana 1999). Crampton et al. (this volume) provide a detailed account of thehistory and current status of floodplain fisheries in the Brazilian Amazon basin.Until the 1970s tambaqui (Colossoma macropomum) and pirarucu (Arapaima gi-gas) represented staple protein supplies in the Amazon basin. With the growth ofcommercial fishing fleets, these species began to show clear signs of overfishingand today are luxury food species (Petrere 1986; Costa 1992; Goulding, Smith, andMahar 1996). In the last two decades the detritivorous curimatá (Prochilodus nigri-cans) and jaraquis (Semaprochilodus spp.) have become the staple food species. Asyet, there is only anecdotal evidence for overfishing of these species (jaraqui sizesare decreasing in Manaus markets, V. Batista pers. comm.). The major challengein Amazon fisheries management is to avert a situation in which one species afteranother is depleted.
This article describes the principal activities and results of an experimental com-munity-based fisheries management initiative in the Reserva de DesenvolvimentoSustentável Mamirauá (Mamirauá Sustainable Development Reserve, or RDSM),a protected area of várzea floodplain in the Brazilian state of Amazonas. This re-serve covers 1,124,000 hectares and is delimited by the rivers Solimões, Japurá, andUatí-Paraná. The work reported here is centered on a smaller, 240,000-ha FocalArea, bordered by the Japurá and Solimões rivers and by a connection betweenthem, the Paraná Aranapu (fig. 9.1). Resident and user communities in or near thisreserve have exclusive access rights to fishing resources granted by its status as aconservation unit. In addition to providing strong economic incentives for the sus-
Part 2 (ch9-12) 5/7/04 2:24 PM Page 139

tainable management of fisheries, the program described here supplied scientificand technical support in the definition of sustainable quotas. The program stroveto improve the production efficiency of an existing fishery and to diversify itsspecies base—both important strategies for reducing the pressure on key commer-cial stocks (Crampton and Viana 1999).
[140] Economic Incentives
FIGURE 9.1 Organizational (political) sectors and Focal Area of the Mamirauá Sustainable De-velopment Reserve.
Part 2 (ch9-12) 5/7/04 2:24 PM Page 140

The RDSM was created in 1990 by the state of Amazonas and is one of thelargest areas of relatively intact várzea floodplains in the Brazilian Amazon. Thelakes, channels, and seasonally flooded forests of this unique ecosystem offer fishesa rich supply of vegetation, detritus, seeds, fruits, and invertebrates (Junk, Bayley,and Sparks 1989). The immense productivity and size of this reserve probablymeans that the area is a regionally important nursery ground for commercial foodspecies. Such resident species as pirarucu and tucunaré (Cichla spp.) pass their en-tire life cycle in the floodplain. Many species of migratory characiform fishes, suchas the detritivorous jaraquis and curimatá, spend the first years of their lives in thevárzea before migrating upstream to colonize other areas.
Crampton, Castello, and Viana (this volume) describe the human population ofthe RDSM. The principle economic activities of the area are fishing, agriculture,and timber extraction, which are undertaken seasonally and on a communal or fa-milial basis. The average annual income of families in the reserve is around US$900, of which 53% is spent on the purchase of food and basic supplies. Fishing rep-resents by far the most lucrative source of income in the reserve, forming 72% ofthe average domestic income (SCM 1996).
The management of natural resources in the RDSM is based upon an alliancebetween the local resident and user population and a multidisciplinary researchand extension project carried out by the Instituto de Desenvolvimento SustentávelMamirauá (Mamirauá Institute for Sustainable Development, or IDSM). The lo-cal people of the reserve are involved in making management decisions that recon-cile sustainable economic development with the conservation of biodiversity(Howard et al. 1995; SCM 1996; Crampton, Castello, and Viana this volume). Be-cause of their economic importance, fisheries resources represent a major focus ofmanagement initiatives in the reserve.
Research undertaken in the Mamirauá reserve and negotiations with local com-munities resulted in the development of a series of restrictive and advisory mea-sures designed to regulate fishery resource use in the area. These measures are out-lined in the reserve’s management plan (SCM 1996) and summarized byCrampton, Castello, and Viana (this volume). In addition to restrictive measures,the reserve’s management plan established a zoning system. This comprises a coreno-use zone surrounded by a zone designated for sustainable resource use by theresidents and user communities of the Reserve (fig. 9.1).
To promote the conservation of biodiversity, to stimulate the sustainable use ofnatural resources, and to improve the economic well being of the residents andusers of the Reserve, the IDSM is undertaking several extension programs in part-nership with the local communities. One of the most important programs, namedNovas Alternativas Econômicas (novel economic alternatives), aims to promote al-ternative economic activities, diversify income sources, and enhance existing activ-ities by either increasing production efficiency and/or by forging more lucrativemarketing arrangements. This initiative involves the organization and empower-ment of production groups, technical and administrative training, the constructionand implementation of new infrastructure, and the development of systems to keep
Economic Incentives [141]
Part 2 (ch9-12) 5/7/04 2:24 PM Page 141

track of the dynamic market conditions. The experimental fish commercializationinitiative described in this article is a central component of this Novas AlternativasEconômicas program.
THE FISH COMMERCIALIZATION PROGRAM
In 1998 an experimental Programa de Comercialização de Pescado (Fish Com-mercialization Program, or PCP) was implemented in one of the nine organiza-tional sectors of Focal Area of the reserve. The Jarauá Sector, which comprisesaround two hundred inhabitants in four communities, was selected for this experi-mental program for four reasons:
1. Its communities are located strategically at the entrance to the largest lake systemin the Focal Area.
2. Fishing represents the main economic activity.3. The communities have a relatively well organized social structure.4. The communities have a history of cooperation with the IDSM throughout the
installation of the reserve.
The program began with an economic viability study prepared by outside con-sultants. This study projected the scale of fisheries production in the area and pro-posed an operational structure and chronogram (Bostock 1998). It assisted with theearly planning of the program but underestimated the time and infrastructure thatwould be required.
Several meetings and consultations with the participating communities wereheld at the onset of the program in order to define the logistic and administrativeorganization necessary to stage a new fisheries production program. Trainingcourses in fish processing were also given in order to improve the quality of fish formarketing. Also, visiting instructors ran workshops on the structure and manage-ment of commercial associations and cooperatives. As far as possible, the tradition-al systems of fish production were maintained, or altered only so as to improve pro-ductivity without drastically altering the community organization.
There was, however, room for consensual experimentation. In the beginningone attempt was made to conduct communal pirarucu exploitation in which laborwas divided among the participants into fishing, transporting, and processing, andthe income then equally divided. This strategy was proposed because of the rela-tively small fishing quota allowed (see below) and the unequal distribution of fish-ing equipment (canoes, engines, ice chests, and tackle) among fishermen. Mostfishermen and the supporting staff felt that a communal organization with divisionof labor was more appropriate for such conditions. However, this approach was un-successful for several reasons. Friction developed around the division of duties andunequal division of labor. More importantly, pirarucu fishing is traditionally orga-nized on an individual or family level or by small teams composed mostly of rela-tives. In view of the failure of communal fishing arrangements, the organization of
[142] Economic Incentives
Part 2 (ch9-12) 5/7/04 2:24 PM Page 142
pirarucu fishing expeditions reverted to individual or small group affairs organizedby the fishermen themselves.
Following capture, fish are transported from the managed area to a processingbase located at the Jarauá community. The base comprises a covered floating raftwith a large icebox and water purifying system. This facility was built in partnershipwith the fishermen and serves as a base for eviscerating, cleaning, and chilling fish,as well as an administrative base for the fishing operations. The base allows up to 4 tons of fish and ice to be stored. When this limit is reached, the fish are trans-ported to the nearby city of Tefé in a boat dedicated to this program and equippedwith an ice hold. The fish are either sold in Tefé or sent to Manaus or other cities.The IDSM invested (at no cost to the fishermen) approximately US$ 15,000 capitalfunds into the construction of the floating fish processing base plus the purchase ofthe boat and some equipment and supplies (a scale, office supplies, ice chests,etc.). The participating fishermen contributed manual labor and wood for the base.
The most important feature of the PCP is the elimination of intermediaries(atravessadores) between the fishermen and the market. Intermediary purchaserstravel around the interior buying fishes at prices way below the market values. Mostof the transactions are based on an exchange of fish for household supplies, such ascooking oil, salt, sugar, and coffee, all of which are bartered at inflated prices. Byremoving intermediate purchasers and improving production quality of the fishproducts, the fishermen of the Jarauá Sector are able to achieve a far greater eco-nomic return with smaller landings of fishes. Fishing expenses are the responsibili-ty of the fishermen, while commercialization expenses are discounted proportion-ally from the sales. The profits are then divided according to the amounts andspecies of fishes captured by different fishermen. For team efforts the leader isresponsible for paying the others according to the arrangements made with hispartners.
The original proposal of the PCP was for fishermen of the Jarauá Sector to avoidcapturing species which are prohibited by IBAMA bans and to capture fish onlyabove legal minimum sizes. The idea was to divert fishing pressure toward specieswithout capture restrictions and toward those for which there is no evidence of cur-rent overfishing (Bostock 1998). However, from the onset it became clear that onlya few species, including pirarucu and tambaqui, were capable of generating suffi-cient profits to make the PCP an economically viable operation.
THE PROBLEMS OF PIRARUCU AND TAMBAQUI
Pirarucu is the most economically important species of fish for the residents andusers of the RDSM (Queiroz and Sardinha 1999). It made up around 40% of the to-tal weight of fish landed for sale and local consumption in the early 1990s. In sixcommunities between 1993 and 1995, an average annual catch of between 1.4 and1.6 tons was registered. On the basis of this information, the annual capture of pi-rarucu in the Focal Area of the reserve was estimated to be in the order of 110 to 150
Economic Incentives [143]
Part 2 (ch9-12) 5/7/04 2:24 PM Page 143
tons. The production of pirarucu occurs mostly during the low-water months ofSeptember to December. Queiroz and Sardinha (1999) showed that only 30% ofthe landed pirarucu were larger than the legal minimum total length (TL) of 1.5 m.This shortfall indicated that the species was being exploited beyond a maximumsustainable yield in some parts of the Reserve.
These studies led to the establishment of pirarucu fishing guidelines in thereserve’s management plan (SCM 1996). The closed season and minimum cap-ture size follow those established by federal legislation (IBAMA decrees 480/1991and 8/1996). However, other guidelines imposed by IDSM were more restrictive.IBAMA decree 14-N/1993 established legal minimum sizes for the salted and sun-dried flanks (mantas) off pirarucu at 1 meter, effectively allowing the landing andcommercialization of pirarucu well below 1.5 m TL. Instead, the Mamirauá man-agement plan set limits of 1.15 m for salted and dried mantas and 1.25 m for freshmantas. Given the economic importance of pirarucu, these restrictions on thecommercialization of mantas were predictably unpopular with the reserve’s resi-dents and created some animosity towards the IDSM. Nonetheless, they were con-sidered necessary to regulate pirarucu fishing, along with other measures proposedby reserve residents and users. These measures included a minimum gill net meshsize for pirarucu fishing (29 cm measured across opposed angles) and the prohibi-tion of fishing soon after the water level starts to drop, extending until the flood-plain lakes become isolated.
From 1996 onwards the IBAMA representation in Amazonas declared pirarucustocks to be in a critical stage of overexploitation and established a two-yearstatewide ban on the capture and commercialization of this species. This ban wasenacted by prohibiting fishing from June through November because a 1996 de-cree by the IBAMA head office in Brasília had already banned fishing from De-cember through May every year throughout the Amazon basin (a period thatroughly corresponds to the species reproductive season). So far this statewide sus-pension of pirarucu fishing has been renewed twice without interruption, andthere are no indications that it will be lifted in the near future.
The ban ruled out the possibility of legal pirarucu fishing within the RDSM, inprinciple resulting in a potentially significant decline in income for the residentcommunities. Tambaqui fishing is still permitted by IBAMA, with a minimumlanding size of 55 cm TL (IBAMA decree 8/1996) and a closed season, which lastsfrom three to four months and varies in exact dates from year to year (IBAMA de-crees 6/1996 and 142/2001). The minimum size of 55 cm TL drastically complicatesthe capture of tambaqui in the reserve. Tambaqui spend the first five years or so oftheir life in floodplain lakes and forests and then, as adults (above around 55 cmTL) undertake upstream migrations along main whitewater river channels (Gould-ing 1979; Costa, Barthem, and Correa 1999). Only around 5% of the tambaquis inthe floodplain lakes of the RDSM are larger than the legal minimum size of 55 cmTL (Costa, Barthem, and Correa 1999).
[144] Economic Incentives
Part 2 (ch9-12) 5/7/04 2:24 PM Page 144
RESOLVING THE PROBLEM OF PIRARUCU
From the onset of the PCP the biggest difficulty was related to the restrictionsplaced on the species with highest commercial value. The participating fishermenmade it clear that the initiative would not generate financial returns unless piraru-cus were involved. A monitoring system was implemented in early 1998 with theobjectives of evaluating local fish production and identifying alternative species forextraction. The first results made it clear that the fishermen were right. Without pi-rarucu and tambaqui the yields of other species when weighed against productionexpenses would not generate profits.
The IBAMA decrees banning pirarucu since 1996 do allow for the controlledcapture and commercialization of the species provided that they derive from bonefide managed fisheries. The PCP therefore proposed a system of managed pirarucuextraction involving a rotation system in thirty-one of the eighty lakes in the sus-tainable use zone of the Jarauá Sector. This proposal, requesting an initial quota of3 tons of pirarucu for the late 1999 season, was submitted to IBAMA-Amazonas andaccepted in June 1999. The quota was based on a previously published estimate ofpirarucu production in várzeas of the Peruvian Amazon at around 0.3 kg/ha/year(Bayley et al. 1992). The Jarauá Sector comprises 56,300 ha of floodplain lakes andforests, allowing a crude production estimate of around 15 tons/year of pirarucu inthe sector (assuming that the area is under low-fishing pressure). Considering anaverage weight of 40 to 50 kg for a 1.55 m pirarucu, this production corresponds toan annual harvest of 375 fish. The quota was set at a conservative one-third of thisnumber in order to err on the side of caution during the beginning of this programand to review the results thereafter.
The first year’s quota of 3 tons was significantly below the previous levels of pi-rarucu fishing in the Jarauá Sector. Monitoring data in the peak productionmonths of September to December 1998 showed a total landing of around 600 pi-rarucu (12 tons of mantas), of which at least 95% were below the legal minimumlength of 1.5 m. We later learned from the fishermen themselves that the numberwas actually higher, maybe around eighteen to twenty tons of mantas, because the fishermen smuggled part of the production. Of course, due to the continuingIBAMA ban on pirarucu fishing, all these fish were illegally captured, includingthose above the minimum size. Even though the 3-ton quota was well below previ-ous harvesting levels, the fishermen of the Jarauá Sector were satisfied to reduceproduction and to follow all of the RDSM fisheries guidelines in return for beingable to sell IBAMA certified legal pirarucu and to avoid intermediary purchasers.
In the PCP’s second year (late 2000 season), a new tool became available tomonitor pirarucu stocks. This tool was a direct counting method conducted as acollaboration between local pirarucu fishermen and a researcher from IDSM(Castello in press). Pirarucu are obligatory air breathers and betray their presenceto fishermen when they rise to gulp air from the surface. Using a combination of
Economic Incentives [145]
Part 2 (ch9-12) 5/7/04 2:24 PM Page 145

auditory and visual cues, experienced fishermen are able to distinguish betweenseveral fish surfacing at the same time and are able even to estimate the approxi-mate size of the fish. These abilities, when used in the context of quantitativemethods, yield replicable information about pirarucu numbers in floodplain lakes.This direct count methodology was compared to independent estimates of piraru-cu population sizes from mark-release-recapture studies in floodplain lakes (at lowwater) and proved to be very accurate for fish larger than 1 m TL (Castello in press).Once the accuracy of this method had been established, it was then employed tomonitor pirarucu stocks and to calculate sustainable landing quotas in the JarauáSector.
POLITICAL INTEGRATION OF THE PCP IN THE JARAUÁ SECTOR
Each organizational sector of the RDSM operates as a separate entity with its ownlocal coordinator responsible for organizing bimonthly meetings. These meetingsprovide a forum to discuss and resolve community-related issues and disputes. Thisorganizational structure is modeled on the rural community projects of theCatholic Church. Working at the sector instead of community level helped to dis-tribute the benefits of the PCP to more people and also to increase the number ofpeople trained to undertake duties for the PCP. In the beginning management wasset up in an informal manner and consisted of a technical coordinator (held by anIDSM technician) and a community coordinator (elected by the participating fish-ermen). A formal terms-of-agreement document was drafted in which the fisher-men agreed to support the PCP work by maintaining the infrastructure (boat andfloating fish processing base), guarding the lakes selected for rotation, and enforc-ing the rotation system. The final, formal, organizational structure and the neces-sary delegations of responsibility were left for the fishermen to develop.
As the discussions evolved, the communities opted to register the PCP as part ofa formal production association (Associação de Produtores do Setor Jarauá), mar-keting not just fish but also agricultural produce and artisanal products, such aspottery and basketwork. A decision was made to extend the PCP infrastructure tothe storage and transport of agricultural and artisanal products. The formation of aproduction association also allowed the formal inclusion of women. The presenceof women was significant from the administrative point of view because it increasedthe possibility of finding people with skills to assume such tasks as record keepingand accounting. Most fishermen are illiterate, whereas literacy rates are higheramong women. By the time the production association was formally registered inJuly 2001, the associates had already assumed most of the administrative and tech-nical duties originally assumed by extension workers and community assistantsfrom IDSM. Several women were elected to administrative posts, among them sec-retary and accountant. Currently, technicians from IDSM support the associationmainly by establishing contacts with fish buyers outside Tefé (because of commu-nication difficulties from the RDSM).
[146] Economic Incentives
Part 2 (ch9-12) 5/7/04 2:24 PM Page 146
The legal registration of the production association permits marketing outsidethe state of Amazonas. In 2001 a contract was signed to supply a chain of restaurantsin Brasilia with a major part of the annual pirarucu quota at an excellent price of8.00 Brazilian Reais (R$) per kilo (exchange rate in 2001 was approximately $US 1= R$ 2.3–2.7). The restaurant chain in turn was able to provide its customers withenvironmentally friendly pirarucu purchased legally and derived from managedfisheries in an area protected for biodiversity conservation.
ECONOMIC, SOCIAL, AND ECOLOGICAL RESULTS
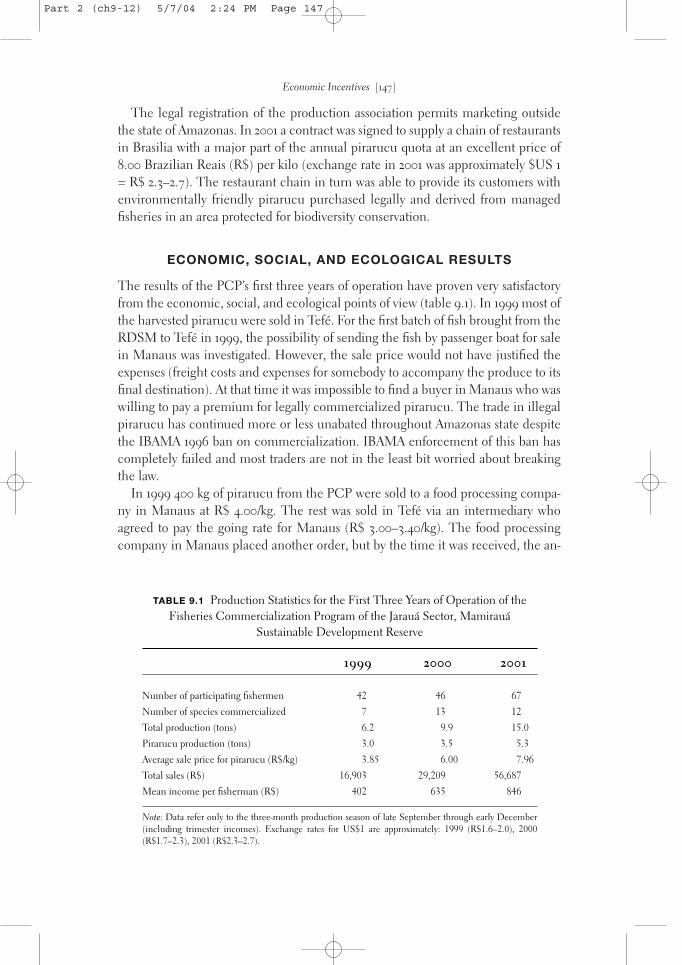
The results of the PCP’s first three years of operation have proven very satisfactoryfrom the economic, social, and ecological points of view (table 9.1). In 1999 most ofthe harvested pirarucu were sold in Tefé. For the first batch of fish brought from theRDSM to Tefé in 1999, the possibility of sending the fish by passenger boat for salein Manaus was investigated. However, the sale price would not have justified theexpenses (freight costs and expenses for somebody to accompany the produce to itsfinal destination). At that time it was impossible to find a buyer in Manaus who waswilling to pay a premium for legally commercialized pirarucu. The trade in illegalpirarucu has continued more or less unabated throughout Amazonas state despitethe IBAMA 1996 ban on commercialization. IBAMA enforcement of this ban hascompletely failed and most traders are not in the least bit worried about breakingthe law.
In 1999 400 kg of pirarucu from the PCP were sold to a food processing compa-ny in Manaus at R$ 4.00/kg. The rest was sold in Tefé via an intermediary whoagreed to pay the going rate for Manaus (R$ 3.00–3.40/kg). The food processingcompany in Manaus placed another order, but by the time it was received, the an-
Economic Incentives [147]
TABLE 9.1 Production Statistics for the First Three Years of Operation of theFisheries Commercialization Program of the Jarauá Sector, Mamirauá
Sustainable Development Reserve
1999 2000 2001
Number of participating fishermen 42 46 67
Number of species commercialized 7 13 12
Total production (tons) 6.2 9.9 15.0
Pirarucu production (tons) 3.0 3.5 5.3
Average sale price for pirarucu (R$/kg) 3.85 6.00 7.96
Total sales (R$) 16,903 29,209 56,687
Mean income per fisherman (R$) 402 635 846
Note: Data refer only to the three-month production season of late September through early December(including trimester incomes). Exchange rates for US$1 are approximately: 1999 (R$1.6–2.0), 2000(R$1.7–2.3), 2001 (R$2.3–2.7).
Part 2 (ch9-12) 5/7/04 2:24 PM Page 147

nual quota of 3 tons had already been reached. The next year, with a renewal ofIBAMA authorization for PCP pirarucu landings, the same company purchasedthe entire PCP quota of pirarucu at R$ 6.00/kg. The other species captured in 1999and 2000 were sold mostly in Tefé. The complete list of fish species exploited byPCP is presented in table 9.2.
Socioeconomic monitoring in one of the communities of the Jarauá Sector, SãoRaimundo do Jarauá, showed that, despite the restrictions in fishing (all fishes werecaptured in accordance with minimum size regulations and closed seasons estab-lished by law and by the Mamirauá Management Plan) and despite the overall re-duction in pirarucu landings, there was no attendant reduction in annual family in-comes. On the contrary, average family incomes increased from around R$ 1,900in 1995 to R$ 2,700 in 1998/1999 and to R$ 4,100 in 2000. Using as a reference pointa cesta básica (a standardized shopping basket of household supplies used byBrazilian social scientists for economic surveys), the buying power of São Raimun-do do Jarauá doubled from 1995 to 2000 (table 9.3). Unfortunately, due to the waythe data were collected, it was not possible to calculate the proportion of the annu-al wage derived from fishing. However, we believe that the contribution of fishingwas significant because no other major revenue-generating activity was introducedin Jarauá during this period.
All fish commercialized by the PCP were above the legal minimum size limits
[148] Economic Incentives
TABLE 9.2 Total Capture (TC, in kg) and Average Sale Price (ASP, in R$) for the FishSpecies Commercialized by PCP from 1999 through 2001
1999 2000
species
TC (kg)
ASP (R$)
TC (kg)
ASP (R$)
TC (kg)
ASP (R$)
Pirarucu Arapaima gigas 3000.0 3.60 3377.0 6.00 5285.0 7.96
Aruanã Osteoglossum bicirrhosum — — 1042.0 0.22 4380.0 0.46
Tambaqui Colossoma macropomum 2166.6 2.34 2524.0 2.07 2921.00 2.87
Pirapitinga Piaractus brachypomus — — — — 40.0 1.00
Caparari Pseudoplatystoma tigrinum 73.4 1.89 754.8 1.92 401.0
Surubim Pseudoplatystoma fasciatum — — 30.5 1.46 5.0 0.60
Dourada Brachyplatystoma flavicans — — 217.5 1.39 96.0 2.15
Filhote Brachyplatystoma filamentosum — — 219.0 1.44 551.5 2.43
Pirarara Phractocephalus hemiliopterus — — 116.0 0.71 211.0 0.56
Pacamum Paulicea lutkeni — — 21.0 0.85 — —
Pescada Plagiocion squamosissimus 11.5 0.85 — — 2.0 0.80
Tucunaré Cichla monoculus 879.0 0.92 1188.5 0.93 565.0 2.19
Acará-açu Astronotus ocellatus 84.0 1.00 230.5 0.52 586.0 0.64
Acará-branco Chaetobranchus flavescens — — 84.5 0.69 — —
2001
scientific name
2.33
Part 2 (ch9-12) 5/7/04 2:24 PM Page 148
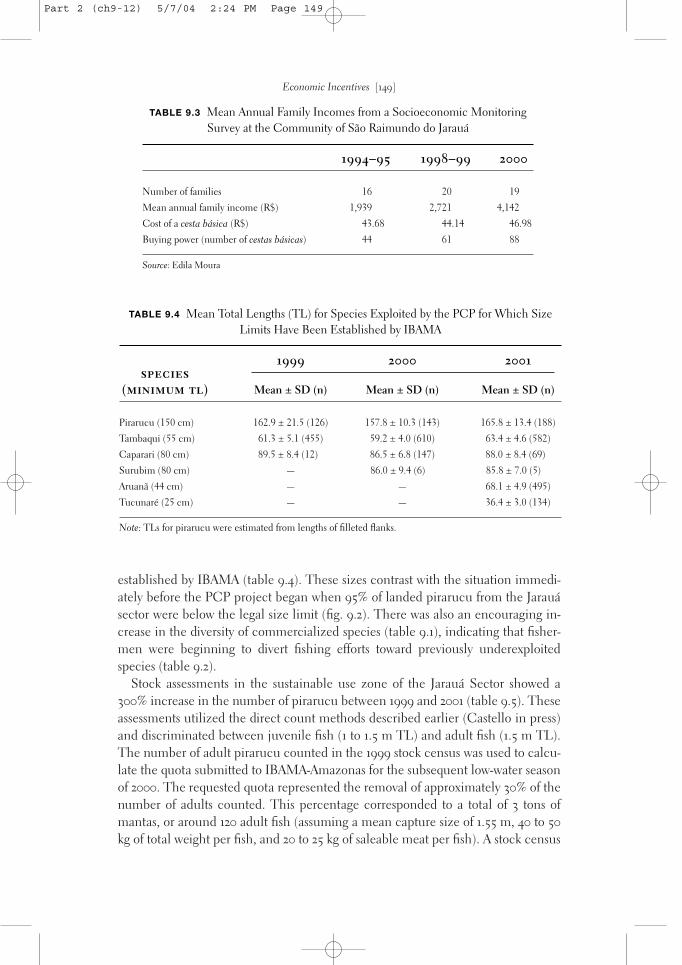
established by IBAMA (table 9.4). These sizes contrast with the situation immedi-ately before the PCP project began when 95% of landed pirarucu from the Jarauásector were below the legal size limit (fig. 9.2). There was also an encouraging in-crease in the diversity of commercialized species (table 9.1), indicating that fisher-men were beginning to divert fishing efforts toward previously underexploitedspecies (table 9.2).
Stock assessments in the sustainable use zone of the Jarauá Sector showed a300% increase in the number of pirarucu between 1999 and 2001 (table 9.5). Theseassessments utilized the direct count methods described earlier (Castello in press)and discriminated between juvenile fish (1 to 1.5 m TL) and adult fish (1.5 m TL).The number of adult pirarucu counted in the 1999 stock census was used to calcu-late the quota submitted to IBAMA-Amazonas for the subsequent low-water seasonof 2000. The requested quota represented the removal of approximately 30% of thenumber of adults counted. This percentage corresponded to a total of 3 tons ofmantas, or around 120 adult fish (assuming a mean capture size of 1.55 m, 40 to 50kg of total weight per fish, and 20 to 25 kg of saleable meat per fish). A stock census
Economic Incentives [149]
TABLE 9.3 Mean Annual Family Incomes from a Socioeconomic MonitoringSurvey at the Community of São Raimundo do Jarauá
1994–95 1998–99 2000
Number of families 16 20 19
Mean annual family income (R$) 1,939 2,721 4,142
Cost of a cesta básica (R$) 43.68 44.14 46.98
Buying power (number of cestas básicas) 44 61 88
Source: Edila Moura
TABLE 9.4 Mean Total Lengths (TL) for Species Exploited by the PCP for Which SizeLimits Have Been Established by IBAMA
species
1999 2000 2001
(minimum tl) Mean ± SD (n) Mean ± SD (n) Mean ± SD (n)
Pirarucu (150 cm) 162.9 ± 21.5 (126) 157.8 ± 10.3 (143) 165.8 ± 13.4 (188)
Tambaqui (55 cm) 61.3 ± 5.1 (455) 59.2 ± 4.0 (610) 63.4 ± 4.6 (582)
Caparari (80 cm) 89.5 ± 8.4 (12) 86.5 ± 6.8 (147) 88.0 ± 8.4 (69)
Surubim (80 cm) — 86.0 ± 9.4 (6) 85.8 ± 7.0 (5)
Aruanã (44 cm) — — 68.1 ± 4.9 (495)
Tucunaré (25 cm) — — 36.4 ± 3.0 (134)
Note: TLs for pirarucu were estimated from lengths of filleted flanks.
Part 2 (ch9-12) 5/7/04 2:24 PM Page 149

(based on the same methodology) in the low-water season of 2000 was used to planthe quota for the subsequent harvest in 2001. For 2001 a quota of 8 tons, correspon-ding to around 300 fishes, was submitted to IBAMA.
Before the 2001 season began, the fishermen proposed to relax the lake rotationsystem rules in favor of choosing lakes on a year-to-year basis. Fishing and accessconditions to any given lake vary considerably from year to year, making it difficultto stick to a rigid schedule. In fact, some lakes are almost impossible to enter dur-ing very dry low-water periods. Such was the rate of increase of pirarucu stocks in
[150] Economic Incentives
FIGURE 9.2 Histogram of size classes for pirarucu captured by communities in the Jarauá Sectorof the Mamirauá Sustainable Development Reserve in the low water periods (September throughDecember) of 1998–2001.
Part 2 (ch9-12) 5/7/04 2:24 PM Page 150
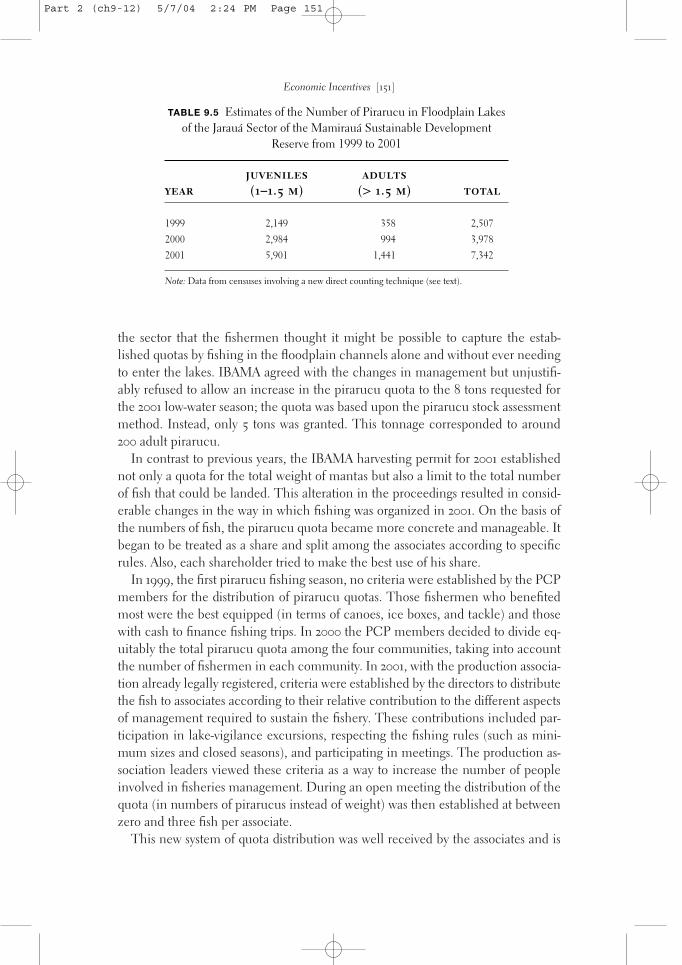
the sector that the fishermen thought it might be possible to capture the estab-lished quotas by fishing in the floodplain channels alone and without ever needingto enter the lakes. IBAMA agreed with the changes in management but unjustifi-ably refused to allow an increase in the pirarucu quota to the 8 tons requested forthe 2001 low-water season; the quota was based upon the pirarucu stock assessmentmethod. Instead, only 5 tons was granted. This tonnage corresponded to around200 adult pirarucu.
In contrast to previous years, the IBAMA harvesting permit for 2001 establishednot only a quota for the total weight of mantas but also a limit to the total numberof fish that could be landed. This alteration in the proceedings resulted in consid-erable changes in the way in which fishing was organized in 2001. On the basis ofthe numbers of fish, the pirarucu quota became more concrete and manageable. Itbegan to be treated as a share and split among the associates according to specificrules. Also, each shareholder tried to make the best use of his share.
In 1999, the first pirarucu fishing season, no criteria were established by the PCPmembers for the distribution of pirarucu quotas. Those fishermen who benefitedmost were the best equipped (in terms of canoes, ice boxes, and tackle) and thosewith cash to finance fishing trips. In 2000 the PCP members decided to divide eq-uitably the total pirarucu quota among the four communities, taking into accountthe number of fishermen in each community. In 2001, with the production associa-tion already legally registered, criteria were established by the directors to distributethe fish to associates according to their relative contribution to the different aspectsof management required to sustain the fishery. These contributions included par-ticipation in lake-vigilance excursions, respecting the fishing rules (such as mini-mum sizes and closed seasons), and participating in meetings. The production as-sociation leaders viewed these criteria as a way to increase the number of peopleinvolved in fisheries management. During an open meeting the distribution of thequota (in numbers of pirarucus instead of weight) was then established at betweenzero and three fish per associate.
This new system of quota distribution was well received by the associates and is
Economic Incentives [151]
TABLE 9.5 Estimates of the Number of Pirarucu in Floodplain Lakesof the Jarauá Sector of the Mamirauá Sustainable Development
Reserve from 1999 to 2001
year
juveniles
(1–1.5 m)
adults
(> 1.5 m) total
1999 2,149 358 2,507
2000 2,984 994 3,978
2001 5,901 1,441 7,342
Note: Data from censuses involving a new direct counting technique (see text).
Part 2 (ch9-12) 5/7/04 2:24 PM Page 151
expected to be maintained for the future. The results from 2001 demonstrate thateach fisherman made the best of the quota he received by selecting and cullinglarger fishes that would give a better financial return. The average pirarucu yielded28.2 kg of mantas in 2001, as compared with 23.8 kg in 1999 and 24.5 kg in 2000.The average size of captured pirarucu reached 1.6 m in 2001 (fig. 9.2), its highestlevel since the onset of the PCP.
FINAL CONSIDERATIONS
In just three years of operation, the Fish Commercialization Program of the JarauáSector has proven to be a viable model for the management of várzea fisheries.During this time many operational problems were identified and resolved. One ofthe greatest sources of difficulties was the complex infrastructure and the mainte-nance of a boat. For example, the Port Authority requires specific training for boatcrews, including at least one skipper and one mechanic. Four fishermen volun-teered to take the required courses offered by the navy and gained the necessarydiplomas and documents. Another problem was that the administrative affairs ofthe PCP require the dedicated full-time attention of at least two people. The asso-ciation consequently provided two salaried positions for two organizers and paid asalary from R$ 150 to 250 per month (depending upon the number of active fisher-men since each contributed with a share of R$ 5 to make up the salary). In the enda small number of people assumed multiple tasks, including administration, boatpiloting, and participating in sales trips. In the future more people are expected tobecome involved and the workload to be spread more comfortably.
Administrative delays at IBAMA proved to be one of the greatest sources of diffi-culties in the development of the Jarauá PCP. Large amounts of complex paper-work attended almost every stage of the proceedings and the resulting permits anddocuments were sometimes issued late. In 2001, for example, IBAMA permits forcapture and commercialization of pirarucu arrived at the end of October, alreadytwo months into the low-water fishing season. This delay left only one month forthe fishing quotas to be met, in contrast to the two to three months of the previoustwo years. The short fishing season made it impossible for the association to meetthe quota, and only 188 of the 200 authorized pirarucu were caught.
The most important contribution of this experimental Fisheries Commercial-ization Program is that it proves the feasibility of exploiting high-value species atgood prices while at the same time allowing stocks to increase through a programof combined management, vigilance, and monitoring. The community-based pro-duction association was able to manage its own affairs with initial—and thereafteroccasional—technical assistance from the outside, demonstrating that communi-ties can incorporate new systems and build upon them.
The general model developed in Jarauá may be a powerful tool for the manage-ment and conservation of fishery resources in other parts of the Amazon basin. Thedirect counting method for assessing pirarucu stocks was also considered to be vital
[152] Economic Incentives
Part 2 (ch9-12) 5/7/04 2:24 PM Page 152

to the success of this program. This tool represents the integration of traditionalknowledge with scientific methodology, and helped tremendously with the intro-duction of fisheries management principles to the communities. This method is al-ready being successfully taught to fishermen from other areas of the Amazon basin,such as the Santarém region in the Brazilian state of Pará, the Pacaya-Samiria Na-tional Reserve in Peru and Guyana. In fact, it is currently under consideration bythe Guyanese government as a tool in the country’s strategy to promote the recov-ery and sustainable use of the pirarucu stocks.
The positive results of the PCP in the Jarauá Sector have attracted much interestfrom fishermen in other sectors of the Mamirauá Reserve and of the adjacent 2.3million-ha Amanã Sustainable Development Reserve. Several communities ofthese other areas have requested technical assistance to develop similar programs.Nonetheless, the PCP system in the Jarauá Sector was expensive to set up and tooka long time to be implemented by and integrated with the communities. We con-clude that the ideal solution would be to implement similar but less complex, low-cost systems adapted to local ecological and socioeconomic conditions. These ini-tiatives could, for example, rely on hiring boats for the transport of fish rather thaninvesting in the purchase and maintenance of vessels. Replicating simplified andless expensive systems based upon the Jarauá model of fisheries production andmanagement would allow more communities to benefit in a shorter time frame.
In 2001 a simpler fisheries production program was initiated in the Tijuaca Sec-tor of the Mamirauá Reserve. The initial results were promising, but delays in theliberation of IBAMA capture and commercialization permits for pirarucu meantthat in its first year of operation the Tijuaca PCP only had time to land 40 of a totalquota of 120 pirarucus before the season closed. In 2002 two other simplified pro-grams will be launched, one targeting the Fishermens Association of the nearbytown of Maraã (around 160 members) and the other assisting the seven communi-ties in the Coraci Sector of the Amanã Reserve (benefiting around 400 people).Both projects have been submitted to IBAMA and are currently being appraised.
Since 2001 IBAMA-Amazonas streamlined its internal procedures. The permitsfor the Jarauá sectors (500 pirarucus or approximately 15 tons of mantas) and Tijua-ca (120 pirarucus or approximately 3 tons of mantas), with the full quotas requestedby the fishermen through the stock assessment method, were issued in late June2002. We expect that the results for Maraã and Coraci projects (120 pirarucus each)will be out well before the beginning of the fishing season, allowing time for thefishermen to plan ahead for their first pirarucu management experience.
The Jarauá fisheries management system, which began in 1999 with merely 3tons of pirarucu, is now ready to harvest 15 tons of legally caught and sized fish. Onthe basis of ongoing monitoring of pirarucu stocks, we expect that the total produc-tion of the four ongoing systems will double next year. This significant increase isexpected because only a fraction of the full potential of the Maraã and Coraci sys-tems will be harvested this year. On the basis of the direct counting method, thefishermen from Maraã, for example, could start harvesting 400 fish in the first year.
Economic Incentives [153]
Part 2 (ch9-12) 5/7/04 2:24 PM Page 153

However, they preferred to begin on a smaller scale and review the situation after-wards. In the case of Coraci the first quota was based on a stock assessment surveyusing the direct count method in a representative subset of the available lakesmade two years ago. After this survey, and in the expectation of having a pirarucumanagement system for this area, the fishermen decided to completely ban fishingfor commercialization purposes. They wanted pirarucu stocks to recover and tostart harvesting them in a different, sustainable manner. In a four to five year timeframe and with the addition of new community fisheries management systems, weexpect that the total production of wild pirarucu in the Mamirauá and Amanã re-serves will reach 100 to 150 tons per year.
Today, the Mamirauá Institute is working on the development of a large-scalemodel for the implementation of this new generation of simplified community-based fisheries management programs around the várzeas of the Brazilian Amazon.Simplicity, technical practicability, and the ability to mould new initiatives aroundpreexisting local conditions are fundamental principles for the successful planningand implementation of such initiatives. The role of technicians will be mostly lim-ited to training fishermen in procedures for stock assessment (for pirarucu and oth-er species), methods for setting quotas, basic management principles, fish process-ing techniques, and association management. The commercialization of theharvests, and the day-to-day running of production associations will be the respon-sibility of the associates themselves. Due to communication difficulties, communi-ties at great distances from markets are placed at a considerable disadvantage in es-tablishing commercial contacts. These cases would probably need the interventionof technicians from such organizations as IDSM. Likewise, the technical reports re-quired from community fisheries programs by IBAMA would probably need to becompiled by experienced fisheries technicians for most communities.
ACKNOWLEDGMENTS
We thank Dr. José Márcio Ayres for the invitation and support to work in the Instituto Mamirauá.Funding was provided by Conselho Nacional de Desenvolvimento Científico e Tecnológico andthe U.K. Department for International Development. Support also came from the Instituto deProteção Ambiental do Estado do Amazonas and the Instituto Brasileiro do Meio Ambiente e dosRecursos Naturais Renováveis do Amazonas. Finally, special thanks to Saide Pereira, AntonioMartins, and the fishermen of the Jarauá Sector who over the last four years have taught us the re-alities of fishing and living in the Amazon floodplain.
[154] Economic Incentives
Part 2 (ch9-12) 5/7/04 2:24 PM Page 154
10Community Ownership and Live Shearing
of Vicuñas in Peru
EVALUATING MANAGEMENT STRATEGIES AND THEIR SUSTAINABILITY
CATHERINE T. SAHLEY, JORGE TORRES VARGAS,
AND JESÚS SÁNCHEZ VALDIVIA
In 1994, after years of being listed under Appendix I of the CITES convention,vicuña (Vicugna vicugna: Camelidae) populations in Peru were reclassified as anAppendix II species. Under this classification Peru obtained permission to exportfiber from animals captured in their wild state, partially shorn, and then released.In 1995 the Peruvian government passed Law # 26496, “System of regulation ofproperty, commercialization and sanctions for the hunting of vicuñas, guanacos,and their hybrids.” The purpose of the law was to give Andean campesinos a directinterest in the conservation of the vicuña and to motivate them to participate inconservation efforts. This law includes the following components:
1. It gives usufruct rights of vicuñas to communities if such animals are found with-in community boundaries and also the rights to a portion of profits from the saleof vicuña fiber
2. It gives the communities the responsibility of management and “rational” use ofthe vicuña
3. It enacts legal penalties for poaching that range from two to twenty-five years im-prisonment, depending on the gravity of the crime committed (El Peruano, July11, 1995).
This law represents a new focus for conservation efforts of the vicuña in Peru.Campesino communities are legally recognized entities, which by and large, aremade up of Andean indigenous peoples. As of 1998, 5,666 campesino communitieswere legally registered, and 3,956 have legal title to their land (Velasquez 2001).With the granting of exclusive usufruct and management rights to communities,the vicuña has in effect ceased to be a totally public resource. The capture, live-shearing, and release program (called the chaku in Quechua) offers many possibil-ities for the sustainable utilization of the vicuña in Peru and other South American
Part 2 (ch9-12) 5/7/04 2:24 PM Page 155

countries. However, many aspects of the current management program need to becarefully evaluated, and an urgent need exists for studies that generate informationon the biological and economic costs and benefits of the program.
In the present article we review the most common management systems that arebeing utilized in Peru and examine the results of the program in terms of fiber har-vests and economic gain. We also present data obtained for the communities ofTambo Cañahuas, and Toccra in Arequipa, Peru, with the objective of highlightingsome of the current limitations of the management program. Finally, we presentsome conclusions and recommendations regarding the implementation of the live-shearing program in Peru.
BACKGROUND
PRESENT MANAGEMENT PLANS
Several management plans proposed by the government are currently being imple-mented. The first is the capture, live-shearing, and release program of free-rangingvicuñas; a program that has been approved by CITES. Once a year, each commu-nity implements the capture/live-shearing/release activity that should occur be-tween May and November. The actual scheduling of the chaku varies greatlyamong communities and is influenced by a variety of factors, such as communityactivities that may or may not conflict with optimal capture dates, logistic con-straints regarding the availability of appropriate capture equipment, and the orga-nizational capacity of each community.
The primary method utilized for the live capture and shearing of vicuñas is theuse of a temporary capture corral made of fishnetting 2 m in height. Communitymembers hide behind bushes or in trenches and run behind the vicuñas carrying acolorfully flagged rope once the vicuñas have entered the capture zone. Thevicuñas try to escape but are hampered by the funnel-shaped capture area. Finally,if the roundup is successful, the vicuñas are herded into a smaller mesh-shapedcorral from which they cannot escape. They are then captured by hand, shorn (ei-ther with scissors or electric shears), and released.
The second plan, which is being pursued aggressively by the state and its exten-sion workers, is the capture of vicuñas in the wild, followed by their subsequenttransfer to corrals that are generally 500-1000 ha in size. The size of corrals varies,and currently, there are no published standards about management requirementsof vicuñas that are kept in corrals. A third plan consists of a repopulation program,wherein animals caught in more populated areas are transferred to communitiesthat have few vicuñas. These animals are not released but are maintained incorrals.
All participating communities are required to formally organize vicuña manage-ment committees and to register with the government in order to participate in thefiber-shearing and marketing program. They are also required to organize an-
[156] Community Ownership and Live Shearing
Part 2 (ch9-12) 5/7/04 2:24 PM Page 156

tipoaching patrols, reinvesting a portion of proceeds from the sale of fiber to thisend.
POTENTIAL COSTS AND BENEFITS OF THE CURRENT MANAGEMENT PLANS
Some concerns have been expressed about the techniques employed (Bonacic1996; Wheeler and Hoces 1997), especially regarding the levels of stress experi-enced by the animals and its effect on their subsequent well-being. Few data existon the effect of capture and shearing on rates of mortality, fertility, and social struc-ture of vicuñas in the wild. Bonacic (1996) studied levels of stress in animals cap-tured and shorn in Chile. Working only with males and following them for eightdays in captivity, he showed that capture increased cortisol secretion for two daysbut that, in and of itself, stress from capture did not contribute directly to vicuñamortality. Instead, Bonacic’s 1996 results suggest that perhaps a more importantfactor affecting mortality is lowered body temperature because of shearing, whichleads to decreased immunological response. His data show that total and partialbody shearing caused respiratory disease in some cases, with completely shorn ani-mals suffering higher mortality than partially shorn animals. Captured, but notshorn, animals did not suffer any mortality during the study.
Bonacic’s work highlights the importance of including physiological stress asone factor in vicuña management plans. Stress could be especially important forpregnant females, which in many cases are gestating and lactating at the same timeand have high energetic requirements. Thus, time of year and climate is likely animportant factor to consider when scheduling shearing. Presently in Peru the cap-ture and shearing of vicuñas starts in winter (June) and continues until spring (No-vember). This long shearing season is due to the lack of sufficient capture netting,which necessitates preparing a timetable for transporting and sharing equipment.
Since the widespread commercial exportation of fiber products began in 1995,management of the vicuñas has moved in the direction of animal husbandry pro-posals and projects to the detriment of investment in wildlife management initia-tives. In 1996 a new management proposal was devised via an agreement betweenthe National Breeders Society, the Ministry of Agriculture, and CONACS (Conse-jo Nacional de Camelidos Sudamericanos, or the National Council for SouthAmerican Camelids). This proposal, “Convenio de Coóperacion InterinstitucionalPara el Uso Sustentable de la Vicuña,” significantly changed the scope of the free-ranging/capture/live-shear program previously in place. It outlined a new Ministryof Agriculture project, Programa de fortalecimiento de la competitividad comunalen la crianza de vicuñas (Program to strengthen community competitiveness in thebreeding and care of vicuñas).
One of the major premises of this program was that “sustainable use modules’’,or large corrals, were more efficient, productive, and profitable than the free-rang-ing program currently in place. Furthermore, the proposal stated that the use of
Community Ownership and Live Shearing [157]
Part 2 (ch9-12) 5/7/04 2:24 PM Page 157

corrals constitutes the “best alternative for the rational management of the species’’.The specific objectives of the program call for: (a) protection and conservation ofthe vicuña (no reference is made to wild vicuñas), (a) reintroduction of vicuñasinto appropriate habitats, (c) production of fiber from live-shorn animals, (d) legalcommercialization of fiber, and (e) generation of a productive activity for Andeancampesinos. The state has been actively promoting these management alternativesand is implementing them on a wide scale throughout Peru.
The program called for the implementation of corrals in 600 campesino com-munities by the year 2000 (Ministerio de Agricultura 1997), a task that has beencompleted for approximately 260 communities (Hoces 2000). It has been estimatedthat 250 vicuñas are needed for the corral scheme to be economically viable; aneconomically viable system would therefore require 150,000 vicuñas to be in whatis euphemistically called semicaptive management, a number that has not beenreached because it is greater than the current population of vicuñas in Peru. Thisprogram, unfortunately, completely neglects the management of free-rangingvicuñas. In fact, no free-ranging management plan currently exists in Peru.
The plan’s assumption that the so-called sustainable use modules are more effi-cient, productive, and profitable was untested at the time that the program was im-plemented on a national level. Unfortunately, although under certain well-definedcircumstances it could be argued that corrals might be necessary for vicuña man-agement, the implementation of this program has caused confusion regarding ap-propriate management practices. It can be argued that implementation of this pro-gram has been detrimental in some respects to the overall conservation program ofthe vicuña in Peru. For example, the implementation of corrals to date has cost An-dean communities approximately US$ 2,500,000.00, while little has been spent onstrengthening antipoaching efforts, which has been one of the primary concerns ofcampesino communities in Peru (Sociedad Nacional de la Vicuña 2000). It is evi-dent that a coherent management plan must be formulated to maintain viable wildpopulations of vicuñas in Peru and that at present the term sustainable use mod-ules has led to confusion about what sustainable use of the vicuña means, both atthe professional and the community level.
The maintenance of vicuñas in large corrals has been the least studied optionfrom both technical and socioeconomic perspectives. Initially, this modality wasproposed by the state to facilitate monitoring of vicuñas and consequently to lowerrates of poaching. Another presumed advantage is greater capture efficiency andconsequently greater economic benefits for campesinos (Zuñiga 1997).
This option has an initial economic disadvantage because it requires an upfronthigh capital investment; each corral costs $23,000.00, not including labor, whichcampesinos provide for free. For many communities this quantity is more than theincome received from the sale of vicuña fiber. Communities with few vicuñas thatbecome involved in this program become immediately indebted to the state. Acost-benefit analysis conducted by Lichtenstein et al. (in press) compared two com-munities that utilized free-range management with two communities that utilized
[158] Community Ownership and Live Shearing
Part 2 (ch9-12) 5/7/04 2:24 PM Page 158

semicaptive management. By the time the study ended, the two communities thatutilized semicaptive management had not received any short-term benefits, andlong-term benefits were considered low income and high risk. In contrast, the twocommunities that utilized free-range animals had received cash that was used forcommunity improvement projects. Lichtenstein et al. (in press) concluded thatmanagement of free-ranging vicuñas, while being a moderately high-risk venture,also had high chances of being profitable.
Biological impacts of maintaining vicuñas in corrals or in semicaptive manage-ment can be significant, both in the short and long term. By increasing densitieswithin fenced-in areas, reproductive rates can decrease if there are density-depen-dent effects. Also, an increase in density can facilitate the transfer of disease andparasite load. An immediate effect is change in dispersal behavior and movementpatterns, changes that can ultimately influence genetic structure at the metapopu-lation level as well as for animals within corrals.
As for the repopulation program, which could arguably be socially, economical-ly, and biologically necessary, Wheeler et al. (2000) have identified four genetical-ly distinct populations of vicuñas within Peru. They recommend caution with re-gards to the repopulation program, and suggest that repopulation efforts occurwithin the four distinct sub-populations. They also recommend caution regardingcorrals and the potential for inbreeding effects. From a population dynamics per-spective, if no interaction is permitted between vicuñas in the wild and vicuñasplaced in corrals , these animals may as well have been harvested from the popula-tion. If too many animals from a wild population are placed within corrals, these defacto harvests may be unsustainable (Sahley 2000; see table 10.1).
Another factor is that animals within corrals may receive more vigilance and at-tention than animals left in the wild, thus putting animals in the wild at greater riskfor poaching. Because emphasis is placed on shearing animals within corrals be-cause of purportedly increased efficiency, free-ranging vicuñas may not be shorn.Shearing vicuñas has been proposed as a disincentive to poachers. In fact, the orig-inal motto surrounding the vicuña management program has been “a vicuñasheared is a vicuña saved.’’
An additional concern is that animals in semicaptive management may be moresusceptible to predators (Sociedad Nacional de la Vicuña 2000). This may not onlyjeopardize vicuñas within the corrals but also create negative attitudes toward pred-ators, such as the puma (predator control for vicuñas in corrals was a concernvoiced by several campesino delegates at the SNV 2000 conference). Further, atthe interface between the vicuña and its habitat, the removal of animals from thewild and into the corrals has immediate effects on the interaction of vicuñas andthe landscape of the Andean puna.
Finally, no standards exist as to management of vicuñas within corrals. For ex-ample, animals in the “repopulation program” currently do not undergo quaran-tine before they are transferred to less populated areas. While in the short-term cor-rals for repopulation programs could be justified, in the long-term, if animals are
Community Ownership and Live Shearing [159]
Part 2 (ch9-12) 5/7/04 2:24 PM Page 159

TA
BL
E 1
0.1
Vic
uña
Cen
sus D
ata
for A
nim
als W
ithin
and
Out
side
of C
orra
ls, a
s Wel
l as F
iber
Pro
duct
ion
for t
he Y
ear 1
999
co
mm
un
it
yd
ist
ric
tp
ro
vin
ce
vic
uñ
as
wit
hin
co
rr
al
vic
uñ
as
ou
tsid
e
co
rr
al
fib
er
pr
od
uc
tio
n
19
99
in
co
me
ge
ne
rat
ed
San
Juan
de
Taru
cani
S. J.
Tar
ucan
iAr
equi
pa10
615
812
.99
3,55
3.09
Salin
as H
uito
S. J.
Tar
ucan
iAr
equi
pa11
651.
5944
1.36
Tam
bo C
añah
uas
Yana
huar
aAr
equi
pa0
560
16.4
94,
449.
09
Tocc
raYa
nque
Cay
llom
a14
462
18.7
15,
239.
39
Tota
l26
184
5
Sour
ce:D
ata
from
CO
NAC
S (C
onse
jo N
acio
nal d
e C
amel
idos
Sud
amer
ican
os)
Not
e:Al
l com
mun
ities
are
loca
ted
with
in th
e N
atio
nal S
alin
as A
guad
a B
lanc
a R
eser
ve. T
he T
occr
a co
rral
is lo
cate
d ju
st ou
tside
the
park
bor
der,
whi
ch is
a h
ighw
ay.
49.7
913
,682
.93
Part 2 (ch9-12) 5/7/04 2:24 PM Page 160

kept behind fences, these translocations cannot be considered legitimate reintro-ductions of the vicuña. Currently, no timetables are set for the eventual release ofrepopulated animals, and no conditions have been established for eventual releas-es into the wild should animals in semicaptive management reach carrying capaci-ty within corrals. Extremely limited data exist on the biological effects corrals arehaving on vicuña populations.
STUDY AREA AND METHODS
We utilized information from CONACS, the governmental agency in charge ofcamelid management in Peru. We also utilized data and reports from the NationalSociety of Vicuña Breeders, which represents the Andean communities and whichis in charge of commercializing vicuña fiber and distributing profits.
Field data were obtained from within a 75-km2 zone pertaining to the cam-pesino community of Tambo Cañahuas, located within the boundaries of the Sali-nas-Aguada Blanca National Reserve in Arequipa, Peru. The study site is primarilya large plain surrounded by mountainous terrain. The area belongs to the sub-alpine, subtropical desert scrubland as defined by the Holdridge system (INRENA1995). Data on habitat use, density, and fertility of vicuñas were obtained from theend of 1996 through 2000, using fixed-width repeated transects as well as oppor-tunistic observation. When a vicuña was observed during a transect count, we not-ed activity, number of vicuñas, social group, and position of group or individual us-ing GPS. In 1999 and 2000 wild-caught vicuñas were marked with plastic coloredand numbered ear tags, which allowed us to identify animals by individual, age,and sex categories. Tagging caught and shorn animals allowed us to experimental-ly compare the effects of capture and shearing on female fertility with uncapturedand unshorn vicuñas. Additional data regarding community management of thevicuña were obtained during informal interviews with state officials and membersof the community of Tambo Cañahuas, attendance at community meetings, re-gional meetings, workshops, and personal observations.
RESULTS
VICUÑA POPULATIONS, FIBER HARVESTS, AND PROFITS
Information obtained from CONACS (1996) indicates that at a national level,community interest in participating in the live-capture and shearing program ishigh. Since 1994 more than 300 communities registered with CONACS in order toparticipate. By 1996 more than 600 communities had formed conservation com-mittees and registered with the government to participate in the program (fig. 10.1).This number has increased to approximately 780 communities and over 250,000families (Sociedad Nacional de la Vicuña 2000). However, many communities arenot yet participating because of a lack of infrastructure and organizational capacity.
Community Ownership and Live Shearing [161]
Part 2 (ch9-12) 5/7/04 2:24 PM Page 161

The level of interest indicated by the formation of vicuña management commit-tees and the animated and passionate debates at local and regional meetings (pers.obs.) is a positive development, especially given the participation of communitymembers in the process of decision making and commercialization. However, thepolitics of vicuña management are still mainly organized in a top-down fashion,with the state maintaining a large influence in the decision making and imple-mentation process. In addition, community interest does not necessarily lead tocommercial success, as we shall see in the next section.
There is one question of extreme importance regarding the utilization of vicuñafiber by campesino communities: does giving communities a direct interest in con-servation of the vicuña through economic incentives have a positive impact onvicuña populations? No published studies exist that show a direct link betweenfiber commercialization and vicuña conservation, although convincing circum-stantial evidence exists. Government censuses conducted at a national level indi-cate a continuous increase in the vicuña population, even though a black marketstill exists for vicuña pelts (fig. 10.2). Nonetheless, a total of 30,391 vicuñas wereshorn and contributed a total of 6.5 tons of fiber between 1994 and 1997, and by1997 279 campesino communities had participated in the chaku (Hoces 2000; table10.2).
Perhaps the most vexing problem is the economic and social sustainability of thecurrent system, at least in the short term. Unlike hunting, vicuña capture requirescapital investment and a high degree of community organization and technicalskills for the monitoring, capture, and shearing of animals. For example, the ap-proximate cost of a capture net is US$ 2,700 (Wheeler and Hoces 1997). Commu-nities must first program the dates of the chaku in a regional assembly, and there-after community meetings need to be organized and held in order to plan theassembly of the capture nets, monitoring of vicuñas, and finally capture and shear-ing. In many communities, the ultimate limitation in this system is the low number
[162] Community Ownership and Live Shearing
FIGURE 10.1 Formation of vicuña management committees, 1994–1996 (Data from CONACS).
Part 2 (ch9-12) 5/7/04 2:24 PM Page 162
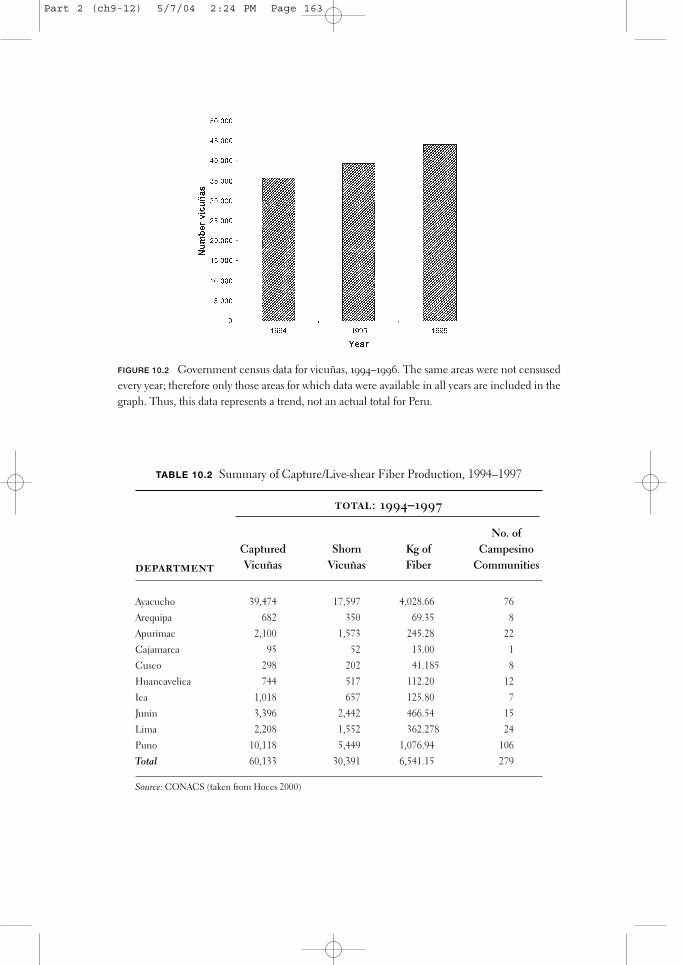
FIGURE 10.2 Government census data for vicuñas, 1994–1996. The same areas were not censusedevery year; therefore only those areas for which data were available in all years are included in thegraph. Thus, this data represents a trend, not an actual total for Peru.
TABLE 10.2 Summary of Capture/Live-shear Fiber Production, 1994–1997
total: 1994–1997
department
Captured Vicuñas
Shorn Vicuñas
Kg of Fiber
No. of Campesino
Communities
Ayacucho 39,474 17,597 4,028.66 76
Arequipa 682 350 69.35 8
Apurimac 2,100 1,573 245.28 22
Cajamarca 95 52 13.00 1
Cusco 298 202 41.185 8
Huancavelica 744 517 112.20 12
Ica 1,018 657 125.80 7
Junin 3,396 2,442 466.54 15
Lima 2,208 1,552 362.278 24
Puno 10,118 5,449 1,076.94 106
Total 60,133 30,391 6,541.15 279
Source: CONACS (taken from Hoces 2000)
Part 2 (ch9-12) 5/7/04 2:24 PM Page 163

of vicuñas, which are still recuperating from several poaching cycles. Thelast ofthese cyles occurred in 1992–93, just prior to the vicuñas’ downgrading to AppendixII in CITES.
Compounding the problems of low vicuña densities in many areas of the Peru-vian Andes is the fact that fiber production per vicuña is low, with an average of 250g/individual. Vicuña fiber grows so slowly that animals can be shorn only onceevery two years. At current prices (US$ 300.00/kg fiber) an average vicuña will pro-duce, at best, US$ 42.00/year. Despite low fiber production, however, the price ofvicuña fiber far exceeds that of the alpaca, another luxury fiber (which has an ex-tremely low price of US$2.00/kg) and that of sheep, US$0.15/kg (prices correspondto those of 2001–2002). Thus, the addition of vicuña fiber as an additional econom-ic option for Andean campesinos is significant. This benefit is real even if priceswere to drop further, as might be expected when other Andean countries, Bolivia,Chile, and Argentina, enter the market.
Another limitation is the unequal distribution of vicuñas in Peru. The depart-ments of Ayacucho, Lima, Puno, and Apurimac (INRENA 1994) have the highestpopulations of vicuñas, and these numbers have led to higher fiber production inthese zones (table 10.2). Large differences exist in the production of fiber in differ-ent geographic localities, as well as the number of campesino communities in-volved. Compare, for example, the 4,028 kg of fiber harvested in Ayacucho in1994–1997 with the 69 kg of fiber harvested in Arequipa. These differences in theproduction of fiber and income can affect power relations of the communities withrespect to management and organizational methods at regional and national scalesand will surely influence the attitudes of people toward vicuñas in different zones.Indeed, signs of such changes are apparent. In the year 2000 some representativesfrom the community of Lucanas in Ayacucho (an area of high vicuña density andfiber production) expressed their desire to commercialize their fiber independent-ly from the SNV (Sociedad Nacional de la Vicuña 2000). The political ecology ofcommunity interaction and relationships with the fiber industry is one that meritsadditional attention.
TAMBO CAÑAHUAS, AND TOCCRA, AREQUIPA: A CASE STUDY
Human census data indicate that approximately 115 families inhabit the 50,000-ha,legally recognized communal territory of Tambo Cañahuas. Approximately 50% ofthe families dedicate themselves in large part to raising livestock, principally al-pacas and llamas and, on a smaller scale, sheep (Torres 1998). Censuses indicatethat within community lands there are approximately 400 vicuñas.
Once a year the community of Tambo Cañahuas plans and implements thechaku. The base price for fiber is approximately US$ 300.00 /kg, lower than theUS$ 500.00 /kg offered by the International Vicuña Consortium in previous years.In addition to paying for capture nets, the community is also discounted the pricefor additional equipment, as well as 10% for the Vicuña Breeders Society (SNV).
[164] Community Ownership and Live Shearing
Part 2 (ch9-12) 5/7/04 2:24 PM Page 164

The 10% discount for the Sociedad Nacional de la Vicuña goes to the regional del-egates and contributes to their administrative and travel costs.
It is evident that, although the shearing program is generating income, the quan-tities currently received will probably not drastically change the economic condi-tions of the community. However, even a few thousand dollars per year distributedat the community level can make a difference in terms of financing small commu-nity-based projects or businesses (table 10.3). By the year 2000, for example, thetown of Tambo Cañahuas had received enough income to pay for equipment costsand to purchase a large truck as an investment not only for vicuña-related necessi-ties but also for use in other community-based enterprises. Because the town resi-dents were able to capture and shear vicuñas in 1995, they perceived immediateeconomic benefits (although because of bureaucratic delays, they did not receivemoney for two years).
Thus, the live shearing of wild vicuñas produced short-term gains (small debtand immediate returns). These short-term gains will last as long as the communitycontinues to capture and shear animals because data indicate that the capture andlive-shearing process is biologically sustainable, and the population is growing(table 10.4). Although the actual income of the capture/shearing/release program isnot high, it can cover the cost of capture equipment and provide a surplus within ashort time frame. From the point of view of wildlife management, the capture/re-lease program has the added benefit of maintaining populations of wild vicuñas.This maintenance is especially important in Tambo Cañahuas, which falls withina National Reserve, and has populations that are still recuperating from a severepoaching event in 1992–1993.
In the case of Tambo Cañahuas, which began shearing vicunas in 1995, a ten-
Community Ownership and Live Shearing [165]
TABLE 10.3 Fiber Production and Projected Income for the Community ofTambo Cañahuas, Arequipa, Peru
year
no. animals
captured fiber
projected
income (us$)a
1995 48 8.185 kg ($434.00/kg) $2,863.82
1996b 21 5 kg ($434.00/kg) $1,953.00
1997b 16 1.5 kg ($434.00/kg) $650.00
1998c 0 0 ($300.00/kg) $ 0.00
1999c 55 16.5 kg ($300.00/kg) $4,449.09
Source: Data from CONACS (Consejo Nacional de Camelidos Sudamericanos)aThese figures do not add up if the price is US$ 300 or US$ 434, as per contract for clean fiber; thus thecommunities must have been discounted for not selling the fibers previously cleaned, or for another rule.There is a convoluted system of discounts during the processing of the gross fiber and the clean fiber to thefinal product, and the actual discounts are not made available to the community in the reports.bSecond lotcThird lot
Part 2 (ch9-12) 5/7/04 2:24 PM Page 165
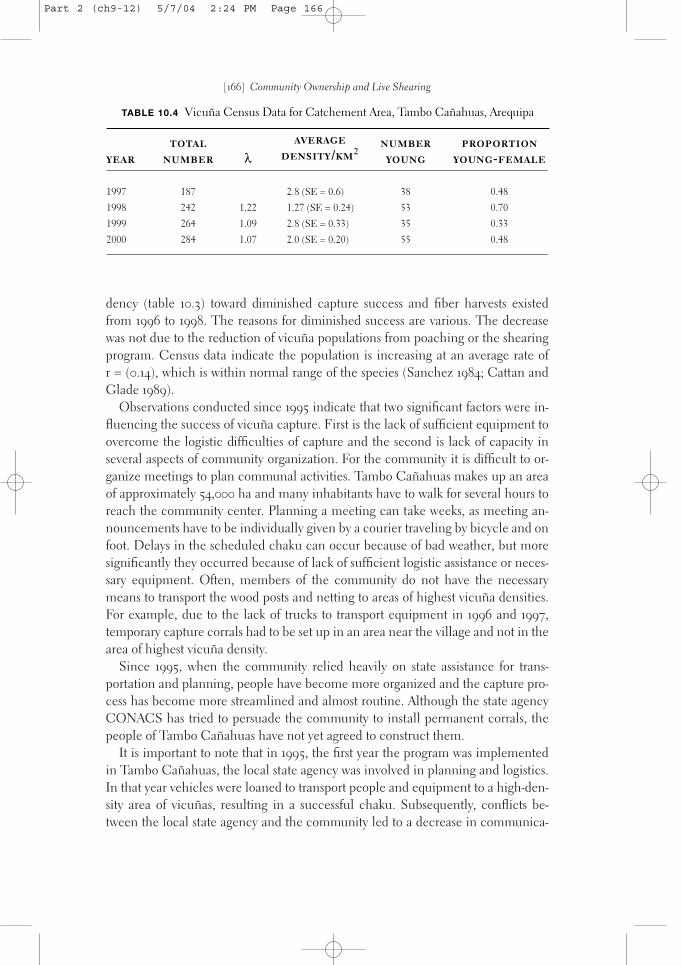
dency (table 10.3) toward diminished capture success and fiber harvests existedfrom 1996 to 1998. The reasons for diminished success are various. The decreasewas not due to the reduction of vicuña populations from poaching or the shearingprogram. Census data indicate the population is increasing at an average rate of r = (0.14), which is within normal range of the species (Sanchez 1984; Cattan andGlade 1989).
Observations conducted since 1995 indicate that two significant factors were in-fluencing the success of vicuña capture. First is the lack of sufficient equipment toovercome the logistic difficulties of capture and the second is lack of capacity inseveral aspects of community organization. For the community it is difficult to or-ganize meetings to plan communal activities. Tambo Cañahuas makes up an areaof approximately 54,000 ha and many inhabitants have to walk for several hours toreach the community center. Planning a meeting can take weeks, as meeting an-nouncements have to be individually given by a courier traveling by bicycle and onfoot. Delays in the scheduled chaku can occur because of bad weather, but moresignificantly they occurred because of lack of sufficient logistic assistance or neces-sary equipment. Often, members of the community do not have the necessarymeans to transport the wood posts and netting to areas of highest vicuña densities.For example, due to the lack of trucks to transport equipment in 1996 and 1997,temporary capture corrals had to be set up in an area near the village and not in thearea of highest vicuña density.
Since 1995, when the community relied heavily on state assistance for trans-portation and planning, people have become more organized and the capture pro-cess has become more streamlined and almost routine. Although the state agencyCONACS has tried to persuade the community to install permanent corrals, thepeople of Tambo Cañahuas have not yet agreed to construct them.
It is important to note that in 1995, the first year the program was implementedin Tambo Cañahuas, the local state agency was involved in planning and logistics.In that year vehicles were loaned to transport people and equipment to a high-den-sity area of vicuñas, resulting in a successful chaku. Subsequently, conflicts be-tween the local state agency and the community led to a decrease in communica-
[166] Community Ownership and Live Shearing
TABLE 10.4 Vicuña Census Data for Catchement Area, Tambo Cañahuas, Arequipa
year
total
number λaverage
density/km2
number
young
proportion
young-female
1997 187 2.8 (SE = 0.6) 38 0.48
1998 242 1.22 1.27 (SE = 0.24) 53 0.70
1999 264 1.09 2.8 (SE = 0.33) 35 0.33
2000 284 1.07 2.0 (SE = 0.20) 55 0.48
Part 2 (ch9-12) 5/7/04 2:24 PM Page 166
tion and collaboration between the two groups. The disillusionment with the poorcapture success in 1996 was another factor that contributed to low yields in 1997and 1998.
It is evident that, with the absence of telephones, radios, and vehicles that wouldpermit communication and transport between community members during theplanning and implementation of the chaku, at the outset of the program it was nec-essary to have some degree of assistance form the state or from other sources. Thecapture and shearing program was not easy to implement in the first few years.Nonetheless, persistence on the part of the community, sporadic state assistance,and logistic support from NGOs has made the wild-caught vicuña shearing enter-prise an independently economically sustainable one within a few years.
Data collected during our study indicate that partial shearing of animals in thespring (September-October) has no negative effect on the vicuña population(Sahley, Torres, and Santos unpublished data). Our data thus far indicate that, ifproperly managed, capture, shearing, and release of free-ranging vicuñas is a bio-logically sustainable option. Moreover, the experience in Tambo Cañahuas hasshown that the wild-caught system originally proposed is feasible and results in bet-ter short-term economic gains than the corral system.
Beyond economics, maintaining wild vicuñas on communal lands may not onlyserve to promote vicuña conservation but also of the Andean landscape and its as-sociated flora and fauna. An additional benefit is the strengthening of the culturalidentification of Andean people with an iconic wildlife species in Peru. Thestrengthening of pre-Colombian tradition in communities and their passionate at-tachment to the new vicuña enterprise is a fascinating combination of the meetingof tradition, human interaction with the wild landscape, and the global market-place. As such, the case study in Tambo Cañahuas illuminates myriad complex in-teractions that have yet to be revealed. Thus far it seems that it is possible to com-bine Western wildlife management with a traditional system of resource use thatcan serve to strengthen cultural and historical ties with the landscape and also workwith an international market. We believe that the information and data collectedin Tambo Cañahuas can serve as a model for other communities in the Andes.
TOCCRA: AN ABBREVIATED CASE STUDY OF THE CORRAL SYSTEM
Adjacent to the campesino community of Tambo Cañahuas is the village of Toc-cra. Located at a slightly higher elevation (approximately 4,300 meters above sealevel) and more sparsely populated by both humans and vicuñas, this village waschosen as the site of a vicuña “repopulation” effort. With strong support from thestate and vigorous promotion by the Inca Group (the Peruvian company that hassole rights to the production of vicuña textiles and is part of the InternationalVicuña Consortium), a corral was installed a few meters outside the boundaries ofthe Salinas-Aguada Blanca Reserve but within its buffer zone.
Community Ownership and Live Shearing [167]
Part 2 (ch9-12) 5/7/04 2:24 PM Page 167

In 1997 ninety-five vicuñas were brought from Pampa Galeras to Toccra andplaced in the corral. Shortly thereafter, these animals became part of a highly pub-licized international vicuña festival, which attracted several hundred Americantourists. A staged capture was enacted, in which tourists were allowed to partici-pate, but animals were subsequently not shorn. Members from neighboring com-munities were asked to help with the capture. Although some community mem-bers did help, others did not, because of a lack of any compensation for labor (eventhough festival organizers charged tourists for the spectacle). Due to pressure fromthe industry, local state officials focused on organizing this event and virtually ig-nored other communities in the area such as Tambo Cañahuas, which subse-quently had low capture success that year.
Efforts to study the biological effects of the corrals on vicuñas by comparing bio-logical parameters of the captive animals with those of the wild populations inTambo Cañahuas were unfortunately hampered by vicuña politics. Nevertheless,we did obtain census data in 1998, 1999, and 2000. Through interviews we learnedthat wild vicuñas were caught when possible and placed in corrals. Thus data onpopulation dynamics and sources of vicuña births and mortality are impossible toquantify precisely. What our census data showed was that in 1998, an El Niño year,production of young was significantly lower in Toccra than in Pampa Cañahuas(Sahley 2000). After three years population growth of animals in the corrals wassimilar to that in the wild, even though animals had been introduced into corrals toapparently compensate for undocumented mortality or low birth rates. Fiber pro-duction for Toccra in 2000 was only 2 kg more than that for Tambo Cañahuas, andthe meager economic gain (US$ 780.00 table 10.1) in comparison to TamboCañahuas did not compensate for the expense of the corral and veterinary treat-ment for vicuñas that had contracted mange or had brought mange with themfrom Pampa Galeras. While Tambo Cañahuas saw an increase in vicuña popula-tions, as well as direct profit from the shearing of wild vicuñas, Toccra continues topay off the debt incurred by the corral expenditure.
CONCLUSION AND RECOMMENDATIONS
Data obtained from this study indicate that live shearing of vicuñas in Peru hasmuch potential for the sustainable utilization of this species and can also benefitAndean communities that traditionally have been marginalized in Peruvian soci-ety. While the “privatization” of the vicuña may cause social and economic con-flict by promoting the construction of corrals, it remains unclear how the econom-ic and social sustainability of this process will be influenced. However, it isapparent that vicuña management needs to be conducted in collaboration withtechnicians familiar with wildlife management theory and techniques. Althoughimplementation of the program is still fairly recent, we believe it is more prudent todevelop methods to improve capture efficiency of wild vicuñas and to protect themfrom poachers instead of changing this methodology for the more risky and costly
[168] Community Ownership and Live Shearing
Part 2 (ch9-12) 5/7/04 2:24 PM Page 168

option of maintaining vicuñas under conditions of captivity. We suggest emphasisbe placed on the following efforts:
1. Measure biological and socioeconomic costs for each community or region thatwill have different advantages and disadvantages with respect to vicuña manage-ment.
2. Proceed with great caution with the implementation on a large scale of perma-nent corrals. Research is urgently needed to compare health, fertility, social be-havior, movement patterns, and effects on the landscape between wild and cap-tive vicuñas.
3. Strengthen community organization and basic wildlife management techniquesat local levels. If communities are going to be legally responsible for vicuña man-agement and conservation, they must receive training in basic concepts of moni-toring and management of vicuñas.
4. It is critical for communities to have complete information on the commercial-ization process and sale of fiber (for example, what percent of profits are they re-ceiving?) and also to be able to understand the full implications of any contract oragreement presented to them by state or private institutions.
5. While community management may have several advantages for the vicuña, onepotential disadvantage is that management on regional or national scales could beoverlooked. This oversight could have a negative effect on the structure of themetapopulation of the vicuña or have important effects on the Andean landscape.It is important to maintain regional and national perspectives regarding manage-ment of wild vicuñas. This need requires collaboration and cooperation with stateand nongovernmental organizations, as well as the creation of a national manage-ment plan for the vicuña.
Fortunately, the interest of Andean campesinos, who are important protagonistsin this saga, is high. We hope that management practices based on scientific prin-ciples will lead to a conservation success story in Andean Peru.
POSTCRIPT
Since the completion of this article, a new presidential decree was signed by for-mer President Fujimori. This decree grants individuals, as well as communities,the right to own vicuñas that occur on their land. Thus, privatization of the vicuñahas, for the time being, been increased in scope. This expansion has resulted in aprotest by the Society of Vicuña Breeders, which represents communities, and rais-es important issues regarding the privatization of a wild mammal and the future so-cial, economic, and biological implications this decree might have.
In 2002, under the new government of President Toledo, a vicuña working groupwas established. This working group will examine the biological, legal, commer-cial, and social aspects of vicuña management and current legislation. Recommen-dations from the working group are as still pending.
Community Ownership and Live Shearing [169]
Part 2 (ch9-12) 5/7/04 2:24 PM Page 169

ACKNOWLEDGMENTS
We are profoundly grateful to the community of Tambo Cañahuas, which for several years hasgranted us permission to conduct our research on their land and to observe the chaku. In addi-tion, we thank Caroline Sahley who revised an early draft of the manuscript and gave commentsthat greatly improved its organization. INRENA has granted us permission to work in the SalinasAguada Blanca Reserve for several years, and CONACS has also granted us permission to con-duct vicuña research and to have access to their fiber harvest data. The Society for Vicuña Breed-ers has also granted us interviews and provided us with information. The study has been support-ed by USAID through the Biodiversity Support Program (a consortium of the World WildlifeFund, The Nature Conservancy, and The World Resources Institute), the Wildlife ConservationSociety of the New York Zoological Society, the International Vicuña Foundation, and AtlanticHospitality.
[170] Community Ownership and Live Shearing
Part 2 (ch9-12) 5/7/04 2:24 PM Page 170

11Captive Breeding Programs as an Alternative for
Wildlife Conservation in Brazil
SÉRGIO LUIZ GAMA NOGUEIRA-FILHO
AND SELENE SIQUEIRA DA CUNHA NOGUEIRA
The incorporation of wild species into the meat production industry has attractedthe interest of Brazilian farmers in the last few years because of the increased de-mand for products and by-products of wild mammal origin. The use of new proteinsources for the human population is also of great social interest. Rational use of na-tive resources can be a beneficial process, resulting in economic and social advan-tages, while at the same time reducing damage to wild animal populations causedby irrational hunting and habitat destruction.
Additionally, there is a great demand in the international market for wild animalleathers. Germany, Italy, and the United States are the main importers of collaredpeccary (Tayassu tajacu) leather from Peru (Bodmer and Pezo 1999). In Argentina,where leather is the main product of capybara (Hydrochaeris hydrochaeris) ex-ploitation, skins are used for such luxury products as shoes, jackets, and gloves(Nogueira-Filho 1996). This demand for wildlife leather has always been met bycommercial hunting in several South American countries, especially in Brazil.From the 1960s and 1970s on, commercial hunting became illegal in many of thesecountries. Nevertheless, traffic in wildlife products continued. In the 1980s, for ex-ample, one German importer purchased 36,000 collared peccary skins fromParaguay (Redford and Robinson 1991).
Commercial hunting is forbidden in Brazil. However, wildlife farming in full orsemicaptivity is permitted, and Brazilian law includes a provision that enables thisuse of wildlife. The Brazilian forest code—one of the most important laws for theprotection of Brazilian forests—requires farmers to protect a part of their propertyas an rea de Reserva Legal, or legal reserve area. This is an area inside the agricul-tural proprerty required for the protection of wildlife and biodiversity conservation.Depending on the region, the legal area ranges from 20 to 80% of the property. In
Part 2 (ch9-12) 5/7/04 2:24 PM Page 171

the Amazon region the Área de Reserva Legal can comprise up 80% of rural prop-erties, and in the Cerrado ecosytem, up to 35%. The sustainable use of natural re-sources is allowed in these protection areas, and some Brazilian farmers are usingpart of their legal protection areas for the semi-intensive production of wildlife. Un-fortunately, landowners do not always support or respect this law, and a draft pro-posal is currently in discussion in the Brazilian congress that will reduce the size ofthe protection areas across the country.
Currently IBAMA, the Brazilian Environmental Agency responsible for wildlifeuse and protection, allows capybaras, rheas (Rhea americana), and other wild ani-mals to be raised, on an experimental basis, in a low management-intensity systemsuch as ranching. IBAMA classifies this kind of wildlife exploitation as an extensiveproduction system (Francisco Neo, pers. comms.). Such extensive production givesfarmers the option of conserving forests by making wildlife an economically valu-able resource. The hope is that wild animal production, whether in full captivity orthrough ranching, will meet the meat and leather demands on wild animals and, inconsequence, decrease illegal hunting.
In this article we describe the biological characteristics, products, and by-prod-ucts of capybara and collared peccary, as well as the current production systemsadopted in Brazil to produce these two species commercially. Analyses of econom-ic parameters such as inputs, outputs, and financial return of the three productionsystems are also compared.
PART I. CAPYBARA: SPECIES CHARACTERISTICS, PRODUCTS, AND BY-PRODUCTS
BIOLOGY
Among Brazilian wild mammals, the capybara is the species that has the highestproductive potential in captive, intensive small-scale farm settings, as well as in nat-ural, extensive ranch settings (Parra, Escobar, and González-Jiménez 1978; La-vorenti 1989; González-Jiménez 1995; Nogueira-Filho 1996). It is herbivorous,grows rapidly, and adapts easily to captivity. There is also a great potential marketfor its meat and leather (Ojasti 1991; González-Jiménez 1995; Andrade et al. 1996;Nogueira-Filho 1996).
Capybara habitat consists of a combination of water bodies (rivers and lakes),pasture, and available natural cover. Its semiaquatic habit and its reliance on wet-lands led some authors to propose capybara ranching as an alternative in order toenhance wetland benefits for local communities (Ojasti 1973; González-Jiménez1995). The ranching system allows rural inhabitants of wetland regions, such as theBrazilian Pantanal, to use this species as a source of protein and income as long asthey safeguard its natural habitat. Alternative uses, such as cattle ranching and agri-culture, require extensive land draining.
[172] Captive Breeding Programs
Part 2 (ch9-12) 5/7/04 2:24 PM Page 172
MEAT CHARACTERISTICS
In Venezuela and Colombia capybara meat is traditionally eaten during Easter. Inthe sixteenth century, in response to a petition from the people, the Pope decreedthe capybara a fish (Mukerjee 1994). Consequently, its meat can be eaten byCatholics during periods of abstinence from red meat.
In the biggest Brazilian cities, such as São Paulo, Rio de Janeiro, and Belo Hori-zonte, capybara meat is sold for up to US$ 7.5 per kilogram. To introduce capybarameat to the market, the following strategy was used in São Paulo. Initially, the meatwas offered only at a few luxury restaurants, at which it was presented as an exoticproduct and listed at the highest price on menu. This process increased the de-mand for wild meat in urban centers, resulting in incentives for commercial cap-tive breeding (Nogueira-Filho 1996).
Some rural peoples, however, reject capybara meat as having a disgusting taste,probably because they have consumed meat from hunted animals. In general,hunted animals are slaughtered without care, and under inadequate hygienic con-ditions, results in meat contaminated by intestinal contents. On the other hand,people that tested the meat of captive-reared animals in a double-blind experimentfound no differences in scent and flavor among capybara, pig, and cow meat (Fras-son and Salgado 1990). The captive animals used in the test had been fed a diet ofelephant grass (Pennisetum purpureum), supplemented with corn and soybeanmeal ration and slaughtered under adequate conditions. Nevertheless, more stud-ies of the fatty acid composition of capybara meat are necessary to establish howdiet affects its organoleptic characteristics. Capybara meat contains on averageonly 4.5% of fat and 24.5% of crude protein (Lavorenti et al. 1990), for a total of89.4% of digestible protein and 61.3% of biological value (Frasson and Salgado1990).
ECONOMIC CONSIDERATIONS
In addition to high quality meat, capybaras produce light and resistant leather. Thisleather can be used for footwear, glove, jacket, and bag production (González-Jiménez 1995). In Buenos Aires, jackets made from capybara leather sell from US$400 to 720, while a pair of gloves sells for US$ 80 (Nogueira-Filho 1996).
Brazil exported 3,500,000 tons of capybara skins between 1956 and 1969, anamount that brought around US$ 10,700,000 to the country (Mourão 1999). How-ever, because of the high market price of capybara meat, currently in Brazil theskin is sold incorporated to the carcass (Nogueira-Filho and Nogueira 2000). Capy-bara leather will only be marketed separately when there is sufficient production toguarantee a constant supply to the industry.
Capybara oil, derived from the body fat, is popularly used for such illnesses as asthma, bronchitis, rheumatism, and allergic diseases and as a growth tonic
Captive Breeding Programs [173]
Part 2 (ch9-12) 5/7/04 2:24 PM Page 173

(Nogueira-Filho 1996). A recent study showed that it functions to control choles-terol in mice fed a diet rich in saturated fat (Fukushima et al. 1997). Capybara bodyfat contains high levels of polyunsaturated fatty acids, including omega fatty acids(Fukushima et al. 1997) that may be responsible for its therapeutic action. The con-jugated linoleic acid (CLA), which has anticarcinogenic properties (Bauman et al.1998), may also be present in capybara body fat. The possibility that capybara meatand fat contain substances that can bring benefits to human health can be used formarketing purposes.
CAPYBARA SOCIAL BEHAVIOR AND CAPTIVE MANAGEMENT
Capybaras live in social groups ranging in size from one male and two females upto 100 individuals; the larger groups include several adults of both sexes with theiroffspring (Ojasti 1973; Macdonald 1981; Schaller and Crawshaw 1981). Groups arecohesive with a complex social structure characterized by a dominance hierarchyand individual specialization of functions (Azcarate-Bang 1980). A dominant maleprotects the group, is possessive of the females, and through threats and attacksmaintains subordinate males at the periphery (Ojasti 1973). Satellite males some-times copulate with young females in estrus (Ojasti 1973; Macdonald 1981; Schallerand Crawshaw 1981). Offspring remain in the original group until they reach sexu-al maturity, at which time females may be incorporated and males expelled follow-ing a hierarchical dispute with the dominant male (Ojasti 1973). Expelled mem-bers often form new groups (Ojasti 1973; Schaller and Crawshaw 1981).
Some authors have suggested the existence of cooperative care or alloparentalbehavior among capybaras (Ojasti 1973; Macdonald 1981). In the wild, capybara fe-males have been seen with twelve to fourteen infants (Macdonald 1981; Schallerand Crawshaw 1981; Alho, Campos, and Gonçalves 1987), although the maximumlitter size is seven (González-Jiménez 1995; Nogueira 1997). In captivity, juvenilesspend more time with one female than with other group members (Nogueira1997). Nogueira et al. (2000) studied the alloparental behavior of two capybara fam-ily groups in captivity and concluded that females did not discriminate betweenyoung when suckling because each suckled her own infant as often as those of oth-er group females.
Despite the occurrence of alloparental behavior, breeding capybara in full orsemi-intensive captivity can be very problematic because of the high rates of infan-ticide (Nogueira 1997). The hypothesis that infanticide is caused by lack of experi-ence in primiparous females has been discarded (Nogueira et al. 1999). Rather, in-fanticide was associated with reproductive groups containing females who had notbeen together since weaning. Unfamiliar females lived together without apparentconflict until the occurrence of births when they killed their pen-mates’ offspring(Nogueira et al. 1999). When a capybara group is set up with females that havebeen living together since weaning, infanticide does not occur, and females do
[174] Captive Breeding Programs
Part 2 (ch9-12) 5/7/04 2:24 PM Page 174

not have to be isolated to farrow either in intensive or semi-intensive breeding(Nogueira et al. 1999).
CAPYBARA FEEDING HABITS
Capybaras feed mostly on grasses (Lavorenti 1989; González-Jiménez 1995) andtherefore do not compete directly with humans for food (Nogueira-Filho 1996).They enhance their nutrient intake from food by increasing the efficiency of theirdigestion by extensive mastication and hindgut fermentation (Mones and Ojasti1986). The cecum represents 74% of the whole gastrointestinal tract of capybaras(González-Jiménez and Parra 1972). Cecum pH is around 6.0 ( 0.3 (González-Jiménez 1977), providing an optimal environment for microbial fermentation ofstructural carbohydrates (cellulose and hemicellulose) and liberation of volatilefatty acids that are an energy source for the host (González-Jiménez 1995).
Capybaras may be able to use microbial protein from the cecum through either(a) reingestion of the cecal content (Herrera 1985; Mendes 1999; Mendes et al.2000; Hirakawa 2001) or (b) digestion and absorption of microbial protein in thelarge intestine (González-Jiménez 1995). This ability suggests that expenses for sup-plements of essential nutrients, such as amino acids and vitamins, can be decreasedfor adult animals in captivity. Nevertheless, the best growth results were obtainedwhen the diet of young animals was supplied with protein supplement (Silva-Neto1989; Andrade, Lavorenti, and Nogueira-Filho 1998). Under these conditionsyoung animals gain up to 110 g per day and reach slaughter weight more quicklythan when just fed grass, which results in 60 gram of daily weight gain (Ojasti1973).
REPRODUCTION
Although capybaras can breed throughout the year, in the wild they do so most fre-quently at the onset of the rainy season (Mones and Ojasti 1986). Capybara gesta-tion lasts approximately 150 days (López-Barbella 1984), and females usually pro-duce one litter per year in the wild (Mones and Ojasti 1986).
Nogueira (1997) analyzed data obtained from the experimental captive-breedingproject at the University of São Paulo at Piracicaba (ESALQ/USP). From Novem-ber 1984 through December 1995, 243 young were born in 80 litters. Births peakedin the rainy months of November, December, and January. Mean litter size was 3.3 (range 1–7) with a male-female sex ratio of 53:47. Mean birth weight ((SD)1,988.0 g (( 346.7) for males and 1,991.0 g (( 356.8) for females.
Females could reach sexual maturity at seven months of life, but there was someindividual variation in the age at which females produced their first litter (1,449.9 ( 744.2 days of age). The mean interbirth interval was 380.0 days (( 163.7). Howev-er, females could reinitiate reproductive activity just twenty days after farrowing.The potential for postpartum estrous with ovulation, unlike what was observed by
Captive Breeding Programs [175]
Ed.:doubleparens? Isthere a spe-cial charac-ter thatshould bethere?
Part 2 (ch9-12) 5/7/04 2:24 PM Page 175
López-Barbella (1984), allows capybaras to produce young at a faster rate than ani-mals that are unable to ovulate soon after parturition. There was a significant dif-ference in interbirth interval among females of different ages. The number ofyoung per litter decreased, and the interbirth interval increased after six years ofage (Nogueira 1997).
Data from this study also showed that intensive breeding and handling proce-dures led to stress and poor condition in captive animals, with negative impact onproductivity. It is therefore necessary to improve husbandry practices through be-havioral studies and to implement a selection program to improve reproductive pa-rameters and to reduce the enormous variability observed. Nogueira (1997) con-cluded that the variability in reproductive parameters could be partially explainedby individual temperament as a consequence of adaptation to captivity. Nogueiraet al. (2000) proposed that subordinate females take better care of juveniles than dodominant females. This observation may be one possible explanation for the vari-ability in reproductive parameters showed by capybara females in captivity.
Lack of adapted husbandry practices for this species in captivity may also haveconsequences for reproductive performance. For example, the delay in entranceinto reproductive life was due partly to the fact that young females and males ofnearly the same age made up the reproductive groups. Capybara males reach sexu-al maturity between fifteen and twenty-four months of age (Ojasti 1973), femalesbetween seven and twelve months (López-Barbella 1982; Nogueira 1997). Groupscomposed of young females with adult males should be tested to verify the possi-bility of reducing the age at which capybara females produced their first litter.
CAPYBARA CAPTIVE-BREEDING SYSTEMS
INTENSIVE PRODUCTION SYSTEM
In the intensive breeding system family groups comprising a male and up to eightfemales are maintained in small enclosed reproduction paddocks (120 to 400 m2,depending on group size), with at least 20 m2 per adult animal (Nogueira-Filho1996). Paddocks should contain a water tank, feeders, and a sheltered area. Addi-tional paddocks,with the same facilities and space per animal are used for rearingjuveniles (Andrade, Lavorenti, and Nogueira-Filho 1998).
Females introduced to each of the reproduction paddocks must belong to thesame family group in order to avoid fights and infanticide (Nogueira et al. 1999).The male can be from a different origin than the females, allowing the exchange ofgenetic material from different populations. If wild-reared females are used, adap-tation to captivity is facilitated by placing them in a paddock already containing acaptive-born adult male (Nogueira 1997). An alternative reproductive group com-position is to place in one paddock juveniles no more than sixty days old from sev-eral groups. Because they will grow to maturity together, fighting and infanticidewill not occur (Nogueira et al. 1999).
[176] Captive Breeding Programs
Part 2 (ch9-12) 5/7/04 2:24 PM Page 176

Adult animals are fed supplementary ration (12% CP) at 1.0% of live weight on adry matter basis and grass ad libitum. Young animals receive grass ad libitum and aprotein supplement at 1.5% of live weight on a dry matter basis. Since all live grassis removed from the confinement area, grass must be cut and brought to the pad-dock. The forage crop of choice is the elephant grass (Pennissetum purpureum),which has high productivity (Nogueira-Filho 1996).
Infants born in the reproduction paddock will stay with the group until they aresixty days old. Then they are weaned and transferred to a juvenile growth paddockuntil they reach the weight/age of 20 kg/6 months or 35–40 kg/12–18 months, de-pending on local market preferences (Nogueira-Filho 1996).
Space allowances for captive capybara are much higher than those used for do-mestic animals and easily meet the animals’ behavioral needs. Even farmers whoadopt the intensive production system use at least up to 20 m2 per individual,whereas pig farming typically allocates 2 m2 or less per animal (Nogueira-Filho1996; Andrade, Lavorenti, and Nogueira-Filho 1998). In cases where appropriatehandling practices, feeding requirements, enclosure facilities, and social environ-ment are not supplied, low productivity, low growth rates, infanticides, or evenlethal fights will occur, leading to breeding failure (Nogueira 1997; Andrade, La-vorenti, and Nogueira-Filho 1998; Nogueira et al. 1999).
SEMI-INTENSIVE PRODUCTION SYSTEM
Over 90% of the 137 capybara farming facilities in Brazil use the semi-intensive pro-duction system. Females are farrowed and juveniles raised to maturity in fenced ar-eas, ranging from 5,000 to 40,000 m2, including a lake or impoundment of at least200 m2 surrounded by arboreal vegetation (Nogueira-Filho 1996). One or moretraps are built in the breeding area. The trap must allow the capture of multiple an-imals in order to reduce the costs of trapping and handling. Inside the traps miner-al salts, grain corn, or supplementary ration are supplied in sheltered feeders. Thenumber of traps and their size depend on the number of animals in the breedingarea, which in turn depends on the size of the area and the farm’s capacity for food(grass) production.
A family group comprising a male and up to nine females is captured from thewild or purchased from another breeder and introduced into the paddock. If theanimals were captured in the wild, only animals caught in the trap at the same timeshould be used in order to avoid the inclusion of a nongroup member (Nogueira1997). If the capybaras were purchased from another breeder, the group individualsshould have been living together at least since weaning (Nogueira et al. 1999). In-side the breeding area the group will increase only by reproduction—no more ani-mals are added from the wild or captivity in order to avoid fights and infanticide(Nogueira 1997).
Appropriate density studies are still required, but at densities of 100 m2 per adultanimal, weaning should take place at sixty days of age. Juveniles are ear-tagged, and
Captive Breeding Programs [177]
Part 2 (ch9-12) 5/7/04 2:24 PM Page 177

young males placed in a growth paddock with an area ranging from 200 to 800m2—at least 20 m2 per young (Andrade, Lavorenti, and Nogueira-Filho 1998)—where they will grow more quickly without competition from the adult animals.Young females can be maintained with the adults. When a breeder needs to re-place an adult female, he can select among those presenting faster growth; becausethey already belong to the group, there will no difficulty with group incorporation(Nogueira-Filho 1996).
At lower densities, on the other hand, weaning occurs naturally and young malesgrow up with the adults until they reach the weight/age of 20 kg/6 months old. Af-ter this age young males are subject to aggressive behavior from adult males. At thistime they should be slaughtered or transferred to a juvenile growth paddock untilthey reach 35–40 kg/12–18 months old, depending on local market preferences(Nogueira-Filho 1996).
Normally, the adult diet is grass and mineral salt, while the young receive a pro-tein supplement in a creeper feeder. As in the intensive system, cut elephant grassis placed in the trapping devices. The grass growing inside the area is not consid-ered in the feeding plan because capybaras are selective feeders who choose forageplants with high protein content, such as plant seedlings, using their incisors to clipvegetation at ground level. Given this behavior, large areas and a pasture rotationsystem would be required to ensure adequate natural pasture supply. This practiceis not cost effective because of the high prices of the stout galvanized chain linkwire fences used in capybara farming (Nogueira-Filho 1996).
We consider this breeding system as semi-intensive, despite food supplementa-tion, because the groups are maintained in large areas and because there is no in-dividual control on reproductive parameters as in the intensive system. When ana-lyzing reproductive parameters, the breeder considers only the average groupreproduction data, such as interbirth intervals or number of young produced per fe-male each year.
EXTENSIVE PRODUCTION SYSTEM
In some portions of Brazil, especially in the states of São Paulo and Minas Gerais,capybaras are shot as agricultural pests because they harm corn, rice, sugarcane,and other crops and may compete with cattle and other domestic livestock for foodduring the dry season (NRC 1991; Moreira and Macdonald 1997). An alternativeway to control and use these animals is through extensive production or ranching.This production system in particular has the ecological benefit of preserving wet-lands rather than draining them as would be done for cattle ranching. CurrentlyIBAMA allows this kind of exploitation system only on an experimental basis.
In this system capybara population density is assessed, and a selective quota de-termined, ranging from 10 to 30% of the population; the range depends on annualpopulation variations. This system is used in the Venezuela Llanos (Ojasti 1973);however, there are some differences between the experimental system in Brazil
[178] Captive Breeding Programs
Part 2 (ch9-12) 5/7/04 2:24 PM Page 178

and the better-known Venezuelan harvest. In Brazil the animals are live-captured,allowing ranchers to select the animals that will be slaughtered. Furthermore, ani-mals can be slaughtered before they reach sexual maturity. IBAMA requires that allranched animals be identified with electronic microchips, and only young born af-ter ranching is implemented may be slaughtered. Therefore monitoring is easierthan in the Venezuelan harvest system, and it is possible to avoid the overharvestingthat has occurred in the Venezuelan Llanos (Ojasti 1991).
An example of the extensive production system in São Paulo state is the Perobalfarm, whose main activity is beef cattle production. There, a population of 800capybaras shares the pasture with cattle. On alternate days grain corn is placed in-side the traps that allow animals to be handled. These trapping devices, with an in-genious system of automatic doors, are set one day before the planned capture andallow the rancher to hold and select the animals that will be slaughtered(Nogueira-Filho 1996).
The main problem with this production system is that capybaras can quickly de-grade the pasture because of their selective feeding on seedlings. Animals thus haveto be moved out of some areas while the pasture recovers, potentially resulting inconfrontations when transferred groups encounter resident groups in new areas.Therefore specific husbandry practices must be developed for this production sys-tem, especially those that allow an increase in the extraction quota.
ECONOMIC ANALYSIS OF THE THREE CAPYBARA PRODUCTION SYSTEMS
An essential practical consideration in evaluating a productive activity is its cost interms of the return obtained for the product. While it is obvious that the financialaspects of breeding operations cannot be neglected, the expression of the results interms of dollars, unless properly interpreted, may obscure rather than clarify thefacts because monetary statements are not experimental results. The latter arebased upon factors that are not under experimental control, the same combinationof which may never happen again. The relative prices of feeds and the sellingprices of product vary from time to time and from place to place, according to mar-ket conditions.
Let us consider a hypothetical comparison, based on data obtained from com-mercial breeders, regarding the farm expenses and income of a dairy farmer whowants to breed capybara through either intensive, semi-intensive, or extensive pro-duction systems. The farm has an available area with arboreal vegetation and a600-m2 lake, and in another area a large group of capybaras is harming a corn cropand grass pasture used by the cows.
We simulated the expenses and income for intensive, semi-intensive, and exten-sive breeding system on this farm (table 11.1). In the intensive system the breederwill need to build six paddocks, each with an area of 400 m2, a 20-m2 water tank,and a 40-m2 sheltered area. Three reproduction groups, each comprising a male
Captive Breeding Programs [179]
Part 2 (ch9-12) 5/7/04 2:24 PM Page 179

and eight females, will occupy three of those paddocks. The other three paddockswill be designated for juvenile growth. In the semi-intensive system the breeder willneed to surround two hectares (20,000 m2) with a 1.5-m high wire fence around thelake to contain a breeding group comprising three males and twenty-four females,which will be captured on the farm. It will also necessary to build a trap for animalhandling. For the ranching system the breeder will need to build two panel traps,establish electrified fences around crops to avoid damage, and increase the carry-ing capacity of the habitat by enriching the habitat with supplementary food—e.g.,elephant grass—that capybara groups can use throughout the year in order to in-crease their production.
To estimate farm expenses (table 11.2) and incomes (table 11.3) from the threebreeding systems, we used a spreadsheet for computing costs and expenses de-signed by researchers at the Economics Department at ESALQ/USP. Intensive andsemi-intensive productivity data are from Nogueira (1997) and Nogueira-Filho(1996), respectively. Currently, there are no data available on the productivity ofcapybara ranching in Brazil; therefore we used the natural productivity data fromGonzález-Jiménez (1995). We considered an extraction quota of 30%, the experi-mental extraction quota currently allowed by IBAMA.
In spite of the apparent high annual potential net income (table 11.3), the smallscale of commercialization limits actual profits. Only a few big producers can selltheir production directly to the consumers, mainly restaurants, and so obtain thehighest incomes. Most capybara farmers sell their production to intermediarieswho pay only US$ 1.5 per kilogram of animal live weight. Therefore, farmers mustorganize themselves to sell their joint production directly to the consumers and toobtain additional income through the industrialization of capybara leather and fat(Nogueira-Filho and Nogueira 2000).
Ranching incurs the lowest expense per kilogram of animal produced (table 11.2)but also the lowest financial return (table 11.3). Contrary to the situation in the
[180] Captive Breeding Programs
TABLE 11.1 Initial Expenses for the Maintenance of Twenty-four Female and Three MaleAdult Capybaras in Intensive, Semi-intensive, and Extensive Breeding Systems
initial expenses (us$) intensive semi-intensive extensive
Consultanta 500.00 500.00 500.00
IBAMAb 100.00 100.00 100.00
Purchase of animals 1,350.00 — —
Materials and labor for facilities building 6,820.00 4,500.00 1,500.00
Equipment 200.00 200.00 200.00
Total 8,970.00 5,300.00 2,300.00
aThe breeder needs to contract a consultant to develop the project.bThe breeder must pay an initial charge to IBAMA to legalize the project.
Part 2 (ch9-12) 5/7/04 2:24 PM Page 180

TABLE 11.2 Analysis of the Total Expense (per kg) of Live Animal Weight in Intensive,Semi-intensive, and Extensive Breeding Systems for Capybara
expense items
intensive
(us$) %
semi-
intensive
(us$) %
extensive
(us$) %
Feedinga 1.19 64.3 1.17 75.0 0.36 52.9
Labor 0.22 11.9 0.10 6.4 0.10 14.7
Capital interestsb 0.25 13.5 0.14 9.0 0.10 14.7
Fuel, electricity, and telephone 0.03 1.6 0.02 1.3 0.05 7.4
Veterinarian and medicines 0.04 2.2 0.04 2.6 0.02 2.9
Other expensesc 0.12 6.5 0.09 5.8 0.05 7.4
Total expense per kg of live
animal weight 1.85 100 1.56 100 0.68 100
aUS$ 7.00/t of Pennisetum purpureum grass, crushed and placed in the feeder (labor included) and US$ 0.15 per kg ofsupplementary growth ration—both used in intensive and semi-intensive system. US$ 5.00/t of grass grazed by the an-imals itself (expenses for pasture recovery) in the extensive system. bIncludes interests (6% per year) on total initial costscIncludes expenses with interests (6% per year) on operational capital, taxes, and commercialization expenses
TABLE 11.3 Projection of the Production, Costs, and Annual Incomes for Twenty-four Adult Female and Three Male Capybaras in Intensive, Semi-intensive,
and Extensive Breeding Systems
annual indices intensive
semi-
intensive extensive
Mean number of young 118.6 144 204.3
Number of commercial animals solda 110.2 134.4 69.4
Total weight of commercial animals (kg) 3,306.0 4,032.0 2,082.0
Total weight of discarded reproducers (kg) 173.3 173.3 —
Labor per kg of commercial animal produced
(hours) 0.4 0.1 0.1
Kg of food consumed/kg of commercial animalb 58.8 55.6 126.2
Facilities and equipment expenses per female (US$) 292.50 195.83 70.83
Hypothetical annual total production expenses
(US$) 6,438.00 6,568.00 1,992.00
Hypothetical annual net income (US$)c 5,743.00 8,151.00 5,295.00
aCurrently, the IBAMA adopts an annual extraction quota of 30%. bIn the extensive system the farmer will need to feed all animals but only a percent of the young will be slaughtered.cSelling the production at US $ 3.5/kg of animal live weight.
Part 2 (ch9-12) 5/7/04 2:24 PM Page 181

Venezuelan Llanos where ranchers incur only slaughter expenses, Brazilian breed-ers incur expenses for supplementary food and landscape management to maxi-mize the capybara carrying capacity. Furthermore, IBAMA does not allow breedersto slaughter the oldest animals. The rancher thus incurs expenses for all animalsbut obtains economic benefit only from animals born after ranching is implement-ed. Because natural predators are controlled in ranching, capybara density willgreatly increase after a few years. Therefore IBAMA extraction quotas should be in-creased in order to make this production system economically feasible. Breederswill incur further costs carrying out the studies required to win approval of a high-er extraction quota.
PART II. COLLARED PECCARY: SPECIES CHARACTERISTICS,PRODUCTS, AND BY-PRODUCTS
The collared peccary occurs throughout Brazil in habitats ranging from arid envi-ronments to tropical rainforest (Sowls 1997). Adult collared peccaries measurefrom 80 to 90 cm in length, 25 to 45 cm in height, and attain weights of up to 27kilograms in captivity (Emmons 1999; Nogueira-Filho 1999). Currently, peccarymeat is sold for up to US$ 10 per kilogram in the city of São Paulo. Unlike capybarameat, peccary meat is a preferred wildlife product throughout Brazil (Nogueira-Filho 1999) and is also the game meat most frequently sold at the urban market ofIquitos, Peru (Bodmer and Pezo 1999). The meat has 22.7% of crude protein andless than 1.5% of fat in its composition (Carrilo 1999). The species also produces ex-cellent quality thin, soft, durable, and stain-resistant leather, characteristics rarelyfound combined in any one leather (Bodmer and Pezo 1999).
The Province of Salta, Argentina, exported 12,600 peccary skins between theyears of 1988 and 1992, even though the trade was illegal. In Salta hunters receivethe equivalent to US$ 3 for each skin (Barbarán 1999), while tanned leather is of-fered to footwear manufacturers at US$ 45 per m2, and a pair of boots is offered tothe public for around US$ 150 (Barbarán 1999). The market is relatively stable be-cause Europeans traditionally use products made from peccary leather (Bodmerand Pezo 1999; Bodmer, Lozano, and Fang this volume). The United States pro-vides another important market; a pair of peccary gloves at Barneys, New York, re-tails for up to US$ 195.
Today the demand for peccary leather is met primarily by the harvest of naturalpopulations in Amazonian Peru (Bodmer and Pezo 1999) and by illegal hunting inseveral other South American countries, especially Brazil (Nogueira-Filho 1999).The collared peccary adapts well to captivity (Nogueira-Filho 1999), can supporthigh indices of extraction in natural populations (Bodmer 1999), and would be anideal animal for incorporation into agroforestry projects (Sowls 1997). For these rea-sons commercial projects are being developed in several South American countriesin order to exploit the species in a sustainable way (Bodmer 1999; Nogueira-Filho1999).
[182] Captive Breeding Programs
Part 2 (ch9-12) 5/7/04 2:24 PM Page 182

SOCIAL BEHAVIOR AND CAPTIVE MANAGEMENT
Collared peccaries live in stable and cohesive herds containing from six to thirty-four individuals with an approximately 1:1 sex ratio (Emmons 1999; Fragoso 1999).The smaller herd size may be characteristic of hunted areas or areas of low produc-tivity (J. Fragoso pers. comm.). Herd members eat, sleep, and forage together(Sowls 1997). In captive groups comprising individuals from different sources, how-ever, feeding and sleeping subgroups frequently form according to their origin, andfemales are more cohesive than males (Nogueira-Filho, Nogueira, and Sato 1999).Therefore, in order to avoid the occurrence of conflicts during feeding, severalfeeders must be available in the enclosures (Lima-Neto, Nogueira, and Nogueira-Filho 2001). Conflicts occur mainly because certain individuals retain definitedominance over others, but dominance ranks are ill defined (Diaz 1978; Sowls1997; Nogueira-Filho, Nogueira, and Sato 1999).
Captive groups tolerate the presence of several adult males without noticeableconflicts, even when receptive females are present. Unlike the situation with capy-bara groups, male and female subadult peccaries are also tolerated (Nogueira-Filho, Nogueira, and Sato 1999). Even though collared peccary groups usually re-ject the introduction of solitary animals into an established colony (Lochmiller and Grant 1982), they tolerate the introduction of groups of three or more relatedindividuals, which leads to the observed subgroup composition (Nogueira-Filho,Nogueira, and Sato 1999).
If the group contains unrelated or unfamiliar females at high densities, pregnantfemales should be isolated to farrow in order to avoid infanticide (Packard et al.1990; Nogueira-Filho 1999). However, this practice increases breeding expensesdue the need for special facilities and the lengthening of the interbirth interval (fe-males can have postpartum oestrus; López-Barbella 1993). One solution is to breedpeccaries at low densities of about 250 m2 per adult animal (Engel 1990), but thisrequirement implies the need to enclose large areas, a very expensive procedure forsmall producers because of the high prices of the wire fences and concrete or rockbase used in peccary farming (Nogueira-Filho 1999). The best solution, if the ruralproducer decides to adopt the semi-intensive production system, may be to buildsmall paddocks and set up groups only with related females. These paddocks willrange from 200 to 400 m2 each, according to group sizes and the breeder’s financialresources. Young animals produced from these groups can then be raised togetherfrom weaning to make up familiar groups in a larger area; this practice helps pre-vent later infanticide (Nogueira-Filho 1999).
FEEDING AND NUTRITION
Collared peccaries are largely frugivorous and also eat a wide variety of roots, tu-bers, greens, bulbs, and rhizomes (Kiltie 1981; Bodmer 1989; Sowls 1997; Fragoso1999). In captivity they adapt easily to different kinds of food, including cassava,
Captive Breeding Programs [183]
Part 2 (ch9-12) 5/7/04 2:24 PM Page 183

cassava hulls, pumpkin, grain corn, sorghum silage, corn silage, crushed sugarcane, and commercial ration for pigs (Liva et al. 1989; Nogueira-Filho 1999).
Collared peccaries have a forestomach with active fermentation (Langer 1979;Cavalcante-Filho et al. 1998), which has given rise to considerable speculation re-garding their ability to utilize coarse roughage by transforming the dietary fiber tousable volatile fatty acids (VFA) (Sowls 1997). Lochmiller et al. (1989) proposedthat the VFAs found in collared peccary forestomachs arise from noncellulosecomponents of the diet. Shively et al. (1984) concluded that fiber digestion in thecollared peccary is considerably lower than in true ruminants. Strey and Brown(1989) suggested that collared peccaries might be concentrate selectors, selectinghighly digestible forages and plant parts over forages with higher fiber contents. Inother studies Gallagher, Varner, and Grant (1984) and Comizzoli et al. (1997)showed that collared peccaries could digest forage like true ruminants, whileNogueira-Filho (1990) determined that this species could digest even low qualityroughage with high lignin contents and that peccaries could handle up to 30% ofroughage in their diet. This characteristic should reduce farm expenses and the de-pendence on external products through the use of coarse products like grasses andleaves from farm and agroindustry by-products.
The protein demand for adult collared peccary maintenance is relatively low,around 0.82 g N/kg0.75 a day, or 6.9% of crude protein (CP; Gallagher, Varner, andGrant 1984; Gary and Brown 1984). Part of this protein requirement could be fur-nished by nonnitrogen sources, such as urea (Leite et al. 2001). Daily digestible en-ergy needs are 148.5 kcal/ kg0.75 (Gallagher, Varner, and Grant 1984).
Growing young, on the other hand, have higher protein requirements. Differentlevels of crude protein (12, 15, or 18% CP) were tested in the diet of twelve collaredpeccaries in the initial phase of growth. Animals that received a higher protein ra-tion (18% CP) showed superior weight gain and better feed:gain ratio (F:C;Nogueira-Filho et al. 1991). These results are preliminary, and more experimentsare needed to determine the species’ nutritional demands in the growth phase.
In tests with an experimental growth ration with 16% of crude protein and 4,100kcal/kg of gross energy, an average daily weight gain of 80 g from 60 days to 120 daysof age was achieved with 380 g/day of dry matter intake, resulting in a F:C of 4.7:1.Between 120 and 300 days of age, an average daily weight gain of 55.1 g was ob-tained with 634 g/day of dry matter intake, for a F:C of 11.5:1. Above ten months ofage, when juveniles weighed 18.5 kg on average, the average daily gain weight was19 g with a F:C of 21.7:1. These data were used to estimate a mean slaughter weightfor collared peccaries of around 18.5 kg of animal live weight at ten months of age(Nogueira-Filho and Lavorenti 1997).
REPRODUCTION
From April 1986 through December 1991, forty-three young were born in twenty-sixcollared peccary litters at ESALQ/USP. Reproduction took place during the wholeyear, and gestation ranged from 140 to 148 days. Mean litter size was 1.6 (range 1–3),
[184] Captive Breeding Programs
Part 2 (ch9-12) 5/7/04 2:24 PM Page 184
with a male:female ratio of 43:57. Mean birth weight was 710 g and 617 g for malesand females, respectively. Females could reach sexual maturity at seven months, buton average females produced their first litter when they were 416 days old (( 88.9).The mean interbirth interval was 215.1 days (( 57.1) (Nogueira-Filho and Lavorenti1997). López-Barbella (1993) established that collared peccaries can come into es-trous at 46.0 ( 24.8 days postpartum (range from 14 to 92 days) and estimated 224.2 (63.8 days for the farrowing interval. However, he also found high fetal mortality andthe possibility of estrous without ovulation or low fertility in the first postpartum es-trous. Studies that provide data on the reproductive physiology of the collared pec-cary are necessary in order to improve management plans and productivity.
COLLARED PECCARY CAPTIVE -BREEDING SYSTEMS
INTENSIVE PRODUCTION SYSTEM
Currently only scientific breeders at universities or other research centers adopt theintensive production system in Brazil (e.g., Universidade Estadual de Santa Cruz,the Universidade Federal do Pará, and Centro de Multiplicação de Animais Sil-vestres, that is, CEMAS). In this breeding system family groups, comprising a maleand up to three females, are maintained in small pens that range from 12 to 40 m2.Alternatively, peccaries are maintained in small herds of up to fifteen individuals(maintaining a male to female ratio of 1: 4–5) in paddocks ranging from 100 to 600m2. Paddocks should contain a watering trough, feeders, and a sheltered area. Ad-ditional pens with 20 to 40 m2 are required for growth of young.
Females introduced in each one of the reproduction pens must belong to thesame family group in order to prevent fights and infanticide (Nogueira-Filho,Nogueira, and Sato 1999). The male could be from a different origin than the fe-males, ensuring genetic diversity. Adult animals are fed grain corn or cassava ataround 3.5% of live weight on a dry matter basis and ad libitum mineral salts.Pumpkins, bananas, or other fruits or foodstuffs available from farms are offered adlibitum. Meanwhile the young receive grain corn and a protein supplement (16%of crude protein) at 5% of live weight on a dry matter basis until they reach 12 kg oflive weight. After that the young receive the same diet as adult animals.
Usually, if the peccary herds are maintained in small pens, females are isolatedto farrow in an available free pen. In larger paddocks of at least 200 m2, the femalescan farrow inside the confinement area. In both situations, infants will stay with themother until they are sixty days old. Then they are weaned and transferred to a ju-venile growth pen until they reach the weight/age of 18.5kg/10 month (Nogueira-Filho 1999).
SEMI-INTENSIVE PRODUCTION SYSTEM
Currently there are twenty-one collared peccary commercial breeders in Brazil,most of them using the semi-intensive production system. Some breeders use areas
Captive Breeding Programs [185]
Ed.: specialcharactermissing?
Part 2 (ch9-12) 5/7/04 2:24 PM Page 185

of their farms that cannot be used for traditional agriculture because of edaphicand/or topographic factors. Other farmers use parts of their legal protection areas.The semi-intensive production system thus provides an alternative for the integraluse of the farms.
In semi-intensive production areas ranging from 1,000 to 50,000 m2 and includ-ing arboreal vegetation enclosed with wire fence on a concrete or rock base. Theseareas are used for farrowing females and growing young (Nogueira-Filho 1999).Peccaries are purchased from another breeder or captured in the wild in places inwhich they are considered agricultural pests and introduced into the paddock in aproportion of one male to four to five females. The captive group will increasethrough reproduction or by the introduction of new members from the wild orfrom captivity, up to a density of 250 m2 per adult animal. At this density infanticidedoes not occur (Engel 1990). One or more trapping devices are built in the breed-ing area, and mineral salts, grain corn, cassava, or supplementary ration are sup-plied in sheltered feeders within the traps. The number and size of trapping de-vices and feeders depends on the number of groups put together inside the area(Nogueira-Filho 1999; Lima-Neto, Nogueira, and Nogueira-Filho 2001).
Normally, the animals are fed cassava or grain corn, supplemented with pump-kin, banana, other fruits, and protein supplements, as in the intensive system.Fruits produced by trees inside the area are not considered in the feeding plan. Asin the case of capybara farming, this breeding system is considered semi-intensivebecause the group is maintained in a large area and because there is no individualcontrol on reproductive parameters. The infants are ear-tagged at approximatelysixty days of age. Weaning is natural and young grow up with the adults until theyreach the weight/age of 18 kg/10 months, at which time they are designated forslaughter or for the formation of new reproduction groups.
The main problem with this production system is that, at densities of less than250 m2 per adult animal, peccary rooting damages natural vegetation and can pro-voke erosion, primarily near the capture areas (Nogueira-Filho et al. 1991). Suchdamage can be minimized with the use of mobile panel traps, like those used totrap and handle feral pigs in the U.S.A. (Sweitzer et al. 1997).
EXTENSIVE PRODUCTION SYSTEM
Collared peccary herds harm cassava and other crops in some areas of Brazil (e.g.,southeastern Bahia) and are shot as agricultural pests (Nogueira-Filho and Nogueira2000). As with capybara, ranching allows the use and control of the species and pro-vides an alternative to destructive use of the land. However, to date there is no expe-rience in Brazil with collared peccary ranching. To develop a rational ranching sys-tem, we require information on the ecology of natural populations. Currently,several research institutions, UESC, EMBRAPA-Pantanal, CIRAD-EMVT andDICE (Durrell Institute of Conservation Ecology, University of Kent, are studyingpeccary ecology in northeastern Brazil and in the Pantanal as part of the project De-
[186] Captive Breeding Programs
Part 2 (ch9-12) 5/7/04 2:24 PM Page 186

velopment of Different Production Systems for the Sustainable Exploitation of theCollared Peccary in Latin America, which is financed by the European Commis-sion. Research on feeding ecology, habitat use, population size, reproductive pro-ductivity, and limiting and keystone resources during periods of low food productionis aimed at determining sustainable levels of collared peccary harvest.
As with capybara IBAMA will allow ranching only on an experimental basis. Allranched animals must be identified with electronic microchips, and only youngborn after ranching is implemented will be slaughtered. Once a selective quota isdetermined based on local population density, individuals will be live-captured inorder to allow selection of animals for slaughter. As in capybara ranching this pro-duction system requires specific husbandry practices, such as traps that capturemultiple animals, thus reducing the costs of trapping and handling.
ECONOMIC ANALYSIS OF THE THREE COLLARED PECCARYPRODUCTION SYSTEMS
We carried out a hypothetical comparison, based on data obtained from commer-cial breeders, of the farm expenses and income of a beef cattle farmer who wants tobreed collared peccaries using either of the three production systems. The farm hasan available area with arboreal native vegetation and abandoned pig facilities com-prising fourteen pens with 12 m2 each and four pens with 24 m2. In another part ofthe property, a group of twelve female and twelve male peccaries is harming a cas-sava crop meant for subsistence use by the farm workers.
In the intensive system the farmer will need to increase the height of the walls inthe old pig facilities with wire mesh to prevent peccaries from escaping. Eight re-production groups comprising one male and three females each will occupy eightof the 12-m2 pens. The other six pens will be used for farrowing, while the four 24-m2 pens will be used for juvenile growth. In the semi-intensive system the breed-er will need to surround 7,500 m2 with a 1.5-m high wire fence around the nativevegetation to create a breeding group of six males and twenty-four females pur-chased from another breeder. At least two panel traps will be built to handle the an-imals. For ranching the breeder will need to build two panel traps, establish elec-trified fences around crops to avoid damage, furnish supplementary food toanimals at the bait station, and increase the carrying capacity by enriching thehabitat with supplementary foods, such as abandoned crops of corn, sweet potato,and cassava that peccaries can use throughout the year (table 11.4).
We used the intensive productivity data from Nogueira-Filho and Lavorenti(1997) and semi-intensive productivity data from Nogueira-Filho (1999) to estimatefarm expenses and incomes from breeding systems (table 11.5). There are no avail-able data on productivity of Brazilian collared peccaries through ranching; there-fore we used the reproductive parameters in the wild from Bodmer (1999). Present-ly, there is no annual extraction quota established by IBAMA. Therefore we used aharvest level of 30% that was considered sustainable by Bodmer (1999).
Captive Breeding Programs [187]
Part 2 (ch9-12) 5/7/04 2:24 PM Page 187

As is the case for capybaras, ranching yields the lowest financial return (table11.6) because there will be expenses with all animals but economic return onlyfrom young born after ranching is implemented. Productivity is further limited bythe peccary’s 1:1 sex ratio.
In spite of the apparently highest annual potential net income (table 11.6), if our
[188] Captive Breeding Programs
TABLE 11.4 Initial Expenses for Maintenance of Twenty-four Female and Eight Male Adult Collared Peccaries in Intensive Breeding System, Twenty-four Females and Six Males in Semi-intensive System, and Twelve Females and Twelve Males in
Extensive Breeding System
initial expenses (us$) intensive
semi-
intensive extensive
Consultanta 500.00 500.00 500.00
IBAMAb 100.00 100.00 100.00
Purchase of animals 1,600.00 1,500.00 —
Materials and labor for facilities building or
adaptation 2,000.00 5,756.00 1,500.00
Equipment 400.00 200.00 200.00Total 4,600.00 8,056.00 2,300.00
aThe breeder needs to contract a professional consultant to develop the project.bThe breeder must pay an initial charge to IBAMA to legalize the project.
TABLE 11.5 Analysis of the Total Expenses (US$) (per kg) of Live Animal Weight ofCollared Peccaries in Intensive, Semi-intensive, and Extensive Breeding Systems
expense
items intensive %
semi-
intensive
(us$) %
extensive
(us$) %
Feedinga 1.47 42.5 0.94 39.7 0.37 15.9
Labor 0.47 13.5 0.13 5.5 0.50 21.5
Capital interestsb 0.56 16.3 0.77 32.5 0.84 36.0
Fuel, electricity, and
telephone 0.18 5.2 0.10 4.2 0.19 8.1
Veterinarian and medicines 0.36 10.4 0.21 8.8 0.19 8.1
Other expensesc 0.42 12.1 0.22 9.3 0.24 10.3
Total expense per kg of live
animal weight 3.46 100 2.37 100 2.33 100
aUS$ 0.08/kg of peccary rationbIncludes interests (6% per year) on total initial costs cIncludes expenses with interests (6% per year) on operational capital, taxes, and commercialization expenses
Part 2 (ch9-12) 5/7/04 2:24 PM Page 188

hypothetical beef cattle farmer chooses the semi-intensive production system toproduce collared peccaries, he will have some problems because of small-scalecommercialization. Most peccary farmers sell their production to intermediarieswho pay at most US$ 2.0 per kilogram of animal live weight, resulting in economicloss to the farmers. Thus farmers will need to market their production jointly to ob-tain better prices. They could also seek additional income through the industrial-ization of peccary leather.
CONCLUSION
Wildlife farming has been indicated as a possible source of animal protein for poorpopulations in developing countries because native mammals have specific advan-tages over domestic species (Lavorenti 1989; NRC 1991; González-Jiménez 1995).We suggest that wildlife farming should also be considered an alternative source ofincome for Brazilian farmers since wild animal meat is sold at high prices as an ex-otic product in Brazil’s largest cities (Nogueira-Filho and Nogueira 2000).
Captive Breeding Programs [189]
TABLE 11.6 Projection of the Production, Costs, and Annual Incomes for Twenty-fourFemale and Eight Male Adult Collared Peccaries in the Intensive Breeding System,
Twenty-four Females and Six Males in the Semi-intensive Breeding System, and TwelveFemales and Twelve Males in Extensive Breeding System
annual indices intensive
semi-
intensive extensive
Mean number of weaned young 27.6 51.5 23.0
Number of commercial animals solda 24.4 47.5 14.0
Total weight of commercial animals (kg) 451.7 879.4 259.0
Total weight of discarded reproducers (kg) 100.5 88.5 —
Labor per kg of commercial animal produced
(hours) 0.9 0.2 0.8
Kg of food consumed/kg of produced commercial
animalb 18.4 11.7 4.6
Facilities and equipment expenses per female
(US$)c 100.0 250.00 250.00
Hypothetical annual total production expenses
(US$) 1,909.00 2,291.00 985.00
Hypothetical annual net income (US$)d 300.00 1,581.00 52.60
aIn the extensive system we used an annual extraction quota of 30%. bIn the extensive system only supplementary food furnished to animals at the bait station was considered.cRemember that for the intensive system only expenses with facilities adaptation were considered. If we consideredbuilding expenses (US$ 75 per m2), the facilities and equipment expenses per female in intensive system will increaseto US$ 850.00. dSelling the production at US$ 4.00/kg of animal live weight
Part 2 (ch9-12) 5/7/04 2:24 PM Page 189
Relative to species of domesticated livestock, wild animals may thrive as meatproducers in their native habitat because they possess heat tolerance, resistance tolocal diseases and parasites, and overall hardiness and tolerance for poor nutrition-al conditions (Nogueira-Filho and Nogueira 2000). Another advantage is the small-er environmental damage they cause relative to domestic animal production—consider the environmental pollution and deforestation caused by pig or cattleproduction, respectively (Nogueira-Filho 1996; Nogueira-Filho 1999).
Wildlife captive breeding, in either full captivity or semi-confinement, is an al-ternative use for unproductive areas of agricultural holdings, which for one reasonor another are unfit for any other agricultural production. Also, in particular forBrazilian farmers, it is an economic alternative use for the legal protection area(Nogueira-Filho 1996, 1999). Semi-intensive captive breeding is not a high-tech orcapital-intensive agrobusiness. However, it is not always practical because of the re-ality of small-scale commercialization. Therefore, farmers must become organizedto sell their production jointly and directly to the consumers. Furthermore, the in-dustrialization of subproducts (e.g., leather) will encourage more farmers to con-sider wildlife breeding as an alternative for the integral use of their property and asa way to diversify production.
On the other hand, the extensive system or ranching is frequently considered thepreferred conservation/management tool because it gives farmers an alternative toconserve forests and wetlands by making wildlife a valuable resource. This activitycould be especially beneficial in places where wild animals are considered veryabundant or agricultural pests, as is the case for capybara in the Pantanal and col-lared peccaries in southeastern Bahia. Nevertheless, the projection of production,expenses, and annual incomes show that the ranching system for both capybara(table 11.3) and collared peccary (table 11.6) will only be economic feasible if har-vest levels are increased. Such a change in policy will only be possible throughstudies of the ecology of natural populations, aimed at improving landscape-scalemanagement to maximize carrying capacity. However, these studies are very ex-pensive, and they must be developed in each and every place where the breedersintend to establish an extensive system.
Because of the high cost of the intensive system and the lack of knowledge in theextensive system, Brazilian farmers are choosing the semi-intensive production sys-tem to breed wild animals. Nevertheless, it is still necessary to improve husbandrypractices to increase production and to lower costs in this system. We believe thatthe establishment of an efficient semi-intensive exploitation system of wild animalswill help create an economic alternative for land use that in turn will help to con-serve the natural ecosystem and its wildlife.
[190] Captive Breeding Programs
Part 2 (ch9-12) 5/7/04 2:24 PM Page 190
12Economic Analysis of Wildlife Use
in the Peruvian Amazon
RICHARD E. BODMER, ETERSIT PEZO LOZANO,
AND TULA G. FANG
Successful conservation programs often depend on practitioners and researchersintegrating the biological limitations of species with the social and economic reali-ties of people (Barbier 1992). Indeed, there has been considerable dialog about theneed to extend the reach of conservation biologists into the realms of social andeconomic analysis (McNeely 1988). The need to integrate biology with social andeconomic considerations is particularly relevant in tropical countries (Plotkin and Famolare 1992).
Conservation efforts must deal with all levels of wildlife use from local hunters tointernational trade. However, wildlife conservation efforts will only be successful ifthey focus on the level of wildlife use that ultimately influences hunting pressure.Economic analyses help determine what level is most critical. For example, there isdebate whether conservation efforts should be directed at the level of national andinternational trade and their corresponding policies, or at the local level and com-munity-based actions (Swanson 1992). This debate is particularly relevant in tropi-cal countries where funds for wildlife conservation are limited. The scarce fundingmust be used efficiently to have an impact on conservation.
This article uses economic analyses of wildlife use in the Peruvian Amazon tohelp determine where conservation efforts should be directed. Should the focus bedirected toward rural hunters who harvest wildlife, toward the national meat tradein urban markets, or toward the international pelt trade? Economic analyses alsoidentify factors that drive overhunting and strategies that can be used to reduceoverhunting of economically valuable species.
Wildlife and wildlife products in tropical forests are used for subsistence food, lo-cal meat markets, and national and international trade. Subsistence and commer-cial use of wildlife has traditionally been part of the economy in the Peruvian Ama-zon (Pinedo-Vasquez 1988; Dourojeanni 1990). Currently, wildlife is an importantresource for the regional economy in terms of subsistence food, local meat sales,
Part 2 (ch9-12) 5/7/04 2:24 PM Page 191

and international pelt exports. People from both the rural and urban sectors are in-volved with the commercial use of wildlife, with some uses being legal and othersillegal. In addition, the peccary (Tayassu pecari and T. tajacu) pelt trade in the Pe-ruvian Amazon is economically important both nationally and internationally(Bodmer et al. 1990).
Conserving wildlife in the Peruvian Amazon will have socioeconomic conse-quences because of the importance of wildlife to the rural sector, regional econo-my, and international trade. Restricting wildlife use will have negative economicconsequences to the people who subsist on and commercialize wildlife products.Likewise, overhunting will result in negative economic returns and a loss of biodi-versity. This paper is based on the premise that the well-managed use of wildlifewill result in continued subsistence benefits and economic returns, and will con-tribute to biodiversity conservation (Freese 1997a).
BACKGROUND: LEGAL STATUS OF WILDLIFE HUNTING IN THE PERUVIAN AMAZON
Due to excessive hunting during the professional pelt period between 1940 and1973, the Peruvian Ministry of Agriculture enacted a national management law in1973 that prohibited professional pelt hunting in the Peruvian Amazon. This legis-lation permitted the use of certain wildlife species for subsistence by rural Amazo-nians (Bodmer 1994). Skins obtained from these species could be commercializedif the pelt originated from an animal killed by subsistence hunters. The law pro-hibiting professional pelt hunters was apparently successful in curbing the pelttrade (COREPASA 1986; Bodmer, Fang, and Moya 1988b).
Subsequently, in 1976 the Ministry of Agriculture noted increasing sales ofwildlife meat in the city markets of Iquitos. To curb professional meat hunting, theMinistry of Agriculture enacted a management law in 1979 that restricted sale ofwildlife meat to cities under 3,000 inhabitants. Again, only animals listed as sourcesof subsistence wildlife meat could be commercialized. While the professionalmeat law appears to have curbed hunting, its implementation was fraught with dif-ficulty. Management authorities could not effectively control small unlicensedmeat vendors in city markets. The demand of wild game meat from urban popula-tions added to the problem of controlling meat sales. The 1979 law restrictingwildlife commercialization in city markets has had little effect on actual wildlifemeat sales, and such meat is currently openly sold in city markets.
More recently there have been a number of legislations in Peru dealing withwildlife use. Some promote captive breeding, while others are apply to hunting intimber and conservation concessions.
METHODS
Four representative sites in the Department of Loreto, northeastern Peru, wereused to evaluate hunting by rural people (fig. 12.1). The major landscape features of
[192] Economic Analysis of Wildlife Use
Part 2 (ch9-12) 5/7/04 2:24 PM Page 192
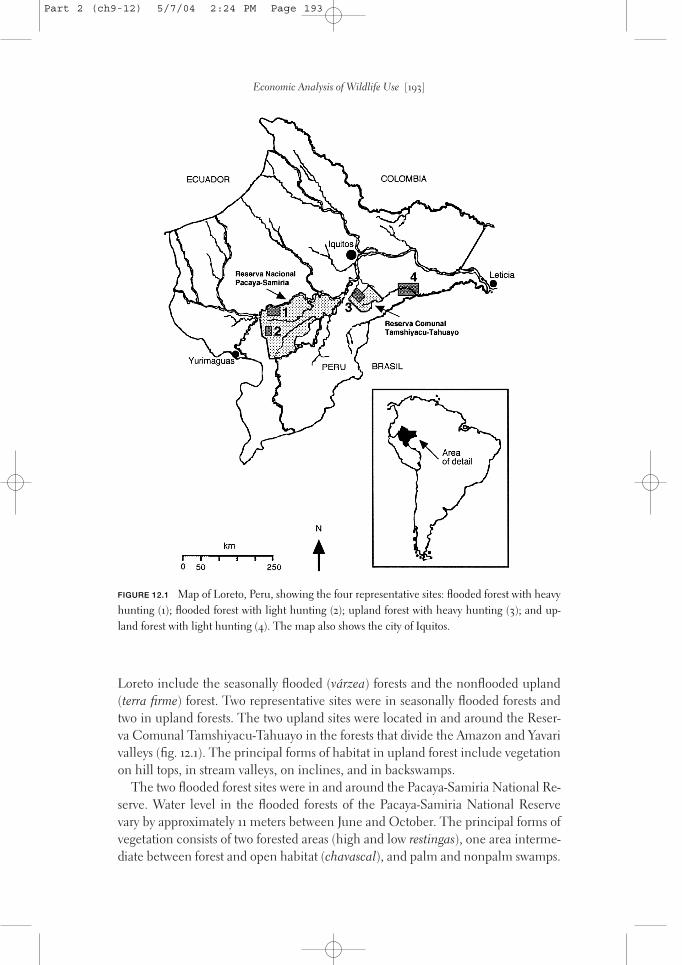
Loreto include the seasonally flooded (várzea) forests and the nonflooded upland(terra firme) forest. Two representative sites were in seasonally flooded forests andtwo in upland forests. The two upland sites were located in and around the Reser-va Comunal Tamshiyacu-Tahuayo in the forests that divide the Amazon and Yavarivalleys (fig. 12.1). The principal forms of habitat in upland forest include vegetationon hill tops, in stream valleys, on inclines, and in backswamps.
The two flooded forest sites were in and around the Pacaya-Samiria National Re-serve. Water level in the flooded forests of the Pacaya-Samiria National Reservevary by approximately 11 meters between June and October. The principal forms ofvegetation consists of two forested areas (high and low restingas), one area interme-diate between forest and open habitat (chavascal), and palm and nonpalm swamps.
Economic Analysis of Wildlife Use [193]
FIGURE 12.1 Map of Loreto, Peru, showing the four representative sites: flooded forest with heavyhunting (1); flooded forest with light hunting (2); upland forest with heavy hunting (3); and up-land forest with light hunting (4). The map also shows the city of Iquitos.
Part 2 (ch9-12) 5/7/04 2:24 PM Page 193

Data on hunting pressure were collected in the two flooded forest sites and thetwo upland forest sites. To cover the range of hunting pressures in Loreto, each for-est type had one site with greater hunting (heavily hunted) and another site withlesser hunting (lightly hunted).
HUNTING PRESSURE
Information on hunting pressure for all mammalian species was obtained by in-volving hunters in data collection in all four representative areas, totaling approxi-mately 100 hunters and their families. Studies were run for a minimum of threeyears at each site. Information was collected continuously by the hunters andrecorded by wildlife extensionists every few months. Hunting pressure was deter-mined by recording the number of animals hunted in each area from skulls col-lected by hunters and from hunting registers. An error margin was added to the cal-culation of hunting pressure to account for animals that were hunted but notrecorded either by skulls or registers. The error was calculated by determiningwhich local hunters were not participating in the study. The error margin variedbetween study sites.
The total number of mammals hunted annually in Loreto was estimated usingwildlife harvests from the four representative sites and the annual peccary pelt har-vests. We assumed that the annual peccary pelt harvests were a realistic estimate ofthe total number of peccaries harvested in Loreto, an assumption that appears valid(Pacheco 1983). The numbers of peccary pelts discarded by Peruvian hunters ap-pears to be balanced by the number of pelts entering Peru illegally from Colombia,Ecuador, and Brazil. We used the proportional harvests in the four representativesites to estimate the annual harvests of other mammalian species solving PH/PP =SPH/SPL, where PH is the peccary harvest in each of the four representative sites,PP the peccary pelt exports from Loreto, SPH the harvest in each of the four repre-sentative sites of the species being estimated, and SPL the estimated annual harvestin Loreto of that species. The peccary pelt harvest in the Department of Loreto wasestimated by government records of peccary pelt exports to Lima. This trade isclosely monitored since peccary pelts exported out of Peru must have a Depart-mental certificate before being issued a CITES certificate.
ECONOMIC ANALYSIS
The economic analysis of wildlife use was done for both the rural and urban sec-tors. The rural sector consisted of the transactions of wildlife meat prior to beingsold by market vendors. This sector includes hunters, carriers, and intermediaries.The urban sector consists of market vendors and urban consumers. Market vendorsusually buy meat from carriers or intermediaries and then sell meat to the public incity markets.
To evaluate the economic value of wildlife meat in the rural areas, prices of meat
[194] Economic Analysis of Wildlife Use
Part 2 (ch9-12) 5/7/04 2:24 PM Page 194

sales in twenty towns and villages were determined from informal interviews at rep-resentative sites along the Rio Yavari, Rio Tigre, Rio Marañon, and Rio Amazonas.There are numerous ways that wildlife meat is transacted by the rural sector; thesemethods are outlined in Bendayán (1991). Hunters usually have to pay transporta-tion costs and/or intermediaries in order to sell wildlife meat in Iquitos, the largestcity in Loreto. The transportation and intermediary costs for hunters varies prima-rily depending on (a) distance to markets and (b) knowledge hunters have aboutmarkets. From informal interviews conducted at the four representative sites, weestimated that transportation and intermediary costs to hunters were between 40 to80% of the income earned from meat sales, with an estimated average of 60%.
To analyze the economic importance of wildlife meat in the urban sector, weconducted a year-long survey of wildlife meat sales in the city markets of Iquitos, thecapital of the Department of Loreto with a population of around 274,759 inhabitants(INEI 1993). For comparison, in rural Loreto, which covers an area of 368,851 km2,there are around 412,523 inhabitants, of which 123,663 live in towns (INEI 1995).Wildlife meat sales were surveyed in the Mercado Belén and Mercado Modelo inIquitos. Bendayán (1991) showed that 91% of meat sales in Iquitos took place at thesetwo markets, with the other markets in Iquitos only selling small amounts. Thesesales were recorded from January through December 1996 for all months expectMay. Sales for May were extrapolated from the averages of April and June.
Surveys were conducted through interviews with market vendors. All marketvendors were surveyed between 6 and 11 a.m. daily Monday through Saturday. Mar-kets were closed on Sundays. During some months surveys were not conductedevery day. During these months the averages from days surveyed were used for daysnot surveyed.
Market vendors participated willingly in the study. They were informed of thepurpose of the study and that their names would be kept confidential. During theyear of the survey there were no decommissions of wildlife meat from the markets,and market vendors did not fear loosing their products.
Information obtained during the surveys was recorded separately for eachspecies and included the kilograms sold daily and the prices of sales. Prices weredetermined for meat bought and for meat sold in the markets of Iquitos. Meatbought represents the price paid to the rural sector, including the hunters, carriers,and middlemen. The difference between the price bought and sold represents theprofit to market vendors. The number of vendors selling wildlife meat during theday was also recorded.
The number of individual animals sold at market was estimated by convertingthe kilogram of meat sold to individuals. Wildlife meat is sold in four distinct formsin Iquitos: fresco (fresh), ahumado (smoked), seco salado (dry salted), and fresco sa-lado (fresh salted). Dried salted and smoked meat had a conversion of 40% of liveweight, whereas fresh and fresh salted had a conversion of 60% of live weight. Av-erage body weights were used for each species and the total number of individualsof each species sold annually in Iquitos was then estimated.
Economic Analysis of Wildlife Use [195]
Part 2 (ch9-12) 5/7/04 2:24 PM Page 195

RESULTS
HUNTING PRESSURE
The site with greatest annual hunting pressure was the heavily hunted upland for-est (255 individuals/100 km2), followed by the heavily hunted flooded forest (133 in-dividuals/100 km2). The flooded forest with lighter hunting had slightly more mam-mals harvested per year than the upland forest with lighter hunting (73 and 54,respectively). In both upland forests and the lightly hunted flooded forest, ungu-lates were the most frequently hunted group (Bodmer and Pezo 2001). In the heav-ily hunted flooded forest, rodents were the most frequently hunted group.
Ungulates had much greater amounts of biomass extracted than the otherspecies in all four sites and were the most important species for meat. In terms ofbiomass extracted, rodents were the next most important, followed by primates,marsupials, edentates, and carnivores. White-lipped peccary, collared peccary, andlowland tapir (Tapirus terrestris) had the greatest amount of meat extracted fromthe representative forest sites (Bodmer and Pezo 2001).
ECONOMICS OF WILDLIFE FOR THE RURAL SECTOR OF LORETO
There are an estimated 113,000 mammals hunted in Loreto annually. The averageannual white-lipped peccary harvests are 14,000; collared peccary, 20,000; brocketdeer (Mazama spp.), 5,000; lowland tapir, 4,000; paca (Agouti paca), 17,000; agouti(Dasypracta fuliginosa), 10,000; and primates, 28,000. Using these estimates, thevalue of wildlife meat for the rural sector is estimated at US$ 1,131,910 annually(Bodmer and Pezo 2001). Lowland tapir has the greatest annual meat value for therural sector of US$ 291,235, followed by collared peccary at US$ 268,853, white-lipped peccary at US$ 237,512, primates at US$ 104,617, and paca at US$ 75,447.
THE URBAN MEAT MARKET
The number of individuals of each species annually sold in the Iquitos meat mar-kets was estimated from the market surveys. A total of sixteen mammal species weresold during the study. The greatest number of individuals sold in the Iquitos marketwere from collared peccary with an estimated 2,542 individuals sold annually, fol-lowed by white-lipped peccary with 2,316 individuals, and paca with 1,860 individu-als (table 12.1). There were fewer individuals of the other large wildlife species soldin the Iquitos meat markets with an estimate of only 232 red brocket deer (M. ame-ricana), 110 wooly monkeys (Lagothrir lagothrica), 76 grey brocket deer (M. gova-zovoira), 76 capybara (Hydrochaeris hydrochaeris), and 43 lowland tapir.
An estimated 72,972 kg of wildlife meat was sold in the Iquitos meat markets dur-ing 1996. By weight, the most frequently sold meat was white-lipped peccary, con-tributing 42.6% of all wildlife meat sales. The next most frequently sold was col-
[196] Economic Analysis of Wildlife Use
Part 2 (ch9-12) 5/7/04 2:24 PM Page 196
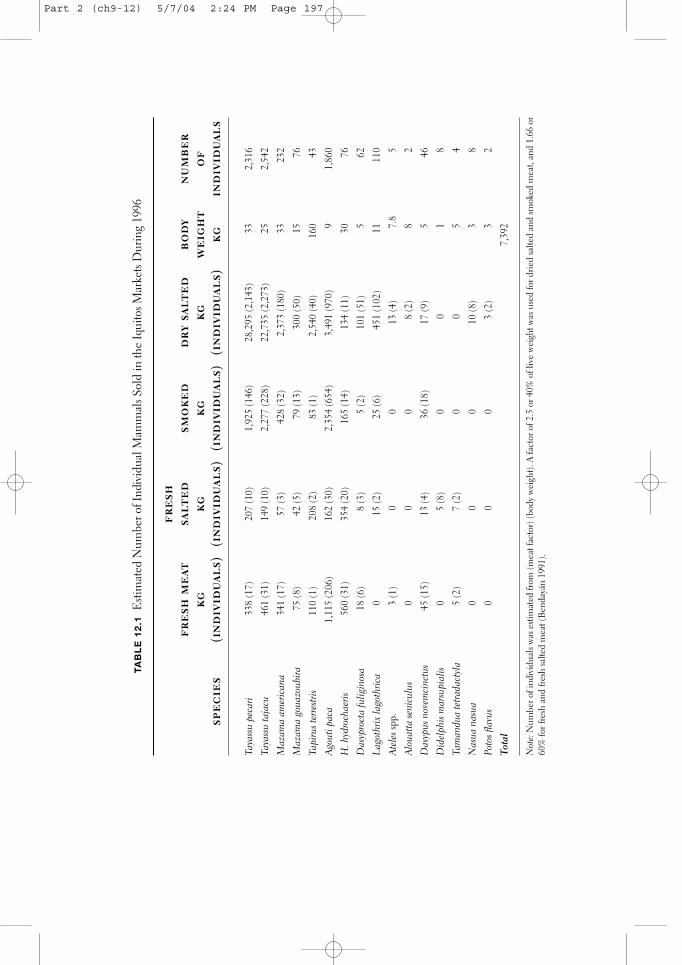
TA
BL
E 1
2.1
Esti
mat
ed N
umbe
r of I
ndiv
idua
l Mam
mal
s Sol
d in
the
Iqui
tos M
arke
ts D
urin
g 19
96
sp
ec
ie
s
fr
esh
m
eat
kg
(in
div
id
ua
ls)
fr
esh
sa
lt
ed
kg
(in
div
id
ua
ls)
sm
ok
ed
kg
(in
div
id
ua
ls)
dr
y sa
lt
ed
kg
(in
div
id
ua
ls)
bo
dy
we
ig
ht
kg
nu
mb
er
of
in
div
id
ua
ls
Taya
ssu
peca
ri33
8 (1
7)20
7 (1
0)1,
925
(146
)28
,295
(2,1
43)
332,
316
Taya
ssu
taja
cu46
1 (3
1)14
9 (1
0)2,
277
(228
)22
,735
(2,2
73)
252,
542
Maz
ama
amer
ican
a34
1 (1
7)57
(3)
428
(32)
2,37
3 (1
80)
3323
2
Maz
ama
goua
zoub
ira75
(8)
42 (5
)79
(13)
300
(50)
1576
Tapi
rus t
erre
stris
110
(1)
208
(2)
83 (1
)2,
540
(40)
160
43
Agou
ti pa
ca1,
115
(206
)16
2 (3
0)2,
354
(654
)3,
491
(970
)9
1,86
0
H. h
ydro
chae
ris56
0 (3
1)35
4 (2
0)16
5 (1
4)13
4 (1
1)30
76
Das
ypro
cta
fulig
inos
a18
(6)
8 (3
)5
(2)
101
(51)
562
Lago
thrix
lago
thric
a0
15 (2
)25
(6)
451
(102
)11
110
Atel
essp
p.3
(1)
00
13 (4
)7.
85
Alou
atta
seni
culu
s0
00
8 (2
)8
2
Das
ypus
nov
emci
nctu
s45
(15)
13 (4
)36
(18)
17 (9
)5
46
Did
elph
is m
arsu
pial
is0
5 (8
)0
01
8
Tam
andu
a te
trada
ctyl
a5
(2)
7 (2
)0
05
4
Nas
ua n
asua
00
010
(8)
38
Poto
s flav
us0
00
3 (2
)3
2
Tota
l7,
392
Not
e:N
umbe
r of i
ndiv
idua
ls w
as e
stim
ated
from
(mea
t fac
tor)
(bod
y w
eigh
t). A
fact
or o
f 2.5
or 4
0% o
f liv
e w
eigh
t was
use
d fo
r drie
d sa
lted
and
smok
ed m
eat,
and
1.66
or
60%
for f
resh
and
fres
h sa
lted
mea
t (B
enda
yán
1991
).
Part 2 (ch9-12) 5/7/04 2:24 PM Page 197
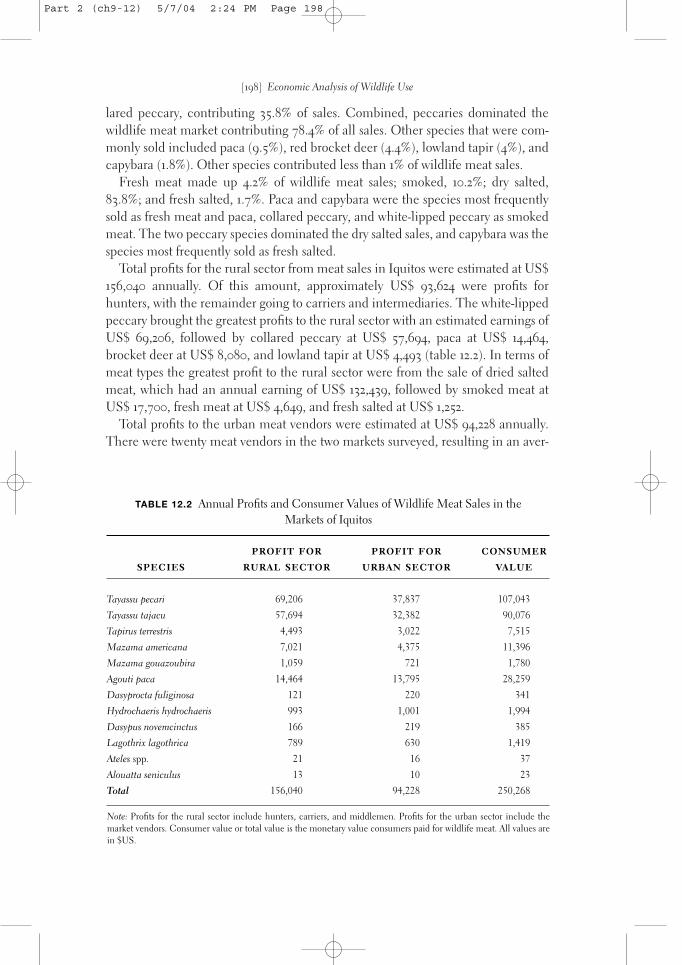
lared peccary, contributing 35.8% of sales. Combined, peccaries dominated thewildlife meat market contributing 78.4% of all sales. Other species that were com-monly sold included paca (9.5%), red brocket deer (4.4%), lowland tapir (4%), andcapybara (1.8%). Other species contributed less than 1% of wildlife meat sales.
Fresh meat made up 4.2% of wildlife meat sales; smoked, 10.2%; dry salted,83.8%; and fresh salted, 1.7%. Paca and capybara were the species most frequentlysold as fresh meat and paca, collared peccary, and white-lipped peccary as smokedmeat. The two peccary species dominated the dry salted sales, and capybara was thespecies most frequently sold as fresh salted.
Total profits for the rural sector from meat sales in Iquitos were estimated at US$156,040 annually. Of this amount, approximately US$ 93,624 were profits forhunters, with the remainder going to carriers and intermediaries. The white-lippedpeccary brought the greatest profits to the rural sector with an estimated earnings ofUS$ 69,206, followed by collared peccary at US$ 57,694, paca at US$ 14,464,brocket deer at US$ 8,080, and lowland tapir at US$ 4,493 (table 12.2). In terms ofmeat types the greatest profit to the rural sector were from the sale of dried saltedmeat, which had an annual earning of US$ 132,439, followed by smoked meat atUS$ 17,700, fresh meat at US$ 4,649, and fresh salted at US$ 1,252.
Total profits to the urban meat vendors were estimated at US$ 94,228 annually.There were twenty meat vendors in the two markets surveyed, resulting in an aver-
[198] Economic Analysis of Wildlife Use
TABLE 12.2 Annual Profits and Consumer Values of Wildlife Meat Sales in the Markets of Iquitos
species
profit for
rural sector
profit for
urban sector
consumer
value
Tayassu pecari 69,206 37,837 107,043
Tayassu tajacu 57,694 32,382 90,076
Tapirus terrestris 4,493 3,022 7,515
Mazama americana 7,021 4,375 11,396
Mazama gouazoubira 1,059 721 1,780
Agouti paca 14,464 13,795 28,259
Dasyprocta fuliginosa 121 220 341
Hydrochaeris hydrochaeris 993 1,001 1,994
Dasypus novemcinctus 166 219 385
Lagothrix lagothrica 789 630 1,419
Ateles spp. 21 16 37
Alouatta seniculus 13 10 23
Total 156,040 94,228 250,268
Note: Profits for the rural sector include hunters, carriers, and middlemen. Profits for the urban sector include themarket vendors. Consumer value or total value is the monetary value consumers paid for wildlife meat. All values arein $US.
Part 2 (ch9-12) 5/7/04 2:24 PM Page 198

age annual income per vendor at US$ 4,711 or US$ 393 per month. White-lippedpeccary brought the greatest annual profits for the market vendors at US$ 37,837,followed by collared peccary at US$ 32,382, paca at US$ 13,795, brocket deer atUS$ 5,096, and lowland tapir at US$ 3,022. The greatest profit to the market ven-dors was from the sale of dried salted meat, which had an annual earning of US$71,024, followed by smoked meat at US$ 14,736, fresh meat at US$ 6,885, and freshsalted meat at US$ 1,583.
Consumers spent US$ 250,268 annually on wildlife meat in the Iquitos markets.This amount reflects the total value of wildlife meat sales in Iquitos. White-lippedpeccary had the greatest value, followed by collared peccary, paca, brocket deer,and tapir. Dried salted meat had the greatest total value followed by smoked meat,fresh meat, and fresh salted meat.
The amount of wildlife meat sold in Iquitos has increased over threefold duringthe ten-year period from 1986 to 1996, amounting to an increase of 48,911 kg ofmeat (1986 survey of the markets is from Bendayán 1991) (table 12.3). The largest in-crease in meat sales was for white-lipped peccary, which has increased by 27,447kg/year, followed by collared peccary by 14,888 kg/year, brocket deer by 2,468kg/year, and paca by 2,047 kg/year.
COMPARING THE RURAL AND URBAN SECTORS
Wildlife harvests in the rural sector were compared to wildlife sold in Iquitos. Over-all, only 6.5% of the mammals hunted in Loreto were sold in the markets of Iquitos(table 12.4). The remainder was used in the rural sector as subsistence food or were
Economic Analysis of Wildlife Use [199]
TABLE 12.3 Differences in the Sale of Wildlife Meat in the Markets of Iquitos Over a Ten-year Period
species or
species group kg sold in 1986 kg sold in 1996 difference
Tayassu pecari 3,654 31,101 +27,447
Tayassu tajacu 11,211 26,099 +14,888
Mazama spp. 1,305 3,773 +2,468
Tapirus terrestris 1,584 2,905 +1,321
Agouti paca 4,855 6,902 +2,047
Dasyprocta fuliginosa 298 130 –168
Hydrochaeris hydrochaeris 572 1,332 +760
Primates 315 536 +221
Marsupials and Edentates 180 22 –158
Carnivores 36 15 –21
Total 24,010 72,921 +48,911
Part 2 (ch9-12) 5/7/04 2:24 PM Page 199

sold in villages and towns. White-lipped peccary had the greatest proportion of itsharvest sold in Iquitos with 16% going to market, followed by collared peccary with13%, paca with 11%, and brocket deer with 6%. The lowland tapir had only 1% of itsharvest sold in Iquitos, while primates only had 0.4%.
SUPPLY AND DEMAND OF MEAT TYPES
The type of meat sold was used to examine supply and demand relationships. Forhunters there was no supply and demand relationship between the price paid tothe rural sector and the supply of meat types (fig. 12.2a). In contrast, market vendorswere driven by supply and demand of meat types (fig. 12.2b). Fresh and smokedmeat has a small supply and prices sold to consumers were high. On the otherhand, supply of dried salted meat was large, and prices sold to consumers werelower.
Hunters and market vendors see the economics of wild game meat from differ-ent perspectives. Hunters are concerned with the number of animals killed interms of individuals because animals are hunted as individuals. In contrast, marketvendors are interested in the kilogram of meat and the type of meat since theirearnings depend on the amount of meat bought and sold.
For example, the price paid to hunters for peccary and deer meat is about thesame in terms of the kilogram per live animal whether it is fresh, smoked, or driedsalted. This relationship is important for the hunters since the price paid for an an-imal hunted is about the same. Therefore hunters consider effort and logistics in-volved in preparing the type of meat they sell. Fresh meat has little effort in terms
[200] Economic Analysis of Wildlife Use
TABLE 12.4 Percent of Mammals Hunted in Loreto That Are Sold in Iquitos Markets Versus the Percent Used in the Rural Sector for Subsistence Food or
for Sale in Villages and Towns
species or
species groups
percent of
harvest sold
in iquitos
percent of harvest
used for subsistence
or sold in rural areas
Tayassu pecari 16 84
Tayassu tajacu 13 87
Mazama spp. 6 94
Tapirus terrestris 1 99
Agouti paca 11 89
Dasyprocta fuliginosa 0.6 99.4
H. hydrochaeris 4 96
Primates 0.4 99.6
Marsupials and Edentates 1 99
Carnivores 0.1 99.9
Total 6.5 93.5
Part 2 (ch9-12) 5/7/04 2:24 PM Page 200

of preparation but can only be sold if the animals are hunted close to the city.Smoked meat has little financial input but takes much effort in time required tosmoke meat and maintain it in a sellable condition. Dried salted meat takes finan-cial input for salt but much less effort in time spent preparing meat. Also, saltedmeat usually lasts longer than smoked.
Most peccary and deer meat is prepared as dried salted since these species are rarein forests close to the city and are usually hunted in remote areas at distances too farfrom the city to sell as fresh meat. Hunters receive considerably more money forfresh paca than for smoked or dried salted paca. Thus, hunters prefer to sell freshpaca meat. Paca can still be hunted in areas close enough to the city to be sold fresh.
SEASONAL CHANGES IN SUPPLY AND DEMAND
Supply and demand relationships can also be examined between low- and high-wa-ter seasons for the sale of peccary meat in Iquitos. Substantially more peccary meat
Economic Analysis of Wildlife Use [201]
FIGURE 12.2 Supply and demand relationship of meat bought and sold in the Iquitos meatmarkets.
Part 2 (ch9-12) 5/7/04 2:24 PM Page 201
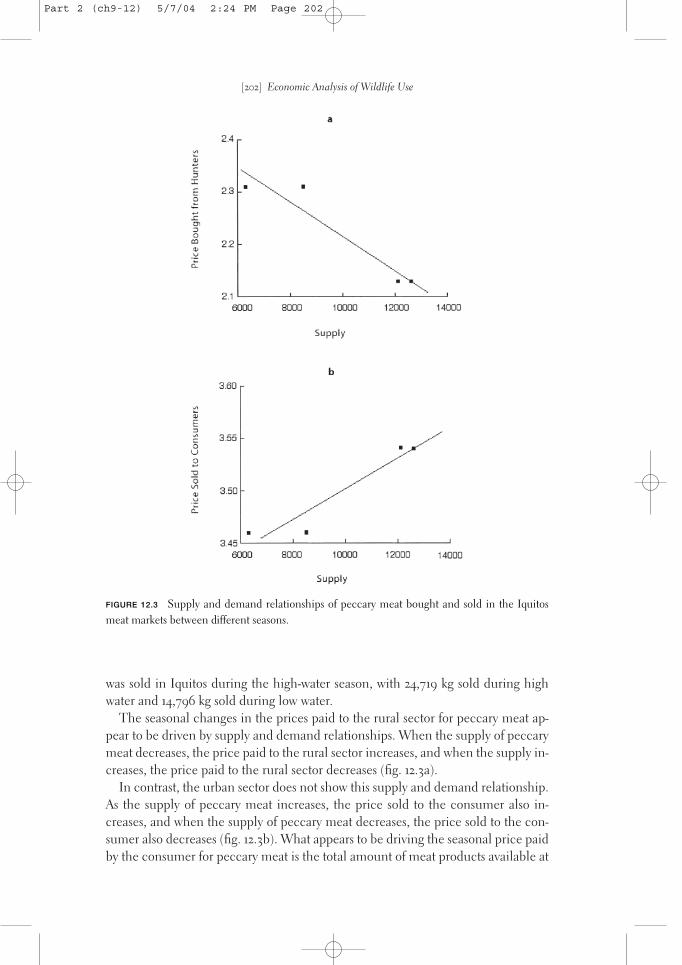
was sold in Iquitos during the high-water season, with 24,719 kg sold during highwater and 14,796 kg sold during low water.
The seasonal changes in the prices paid to the rural sector for peccary meat ap-pear to be driven by supply and demand relationships. When the supply of peccarymeat decreases, the price paid to the rural sector increases, and when the supply in-creases, the price paid to the rural sector decreases (fig. 12.3a).
In contrast, the urban sector does not show this supply and demand relationship.As the supply of peccary meat increases, the price sold to the consumer also in-creases, and when the supply of peccary meat decreases, the price sold to the con-sumer also decreases (fig. 12.3b). What appears to be driving the seasonal price paidby the consumer for peccary meat is the total amount of meat products available at
[202] Economic Analysis of Wildlife Use
FIGURE 12.3 Supply and demand relationships of peccary meat bought and sold in the Iquitosmeat markets between different seasons.
Part 2 (ch9-12) 5/7/04 2:24 PM Page 202

market. During the dry season when peccary meat supplies are low, the total supplyof meat products is at its greatest because the supply of fish is at its highest. Duringthe flooded season the supply of peccary meat is at its greatest, but the total supplyof meat products is at its lowest because of a decrease in the supply of fish.
VALUE OF THE PECCARY PELT TRADE
Pelts from species listed as subsistence wildlife can be legally exported for commer-cial profits from Peru if the species is not listed on Appendix I of CITES. However,in Peru peccary pelts are the only legally exported mammalian pelt that has any sig-nificant economic importance. Peccary pelts are sold principally to West Germany,Italy, Japan, and the United States (table 12.5). Peccary leather is used mainly forgloves, shoes, belts, and watchbands. The peccary pelt market is relatively stablebecause peccary products have traditionally been used by continental Europeans.Peccary leather is prized for its softness and durability, two qualities that are rarelyfound in a single leather.
The peccary pelt trade has economic value to rural hunters. Rural hunters inLoreto usually sell peccary pelts between US$ 2 to US$ 5 and obtain approximate-ly US$ 74,500 annually. However, the total value of peccary meat for hunters isaround US$ 633,265 annually, including the value of both subsistence food andmarket sales. Thus, pelts only contribute around 11% of the total value of peccariesfor rural hunters.
Peccary pelts are bought by intermediaries who air cargo the skins to tanneries inLima and Arequipa. The tanneries carry out the initial tanning process, which in-volves rehumidifying, degreasing, and chrome tanning. Peccary hides are then ex-ported at approximately US$ 16 each. The national intermediaries and tannerieshave substantial costs because of air transportation, tannery equipment, supplies,labor, government taxes, and CITES permits. Profits for the pelts are approximate-
Economic Analysis of Wildlife Use [203]
TABLE 12.5 Exports of Collared and White-lipped Peccaries from Peru
country product
collared
peccary
white-lipped
peccary
Germany Skins 163,175 83,572
Gloves 449 1,540
Italy Skins 69,239 38,693
Japan Skins 9,822 6,080
USA Skins 615 200
Specimens 20 15
Uruguay Skins 256 64
France Gloves 150 —
Total 243,726 130,164
Part 2 (ch9-12) 5/7/04 2:24 PM Page 203
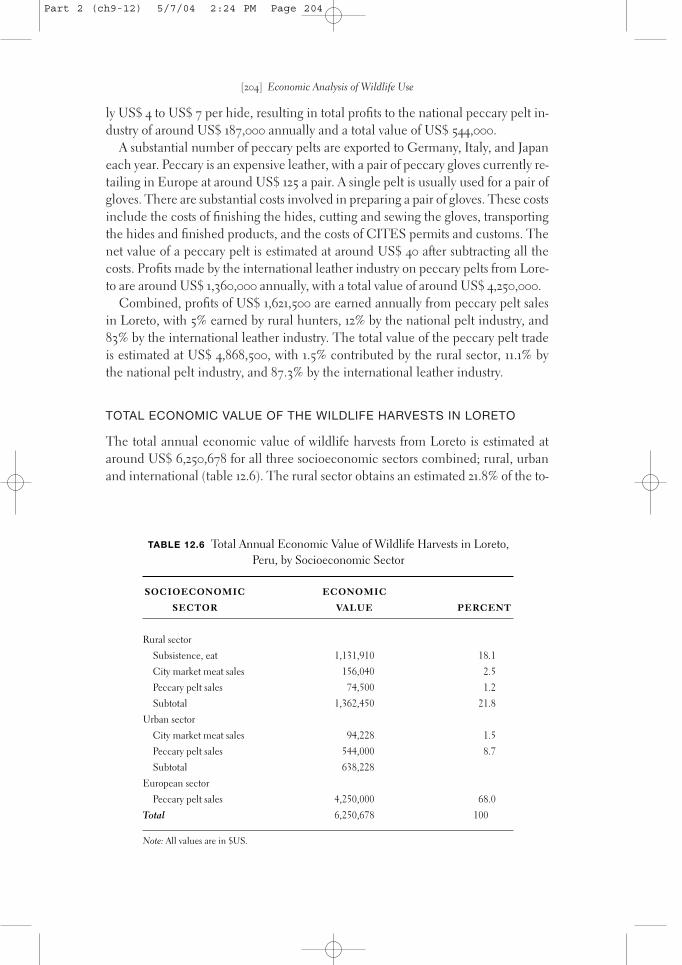
ly US$ 4 to US$ 7 per hide, resulting in total profits to the national peccary pelt in-dustry of around US$ 187,000 annually and a total value of US$ 544,000.
A substantial number of peccary pelts are exported to Germany, Italy, and Japaneach year. Peccary is an expensive leather, with a pair of peccary gloves currently re-tailing in Europe at around US$ 125 a pair. A single pelt is usually used for a pair ofgloves. There are substantial costs involved in preparing a pair of gloves. These costsinclude the costs of finishing the hides, cutting and sewing the gloves, transportingthe hides and finished products, and the costs of CITES permits and customs. Thenet value of a peccary pelt is estimated at around US$ 40 after subtracting all thecosts. Profits made by the international leather industry on peccary pelts from Lore-to are around US$ 1,360,000 annually, with a total value of around US$ 4,250,000.
Combined, profits of US$ 1,621,500 are earned annually from peccary pelt salesin Loreto, with 5% earned by rural hunters, 12% by the national pelt industry, and83% by the international leather industry. The total value of the peccary pelt tradeis estimated at US$ 4,868,500, with 1.5% contributed by the rural sector, 11.1% bythe national pelt industry, and 87.3% by the international leather industry.
TOTAL ECONOMIC VALUE OF THE WILDLIFE HARVESTS IN LORETO
The total annual economic value of wildlife harvests from Loreto is estimated ataround US$ 6,250,678 for all three socioeconomic sectors combined; rural, urbanand international (table 12.6). The rural sector obtains an estimated 21.8% of the to-
[204] Economic Analysis of Wildlife Use
TABLE 12.6 Total Annual Economic Value of Wildlife Harvests in Loreto,Peru, by Socioeconomic Sector
socioeconomic
sector
economic
value percent
Rural sector
Subsistence, eat 1,131,910 18.1
City market meat sales 156,040 2.5
Peccary pelt sales 74,500 1.2
Subtotal 1,362,450 21.8
Urban sector
City market meat sales 94,228 1.5
Peccary pelt sales 544,000 8.7
Subtotal 638,228
European sector
Peccary pelt sales 4,250,000 68.0
Total 6,250,678 100
Note: All values are in $US.
Part 2 (ch9-12) 5/7/04 2:24 PM Page 204

tal value, the urban sector in Peru 10.2% and the international sector obtains thegreatest proportion at 68%.
The meat markets in Iquitos only account for 3% of the total estimated value ofwildlife harvests. Subsistence food and sales in small villages and towns in the ruralsector account for 18.1% of the total estimated value. The greatest value is for thepeccary pelt trade, which accounts for 79%. However, most of the value of the pec-cary pelt trade is in the international sector, not in Peru.
DISCUSSION
Economic value of different wildlife species varies considerably between the ruraland urban sectors. In the Iquitos markets the lowland tapir and primates made upvery little of the annual value. In contrast, in the rural sector, lowland tapir and pri-mates are very important sources of wildlife meat.
Results from this study clearly show the importance of the rural sector in the useof wildlife meat. The results also show that the Iquitos wildlife meat market onlyconsumes a small part of the wildlife harvests in Loreto. Totally prohibiting thewildlife meat markets in Iquitos would only result in a 6.5% reduction of the totalharvests of Loreto. Legalizing the wildlife meat markets might promote a furtheruncontrolled and unmanaged hunt, which would lead to greater overharvestingand more local extinctions. In Iquitos there has been a threefold increase inwildlife meat sales over the past ten years.
These results show the importance of managing wildlife hunting with a focus onthe rural sector, not the Iquitos meat markets. Management programs directed athunters, villages, and towns of rural Loreto are imperative for the success of wildlifemanagement in the Peruvian Amazon.
Management of wildlife in Loreto must reduce overhunting. Previous studies inthe four representative areas of Loreto have shown that primates and lowland tapirare usually overhunted, while peccaries, deer, and large rodents are usually not(Bodmer, Eisenberg, and Redford 1997). Therefore wildlife management programsneed to reduce the hunting of primates and lowland tapir and maintain a sustain-able harvest of peccaries, deer, and large rodents.
There will be short-term economic costs if overhunting is reduced in Loreto.These economic costs can be estimated by examining what happens if the huntingof primates, lowland tapirs, carnivores, edentates, and marsupials is stopped, andthe current harvest levels of peccaries, deer, and large rodents are maintained(Bodmer and Lozano 2001).
This management approach would have only minor economic costs to the meatmarkets in Iquitos, with these costs estimated at 3.6% of the economic value of themeat markets. In contrast, the short-term economic costs to the rural sector wouldbe significant, with the rural sector having a 36.4% decrease in the economic ben-efits from wildlife hunting, or an annual loss of US$ 412,978 (Bodmer and Lozano2001).
Economic Analysis of Wildlife Use [205]
Part 2 (ch9-12) 5/7/04 2:24 PM Page 205

If management programs are not set up, there will be further overhunting and anincrease in local extinctions. It is likely that these local extinctions would result inspecies extinctions and an overall loss of biodiversity to Peru. Thus, the economiccosts to the rural sector must be weighed against the biodiversity loss to Peru.
ECONOMICS OF THE CURRENT PELT TRADE
Professional pelt hunting is prohibited in Peru, and peccary pelts exported fromLoreto should only be collected by subsistence hunters. Pelt hunters obtained arelatively good income from peccary skins in the 1950s, 1960s, and early 1970s, andpeccary pelt exports from the Peruvian Amazon exceeded 200,000 skins/year(Grimwood 1969). Since the pelt trade has become both less lucrative for huntersand more strictly controlled, exports have fallen to the current level of around34,000 skins/year.
Peccary pelts from the Peruvian Amazon are usually of poor quality and can notbe used for such large leather products as jackets but only for such smaller productsas gloves, shoes, belts, and watchbands. The poor quality of peccary pelts resultsfrom a combination of causes that include (a) epidermal parasites, especially ticks,infecting free-ranging animals; (b) scars from intraspecific aggression; (c) shotholes produced by the 16-gauge shotguns used by most rural hunters; (d) cuts andholes caused by the rough skinning by rural hunters; (e) blisters caused by dryingskins in direct sunlight; and (f) mold and pest damage caused by storing pelts in thehumid Amazonian climate.
Rural hunters, however, have little interest in improving their processing tech-niques because the price paid to hunters for pelts does not make it profitable forthem to improve their methods. The international tanneries and leather manufac-tures, on the other hand, are very interested in getting better quality pelts.
Increasing the price paid to hunters for pelts as a strategy to increase the qualityof pelts might add value for hunters and lead to improved pelt quality. However,this increase can only be done sustainably if peccary hunting is well managed. Ifpelt prices are increased without improved management programs, then huntingpressure on peccaries might exceed sustainable levels and cause overhunting ofpeccary populations. On the other hand, if added value for peccary pelts is provid-ed to hunters who manage their hunting practices, especially through community-based approaches, this added value could be an incentive for better wildlife man-agement practices. Indeed, added value for peccary pelts could act as a broadincentive for community-based wildlife management.
HUNTING PRESSURE AND ECONOMIC VALUE
In order to focus wildlife management programs, it is imperative to understandwhat factors are influencing hunting pressures. In the case of the Peruvian Ama-zon, there is a clear disjunct between the realized hunting pressure and the eco-
[206] Economic Analysis of Wildlife Use
Part 2 (ch9-12) 5/7/04 2:24 PM Page 206
nomic value of wildlife. Hunters are harvesting species primarily for the value ofsubsistence meat, secondarily for the value of meat sales in the urban markets, andlastly for the value of peccary hides. In contrast, the greatest value of the wildlife isin the international market of peccary hides. Still, the international pelt trade is nota major influence in determining hunting pressure of wildlife in the PeruvianAmazon. Likewise, the urban meat market is influencing hunting pressure to amuch lesser degree than the use of wildlife meat in the rural sector.
The success of conservation efforts in the Peruvian Amazon will depend on thesuccess of working with the rural hunters. This effort includes the sale of wildlifemeat in villages and towns. One promising management strategy that focuses onwildlife management with rural hunters is community-based wildlife management(Bodmer and Puertas 2000). Community-based management is focused at the lev-el that can actually influence hunting pressure.
ACKNOWLEDGMENTS
We are indebted to the tremendous support provided by the communities of the Reserva Comu-nal Tamshiyacu-Tahuayo and the Reserva Nacional Pacaya-Samiria; to Pablo Puertas, RolandoAquino, and César Reyes who helped with the fieldwork; and to Julio Curinuqui and GilbertoAsipali for their dedicated field assistance. We thank the Wildlife Conservation Society, theChicago Zoological Society, Instituto Nacional de Recursos Naturales-Peru, the Universidad Na-cional de la Amazonía Peruana, The Nature Conservancy, the Mellon Foundation, ProNatu-raleza, AIF-WWF/DK Programa Integral de Desarrollo y Conservación Pacaya Samiria, and US-AID-Peru for logistical and financial support of the project.
Economic Analysis of Wildlife Use [207]
Part 2 (ch9-12) 5/7/04 2:24 PM Page 207

Part 2 (ch9-12) 5/7/04 2:24 PM Page 208