part 1. the business case for reducing food loss...
TRANSCRIPT

Part 1. The Business Case for Reducing Food Loss and WasteBy Craig Hanson
Part 2. Introduction to the FLW StandardBy Kai Robertson
March 9, 2017

Why does food loss and waste matter?
Source: FAO (Food and Agriculture Organization of the United Nations). 2011. Global food losses and food waste – extent, causes and prevention. Rome: UN FAO; FAO. 2015. Food wastage footprint & climate change. Rome: UN FAO.

TARGET 12.3
By 2030, halve per capita global food waste at the retail and consumer levels and reduce food
losses along production and supply chains, including post-harvest losses

Champions 12.3 is a unique coalition of leaders from around the world
dedicated to inspiring ambition, mobilizing action, and accelerating progress
toward achieving SDG Target 12.3
In January 2016, “Champions 12.3” formed to advance progress toward SDG Target 12.3

The question Champions 12.3 asked
If it can generate so many benefits, then why are countries, cities, and companies not already doing more to reduce food loss and waste?
“Unclear business case”
“Costs buried in operational budgets”
“Accepted as cost of doing business”
“Costs of taking action outweigh the benefits”
Photo: la-ja-femme.ruSource: Interviews

Released March 7, 2017
Research conducted by:
www.champions123.org
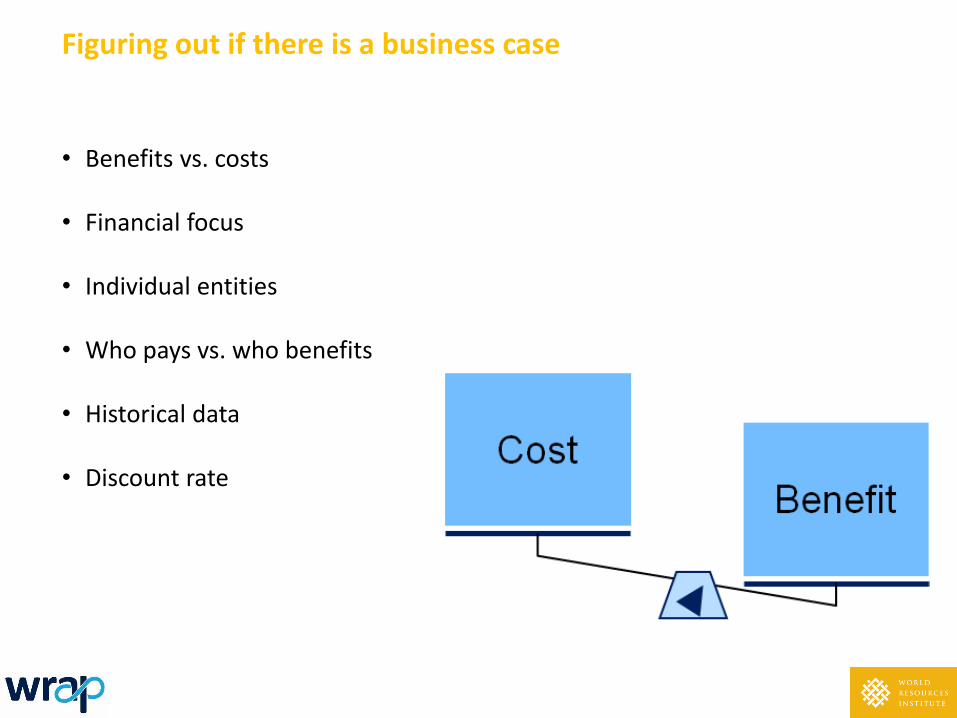
Figuring out if there is a business case
• Benefits vs. costs
• Financial focus
• Individual entities
• Who pays vs. who benefits
• Historical data
• Discount rate

Photo: background-pictures.picphotos.net
Financial returns for a country: United Kingdom
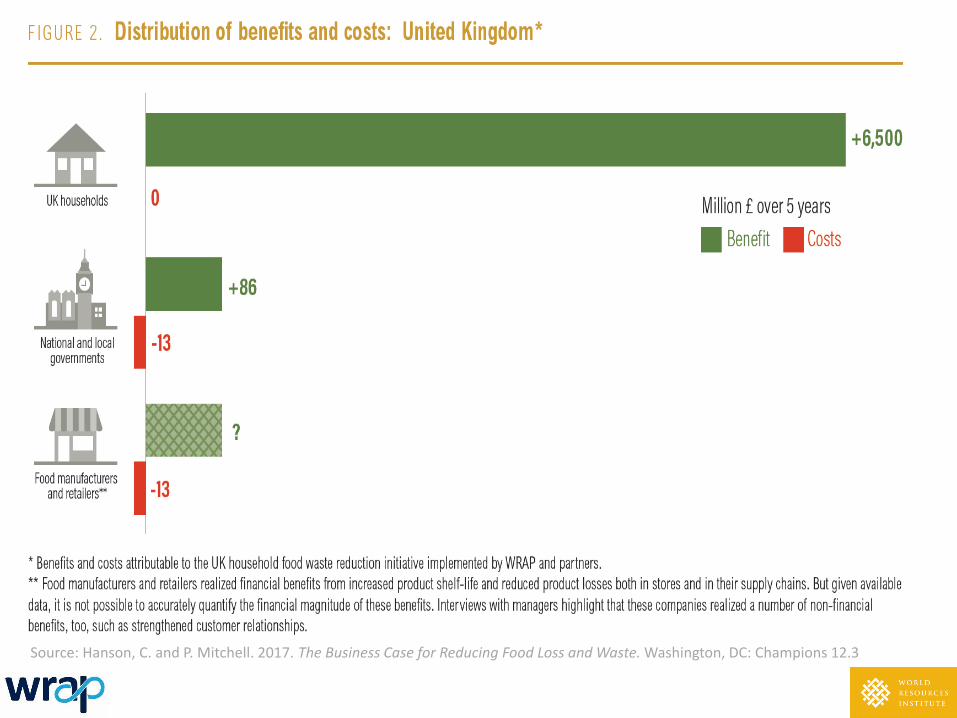
Source: Hanson, C. and P. Mitchell. 2017. The Business Case for Reducing Food Loss and Waste. Washington, DC: Champions 12.3
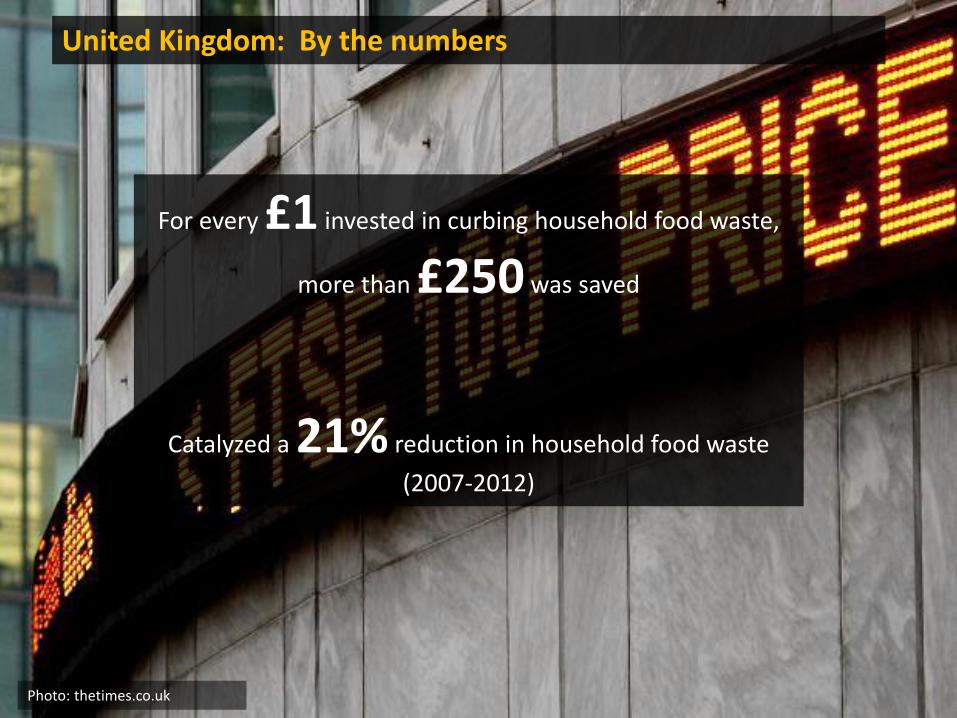
United Kingdom: By the numbers
For every £1 invested in curbing household food waste,
more than £250 was saved
Catalyzed a 21% reduction in household food waste
(2007-2012)
Photo: thetimes.co.uk

United Kingdom: What were the financial benefits and costs?
Benefits• Avoiding food waste disposal costs• Avoiding expenditures on food
that otherwise would be wasted
Costs• Quantifying and monitoring• Conducting the “Love Food Hate
Waste” consumer education campaign (TV, print, digital, in-store messaging)
• Changing date labeling, adjusting pack sizes, creating re-sealable bags

Photo: latitudethirtyfour.com
Financial returns for a city: West London

Source: Hanson, C. and P. Mitchell. 2017. The Business Case for Reducing Food Loss and Waste. Washington, DC: Champions 12.3

West London: By the numbers
For every £1 invested in curbing household food waste:
• Local authorities saved £8
• Households saved £84
Catalyzed a 15% reduction in household food waste within 6 months
Photo: thetimes.co.uk

West London: What were the financial benefits and costs?
Costs• Quantifying and monitoring• Advertising via radio, print, and digital
(providing planning, storage, recipe, etc. tips)
• Conducting 50 public relations activities, events, and community engagements
Benefits• Avoiding food waste disposal costs• Avoiding expenditures on food
that otherwise would be wasted
Photo: gamesindustry.biz
Financial returns for companies

Photo: gamesindustry.biz
Companies: What did we look at?
>700 companies
Nearly 1,200 business sites
Across 17 countries

Companies: What were the financial benefits and costs?
Costs• Quantifying and monitoring• Training staff• Investing in new equipment (storage)• Changing storage, handling, and
manufacturing processes• Changing packaging and date labeling
Benefits• Reducing unsold food • Launching new product lines • Reducing food waste
management costs

Source: Hanson, C. and P. Mitchell. 2017. The Business Case for Reducing Food Loss and Waste. Washington, DC: Champions 12.3

Source: Hanson, C. and P. Mitchell. 2017. The Business Case for Reducing Food Loss and Waste. Washington, DC: Champions 12.3

Source: Hanson, C. and P. Mitchell. 2017. The Business Case for Reducing Food Loss and Waste. Washington, DC: Champions 12.3

The non-financial business case for reducing food loss and waste
Food security
Waste regulations
Environmental sustainability
Stakeholder relationships
Ethical responsibility
Photo: thinkeatsave.org

The strategy for reducing food loss and waste consists of 3 elements
Target
Measure
Act

TARGET: Targets set ambition, ambition motivates action

Source: Lipinski, L., C. O’Connor, C. Hanson (2016). SDG Target 12.3 on Food Loss and Waste: 2016 Progress Report. Champions 12.3
Status to date: 3 regional blocks with specific targets
MEASURE: “What gets measured gets managed”
Photo: www.cgu.edu

Guidance is now available to help countries and companies quantify their food loss and waste

ACT: What ultimately matters is action

Source: Hanson, C. and P. Mitchell. 2017. The Business Case for Reducing Food Loss and Waste. Washington, DC: Champions 12.3

We thank those providing financial support for making “The Business Case” publication a reality
The Netherlands Ministry of Economic Affairs


Introduction to the FLW Standard

About the FLW Protocol
A multi-stakeholder effort to develop a global Food Loss and Waste Accounting and Reporting Standard
(FLW Standard)
Secretariat

Over 200 Stakeholders Consulted (Sample Below)
Across every continentAcademia, private sector, government, NGOs

Launched June 2016
• Global voluntary standard
• Common language, requirements, and guidance for quantifying and reporting on the weight of FLW
• Benefits of using the FLW Standard:
1. Consistency and transparency
2. Set and track progress using a clear framework
3. Understand where FLW is generated to guide action

Questions to Ask When Measuring
Why quantify?
What to quantify?
How to quantify?

What to Quantify?
The FLW Standard’s accounting and reporting requirements and guidance apply to that which is in this shaded box
(i.e., removed from the food supply chain)
FLW Standard allows an entity to select which
combination of (1) Material Types (i.e., food
and/or inedible parts)and
(2) Destinations (i.e., which of the ten listed)
it considers to be“food loss and waste”

(insert
timeframe)
Food
Inedible parts
Animal Feed
Biomaterial/
processing
Co/anaerobic
digestion
Compost/aerobic
Controlled
combustion
Land application
Landfill
Not harvested
Refuse/discards
Sewer
Pre-harvest
losses and the
weight of
product
packaging is
excluded from
the weight of
FLW.
(modify and/or
insert additional
relevant text)
Template to Visually Represent Scope Using the FLW Standard
Food category =
(insert text)
Lifecycle stage =
(insert text)
Geography =
(insert text)
Organization =
(insert text)
This template should be
customized to show your scope

Inedible parts
Food
Biomaterial/
processing
Co/anaerobic
digestion
Controlled
combustion
Land application
Landfill
Not harvested
Refuse/discards
Animal feed
Compost/
aerobic
Sewer
US EPA: 36.46 million tons disposed
Inedible parts
Food
Biomaterial/
processing
Co/anaerobic
digestion
Controlled
combustion
Land application
Landfill
Not harvested
Refuse/discards
Animal feed
Compost/
aerobic
USDA: 66.5 million tons
Comparing Scope of US Food Loss and Waste Data
VERSUS
Sewer

1. Direct weighing
2. Counting
3. Assessing volume
4. Waste composition analysis
5. Records
6. Diaries
7. Surveys
8. Mass balance
9. Modeling
10. Proxy data
How to Quantify?
@ www.FLWProtocol.org, under the “Tools & Resources” tab

WHAT is quantified?
FLW Standard requires reporting the scope of an FLW inventory.
It requires using clear terms and definitions for describing what is meant by food loss/waste.
It does not prescribe a particular definition of food loss/waste.
HOW is it quantified?
FLW Standard requires reporting on quantification method used and other details.
It does not prescribe a particular method for quantifying FLW.
The FLW Standard provides a firm framework –
that allows for flexibility in application

1. Base FLW accounting and reporting on the principles of relevance, completeness, consistency,
transparency, and accuracy
2. Account for and report the physical amount of FLW expressed as weight
(e.g., pounds, kilograms, tons, metric tons)
3. Define and report on the scope of the FLW inventory
a. Timeframe c. Destination
b. Material type d. Boundary
(See FLW Standard for details, including related issues)
4. Describe the quantification method(s) used. If existing studies or data are used, identify the source
and scope
5. If sampling and scaling of data are undertaken, describe the approach and calculation used, as well
as the period of time over which sample data are collected (including starting and ending dates)
6. Provide a qualitative description and/or quantitative assessment of the uncertainty around FLW
inventory results
7. If assurance of the FLW inventory is undertaken (which may include peer review, verification,
validation, quality assurance, quality control, and audit), create an assurance statement
8. If tracking the amount of FLW and/or setting an FLW reduction target, select a base year, identify
the scope of the target, and recalculate the base year FLW inventory when necessary
The Eight FLW Standard Accounting and Reporting Requirements
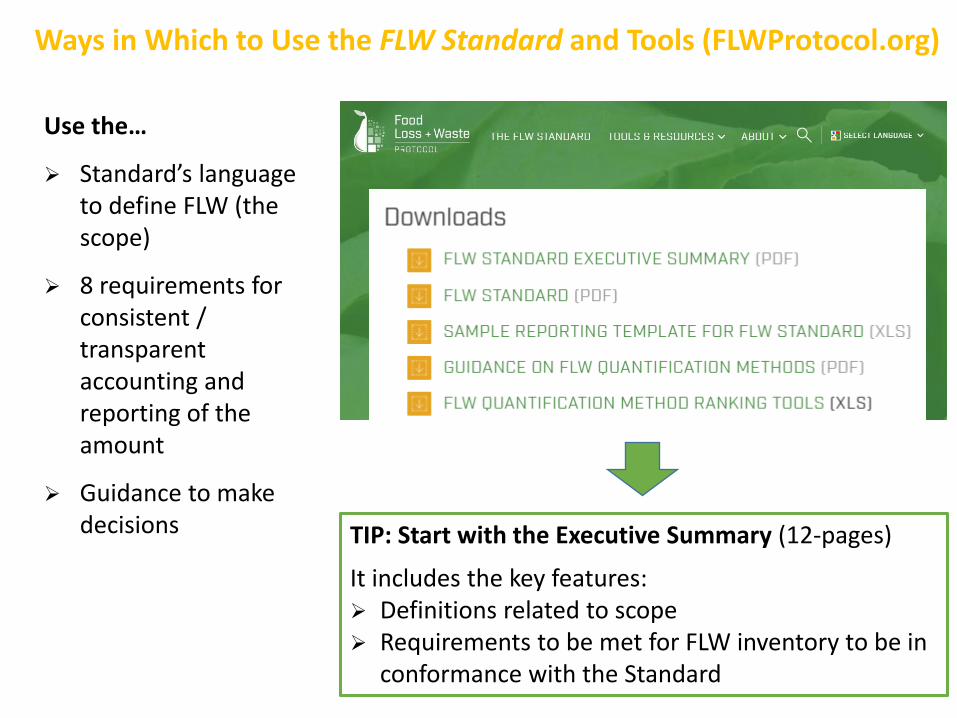
Ways in Which to Use the FLW Standard and Tools (FLWProtocol.org)
TIP: Start with the Executive Summary (12-pages)
It includes the key features: Definitions related to scope Requirements to be met for FLW inventory to be in
conformance with the Standard
Use the…
Standard’s language to define FLW (the scope)
8 requirements for consistent / transparent accounting and reporting of the amount
Guidance to make decisions

Focus for 2017
Promote adoption and use of the FLW Standard
News update to interested stakeholders (sign up @ www.FLWProtocol.org)
Case studies to highlight “users” of FLW Standard
Translating Executive Summary (Chinese, Japanese, Spanish)
Trainings and presentations (email suggestions to [email protected])
FLW database / inventory reporting platform
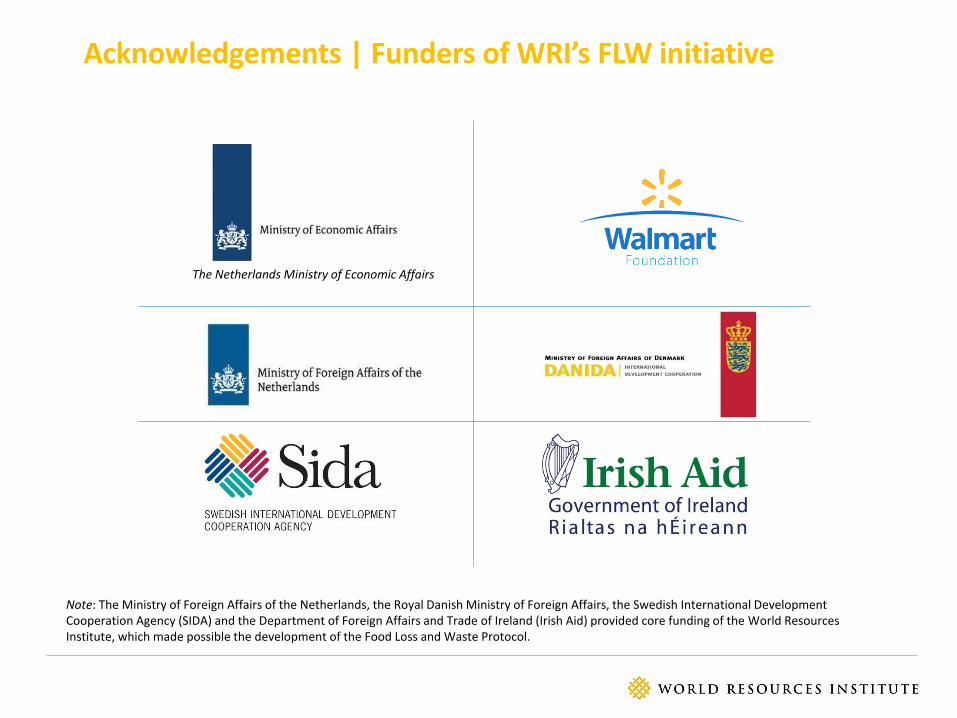
Acknowledgements | Funders of WRI’s FLW initiative
The Netherlands Ministry of Economic Affairs
Note: The Ministry of Foreign Affairs of the Netherlands, the Royal Danish Ministry of Foreign Affairs, the Swedish International Development Cooperation Agency (SIDA) and the Department of Foreign Affairs and Trade of Ireland (Irish Aid) provided core funding of the World Resources Institute, which made possible the development of the Food Loss and Waste Protocol.
www.flwprotocol.org
For questions and suggestions, contact: Kai Robertson ([email protected])
Brian Lipinski ([email protected]) Craig Hanson ([email protected])
DISCUSSION

APPENDIX

STRUCTURE OF THE FLW STANDARD (PARTS I, II, III)
PART I. Overview
6. Establishing the scope of an FLW inventory
7. Deciding how to quantify FLW
PART II. Main requirements
1. Introduction
2. Definition of terms and applications
3. Goals of quantifying FLW
4. Summary of steps and requirements
5. Principles of FLW accounting and reporting
8. Collecting, calculating, and analyzing data
9. Assessing uncertainty
10. Coordinating the analysis of multiple FLW inventories
11. Recording causes of FLW
12. Review and assurance
13. Reporting
14. Setting targets and tracking changes over time
PART III. Other requirements and recommendations

Guidance on FLW Quantification Methods (stand-alone document)
Introduction
Quantification Methods
1. Direct weighing
2. Counting
3. Assessing volume
4. Waste composition analysis
5. Records
6. Diaries
7. Surveys
8. Mass balance
9. Modeling
10. Proxy data
Appendix: Quantifying FLW if water is added
Appendix to the FLW Standard
A. Approaches to sampling and scaling up data
B. Separating material types: data sources for conversion factors applied to individual items
C. Normalizing data
D. Expressing weight of FLW in other terms or units of measurement
E. Quantifying and reporting the weight of food rescued
STRUCTURE OF THE FLW STANDARD (APPENDIX) & GUIDANCE ON FLW QUANTIFICATION METHODS

1. Base FLW accounting and reporting on the principles of relevance, completeness, consistency, transparency, and accuracy
2. Account for and report the physical amount of FLW expressed as weight (e.g., pounds, kilograms, tons, metric tons)
3. Define and report on the scope of the FLW inventory
a. Timeframe. Report the timeframe for which the inventory results are being reported (including starting and ending date)
b. Material type. Account for and report the material type(s) included in the FLW inventory (i.e., food only, inedible parts only, or food and associated
inedible parts).
If food or associated inedible parts removed from the food supply chain are accounted for separately in the inventory:
Describe the sources or frameworks used to categorize a material as food or as inedible parts. This includes stating any assumptions that were
used to define whether or not material was “intended” for human consumption
Describe the approach used to calculate the separate amounts. If applicable, describe all conversion factors used and their sources
c. Destination. Account for and report the destinations included in the FLW inventory (i.e., where material removed from the food supply chain is
directed). If the destination is unknown, then report the initial path(s) at a minimum.
d. Boundary. Report the boundary of the FLW inventory in terms of the food category, lifecycle stage, geography, and organization (including the
sources used to classify them).
e. Related issues.
Packaging and other non-FLW material. Exclude from an FLW inventory any material (and its weight) that is not food or associated inedible parts
removed from the food supply chain (i.e., FLW). If a calculation is needed to separate the weight of FLW from non-FLW materials (e.g., subtracting
the weight of packaging), describe the approach and calculation used
Water added/removed from FLW. Account for and report the weight of FLW that reflects the state in which it was generated before water was
added, or before the intrinsic water weight of FLW was reduced. If a calculation is made to estimate the original weight of FLW, describe the
approach and calculation used
Pre-harvest losses. Exclude pre-harvest losses from the scope of an FLW inventory. Users may quantify such losses but shall keep data separate
from the FLW inventory results
4. Describe the quantification method(s) used. If existing studies or data are used, identify the source and scope
5. If sampling and scaling of data are undertaken, describe the approach and calculation used, as well as the period of time over which sample data
are collected (including starting and ending dates)
6. Provide a qualitative description and/or quantitative assessment of the uncertainty around FLW inventory results
7. If assurance of the FLW inventory is undertaken (which may include peer review, verification, validation, quality assurance, quality control, and
audit), create an assurance statement
8. If tracking the amount of FLW and/or setting an FLW reduction target, select a base year, identify the scope of the target, and recalculate the
base year FLW inventory when necessary
FLW STANDARD ACCOUNTING AND REPORTING REQUIREMENTS
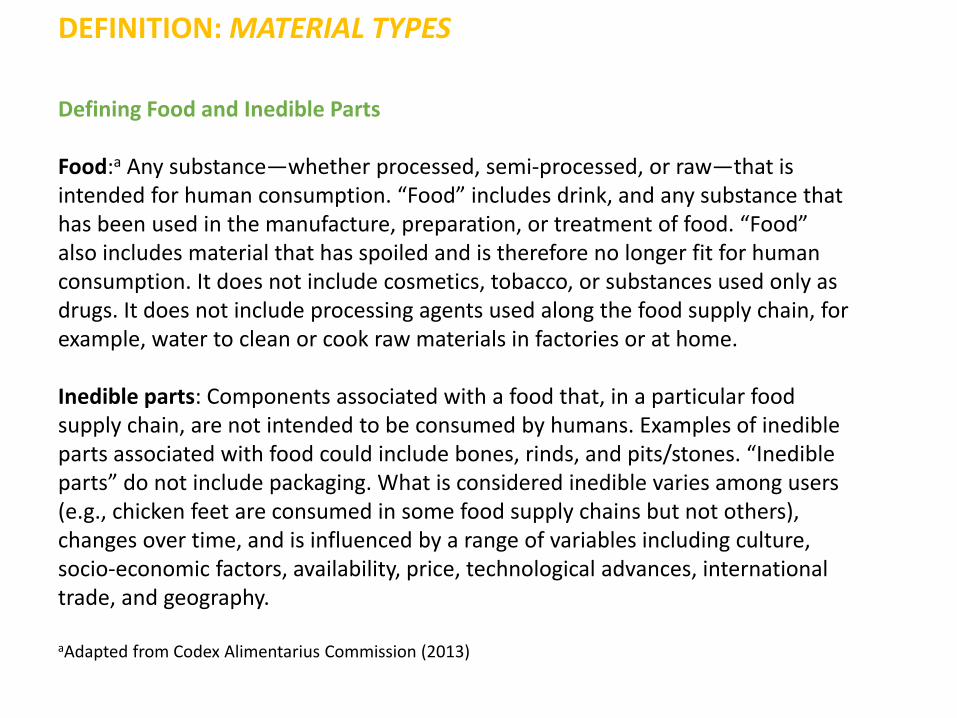
DEFINITION: MATERIAL TYPES
Defining Food and Inedible Parts
Food:a Any substance—whether processed, semi-processed, or raw—that is intended for human consumption. “Food” includes drink, and any substance that has been used in the manufacture, preparation, or treatment of food. “Food” also includes material that has spoiled and is therefore no longer fit for human consumption. It does not include cosmetics, tobacco, or substances used only as drugs. It does not include processing agents used along the food supply chain, for example, water to clean or cook raw materials in factories or at home.
Inedible parts: Components associated with a food that, in a particular food supply chain, are not intended to be consumed by humans. Examples of inedible parts associated with food could include bones, rinds, and pits/stones. “Inedible parts” do not include packaging. What is considered inedible varies among users (e.g., chicken feet are consumed in some food supply chains but not others), changes over time, and is influenced by a range of variables including culture, socio-economic factors, availability, price, technological advances, international trade, and geography.
aAdapted from Codex Alimentarius Commission (2013)

DEFINITION: DESTINATIONSDestination Definition
Animal feed Diverting material from the food supply chaina (directly or after processing) to animals
Bio-based
materials/biochemical
processing
Converting material into industrial products. Examples include creating fibers for packaging material, creating
bioplastics (e.g., polylactic acid), making “traditional” materials such as leather or feathers (e.g., for pillows),
and rendering fat, oil, or grease into a raw material to make products such as soaps, biodiesel, or cosmetics.
“Biochemical processing” does not refer to anaerobic digestion or production of bioethanol through
fermentation
Codigestion/anaerobic
digestion
Breaking down material via bacteria in the absence of oxygen. This process generates biogas and nutrient-rich
matter. Codigestion refers to the simultaneous anaerobic digestion of FLW and other organic material in one
digester. This destination includes fermentation (converting carbohydrates—such as glucose, fructose, and
sucrose—via microbes into alcohols in the absence of oxygen to create products such as biofuels)
Composting/aerobic
processes
Breaking down material via bacteria in oxygen-rich environments. Composting refers to the production of
organic material (via aerobic processes) that can be used as a soil amendment
Controlled combustion Sending material to a facility that is specifically designed for combustion in a controlled manner, which may
include some form of energy recovery (this may also be referred to as incineration)
Land application Spreading, spraying, injecting, or incorporating organic material onto or below the surface of the land to enhance soil quality
Landfill Sending material to an area of land or an excavated site that is specifically designed and built to receive wastes
Not harvested/plowed-in Leaving crops that were ready for harvest in the field or tilling them into the soil
Refuse/discards/litter Abandoning material on land or disposing of it in the sea. This includes open dumps (i.e., uncovered, unlined),
open burn (i.e., not in a controlled facility), the portion of harvested crops eaten by pests, and fish discards (the
portion of total catch that is thrown away or slipped)
Sewer/wastewater
treatment
Sending material down the sewer (with or without prior treatment), including that which may go to a facility
designed to treat wastewater
Other Sending material to a destination that is different from the 10 listed above. This destination should be described
a Excludes crops intentionally grown for bioenergy, animal feed, seed, or industrial use

DEFINITION: BOUNDARY
Boundary
dimension Definition Examples
Food category The type(s) of food included in reported
FLW
• All food • Dairy products• Fresh fruits and
vegetables • Chicken
Lifecycle stage The stage(s) in the food supply chain or
food lifecycle within which reported FLW
occurs
Entire food supply chain Two stages: manufacture
of dairy products, and retail of food and beverage
At home
Geography Geographic borders within which
reported FLW occurs
World (all countries) Eastern Asia Ghana Nova Scotia, Canada Lima, Peru
Organization Organizational unit(s) within which
reported FLW occurs
All sectors in country Entire company Two business units All 1,000 stores 100 households
Boundary
dimension
Classification source to use
(select the most current version) Selected examples with relevant codes
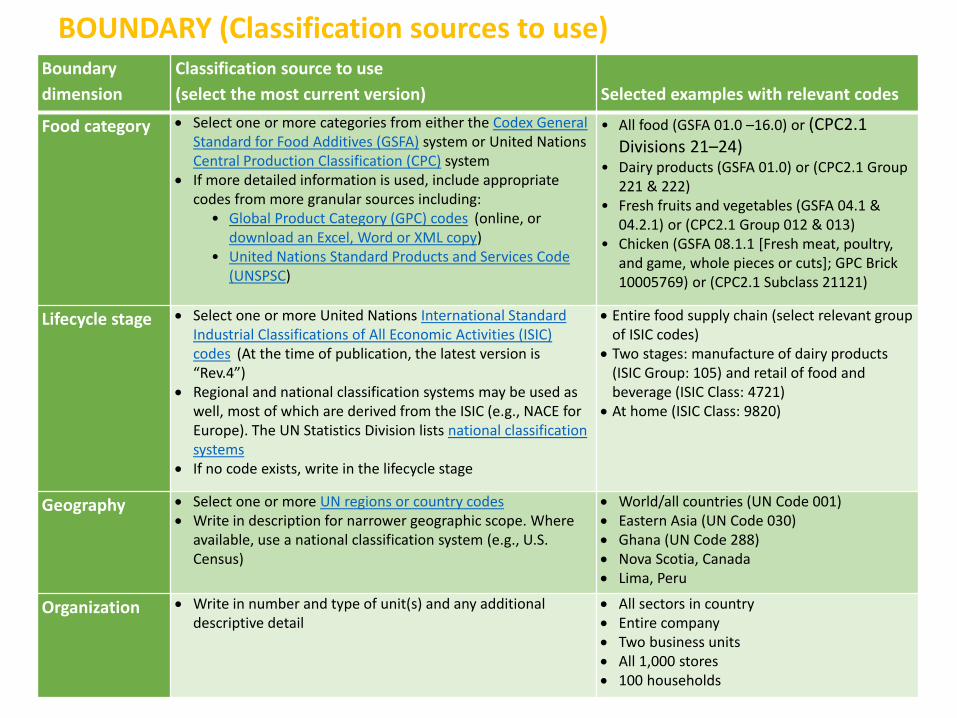
Food category Select one or more categories from either the Codex General Standard for Food Additives (GSFA) system or United Nations Central Production Classification (CPC) system
If more detailed information is used, include appropriate codes from more granular sources including:
• Global Product Category (GPC) codes (online, or download an Excel, Word or XML copy)
• United Nations Standard Products and Services Code (UNSPSC)
• All food (GSFA 01.0 –16.0) or (CPC2.1 Divisions 21–24)
• Dairy products (GSFA 01.0) or (CPC2.1 Group 221 & 222)
• Fresh fruits and vegetables (GSFA 04.1 & 04.2.1) or (CPC2.1 Group 012 & 013)
• Chicken (GSFA 08.1.1 [Fresh meat, poultry, and game, whole pieces or cuts]; GPC Brick 10005769) or (CPC2.1 Subclass 21121)
Lifecycle stage Select one or more United Nations International Standard Industrial Classifications of All Economic Activities (ISIC) codes (At the time of publication, the latest version is “Rev.4”)
Regional and national classification systems may be used as well, most of which are derived from the ISIC (e.g., NACE for Europe). The UN Statistics Division lists national classification systems
If no code exists, write in the lifecycle stage
Entire food supply chain (select relevant group of ISIC codes)
Two stages: manufacture of dairy products (ISIC Group: 105) and retail of food and beverage (ISIC Class: 4721)
At home (ISIC Class: 9820)
Geography Select one or more UN regions or country codes Write in description for narrower geographic scope. Where
available, use a national classification system (e.g., U.S. Census)
World/all countries (UN Code 001) Eastern Asia (UN Code 030) Ghana (UN Code 288) Nova Scotia, Canada Lima, Peru
Organization Write in number and type of unit(s) and any additional descriptive detail
All sectors in country Entire company Two business units All 1,000 stores 100 households
BOUNDARY (Classification sources to use)
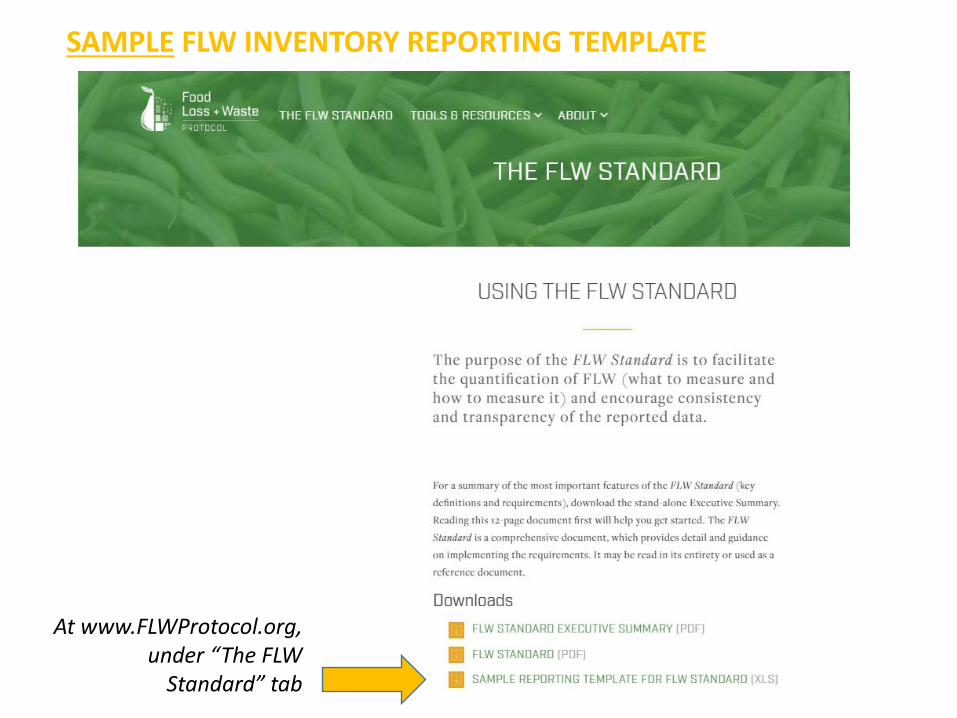
SAMPLE FLW INVENTORY REPORTING TEMPLATE
At www.FLWProtocol.org, under “The FLW
Standard” tab

SAMPLE FLW INVENTORY REPORTING TEMPLATE

FLW QUANTIFICATION METHOD RANKING TOOL