parliamentary copyright (house of commons) 1999 …€¦ · house of commons information office...
TRANSCRIPT

No 68
GENERAL ELECTION RESULTS, 1 MAY 1997
This paper presents some analyses of voting in the general election held on 1 May 1997. It is based onthe definitive results which are published in Britain Votes 6, by Colin Rallings and Michael Thrasher(Ashgate 1997).
CONTENTS
1. Summary of voting.2. Votes cast for major parties by region.3. Percentage distribution of votes cast for major parties by region.4. Changes since April 1992 in major parties' share of votes by region.5. The results in Northern Ireland.6. Seats won by party in each region of Great Britain.7. Change from 1992 in seats won by party in each region.8. Changes in seats relative to April 1992.9. Highest and lowest turnouts (per cent).10. Largest and smallest majorities by party.11. Highest and lowest shares of the vote, by party.12. Largest constituency changes between 1992 and 1997 in main parties' share of the total vote.13. Candidates finishing in first, second, third and fourth places (Great Britain only).14. Seats gained and lost
Staff of the House of Commons Social and General Statistics Section regret that they are not availableto discuss the contents of this paper with enquirers.

The 1997 General Election was the first to be fought on a new set of boundaries, with a total of 659seats in the United Kingdom compared with 651 in 1992. Notional results for the 1992 election on thebasis of the new constituencies were calculated by Colin Rallings and Michael Thrasher on the basis ofthe actual results, voting patterns in local elections and demographic factors. It is from these resultsthat any comparisons with 1992 are made.
The Labour Party won the 1997 General Election by the largest majority of seats since 1945. The 418seats secured by Labour were the party's largest ever total, while the Conservative Party gained theirlowest number since 1906. The Liberal Democrats saw their share of the vote fall but gained 46 seatscompared with a notional total of 18 in 1992.
The turnout in 1997 was a post-war low of 71.4 per cent.
The number of women candidates elected in 1997 was 120, double the number elected in 1992 andalmost three times the 41 elected in 1987.
Bryn Morgan1998
February 1999 FS No 68 Ed 1 Pr 1 1000ISSN 0144-4689
PARLIAMENTARY COPYRIGHT (HOUSE OF COMMONS) 1999May be reproduced for purposes of private study
or research without permission.Reproduction for sale or other commercial purposes not permitted
House of Commons Information OfficeTel: 0171-219 4272 e-mail: [email protected]
Providing information on the work, history and membership of the House of Commons

Table 1
Summary of Voting
% share MPs LostParty Votes of votes Candidates elected deposits
Labour 13,518,167 43.2% 639 418 0Conservative 9,600,943 30.7% 648 165 8Liberal Democrat 5,242,947 16.8% 639 46 13Referendum Party 811,849 2.6% 547 0 505Scottish National 621,550 2.0% 72 6 0Ulster Unionist 258,349 0.8% 16 10 1SDLP 190,814 0.6% 18 3 3Plaid Cymru 161,030 0.5% 40 4 15Sinn Fein 126,921 0.4% 17 2 4Democratic Unionist 107,348 0.3% 9 2 0UK Independence 105,722 0.3% 193 0 192Green 63,991 0.2% 95 0 95Alliance Party 62,972 0.2% 17 0 6Socialist Labour 52,109 0.2% 64 0 61Liberal 45,166 0.1% 55 0 53British National 35,832 0.1% 57 0 54Natural Law 30,604 0.1% 197 0 197Speaker 23,969 0.1% 1 1 0ProLife Alliance 19,332 0.1% 56 0 56United Kingdom Unionist 12,817 0.0% 1 1 0Progressive Unionist 10,928 0.0% 3 0 0National Democrat 10,829 0.0% 21 0 20Scottish Socialist Alliance 9,740 0.0% 16 0 15National Front 2,716 0.0% 6 0 6Others 159,639 0.5% 297 1 289
Total 31,286,284 100.0% 3,724 659 1,593
The average turnout nationally was 71.4%

Table 2
Votes cast for major parties by Government Office region
Con Lab LDem SNP/PC Other Total
England 8,780,881 11,347,882 4,677,565 - 1,252,384 26,058,712North East 266,294 862,262 169,270 - 48,764 1,346,590North West 859,436 1,499,518 421,025 - 130,730 2,910,709Merseyside 141,120 442,366 103,152 - 28,158 714,796Yorkshire & The Humber 720,771 1,339,170 412,216 - 106,016 2,578,173East Midlands 800,958 1,097,639 311,264 - 84,889 2,294,750West Midlands 953,465 1,326,822 388,807 - 156,731 2,825,825Eastern 1,164,777 1,137,637 504,416 - 140,337 2,947,167London 1,036,082 1,643,329 485,511 - 156,126 3,321,048South East 1,817,343 1,264,778 1,012,418 - 247,069 4,341,608South West 1,020,635 734,361 869,486 - 153,564 2,778,046
Wales 317,145 886,935 200,020 161,030 54,932 1,620,062Scotland 493,059 1,283,350 365,362 621,550 53,427 2,816,748Great Britain 9,591,085 13,518,167 5,242,947 782,580 1,360,743 30,495,522
Northern Ireland(a)
9,858 - - - 780,904 790,762United Kingdom 9,600,943 13,518,167 5,242,947 782,580 2,141,647 31,286,284
(a) Table 5 gives a breakdown of voting in Northern Ireland
Table 3
Percentage distribution of votes cast by Government Office region
Con Lab LDem SNP/PC Other Total
England 33.7% 43.5% 18.0% - 4.8% 100.0%North East 19.8% 64.0% 12.6% - 3.6% 100.0%North West 29.5% 51.5% 14.5% - 4.5% 100.0%Merseyside 19.7% 61.9% 14.4% - 3.9% 100.0%Yorkshire & The Humber 28.0% 51.9% 16.0% - 4.1% 100.0%East Midlands 34.9% 47.8% 13.6% - 3.7% 100.0%West Midlands 33.7% 47.0% 13.8% - 5.5% 100.0%Eastern 39.5% 38.6% 17.1% - 4.8% 100.0%London 31.2% 49.5% 14.6% - 4.7% 100.0%South East 41.9% 29.1% 23.3% - 5.7% 100.0%South West 36.7% 26.4% 31.3% - 5.5% 100.0%
Wales 19.6% 54.7% 12.3% 9.9% 3.4% 100.0%Scotland 17.5% 45.6% 13.0% 22.1% 1.9% 100.0%Great Britain 31.5% 44.3% 17.2% 2.6% 4.5% 100.0%
Northern Ireland(a)
1.2% - - - 98.8% 100.0%United Kingdom 30.7% 43.2% 16.8% 2.5% 6.8% 100.0%
(a) Table 5 gives a breakdown of voting in Northern Ireland

Table 4
Changes since April 1992 in major parties' share of the vote, by Government Office region
Con Lab LDem SNP/PC Other
England -11.8% +9.6% -1.3% - +3.5%North East -11.0% +10.7% -2.9% - +3.2%North West -11.3% +9.0% -1.0% - +3.3%Merseyside -9.3% +10.4% -2.4% - +1.3%Yorkshire & The Humber -10.0% +7.6% -0.8% - +3.2%East Midlands -11.7% +10.4% -1.7% - +3.0%West Midlands -11.0% +8.2% -1.3% - +4.1%Eastern -13.0% +12.2% -2.7% - +3.5%London -14.1% +12.4% -1.3% - +3.0%South East -13.1% +10.2% -1.4% - +4.2%South West -10.8% +7.2% -0.1% - +3.7%
Wales -9.0% +5.2% -0.1% +1.1% +2.8%Scotland -8.1% +6.6% -0.1% +0.6% +1.1%Great Britain -11.3% +9.1% -1.2% +0.2% +3.2%
Northern Ireland(a) -4.4% - - - +4.4%United Kingdom -11.2% +8.8% -1.2% +0.2% +3.4%
(a) Table 5 gives a breakdown of voting in Northern Ireland

Table 5
The results in Northern Ireland % share MPs LostVotes of votes Candidates elected deposits
Ulster Unionist 258,349 32.7% 16 10 1Democratic Unionist 107,348 13.6% 9 2 0Progressive Unionist 10,928 1.4% 3 0 0United Kingdom Unionist 12,817 1.6% 1 1 0Conservative 9,858 1.2% 8 0 7Alliance Party 62,972 8.0% 17 0 6SDLP 190,814 24.1% 18 3 3Sinn Fein 126,921 16.1% 17 2 4Workers Party 2,766 0.3% 8 0 8Natural Law Party 2,208 0.3% 18 0 18Others 5,781 0.7% 10 0 10
Total 790,762 100.0% 125 18 57
The overall turnout was 67.1%
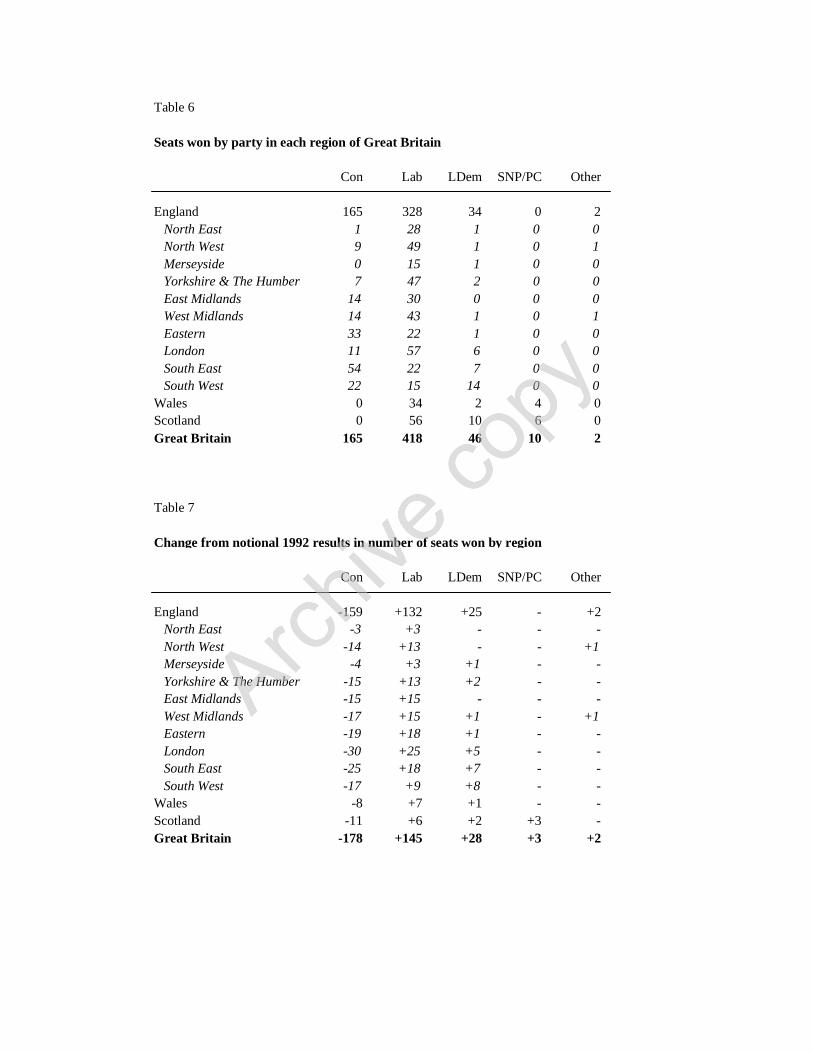
Table 6
Seats won by party in each region of Great Britain
Con Lab LDem SNP/PC Other
England 165 328 34 0 2North East 1 28 1 0 0North West 9 49 1 0 1Merseyside 0 15 1 0 0Yorkshire & The Humber 7 47 2 0 0East Midlands 14 30 0 0 0West Midlands 14 43 1 0 1Eastern 33 22 1 0 0London 11 57 6 0 0South East 54 22 7 0 0South West 22 15 14 0 0
Wales 0 34 2 4 0Scotland 0 56 10 6 0Great Britain 165 418 46 10 2
Table 7
Change from notional 1992 results in number of seats won by region
Con Lab LDem SNP/PC Other
England -159 +132 +25 - +2North East -3 +3 - - - North West -14 +13 - - +1Merseyside -4 +3 +1 - - Yorkshire & The Humber -15 +13 +2 - - East Midlands -15 +15 - - - West Midlands -17 +15 +1 - +1Eastern -19 +18 +1 - - London -30 +25 +5 - - South East -25 +18 +7 - - South West -17 +9 +8 - -
Wales -8 +7 +1 - - Scotland -11 +6 +2 +3 - Great Britain -178 +145 +28 +3 +2
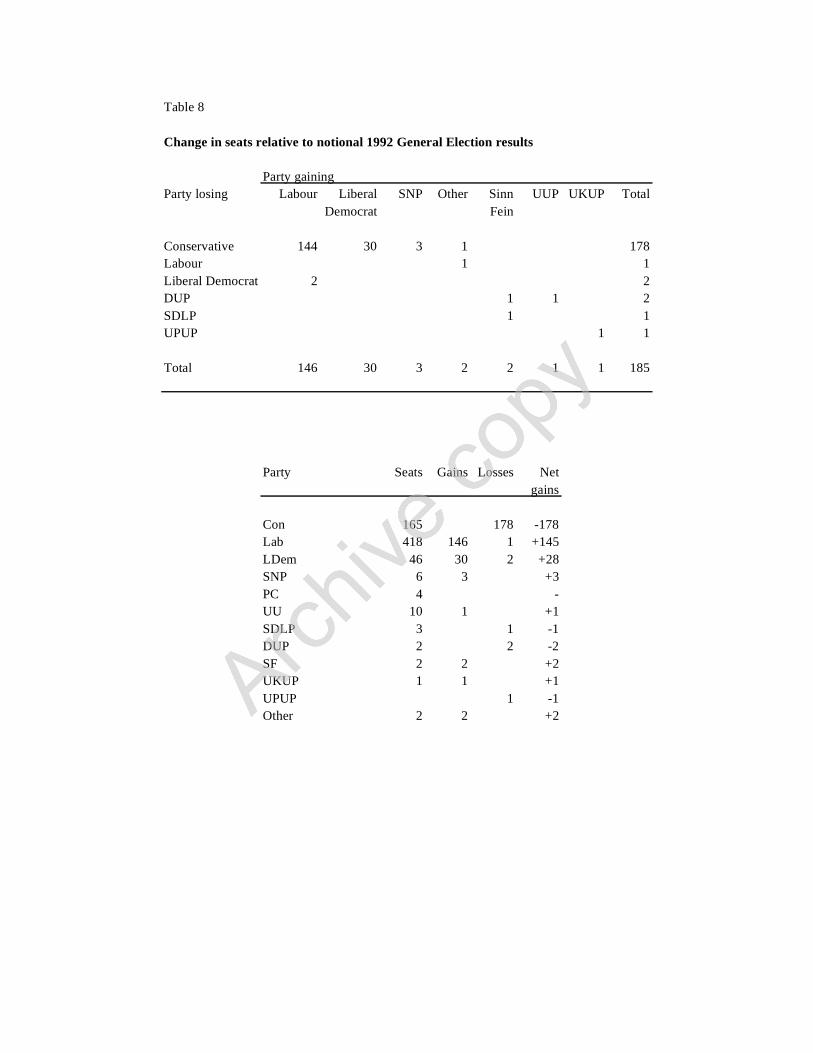
Table 8
Change in seats relative to notional 1992 General Election results
Party gainingParty losing Labour Liberal SNP Other Sinn UUP UKUP Total
Democrat Fein
Conservative 144 30 3 1 178Labour 1 1Liberal Democrat 2 2DUP 1 1 2SDLP 1 1UPUP 1 1
Total 146 30 3 2 2 1 1 185
Party Seats Gains Losses Netgains
Con 165 178 -178Lab 418 146 1 +145LDem 46 30 2 +28SNP 6 3 +3PC 4 - UU 10 1 +1SDLP 3 1 -1DUP 2 2 -2SF 2 2 +2UKUP 1 1 +1UPUP 1 -1Other 2 2 +2

Table 9
Highest and lowest turnouts (per cent)ENGLAND
1 Wirral South 81.1% 1 Liverpool, Riverside 51.6%2 North West Leicestershire 80.0% 2 Manchester, Central 51.7%3 Northavon 79.1% 3 Hackney North & Stoke Newington 52.0%4 Twickenham 79.0% 4 Sheffield, Central 53.0%5 Richmond Park 79.0% 5 Birmingham, Ladywood 54.2%6 Wansdyke 79.0% 6 Leeds Central 54.2%7 Mid Bedfordshire 78.9% 7 Cities of London & Westminster 54.2%8 High Peak 78.9% 8 West Bromwich West 54.4%9 Dover 78.9% 9 Hackney South & Shoreditch 54.5%
10 Stroud 78.8% 10 Kensington & Chelsea 54.7%
WALES
1 Brecon & Radnorshire 82.2% 1 Swansea East 67.4%2 Monmouth 80.5% 2 Swansea West 67.6%3 Cardiff North 80.2% 3 Cardiff South & Penarth 68.3%4 Vale of Glamorgan 80.0% 4 Cardiff West 69.2%5 Carmarthen East & Dinefwr 78.6% 5 Cynon Valley 69.2%
SCOTLAND
1 Stirling 81.8% 1 Glasgow Shettleston 55.7%2 Ayr 80.0% 2 Glasgow Kelvin 56.1%3 Galloway & Upper Nithsdale 79.7% 3 Glasgow Maryhill 56.4%4 Dumfries 78.9% 4 Glasgow Springburn 58.9%5 Strathkelvin & Bearsden 78.8% 5 Glasgow Baillieston 62.2%
NORTHERN IRELAND
1 Mid Ulster 85.8% 1 North Down 57.9%2 West Tyrone 79.2% 2 East Antrim 58.2%3 Newry & Armagh 75.2% 3 Strangford 59.4%4 Fermanagh & South Tyrone 74.6% 4 Belfast South 62.0%5 Belfast West 74.1% 5 Lagan Valley 62.1%

Table 10a
Largest and smallest absolute majorities, by party
Largest Conservative majorities
1 John Major Huntingdon 18,140 31.8%2 Nick Hawkins Surrey Heath 16,287 29.8%3 Peter Ainsworth East Surrey 15,093 27.6%4 Norman Fowler Sutton Coldfield 14,885 28.4%5 Francis Maude Horsham 14,862 26.0%
Largest Labour majorities
1 Eddie O'Hara Knowsley South 30,708 64.5%2 John Cummings Easington 30,012 71.6%3 Joe Benton Bootle 28,421 74.4%4 Llew Smith Blaenau Gwent 28,035 70.7%5 Dennis Skinner Bolsover 27,149 57.3%
Smallest Conservative majorities
1 Ian Bruce South Dorset 77 0.2%2 David Madel South West Bedfordshire 132 0.2%3 Peter Atkinson Hexham 222 0.5%4 Michael Fabricant Lichfield 238 0.5%5 Patrick Nicholls Teignbridge 281 0.4%
Smallest Labour majorities
1 Paul Stinchcombe Wellingborough 187 0.3%2 Philip Sawford Kettering 189 0.3%3 Brian White North East Milton Keynes 240 0.5%4 Andrew King Rugby & Kenilworth 495 0.8%5 Eileen Gordon Romford 649 1.5%
Liberal Democrat majorities
Largest Paul Tyler North Cornwall 13,847 23.7%Smallest Mark Oaten Winchester 2 0.0%
SNP/Plaid Cymru majorities
Largest Alex Salmond Banff & Buchan SNP 12,84532.0%Smallest Ieuan Wyn Jones Ynys-Mon PC 2,481 6.2%
Northern Ireland majorities
Largest Jeffrey Donaldson Lagan Valley UUP 16,92538.2%Smallest William Thompson West Tyrone UUP 1,161 2.5%

Table 10b
Largest and smallest percentage majorities, by party
Largest Conservative majorities
1 John Major Huntingdon 31.8% 18,1402 Nick Hawkins Surrey Heath 29.8% 16,2873 Norman Fowler Sutton Coldfield 28.4% 14,8854 James Arbuthnot North East Hampshire 28.2%14,3985 Dominic Grieve Beaconsfield 27.9% 13,987
Largest Labour majorities
1 Joe Benton Bootle 74.4% 28,4212 John Cummings Easington 71.6% 30,0123 Llew Smith Blaenau Gwent 70.7% 28,0354 Ted Rowlands Merthyr Tydfil & Rhymney 69.2% 27,0865 Peter Kilfoyle Liverpool, Walton 67.2% 27,038
Smallest Conservative majorities
1 Ian Bruce South Dorset 0.2% 772 David Madel South West Bedfordshire 0.2% 1323 Patrick Nicholls Teignbridge 0.4% 2814 Peter Atkinson Hexham 0.5% 2225 Michael Fabricant Lichfield 0.5% 238
Smallest Labour majorities
1 Philip Sawford Kettering 0.3% 1892 Paul Stinchcombe Wellingborough 0.3% 1873 Brian White North East Milton Keynes 0.5% 2404 Andrew King Rugby & Kenilworth 0.8% 4955 Tony Clark Northampton South 1.3% 744
Liberal Democrat majorities
Largest James Wallace Orkney & Shetland 33.7%6,968Smallest Mark Oaten Winchester 0.0% 2
SNP/Plaid Cymru majorities
Largest Alex Salmond Banff & Buchan SNP 32.0%12,845Smallest Ieuan Wyn Jones Ynys-Mon PC 6.2% 2,481
Northern Ireland majorities
Largest Clifford Forsythe South Antrim UUP 41.3% 16,611Smallest William Thompson West Tyrone UUP 2.5% 1,161

Table 11
Highest and lowest shares of the vote, by partyCONSERVATIVE
1 Huntingdon 55.3% 1 Rhondda 3.8%2 Kensington & Chelsea 53.6% 2 Glasgow Shettleston 5.5%3 Arundel & South Downs 53.1% 3 Glasgow Maryhill 5.9%4 Sutton Coldfield 52.2% 4 Glasgow Springburn 6.0%5 Surrey Heath 51.6% 5 Glasgow Pollok 6.0%6 North East Hampshire 50.9% 6 Liverpool, Walton 6.3%7 Horsham 50.8% 7 Merthyr Tydfil & Rhymney 6.4%8 New Forest West 50.6% 8 Blaenau Gwent 6.6%9 Chesham & Amersham 50.4% 9 Western Isles 6.6%
10 Ruislip - Northwood 50.2% 10 Cynon Valley 6.8%
LABOUR
1 Bootle 82.9% 1 Newbury 5.5%2 Easington 80.2% 2 Christchurch 6.9%3 Blaenau Gwent 79.5% 3 Harrogate & Knaresborough 8.7%4 Liverpool, Walton 78.4% 4 West Aberdeenshire & Kincardine 9.1%5 Knowsley South 77.1% 5 North Cornwall 9.4%6 Barnsley Central 77.0% 6 South West Surrey 9.4%7 Tyne Bridge 76.8% 7 North Devon 9.8%8 Merthyr Tydfil & Rhymney 76.7% 8 Cheltenham 10.1%9 Houghton & Washington East 76.4% 9 North Dorset 10.2%
10 Pontefract & Castleford 75.7% 10 North East Fife 10.3%
LIBERAL DEMOCRAT
1 Hazel Grove 54.5% 1 Western Isles 3.1%2 North Cornwall 53.2% 2 Glasgow Pollok 3.5%3 Newbury 52.9% 3 Cumbernauld & Kilsyth 3.8%4 Orkney & Shetland 52.0% 4 Glasgow Baillieston 3.8%5 Harrogate & Knaresborough 51.5% 5 Ynys-Mon 3.8%6 Sheffield, Hallam 51.3% 6 Glasgow Shettleston 4.0%7 North East Fife 51.2% 7 Kilmarnock & Loudoun 4.0%8 North Devon 50.8% 8 Dundee East 4.1%9 Cheltenham 49.5% 9 Airdrie & Shotts 4.2%
10 Yeovil 48.7% 10 Glasgow Springburn 4.3%
PLAID CYMRU/SCOTTISH NATIONAL PARTY
1 Banff & Buchan 55.8% 1 Monmouth 1.1%2 Caernarfon 51.0% 2 Brecon & Radnorshire 1.5%3 Meirionnydd Nant Conwy 50.7% 3 Newport West 1.6%4 Angus 48.3% 4 Alyn & Deeside 1.8%5 North Tayside 44.8% 5 Newport East 1.9%6 Galloway & Upper Nithsdale 43.9% 6 Torfaen 2.4%7 Ceredigion 41.6% 7 Cardiff North 2.5%8 Moray 41.6% 8 Vale of Glamorgan 2.6%9 Ynys-Mon 39.5% 9 Cardiff South & Penarth 3.2%
10 Perth 36.4% 10 Wrexham 3.2%
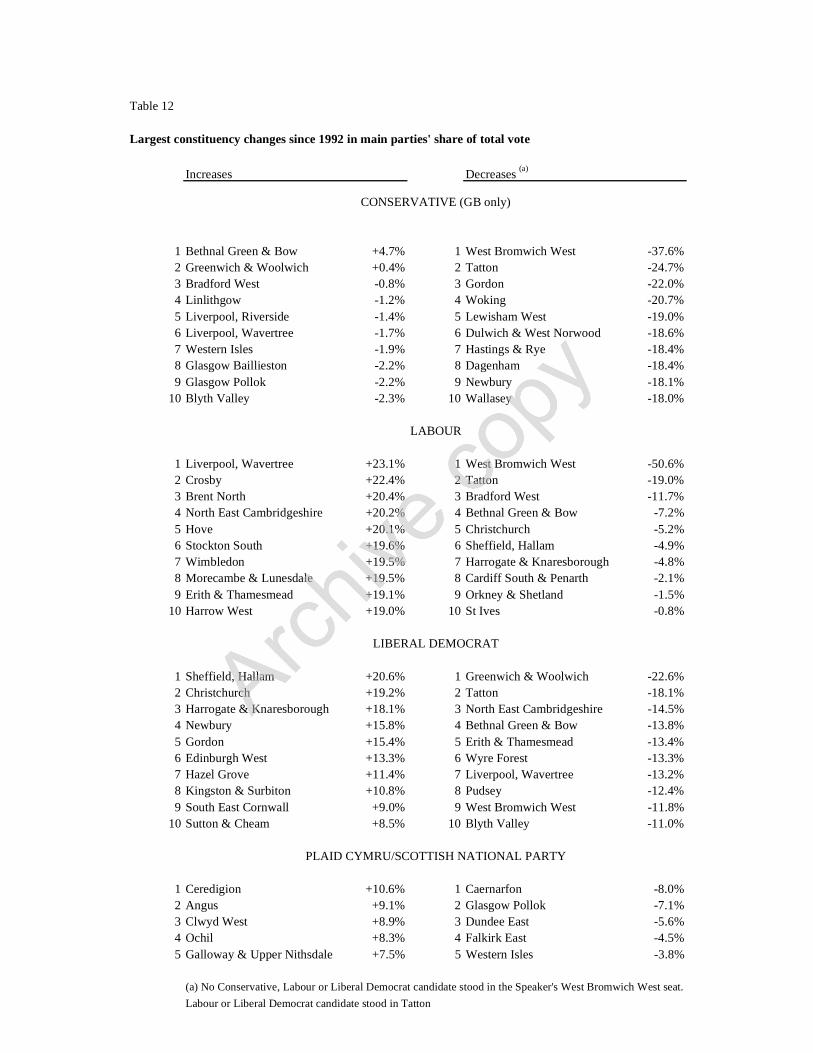
Table 12
Largest constituency changes since 1992 in main parties' share of total vote
Increases Decreases (a)
CONSERVATIVE (GB only)
1 Bethnal Green & Bow +4.7% 1 West Bromwich West -37.6%2 Greenwich & Woolwich +0.4% 2 Tatton -24.7%3 Bradford West -0.8% 3 Gordon -22.0%4 Linlithgow -1.2% 4 Woking -20.7%5 Liverpool, Riverside -1.4% 5 Lewisham West -19.0%6 Liverpool, Wavertree -1.7% 6 Dulwich & West Norwood -18.6%7 Western Isles -1.9% 7 Hastings & Rye -18.4%8 Glasgow Baillieston -2.2% 8 Dagenham -18.4%9 Glasgow Pollok -2.2% 9 Newbury -18.1%
10 Blyth Valley -2.3% 10 Wallasey -18.0%
LABOUR
1 Liverpool, Wavertree +23.1% 1 West Bromwich West -50.6%2 Crosby +22.4% 2 Tatton -19.0%3 Brent North +20.4% 3 Bradford West -11.7%4 North East Cambridgeshire +20.2% 4 Bethnal Green & Bow -7.2%5 Hove +20.1% 5 Christchurch -5.2%6 Stockton South +19.6% 6 Sheffield, Hallam -4.9%7 Wimbledon +19.5% 7 Harrogate & Knaresborough -4.8%8 Morecambe & Lunesdale +19.5% 8 Cardiff South & Penarth -2.1%9 Erith & Thamesmead +19.1% 9 Orkney & Shetland -1.5%
10 Harrow West +19.0% 10 St Ives -0.8%
LIBERAL DEMOCRAT
1 Sheffield, Hallam +20.6% 1 Greenwich & Woolwich -22.6%2 Christchurch +19.2% 2 Tatton -18.1%3 Harrogate & Knaresborough +18.1% 3 North East Cambridgeshire -14.5%4 Newbury +15.8% 4 Bethnal Green & Bow -13.8%5 Gordon +15.4% 5 Erith & Thamesmead -13.4%6 Edinburgh West +13.3% 6 Wyre Forest -13.3%7 Hazel Grove +11.4% 7 Liverpool, Wavertree -13.2%8 Kingston & Surbiton +10.8% 8 Pudsey -12.4%9 South East Cornwall +9.0% 9 West Bromwich West -11.8%
10 Sutton & Cheam +8.5% 10 Blyth Valley -11.0%
PLAID CYMRU/SCOTTISH NATIONAL PARTY
1 Ceredigion +10.6% 1 Caernarfon -8.0%2 Angus +9.1% 2 Glasgow Pollok -7.1%3 Clwyd West +8.9% 3 Dundee East -5.6%4 Ochil +8.3% 4 Falkirk East -4.5%5 Galloway & Upper Nithsdale +7.5% 5 Western Isles -3.8%
(a) No Conservative, Labour or Liberal Democrat candidate stood in the Speaker's West Bromwich West seat.
Labour or Liberal Democrat candidate stood in Tatton

Table 13
Candidates finishing in first, second, third and fourth placesGreat Britain
First Second Third Fourth Totalplace or Candidates
lowerEngland
Labour 328 94 105 0 527Conservative 165 338 24 1 528Liberal Democrat 34 95 397 1 527Other 2 2 3 1,351 1,358
Total 529 529 529 1,353 2,940
Wales
Labour 34 4 2 0 40Conservative 0 25 12 3 40Liberal Democrat 2 7 22 9 40Plaid Cymru 4 4 4 28 40Other 0 0 0 63 63
Total 40 40 40 103 223
Scotland
Labour 56 4 8 4 72Conservative 0 23 38 11 72Liberal Democrat 10 1 8 53 72Scottish National Party 6 44 17 5 72Other 0 0 1 139 140
Total 72 72 72 212 428
Great Britain
Labour 418 102 115 4 639Conservative 165 386 74 15 640Liberal Democrat 46 103 427 63 639Plaid Cymru 4 4 4 28 40Scottish National Party 6 44 17 5 72Other 2 2 4 1,553 1,561
Total 641 641 641 1,668 3,591
The other candidates finishing in first place were the Speaker (West Bromwich West) and MartinBell (Ind - Tatton) The other candidates finishing in second place were R. Sylvester (Ind Lab -West Bromwich West) and S. Radford (Liberal - Liverpool, West Derby)
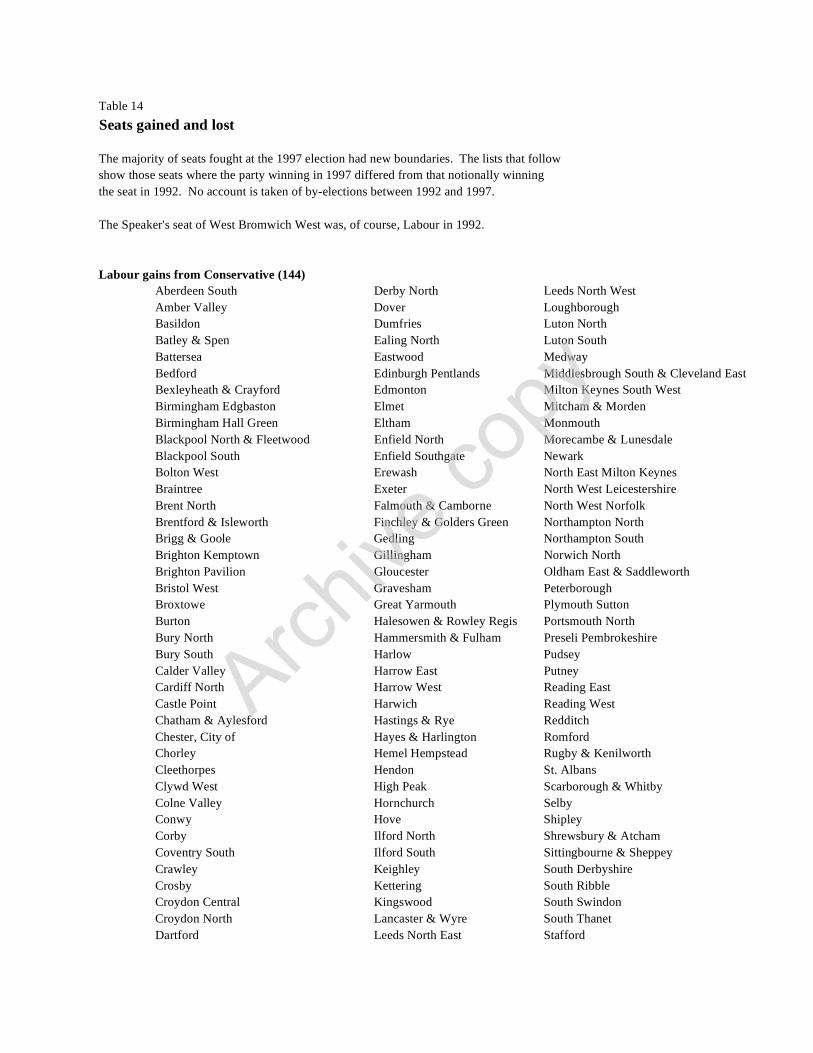
Table 14
Seats gained and lost
The majority of seats fought at the 1997 election had new boundaries. The lists that followshow those seats where the party winning in 1997 differed from that notionally winningthe seat in 1992. No account is taken of by-elections between 1992 and 1997.
The Speaker's seat of West Bromwich West was, of course, Labour in 1992.
Labour gains from Conservative (144)Aberdeen South Derby North Leeds North WestAmber Valley Dover LoughboroughBasildon Dumfries Luton NorthBatley & Spen Ealing North Luton SouthBattersea Eastwood MedwayBedford Edinburgh Pentlands Middlesbrough South & Cleveland EastBexleyheath & Crayford Edmonton Milton Keynes South WestBirmingham Edgbaston Elmet Mitcham & MordenBirmingham Hall Green Eltham MonmouthBlackpool North & Fleetwood Enfield North Morecambe & LunesdaleBlackpool South Enfield Southgate NewarkBolton West Erewash North East Milton KeynesBraintree Exeter North West LeicestershireBrent North Falmouth & Camborne North West NorfolkBrentford & Isleworth Finchley & Golders Green Northampton NorthBrigg & Goole Gedling Northampton SouthBrighton Kemptown Gillingham Norwich NorthBrighton Pavilion Gloucester Oldham East & SaddleworthBristol West Gravesham PeterboroughBroxtowe Great Yarmouth Plymouth SuttonBurton Halesowen & Rowley Regis Portsmouth NorthBury North Hammersmith & Fulham Preseli PembrokeshireBury South Harlow PudseyCalder Valley Harrow East PutneyCardiff North Harrow West Reading EastCastle Point Harwich Reading WestChatham & Aylesford Hastings & Rye RedditchChester, City of Hayes & Harlington RomfordChorley Hemel Hempstead Rugby & KenilworthCleethorpes Hendon St. AlbansClywd West High Peak Scarborough & WhitbyColne Valley Hornchurch SelbyConwy Hove ShipleyCorby Ilford North Shrewsbury & AtchamCoventry South Ilford South Sittingbourne & SheppeyCrawley Keighley South DerbyshireCrosby Kettering South RibbleCroydon Central Kingswood South SwindonCroydon North Lancaster & Wyre South ThanetDartford Leeds North East Stafford

Stevenage Vale of Clwyd Welwyn HatfieldStirling Vale of Glamorgan WimbledonStockton South Wansdyke Wirral SouthStourbridge Warrington South Wirral WestStroud Warwick & Leamington Wolverhampton South WestTamworth Watford WorcesterTynemouth Waveney Wrekin, TheUpminster Wellingborough Wyre Forest
Labour gains from Liberal Democrat (2)Inverness East, Nairn & Lochaber Rochdale
Liberal Democrat gains from Conservative (30)Brecon & Radnorshire Kingston & Surbiton South East CornwallCarshalton & Wallington Lewes SouthportColchester Newbury Sutton & CheamEastleigh Northavon TauntonEdinburgh West Oxford West & Abingdon TorbayGordon Portsmouth South Torridge & West DevonHarrogate & Knaresborough Richmond Park TwickenhamHazel Grove St. Ives West Aberdeenshire & KincardineHereford Sheffield Hallam Weston-Super-MareIsle of Wight Somerton & Frome Winchester
SNP gains from Conservative (3)Galloway & Upper Nithsdale Perth North Tayside
Independent gain from Conservative (1)Tatton
Ulster Unionist gain from DUP (1)West Tyrone
Sinn Fein gain from DUP (1)Mid Ulster
Sinn Fein gain from SDLP (1)Belfast West
United Kingdom Unionist gain from Ulster Popular Unionist (1)North Down
Note: West Tyrone is a new seat, notionally 'won' by the DUP in 1992, but where
the DUP did not field a candidate in 1997.