parks victoria technical series · sanctuary and eagle rock point marine sanctuary are the focus of...
TRANSCRIPT
p a r k s v i c t o r i a t e c h n i c a l s e r i e s
number 22
rocky shores of marine national parks and sanctuaries on the surf coast shire:
values, uses and impacts
Christine Porter and Geoffrey Wescott
June 2010

© Parks Victoria
All rights reserved. This document is subject to the Copyright Act 1968, no part of this publication may be reproduced, stored in a retrieval system, or transmitted in any form, or by any means, electronic, mechanical, photocopying or otherwise without the prior permission of the publisher.
First published 2010
Published by Parks Victoria Level 10, 535 Bourke Street, Melbourne Victoria 3000
Opinions expressed by the Authors of this publication are not necessarily those of Parks Victoria, unless expressly stated. Parks Victoria and all persons involved in the preparation and distribution of this publication do not accept any responsibility for the accuracy of any of the opinions or information contained in the publication.
Author(s):
Christine Porter – Deakin University
Geoffrey Wescott – Deakin University
National Library of Australia Cataloguing-in-publication data
Includes bibliography ISSN 1448-4935
Citation
Porter, C and Wescott, G. (2010) Rocky Shores of Marine National Parks and Sanctuaries on the Surf Coast: Values, Uses and Impacts prior to protection. Parks Victoria Technical Series No. 22. Parks Victoria, Melbourne.
Printed on environmentally friendly paper
Parks Victoria Technical Series No. 22
Rocky Shores of Marine National Parks and Sanctuaries on the Surf Coast Shire:
Values, uses and impacts
Christine Porter
Geoffrey Wescott
Deakin University
June 2010

Parks Victoria Technical Series No.22 Surf Coast use
II
EXECUTIVE SUMMARY
Rocky shores located in and near the Point Addis Marine National Park, Point Danger Marine Sanctuary and Eagle Rock Point Marine Sanctuary are the focus of this report. The study known as the “Surf Coast Intertidal Project” was undertaken in 2000-2003, where most of the sampling was completed prior to the declaration of the 13 new Marine National Parks and 11 Marine Sanctuaries along the Victorian Coastline in 2002. The project was conducted by Deakin University for the Surf Coast Shire and funded through an Australian Research Industry Partnership grant.
Four questions were addressed as part of the current study:
• What are the main habitats, community types and species present within the Marine National Parks (MNP) and Marine Sanctuaries (MSs) areas before declaration?
• How many people visit shores along the study area and what activities do they pursue while there?
• What are the effects of human use on populations of common gastropods and dominant plant cover?
• How can managers assess human impacts and what management options are available for maintaining ecological health of the rocky shores?
Whilst this study is specific to the Surf Coast Shire the questions addressed are similar to those in recent major reports such as the House of Representatives (HORSCCCWEA, 2009) inquiry into the impact of climate change on coastal communities, the work of the National Sea Change Task Force (see Lazarow et al., 2006) on coastal development and the national coastal policy context outlined by Wescott (2009). Generally, there has been little information available to address any of these questions for shores of the Surf Coast.
Data on the main habitats and species assemblages present, with comparisons made between shores inside and out side the proposed Marine Protected Areas (MPAs) is presented in Chapter 2 to address the first question.
Chapter 3 describes visitation rates and main activities observed for the shores and how these change with time of year. The Surf Coast intertidal areas are used extensively for recreation, education and harvesting, although the extent of this use has not been measured. Visitors to rocky shores may actively investigate the flora and fauna (fossick), collect specimens (living or inanimate), fish or scuba dive from the reef edge, or simply move across the reef as an adjunct to their primary purpose for being there – a visit to the adjacent beach. Some visitors collect intertidal organisms for consumption, fish bait and home aquariums. Highest usage was observed during summer, particularly summer holidays, and lowest during winter. This pattern of use has ecological significance for the intertidal zone in Victoria, because the period of peak use coincides with very low tides in the middle of the day, i.e., impact on intertidal areas is likely to be greatest at this time.
Chapter 4 presents an assessment of impacts of usage on populations of common gastropods and the dominant plant cover Hormosira banksii. These parameters were selected as the most easily assessable indicators of reef biological health, keeping in mind the cost-effectiveness of long term monitoring.
Active management may be required to ensure protection objectives are met and could be in the form of education programs, enforcement presence and, even, construction of physical barrier. Implications of the major findings are discussed with respect to management options in Chapter 5.

Parks Victoria Technical Series No.22 Surf Coast use
III
CONTENTS
EXECUTIVE SUMMARY............................................................................................II
CONTENTS...............................................................................................................III
INDEX OF FIGURES AND TABLES......................................................................... V
1 INTRODUCTION..................................................................................................1
2 NATURAL VALUES OF ROCKY SHORES OF THE SURF COAST: POINT IMPOSSIBLE TO AIREYS INLET .......................................................................3
2.1 Introduction .....................................................................................................................3
2.2 Methods..........................................................................................................................3
2.3 Results............................................................................................................................4
2.3.1 Location descriptions ...............................................................................................................4
2.3.2 Physical features......................................................................................................................7
2.3.3 Plants and animals...................................................................................................................9
2.3.4 Qualitative species data ...........................................................................................................9
3 HUMAN USE OF SURF COAST ROCKY SHORES .........................................12
3.1 Introduction ...................................................................................................................12
3.2 Methods........................................................................................................................12
3.3 Results..........................................................................................................................14
3.3.1 Rocky shore use – off peak (May to October) .......................................................................14
3.3.2 Rocky shore use – Peak period (November to April).............................................................17
3.3.3 Comparisons of usage between peak and off peak periods..................................................21
3.3.4 Minor activities .......................................................................................................................22
3.3.5 Exploitative activities ..............................................................................................................23
4 HUMAN EFFECTS ON SANDSTONE SHORES OF THE SURF COAST ........24
4.1 Introduction ...................................................................................................................24
4.1.1 Effects of collecting on gastropod populations ......................................................................24
4.1.2 Effects of trampling on Hormosira mats.................................................................................25
4.2 Methods........................................................................................................................26
4.2.1 Effects on gastropods ............................................................................................................26
4.2.2 Effects on Hormosira..............................................................................................................27
4.3 Results..........................................................................................................................28
4.3.1 Collecting effects on gastropods............................................................................................28
4.3.2 Trample effects on Hormosira................................................................................................36
5 DISCUSSION.....................................................................................................39
5.1 Biophysical values ........................................................................................................39
5.2 Recreational use...........................................................................................................39
5.3 Impacts of selected uses...............................................................................................39
5.3.1 Collecting ...............................................................................................................................40
5.3.2 Trampling ...............................................................................................................................40
6 CONCLUSIONS AND MANAGEMENT IMPLICATIONS ..................................42
6.1 Conclusions ..................................................................................................................42
6.1.1 Natural values ........................................................................................................................42
6.1.2 Recreational use ....................................................................................................................42

Parks Victoria Technical Series No.22 Surf Coast use
IV
6.1.3 Impacts of collecting and trampling........................................................................................44
6.1.4 Management issues ...............................................................................................................44
6.1.5 Possible measures of ecological health.................................................................................45
6.1.6 Impacts of use and effects of MPA establishment.................................................................45
6.2 Management implications .............................................................................................46
6.2.1 Management issues and options ...........................................................................................46
6.2.2 Options for monitoring............................................................................................................46
ACKNOWLEDGMENTS...........................................................................................47
REFERENCES.........................................................................................................48
APPENDIX 1 ........................................................................................................ A1.1
A1. Field Data Surveys.................................................................................................... A1.1
A1.1. Surf coast inventory checklist.............................................................................................. A1.1
A1.2. Management issues ............................................................................................................ A1.2
A1.3. Hard shores ......................................................................................................................... A1.3
A1.4. Rocky shore transects......................................................................................................... A1.4
APPENDIX 2 ........................................................................................................ A2.1
A2. Locations surveyed ................................................................................................... A2.1
APPENDIX 3 ........................................................................................................ A3.1
A3. Location details ......................................................................................................... A3.1
APPENDIX 4 ........................................................................................................ A4.1
A4. Rocky shore features ................................................................................................ A4.1
APPENDIX 5 ........................................................................................................ A5.2
A5. Habitat types present ................................................................................................ A5.2
APPENDIX 6 ........................................................................................................ A6.1
A6. Assemblage types..................................................................................................... A6.1
APPENDIX 7 ........................................................................................................ A7.1
A7. Ecological assemblages per site ............................................................................... A7.1
APPENDIX 8 ........................................................................................................ A8.1
A8. Species list summary table per site location.............................................................. A8.1
APPENDIX 9 ........................................................................................................ A9.1
A9. Regionally uncommon species.................................................................................. A9.1
APPENDIX 10 .................................................................................................... A10.1
A10. Species richness....................................................................................................A10.1
APPENDIX 11 .................................................................................................... A11.1
A11. Activity totals at each site (off peak period) ............................................................A11.1

Parks Victoria Technical Series No.22 Surf Coast use
V
INDEX OF FIGURES AND TABLES
FIGURES
Figure 2.1. Map of the location surveyed. .............................................................................. 6
Figure 2.1. Non-metric MDS plots resulting from comparison of, (a) physical features and (b) habitats present between sites, inside and outside protected areas based on visual assessment data. ........................................................................... 8
Figure 2.2. Non-metric MDS plot resulting from comparison of habitat structure between sites inside and outside protected areas based on relative amounts of each habitat type present (values not available for Eagle Rock Point). ................ 9
Figure 2.3. Comparison of park and non-park areas based on species presence for: (a) all species and (b) plant species. The closer data points are together the greater the similarity of shores for the variable(s) being compared. The circle to the left in map b represents the Eagle Rock Point basalt site..............................11
Figure 3.1. Mean number of people per 5 minutes using each of the rocky shores during off peak season. ..........................................................................................15
Figure 3.2. The effect of day type on usage patterns for reefs inside (first 5 locations) and outside the marine protected areas from May to October (off peak). Location abbreviations as per Table 2.1 .................................................................17
Figure 3.3. Mean numbers of visitors per five minute observation time during peak period. ....................................................................................................................18
Figure 3.4. The effect of day type on usage patterns for reefs inside (first 5 locations) and outside the marine protected areas from November to April (peak season). Location abbreviations as per Table 2.1...................................................21
Figure 3.5. Comparison of visits to rocky shores (a) and visits to rocky shores plus nearshore use (b) between peak and off peak seasons. The first (blue) bar represents off-peak values and the second (purple) bar peak values......................22
Figure 4.1 (a). Mean size ± se of gastropods often harvested. Location code key as per Table 4.1. .........................................................................................................29
Figure 4.1 (b). Mean size± se of gastropods not normally collected. First four locations in each graph now in MPAs. ...................................................................................30
Figure 4.2. Mean size (± se) for each species with locations grouped according to usage level, based on data for all shores investigated. ...........................................31
Figure 4.3. CPUE mean±se for: a) Cellana tramoserica; b) Austrocochlea constricta; c) Bembicium nanum; d) Siphonaria sp.; e) Cominella lineolata; f) Dicathais orbita; g) Turbo undulatus (Point Roadknight CPUE + 80±8 not included here). Location abbreviation details as per Table 4.5. PD, WP, ER and PA have since been included in Marine National Parks.........................................................34
Figure 4.4. Percent cover in Hormosira mats autumn and spring. PI to WP high use shores. St to SS low use. PD, WP and SS now in MPAs. .......................................37
Figure 4.5. Percent of Hormosira fronds less than 50 mm long, autumn and spring. Smaller values indicate healthier plant cover. .........................................................38

Parks Victoria Technical Series No.22 Surf Coast use
VI
TABLES
Table 2.1. Description of the location surveyed. .................................................................... 5
Table 3.1. Usage survey locations........................................................................................13
Table 3.3. Factors and levels used in the experimental design.............................................14
Table 3.4. Means and standard errors (SE) for visitors to the rocky shores (rock) and nearshore (sea) use at each site during the off-peak period (n = 12) per 5 min period. R = rock, S = Sea........................................................................................15
Table 3.5. Main activities at each site based on total numbers for 12 observation periods – off peak period. .......................................................................................16
Table 3.6. Main activities for each location: peak period based on twelve observation periods at each site. Percent refers to percent of total people observed at the site. The first five locations (shaded) are now within MPAs.....................................19
Table 3.7. Use level categories based on mean number of visitors per 5 minute observation period and the maximum number seen during any one observation period for that location – including both rock and nearshore use - during peak period. High use = mean > 6 and maximum > 20; Moderate use = mean 2 – 6 and maximum 10 – 20; Low use = mean < 2 and maximum < 10.........20
Table 4.1. Study locations categorised by high or low use...................................................26
Table 4.2. Gastropod species for which population data was collected. ...............................27
Table 4.3. Abundance and size data for Turbo undulatus. Locations now within MPA’s are bolded. .............................................................................................................32
Table 4.4 Abundance and size data for Austrocochlea constricta. Locations now in MPA’s are bolded. ..................................................................................................33
Table 4.5: Abundance and size data for Dicathais orbita. Locations now in protected areas bolded. Asterisk indicates locations where most of individuals found midshore in mussel patches. ..................................................................................33

Parks Victoria Technical Series No.22 Surf Coast use
1
1 INTRODUCTION
Rocky shores cover around 26% of Victoria’s coastline (Traill & Porter 2001). The proportion is slightly higher for the Surf Coast at 32% (unpublished data). The rocky shores of Victoria’s open coast support a diverse assemblage of animal and plants that varies slightly according to the type of rock, the exposure to waves and the water temperature (Handreck and O’Hara 1994). The composition of species assemblages is influenced by biological processes of recruitment, competition and predation. Human use may also alter the population and community dynamics of rocky shores.
Rocky shores of the Surf Coast between Breamlea and Aireys Inlet are the focus of this report: in particular, those in and near the Point Addis Marine National Park, Point Danger Marine Sanctuary and Eagle Rock Point Marine Sanctuary. Sampling was undertaken between 2000 and 2002, prior to the declarations of the 13 Marine National Parks in 2002.
Existing published knowledge about intertidal environments of the Surf Coast is based on descriptions of geomorphology (Bird 1993), the early ecological work of Bennett and Pope (1953) and on species lists of invertebrates compiled by the Marine Research Group of Victoria (Handreck & O’Hara 1994). Shores of the Surf Coast comprise sandstone/mudstone west of Cinema Point and mainly sandy limestone to the east of this point. The shores around Aireys Inlet are an exception, with a mosaic of rock types represented. Most of the shores are either wave cut platforms or eroding reef flats and are backed by cliffs or bluffs.
Bennett and Pope’s work provides a general description of zonation patterns, with only one shore in the region described in detail (Point Grey, Lorne), while Handreck and O’Hara (1994) have described invertebrate species diversity. The rocky shores of Lorne, Aireys Inlet, Point Addis and Point Danger were all identified as areas of high invertebrate species richness.
Previous reported studies of visitation to temperate shores confirm the expected trend of highest usage during summer, particularly summer holidays, and lowest during winter (Underwood & Kennelly 1990; Kingsford et al. 1991). This pattern of use has ecological significance for the intertidal zone in Victoria, because the period of peak use coincides with very low tides in the middle of the day, i.e., impact on intertidal areas is likely to be greatest at this time.
Harvesting pressure has the capacity to change the nature of intertidal communities (Castilla 1999). Direct effects of collecting include reductions in abundance and/or reductions in mean size (changes in size structure through collection of larger individuals) of populations (Keough et al. 1993; Keough & Quinn 2000). Indirect effects may occur as a result of effects on interactions between species. Removal of predators has been shown to result in an increased abundance of prey species and to indirectly affect algal abundance and food web dynamics (for example Castilla & Duran 1985; Godoy & Moreno 1989; Linberg et al. 1998).
The fucoid alga, Hormosira banksii (Neptune’s Necklace), is a key habitat forming plant of mid and low eulittoral zones on rocky shores in South West Victoria. Along the Surf Coast, it is typical of platform shores east of Cinema Point. Hormosira mats provide shelter for a range of organisms, including gastropods, small crustaceans, polychaete worms, small foliose algae and articulating coralline algae. Activities that impact on Hormosira cover have the potential to change mid-shore community dynamics.
Previous studies have shown that protected areas are not necessarily free from exploitative activities (Murray 1999; Keough & Quinn 2000; Porter & Wescott 2004) and that active management may be required to ensure protection objectives are met. This active management could be in the form of education programs, enforcement presence and, even, construction of physical barrier. Recent studies from Blayney and Wescott (2004) and Galloway (2009) have also examined the relationship between Marine Protected Area (MPA)

Parks Victoria Technical Series No.22 Surf Coast use
2
declaration, public perceptions and recreational use of MPAs - the former being performed inside the Surf Coast Shire.
The Victorian Coastal Strategy, which is the State’s chief coastal strategic planning document for the coastal zone (including coastal waters) sets three major priorities for the next five years in relation to the coastal zone:
• Addressing the impacts of climate change on the coastal zone.
• Addressing the challenge of increasing coastal development.
• Maintaining the ecological integrity of the marine environment.
This study addresses all three of these challenges by posing the following four main research questions for the Surf Coast Shire:
• What were the main habitats, community types and species present within the Marine National Park (MNP) and Marine Sanctuaries (MSs) before declaration?
• How many people visit shores along the study area and what activities do they pursue while there?
• What are the effects of human use on populations of common gastropods and dominant plant cover?
• How can managers assess human impacts and what management options are available for maintaining ecological health of the rocky shores?
Parks Victoria Technical Series No.22 Surf Coast use
3
2 NATURAL VALUES OF ROCKY SHORES OF THE SURF COAST: POINT IMPOSSIBLE TO AIREYS INLET
2.1 Introduction
Current knowledge about intertidal environments of the Surf Coast is based on descriptions of geomorphology (Bird 1993), the early ecological work of Bennett and Pope (1953) and on species lists of invertebrates compiled by the Marine Research Group of Victoria (Handreck & O’Hara 1994). Shores in the Aireys Inlet region are of complex geology, being a mix of sandy limestone, basalt and mudstone. Shores to the east here are a mix of sandy limestone and Pleistocene dune calcarenite. Two rocky protrusions in this region are distinctly different to the rest of the rocky coastline. Soapy Rocks are “a ledge of cross-beaded yellow ferruginous Angahook sands and clays with basalt pebbles and tuff derived from the Aireys inlet volcano” (Bird 1993). Black Rocks is a promontory fringed by basalt boulders. Many shores in the region are backed by vertical unvegetated and unstable limestone/calcarenite cliffs.
Bennett and Pope’s work provides a general description of zonation patterns, with only one shore in the region described in detail (Point Grey, Lorne), while Handreck and O’Hara (1994) have described invertebrate species diversity. The rocky shores of Lorne, Aireys Inlet, Point Addis and Point Danger were all identified as areas of high invertebrate species richness.
The work presented part of a study conducted for Surf Coast Shire for shores between Point Impossible to Cumberland River. Data was collected to provide comparative information on habitat types, community composition and species present. The results presented here represent a subset of this data: those pertaining to shores within and adjacent to the marine protected areas (MPAs). The mud stone shores west of Cinema Point are not included, as there are no MPAs along this stretch of coast.
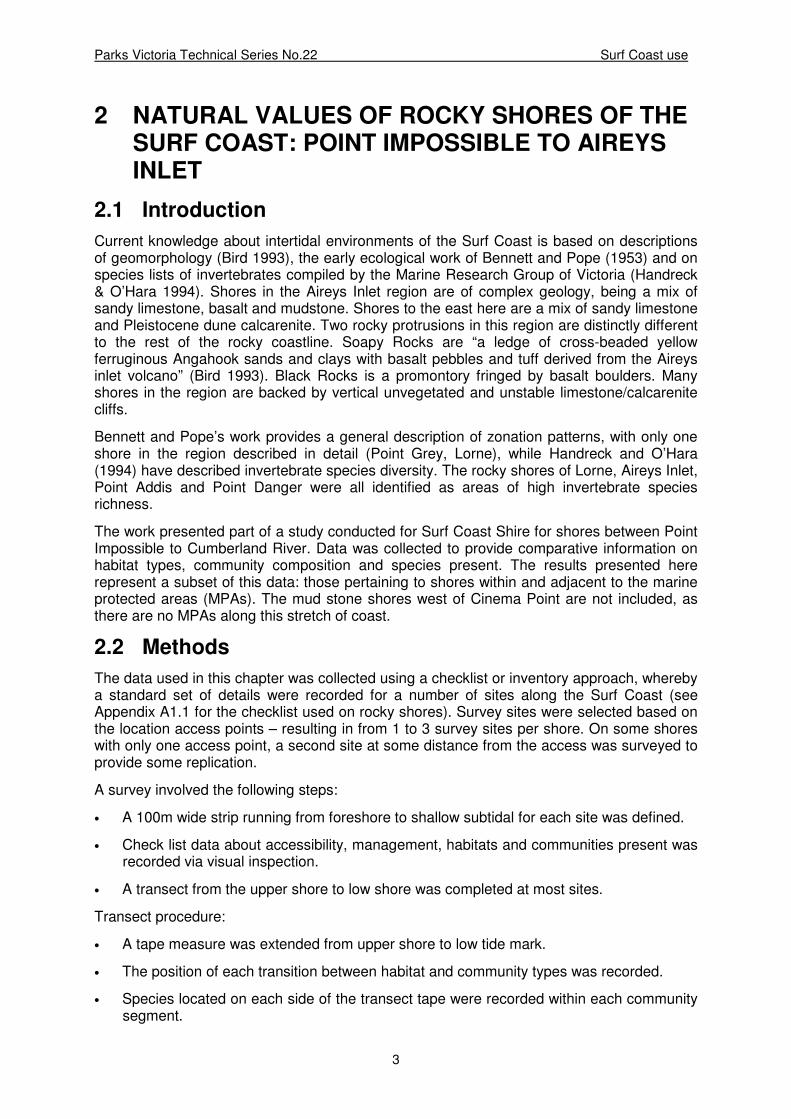
2.2 Methods
The data used in this chapter was collected using a checklist or inventory approach, whereby a standard set of details were recorded for a number of sites along the Surf Coast (see Appendix A1.1 for the checklist used on rocky shores). Survey sites were selected based on the location access points – resulting in from 1 to 3 survey sites per shore. On some shores with only one access point, a second site at some distance from the access was surveyed to provide some replication.
A survey involved the following steps:
• A 100m wide strip running from foreshore to shallow subtidal for each site was defined.
• Check list data about accessibility, management, habitats and communities present was recorded via visual inspection.
• A transect from the upper shore to low shore was completed at most sites.
Transect procedure:
• A tape measure was extended from upper shore to low tide mark.
• The position of each transition between habitat and community types was recorded.
• Species located on each side of the transect tape were recorded within each community segment.

Parks Victoria Technical Series No.22 Surf Coast use
4
• Community types were determined according to dominant species e.g. Hormosira mats, grazers, and mussel beds
In this way, both presence/absence and quantitative data was collected from the one transect.
Data was entered into a Microsoft Access database and Excel spreadsheets, from which reports on data of interest were prepared (e.g. species lists).
Data analysis involved grouping shores according to similarity of physical and/or biological features using non-metric multi-dimensional scaling (MDS) analysis. Multidimensional scaling (MDS) is an exploratory data analysis technique that condenses large amounts of data into a relatively simple spatial map, thus providing a visual representation of similarities among objects. Points that are closer together on the spatial map represent similar objects while those that are further apart represent dissimilar ones. The stress value on each map ranges from zero to one, and is a measure of how well the output map fits the input data – the closer the value to zero the better the fit.
In addition to this analysis, a species richness index was calculated whereby the number of species found on a shore was divided by the total number of species found for all shores, as per Handreck and O’Hara (1994).
2.3 Results
2.3.1 Location descriptions
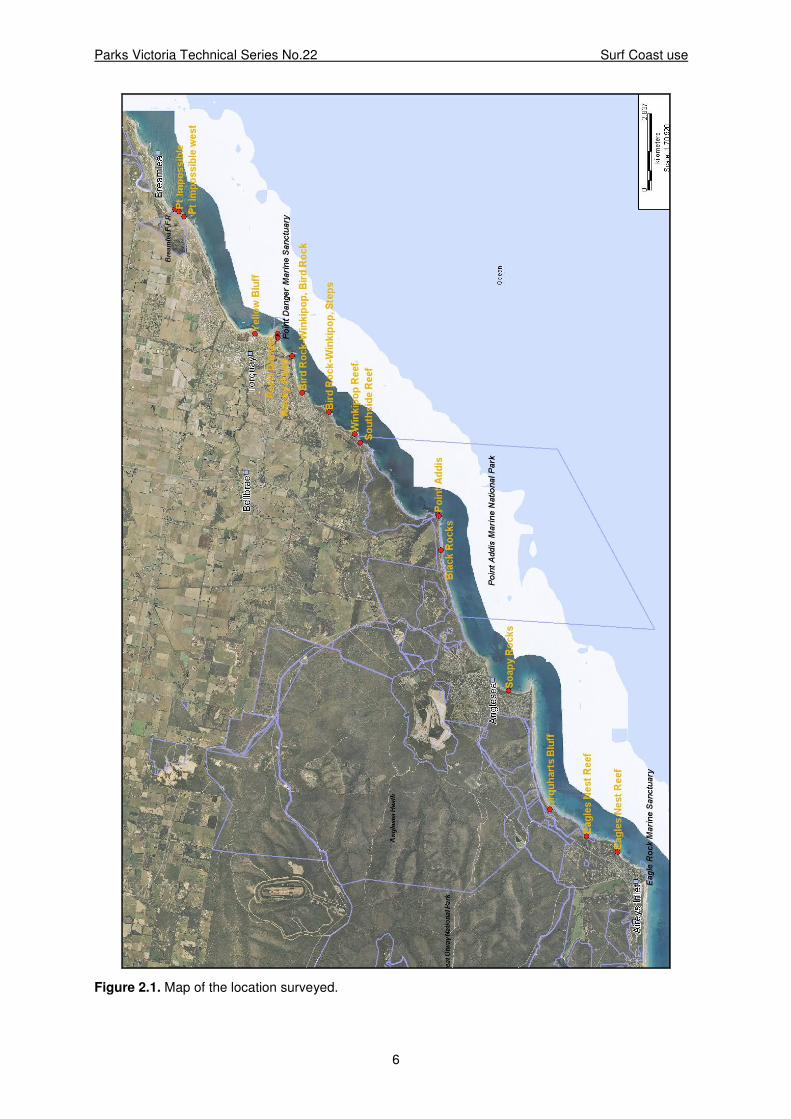
Each location included in this report is shown on the map in Figure 2.1 and a general description is provided in Table 2.1 (refer to Appendix 2 for greater visual detail of each location surveyed including the location of transect lines). Data on shore length, number of access points, number of sites surveyed, percent sand, accessibility, foreshore type and presence of watercourses for each location is presented in Appendix 3.
The Surf Coast study area from Point Impossible, Breamlea, to Spit Point, Aireys Inlet comprises a series of rocky shoes, ranging in length from 0.3 to 2.2 kilometres, separated by sandy beaches. The rocky shores from Bird Rock to Southside and from Urquharts Bluff to Eagle Rock are dissected by small pocket-shaped beaches, giving the appearance of almost continuous rocky coastline. Shores are separated by long sandy beaches along the rest of this coastline. Twenty three percent of the rocky shores along this section of coast are included within MPAs.
Sand scouring, freshwater input and human activity all have the potential to impact on the ecology of rocky shores. Most of the shores now within the MPAs are predominantly rocky, while a high proportion of the other shores are sand affected. The only direct freshwater input is Thompson Creek at Point Impossible. None of the MPA shores have direct freshwater input, although Southside and Eagle Rock may be influenced by seepage through cliffs (based on observations during the study). Tall, unstable cliffs back many of the shores along this coastline – a physical feature that limits accessibility. However, Point Danger, Yellow Bluff and Rocky Point are close to the major coastal township of Torquay and access to the reefs from the foreshore bluffs and adjacent beaches is relatively easy. The direct impact of built structures on the biota of rocky shoes is likely to be insignificant as, apart from cliff top housing at Eagle Rock, built structures are limited to access steps, viewing platforms and foreshore car parks.

Parks Victoria Technical Series No.22 Surf Coast use
5
Table 2.1. Description of the location surveyed.
Key: SC = Surf Coast study location code. Access marker refers to the yellow emergency triangles marking access tracks along Victoria’s coastline Point Impossible and Yellow Bluff. While the least habitat diverse shore was the Point Roadknight Ocean platform.
SC Code
Location name
Abbrev. Access marker
Location notes
1 Point Impossible
PI 52W, 53W
Thompson Creek outlet is western boundary of this unit. Boulders and broken reef upper shore, smooth bedrock with some overlying sand mid-shore and dissected platform/broken reef mid to low shore. Periodic sand cover over reef, especially upper and upper-mid shore.
2 Point Impossible west
IW 54W Rock platform with rock pools backed by beach and an extensive dune system that is several hundred meters wide.
5 Yellow Bluff YB 61W Very accessible reef that appears quite worn from foot traffic. Fractured platform with "fractures" aligned down shore.
7 Point Danger PD 66W Large flat reef that is only exposed during tides less than 0.5 m. High proportion of broken reef, rubble and cobbles, with most of animals under rather than on top of rocks. Sand deposits amongst rock rubble.
11 Bird Rock to Winkipop (sites Bird Rock and Steps)
BR, St 79W, none
Cliffed coastline with limestone rock platforms dissected by a couple of very small, steep sandy beaches. Both are popular surfing sites.
12 Winkipop Reef
WP 80W High cliffs and flat shore platform. Waves generally greater than 1 m. Mainly used by surfers for access to waves.
14 Southside Reef
SS 81W Gently sloping limestone reef with some fractures and ledges. Hornosira mats provide the dominant cover.
17 Point Addis PA 84W Extensive shore platform on Addiscott Beach side of the point. Narrow fringing platform below cliffs around the point. Small sandy cove with subtidal reef divides the two areas of rocky shore.
25 Point Roadknight Ocean
PR 96W The point is a narrow dune calcarinite ridge. Ocean side has shore platform and shallow subtidal reef.
28 Urquharts Bluff
UB 103W Wide flat platform with large area covered in mussel beds.
29 Urquharts to Sunnymead
US none Extensive shore platform backed by cliffs dissected by two small pocket beaches.
31 Eagles Nest Reef
EN 104W, 105W
Sandstone reef backed by high cliffs with two narrow beaches and extensive nearshore reef.
33 Aireys to Eagle Rock Beach
AE 105W Platform extends from Aireys beach to a less accessible small beach just before Eagle Rock. Predominantly mudstone with some sandstone. In shadow of tall cliffs most of the day.
35 Eagle Rock Beach to Spit Point
ER none Mosaic of rock types and mixed platform boulder reef. Eagle Rock is a 20 m high stack.
Parks Victoria Technical Series No.22 Surf Coast use
6
Figure 2.1. Map of the location surveyed.

Parks Victoria Technical Series No.22 Surf Coast use
7
2.3.2 Physical features
Features of the rocky shores of the Surf Coast are summarized in Appendix 4. Limestone and sandstone shore platforms are the most common shore type to the east of Aireys Inlet, while shores in the vicinity of Aireys Inlet reflect the complex geology of this area. Most shores are 60 – 90 m wide at low tide, with the exception of the wide reefs at Point Impossible, Point Danger, Point Addis and Urquharts Bluff. The platform of these sandstone
shores occurs in the mid-intertidal zone where mats of the brown alga Hormosira banksii, form the dominant (in terms of extent) shore cover. The shores within MPAs are predominantly sandstone, with some basalt boulders at two sites. Reef form within the MPAs is typical of sandstone shores in the region, and the main habitat on each shore encompasses the full range of main habitat types seen for this region (platform, eroded platform, rock slabs, and boulders).
The physical structure of shores will influence the patterns of distribution and abundance of plants and animals that live there. The expectation is that the more habitat types on a shore, the higher the species diversity is likely to be. An analysis of habitat was conducted in this study by recording presence and extent of each of habitat type along transects from the foreshore to the sublittoral fringe zone. The habitat types present on these shores are indicated in Appendix 5, where the presence of each habitat at each site is indicated with a “1”. The number of different habitats present along a transect on shores within the MPAs ranged from 3 to 7, with an average of 6 (standard deviation of 1.6), while the number of habitats on shores outside the MPAs ranged from 2 to 9, with an average of 5 (standard deviation 1.6). The result suggests that the MPA shores and non-MPA shores are similar in terms of the habitats available.
The data on physical features and habitat types were used to determine how physically similar shores inside and outside of MPAs are to each using non-metric MDS (Primer). The resultant plots (Figure 2.1a & b) suggest all of the shores studied are similar in gross physical features and in the habitat types available to shore biota. This is confirmed with statistical comparison using Primer ANOSIM, or analysis of similarity, between MPA verses other shores (Primer ANOSIM: global correlation (r) = 0.054; probability (p) = 17.9% for physical feature comparison and global r = 0.063; p = 13.4% for habitat comparison).

Parks Victoria Technical Series No.22 Surf Coast use
8
a)
n
pd
wp
ss
pa
er
Stress: 0.16
b)
n
pd
wp
ss
pa
er
Stress: 0.17
Figure 2.1. Non-metric MDS plots resulting from comparison of, (a) physical features and (b) habitats present between sites, inside and outside protected areas based on visual assessment data.
Key: triangle/n = non-protected area sites; circle = park sites; pd = Point Danger; wp = Winki Pop Reef; ss = Southside reef; pa = Point Addis shore platform; er = Eagle Rock Point.
Extent of habitat type data, measured as a percent occurrence along a transect, was calculated for 10 MPA sites and 16 non-MPA sites (see Appendix 5). The map of similarity between shores based on the relative amount of each habitat type present on each reef (Figure 2.2) suggests that the shores inside MPAs are dissimilar (when compared with each other and with shores outside the MPAs) with respect to habitat structure. This was confirmed with analysis of similarity (global r = 0.172; p = 2.1%). Ideally, stress values for this test should be less than 0.1, hence the conclusions from these comparisons are statistically weak.
In summary, the shores inside MPAs are similar to shores outside their boundaries in terms of habitats available to animals and plants, but the extent of each habitat type differs. For example half the shores within MPAs have large areas of crumbling reef or rubble, while only two sites outside the MPAs had significant amounts of this habitat. These rubble areas are likely to have a different species composition to the solid rock platform areas, with potential micro-habitats both on top of and under the chunks of rubble.

Parks Victoria Technical Series No.22 Surf Coast use
9
n
pd
wp
ss
pa
Stress: 0.15
Figure 2.2. Non-metric MDS plot resulting from comparison of habitat structure between sites inside and outside protected areas based on relative amounts of each habitat type present (values not available for Eagle Rock Point).
Key: triangle/n = non-protected area sites; circle = park sites; pd = Point Danger; wp = Winki Pop Reef; ss = Southside reef; pa = Point Addis shore platform; er = Eagle Rock Point.
2.3.3 Plants and animals
A descriptive survey of the biological values of shores along the Surf Coast was undertaken as a precursor to quantitative work on species abundance and human impact studies. Species assemblage types, species presence and the proportion of each assemblage type present were recorded for most of the intertidal rocky shores along the Surf Coast. The assemblage types observed at each site are listed in Appendix 6 and presence/ absence for each site recorded in Appendix 7.
Many of the sandstone platform reefs had an extensive cover Hormosira banksii (referred to as Hormosira mats). On three shores close to population centres (Yellow Bluff, Bird Rock, and Aireys to Eagle Rock – also known as Sandy Gully) the mid-shore areas were covered in turf algae - Gelidium pusilum for example. Mussel beds cover large areas on some reefs around Urquharts Bluff and Aireys Inlet. Grazers and deposit feeders are typical of the shores that areas of rubble, cobbles and boulders (e.g. Point Danger, Pt Addis and the Eagle Rock basalt boulder area).
All assemblage types were represented at both MPA and other shore locations, although some assemblages were (apparently) absent from some parks. Patches of barnacles and Galeolaria large enough to be considered an assemblage were absent from Pt Danger, for example, probably because of the absence of suitable habitat such as vertical faces. Cunjevoi spp. patches were not seen at any of the locations included here, although the occasional individual was found. Dicathais orbita and Turbo undulatus species were found in association with each other (predator and prey). These species were abundant at only four sites (two inside and two outside the MPAs). Cunjevoi, Dicathais and Turbo are all known to be subject to human harvesting pressure (Fairweather 1991, Keough et al. 1993).
2.3.4 Qualitative species data
Ninety four taxa from 14 animal classes and 48 taxa from 6 plant phyla were recorded from in all sites surveyed in the Surf Coast region study. Most of the animal species belonged to the classes Gastropoda (38) and Crustacea (18), while most plants belonged to the Phyla Phaeophyta (24) and Chlorophyta (13). All of the taxa found along this coastline are common intertidal species for Victorian shores (Marine Research Group of Victoria, 1984). This data is comparable across shores and gives an indication of relative species richness, but it is based on a single survey effort at each site, so is very likely to under-represent the diversity of these shores.

Parks Victoria Technical Series No.22 Surf Coast use
10
Forty three plant, 34 mollusc and 30 non-molluscan invertebrate taxa were recorded from within 6 MPA sites. Thus 30 animal taxa and 5 plant taxa were found elsewhere in the region but not within the proposed MPA sites (Appendix 8).
Because quantitative data is not yet available from this study, an indirect method was used here to assess the relative abundance of taxa within the Surf Coast region. Taxa were categorized as very common, common or uncommon, based on the proportion of sites at which each taxon was observed. The species considered uncommon within the region (present at less than 10% of sites) with the locations at which they were found are given in Appendix 9. Regionally uncommon taxa were found in all three MPAs, with 11 at Pt Danger, 9 at Point Addis and 4 at Eagle Rock Point.
Many of the plant, cnidarian and echinoderm species on this list are normally found in the sublittoral fringe/ shallow subtidal zones, thus are probably more abundant than indicated here.
Species richness and diversity for shores in the region has not been calculated, as this requires abundance data. Handreck and O’Hara (1994) devised a species richness index (SRI), which involved dividing the number of species found by the number of species on their rocky shore invertebrate database. A similar approach has been applied here, whereby the number of taxa found on each shore is divided by the total number of taxa found for all shores along the Surf Coast in this study. This provides a measure of relative diversity for the shores. Values were calculated for the gastropod fauna, all animals, all plants and all taxa (see Appendix 10). SRI values were considered high if more than 40% of the total species list were found at a site. Most MPA sites have high SRI values for gastropods and plants. Only three shores have high SRI values when all taxa are considered, two of which (Point Danger and Southside reef) occur within MPAs.
Gastropods were recorded separately to determine whether this taxonomic group can be used as a surrogate for overall species richness. The correlation between gastropod and overall SRI’s was high (correlation coefficient = 0.93). The correlation between plant SRI and overall SRI was much lower (correlation coefficient = 0.64).
Park and non-park sites were compared for species composition using non-metric MDS and ANOSIM analysis (PRIMER v.5). When all taxa are considered, the only site that is obviously different to the rest is the basalt boulder shore at Eagle Rock Point (Figure 2.3a), a difference reflected in the plant species present (Figure 2.3b). No difference was detected in species composition, based on species presence data, between MPA and other shore areas for any of the taxonomic levels considered (all species, all invertebrate species, all plant species, all mollusc species). Thus, apart from Eagle Rock Point, the shores included in this study had similar species composition before the MPAs were declared. This provides a useful starting point for future monitoring. For example, if a future descriptive survey of biota were to sho significant difference between within-MPA and non-MPA shores, then quantitative sampling to test hypotheses to explain any differences would be warranted.

Parks Victoria Technical Series No.22 Surf Coast use
11
a)
pd
pa
er
n
Stress: 0.15
b)
MPA
n
Stress: 0.12
Figure 2.3. Comparison of park and non-park areas based on species presence for: (a) all species and (b) plant species. The closer data points are together the greater the similarity of shores for the variable(s) being compared. The circle to the left in map b represents the Eagle Rock Point basalt site.
Key: (a) all species: triangle/n = non-MPA shores; circle = MPA shores - pa = Point Addis, pd = Point Danger; er = Eagle Rock Point. (b) plant species: triangle/n = non-MPA shores, circle/MPA =shores in MPAs.

Parks Victoria Technical Series No.22 Surf Coast use
12
3 HUMAN USE OF SURF COAST ROCKY SHORES
3.1 Introduction
The Surf Coast intertidal areas are used extensively for recreation, education and harvesting, although the extent of this use has not been measured. Typical uses of rocky shores include exploration, walking, fishing, and educational visits. Some visitors collect intertidal organisms for consumption, fish bait and home aquariums. Previous reported studies of visitation to temperate shores confirm the expected trend of highest usage during summer, particularly summer holidays, and lowest during winter (Underwood & Kennelly 1990; Kingsford et al. 1991). This pattern of use has ecological significance for the intertidal zone in Victoria, because the period of peak use coincides with very low tides in the middle of the day, i.e., impact on intertidal areas is likely to be greatest at this time.
Quantitative assessments of recreational use for Australian rocky shores have mainly been conducted to assess levels of harvesting of intertidal organisms (e.g., Underwood and Kennelly 1990; Kingsford et al. 1991; Keough et al. 1993). Abalone, whelks, turban shells, trochid shells, limpets, urchins, crabs and octopuses appear to be the most commonly collected organisms, primarily for food or fish bait. Keough et al. (1993) reported collecting incidence as high as twenty five percent of visitors on heavily used shores close to Melbourne, Victoria. The figure was higher for some shores close to Sydney in New South Wales (Underwood & Kennelly, 1990), although the average for a number of shores along the New South Wales coastline was closer to 8% (Underwood 1993). The incidence of collecting was found to be far lower on shores distant from population centres and within intertidal protected areas (Keough et al. 1993; Porter & Wescott 1994). Nonetheless, illegal collecting from within intertidal protected areas has been reported in several papers (Murray et al. 1999; Keough & Quinn 2000; Porter & Wescott 1994). Managers may need to pay special attention to strategies to increase compliance in these areas.
The patterns of human use of rocky shores within, and in the vicinity of, marine protected areas located on the Surf Coast are described in this chapter. Data has been collected on total use levels, the most common activities, and when peaks of use occur.
3.2 Methods
Observations of activity patterns were made from May 2001 to May 2002 (prior to declaration of the Marine National Parks and Sanctuaries). The survey locations are listed in Table 3.1. On each survey day, five minute counts were conducted at each survey location at a time during the period from three hours before to three hours after predicted low time. A five minute period was used to allow all sites along the coast to be assessed during the two hours before and after predicted low tide. For each location, people were counted and their activities recorded from the foreshore out to approx 500 m off shore within a 200 m wide stretch of rock platform close to an access point. The dependent variables are the number of people at each location and the number of people engaged in a range of activities as described in Table 3.2. Information on weather and sea conditions at each location was recorded, along with the species of sea and shore birds present (Appendix 11).

Parks Victoria Technical Series No.22 Surf Coast use
13
Table 3.1. Usage survey locations.
Code Reefs now within protected areas
Code Reefs outside
protected areas
PD Point Danger BR Bird Rock
WP Winki Pop Reef PR Point Roadknight Ocean
SS Southside Reef UB Urquharts Bluff
PA Point Addis EN Eaglesnest Reef
ER Eagle Rock Point AE Aireys to Eagle Rock
Table 3.2. Descriptions of the activities observed in the Surf Coast activity survey.
Activity Description
(ROCK) WALKING Walking at steady pace across the reef, not slowing to observe, touching or moving anything.
COLLECTING Searching the reef and placing items in a container.
FOSSICKING
Reaching into rock pools or onto reef to pick things up to look at. Includes small children with buckets and nets, who were not obviously collecting.
EXPLORING Similar to fossicking – stopping to look at things, sometimes bending down for a closer look, but no attempt made to pick up items from reef.
STATIONARY
Sitting (picnicking, reading, minding children) or standing in the same spot for the sample period. Includes small children playing in sand.
SHORE FISHING Anglers on reefs.
SPEARFISHING
People snorkelling or diving while carrying a hand spear or spear gun, or people out of the water with this gear and with fish in a catch bag.
DIVE/SNORKEL People in the water snorkelling or scuba diving.
SWIM People in water at least up to their knees.
SURF People surfing, including boogie boards and body surfing.
KYACK, SURFSKI People in kyacks or on surf skis.
EDUCATION GROUP Primary, secondary or tertiary students being lead by 'instructors' on an excursion.
DOGS Dogs seen on the rocky shore
BOATS Number of boats observed nearshore
PEOPLE IN BOATS Number of people observed in boats nearshore
OTHER
All activities that don't fit into those above e.g. beach games, kite flying, rock stack climbing.
Season, day type and time of day may influence patterns of use of the coast and are of interest in terms of future management. The levels for each of these factors in this experimental design are given in Table 3.3. Two o’clock represented the mid-way point of the sampling day and only two levels for were used to simplify design. Sampling was randomised within a stratified design to cover all of these factors. The order in which locations were sampled was randomised by throwing a dice to select starting location and the order in which to survey locations.
Total number of people and the number of people involved in each activity for park and non-park locations were compared using ANOVA.

Parks Victoria Technical Series No.22 Surf Coast use
14
Table 3.3. Factors and levels used in the experimental design.
Factors Levels
Season Off peak: May–October
Peak: November–April
Day type Holiday week day
Holiday weekend
School term (State) week day
Term weekend
Time Before 2 pm
After 2 pm
3.3 Results
3.3.1 Rocky shore use – off peak (May to October)
Twelve observation periods were completed for each location with three each of term week, term weekend, holiday week and holiday weekend. All off peak tides surveyed were morning low tides and all observations were made before 2 pm, with most made before 12 noon. The weather was mainly cloudy or overcast and cool. Smooth seas with clean waves were typical of this time, with only the occasional messy or rough conditions. The few very rough days were not surveyed.
3.3.1.1 Relative use levels – off peak
The mean number of people per 5 minutes seen at each location is presented in Figure 3.1 and Table 3.4. Only one or two people were seen per 5 minutes on all shores, thus use of the rock platforms was low during this period.
Winki Pop was by far the most heavily used location for water based activities; mainly surfing. Nearshore (or sea) use values ranged from an average 11.25 people per 5 min at Winki Pop to zero at Eaglesnest. The maximum number seen at any location was 31 at Winki Pop on a day with ideal waves for surfing.
When both visits to rocky shores and nearshore use are combined, the highest use locations in descending order were Winki Pop, Southside, and Bird Rock – all popular surfing locations at this time fo the year. As most surfers walk across the intertidal reef flat to enter the water, Winki Pop reef receives the most foot traffic between May and October of all reefs in the survey. Only a very small part of the reef is used to access the waves at Southside (Barnes 2002).
In summary, reefs receiving the highest levels of foot traffic during off peak season were Winki Pop, Southside and Bird Rock. The lowest use locations were Eaglesnest, Point Addis and Eagle Rock Point.

Parks Victoria Technical Series No.22 Surf Coast use
15
Table 3.4. Means and standard errors (SE) for visitors to the rocky shores (rock) and nearshore (sea) use at each site during the off-peak period (n = 12) per 5 min period. R = rock, S = Sea.
Code Location Mean rock SE rock Mean sea
SE sea Mean R+S
SE R+S
WP Winki Pop 0.92 0.66 11.25 3.09 12.17 3.4
SS Southside 0.75 0.33 3.83 1.43 4.58 1.38
BR Bird rock 0.83 0.44 2.75 1.12 3.58 1.31
UB Urquharts Bluff
2.00 0.72 0.50 0.34 2.50 0.85
PD Point Danger 1.75 0.69 0.42 0.34 2.17 0.67
PR Point Roadknight
1.58 0.42 0.25 0.18 1.83 0.39
AE Aireys main 1.58 0.69 0.17 0.17 1.75 0.68
EN Eaglesnest 0.92 0.29 0 0 0.92 0.29
ER Eagle Rock Pt
0.50 0.34 0.08 0.08 0.58 0.40
PA Pt Addis 0.08 0.08 0.25 0.18 0.42 0.26
0
2
4
6
8
10
12
14
16
18
PD WP SS PA ER BR PR UB EN AE
Location
Figure 3.1. Mean number of people per 5 minutes using each of the rocky shores during off peak season.
Key: First five locations are now within Marine National Parks or Sanctuaries. PD = Pt Danger, WP = Winki Pop, SS = South side, PA = Pt Addis, ER = Eagle Rock, BR = Bird Rock, PR = Point Roadnight, UB = Urquharts Bluff, EN = Eagles nest and AE = Aireys main to Eagle Rock. N = 12.
Reefs within the marine protected areas were visited more than reefs outside the protected areas during off peak season. This difference is largely due to the popularity of Winki Pop and Southside reefs with surfers.
Parks Victoria Technical Series No.22 Surf Coast use
16
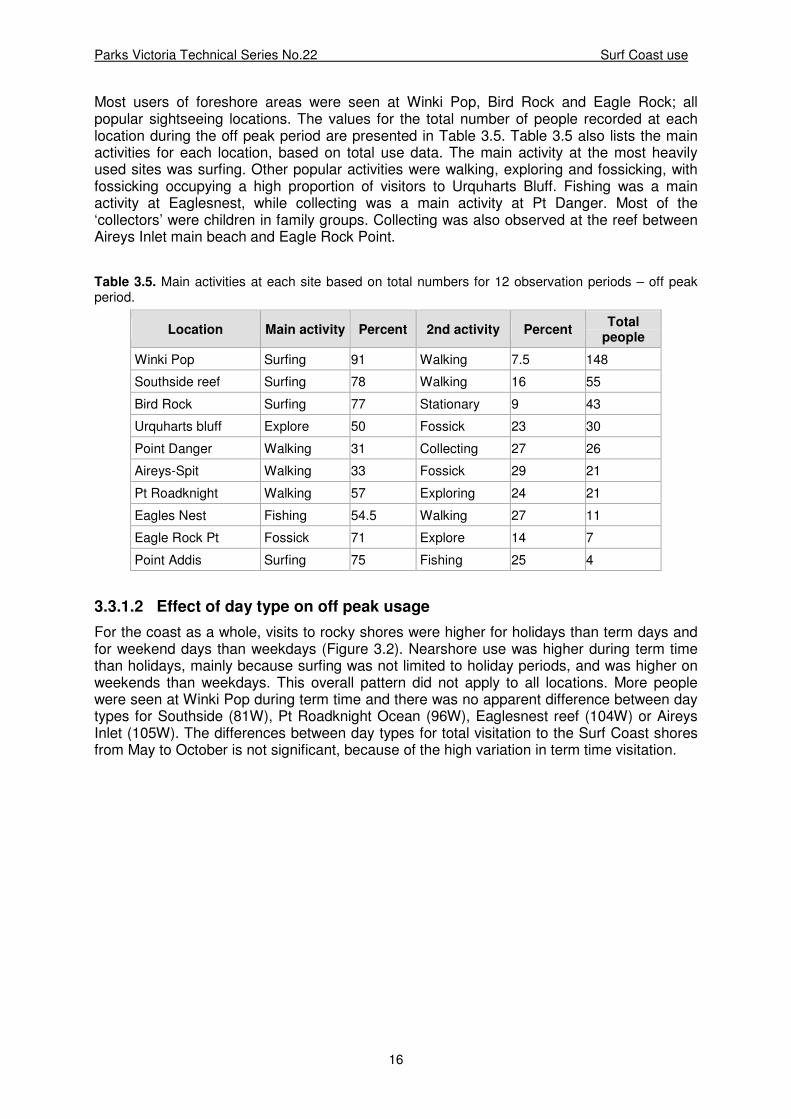
Most users of foreshore areas were seen at Winki Pop, Bird Rock and Eagle Rock; all popular sightseeing locations. The values for the total number of people recorded at each location during the off peak period are presented in Table 3.5. Table 3.5 also lists the main activities for each location, based on total use data. The main activity at the most heavily used sites was surfing. Other popular activities were walking, exploring and fossicking, with fossicking occupying a high proportion of visitors to Urquharts Bluff. Fishing was a main activity at Eaglesnest, while collecting was a main activity at Pt Danger. Most of the ‘collectors’ were children in family groups. Collecting was also observed at the reef between Aireys Inlet main beach and Eagle Rock Point.
Table 3.5. Main activities at each site based on total numbers for 12 observation periods – off peak period.
Location Main activity Percent 2nd activity Percent Total
people
Winki Pop Surfing 91 Walking 7.5 148
Southside reef Surfing 78 Walking 16 55
Bird Rock Surfing 77 Stationary 9 43
Urquharts bluff Explore 50 Fossick 23 30
Point Danger Walking 31 Collecting 27 26
Aireys-Spit Walking 33 Fossick 29 21
Pt Roadknight Walking 57 Exploring 24 21
Eagles Nest Fishing 54.5 Walking 27 11
Eagle Rock Pt Fossick 71 Explore 14 7
Point Addis Surfing 75 Fishing 25 4
3.3.1.2 Effect of day type on off peak usage
For the coast as a whole, visits to rocky shores were higher for holidays than term days and for weekend days than weekdays (Figure 3.2). Nearshore use was higher during term time than holidays, mainly because surfing was not limited to holiday periods, and was higher on weekends than weekdays. This overall pattern did not apply to all locations. More people were seen at Winki Pop during term time and there was no apparent difference between day types for Southside (81W), Pt Roadknight Ocean (96W), Eaglesnest reef (104W) or Aireys Inlet (105W). The differences between day types for total visitation to the Surf Coast shores from May to October is not significant, because of the high variation in term time visitation.

Parks Victoria Technical Series No.22 Surf Coast use
17
Figure 3.2. The effect of day type on usage patterns for reefs inside (first 5 locations) and outside the marine protected areas from May to October (off peak). Location abbreviations as per Table 2.1
HW = holiday week day, HWE =holiday weekend, TW = term week day, TWE = term weekend.
3.3.2 Rocky shore use – Peak period (November to April)
Weather during these months was mainly cloudy to overcast and mild to warm. Hot days were few. Seas were typically rippled to messy, with few days of clean swell for surfing.
The number of observation periods for each location (n) ranged from 19 to 22, as not all sites could be reached during low tide on high use days (car parking and traffic congestion problems).
3.3.2.1 Relative use levels – peak period
Only three of the locations averaged more than five people per five minutes on the rock platforms. These were Point Danger, Bird Rock and Urquharts Bluff. Locations with a low number of visits to the rocky shore (mean less than 2 per 5 mins) were Eagle Rock, Point Addis and Winki Pop Reef (Figure 3.3a). Three locations stand out as having high nearshore use compared to the others – Point Danger, Bird Rock, and Winki Pop. Kite surfers and snorkelers were the main users recorded at Pt Danger, and surfers at the other two (Figure 3.3b). Combining visits to the rocky shore and nearshore use, the highest use sites were Point Danger, Bird Rock, Winki Pop and Urquharts Bluff (Figure 3.3c). The lowest use site was Point Addis. Comparison of means for locations inside versus outside of the marine protected areas indicates that visits to the rocky shores are lower and nearshore use is higher inside the protected areas. Overall, there was no difference in visitor numbers between locations that are now included within MPAs and those which are not included within MPAs during peak season (Mean ± se inside = 5.4±1.3 vs outside = 5.7±1.8)

Parks Victoria Technical Series No.22 Surf Coast use
18
0
2
4
6
8
10
12
14
PD WP SS PA ER BR PR UB EN AE mpa non-
mpa
Location
a) Average number of people seen on the rocky shores.
01
23
456
78
910
PD WP SS PA ER BR PR UB EN AE mpa non-
mpa
Location
b) Average number of seen nearshore
0
2
4
6
8
10
12
14
16
18
PD WP SS PA ER BR PR UB EN AE mpa non-
mpa
Location
c) Average number of people seen on the rocky shore and nearshore
Figure 3.3. Mean numbers of visitors per five minute observation time during peak period.
(a) rock (intertidal) use; (b) water-based activities (nearshore); and, (c) rock plus nearshore use. The first five locations are now inside MPAs, and the remaining locations now outside MPAs. Location abbreviations are as per Table 2.1. ‘MPA’ refers to areas now included within MPAs.

Parks Victoria Technical Series No.22 Surf Coast use
19
Walking was the most often observed activity over all locations, and the main activity for four of the locations (Table 3.6). Dogs were seen on the rocky shores at all locations, mainly off lead, but in very low numbers. Exploring reefs was the next most popular activity after walking. This involved wandering over the reef and viewing rockpools, without making any attempt to bend over, get hands wet, or pick things up. Most viewers were seen at Pt Danger and Bird Rock but still in relatively low numbers (2-3 per 5 mins). Fossicking was most often observed at Pt Danger (3.5/5 min). Collecting and fishing were minor activities in terms of number of people involved during daylight hours (see section 3.3.5). People sitting or standing on reef were generally associated with surfers at Winki Pop and Southside, or with family/group members involved in other activities at the remaining locations. The main impact of usage on rocky shores would appear to be from the effects of foot traffic.
Table 3.6. Main activities for each location: peak period based on twelve observation periods at each site. Percent refers to percent of total people observed at the site. The first five locations (shaded) are now within MPAs.
Location Main activity Percent Second activity Percent Total number of people from 12 observations
Point Danger Fossick 29 Snorkel 29 143
Winki Pop Surfing 83 Walking 8 104
Southside reef Walking 31 Explore 26 38
Eagle Rock Pt Fossick 33 Snorkel 20 18
Point Addis Walking 47 Snorkel 20 18
Bird Rock Surfing 25 Explore 24 145
Urquharts bluff Walking 46 Explore 16 80
Pt Roadknight Exploring 31 Walking 28 43
Eagles Nest Walking 31 Fossick 25 38
Aireys-Spit Fossick 25 Walking 18 34
Surfing was again the most common water based activity, with the highest concentration of surfers within Bells Beach reserve (best waves year round). Swimmers, snorkelers and divers were not often seen nearshore of the rocky reefs, possibly because sea conditions are quite hazardous along this coastline.
By far the most common foreshore use for the rocky locations was sightseeing, with the most sightseers seen at Winki Pop (Bells Reserve), Bird Rock and Point Danger.
3.3.2.2 Maximum numbers for each location
Short term high intensity use could cause more disturbances to rocky shore biota than continuous low levels of use. One of the reasons is that high use episodes are usually on hot days when the low tide occurs during the day, thus compounding the damaging effect of heat stress on plants and animals (Porter 1999, Porter and Wescott, 2004). Even though the average values indicate fairly low use levels for most shores of the Shire, at times the number of people seen within 5 mins was quite high. Maxima of 55 for Bird Rock, 33 for Pt Danger and 30 for Urquharts Bluff were recorded. Maximum numbers for other locations were all below 20. Nearshore use maxima were over 20 at only two locations – Winki Pop (surfers), and Pt Danger (school group learning to snorkel). Both maxima and average numbers have been taken into account in deciding the use category (high, moderate or low) for each location (see Table 3.7).

Parks Victoria Technical Series No.22 Surf Coast use
20
Table 3.7. Use level categories based on mean number of visitors per 5 minute observation period and the maximum number seen during any one observation period for that location – including both rock and nearshore use - during peak period. High use = mean > 6 and maximum > 20; Moderate use = mean 2 – 6 and maximum 10 – 20; Low use = mean < 2 and maximum < 10.
High use Moderate use Low use
Point Danger Southside Point Addis
Bird Rock Pt Roadknight ocean Eagle Rock Point
Winki Pop Eaglesnest reef
Urquharts Bluff Aireys – Sandy Gully
3.3.2.3 Comparison of time categories (before 2pm vs after 2pm)
Generally more people were seen on rock platforms after 2pm than before. This was noticeably so at Urquharts Bluff and Bird Rock. An exception was on the rocky shore at Aireys Inlet main beach (Sandy Gully). More people were seen in the water mornings than afternoons, with surfers at Winki Pop the major contributor to this trend. Thus, overall, more people were seen after 2pm than before for all locations except Winki Pop, where surfers tended to favour morning waves.
3.3.2.4 Effect of day type on peak usage
The trends for usage based on our data indicate that visits to rocky shores were highest on holiday weekends at most locations. The exceptions were Bird Rock (term weekend), Pt Roadknight (term weekend) and Urquharts Bluff (term week day). Visits to rocky shores were generally lowest on term weekdays. Nearshore use was highest on holiday weekends for Bird Rock, Winki Pop, Point Addis and Eagle Rock. More people were seen in or on the water at Pt Danger on term weekends. When the numbers for visitors to the rocky shores and nearshore use are combined, the expectation of highest usage on holiday weekends was confirmed for all locations except for Pt Danger (highest use on term weekends), Bird Rock (high use for both term and holiday weekends) and Urquharts Bluff (high use on holiday week days) (Figure 3.4).
Parks Victoria Technical Series No.22 Surf Coast use
21
0.00
5.00
10.00
15.00
20.00
25.00
30.00
35.00
40.00
45.00
50.00
PD WP SS PA ER BR 96W UB EN EA
Location
Pe
op
le
hol w
hol we
term w
term we
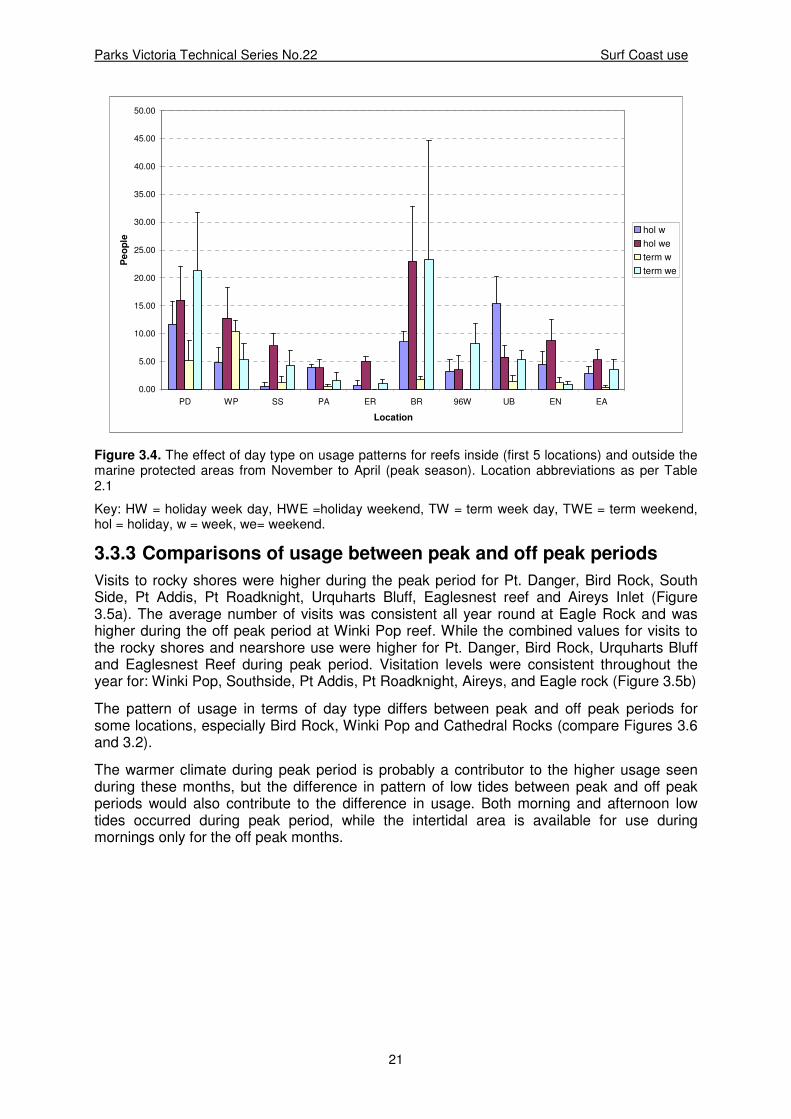
Figure 3.4. The effect of day type on usage patterns for reefs inside (first 5 locations) and outside the marine protected areas from November to April (peak season). Location abbreviations as per Table 2.1
Key: HW = holiday week day, HWE =holiday weekend, TW = term week day, TWE = term weekend, hol = holiday, w = week, we= weekend.
3.3.3 Comparisons of usage between peak and off peak periods
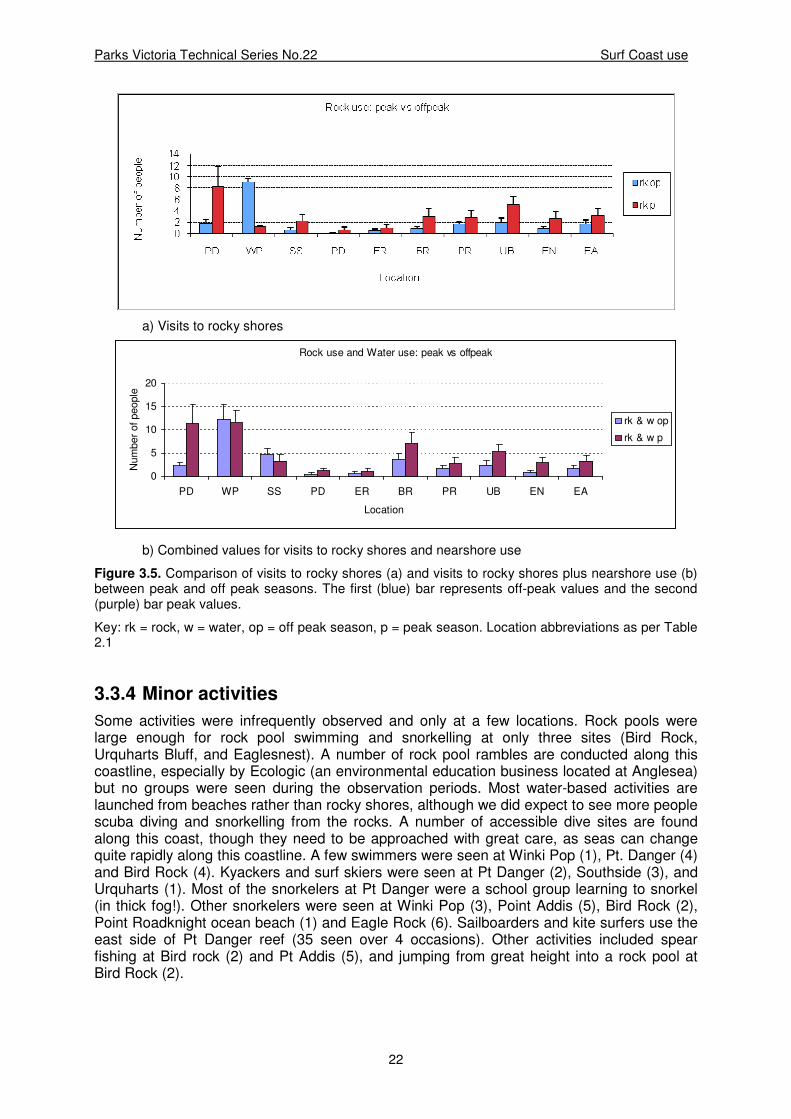
Visits to rocky shores were higher during the peak period for Pt. Danger, Bird Rock, South Side, Pt Addis, Pt Roadknight, Urquharts Bluff, Eaglesnest reef and Aireys Inlet (Figure 3.5a). The average number of visits was consistent all year round at Eagle Rock and was higher during the off peak period at Winki Pop reef. While the combined values for visits to the rocky shores and nearshore use were higher for Pt. Danger, Bird Rock, Urquharts Bluff and Eaglesnest Reef during peak period. Visitation levels were consistent throughout the year for: Winki Pop, Southside, Pt Addis, Pt Roadknight, Aireys, and Eagle rock (Figure 3.5b)
The pattern of usage in terms of day type differs between peak and off peak periods for some locations, especially Bird Rock, Winki Pop and Cathedral Rocks (compare Figures 3.6 and 3.2).
The warmer climate during peak period is probably a contributor to the higher usage seen during these months, but the difference in pattern of low tides between peak and off peak periods would also contribute to the difference in usage. Both morning and afternoon low tides occurred during peak period, while the intertidal area is available for use during mornings only for the off peak months.
Parks Victoria Technical Series No.22 Surf Coast use
22
a) Visits to rocky shores
Rock use and Water use: peak vs offpeak
0
5
10
15
20
PD WP SS PD ER BR PR UB EN EA
Location
Num
ber
of people
rk & w op
rk & w p
b) Combined values for visits to rocky shores and nearshore use
Figure 3.5. Comparison of visits to rocky shores (a) and visits to rocky shores plus nearshore use (b) between peak and off peak seasons. The first (blue) bar represents off-peak values and the second (purple) bar peak values.
Key: rk = rock, w = water, op = off peak season, p = peak season. Location abbreviations as per Table 2.1
3.3.4 Minor activities
Some activities were infrequently observed and only at a few locations. Rock pools were large enough for rock pool swimming and snorkelling at only three sites (Bird Rock, Urquharts Bluff, and Eaglesnest). A number of rock pool rambles are conducted along this coastline, especially by Ecologic (an environmental education business located at Anglesea) but no groups were seen during the observation periods. Most water-based activities are launched from beaches rather than rocky shores, although we did expect to see more people scuba diving and snorkelling from the rocks. A number of accessible dive sites are found along this coast, though they need to be approached with great care, as seas can change quite rapidly along this coastline. A few swimmers were seen at Winki Pop (1), Pt. Danger (4) and Bird Rock (4). Kyackers and surf skiers were seen at Pt Danger (2), Southside (3), and Urquharts (1). Most of the snorkelers at Pt Danger were a school group learning to snorkel (in thick fog!). Other snorkelers were seen at Winki Pop (3), Point Addis (5), Bird Rock (2), Point Roadknight ocean beach (1) and Eagle Rock (6). Sailboarders and kite surfers use the east side of Pt Danger reef (35 seen over 4 occasions). Other activities included spear fishing at Bird rock (2) and Pt Addis (5), and jumping from great height into a rock pool at Bird Rock (2).

Parks Victoria Technical Series No.22 Surf Coast use
23
3.3.5 Exploitative activities
3.3.5.1 Collecting
Pt Danger and the reef near Aireys Inlet main beach were the only locations where collecting was observed during the off peak months. Collectors were observed at more locations during peak season, with Point Danger, and the reef near Aireys main beach targeted most often and by more people. Many of the collectors were children or family groups collecting such items as empty shells and live crabs (of which there were many at Pt Danger). Adults appeared to be collecting shellfish from the sublittoral zone at Pt Addis, Pt Roadknight and Aireys Inlet (most likely Turbo undulatus). Collectors in mid and low shore zones at Urquharts were harvesting a range of molluscs. The nature of these surveys meant time was not available to approach collectors to view collections, but this would be a worthwhile addition to more localized surveys. The only time this was attempted collectors moved rapidly away. Locals have reported that shellfish collectors usually carry plastic bags for holding catches and that they drop them into rock pools or hide them in large pockets if other people approach too closely. This behaviour occurred even though collecting was not prohibited along this coastline at the time. (The western limit of the Victoria Shellfish protection Zone was Breamlea).
Collecting was not seen as often as had been initially expected. This could be because we were not observing during the main collecting tides. All anecdotal reports of collecting given to us by local residents were of groups collecting at dusk during the spring to autumn evening low tides. No surveying was undertaken after 8pm at night for safety reasons, thus data here is likely to under-represent real collecting pressure. Anecdotal reports of collecting were received for Pt Impossible (1 report), Pt Danger (3 reports), Steps (1 report), and Winki Pop (2 reports).
3.3.5.2 Fishing and spear fishing
Spear fishing was observed at only two locations; Bird rock (2) and Pt Addis (5).
Small boats were occasionally seen along this stretch of coastline close to shore. Four of the boats were engaged in commercial rock lobster harvesting (at Point Danger, Point Addis and Aireys Inlet — i.e. the then proposed and now proclaimed Marine National Parks and sanctuaries). These boats were not observed elsewhere along the coast. Recreational boat fishing sites were spread fairly evenly along the coastline. Very few people were observed fishing from the rocky shores, with most fishing from nearby beaches (especially the Point Addis Surf Beach).

Parks Victoria Technical Series No.22 Surf Coast use
24
4 HUMAN EFFECTS ON SANDSTONE SHORES OF THE SURF COAST
4.1 Introduction
Human activities that impact on rocky shores include harvesting, trampling, mechanical destruction, introduced organisms, pollution and oil spills.
Widespread concern has been expressed at the deleterious effects of harvesting and disturbance on the health and biodiversity of this intertidal ecosystem (e.g. Kingsford et al., 1991; Underwood 1993). In these earlier studies, foraging for animals and plants is so intensive on shores close to metropolitan areas that many have been virtually denuded. Destruction of habitat is also and issue, with removal of non-living materials (such as shells and rocks), damaging the habitat of many shore species. Destruction of habitat is more pronounced when implements such as hammers, chisels and crowbars are used (Underwood and Chapman 1995).
The number, extent and effect of introduced species on Victoria’s rocky shores has received little attention. Two introduced species with widespread distributions are the European shore crab Carcinus maenas and the green alga Cladophora rugosa.
Potential sources of pollution include two sewage outfalls (Black Rocks and Anglesea), run-off, stormwater and discharge from ships. The Black Rock Outfall discharges 1.2 km offshore, minimising the impact on intertidal biota (Ashton and Richardson 1995). The Anglesea outfall discharges within 500 meters of shore, although the discharge volume is relatively low (around 200 megalitres per annum). Pollutants that reach the shore from a runoff, storm water and ship discharge include plastics, organic material, high nutrient levels, pesticides, heavy metals, detergents, petrochemicals and oil. The extent and impacts of these materials on rocky shore biota have not been assessed in this study.
The ecological effects of harvesting and trampling have been extensively studied for rocky shores overseas (see reviews by Siegfried 1994; Castilla 1999) and at a few locations within Australia (e.g. Underwood and Kennelly 1990; Fairweather 1991; Keough et al., 1993; Keough & Quinn 1998; Porter 1999; Keough & Quinn 2000). The research presented here expands on the Australian studies by relating ecological variables to measured human activity patterns. Two impacts resulting from direct use of intertidal rocky shores were investigated: effects on gastropod populations and effects on the dominant plant cover Hormosira banksii. These parameters were chosen for several reasons: the previous studies have shown measureable effects resulting from human impacts, activities that impact on them have the potential to change mid-shore community dynamics and they are easily recognisable componenets of the intertidal biota – potentially being accessible for use in community-based monitoring programs.
4.1.1 Effects of collecting on gastropod populations
Much of the published research on harvesting of organisms from intertidal environments outside of Australia concerns the effects of subsistence harvesting for food (e.g. Castilla & Duran 1985; Duran & Castilla 1989; Hockey & Bosnan 1986), whereas much of the harvesting reported from Australian shores is recreational. Here, intertidal organisms are collected for food, bait, aquaria, and decorative use (Underwood & Kennelly 1990; Kingsford et al. 1991; Fairweather 1991; Underwood 1993). Organisms collected for food include abalone, octopus, whelks, sea urchins and grazing gastropods. Crabs, bivalves, limpets, green algae and cunjevoi are typically collected to use as bait (Underwood & Kennelly 1990; Kingsford et al. 1991; Fairweather 1991; Underwood 1993.) In this study, young children observed collecting tended to collect anything that moves (e.g. crabs and small fish) or stands out (e.g. sea stars, shells).

Parks Victoria Technical Series No.22 Surf Coast use
25
Harvesting pressure has the capacity to change the nature of intertidal communities (Castilla 1999). Direct effects of collecting include reductions in abundance and/or reductions in mean size (changes in size structure through collection of larger individuals) of populations (Keough et al. 1993; Keough & Quinn 2000). Indirect effects may occur as a result of effects on interactions between species. Removal of predators has been shown to result in an increased abundance of prey species and to indirectly affect algal abundance and food web dynamics (for example Castilla & Duran 1985; Godoy & Moreno 1989; Linberg et al. 1998). Removal of non-living materials, such as shells and rocks, destroys homes of many different creatures. Destruction of habitat is even more pronounced when implements such as hammers, chisels and crowbars are used.
Population parameters of selected gastropod species were compared for high and low use shores along the Surf Coast a few months before declaration of the Marine National Parks and Sanctuaries in November 2002. Some of the shores surveyed now lie within the new marine protected areas, thus the results provide useful baseline data for later assessment of protection effects.
4.1.2 Effects of trampling on Hormosira mats
The fucoid alga, Hormosira banksii (Neptune’s Necklace), is a key habitat forming plant of mid and low eulittoral zones on rocky shores in South West Victoria. Along the Surf Coast, it is typical of platform shores east of Cinema Point. Hormosira mats provide shelter for a range of organisms, including gastropods, small crustaceans, polychaete worms, small foliose algae and articulating coralline algae. Activities that impact on Hormosira cover have the potential to change mid-shore community dynamics.
Povey and Keough (1991) found that Hormosira banksii fronds are easily damaged, with as much as 20% of biomass of individual plants removed with one footstep. High levels of sustained trampling result in reduction in percent cover within Hormosira mats to the extent that cleared paths are formed.
Growth of Hormosira plants is relatively slow, meaning that recovery from damage will take more than one season. For example, a study on shores in southern New Zealand found that close to 2 years with no foot traffic are required for recovery to the initial amount of Hormosira cover after trample damage inflicted during one low tide (Sheil & Taylor 1999). Similarly, Keough and Quinn (1998) found that recovery of Hormosira was least in areas subject to higher intensities of trampling, with the potential for cumulative reduction in cover from year to year.
The relationship between human disturbance levels and Hormosira cover is complex, as many factors interact to influence cover. Timing of trampling can influence the extent of damage to Hormosira beds and the subsequent recovery of these areas (Shiel & Taylor 1999). In their study, areas trampled in autumn were slower to recover than those trampled in spring. Plants stressed by desiccation, storms and sand deposits may also be more vulnerable to trample damage. This variability in response to trample pressure complicates attempts to make comparisons across shores or interpret the state of Hormosira cover on any one shore.
The aim of this component of the project was to assess the effects of foot traffic on rocky shore organisms of the Surf Coast. We determined that Hormosira mats are the main community type likely to be detrimentally effected by foot traffic here. Other vulnerable assemblages — mussel beds, coralline algae mats and barnacles (Brosnan & Crumrine 1994) — are sparse on shores to the east of Cinema Point. Articulating corallines do form a dense cover at extreme low tide mark and in rock pools – both habitats rarely the focus of trampling pressure. Thus, cover of Hormosira banksii before and after the time of peak use was compared on several high and low use shores.
The only known study of pedestrian traffic for shores of the Surf Coast was conducted as part of the Surf Coast intertidal project. Barnes (2002) demonstrated variation in Hormosira
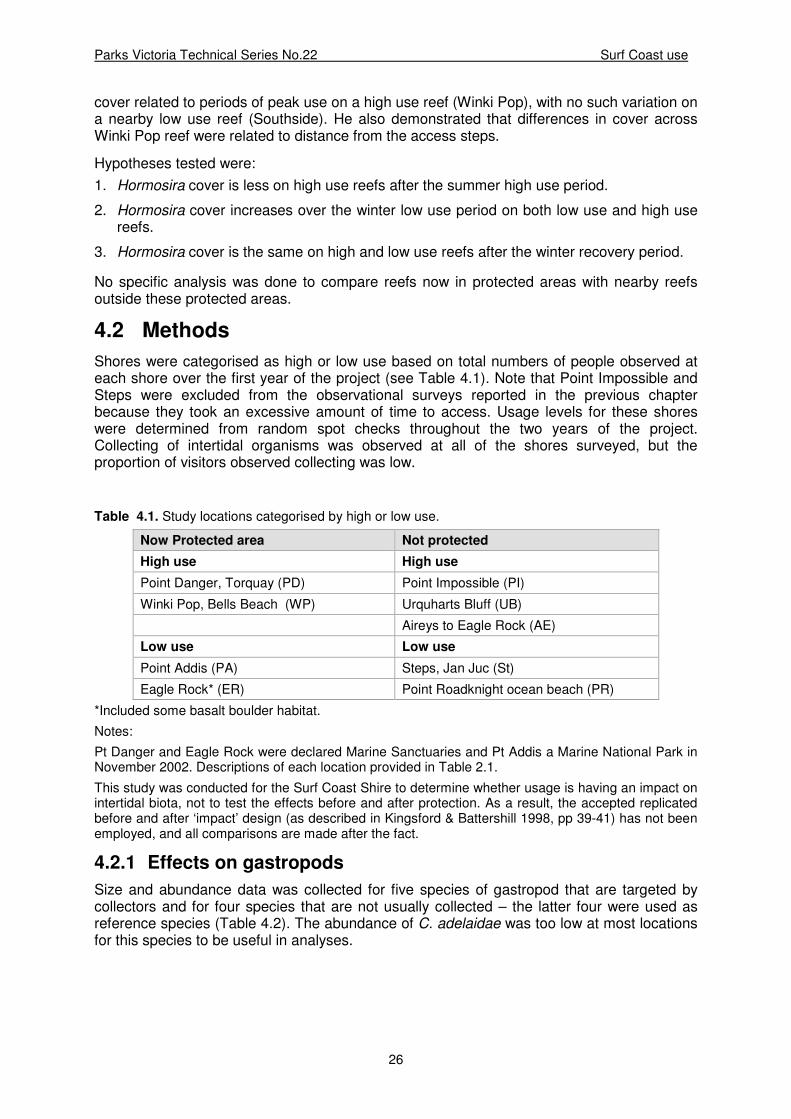
Parks Victoria Technical Series No.22 Surf Coast use
26
cover related to periods of peak use on a high use reef (Winki Pop), with no such variation on a nearby low use reef (Southside). He also demonstrated that differences in cover across Winki Pop reef were related to distance from the access steps.
Hypotheses tested were:
1. Hormosira cover is less on high use reefs after the summer high use period.
2. Hormosira cover increases over the winter low use period on both low use and high use reefs.
3. Hormosira cover is the same on high and low use reefs after the winter recovery period.
No specific analysis was done to compare reefs now in protected areas with nearby reefs outside these protected areas.
4.2 Methods
Shores were categorised as high or low use based on total numbers of people observed at each shore over the first year of the project (see Table 4.1). Note that Point Impossible and Steps were excluded from the observational surveys reported in the previous chapter because they took an excessive amount of time to access. Usage levels for these shores were determined from random spot checks throughout the two years of the project. Collecting of intertidal organisms was observed at all of the shores surveyed, but the proportion of visitors observed collecting was low.
Table 4.1. Study locations categorised by high or low use.
Now Protected area Not protected
High use High use
Point Danger, Torquay (PD) Point Impossible (PI)
Winki Pop, Bells Beach (WP) Urquharts Bluff (UB)
Aireys to Eagle Rock (AE)
Low use Low use
Point Addis (PA) Steps, Jan Juc (St)
Eagle Rock* (ER) Point Roadknight ocean beach (PR)
*Included some basalt boulder habitat.
Notes:
Pt Danger and Eagle Rock were declared Marine Sanctuaries and Pt Addis a Marine National Park in November 2002. Descriptions of each location provided in Table 2.1.
This study was conducted for the Surf Coast Shire to determine whether usage is having an impact on intertidal biota, not to test the effects before and after protection. As a result, the accepted replicated before and after ‘impact’ design (as described in Kingsford & Battershill 1998, pp 39-41) has not been employed, and all comparisons are made after the fact.
4.2.1 Effects on gastropods
Size and abundance data was collected for five species of gastropod that are targeted by collectors and for four species that are not usually collected – the latter four were used as reference species (Table 4.2). The abundance of C. adelaidae was too low at most locations for this species to be useful in analyses.
Parks Victoria Technical Series No.22 Surf Coast use
27
Table 4.2. Gastropod species for which population data was collected.
Target species Reference species
Cellana tramoserica (Limpet) Siphonaria diemenensis (False limpet)
Turbo undulatus (Turban shell) Bembicium nanum (Striped conniwink)
Austrocochlea constricta (Top shell) Cominella lineolata (Small whelk)
Dicathais orbita (Dog whelk) Austrocochlea adelaidea
Nerita atramentosa (Black nerite)
Size data for, Cellana tramoserica, Austrocochlea constricta, Siphonaria diemenensis and Bembicium nanum, was collected by measuring shall length of all adults found within randomly placed quadrats (0.25 m2). Measurements were to the nearest millimetre using vernier calipers. This process was repeated until measurements for 100 individuals of each species were recorded. For the remaining species, use of quadrats proved impractical because of the terrain in which the target species were usually found (under ledges, in rockpools and under boulders). For these species searches were made within suitable habitat from a random starting point, with all individuals located being measured. Some species were in such low abundances at some locations, that 100 individuals could not be found during one low tide period.
Abundance was estimated using time taken to find and touch 25 individuals (n = 4–6) within the habitat type that the particular species is normally found. To minimize the impact of our sampling, animals were not (usually) removed from where they were found. These values were converted to individuals collected per person per minute (catch per unit effort or CPUE) for analysis.
Data collection took place over 16 low tides in late summer/early autumn of 2002.
Size frequency histograms and box plots were used for initial data description. Most size frequency histograms were unimodal. Where this was not so, the smaller mode (size classes) were removed from analysis.
4.2.2 Effects on Hormosira
Hormosira banksii cover was assessed on four high use and three low use shores after the summer of 2001/2, and again before the summer 2002/3 (i.e. after the time of highest use and again after a recovery period). Two of the high use shores, Point Danger and Winki Pop, and one of the low use shores, Southside, are now within marine protected areas.
Two mid shore sites at least 100 m apart were selected on each shore – each site measured roughly 20m by 20m. On some shores, Bird Rock, Winki Pop, Southside & Point Roadknight, sites were labelled according to proximity to the access point. Data was collected from 15 randomly placed quadrats within each site. We used 0.24 m2 quadrat strung to give 99 intersecting points. During the “before summer 02” sampling season, rapidly advancing tides at several locations required technique modification to speed up data collection. The modification involved estimation of percent cover to the nearest 5%, rather than counting each intersecting point touching a Hormosira frond. Hence, all data was rounded to the nearest 5% for analysis.
Previous studies have shown that Hormosira frond length is a useful indicator of trample damage (Porter 1999; Arundel & Fairweather 2003). Thus the indicators of effect recorded were percent cover of Hormosira and percent of the quadrat with Hormosira fronds less than 50 mm long.

Parks Victoria Technical Series No.22 Surf Coast use
28
4.3 Results
4.3.1 Collecting effects on gastropods
4.3.1.1 Size comparisons – proposed MPA verses non-MPA locations
Analysis of variance results indicate no real differences in mean size for any of the species before protected areas were declared between locations that are now within these protected and those that are not (ANOVA ‘p values’ ranged from 0.15 to 0.92). However, some locations stood out as quite different from the rest for some species (Figure 4.1a & b). The Turbo undulatus population mean size was largest at Point Roadknight and smallest at Winki Pop. Similarly, the Dicathais orbita population mean size was larger at Steps than at the other locations. Large individuals of Austrocochlea constricta were found in abundance at Winki Pop only. However, a high proportion of these animals had tall shells indicative of parasitic impotence.
4.3.1.2 Size comparisons – high verses low use shores
Populations of gastropod species considered at risk from collecting pressure have a smaller mean size on high use shores than on low use shores. Mean size was significantly smaller (p<0.1) on high use shores for Turbo undulatus, Austrocochlea constricta, and Dicathais orbita (Figure 4.2). This pattern is reflected when the individual location size graphs in Figure 4.1 are compared with respect to usage level for each shore. For example, high use shores, Winki Pop, Aireys to Eagle Rock and Urquharts Bluff, have smaller individuals of Turbo undulatus than do the other shores.
The effect of usage showed some variation for species considered at low risk from collecting pressure:
• Bembicium nanum and Cominella lineolata: showed no difference in size between high and low use reefs (p = 0.356 & 0.053 respectively).
• Siphonaria diemenensis were significantly larger on high use reefs (p < 0.1).
In summary, a negative effect of human use on mean size of “target” species has been detected for Surf Coast shores.

Parks Victoria Technical Series No. 22 Surf Coast Use
29
a)
Cellana tramoserica.
0
5
10
15
20
25
30
35
40
PD WP PA ER PI UB AE St PR
Location .
Austrocochlea constricta.
0
2
4
6
8
10
12
14
16
18
PD WP PA ER PI UB AE St PR
Location .
Turbo undulatus
0
5
10
15
20
25
30
35
PD WP PA ER PI UB AE St PR
Location .
Dicathais orbita .
0
10
20
30
40
50
60
PD WP PA ER PI UB AE St PR
Location .
Figure 4.1 (a). Mean size ± se of gastropods often harvested. Location code key as per Table 4.1.

Parks Victoria Technical Series No. 22 Surf Coast Use
30
b)
Siphonaria diemenensis .
0
1
2
3
4
5
6
7
8
9
10
PD WP PA ER PI UB AE St PR
Location .
0
2
4
6
8
10
12
PD WP PA ER PI UB AE St PR
Location .
Bembicium nanum
Chlorodiloma adelaidae
0
2
4
6
8
10
12
14
16
18
PD WP PA ER PI UB AE St PR
Location .
Cominella lineolata
0
5
10
15
20
25
30
PD WP PA ER PI UB AE St PR
Location .
Figure 4.1 (b). Mean size± se of gastropods not normally collected. First four locations in each graph now in MPAs.

Parks Victoria Technical Series No. 22 Surf Coast Use
31
Figure 4.2. Mean size (± se) for each species with locations grouped according to usage level, based on data for all shores investigated.

Parks Victoria Technical Series No. 22 Surf Coast Use
32
4.3.1.3 Abundance comparisons
Abundances of most species showed high variation between replicate counts both within and between locations. For some species this variability was too high for valid statistical comparisons. Mean CPUE values for each species and location are presented in Figures 4.3a–g. Observations on abundances for each species are:
Turbo undulatus: The average number found per minute was an order of magnitude higher for Point Roadknight ocean reef (80±8) than for any other location surveyed (Figure 4.3a). Abundances ranged from CPUEs of 1–9 per minute for the other locations. We were unable to find 100 individuals of Turbo undulatus at six of the nine locations, equally distributed between high and low use shores (as indicated in Table 4.3a). This suggests population numbers are low — a possible indicator of over-harvesting. Large individuals (>40mm) were uncommon at all locations except the Point Roadknight ocean reef. Abundances were no different between park and non-park locations (Point Roadknight excluded from analysis).
Table 4.3. Abundance and size data for Turbo undulatus. Locations now within MPA’s are bolded.
Low use Median size (mm)
% > 40mm Found 100
Low use
Eagle Rock (ER)
PRK ocean (PR)
Pt Addis (PA)
Steps (BWs)
24
30
23
20
0
26
5
3
No (42)
Yes
No (95)
No (74)
High use
Aireys to Eagle Rock (AE)
Urquharts Bluff (UB)
Point Danger (PD)
Point Impossible (PI)
Winki Pop (WP)
16
14
22
26
15
2
0
1
1
17
No (52)
No (23)
Yes
Yes
No (54)
Cellana tramoserica: The abundance of Cellana tramoserica appears higher at locations that are now in protected areas than at the nearby shores (Figure 4.3b), but the difference is not significant.
Austrocochlea constricta: Abundances of this species were significantly higher at locations that are now within the MPAs (Figure 4.3c; p = 0.02). We found 100 individuals at all low use sites but at only 3 of 5 high use sites (Table 4.4).
Dicathais orbita: This species was usually found at low tide mark, as well as mid shore on those shores with substantial mussel beds (see Table 4.5). The mid-shore animals were always smaller than those found lower on the shore. This species was most abundant at Pt Danger, occurring in mid to upper shore mussel beds. However, a deep layer of sand subsequently inundated this habitat, removing most of the animals. No individuals of this species were found on the Point Roadknight ocean reef, even though the habitat appears suitable (see Figure 4.3d).

Parks Victoria Technical Series No. 22 Surf Coast Use
33
Table 4.4 Abundance and size data for Austrocochlea constricta. Locations now in MPA’s are bolded.
Low use Median size (mm)
% > 20mm Found 100
Eagle Rock (ER)
PRK ocean (PR)
Pt Addis (PA)
Steps (BWs)
14
16
14
14
0
5
4
1
Yes
Yes
Yes
Yes
High use
Aireys to Eagle Rock (AE)
Urquharts Bluff (UB)
Point Danger (PD)
Point Impossible (PI)
Winki Pop (WP)
13
11
12
13
17
0
0
0
1
23
No (52)
Yes
Yes
No (80)
Yes
Table 4.5: Abundance and size data for Dicathais orbita. Locations now in protected areas bolded. Asterisk indicates locations where most of individuals found midshore in mussel patches.
Low use Median size (mm)
Large
% > 50mm
Found 100
Eagle Rock (ER)
PRK ocean (PR)
Pt Addis (PA)
Steps (BWs)
48
NA
47
58
40
NA
38
70
No (52)
No (0)
No (26)
No (35)
High use
Aireys to Eagle Rock (AE)
Urquharts Bluff (UB)
Point Danger (PD)
Point Impossible (PI)
Winki Pop (WP)
33
29
30
27
29
2
0
2
25
25
No (84)*
Yes*
Yes*
No (29)
No (56)
Nerita atramentosa: This species was uncommon on sandstone shore. Individuals were found in isolated pockets at Winki Pop, Steps and Point Impossible. The species is amongst basalt boulders at Eagle Rock Point and on mudstone shores to the west of Aireys Inlet.
Siphonaria diemenensis: A significant difference in abundance was found between high and low use levels. This species was most abundant on the high use shore, Sandy Gully (Figure 4.3e). None were found at Pt Roadknigh, where its niche was occupied by Patelloida alticostata.
Bembicium nanum: No difference in abundance was found between high and low use locations. The very low abundance at Pt Impossible (high use) and Pt Addis (low use) are probably unrelated to use levels (Figure 4.3f).
Cominella lineolata: Cominella is a scavenger and was more abundant on shores with large areas of rock rubble habitat – a habitat that appears to accumulate debris (Figure 4.3g).
Chlorodiloma adelaidae: This species was abundant at Point Danger only, hidden amongst rubble and under stones.
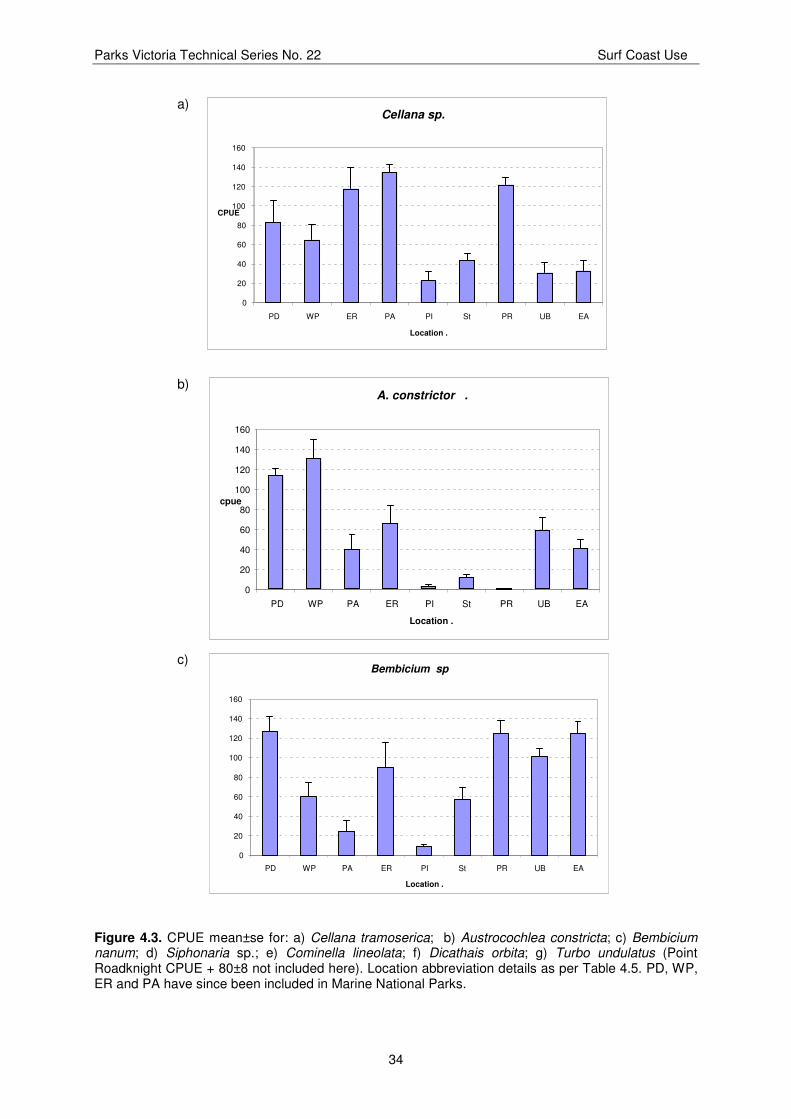
Parks Victoria Technical Series No. 22 Surf Coast Use
34
a)
b)
c)
Bembicium sp.
0
20
40
60
80
100
120
140
160
PD WP PA ER PI St PR UB EA
Location .
Figure 4.3. CPUE mean±se for: a) Cellana tramoserica; b) Austrocochlea constricta; c) Bembicium nanum; d) Siphonaria sp.; e) Cominella lineolata; f) Dicathais orbita; g) Turbo undulatus (Point Roadknight CPUE + 80±8 not included here). Location abbreviation details as per Table 4.5. PD, WP, ER and PA have since been included in Marine National Parks.
Cellana sp.
0
20
40
60
80
100
120
140
160
PD WP ER PA PI St PR UB EA Location .
CPUE
A. constrictor .
0
20
40
60
80
100
120
140
160
PD WP PA ER PI St PR UB EA
Location .
cpue
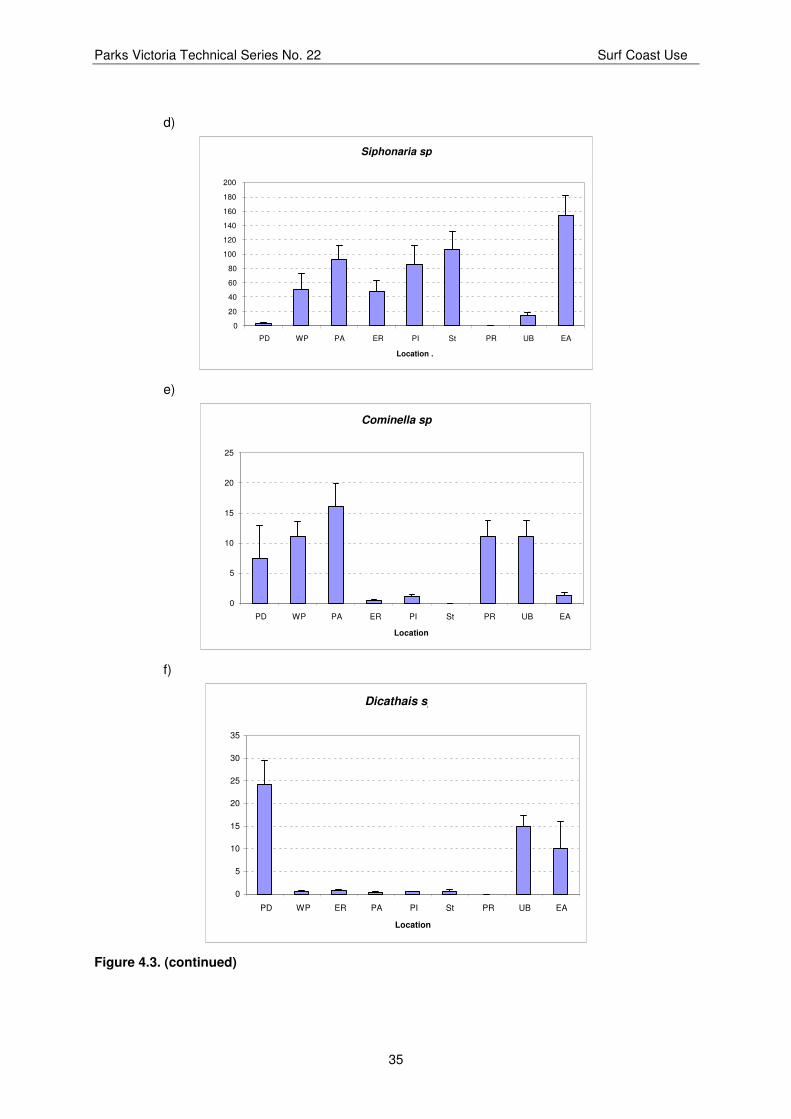
Parks Victoria Technical Series No. 22 Surf Coast Use
35
d)
Siphonaria sp.
0
20
40
60
80
100
120
140
160
180
200
PD WP PA ER PI St PR UB EA
Location .
e)
Cominella sp .
0
5
10
15
20
25
PD WP PA ER PI St PR UB EA
Location .
f)
Dicathais sp.
0
5
10
15
20
25
30
35
PD WP ER PA PI St PR UB EA
Location .
Figure 4.3. (continued)

Parks Victoria Technical Series No. 22 Surf Coast Use
36
g)
Turbo sp.
0
2
4
6
8
10
12
PD WP PA ER PI St UB EA
Location .
Figure 4.3. (continued)
4.3.2 Trample effects on Hormosira
4.3.2.1 Percent cover
The percent cover of Hormosira was higher in spring than in autumn in all the low use sites, but cover decreased or remained the same in three of the eight high use sites (Figure 4.4). ANOVA results (sites pooled) indicate that the difference in autumn cover between high and low use shores is not significant (p = 0.24). By spring, all low use sites had more than 80% cover, while only three of the high use sites had achieved these levels. Differences in spring cover values between low and high use shores were significant, with a higher percent cover found on low use reefs. This result suggests that some growth has occurred over winter, but high use locations have not reached cover values found on low use shores.
The overall increase in cover was higher on low use reefs (cover increased on average by 19% v 13% for high use reefs).
At Winki Pop, and Southside, the site furthest from the access point (b) had greater cover than the site closest to the access (a).

Parks Victoria Technical Series No. 22 Surf Coast Use
37
Hormosira mats
0
20
40
60
80
100
120
PIa PIb BRa BRb PDa PDb WPa WPb Sta Stb PRa PRb SSa SSb
Shore
Pe
rce
nt
co
ve
r
autumn
spring
Hormosira mats
0
20
40
60
80
100
120
PIa PIb BRa BRb PDa PDb WPa WPb Sta Stb PRa PRb SSa SSb
Shore
Pe
rce
nt
co
ve
r
autumn
spring
Figure 4.4. Percent cover in Hormosira mats autumn and spring. PI to WP high use shores. St to SS low use. PD, WP and SS now in MPAs.
Key: (a) Furthest site from the access. (b) Site closest to access.
4.3.2.2 Percent of quadrat with fronds less than 50mm
Significant differences in frond length were found between low and high use shores for both autumn and spring measurements. Low use shores have less proportion of quadrat cover as short fronds in both seasons. A lower proportion of small fronds would be expected in spring if recovery from summer trampling has occurred over winter. This evidence of recovery was seen for all low use sites but for only half of the high use sites (Figure 4.5)
Only one site, Southside b (SSb), had less than 20% cover of small fronds in autumn. This was one of the lowest use sites surveyed (and was over 300m from the access point). In spring, another low use site, Steps (St), also had a low proportion of plants with fronds less than 50mm.

Parks Victoria Technical Series No. 22 Surf Coast Use
38
Hormosira fronds
0
10
20
30
40
50
60
70
80
90
100
PIa PIb BRa BRb PDa PDb WPa WPb Sta Stb PRa PRb SSa SSb
Shore
% <
50
mm
autumn
spring
Hormosira fronds
0
10
20
30
40
50
60
70
80
90
100
PIa PIb BRa BRb PDa PDb WPa WPb Sta Stb PRa PRb SSa SSb
Shore
% <
50
mm
autumn
spring
Figure 4.5. Percent of Hormosira fronds less than 50 mm long, autumn and spring. Smaller values indicate healthier plant cover.
Key: (a) Furthest site from the access. (b) Site closest to access. Location abbreviation details as per Table 4.1. PI to WP high use shores. St to SS low use. PD, WP and SS now in MPAs.
Three physical factors in particular are likely to influence extent of H. banksii cover. These are extremes of temperature, wave energy and sand scouring. The summer of 2001/2002 was quite mild with no days hot enough to cause burning of intertidal algae. In contrast one hot day (35 ºC) in late November 2002 was sufficient to cause significant burn damage to H. banksii fronds. The extent of damage varied from shore to shore. As many as 80% of the fronds were burnt on both Point Impossible (PI) reefs, with plants low on the shore being most affected. The proportion of burnt fronds was closer to 20% for the remaining shores. The exception was Southside Reef, where few plants appear to have been affected. Several storm events, with exceptionally large waves for this coastline occurred during the winter of 2002. Waves as high as 4m, compared to the average of 1-2m, were reported for some shores (e.g. Winki Pop). These events may have compounded the effect of foot traffic, particularly on high use shores.

Parks Victoria Technical Series No. 22 Surf Coast Use
39
5 DISCUSSION
5.1 Biophysical values
The shores within proposed MPAs of the Surf Coast are predominantly sandstone reefs, either as wave cut platforms or eroded reef flats. The dominant assemblage type in terms of extent of coverage is Hormosira mats. The shores are representative of all shores within the study area in both habitat structure and species assemblages. They differ from surrounding shores in that species richness is generally higher and they contain a higher proportion of locally uncommon species. Our results on invertebrate species richness support the findings of Handreck and O’Hara (1994), in that Pt Addis, Pt Danger and Eagle Rock Point have higher species richness than do nearby reefs. Reefs to the west of Point Impossible were also identified here as having a species rich intertidal flora and fauna.
5.2 Recreational use
The surveys of human usage have identified reef walking, exploring rock pools and fossicking as major uses of rocky shores within the Surf Coast. The observed incidence of collecting was low. The result is consistent with observations for another Victorian open coast location (Porter & Wescott 2004) and much lower than reported for shores closer to metropolitan areas (Keough et al. 1993; Underwood 1993). However, local residents reported large scale collecting for food and bait for some locations, usually during low tides around dusk. Thus, trampling, general disturbance and collecting effects are the main impacts likely on shores within the study area.
Visitation to the Surf Coast is highly seasonal, with a peak of activity during summer. Winki Pop at Bells Beach was the only reef to experience high use levels between May and October. Low tides that expose a large intertidal area occur during the day in Summer and Autumn, while much of the rocky intertidal is not exposed during daytime in winter. The implications are that highest visitor numbers coincide with times of increased physiological stress for intertidal organisms (e.g. desiccation), but that there are several months of ‘recovery time’ each year from the effects of human activity.
Just one day of very high use during summer may be sufficient to cause long-term damage to the dominant plant cover of reefs (Schiel & Taylor 1999). For the Surf Coast, shores where more than 20 people per 200 metres in a 5 minute period are recorded on any one day are at highest risk of this impact occurring.
Overall usage levels for reefs inside compared to outside the proposed MPAs were similar immediately before the MPAs were declared. The results presented in this report provide useful baseline data against which to compare usage levels and activities pursued post-reservation.
5.3 Impacts of selected uses
Levels of usage are high enough on some shores of the Surf Coast to be impacting on shellfish populations and dominant plant cover. The mean size of targeted gastropod species was lower on high use shore. Plant cover reduced on some high use shores over the winter period, while it increased on low use shores. The results reported here suggest that the combination of collecting and trampling are changing community composition of these high use shores.

Parks Victoria Technical Series No. 22 Surf Coast Use
40
5.3.1 Collecting
Mean size was smaller for populations of three of the four collected species on high use shores compared to low use shores. Species that are not usually collected did not show the same trend. Locations now within MPAs were no different to those now outside the MPAs pre-reservation. Collecting of intertidal biota is not allowed in the new MPA areas and an expectation is that mean size for populations of previously collected species will increase and be greater than those outside the protected areas in time, as has happened elsewhere (e.g. Branch & Odenhaal 2003). While several years of pre-reservation data would have been better, results of this study still provide useful baseline data for on going monitoring of protection effects on gastropod populations.
Abundance data proved far less reliable for determining differences between shore types because of high variability in the data, partly because of patchy distribution of species on each shore. However, protection effect studies elsewhere have revealed huge increases in abundance of some exploited species, of a magnitude high enough to make within shore variation insignificant (e.g. Edgar & Barrett 1999). Thus, this pre-reservation data will again provide a useful baseline for post-reservation monitoring.
Removal of some species, particularly predators such as whelks, may result in changes to community structure on rocky shores (Castilla & Duran 1985; Fairweather 1990). The dog whelk, Dicathais orbita, found on Surf Coast shores predates on mussels, barnacles and turban shells. Abundance of this whelk was low for most shores surveyed, with most found on shores with extensive mussel beds; all high use shores. The mean size for this species was greater on low use shores. Interpretation of these results is difficult as whelks found amongst mid-shore mussel beds were usually smaller than those found in the low shore and shallow sublittoral zones. Further investigation is required here to compare abundances and size of low shore whelks across shores. The reasons for low abundance and even absence of whelks on most shores, also merits further investigation to determine whether harvesting is the cause.
The turban shell, Turbo undulates, is perhaps one of the most commonly collected food species on southern shores and individuals were observed collecting this species from several Surf Coast shores. Collecting effort and usage levels are not necessarily correlated, thus it is not surprising that the huge differences in abundances between shores were not related to use levels. The mean size for this species was higher on the low use shores, however.
5.3.2 Trampling
Hormosira mats are the dominant plant cover of mid to low shore for rocky shores in this region. These mats have been identified as important habitat formers (Keough and Quinn 1998). Degradation of Hormosira mats is likely to change the nature of rocky shore communities.
Hormosira cover was at its highest in Spring for the shores surveyed in this study. Low use shores all had a higher percent cover and less proportion of short fronds than did high use shores at this time. This difference was not so apparent after the peak summer use period, suggesting that low use shores recover better over winter.
Hormosira mats recover from trampling damage by regrowth of remaining plants and by recruitment. Hormosira plant growth rate is about 30 mm a year. Recovery by recruitment is dependent on some Hormosira plants and/or sub-canopy coralline algae remaining, as Hormosira spores are less likely to settle and survive on bare rock. Thus recovery is slow and dependent on a number of factors including extent of damage, presence of grazing gastropods and frequency of natural disturbance events.
Generally, the greater the amount of foot traffic the greater the loss of Hormosira cover and the longer the time required for recovery. Recovery to pre-trample levels from a single

Parks Victoria Technical Series No. 22 Surf Coast Use
41
episode of high intensity trampling can take as long as two years (Schiel & Taylor 1999). The extent of damage and the time taken to recover from prolonged periods of trampling may vary across shores (Keough & Quinn 1998).
Invasion of recently cleared space by grazing gastropods was reported by Keough and Quinn (1998) for sites at Point Nepean. The gastropods tend to maintain cleared spaces once they have been formed. This response was not apparent in our study. Instead, reduction in Hormosira was associated with an increase in cover of turf forming algae such as, Gelidium pusillum; a response also noted for trampled areas on rocky shores in England and North America (Brosnan & Crumrine 1994; Fletcher & Frid 1996). This response could be a result of reduction in intertidal shellfish populations on the Surf Coast through collecting, whereas Point Nepean has been protected from collecting for some time. Invasion by gastropods was not observed on shores in southern New Zealand, where grazer abundances are naturally low (Schiel & Taylor 1999).
The impacts of foot traffic are likely to be greater on shores that have recently experienced other forms of physical stress, particularly heat stress (Keough & Quinn 1998).

Parks Victoria Technical Series No. 22 Surf Coast Use
42
6 CONCLUSIONS AND MANAGEMENT IMPLICATIONS
6.1 Conclusions
6.1.1 Natural values
• 23% of the rocky shores between Thompson Creek and Fairhaven are now included within MPAs.
• The shores within MPAs are predominantly sandstone, with some basalt boulders at two sites.
• The average shore length within MPAs (0.43 km). The average length of nearby shores (0.79 km).
• Most shores are 60 – 90 m wide at low tide.
• All MPA locations are backed by cliffs.
• Apart from cliff top housing at Eagle rock, built structures are limited to access steps, viewing platforms and foreshore carparks.
• By far the dominant shore type is platform reef.
• The main habitat types present were platform reef, eroded platform, rock slabs and boulders.
• Hormosira mats are the typical dominant cover of the sandstone platform reefs. On three high use reefs (Yellow Bluff, Bird Rock, and Aireys to Eagle Rock) these mats are replaced by algal turf. Small mussels cover large areas on some reefs around Urquharts Bluff and Aireys Inlet.
• All biological assemblage types found in the region were presented at both MPA and other shore locations.
• Forty three plant, thirty four mollusc and thirty non-molluscan invertebrate taxa were recorded from six MPA sites.
• All of the taxa found along this coastline are common intertidal species for Victorian shores.
• Regionally uncommon taxa were found in all three MPAs, with eleven at Pt Danger, nine at Point Addis and four at Eagle Rock Point.
• Most MPA sites have high Species Richness Index values for gastropod and plant species.
• The correlation between gastropod and overall SRI’s was high, meaning this taxonomic group can serve as a useful surrogate for overall species richness.
• With the exception of Eagle Rock Point, the shores included in this study had similar species composition before the MPAs were declared, providing a useful baseline for future monitoring.
6.1.2 Recreational use
During the off peak period from May to October, inclusive:
• All tides low enough to expose reef occurred in the morning.

Parks Victoria Technical Series No. 22 Surf Coast Use
43
• Only one or two people were seen per 5 minutes on any of the shore, thus use of the rock platforms was low during this period.
• Nearshore use values ranged from an average 11.25 people per 5 min at Winki Pop to zero at Eaglesnest.
• The maximum number seen at any of the ocations was 31 at Winki Pop on a day with ideal waves for surfing.
• Reefs receiving the highest levels of foot traffic are Winki Pop, Southside and Bird Rock.
• The lowest use locations were Eaglesnest, Point Addis and Eagle Rock Point.
• Reefs within the marine protected areas were visited more than reefs outside the protected areas, largely due to the popularity of Winki Pop and Southside reefs with surfers.
• The main activity at the most heavily used sites was surfing. Other popular activities were walking, exploring and fossicking. Fishing was a main activity at Eaglesnest, while collecting was a main activity at Pt Danger.
• Visits to rocky shores were higher during holiday days than term days, and for weekend days than week days. Nearshore use was higher during term time than holidays.
During peak season from November to April, inclusive:
• More than 5 people per 5 minutes were seen on the rock platforms at Point Danger, Bird Rock and Urquharts Bluff.
• Three locations with high nearshore use were Point Danger, Bird Rock, and Winki Pop.
• The highest use sites were Point Danger, Bird Rock, Winki Pop and Urquharts Bluff.
• The lowest use site was Point Addis.
• Rock use is lower and nearshore use is higher inside outside the protected areas. Overall, there was no difference in visitor numbers between inside and outside the protected areas during peak season (Mean ± se inside = 5.4±1.3; outside = 5.7±1.8).
• Most popular rock based activities were reef walking, exploring and fossicking.
• Surfing was the most common water based activity. Swimmers, snorkellers and divers were not often seen nearshore of the rocky reefs.
• Maxima of 33 people for Pt Danger and 30 for Urquharts Bluff were recorded. Maximum numbers for other locations were all below 20.
• Generally, more people were seen on rock platforms after 2pm than before this time.
• Visits to rocky shores were highest on holiday weekends and lowest of term weekdays at most locations.
• Collecting of intertidal biota was either observed first hand or reported to the researchers for all shores within the study area.
• Spearfishing was observed at only two locations; Bird rock and Pt Addis.
• Recreational boat fishing sites were spread fairly evenly along the coastline. Very few people were seen fishing from the rocky shores, with most people fishing from nearby beaches (especially at Pt Addis).

Parks Victoria Technical Series No. 22 Surf Coast Use
44
6.1.3 Impacts of collecting and trampling
• Mean size for populations of gastropod species was the same for locations that are now protected and those that are not before the marine protected areas were declared.
• Populations of gastropod species at risk from collecting pressure have a smaller mean size on high use shores than on low use shores. Mean size was significantly smaller on high use shores for Turbo undulatus, Austrocochlea constricta, and Dicathais orbita.
• Abundances of gastropod species showed huge variation both within and between sites, so conclusions about the effect of usage were not possible. Two targeted species, Turbo undulatus and Dicathais orbita, were scarce on most shores surveyed.
• Harvesting pressure appears to be impacting on populations of some gastropod species, but further testing is required to confirm this observation.
• The effect of trampling on Hormosira mats was tested by comparing high and low use shores after the summer peak of coastal usage and again after the low use winter season.
• Percent cover of Hormosira was no different between use levels after summer, but was higher after winter for the low use sites.
• The proportion of cover with short fronds was higher for high use sites than for low use sites at both sample periods.
• Foot traffic is impacting on plant cover, and hence community structure, of high use shores on the surf coast. Two of these shores, Pt Danger and Winki Pop reef, are now located within MPAs.
6.1.4 Management issues
The two highest use reefs, Point Danger and Winki Pop are now located within MPAs. The results of this study highlight the need for controls on visitor numbers to protect reefs in the parks.
• Disturbance to biota from reef walking and fossicking is an issue for Pt Danger. Many of those observed fossicking and collecting at Pt Danger were small children in family groups. An on site educational program may help to address this issue.
• The high levels of use year round at Winki Pop may require a management response. Impacts of trampling across reef appear to be localised (Barnes 2002), but regular monitoring of use levels and plant cover is recommended. Surfers could also be encouraged to stick to well-established entry and exit points via a map and/or sign on the main access.
• The lowest use reef in this study was the one at Pt Addis. This reef is likely to represent the most natural intertidal environment in this region. We recommend that management actions be implemented to maintain this status.
Previous studies have shown that protected areas are not necessarily free from exploitative activities (Murray 1999; Keough & Quinn 2000; Porter & Wescott 2004). Active management, in the form of education programs, enforcement presence and even construction of a physical barrier, is required.
The direct approach to reduce damage to intertidal biota from trampling damage would be to close whole shores or parts of shores to the public. Closures may be permanent, e.g. to create scientific reference areas, or temporary to allow time for recovery. Temporary reef closure can be anything from a few days on and immediately after hot days, when plants are most vulnerable to damage, up to two years to allow for full recovery of plant cover.

Parks Victoria Technical Series No. 22 Surf Coast Use
45
The suggestion of completely closing shores may meet with public resistance, requiring indirect approaches to minimise impacts from recreational use. These include education programs, signage, and reduced access to some shores by removing car parks and access tracks. The public safety issue of dangerous cliffs could be exploited to the benefit of intertidal communities for some shores.
Routine monitoring of use levels and impacts should be implemented as an integral part of adaptive management for the MPAs.
6.1.5 Possible measures of ecological health
6.1.5.1 Recreational use
Regular assessment of use levels and activity patterns will provide managers with vital information on changes in usage patterns over time. Comparison with pre-reservation use levels and activities will, in itself, be of value in determining public response to establishing the protected areas. Furthermore, data on use levels and activity patterns can be used to inform management decisions, particularly with regards to known impacts of high use levels on rocky shores. Carrying capacity for the rocky shores was not assessed in this study. Each shore is likely to differ in resilience to human impact and hence have a different carrying capacity, particularly with regards to dominant plant cover (Keough & Quinn 1998). However, this study suggests that average use levels higher than 5 people in 5 minutes and peaks of use greater than 20 people per 5 minutes on a 200 m section of shore will result in detrimental impacts to intertidal biota on many shores.
The methodology used in this study is rapid, can be used to cover a number of shores within one low tide period and provides comparative data across a number of shores and between seasons. Volunteers trialled the protocol as part of the Surf Coast project. Two short training sessions were sufficient to bring most volunteers up to speed with the data requirements and methodology. Data recorded at associated pilot sessions was consistent and accurate across all volunteers.
6.1.6 Impacts of use and effects of MPA establishment
6.1.6.1 Species assemblage composition and species richness.
Gastropod species richness index correlates highly with the SRI for all species (correlation coefficient of 0.93). This may be a useful surrogate measure, with changes to either assemblage composition or richness of molluscan fauna likely to reflect changes in overall species composition and richness for the shore.
While surrogate measures are likely to be sufficient for routine monitoring, periodic quantitative sampling for all species present is recommended. Species composition data is important to collect as species richness indices by themselves are of limited value in picking up changes to community structure — indices don’t show where vulnerable species have been replaced by exotic invaders, for example.
Annual assessment of gastropod species richness, as well as surveys to record relative abundance of all species present about every 5 years is recommended, using a stratified random quadrat sampling approach as per Parks Victoria’s intertidal reef monitoring protocol (Hart and Edmunds, 2005).
6.1.6.2 Impacts of collecting
While a number of intertidal animals and plants are collected, gastropods are the most amenable for use as an indicator of collecting pressure. Abundances are generally sufficient for enough individuals to be found on each shore to allow for valid comparisons. Size is also relatively easy to measure. Recommend annual assessment of population parameters (size and abundance) for Turbo undulatus and Dicathais orbita, in particular.
Parks Victoria Technical Series No. 22 Surf Coast Use
46
6.1.6.3 Impacts of foot traffic
Because of the critical role Hormosira mats plays in structuring rocky shore communities on the Surf Coast, Hormosira cover is a key indicator that should be assessed when monitoring for human effects.
Monitoring of Hormosira cover will be required on all shores that remain open to human access, as each shore is likely to respond differently to trampling and disturbance impacts (Keough & Quinn 1998).
Percent cover measures by themselves are not always a true reflection of damage to plant cover (Porter 1999). Trampling affects the length of fronds – and this is probably a better indicator of damage. This conclusion is supported by the results of Arundel and Fairweather (2003). A combination of both measures is recommended here, as frond length by itself gives no indication of the extent of plant cover.
Recommend before and after summer assessment of Hormosira mat cover on all shores, using both percent cover and frond length measures.
6.2 Management implications
6.2.1 Management issues and options
• Disturbance to biota from reef walking and fossicking is an issue for Pt Danger. Many of those observed fossicking and collecting at Pt Danger were small children in family groups. On site educational programs are an option to consider.
• The high levels of use year round at Winki Pop may require a management response. Regular monitoring of use levels and plant cover is an option to consider. Surfers could also be encouraged to stick to well-established entry and exit points via a map and/or sign on the main access.
• The lowest use reef in this study was the one at Pt Addis. This reef is likely to represent the most natural intertidal environment in this region. Implementations of management actions that maintain this status are an option to consider.
6.2.2 Options for monitoring
• Monitoring of use levels and activity periods during peak season, using the methods employed in this study.
• Annual assessment of gastropod species richness to detect protection effects on diversity.
• Before and after summer assessment of Hormosira mat cover on all shores, using both percent cover and frond length measures.
• Annual assessment of population parameters (size and abundance) for Turbo undulatus, Dicathais orbita and Austrocochlea constricta.
• Repeat surveys to record relative abundance of all species present every 5 years using a stratified random quadrat sampling approach.

Parks Victoria Technical Series No. 22 Surf Coast Use
47
ACKNOWLEDGMENTS
The Surf Coast Intertidal project was conducted by Deakin University for the Surf Coast Shire and funded through an Australian Research Council Industry Partnership grant to Associate Professor Geoff Wescott and Dr Peter Fairweather (now Professor of Marine Biology, Flinders University). Helen Arundel assisted with data analysis and Matthew Barnes, Sam Pollard, Travis Lee and Rod Watson helped with field work. Special thanks to all the volunteers who collected recreational use data, trialling the methods developed here in the process. Editing provided by Illonna Evans.

Parks Victoria Technical Series No. 22 Surf Coast Use
48
REFERENCES
Arundel, H. & Fairweather, P. (2003) South-west intertidal habitat assessment and education project. Warrnambool, Deakin University.
Ashton, P.H. & Richardson, B.J. (1995) Biological monitoring of the marine ocean outfall at black rock, Victoria, Australia. Marine Pollution Bulletin 31, 334-340.
Barnes, M. (2002) Effects of pedestrian traffic on rocky intertidal algal beds within the Bells beach Surfing and Recreation Reserve. Geelong, Deakin University.
Bennett, I. & Pope, E. (1953) Intertidal zonation of the exposed rocky shores of Victoria, together with a rearrangement of the biogeographical provinces of temperate Australian shores. Australian Journal of Marine and Freshwater Research 4, 105-159.
Bird, E. (1993) The Coast of Victoria: the shaping of scenery. Melbourne, Melbourne University Press.
Blayney, C. & Wescott, G. (2004) Protecting Marine Parks in Reality: the role of regional and local communication programs. Australasian Journal of Environmental Management: 11 (2): 126-128.
Branch, G. & Odendaal, F. (2003) The effects of marine protected areas on the population dynamics of a South African limpet, Cymbula oculus, relative to the influence of wave action. Biological Conservation 114, 255-269.
Brosnan, D. & Crumrine, L. (1994) Effects of human trampling on marine rocky shore communities. Journal of Experimental Marine Biology and Ecology 177(1), 79-97.
Castilla, J. (1999). Coastal marine communities: trends and perspectives from human exclusion experiments. Trends in Ecology and Evolution 14, 280-283.
Castilla, J. & Duran, L. (1985) Human exclusion from the rocky intertidal zone of central Chile: the effects on Concholepas concholepas (Gastropoda). Oikos 45, 391-399.
Duran, L. & Castilla, J. (1989) Variation and persistance of the middle rocky intertidal community of central Chile, with and without human harvesting. Marine Biology 103, 555-562.
Environment Conservation Council (2000) Marine, Coastal and Estuarine Investigation: Final Report. Environment Conservation Council, Melbourne, Australia. (Available at http://www.nre.vic.gov.au/ecc/index.htm)
Edgar, G. & Barrett, N. (1999) Effects of declaration of marine reserves on Tasmanian reef fishes, invertebrates and plants. Journal of Experimental Marine Biology and Ecology. 242(1), 107-144.
Fairweather, P.G. (1990) Is predation capable of interacting with other community processes on rocky reefs? Australian Journal of Ecology 15, 453-465.
Fairweather, P.G. (1991) A conceptual framework for ecological studies of coastal resources: an example of a tunicate collected for bait on Australian seashores. Ocean and Shoreline Management 15, 125-142.
Fletcher, H. & Frid, C.L.J. (1996) Impact and management of visitor pressure on rocky intertidal algal communities. Aquatic Conservation: Marine and Freshwater Ecosystems, 6(4), 287-297.
Galloway, D. (2009) Six years on: Public perceptions of the Implementation of Victoria’s Marine Protected Area System. Unpublished B. Env Sci. (Honours) thesis, School of Life and Environmental Sciences, Deakin University, Australia.

Parks Victoria Technical Series No. 22 Surf Coast Use
49
Godoy, C. & Moreno, C.A. (1989) Indirect effects of human exclusion from the rocky intertidal in southern Chile: a case of cross-linkage between herbivores. Oikos 54, 101-106.
Handreck, C. & O'Hara, T. (1994) Occurrence of selected species of intertidal and shallow subtidal invertebrates at Victorian locations. A report by the Marine Research Group of Victoria to the Land Conservation Council.
Hart, S.P. & Edmunds. M. (2005) Parks Victoria Standard Operating Procedure: Biological Monitoring of Intertidal Reefs. Parks Victoria Technical Series No. 21. Parks Victoria, Melbourne.
Harvey, N. & Caton, B. (2003) Coastal Management in Australia. Oxford University Press. Melbourne.
Hockey, P.A.R. & Bosman, A.L. (1986) Man as an intertidal predator in Transkei: disturbance, community convergence and the management of a natural food resource. Oikos 46, 3-14.
Keough, M.J., Quinn, G.P. & King, A. (1993) Correlations between human collecting and intertidal mollusc populations on rocky shores. Conservation Biology 7(2), 378-390.
Keough, M.J. & Quinn, G.P. (2000) Legislative vs. practical protection of an intertidal shoreline in southeastern Australia. Ecological Applications 10(3), 871-881.
Keough, M. & Quinn, GP (1998) Effects of periodic disturbances from trampling on rocky intertidal algal beds. Ecological Applications 8(1), 141-161.
Kingsford, M. & Battershill, C. (1999) Studying temperate marine environments: A handbook for ecologists. Canterbury University Press, New Zealand.
Kingsford, M.J., Underwood, A.J. & Kennelly, S.J (1991) Humans as predators on rocky reefs in New South Wales, Australia. Marine Ecology Progress Series 72, 1-14.
Lasiak, T. (1998). Multivariate comparisons of rocky infratidal macrofaunal assemblages from replicate exploited and non-exploited localities on the Transkei coast of South Africa. Marine Ecology Progress Series 167, 15-23.
Lazarow, N., Souter, R. Fearon, R. and Dovers, S. (Eds.) (2006) Coastal management in Australia. Key institutional and governance issues for coastal natural resource management
and planning. CRC for Coastal Zone, Estuary and Waterway Management. Brisbane.
Lindberg, D.R., Estes, J.A. & Warheit, K.I. (1998) Human influences on trophic cascades along rocky shores. Ecological Applications 8(3), 880-890.
Marine Research Group Of Victoria (1984) Coastal Invertebrates of Victoria. Marine Research Group of Victoria and the Museum of Victoria, Melbourne.
Murray, S.N., Denis, T.G., Kido, J.S. & Smith J.R. (1999) Human visitation and the frequency and potential effects of collecting on rocky intertidal populations in southern California marine reserves, California Cooperative Oceanic Fisheries Investigations Reports. 100-106.
Porter, C. (1999) Evaluation of the effectiveness of Marine Protected Areas in temperate waters of Australasia. PhD thesis, Deakin University, Geelong.
Porter, C. & Wescott, G. (2004) Recreational use of a Marine Protected Area: Point Lonsdale, Victoria. Australian Journal of Environmental Management September, in press.
Povey, A. & Keough, M.J. (1991) Effects of trampling on plant and animal populations on rocky shores. Oikos 61, 355-368.
Schiel, D. & Taylor, D.I. (1999) Effects of trampling on a rocky intertidal algal assemblage in southern New Zealand. Journal of Experimental Marine Biology and Ecology 235(2), 213-235.

Parks Victoria Technical Series No. 22 Surf Coast Use
50
Siegfried, W. (1994) Rocky shores: exploitation in Chile and South Africa. Berlin, Germany, Springer Verlag.
Thom, B.G. & Harvey, N. (2000) Trigger for Late Twentieth Century Reform of Australian Coastal Management. Australian Geographical Studies, 38(3): 275-290.
Traill, B. & Porter, C. (2001) Nature Conservation Review Victoria 2001. Melbourne, Victorian National Parks Association.
Underwood, A.J. (1993) Exploitation of species on the rocky coast of New South Wales (Australia) and options for its management. Ocean and Coastal Management 20, 41-62.
Underwood, A.J. & Chapman, M.G. (1995) Coastal Marine Ecology of Temperate Australia. University of New South Wales Press, Sydney.
Underwood, A.J. & Kennelly, S.J. (1990) Pilot studies for designs of surveys of human disturbance of intertidal habitats in New South Wales. Australian Journal of Marine and Freshwater Research 41, 165-173.
Wescott, G. (2006) The long and winding road: the development of a comprehensive, adequate and representative system of highly protected marine protected areas in Victoria, Australia. Ocean and Coastal Management. 49 (12): 905-922.
Wescott, G. (2009) Stimulating Vertical integration In Coastal Management in a federated nation: the case of Australian Coastal Policy reform. Coastal Management. 37, 1-13.
Wescott, G & Fitzsimons, J. (2008) Progress and Challenges in Establishing a Comprehensive, Adequate and Representative System of MPAs in Australia. In: Australian Protected Areas Congress 2008 Proceedings pp. 173-175.

Parks Victoria Technical Series No. 22 Surf Coast Use
A1.1
APPENDIX 1
A1. Field Data Surveys
A1.1. Surf coast inventory checklist
Site name: Access number: Date/ time of visit:
Low tide time & height: Conditions:
GEOMORPHOLOGY (description for whole shore unit)
Main substrate type: Hard Soft Both
Foreshore: Cliffs
Height
Dunes
Height
Other:
What?
Along-shore extent of this type: km
Along-shore extent of site km
Nearest headlands Km East Km West
Nearshore Hard Soft Both
Offshore:
Height/extent
Reef/boulders Sand bars Islands
Distance to river/ estuary mouth km
Name: Open Closed
General description/comments:

Parks Victoria Technical Series No. 22 Surf Coast Use
A1.2
A1.2. Management issues
Adjacent land use zoning scheme category:
Adjacent land use (observed): Housing - rural Urban Carpark Road
Farmland Reserve
Foreshore use Buildings Boat ramp
Carpark Access tracks Reserve
Foreshore classification Recreation Conservation
Foreshore Dunes
Cliffs
Other
Bare
Bare
Bare
Part vegetation
Part vegetation
Part vegetation
Dense vegetation
Dense vegetation
Dense vegetation
Distance to nearest town km Name: Population
Nearest town pop. > 10,000 km
Name: Population
Distance to Great Ocean Road km
Nearest road km
Road name:
Sealed?
Type of access point:
e.g. steps, trail.
Distance from road/car park:
Dist. from nearest access point:
GPS coordinates:
Distance from harbour
Distance from boat ramp
Accessibility from sea?
km
km
No Low Med High
Name harbour
Groynes or similar present Yes
No
Describe:
Signs of erosion? Sand burial?
Nearest sewage outfall
Distance (E or W): km
Nearest industrial outfall
Distance (E or W):
km
Storm water drain(s) present?
Drains from: urban agricultural bush land?
Signs of pollution: Sewage Storm water Animal waste Industrial Oil
Describe:
Litter present? What? Likely source?
Management authority
Management: Rubbish/ Recycle bins
Fencing Patrols Beach cleaning Signage
Comments and evidence of other activities (e.g., extraction, collecting, fishing, dogs, horses):

Parks Victoria Technical Series No. 22 Surf Coast Use
A1.3
A1.3. Hard shores
SITE: DATE:
Rock type: Sandstone/ calcarenite
Limestone Basalt Mud/silt stone
Other (describe):
Shore width: m < 30 m 30-100 m > 100m
Shore slope: Low Mid Upper
Habitat types and most abundant taxa associated
Low Mid Upper Notes
Platform:
Stacks:
Vertical faces:
Boulder fields:
Cobble:
Crevices:
Caves/overhangs:
Rockpools
Depth:
Size :
Sand:
Wrack:
Other:
“Community” types based on “dominant “organisms (ALSO SEE TRANSECT DATA)
Type Relative abundance Habitat associations Associated species
Lichen/ Littorines
Barnacles
Tube worms
Bare/grazers
Hormosira mats
Gelidium turf
Mussel beds
Coralline turf
Filamentous algal turf
Ulvoids
Algal pools
Cunjevoi
Mixed algae
Bull kelp fringe
Other (name)
Birds, special features, additional comments:

Parks Victoria Technical Series No. 22 Surf Coast Use
A1.4
A1.4. Rocky shore transects
Site name and access number:
Shore width at low tide:
Shore slope: upper mid low
Distance from access point: GPS co-ords:
Date: Time: Low tide time/height:
Transect number:
Dist. (m)
Substrate type
Habitat type Most abundant species
Associated species
Additional notes:

Parks Victoria Technical Series No. 22
A2.1
APPENDIX 2
A2. Locations surveyed
Transect lines are shown in pale blue. SC Codes are listed in Table 2.1.
SC Code 1 and 2: Point Impossible and Point Impossible West (respectively).
SC Code 5: Yellow Bluff
Point Impossible
Torquay
Pt Impossible West

Parks Victoria Technical Series No. 22
A2.2
SC Code 7: Point Danger.
SC Code 11: Bird Rock to Winkipop.
Bells Beach
Jan Juc
Steps –Bird Rock to Winki Pop

Parks Victoria Technical Series No. 22
A2.3
SC Code 14: Southside reef.
SC Code 17: Point Addis.

Parks Victoria Technical Series No. 22
A2.4
SC Code 25: Point Roadknight Ocean.
SC Code 28: Urquharts Bluff.

Parks Victoria Technical Series No. 22
A2.5
SC Code 31: Eagles Nest Reef.
SC Code 33: Aireys to Eagle Rock Beach.
Aireys Inlet Aireys to Eagle Rock
Aireys Inlet
Eagles Nest
Eagle Rock Beach to Spit Point
Aireys to Eagle Rock Beach
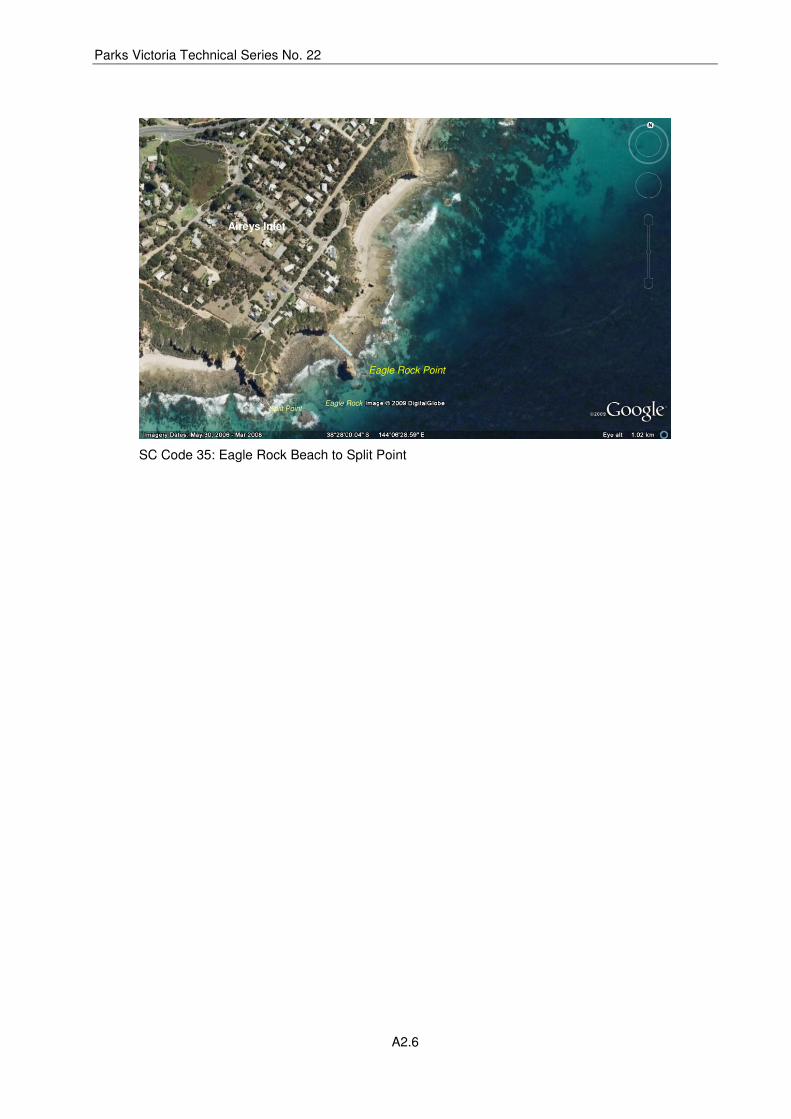
Parks Victoria Technical Series No. 22
A2.6
SC Code 35: Eagle Rock Beach to Split Point
Aireys Inlet
Split Point Eagle Rock
Eagle Rock Point

Parks Victoria Technical Series No. 22 Surf Coast Use
A3.1
APPENDIX 3
A3. Location details
Code Location name Abbrev. Length km Access points
Sites % Sand % near access
Main foreshore Watercourse
1 Point Impossible
PI 0.30 3 3 10 - 30 % > 75% cliffs/bluffs Thompson Creek
2 Point Impossible west IW 0.70 1 3 31 - 50 % < 25% dunes NA
5 Yellow Bluff YB 0.40 2 1 31 - 50 % 50-75% cliffs/bluffs NA
7 Point Danger PD 0.50 3 3 10 - 30 % 50-75% cliffs/bluffs NA
11 Bird Rock to Winkipop (sites Bird Rock and Steps(
BR
St 2.20 2 2 < 10 % < 25% cliffs/bluffs NA
12 Winkipop Reef WP 0.40 1 1 < 10 % 25-50% cliffs/bluffs NA
14 Southside Reef SS 0.45 2 2 < 10 % < 25% cliffs/bluffs NA
17 Point Addis PA 0.80 1 3 10 - 30 % < 25% cliffs/bluffs NA
25 Point Roadknight Ocean PR 0.50 1 3 < 10 % < 25% dunes NA
28 Urquharts Bluff UB 0.40 1 1 51 - 70 % 50-75% cliffs/bluffs NA
29 Urquharts to Sunnymead US 1.10 0 2 10 - 30 % < 25% cliffs/bluffs NA
31 Eagles Nest Reef EN 1.20 2 2 < 10 % < 25% cliffs/bluffs NA
33 Aireys to Eagle Rock B. AE 0.30 1 1 < 10 % < 25% cliffs/bluffs NA
35 Eagle Rock Point ER 0.50 0 2 < 10 % < 25% cliffs/bluffs NA
Key: ‘Access’ refers to the number of access tracks or points into the location from the road or cliff tops.’ % near access’ is an estimate of the proportion of the shore within 50 m of an access point and is used as a measure of accessibility by the general public. The access steps to Bird Rock were closed soon after this study due to unstable cliffs and rock fall. Locations now within marine protected areas are highlighted.

Parks Victoria Technical Series No. 22 Surf Coast Use
A4.1
APPENDIX 4
A4. Rocky shore features
Features of rocky shores within the Surf Coast Shire intertidal zone. Shores now in Marine Protected Areas are highlighted.
Location Rock type Shore width* Slope- midshore Main habitat Main assemblage
Point Impossible Calcarenite/sandstone 91 - 120 M shallow large slabs Hormosira mats
Point Impossible, west Calcarenite/sandstone > 120 M flat platform Hormosira mats
Yellow Bluff Sandy limestone 91 - 120 M shallow eroded platform Algal turf
Point Danger Sandy limestone >120 M Flat Eroded platform Grazer/deposit
Rocky Point Sandy limestone 31 - 60 M shallow platform Hormosira/turf
Bird Rock Sandy limestone 61 - 90 M shallow platform Algal turf
Steps Sandy limestone 61 - 90 M flat platform Hormosira mats
Winki Pop Sandy limestone 61 - 90 M flat platform Hormosira mats
Southside Reef Sandy limestone 61 - 90 M flat large slabs Hormosira mats
Point Addis Sandy limestone > 120 M flat eroded platform Hormosira mats
Black Rocks Basalt 0 - 30 M up and down boulders Encrusting animals
Soapy Rocks other 31 - 60 M up and down bedrock Mussels
Point Roadknight Ocean Calcarenite/sandstone 61 - 90 M flat platform Bare rock/grazers
Urquharts Bluff Sandstone > 120 M flat platform Mussels
Urquharts to 104W, site 1 Mosaic 91 - 120 M flat platform Mussels
Urquharts to 104W, site 2 Mosaic 61 - 90 M flat platform Hormosira mats
Eagles Nest, site 1 Mosaic 61 - 90 M flat platform Mussels
Eagles Nest, site 2 Mosaic 31 - 60 M flat platform Hormosira mats
Aireys to Eagle Rk Mudstone/sandstone 61 - 90 M flat platform Algal turf
Eagle Rock Point, site 1 Sandstone 31 - 60 M flat platform Hormosira
Eagle Rock Point , site 2 Basalt/sandstone 61 - 90 M inclined boulders Grazer/deposit
*Based on transect length

Parks Victoria Technical Series No. 22 Surf Coast Use
A5.2
APPENDIX 5
A5. Habitat types present
Habitat types
Location/Site
Upper shore bedrock platform
Reef rubble
Vertical surfaces ledges stacks crevices boulders pools cobbles sand other
Pt Impossible 1 1 1 1 1 1 1 1 1 1
Pt Impossible 2 1 1 1 1 1
Pt Impossible 3 1 1 1 1 1 1
Impossible West 1 1 1 1 1 1
Impossible West 2 1 1 1 1 1 1
Impossible west 3 1 1 1 1
Yellow Bluff 1 1 1 1 1 1 1 1
Yellow Bluff 2 1 1 1 1 1 1 1 1
Yellow Bluff 3 1 1 1 1 1 1 1 1
Point Danger 1 1 1 1 1 1 1
Point Danger 2 1 1 1 1 1 1
Point Danger 3 1 1 1 1 1 1 1
Bird Rock 2 1 1 1 1 1 1
Steps 2 1 1 1 1 1 1 1
Winki Pop 1 1 1 1 1 1 1 1
Winki Pop 2 1 1 1 1
Southside Reef 1 1 1 1
Southside Reef 2 1 1 1 1
Southside Reef 3 1 1 1 1 1 1 1

Parks Victoria Technical Series No. 22 Surf Coast Use
A5.3
A5. (continued)
Habitats present
Location/site
bedrock
platform Reef rubble
Vertical surfaces ledges stacks crevices boulders pools cobbles
sand other
Point Addis 1
1
1 1 1 1 1
Point Addis 2 1 1 1 1 1 1 1 1
Point Addis 3 1 1 1
Point Roadknight 1 1 1 1 1 1
Point Roadknight 2 1 1
Point Roadknight 3 1 1 1 1
Urquats Bluff 2 1 1 1 1 1 1
Urquats to Sunnymead 1
1 1 1 1 1 1 1 1
Urquats to Sunnymead 3
1 1 1 1 1 1 1
Eagles Nest 1 1 1 1 1 1
Eagles Nest 3 1 1 1 1 1 1 1
Aireys to Eaglerock 1 1 1 1 1 1
Eagle Rock 1 1 1 1 1 1 1
Eagle Rock 2 1 1 1 1 1
Note:
Each location has from 1 to 3 sites. Site data is based on one transect from top to bottom of shore at low tide
1 = present; blank cell = absent

Parks Victoria Technical Series No. 22 Surf Coast Use
A6.1
APPENDIX 6
A6. Assemblage types
Assemblage name Code Comment
Bull kelp fringe bk Durvillaea potatorum
Low mixed algae mla Foliose algae at low tide level; mainly Cystophera and Caulerpa species
Cunjevoi cj Pyura stolonifera
Gelidium turf gt
Coralline turf ct Foliose coralline algae such as Corallina sp.
Algal turf other ato Filamenous, turf forming algae – mainly Rhodophyta, but occasionally Ectocarpus (Phaeophyta)
Dicathais/Turbo D/t Occurrance of these species in low shore
Hormosira mats H Hormosira banksii appears to cover more than 15% of site
Mussel beds mb Usually a mixture of Austomytilus rostratus and Xenostobus pulex
Algal pools ap
Barnacles bar Occurring as distinct patches
Galeolaria gal As above
Skuzz sk Thin grey green spongy mat – may contain blue-green algae
Ulvoids ulv Enteromorpha and Ulva species
Grazers/bare rock g/b Limpets and other grazing gastropods
Grazers/deposit feeders g/d Species assemblage which includes echinoderms and molluscs often found in association with rubble and cobbles.
Siphonaria zealandia sz Found in high numbers on sand affected shores
Littorinids lit Nodilittorina spp., Lichinia and Bembicium nanum; upper shore
Amphibolis amp Seagrass found in pools and sublittoral fringe on open coast
Note: “Assemblage” types recognized in visual assessments.

Parks Victoria Technical Series No. 22 Surf Coast Use
A7.1
APPENDIX 7
A7. Ecological assemblages per site 1= present
Ecological Assemblage
Locations bk mla cj ato gt ct D/t H mb ap bar gal sk ulv g/b g/d sz lit amp
pi 1 1 1 1 1 1
pi 1 1 1 1 1 1 1 1 1 1
pi 1 1 1 1 1 1
piw 1 1 1 1
piw 1 1 1 1 1 1 1 1
piw 1 1 1 1 1 1 1
yb 1 1 1 1 1 1 1 1
pd 1 1 1 1 1 1 1 1
pd 1 1 1 1 1 1 1 1 1 1 1 1 1
pd 1 1 1 1 1 1
br 1 1 1 1 1
st 1 1 1 1 1 1 1 1 1
wp 1 1 1 1 1 1 1
ss 1 1 1 1 1 1 1 1
ss 1 1 1 1 1
pa 1 1 1 1 1 1 1 1 1 1 1
pa 1 1 1 1 1 1
pa 1 1 1 1 1 1 1
ro 1 1 1 1 1 1 1 1
Note: 1) Abbreviation definitions - for locations see Appendix 2 and for ecological Assemblage see Appendix 5. 2) Shores in Marine Protected Areas highlighted.

Parks Victoria Technical Series No. 22 Surf Coast Use
A7.2
A7. (continued)
Ecological Assemblage
Location bk mla cj ato gt ct D/t H mb ap bar gal sk ulv g/b g/d sz lit amp
ro 1 1 1 1
ro 1 1 1 1
ub 1 1 1 1 1 1
u-s 1 1 1 1 1 1 1
u-s 1 1 1 1 1 1
en 1 1 1 1 1 1 1 1 1
en 1 1 1 1 1 1 1
a-e 1 1 1 1 1 1 1 1 1
er 1 1 1 1 1 1
er 1 1 1 1 1 1
Note: 1) Abbreviation definitions - for locations see Appendix 2 and for ecological Assemblage see Appendix 5. 2) Shores in Marine Protected Areas highlighted.
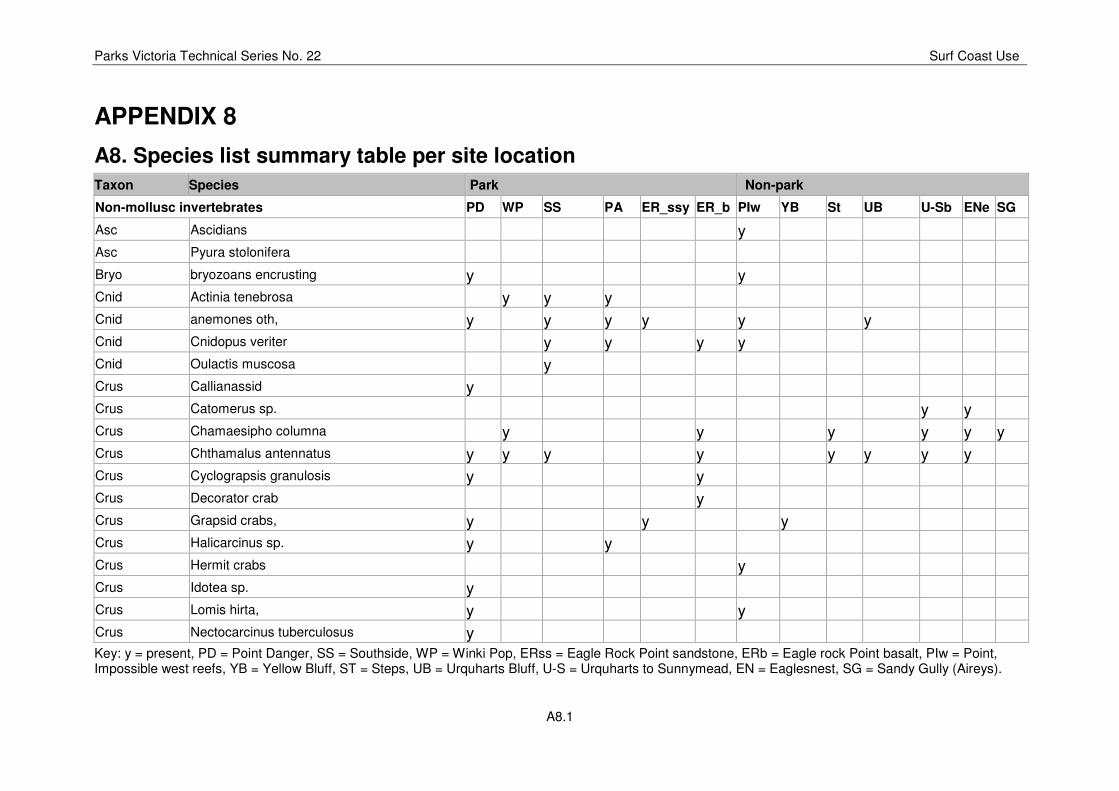
Parks Victoria Technical Series No. 22 Surf Coast Use
A8.1
APPENDIX 8
A8. Species list summary table per site location
Taxon Species Park Non-park
Non-mollusc invertebrates PD WP SS PA ER_ssy ER_b PIw YB St UB U-Sb ENe SG
Asc Ascidians y
Asc Pyura stolonifera
Bryo bryozoans encrusting y y
Cnid Actinia tenebrosa y y y
Cnid anemones oth, y y y y y y
Cnid Cnidopus veriter y y y y
Cnid Oulactis muscosa y
Crus Callianassid y
Crus Catomerus sp. y y
Crus Chamaesipho columna y y y y y y
Crus Chthamalus antennatus y y y y y y y y
Crus Cyclograpsis granulosis y y
Crus Decorator crab y
Crus Grapsid crabs, y y y
Crus Halicarcinus sp. y y
Crus Hermit crabs y
Crus Idotea sp. y
Crus Lomis hirta, y y
Crus Nectocarcinus tuberculosus y
Key: y = present, PD = Point Danger, SS = Southside, WP = Winki Pop, ERss = Eagle Rock Point sandstone, ERb = Eagle rock Point basalt, PIw = Point, Impossible west reefs, YB = Yellow Bluff, ST = Steps, UB = Urquharts Bluff, U-S = Urquharts to Sunnymead, EN = Eaglesnest, SG = Sandy Gully (Aireys).

Parks Victoria Technical Series No. 22 Surf Coast Use
A8.2
A8. (continued)
Crus Paragrapsus quadradentatus y y y y y
Crus Plagusia chabrus y y
Crus Tesseropora rosea y y y
Crus Tetraclitella purpurascens y y y y y
Echino Coscinasterias calamaria y
Echino Holopneustes sp. y
Echino Holothuroids y y y
Echino Nectria sp. y
Echino Patiriella calcar y y y y y y y y
Echino Patiriella exigua y y y y y
Echino Tosia sp. y y
Platy Platyhelminthes y y
Poly Galeolaria caespitosa y y y y y y y y y
Poly Polychaetes - not id'd y y y
Spon Sponges y y y
Molluscan species
Chiton Acanthochitona sp. y
Chiton Ischnochiton australis y y y
Chiton Ischnochiton elongatus, y y y y y
Chiton Ischnochiton lineolatus y y y y y
Chiton Ischnochiton spp. other y y y
Chiton Plaxiphora albida y y y y
Biv unidentified bivalve (like spiny oyster), y y
Biv Austromytilus ostratus y y y y y y
Biv Xenostrobus pulex y y y y y y y y y y

Parks Victoria Technical Series No. 22 Surf Coast Use
A8.3
A8. (continued)
Gast Chlorodiloma adelaidae y y y y y y y y y y y
Gast Austrocochlea constricta y y y y y y y y y y y y y
Gast Austrocochlea odontis y y y y y y y y y y
Gast Bembicium nanum y y y y y y y y y y y y
Gast Cantharidus pulcherrimus y y y y y
Gast Cellana tramoserica y y y y y y y y y y y y
Gast Clanculus sp. y y
Gast Clypidina rugulosa y y y y y
Gast Cominella lineolata y y y y y y y y y y y
Gast Dentimitrella sp. y y y y y y
Gast Dicathais orbita y y y y y y y y y y y y
Gast Haliotis sp. y y
Gast Lepsiella vinosa y y y y y y y y y
Gast Nerita atramentosa y y y
Gast Nodilittorina praettermisa y y y y y y y y
Gast Nodilittorina unifasciata y y y y y y y y y y y y
Gast Notoacmea other y y y y
Gast Notoacmea peterdi y y y y
Gast Onchidella patelloides y y y y y y
Gast Patelloida alticostata y y y y y y y y y y
Gast Patelloida latistrigata y y
Gast Pleuroploca australasia y
Gast Scutus antipodes y y y
Gast Siphonaria diemenensis y y y y y y y y y y y y y
Gast Siphonaria faniculata y y y Key: y = present, PD = Point Danger, SS = Southside, WP = Winki Pop, ERss = Eagle Rock Point sandstone, ERb = Eagle rock Point basalt, PIw = Point, Impossible west reefs, YB = Yellow Bluff, ST = Steps, UB = Urquharts Bluff, U-S = Urquharts to Sunnymead, EN = Eaglesnest, SG = Sandy Gully (Aireys)

Parks Victoria Technical Series No. 22 Surf Coast Use
A8.4
A8. (continued)
Gast Siphonaria zelandica y y y y y y y y
Gast Turbo undulatus y y y y y y y y y y
Plant Species
Angio Amphibolis y y y y y y y y
BLGR Blue-green algae y y y y y y y y y
BLGR Rivularia y y y y y y y
BLGR Spongy blue-green algal mat y y y y y y
Chlor Caulerpa brownii y y y y y y y y y y y y y
Chlor Caulerpa cactoides y y y y
Chlor Caulerpa geminata y y y y
Chlor Caulerpa scalpelliformis y
Chlor Caulerpa vesiculifera y y y y y y y
Chlor Chaetomorpha darwinii y y
Chlor Cladophora rugulosa y y y y
Chlor Cladostephus spongiosis y y
Chlor Codium spp. y y y y y
Chlor Dictyosphaeria sericea y y y y y y y y
Chlor Enteromorpha y y y y y y y y y
Chlor Ulva y y y y y
Lich Lichina y y y y y
Phaeo Brown encrusting alga y y y y y
Phaeo Caulocystis unifera y y y y y y y y y y y y
Phaeo Colpomenia sinuosa y y
Phaeo Cystophera torulosa y y y y y
Phaeo Cystophora moniliformis y y y y Key: y = present, PD = Point Danger, SS = Southside, WP = Winki Pop, ERss = Eagle Rock Point sandstone, ERb = Eagle rock Point basalt, PIw = Point, Impossible west reefs, YB = Yellow Bluff, ST = Steps, UB = Urquharts Bluff, U-S = Urquharts to Sunnymead, EN = Eaglesnest, SG = Sandy Gully (Aireys)

Parks Victoria Technical Series No. 22 Surf Coast Use
A8.5
A8. (continued)
Phaeo Cystophora retorata y y y y y y y y y y y
Phaeo Cystophora spp. other y y y y y y y y y
Phaeo Cystophora subfarcinata y y y y y y y y y y y y y
Phaeo Dictyopteris sp. y
Phaeo Durvillaea potatorum y y
Phaeo Ectocarpus sp. y y y
Phaeo Halopteris spp. y y y y y
Phaeo Hormosira browni y y y y y y y y y y y y y
Phaeo Notheia anomala y y y y y y y y y y
Phaeo Padina fraseri y y y y y
Phaeo Phyllospora comosa y
Phaeo Sargassum spp. y y y y y y y y y y y y
Phaeo Scytosiphon lomentaria y
Phaeo Splancnidium y y
Phaeo Xiphophora chondrophylla y y y y
Phaeo Zonaria sp. y y y y y y y y
Rhodo Coralline encrusting y y y y y y y y y
Rhodo Coralline turf y y y y y y y y y y y y
Rhodo Gelidium pusillum y y y y y y y y y y y
Rhodo Laurencia spp. y y y y y y y y y
Rhodo unidentified turf red y y y y y
Rhodo unidentified foliose red - mid-upper y y y
Key: y = present, PD = Point Danger, SS = Southside, WP = Winki Pop, ERss = Eagle Rock Point sandstone, ERb = Eagle rock Point basalt, PIw = Point, Impossible west reefs, YB = Yellow Bluff, ST = Steps, UB = Urquharts Bluff, U-S = Urquharts to Sunnymead, EN = Eaglesnest, SG = Sandy Gully (Aireys)

Parks Victoria Technical Series No. 22 Surf Coast Use
A9.1
APPENDIX 9
A9. Regionally uncommon species
Uncommon species listed for the Surf Coast region and sandstone locations at which they were found.
Group Taxa PIw PD BiR St WP SS PA U-S ER
Ascidian Pyura sp. (sea tulip) y
Chiton Ischnochiton veriegatus y
Chiton Ischnochiton versicolor y
Cnidaria Anthothe albocincta y
Crustacea Cyclograpsis granulosis y y
Crustacea Notomitrax sp. y y
Crustacea Halicarcinus y y
Crustacea Idotea sp. y y
Crustacea Lomis hirta y y
Crustacea Nectocarcinus tuberculosus y
Crustacea Plagusia chabrus y y y
Crustacea Tesseropora rosea y y y
Echinoderm Coscinasterias calamaria y
Echinoderm Holopneustes sp. y
Echinoderm Nectria sp. y
Echinoderm Tosia australis y y y
Gastropod Cantharidellatuberiana y
Gastropod Clanculus sp. y y y
Gastropod Haliotis sp. y y
Gastropod Notoacmea flammea y y
Gastropod Phasianella australis y
Gastropod Pleuroploca australasia y
Gastropod Thaliota sp. y
Chlorophyta Caulerpa cactoides y y y y
Chlorophyta Caulerpa scalpelliformis y y
Chlorophyta Cladostephus spongiosis y y
Chlorophyta Codium pomoides y y
Phaeophyta Colpomenia sinuosa y
Phaeophyta Cystophora grevillei y
Phaeophyta Dictyopteris sp. y
Phaeophyta Splacnidium rugosum y
Key: areas highlighted = ‘shores in marine protected’; y = present.

Parks Victoria Technical Series No. 22 Surf Coast Use
A10.1
APPENDIX 10
A10. Species richness
Species richness indices for shores of the Surf Coast region.
Location
Gastropod
number SRI
Animals
number SRI
Plants
number SRI
Total taxa
number SRI
PI 4 11 5 5 18 38 23 16
PIw 17 46 35 37 22 46 57 40
YB 12 32 17 18 22 46 38 27
PD 21 57 47 51 26 54 73 52
BR 20 54 27 29 27 56 54 38
St 10 27 13 14 25 52 38 27
WP 14 38 23 25 22 46 45 32
SS 19 51 33 35 25 52 58 41
PA 18 49 31 33 24 50 55 39
PRoc 8 22 17 18 8 17 25 18
UB 12 32 16 17 21 44 37 26
U-Sa 14 38 18 19 23 48 41 29
U-Sb 16 43 25 27 21 44 46 33
ENe 17 46 28 30 23 48 51 36
ENw 10 27 14 15 16 33 30 21
EA 12 32 17 18 15 31 32 23
ER_ss 16 43 26 28 19 40 45 32
ER_b 17 46 34 37 11 23 45 32
Key: PD = Point Danger, SS = Southside, WP = Winki Pop, ERss = Eagle Rock Point sandstone, Erb = Eagle Rock Point basalt, PIw = Point Impossible west reefs, YB = Yellow Bluff, ST = Steps, UB = Urquharts Bluff, U-S = Urquharts to Sunnymead, EN = Eaglesnest, SG = Sandy Gully (Aireys)

Parks Victoria Technical Series No. 22 Surf Coast Use
A11.1
APPENDIX 11
A11. Activity totals at each site (off peak period) Total numbers for each activity at each site for the off peak period. Each location is listed in order of most people through to least people observed, along with a breakdown into activities within each category for; intertidal (Table A10.1), nearshore (Table A10.2) and foreshore (Table A10.3) zones.
Table A11.1 Intertidal
Location Access Dogs Walking Stationary Explore Fossick Collect Shore fish Total rock
Urquharts bluff 103W 1 1 1 15 7 0 0 24
Point Danger 66W 0 8 0 2 4 7 0 21
Aireys - Spit 105W 1 7 0 2 4 3 3 19
Pt Roadknight oc 96W 9 12 2 5 0 0 0 19
Eagles Nest 104W 3 3 0 2 0 0 6 11
Winki Pop 80W 1 11 0 0 0 0 0 11
Bird Rock 79W 0 3 4 2 1 0 0 10
Southside reef 81W 1 9 0 0 0 0 0 9
Eagle rock 105A 0 0 0 1 5 0 0 6
Point Addis 84W 1 0 0 0 0 0 1 1
Total park 3 28 0 3 9 7 1 48
Total non-park 14 26 7 26 12 3 9 83
Table A11.2 Total numbers for each activity and site, off peak – nearshore zone
Location Access Swim/snork Surf Kyack surfski Boats People in boats Total water
Winki Pop 80W 0 133 0 1 2 135
Southside reef 81W 0 43 3 0 0 46
Bird Rock 79W 0 33 0 0 0 33
Urquharts bluff 103W 0 1 1 2 4 6
Point Danger 66W 0 2 1 1 2 5
Point Addis 84W 0 3 0 0 0 3
Pt Roadknight oc 96W 1 0 0 1 2 3
Aireys - Spit 105W 0 0 0 1 2 2
Eagle rock 105A 0 0 0 1 1 1
Eagles Nest 104W 0 0 0 0 0 0
Total park 0 181 4 2 5 190
Total non-park 1 34 1 4 8 44

Parks Victoria Technical Series No. 22 Surf Coast Use
A11.2
Table A11.3 Totals by activity and site, off peak – foreshore
Location Access On access Sightsee Sit picnic Total foreshore
Winki Pop 80W 37 109 0 146
Bird Rock 79W 12 40 0 52
Eagle rock 105A 0 37 0 37
Point Danger 66W 0 16 0 16
Eagles Nest 104W 0 6 0 6
Urquharts bluff 103W 0 3 3 6
Point Addis 84W 1 4 0 5
Pt Roadknight oc 96W 5 0 0 5
Aireys – Spit 105W 0 0 0 0
Southside reef 81W 0 0 0 0
Total park 38 166 0 204
Total non-park 17 49 3 69


Parks Victoria is responsible for managing the Victorian protected
area network, which ranges from wilderness areas to metropolitan
parks and includes both marine and terrestrial components.
Our role is to protect the natural and cultural values of the parks
and other assets we manage, while providing a great range of
outdoor opportunities for all Victorians and visitors.
A broad range of environmental research and monitoring activities
supported by Parks Victoria provides information to enhance park
management decisions. This Technical Series highlights some of
the environmental research and monitoring activities done within
Victoria’s protected area network.
Healthy Parks Healthy People
For more information contact the Parks Victoria Information Centre
on 13 1963, or visit www.parkweb.vic.gov.au