parker's presentation - center for strategic and international studies
TRANSCRIPT

Water Resources Modeling for
Informed Decision-Making
Andrew Parker
Director, Water Resources Modeling Group
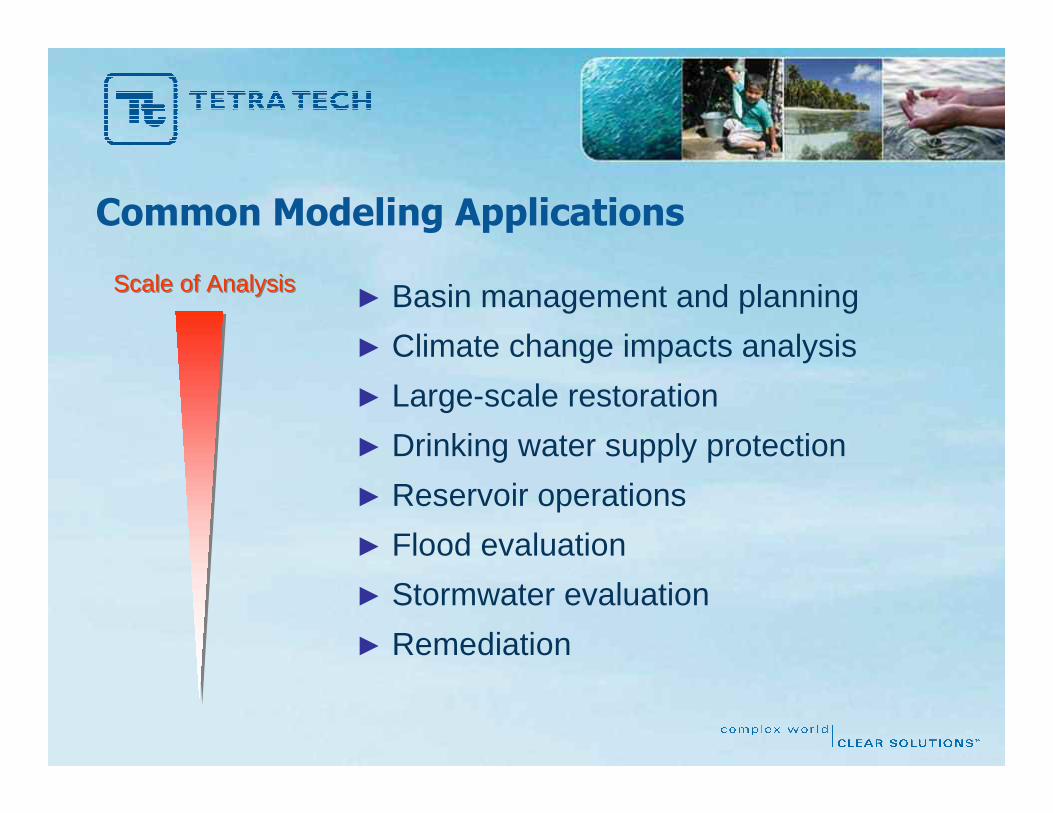
Common Modeling Applications
► Basin management and planning
► Climate change impacts analysis
► Large-scale restoration
► Drinking water supply protection
► Reservoir operations
► Flood evaluation
► Stormwater evaluation
► Remediation
Scale of AnalysisScale of Analysis

Model CategoriesCrops
Pasture
Urban► Landscape models
� Runoff of water and pollutants on and through the land
► Receiving water models� Flow of water through streams and in lakes and
estuaries� Transport, deposition, and transformation of pollutants
► Watershed models� Combined landscape and receiving water models
► Site-scale models� Detailed representation of local processes

Model Basis
► Empirical formulations� relationship based on observed data
► Deterministic models� produce system responses or outputs to
temporal and spatial inputs (process-based)
Input Model Output
Factor 1
Rainfall Event
Pollutant Buildup
Others
Land use
System
Soil
Stream
Pt. Source
Factor 2
Factor 3
Response
Input Model Output
Factor 1
Rainfall Event
Pollutant Buildup
Others
Land use
System
Soil
Stream
Pt. Source
Factor 2
Factor 3
Response
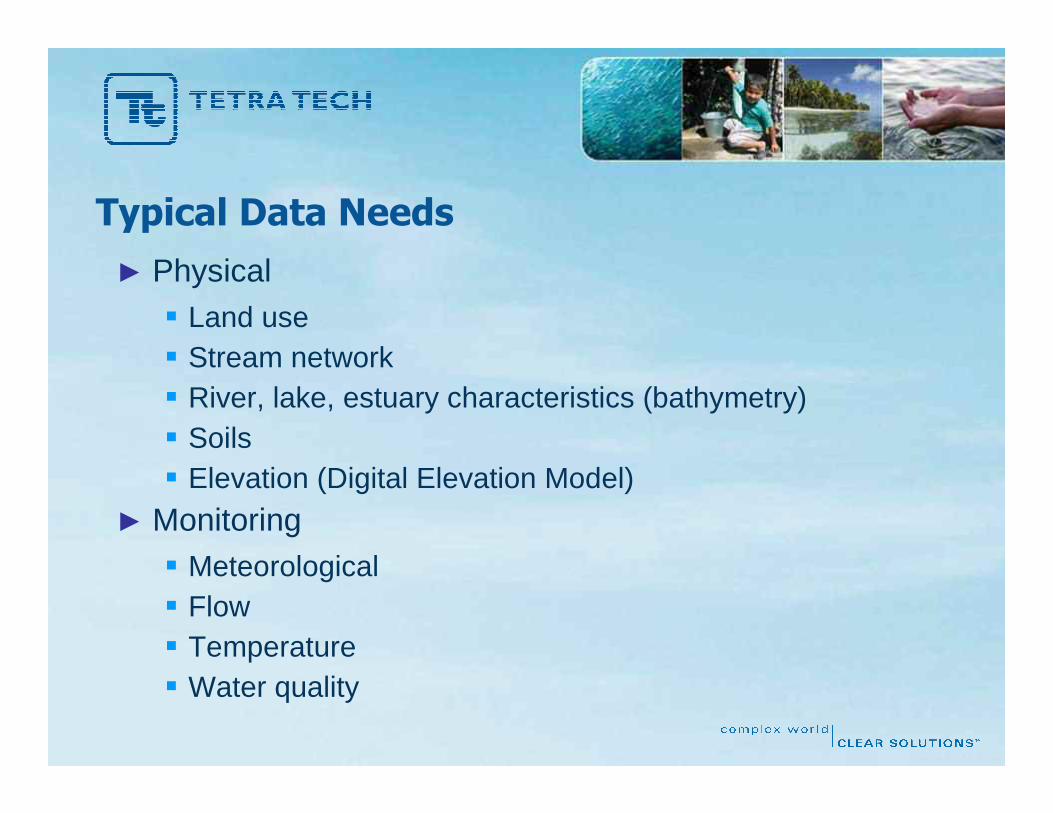
Typical Data Needs► Physical
� Land use� Stream network� River, lake, estuary characteristics (bathymetry)� Soils� Elevation (Digital Elevation Model)
► Monitoring� Meteorological� Flow� Temperature� Water quality
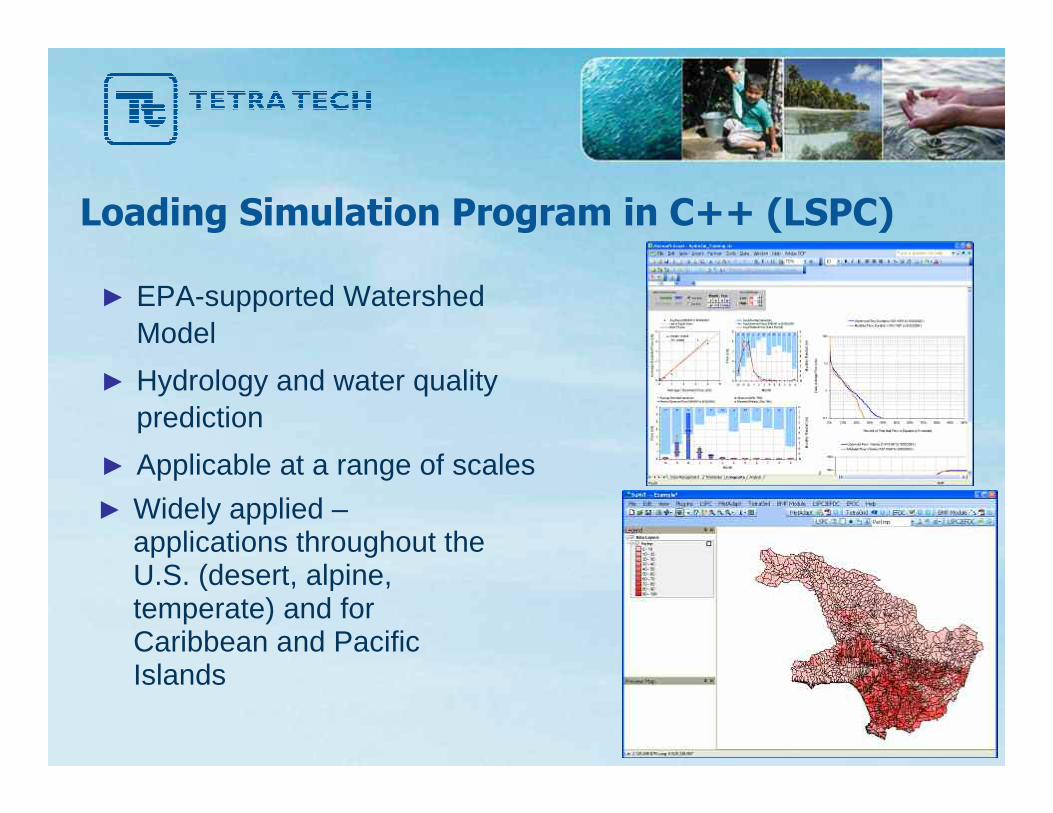
Loading Simulation Program in C++ (LSPC)
► EPA-supported WatershedModel
► Hydrology and water qualityprediction
► Applicable at a range of scales
► Widely applied –applications throughout theU.S. (desert, alpine,temperate) and forCaribbean and PacificIslands

Environmental Fluid Dynamics Code (EFDC)
► Comprehensive Surface Water Modeling System� Fully integrated hydrodynamic, water quality
and sediment-contaminant simulationcapabilities
� 1, 2, or 3-Dimensional simulation of rivers,lakes, estuaries, coastal waters, and wetlands
� Eutrophication, mixing zone, sedimenttransport, salinity, temperature
► Applied internationally, with >125 applications
EFDC Model
HydrodynamicsSedimentTransport
WaterQuality
Toxics

► Decision support system
► Available at www.modelingwater.com
► Collection of environmental models and analysis tools
� Watershed� Receiving water (rivers, lakes, coastal)� Site-scale
► Models work together to answer Integrated Water ResourcesManagement (IWRM) questions
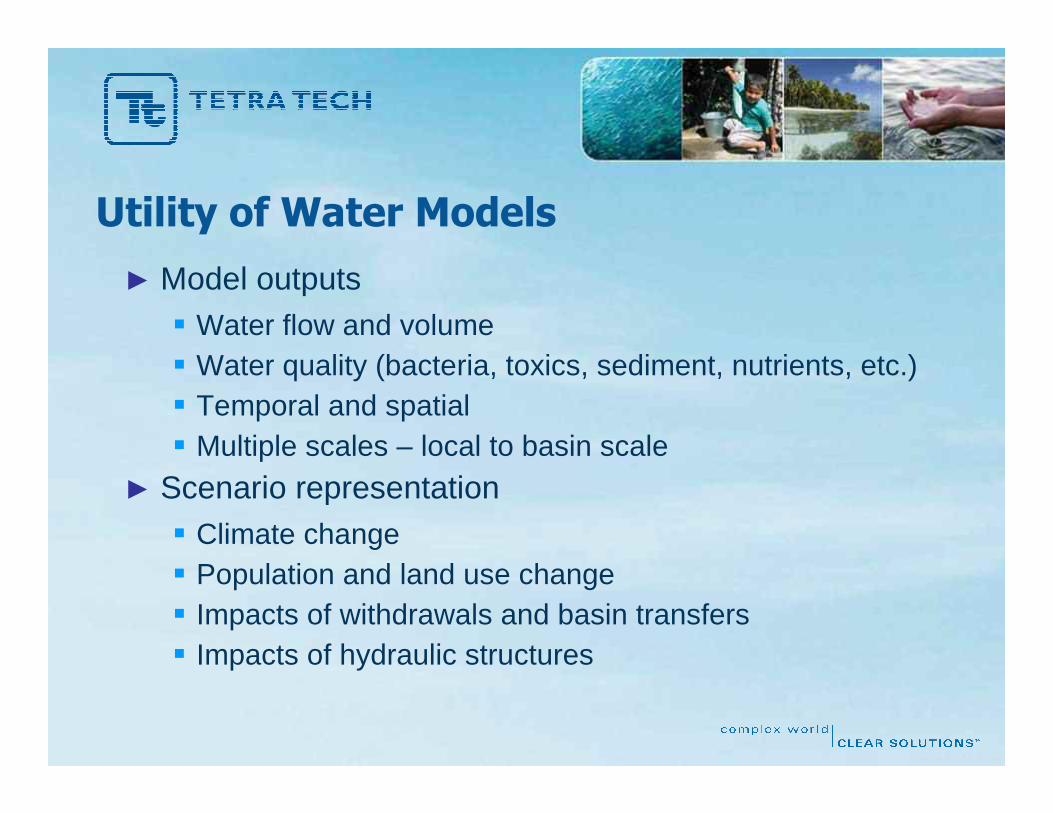
Utility of Water Models
► Model outputs� Water flow and volume� Water quality (bacteria, toxics, sediment, nutrients, etc.)� Temporal and spatial� Multiple scales – local to basin scale
► Scenario representation� Climate change� Population and land use change� Impacts of withdrawals and basin transfers� Impacts of hydraulic structures

WaterWater
FoodFood EnergyEnergy
► Are crops susceptible tofloods?
► How may crop selectionbe affected by a changingclimate?
► Does water supply meetdrinking water andagricultural demands?
► Are minimum drinkingwater standards met?
► Is sufficient water flowand volume available forhydropower generation?
► Is water supply sufficientto meet powergeneration coolingdemands?
► Are there impacts fromenergy-relatedextraction operations onwater quality?
Linkage to Food and Energy
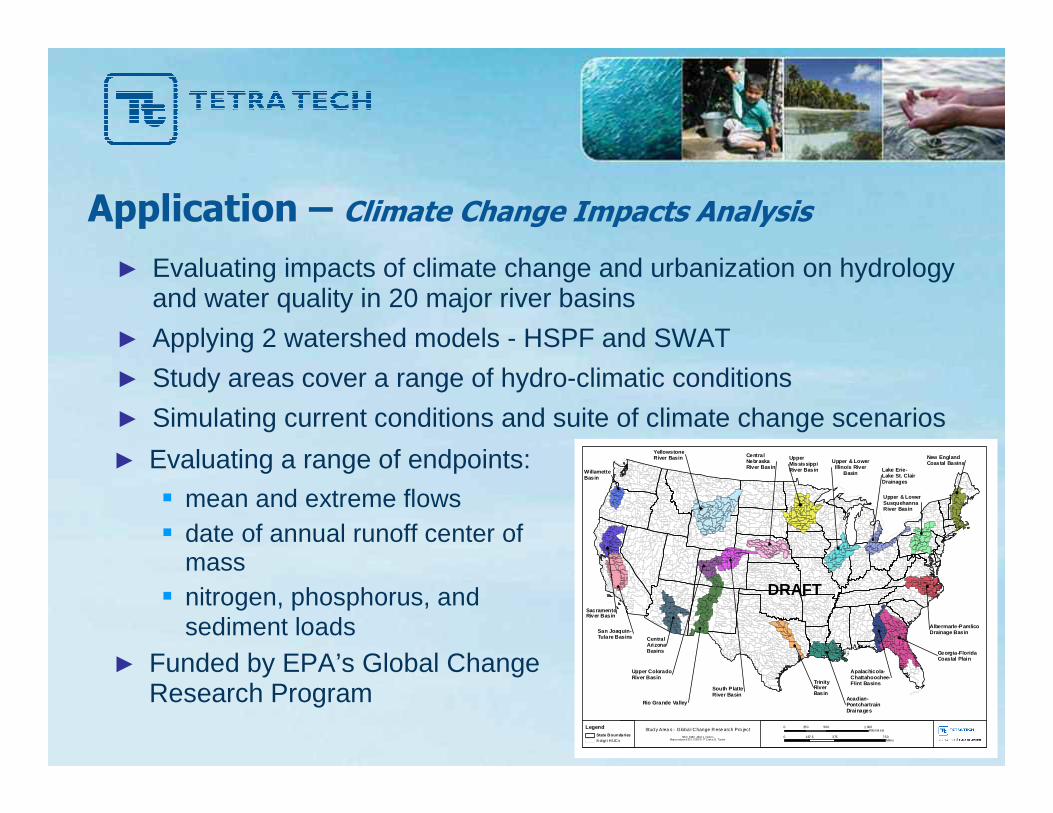
Application – Climate Change Impacts Analysis
► Evaluating impacts of climate change and urbanization on hydrologyand water quality in 20 major river basins
► Applying 2 watershed models - HSPF and SWAT
► Study areas cover a range of hydro-climatic conditions
► Simulating current conditions and suite of climate change scenariosYellowstoneRiver Basin Central
NebraskaRiver Basin
South PlatteRiver Basin
UpperMississippiRiver Basin
Upper & LowerIllinois River
BasinLake Erie-Lake St. ClairDrainages
New EnglandCoastal Basins
WillametteBasin
SacramentoRiver Basin
San Joaquin-Tulare Basins
Upper ColoradoRiver Basin
Rio Grande Valley
CentralArizonaBasins
TrinityRiverBasin
Acadian-PontchartrainDrainages
Apalachicola-Chattahoochee-Flint Basins
Georgia-FloridaCoastal Plain
Albermarle-PamlicoDrainage Basin
Upper & LowerSusquehannaRiver Basin
Stud y Area s - Globa l Change R ese arch Pro jectNAD_1983 _Alber s_meter s
Map p roduce d 02-1 0-200 9 - P. Cad a, B. Tucker
LegendState Boundaries8-d igi t HUCs
0 500 1,000250Kilomet ers
0 375 750187.5Miles
► Evaluating a range of endpoints:
� mean and extreme flows� date of annual runoff center of
mass� nitrogen, phosphorus, and
sediment loads
► Funded by EPA’s Global ChangeResearch Program
DRAFT

Application – Patuxent Drinking Water Supply Protection
► Developed linked watershed-reservoir models using LSPC and CE-QUAL-W2
► Simulated hydrodynamics and eutrophication (DO and nutrients)
► Evaluated holistic watershedmanagement alternatives
� Past
� Present
� Future
► Assessed influence ofeutrophication on disinfectionbyproducts
► Funded by WSSC

► Modeled hydrodynamics and waterquality for 250 miles of the KlamathRiver (in CA and OR)
► Applied linked RMA, CE-QUAL-W2, andEFDC modeling framework to simulatemain-stem river, 4 reservoirs, and anestuary
► Simulated flow/water depth, temperature,nutrients, DO, and pH
► Represented historical and naturalbaseline conditions, including absence ofhydroelectric developments
► Funded by EPA, North Coast RegionalWater Quality Control Board, andOregon DEQ
Application – Klamath River Impairment Analysis

For more information, please contact:Andrew Parker
(703) 385-6000
www.modelingwater.com