pareto conference - ocean yield
TRANSCRIPT

Pareto Conference
September 2014

Ocean Yield – The dividend yield company
September 14 2
Ocean Yield in brief
Pareto Conference 2014
Attractive and growing
dividends Increased dividend capacity as earnings per share grow
– Delivery of newbuildings
– New investments without raising equity
– Reduced funding cost
Capacity to increase the current pay-out ratio
Current dividend yield of 7.7% p.a.
A modern and diversified fleet of oil-service and shipping assets
All vessels on long-term charter, substantial charter-backlog
Target growth of minimum USD 350 million in annual investments

Attractive and diversified portfolio of oil
service and industrial shipping assets
September 14 3
FPSO
Dhirubhai 1
Subsea construction
vessel
Wayfarer
Seismic vessel
Geco Triton
American Shipping
Company bonds
Initial asset base… …and USD 1.1 billion in recent acquisitions
Subsea vessel Lewek
Connector
6 x car carriers
2x 6500 CEU
2x 8500 CEU (newbuilds)
2x 4900 CEU
2 x AHTSs’
FAR Senator
FAR Statesman
Bonds in AMSC with book value USDm
171.7 and nominal value of USDm 190
AMSC Market cap ~USD 480 million
3 x ethylene carriers
36,000 cbm (newbuilds)
Pareto Conference 2014

All vessels on long term charter with
USD 2.0 billion in contracted EBITDA*
4 September 14
Per end Q2 2014. EBITDA as reported, incl. mob. fees. Figures are based on management’s estimates regarding operating expenses on the Dhirubha i-1 which may be subject to
change in addition to certain purchase options in bareboat charter contracts not being exercised
Pareto Conference 2014
Unit # no Counterparty
Dhirubhai-1 1 Reliance
Wayfarer 1 Aker Solutions
Lewek Connector 1 EMAS / Ezra Holding
Höegh Jacksonville & Jeddah 2 Höegh Autoliners
Höegh XSI462E & XS1462F 2 Höegh Autoliners
Höegh Beijing / Xiamen 2 Höegh Autoliners
FAR Senator / Statesman 2 Farstad Supply
LEG Carrier - S1034 /S1035/S1036 3 Hartmann / SABIC
Geco Triton 1 WesternGeco
Under construction Fixed dayrate Floating dayrate
2022 2023 2024 2027 20282025 20262019 2020 202120182014 2015 2016 2017
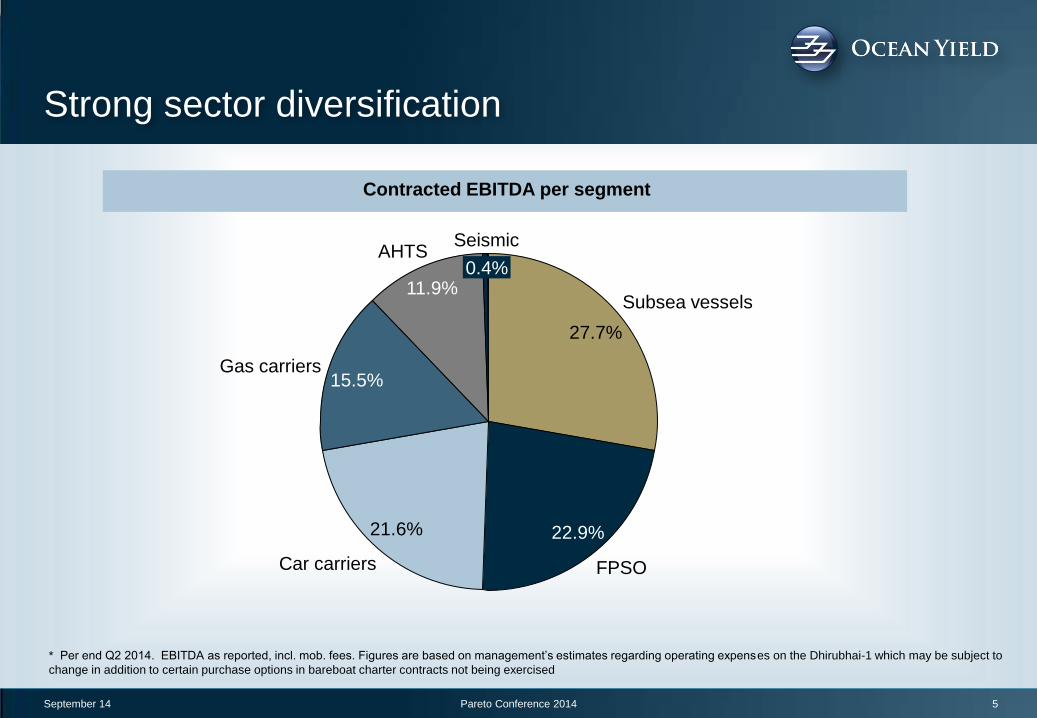
Strong sector diversification
September 14 5
Contracted EBITDA per segment
* Per end Q2 2014. EBITDA as reported, incl. mob. fees. Figures are based on management’s estimates regarding operating expenses on the Dhirubhai-1 which may be subject to
change in addition to certain purchase options in bareboat charter contracts not being exercised
Pareto Conference 2014
FPSO
21.6% 22.9%
Car carriers
Gas carriers 15.5%
11.9%
AHTS 0.4%
Seismic
Subsea vessels
27.7%

Liquified Ethylene Gas Carriers – 3 newbuildings
6
Vessel: 3 Liquified Ethylene Gas (LEG) Carriers
Yard cost: ~USD 243 million (total for the three newbuildings)
Yard / Delivery: Sinopacific Offshore & Engineering, China, with delivery in H2 2016
Term: 15 years (10 years fixed and 5 years floating rate)
Charterer: Hartmann Group with 10 years subcharter to SABIC Petrochemicals B.V.
EBITDA: USD 31.5 million per annum (EV/EBITDA 7.8x)
September 14 Pareto Conference 2014

September 14
Significant EBITDA growth from
newbuildings
7
EBITDA per quarter (USDm)
55.453.252.755.650.648.8
39.438.138.8
Q2’14 Q3’12 Q2’12 Q4’13 Q1’14 Q3’13 Q2’13 Q1’13 Q4’12
Already committed projects will add USD 15m to Q2
EBITDA
Pareto Conference 2014

September 14
Adjusted Net Profit / Dividend per share
8
Dividend per share, annualized basis (USD)
Adj. Net profit per share, annualized basis (USD)**
0.520.500.490.48
+8%
Q2 2014 Q1 2014 Q4 2014
Q3 2013
*As per close 08.09.2014 – Q2 2014 dividend annualized, share price of NOK 42,50 and NOK/USD 6,30
**Reported EPS has been adjusted for non-recurring items. Reported EPS for Q3’13, Q4’13, Q1’14 and Q2’14 was USD 0.14, USD 0.20, USD
0.21 and USD 0.13, respectively.
0.780.760.640.74
Q1 2014 Q4 2013 Q2 2014 Q3 2013
Pareto Conference 2014
Dividend yield
7.7%* p.a
Pay-out ratio on adjusted Q2 EPS
66%
Adjusted earnings yield
11.5%* p.a

September 14
New investments
Invested USD 1.1bn in 12 vessels since the company was established 1st
April 2012 (~2.5 years)
Our target is minimum USD 350m in new investments per year
● Modern assets within oil-service and industrial shipping
● Equity returns targeted in the range of 13-15% p.a.
● Reasonable credit quality of counterparties
● Contract duration in recent transactions have been 8-12 years
Capacity to make new investments without raising equity
9 Pareto Conference 2014

September 14
Attractive credit markets will reduce funding
costs
Lower margins on bank loans
● Opportunity to reduce interest cost by refinancing existing bank loans
● Recently arranged a USD 250m bank facility at LIBOR +2.25% p.a.
● Bank margins on new facilities are indicated at even lower levels
Reduced funding cost in bond market
● New bond of NOK 600 million issued in March 2014 at NIBOR +3.90% p.a.
● Tap issue of NOK 400 million in July 2014 at NIBOR +3.65% p.a.
● Bond now trading at a spread of 3.63% p.a.
10 Pareto Conference 2014

September 14
Risk factors
Counterparty risk
Operating risk Dhirubhai 1
Residual risk
Interest rate risk
Refinancing risk
11 Pareto Conference 2014
September 14
Investment highlights
Increased earnings per share
● Delivery of newbuildings
● New investments without raising new equity
● Reduced funding cost
Growing dividends per share
● Higher pay-out ratio
● Increased earnings
12 Pareto Conference 2014

September 14 13
Q&A
Pareto Conference 2014

P&L
September 14 14
Comments
Operating Expenses: Lower
than budgeted in Q2 related
to the FPSO Dhirubhai-1
Financial Expenses: One-off
accounting effect of USD 5.5
mill related to refinancing of
car carriers. Accrued bank
fees booked in the balance
sheet for the old loan is
expensed over P&L in Q2
2014. USD 0.4 mill related to
buyback of bonds.
Derivatives: Negative mark to
market of USD 5.3 mill
related to interest rate swaps
2nd Quarter 2nd Quarter First Half First Half
Amounts in USD million 2014 2013 2014 2013
Operating revenues 62.1 60.0 121.8 116.6
Vessel operating expenses (3.5) (3.9) (7.1) (7.8)
Wages and other personnel expenses (2.2) (2.8) (4.0) (4.5)
Other operating expenses (1.0) (2.7) (2.1) (4.9)
EBITDA 55.4 50.6 108.6 99.4
Depreciation and amortization (24.4) (25.0) (47.7) (49.2) Impairment charges and other non-recurring
items - - - -
Operating profit 31.0 25.5 60.9 50.2
Financial income 4.7 7.3 20.7 11.7
Financial expenses (14.9) (9.4) (29.3) (17.5)
Foreign exchange gains/losses 2.0 (0.2) 1.3 (0.1)
Mark to market of derivatives (5.3) (3.4) (4.0) (6.7)
Net financial items (13.5) (5.8) (11.3) (12.6)
Net Profit before tax 17.5 19.8 49.6 37.6
Income tax expense (0.4) 0.2 (3.9) (0.5)
Net Profit after tax 17.1 19.9 45.7 37.1
Income statement
Pareto Conference 2014

1st Quarter 2nd Quarter
Amounts in USD million 2014 2014
Profit after tax 28.6 17.1
- One-off adjustment to Financial Income (11.5) -
- One-off adjustment to Financial Expenses 6.0 5.9
- Foreign exchange gains/losses 0.7 (2.0)
- Mark to market of derivatives (1.3) 5.3
- Tax 3.1 -
Net profit after tax adjusted for non-
recurring items 25.6 26.3
Net profit after tax adjusted for non-recurring items
September 14 15
Adjustments Comments
Accounting effect of financing of car carriers as bank
fees related to old loan is expensed over P&L (USD 5.5
million) and USD 0.4 million related to repurchase of
OCY Bonds
Related to interest rate swaps on vessel loans and
Ocean Yield bond loan
Pareto Conference 2014

Balance sheet
September 14 16
Balance sheet
30 June 30 June
Amounts in USD million 2014 2013
ASSETS
Vessels and equipment 1 366.4 1 307.3
Intangible assets 38.3 38.3
Deferred tax assets 10.5 9.7
Restricted cash deposits 20.1 20.0
Investments in AMSC Bonds 174.8 150.1
Other non-current assets 0.5 0.5
Total non-current assets 1 610.7 1 526.0
Trade receivables and other interest-free receivables 20.7 18.5
Cash and cash equivalents 102.8 60.1
Total current assets 123.5 78.6
Total assets 1 734.2 1 604.6
30 June 30 June Amounts in USD million 2014 2013
Total equity 707.1 522.0
Interest-bearing debt 811.5 838.7
Deferred tax liabilities 1.0 1.3
Pension liabilities 0.3 0.4
Mobilization fee and advances 69.5 75.5
Other interest-free long term liabilities 1.4 ( 0.0)
Total non-current liabilities 883.7 915.8
Interest-bearing short term debt 117.6 125.4
Trade and other payables 25.9 41.4
Total current liabilities 143.4 166.8
Total liabilities 1 027.1 1 082.6
Total equity and liabilities 1 734.2 1 604.6
Pareto Conference 2014

September 14 17 Pareto Conference 2014