parent engagement survey - pei - peihsf.capeihsf.ca/sites/default/files/parent%20engagement... ·...
TRANSCRIPT
PARENT ENGAGEMENT SURVEY - PEI
2008
A report on a survey of Prince Edward Island parents’ responses to education engagement questions

i
Table of Contents
ACKNOWLEDGEMENTS ....................................................................................................... II
EXECUTIVE SUMMARY ....................................................................................................... III
BACKGROUND .................................................................................................................... 1
SURVEY METHODOLOGY .................................................................................................... 2
Outline ........................................................................................................................................................ 2
Limitations ................................................................................................................................................... 2
Sample ........................................................................................................................................................ 3
Interpretation ............................................................................................................................................. 3
RESULTS ............................................................................................................................... 4
Communications with the School System ............................................................................................... 6
Did You Feel Supported by the School as a Partner in Your Child’s Education? ...................... 6
One-Way Communications .................................................................................................................. 7
Two-Way Communications .................................................................................................................. 8
Involvement in School-Based Activities .............................................................................................. 10
Satisfaction with Parent-Teacher Meetings ...................................................................................... 11
School Response to Students’ Special Needs ................................................................................... 12
Where Learning Occurs ....................................................................................................................... 13
Where Should Learning Occur? ....................................................................................................... 13
Learning Outside of the School ........................................................................................................ 15
Homework Issues .................................................................................................................................... 16
Parent Involvement in Volunteering for the School ......................................................................... 21
Involvement with Home and School Associations and School Councils ........................................ 23
Full-Day vs. Half-Day Kindergarten .................................................................................................. 24
WORKS CITED .................................................................................................................... 25
Parent Engagement Paper Survey ..................................................................................................... 26
ii
Parent Engagement Survey - PEI A report on a survey of Prince Edward Island parents’ responses to education engagement questions
ACKNOWLEDGEMENTS
The survey questionnaire development, focus testing, and the design for the web and paper-based versions of
the survey were done by Consultant, Vicki Bryanton in conjunction with an Advisory Committee consisting of
William Whelan (President of the Prince Edward Island Home and School Federation), Wendy MacDonald
(Prince Edward Island Home and School Federation Past President), and Shirley Jay (Executive Director of the
Federation).
Special thanks go to the parents who participated with enthusiasm and candor in the focus group sessions.
Thanks are also extended to Leona McIsaac-Moran for background information and insight into Department
of Education surveys and interests.
The Parent Engagement Survey is part of the Prince Edward Island Home and School Federation’s parent
engagement initiative which is supported by the Department of Education and Early Childhood Development.
iii
PEI Parent Engagement Survey
EXECUTIVE SUMMARY
In the fall of 2008, the Prince Edward Island Home and School Federation sponsored a survey of parents of
school-aged children in PEI. The survey, carried out by consultant Vicki Bryanton, explored issues related to
parent engagement in their children’s education. A total of 704 surveys are included in the analysis,
representing parents of 1,234 school-aged children.
Key Findings
Sense of Partnership: Almost two-thirds of parents indicated that they felt supported a great deal by their
school as a partner in their child’s education, and a further 30% felt somewhat supported. Comments
indicated that communication between parents and teachers, or parents and administrators, played a large
role in whether or not parents felt supported.
Communications with the School System: The three forms of one-way communications seen as most useful
were the school newsletter, school handbook, and school website. Most forms of two-way communication were
seen as useful.
Involvement in School-Based Activities: Ninety-nine percent (99%) of parents had attended parent-
teachers interviews (with over 90% attending all meetings). Eighty-nine percent (89%) of parents attended
events or activities at the school. Sixty percent (60%) had been involved in fund raising and 53% had
volunteered for some event or activity for the school. Only 31% reported having been involved in their Home
and School or School Council.
Satisfaction with Parent-Teacher Meetings: Satisfaction with parent-teacher meetings was very high, with
60% of respondents indicating (across all children) that they were very satisfied and a further 30% satisfied
with the meetings.
School Response to Students' Special Needs: One-fifth of parents, 21%, indicated that they had a child with
special needs. Of those parents, 25% were very satisfied with the school’s response to their child’s special
needs and a further 34% were satisfied. Twenty-three percent (23%) were somewhat dissatisfied and 19%
were very dissatisfied.
Where Learning Occurs: Almost three-quarters of parents felt that learning about sciences should occur mostly
or only at school, and about half felt the same about math. On the other hand, a majority of parents felt that
learning about religion should happen mostly or only at home, and a substantial minority felt that learning
about morals and values should occur mostly at home. However, in most other areas of both academic and
life skills, at least three-quarters of parents felt that learning should be a balance between home and school.
Homework Issues: Across all school levels, children averaged 1-3 hours a week on homework. Children in
elementary/consolidated levels were somewhat more likely than average to spend less than an hour per
iv
week on homework while students in intermediate and senior high were more likely to spend more than five
hours a week on homework. Almost three-quarters of parents felt their child’s amount of homework was about
right, with the remaining parents fairly evenly split between those who felt there was too much homework and
those who felt there was not enough.
Among parents of elementary students, 44% were very comfortable helping their child with homework and a
further 40% were mostly comfortable. Among parents of intermediate and high school students, a smaller
share, 30%, were very comfortable, but 50% reported feeling mostly comfortable.
Amount of Instructional Time and Level of Challenge: The majority of parents (ranging from 74% for the
first child to 67% for the third child) felt that their child was receiving enough instructional time at school, and
similarly, 74% felt their child was challenged enough. However a significant minority, almost one-fifth of
parents, felt that their child was not receiving enough instructional time and 22% felt that their child was not
challenged enough.
Parent Involvement in Volunteering for the School: One-fifth of parents said that they volunteered often in
their child’s school and a further one-third said that they volunteered sometimes. One-quarter of parents
volunteered rarely, and the remaining 22% never volunteered.
Areas of Volunteering: Almost two-thirds of all parents reported helping with fundraisers. Helping with field
trips was the next most common activity, with 38% of parents assisting in this area, followed by 27% helping
with food programs, and 27% driving students other than their own children to activities. Twenty-four percent
helped organize special events while 19% helped with sporting activities. Smaller numbers of parents cited a
wide range of other volunteer supports to their child’s school.
Involvement with Home and School Associations and School Councils: Work commitments were the most
common barrier to more involvement in their local parent group, cited by 67% of parents. The next largest
group, at 34%, identified the demands or needs of other children as a barrier. Only 2% did not know that
there was a parent group at the school and 4% did not know how to contact the parent group.
Full-day vs. Half-day Kindergarten
Forty-seven percent of all parents (47%) thought that the kindergarten program should be full-day once it
moves into the school system, while 42% felt it should be half-day and 11% were unsure. Among parents with
preschoolers, who will be directly affected by the change, a somewhat larger share, 53%, were in favor of
full-day kindergarten, while 40% preferred half-day and 7% were unsure.
1
BACKGROUND
The Prince Edward Island Home and School Federation (PEIHSF) is composed of local Home and School
Associations representing parents and students at 52 schools across PEI. The Federation Board of Directors,
comprised of 5 executive members and 8 regional directors, provides leadership, support, and resources to its
members. The regional directors are the liaison between the local Home and School Associations and the
provincial board.
The PEIHSF exists to promote the total well-being of children and the highest standards of education for each
child in the province. The Federation works in partnership with other organizations that foster this ideal. The
Federation encourages and whenever possible assists in the development of policies related particularly to
quality education for each child and generally to the total well-being of children in Prince Edward Island.
In response to the recommendations by the Task Force on Student Achievement (Kurial, 2005), the Minister
of Education asked the Prince Edward Island Home and School Federation to lead the development of a
province-wide Parental Engagement Initiative. The vision of the Parent Engagement Initiative is to establish
collaborative home and school learning environments for PEI children so that they can succeed as individuals,
as students and as citizens.
During 2007-08, Phase 1 of the Initiative included a survey circulated to principals and local presidents to
gather information on the current nature and extent of parent involvement, so as to learn about effective
approaches/activities that are already underway, and to identify needs and priorities. The Home and School
Federation entered into a partnership with Learning and Reading Partners, Mait MacIsaac and Sandy Rendall
to design supports for parent involvement in learning. A pilot program engaged 12 Island schools.
In 2008, the second element of the initiative was to gather information directly from parents through a
random survey. A Parent Engagement Survey of 500-600 respondents was sought to enable analysis of
results below the provincial level (e.g. by school board or school level). The core focus of the research was to
provide the information to encourage and to support parent involvement in learning at home. A secondary
focus of the research was to provide the information to promote and support the volunteer involvement in
supporting children’s learning in the school and in the community.
This Report is about the results of the Parent Engagement Survey.
2
SURVEY METHODOLOGY
Outline
The frame work and context for questions for the survey were provided by the Prince Edward Island Home
and School Federation. Questions were developed using a consultation process involving Advisory Committee
Members, focus group feedback, a review of several parent surveys (national and international in scope) used
in recent years and input from the PEI Department of Education and Early Childhood Development.
The survey was reviewed to ensure that questions would achieve stated objectives and some questions were
redesigned for online use. The design was modified slightly for creation of the paper survey ensuring that all
questions were covered, and comparable, between survey designs. The paper survey was tested within
parent focus groups for reliability and readability and adjusted accordingly.
To allow for the inclusion of as many parents as possible, and to keep costs down, data collection was done
with a broadly promoted web-based survey and a select distribution of 800 paper surveys.
Promotion of the survey was achieved through the PRINCE EDWARD ISLAND Home and School Federation, its
local organizations, public advertising in print, radio, and television media opportunities and direct distribution
of promotional materials and paper surveys. Incentive draw prizes were offered to improve the response
rate.
Paper survey data were manually entered into the same database as the online survey for analysis.
As confidentiality of respondents was critical to involvement of target groups, question skipping was
permitted.
To achieve a goal of 95% confidence interval with an error rate of +/- 5% (19 times out of 20), a response
sample size of 380 was required (with reported sub-groups requiring a minimum of 40 respondents to ensure
confidence interval and respondent anonymity in smaller schools/communities.)
Limitations
The Prince Edward Island Home and School Federation and its local Associations tend to attract “engaged”
parents. It can be anticipated that respondents to their call for participation would result in more responses
from engaged parents.
The online survey was promoted as the primary access point to the survey, but to account for lack of high-
speed internet access, paper surveys were distributed by local Home and School Association members
(leading to some selection in the distribution process) and paper surveys were available on request.
Although a multi-phase communications strategy was used to promote the survey, and underrepresented
groups were targeted for the second wave of communications, the Western School Board was
underrepresented in the final numbers.
As the survey was voluntary, not directly connected to the schools, and relatively long, there is a self-selection
bias attached to this survey. This survey would not be easily completed by parents with low literacy.

3
The data used in the analysis are based on self-reports and were not validated against objective criteria or
by direct observation. Although self-reporting has limitations, due to the nature of this survey, responses were
necessarily subjective and based on individual perception.
The data reported is unweighted. Cells of under 40 are not reported in detail in this report. Question skipping
of under 10% (70 respondents) was deemed an acceptable rate and will not be noted in the report.
Due to rounding, not all percentage breakdowns will equal 100%.
Sample
According to 2006 census data, there were just over 23,000 families with children aged 5-17 at home. A
total of 712 e-surveys were completed as were 39 hard copies for a total of 751 submitted surveys. Forty
seven (47) surveys were removed from the final count as respondents completed less than ¼ of the survey.
The final participant inclusion number was 704 respondents, including 11 respondents with children in the
French Language School Board, private schools, or alternative school programs. The 704 represents
approximately 3% of the population of parents of school-aged children.
The ratio of parents in the Eastern School District to Western School Board stands at 2:1. The results of this
survey included 544 respondents from the Eastern School District and 149 from the Western School Board, a
ratio of approximately 4:1.
Interpretation
Interpretation of survey results is limited in this report to the identification of issues that might bear further
investigation. Results reported focus on areas of significance that would require further analysis to confirm or
refute statistical significance or possible relationships. The author, in consultation with the Advisory Committee,
has recommended relationships that may make a good starting point for future data analysis.
4
RESULTS
According to Joyce Epstein, Director of the Center of School, Family and Community Partnerships at Johns
Hopkins University, parent involvement in education can be categorized into six types: (Epstein, 1997)
1. Parenting-- Families take care of the health and safety of children, and maintain a home
environment that encourages learning and good behaviour in school.
2. Communicating-- Schools reach out to families with information about programs, student progress
and transitions to higher grades.
3. Volunteering-- Parents make significant contributions to the life of the school.
4. Learning at home-- Family members help their children with homework assignments and other
school-related activities.
5. Decision-making-- Schools may include parents in decision-making about their own children or
involve them in school decisions through School Councils, committees and regional School Councils.
Parents may also join independent community groups to work for improvements in education.
6. Collaborating with the community-- Schools can help to link families with support services offered
by other agencies, such as healthcare, cultural events, tutoring services, and after-school child-care
programs. They also can help families, students and community groups provide services to the
community.
Parents of school-aged children on Prince Edward Island were asked a series of questions that sought
responses in areas of parent involvement of interest to the Prince Edward Island Home and School Federation.
Areas of interest included communications with the school system, involvement in school-based activities,
satisfaction with parent-teacher meetings, school response to students’ special needs, learning outside of the
school, homework issues, parent involvement in volunteering for the school, and full-day vs. half-day
kindergarten.
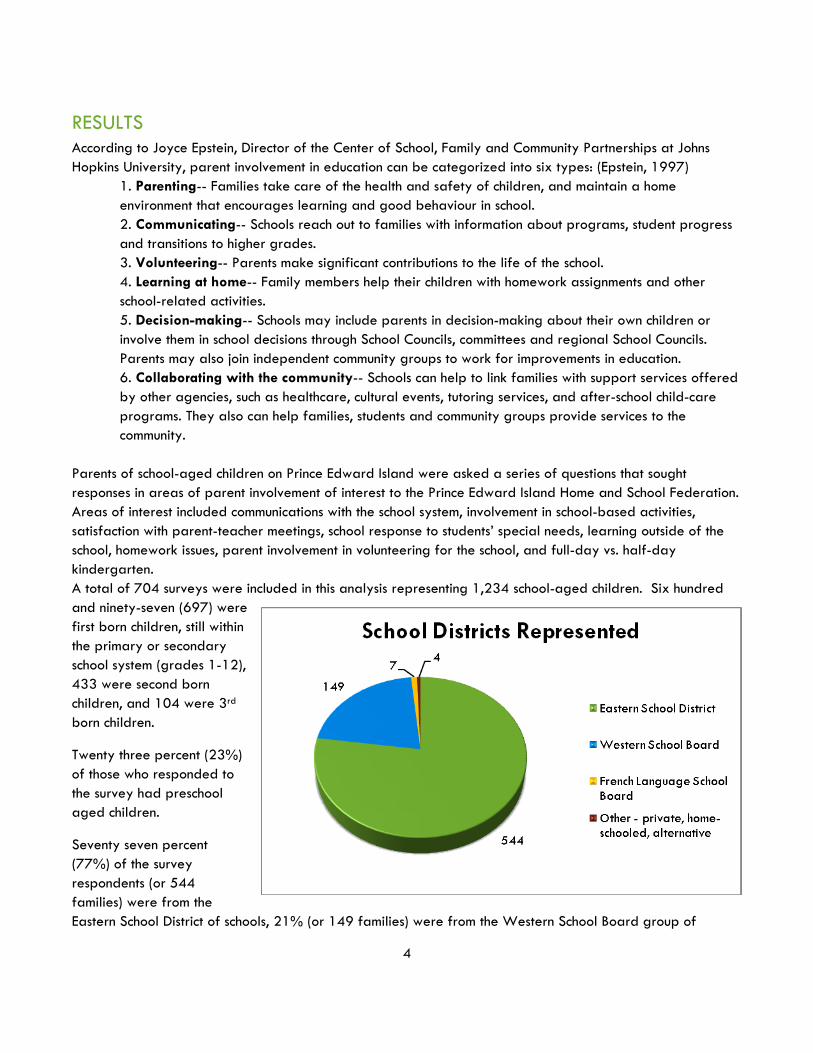
A total of 704 surveys were included in this analysis representing 1,234 school-aged children. Six hundred
and ninety-seven (697) were
first born children, still within
the primary or secondary
school system (grades 1-12),
433 were second born
children, and 104 were 3rd
born children.
Twenty three percent (23%)
of those who responded to
the survey had preschool
aged children.
Seventy seven percent
(77%) of the survey
respondents (or 544
families) were from the
Eastern School District of schools, 21% (or 149 families) were from the Western School Board group of
5
schools, and less than 2% (or 11 families) were from the French Language School Board or other school
options (private schools, home-schools, or alternative education programs.)
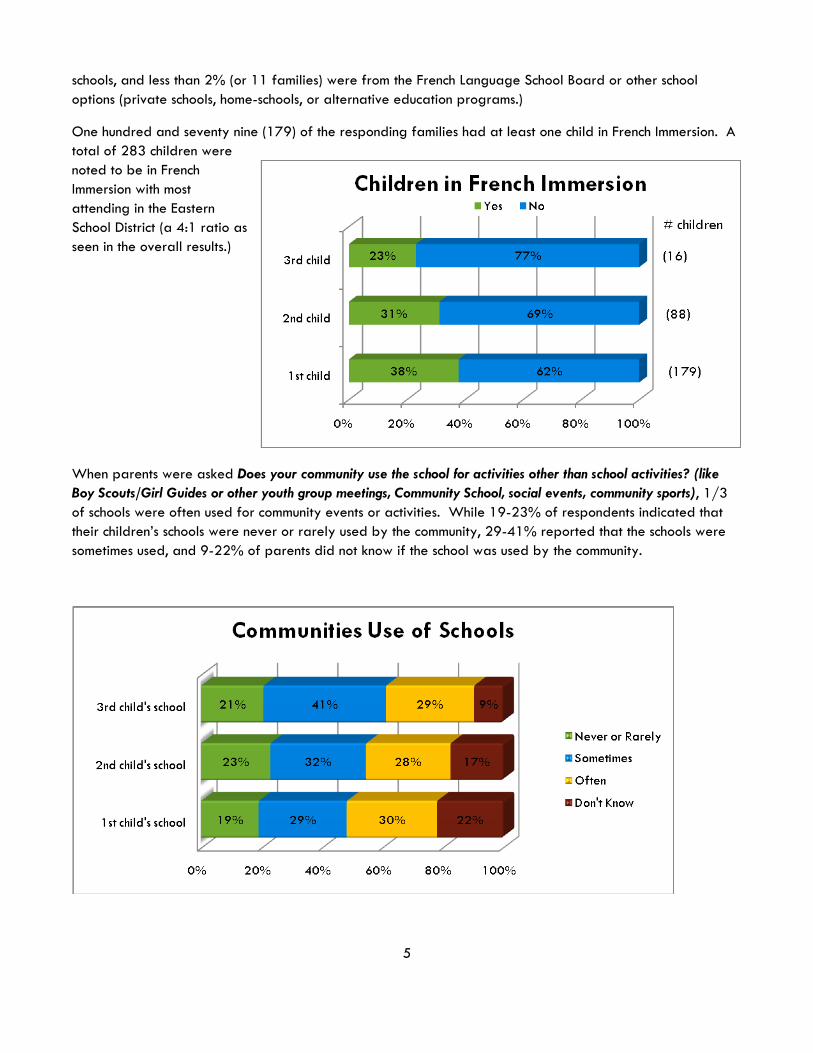
One hundred and seventy nine (179) of the responding families had at least one child in French Immersion. A
total of 283 children were
noted to be in French
Immersion with most
attending in the Eastern
School District (a 4:1 ratio as
seen in the overall results.)
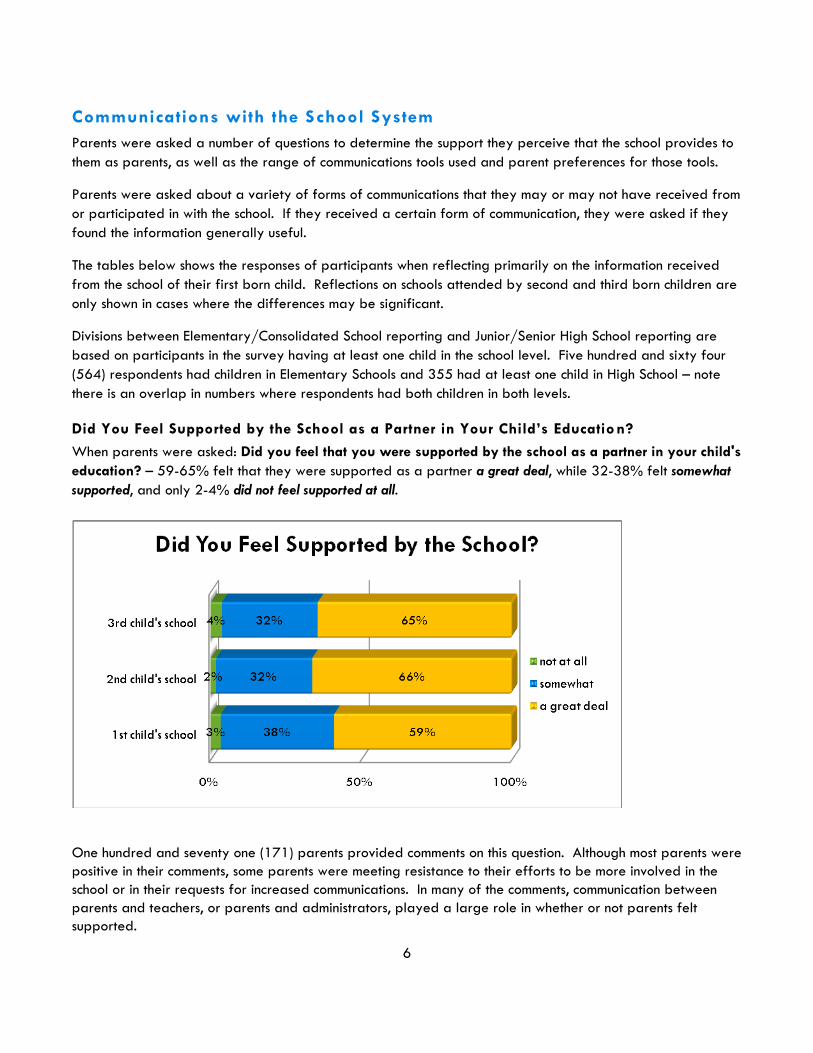
When parents were asked Does your community use the school for activities other than school activities? (like
Boy Scouts/Girl Guides or other youth group meetings, Community School, social events, community sports), 1/3
of schools were often used for community events or activities. While 19-23% of respondents indicated that
their children’s schools were never or rarely used by the community, 29-41% reported that the schools were
sometimes used, and 9-22% of parents did not know if the school was used by the community.
6
Communications with the School System
Parents were asked a number of questions to determine the support they perceive that the school provides to
them as parents, as well as the range of communications tools used and parent preferences for those tools.
Parents were asked about a variety of forms of communications that they may or may not have received from
or participated in with the school. If they received a certain form of communication, they were asked if they
found the information generally useful.
The tables below shows the responses of participants when reflecting primarily on the information received
from the school of their first born child. Reflections on schools attended by second and third born children are
only shown in cases where the differences may be significant.
Divisions between Elementary/Consolidated School reporting and Junior/Senior High School reporting are
based on participants in the survey having at least one child in the school level. Five hundred and sixty four
(564) respondents had children in Elementary Schools and 355 had at least one child in High School – note
there is an overlap in numbers where respondents had both children in both levels.
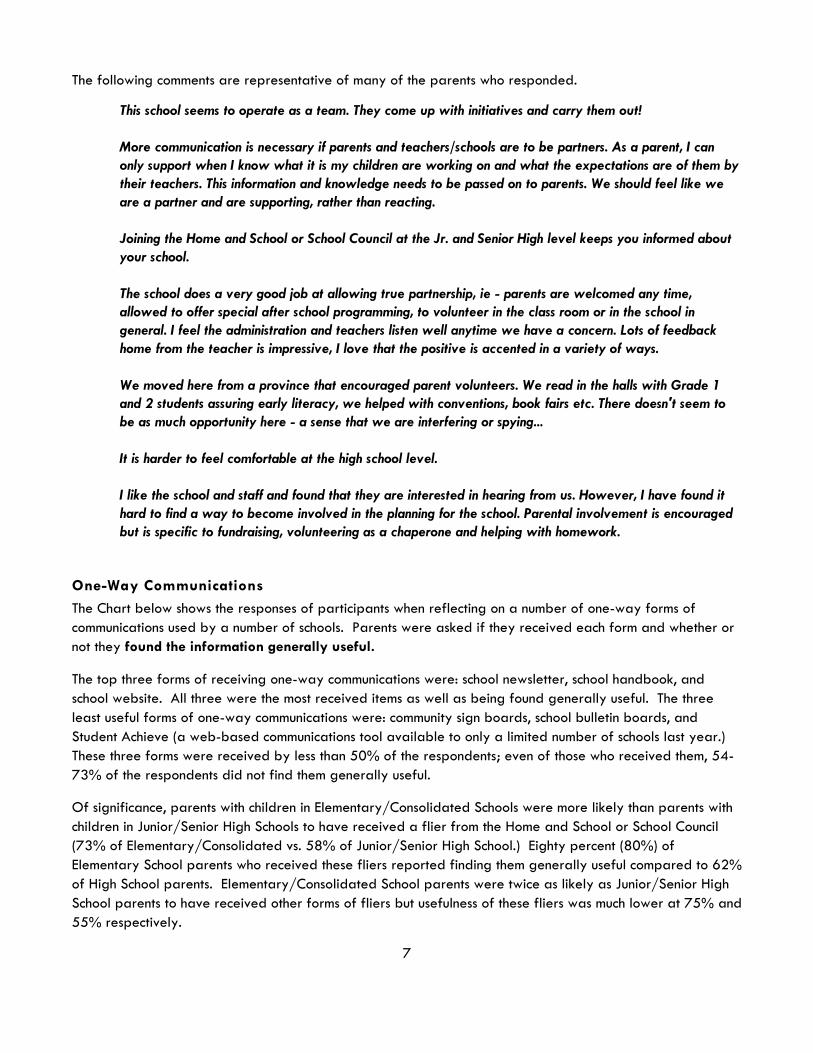
Did You Feel Supported by the School as a Partner in Your Child’s Education?
When parents were asked: Did you feel that you were supported by the school as a partner in your child's
education? – 59-65% felt that they were supported as a partner a great deal, while 32-38% felt somewhat
supported, and only 2-4% did not feel supported at all.
One hundred and seventy one (171) parents provided comments on this question. Although most parents were
positive in their comments, some parents were meeting resistance to their efforts to be more involved in the
school or in their requests for increased communications. In many of the comments, communication between
parents and teachers, or parents and administrators, played a large role in whether or not parents felt
supported.
7
The following comments are representative of many of the parents who responded.
This school seems to operate as a team. They come up with initiatives and carry them out!
More communication is necessary if parents and teachers/schools are to be partners. As a parent, I can
only support when I know what it is my children are working on and what the expectations are of them by
their teachers. This information and knowledge needs to be passed on to parents. We should feel like we
are a partner and are supporting, rather than reacting.
Joining the Home and School or School Council at the Jr. and Senior High level keeps you informed about
your school.
The school does a very good job at allowing true partnership, ie - parents are welcomed any time,
allowed to offer special after school programming, to volunteer in the class room or in the school in
general. I feel the administration and teachers listen well anytime we have a concern. Lots of feedback
home from the teacher is impressive, I love that the positive is accented in a variety of ways.
We moved here from a province that encouraged parent volunteers. We read in the halls with Grade 1
and 2 students assuring early literacy, we helped with conventions, book fairs etc. There doesn't seem to
be as much opportunity here - a sense that we are interfering or spying...
It is harder to feel comfortable at the high school level.
I like the school and staff and found that they are interested in hearing from us. However, I have found it
hard to find a way to become involved in the planning for the school. Parental involvement is encouraged
but is specific to fundraising, volunteering as a chaperone and helping with homework.
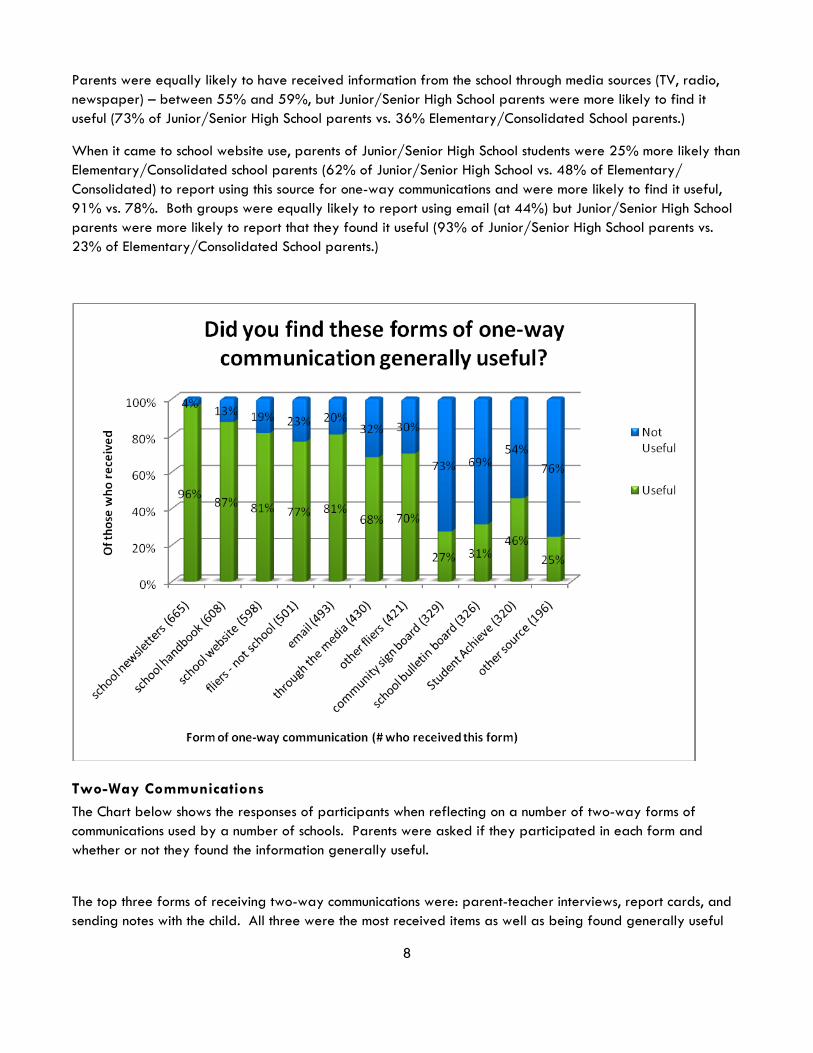
One-Way Communications
The Chart below shows the responses of participants when reflecting on a number of one-way forms of
communications used by a number of schools. Parents were asked if they received each form and whether or
not they found the information generally useful.
The top three forms of receiving one-way communications were: school newsletter, school handbook, and
school website. All three were the most received items as well as being found generally useful. The three
least useful forms of one-way communications were: community sign boards, school bulletin boards, and
Student Achieve (a web-based communications tool available to only a limited number of schools last year.)
These three forms were received by less than 50% of the respondents; even of those who received them, 54-
73% of the respondents did not find them generally useful.
Of significance, parents with children in Elementary/Consolidated Schools were more likely than parents with
children in Junior/Senior High Schools to have received a flier from the Home and School or School Council
(73% of Elementary/Consolidated vs. 58% of Junior/Senior High School.) Eighty percent (80%) of
Elementary School parents who received these fliers reported finding them generally useful compared to 62%
of High School parents. Elementary/Consolidated School parents were twice as likely as Junior/Senior High
School parents to have received other forms of fliers but usefulness of these fliers was much lower at 75% and
55% respectively.
8
Parents were equally likely to have received information from the school through media sources (TV, radio,
newspaper) – between 55% and 59%, but Junior/Senior High School parents were more likely to find it
useful (73% of Junior/Senior High School parents vs. 36% Elementary/Consolidated School parents.)
When it came to school website use, parents of Junior/Senior High School students were 25% more likely than
Elementary/Consolidated school parents (62% of Junior/Senior High School vs. 48% of Elementary/
Consolidated) to report using this source for one-way communications and were more likely to find it useful,
91% vs. 78%. Both groups were equally likely to report using email (at 44%) but Junior/Senior High School
parents were more likely to report that they found it useful (93% of Junior/Senior High School parents vs.
23% of Elementary/Consolidated School parents.)
Two-Way Communications
The Chart below shows the responses of participants when reflecting on a number of two-way forms of
communications used by a number of schools. Parents were asked if they participated in each form and
whether or not they found the information generally useful.
The top three forms of receiving two-way communications were: parent-teacher interviews, report cards, and
sending notes with the child. All three were the most received items as well as being found generally useful
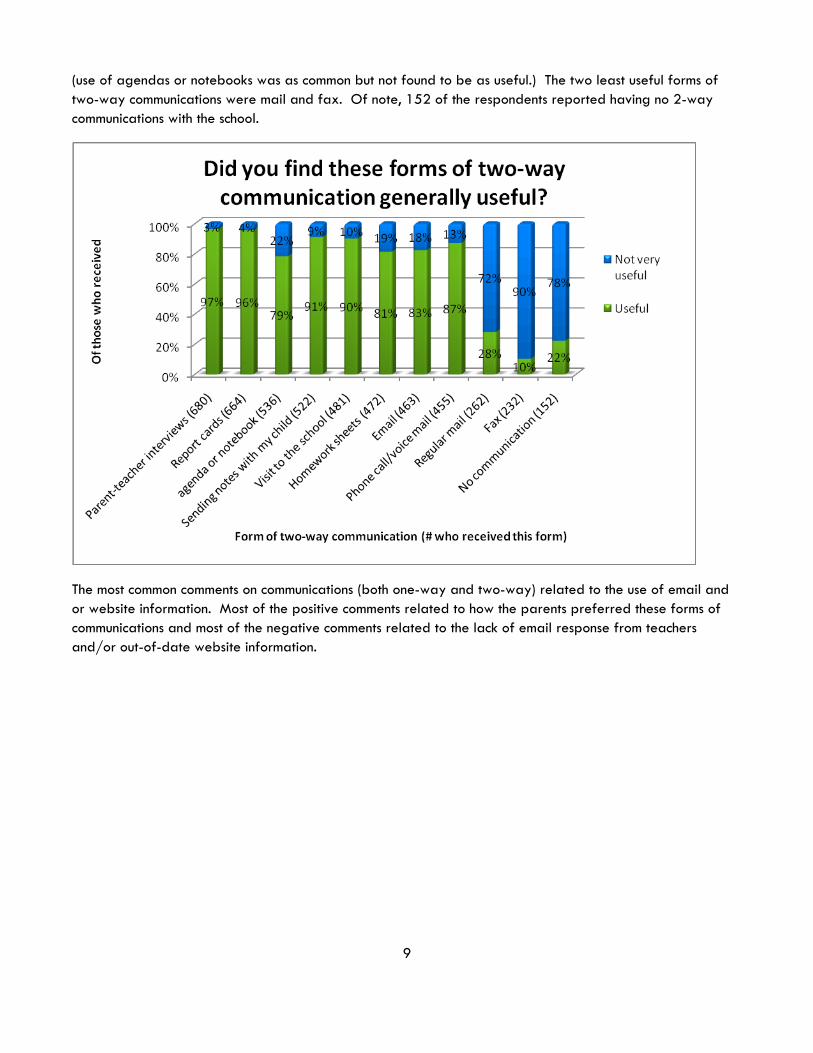
9
(use of agendas or notebooks was as common but not found to be as useful.) The two least useful forms of
two-way communications were mail and fax. Of note, 152 of the respondents reported having no 2-way
communications with the school.
The most common comments on communications (both one-way and two-way) related to the use of email and
or website information. Most of the positive comments related to how the parents preferred these forms of
communications and most of the negative comments related to the lack of email response from teachers
and/or out-of-date website information.
10
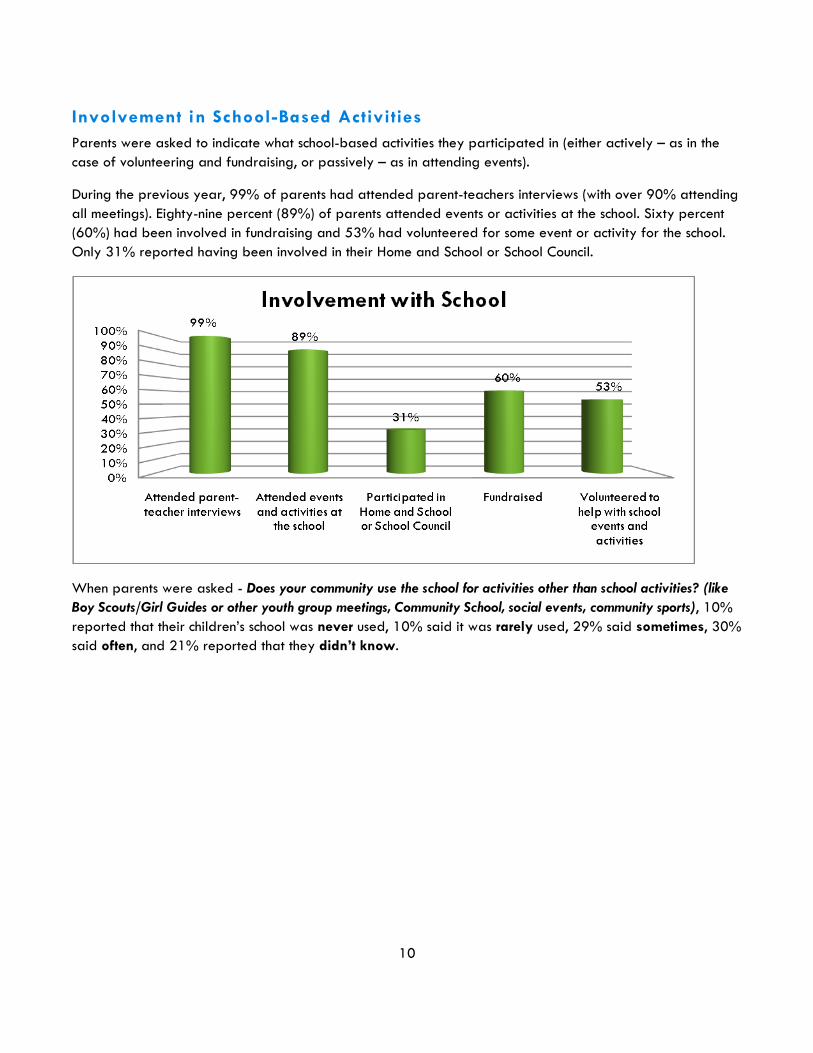
Involvement in School-Based Activities
Parents were asked to indicate what school-based activities they participated in (either actively – as in the
case of volunteering and fundraising, or passively – as in attending events).
During the previous year, 99% of parents had attended parent-teachers interviews (with over 90% attending
all meetings). Eighty-nine percent (89%) of parents attended events or activities at the school. Sixty percent
(60%) had been involved in fundraising and 53% had volunteered for some event or activity for the school.
Only 31% reported having been involved in their Home and School or School Council.
When parents were asked - Does your community use the school for activities other than school activities? (like
Boy Scouts/Girl Guides or other youth group meetings, Community School, social events, community sports), 10%
reported that their children’s school was never used, 10% said it was rarely used, 29% said sometimes, 30%
said often, and 21% reported that they didn’t know.
11
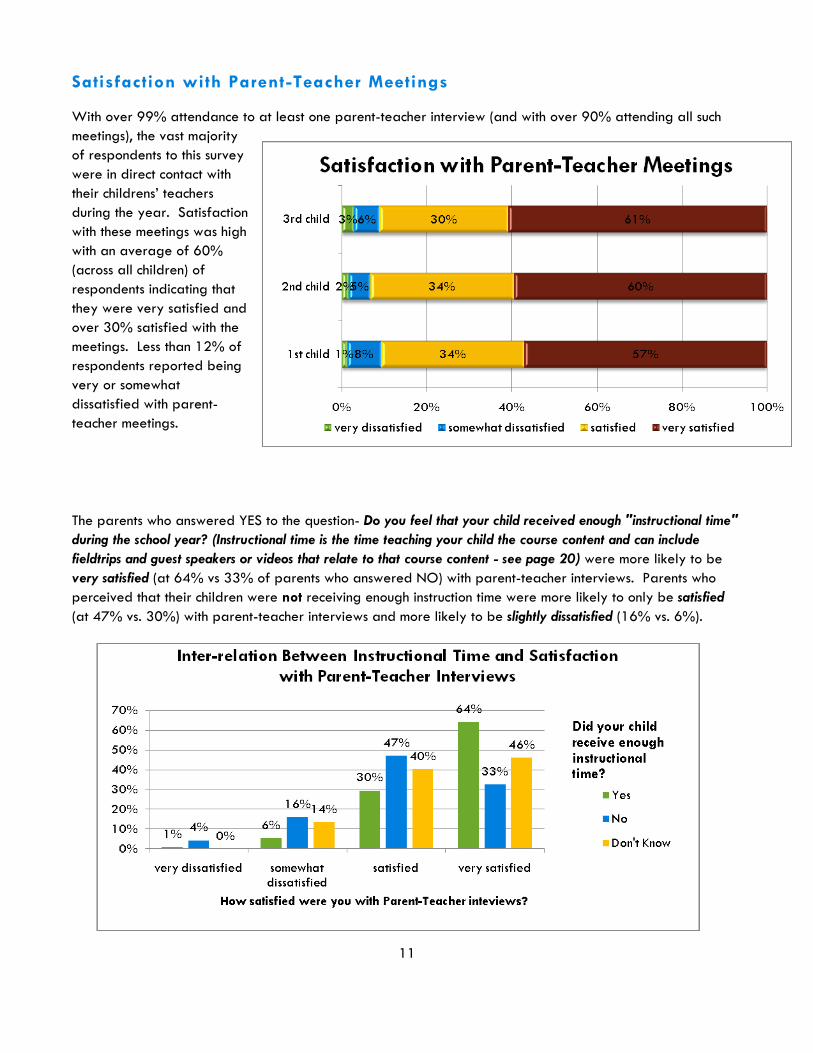
Satisfaction with Parent-Teacher Meetings
With over 99% attendance to at least one parent-teacher interview (and with over 90% attending all such
meetings), the vast majority
of respondents to this survey
were in direct contact with
their childrens’ teachers
during the year. Satisfaction
with these meetings was high
with an average of 60%
(across all children) of
respondents indicating that
they were very satisfied and
over 30% satisfied with the
meetings. Less than 12% of
respondents reported being
very or somewhat
dissatisfied with parent-
teacher meetings.
The parents who answered YES to the question- Do you feel that your child received enough "instructional time"
during the school year? (Instructional time is the time teaching your child the course content and can include
fieldtrips and guest speakers or videos that relate to that course content - see page 20) were more likely to be
very satisfied (at 64% vs 33% of parents who answered NO) with parent-teacher interviews. Parents who
perceived that their children were not receiving enough instruction time were more likely to only be satisfied
(at 47% vs. 30%) with parent-teacher interviews and more likely to be slightly dissatisfied (16% vs. 6%).
12
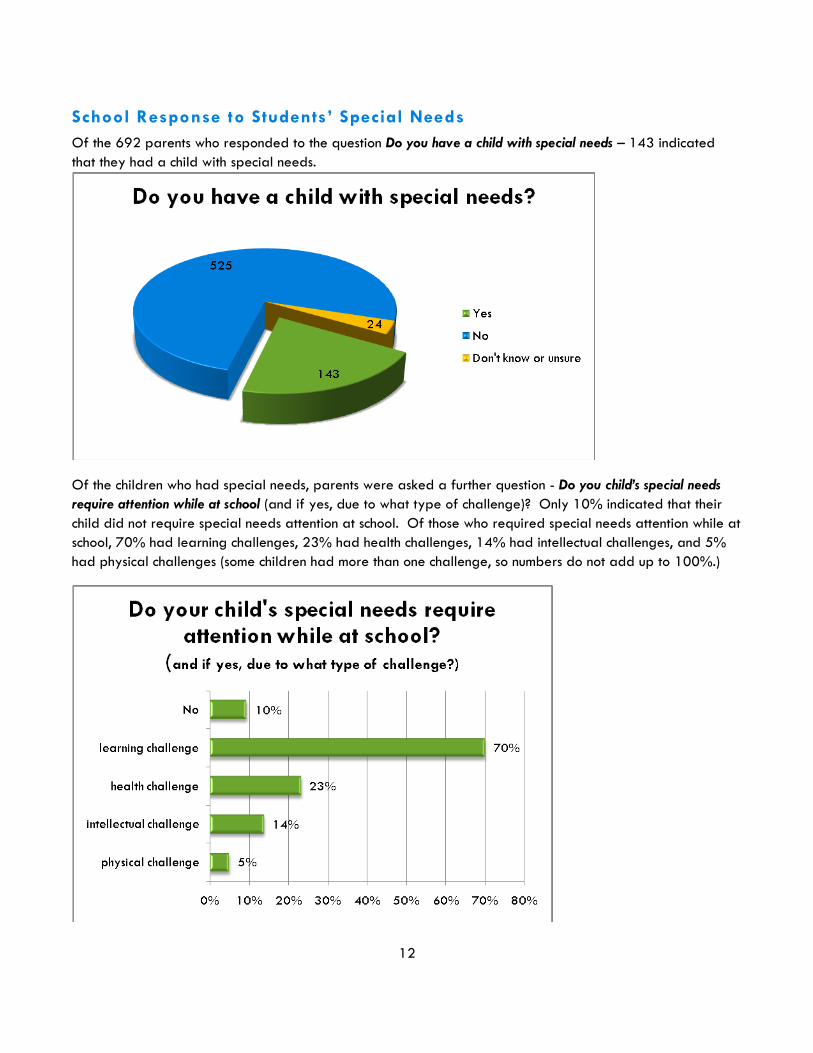
School Response to Students’ Special Needs
Of the 692 parents who responded to the question Do you have a child with special needs – 143 indicated
that they had a child with special needs.
Of the children who had special needs, parents were asked a further question - Do you child’s special needs
require attention while at school (and if yes, due to what type of challenge)? Only 10% indicated that their
child did not require special needs attention at school. Of those who required special needs attention while at
school, 70% had learning challenges, 23% had health challenges, 14% had intellectual challenges, and 5%
had physical challenges (some children had more than one challenge, so numbers do not add up to 100%.)
13
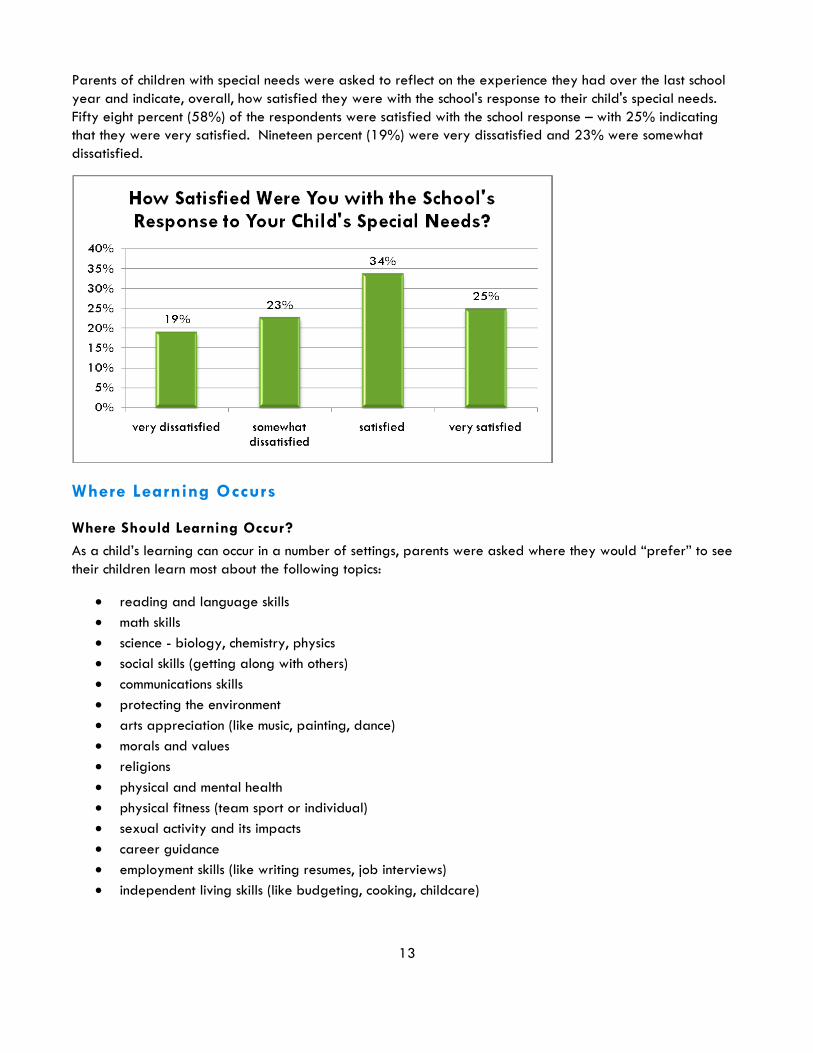
Parents of children with special needs were asked to reflect on the experience they had over the last school
year and indicate, overall, how satisfied they were with the school's response to their child's special needs.
Fifty eight percent (58%) of the respondents were satisfied with the school response – with 25% indicating
that they were very satisfied. Nineteen percent (19%) were very dissatisfied and 23% were somewhat
dissatisfied.
Where Learning Occurs
Where Should Learning Occur?
As a child’s learning can occur in a number of settings, parents were asked where they would “prefer” to see
their children learn most about the following topics:
reading and language skills
math skills
science - biology, chemistry, physics
social skills (getting along with others)
communications skills
protecting the environment
arts appreciation (like music, painting, dance)
morals and values
religions
physical and mental health
physical fitness (team sport or individual)
sexual activity and its impacts
career guidance
employment skills (like writing resumes, job interviews)
independent living skills (like budgeting, cooking, childcare)
14
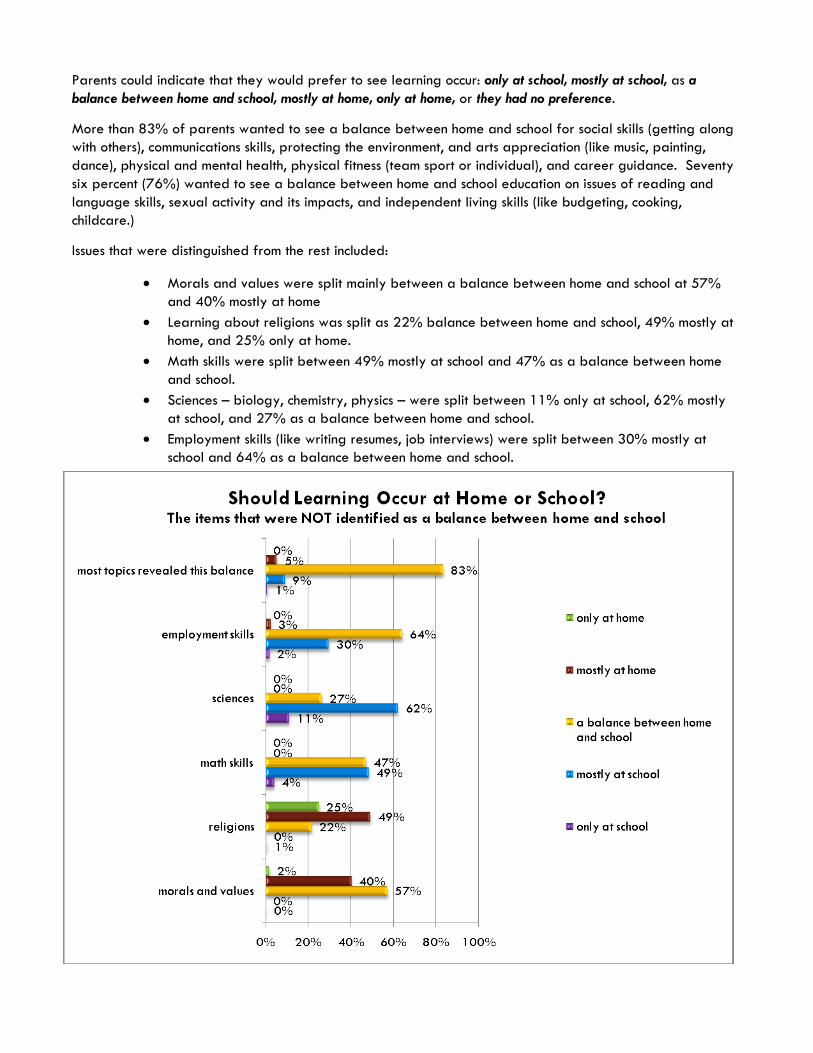
Parents could indicate that they would prefer to see learning occur: only at school, mostly at school, as a
balance between home and school, mostly at home, only at home, or they had no preference.
More than 83% of parents wanted to see a balance between home and school for social skills (getting along
with others), communications skills, protecting the environment, and arts appreciation (like music, painting,
dance), physical and mental health, physical fitness (team sport or individual), and career guidance. Seventy
six percent (76%) wanted to see a balance between home and school education on issues of reading and
language skills, sexual activity and its impacts, and independent living skills (like budgeting, cooking,
childcare.)
Issues that were distinguished from the rest included:
Morals and values were split mainly between a balance between home and school at 57%
and 40% mostly at home
Learning about religions was split as 22% balance between home and school, 49% mostly at
home, and 25% only at home.
Math skills were split between 49% mostly at school and 47% as a balance between home
and school.
Sciences – biology, chemistry, physics – were split between 11% only at school, 62% mostly
at school, and 27% as a balance between home and school.
Employment skills (like writing resumes, job interviews) were split between 30% mostly at
school and 64% as a balance between home and school.
15
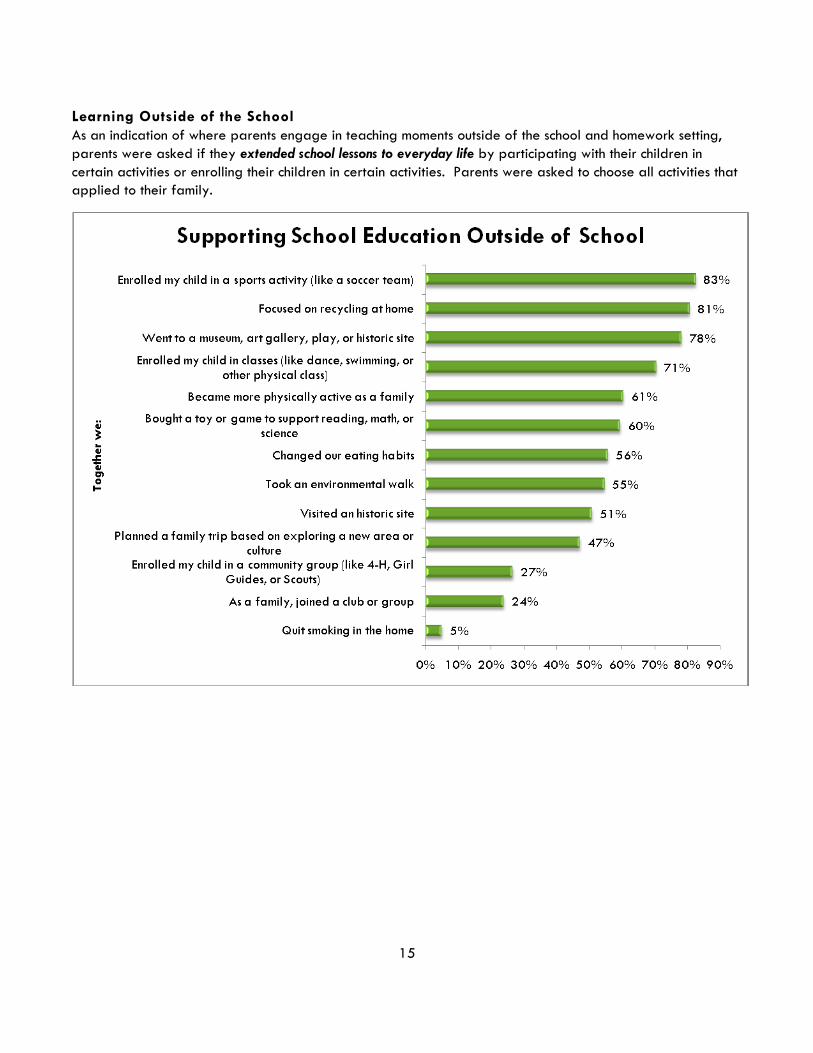
Learning Outside of the School
As an indication of where parents engage in teaching moments outside of the school and homework setting,
parents were asked if they extended school lessons to everyday life by participating with their children in
certain activities or enrolling their children in certain activities. Parents were asked to choose all activities that
applied to their family.
16
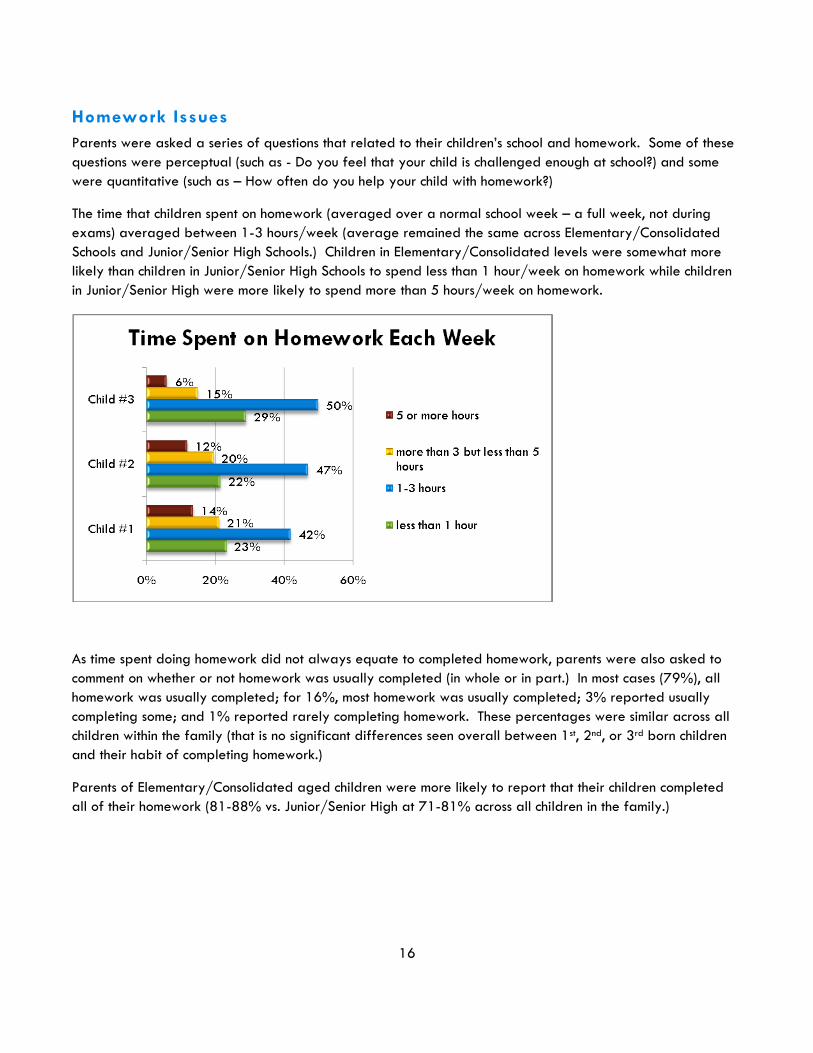
Homework Issues
Parents were asked a series of questions that related to their children’s school and homework. Some of these
questions were perceptual (such as - Do you feel that your child is challenged enough at school?) and some
were quantitative (such as – How often do you help your child with homework?)
The time that children spent on homework (averaged over a normal school week – a full week, not during
exams) averaged between 1-3 hours/week (average remained the same across Elementary/Consolidated
Schools and Junior/Senior High Schools.) Children in Elementary/Consolidated levels were somewhat more
likely than children in Junior/Senior High Schools to spend less than 1 hour/week on homework while children
in Junior/Senior High were more likely to spend more than 5 hours/week on homework.
As time spent doing homework did not always equate to completed homework, parents were also asked to
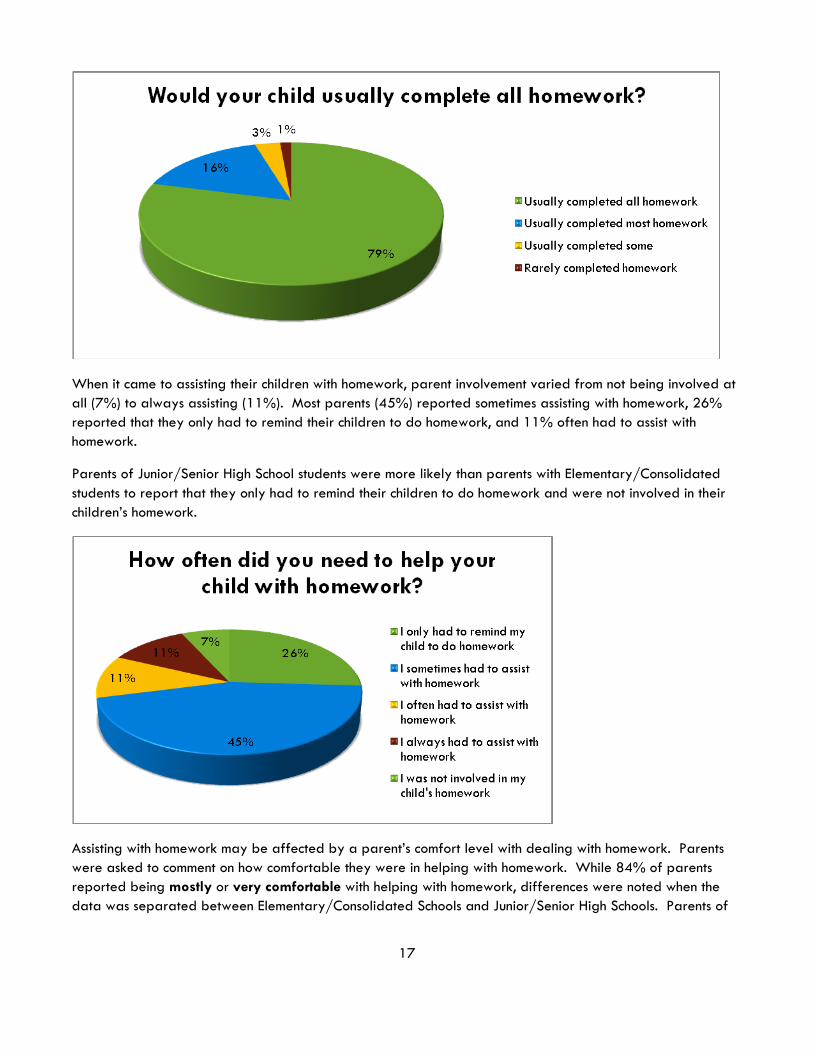
comment on whether or not homework was usually completed (in whole or in part.) In most cases (79%), all
homework was usually completed; for 16%, most homework was usually completed; 3% reported usually
completing some; and 1% reported rarely completing homework. These percentages were similar across all
children within the family (that is no significant differences seen overall between 1st, 2nd, or 3rd born children
and their habit of completing homework.)
Parents of Elementary/Consolidated aged children were more likely to report that their children completed
all of their homework (81-88% vs. Junior/Senior High at 71-81% across all children in the family.)
17
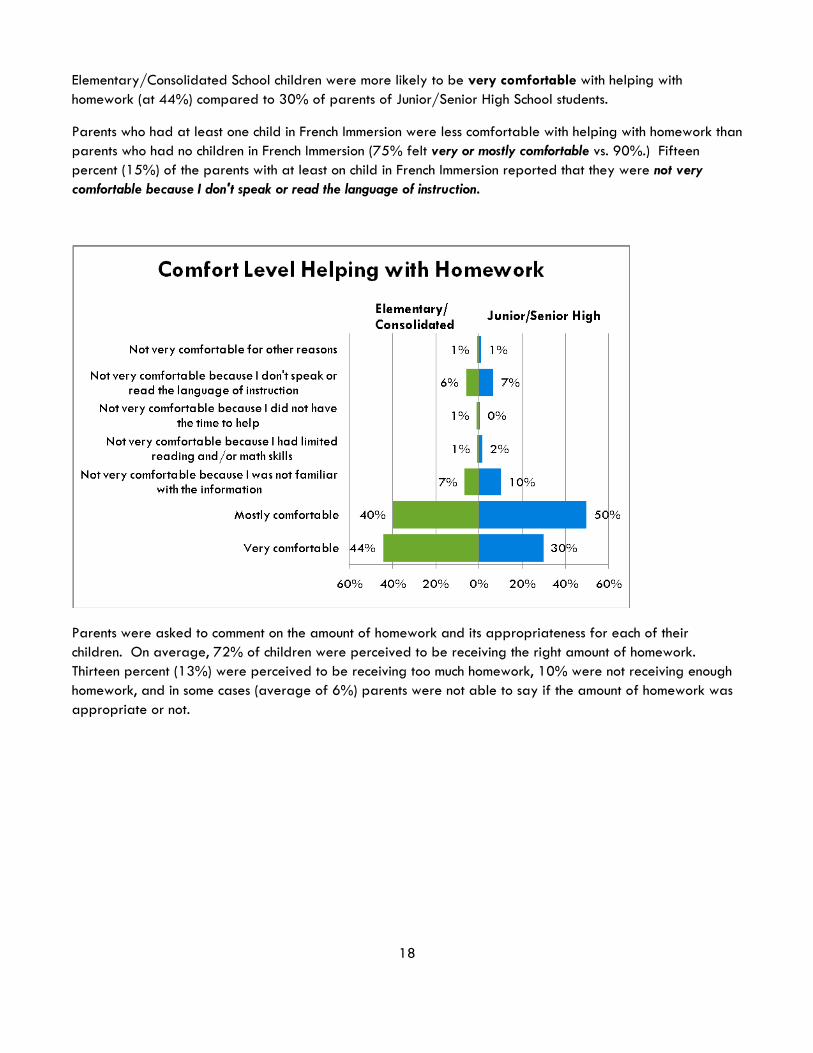
When it came to assisting their children with homework, parent involvement varied from not being involved at
all (7%) to always assisting (11%). Most parents (45%) reported sometimes assisting with homework, 26%
reported that they only had to remind their children to do homework, and 11% often had to assist with
homework.
Parents of Junior/Senior High School students were more likely than parents with Elementary/Consolidated
students to report that they only had to remind their children to do homework and were not involved in their
children’s homework.
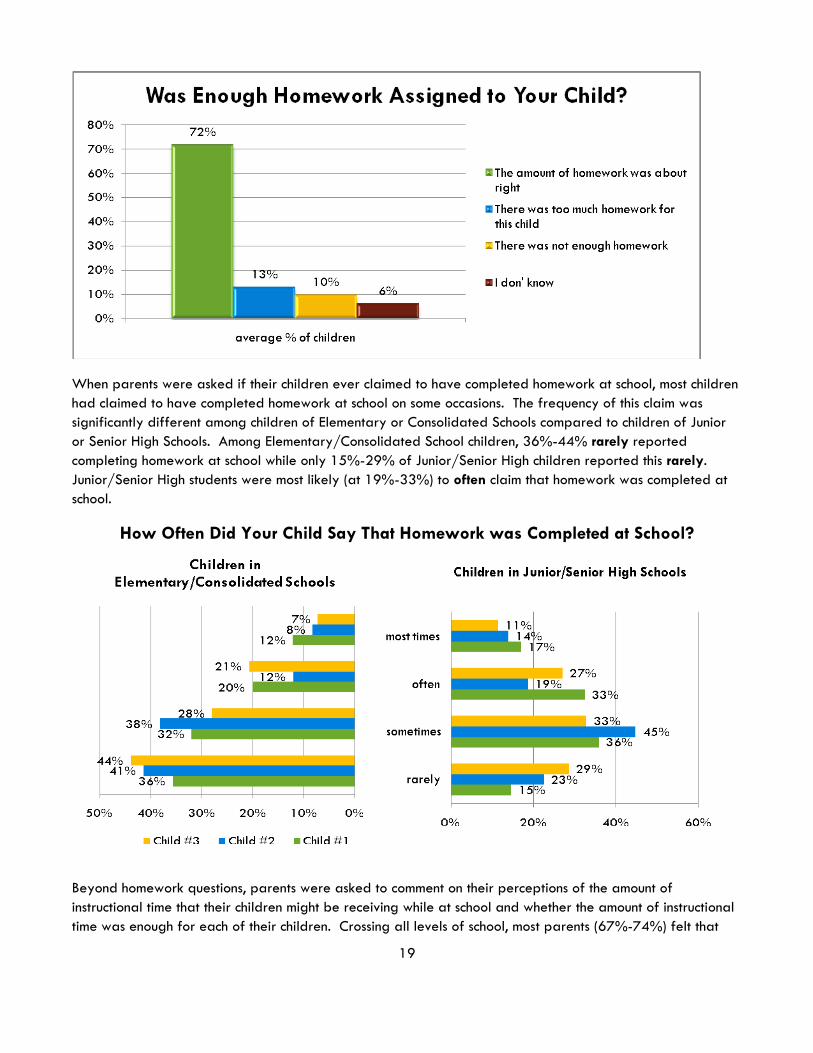
Assisting with homework may be affected by a parent’s comfort level with dealing with homework. Parents
were asked to comment on how comfortable they were in helping with homework. While 84% of parents
reported being mostly or very comfortable with helping with homework, differences were noted when the
data was separated between Elementary/Consolidated Schools and Junior/Senior High Schools. Parents of
18
Elementary/Consolidated School children were more likely to be very comfortable with helping with
homework (at 44%) compared to 30% of parents of Junior/Senior High School students.
Parents who had at least one child in French Immersion were less comfortable with helping with homework than
parents who had no children in French Immersion (75% felt very or mostly comfortable vs. 90%.) Fifteen
percent (15%) of the parents with at least on child in French Immersion reported that they were not very
comfortable because I don't speak or read the language of instruction.
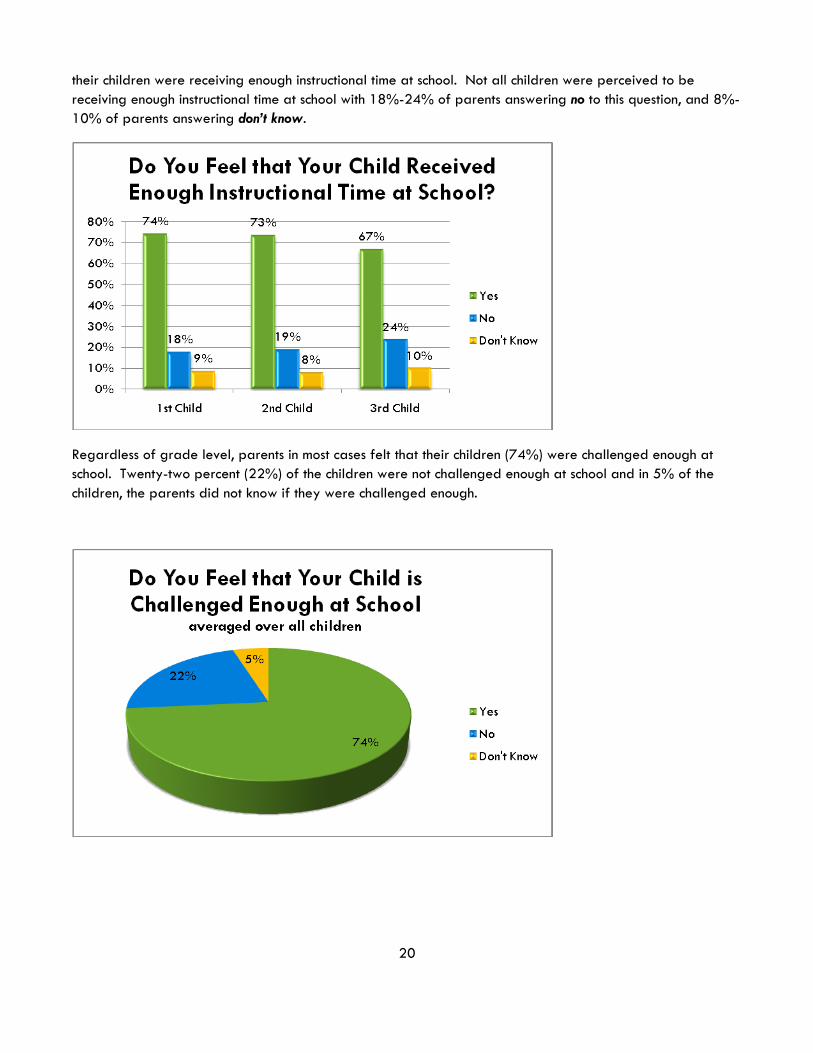
Parents were asked to comment on the amount of homework and its appropriateness for each of their
children. On average, 72% of children were perceived to be receiving the right amount of homework.
Thirteen percent (13%) were perceived to be receiving too much homework, 10% were not receiving enough
homework, and in some cases (average of 6%) parents were not able to say if the amount of homework was
appropriate or not.
19
When parents were asked if their children ever claimed to have completed homework at school, most children
had claimed to have completed homework at school on some occasions. The frequency of this claim was
significantly different among children of Elementary or Consolidated Schools compared to children of Junior
or Senior High Schools. Among Elementary/Consolidated School children, 36%-44% rarely reported
completing homework at school while only 15%-29% of Junior/Senior High children reported this rarely.
Junior/Senior High students were most likely (at 19%-33%) to often claim that homework was completed at
school.
How Often Did Your Child Say That Homework was Completed at School?
Beyond homework questions, parents were asked to comment on their perceptions of the amount of
instructional time that their children might be receiving while at school and whether the amount of instructional
time was enough for each of their children. Crossing all levels of school, most parents (67%-74%) felt that
20
their children were receiving enough instructional time at school. Not all children were perceived to be
receiving enough instructional time at school with 18%-24% of parents answering no to this question, and 8%-
10% of parents answering don’t know.
Regardless of grade level, parents in most cases felt that their children (74%) were challenged enough at
school. Twenty-two percent (22%) of the children were not challenged enough at school and in 5% of the
children, the parents did not know if they were challenged enough.
21
Parent Involvement in Volunteering for the School
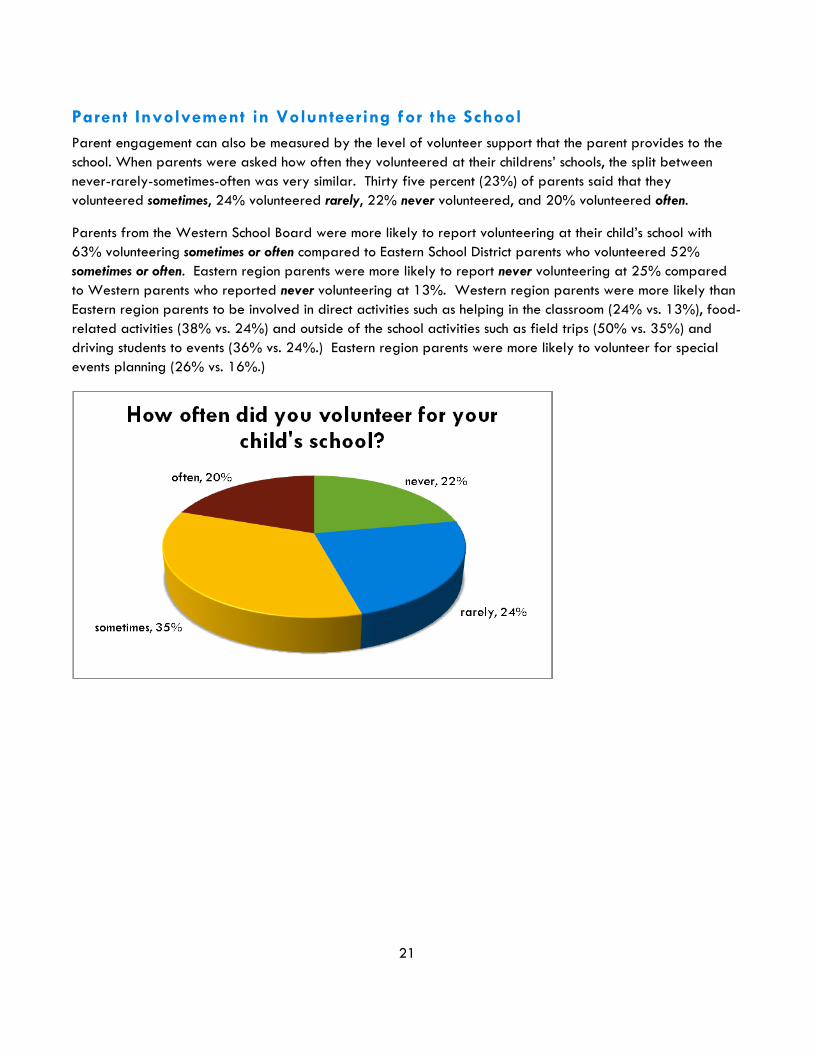
Parent engagement can also be measured by the level of volunteer support that the parent provides to the
school. When parents were asked how often they volunteered at their childrens’ schools, the split between
never-rarely-sometimes-often was very similar. Thirty five percent (23%) of parents said that they
volunteered sometimes, 24% volunteered rarely, 22% never volunteered, and 20% volunteered often.
Parents from the Western School Board were more likely to report volunteering at their child’s school with
63% volunteering sometimes or often compared to Eastern School District parents who volunteered 52%
sometimes or often. Eastern region parents were more likely to report never volunteering at 25% compared
to Western parents who reported never volunteering at 13%. Western region parents were more likely than
Eastern region parents to be involved in direct activities such as helping in the classroom (24% vs. 13%), food-
related activities (38% vs. 24%) and outside of the school activities such as field trips (50% vs. 35%) and
driving students to events (36% vs. 24%.) Eastern region parents were more likely to volunteer for special
events planning (26% vs. 16%.)
22
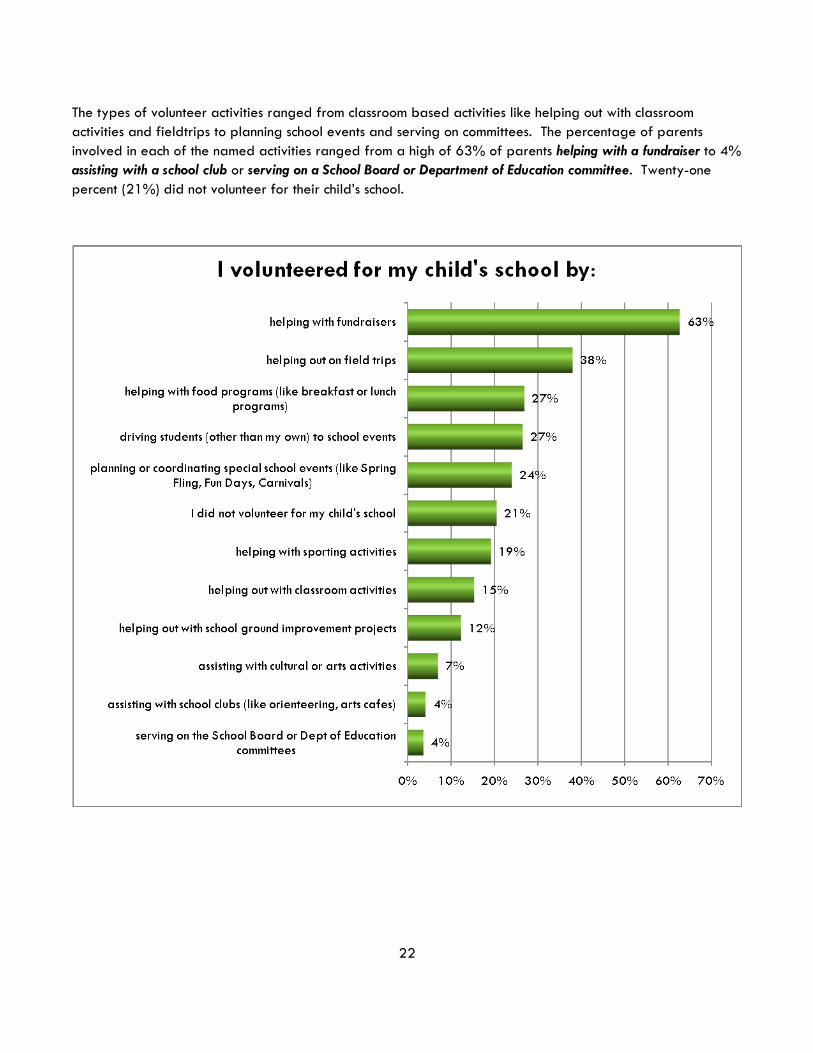
The types of volunteer activities ranged from classroom based activities like helping out with classroom
activities and fieldtrips to planning school events and serving on committees. The percentage of parents
involved in each of the named activities ranged from a high of 63% of parents helping with a fundraiser to 4%
assisting with a school club or serving on a School Board or Department of Education committee. Twenty-one
percent (21%) did not volunteer for their child’s school.
23
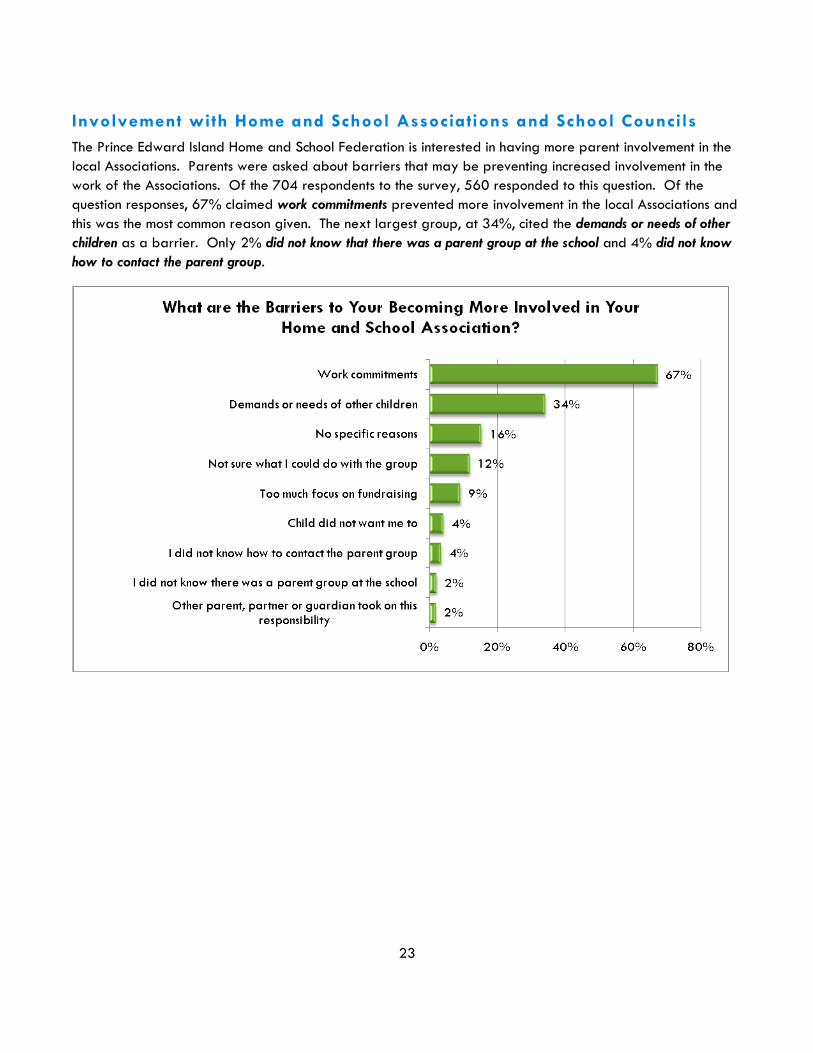
Involvement with Home and School Associations and School Councils
The Prince Edward Island Home and School Federation is interested in having more parent involvement in the
local Associations. Parents were asked about barriers that may be preventing increased involvement in the
work of the Associations. Of the 704 respondents to the survey, 560 responded to this question. Of the
question responses, 67% claimed work commitments prevented more involvement in the local Associations and
this was the most common reason given. The next largest group, at 34%, cited the demands or needs of other
children as a barrier. Only 2% did not know that there was a parent group at the school and 4% did not know
how to contact the parent group.
24
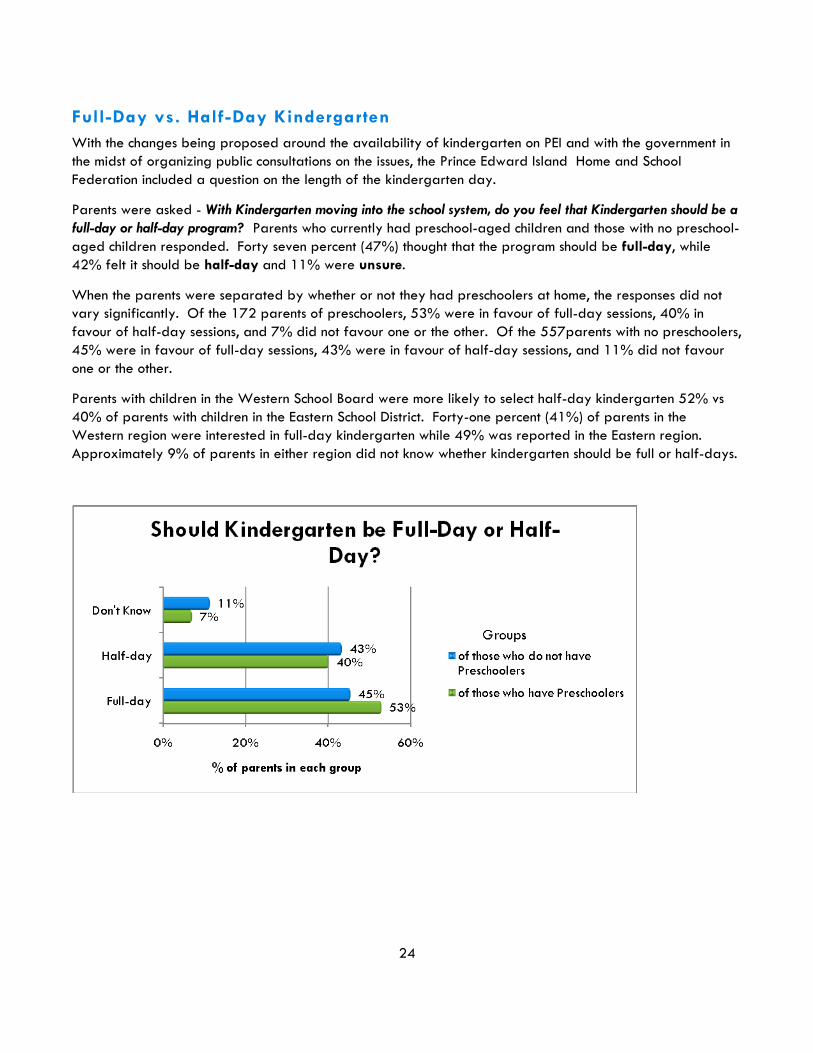
Full-Day vs. Half-Day Kindergarten
With the changes being proposed around the availability of kindergarten on PEI and with the government in
the midst of organizing public consultations on the issues, the Prince Edward Island Home and School
Federation included a question on the length of the kindergarten day.
Parents were asked - With Kindergarten moving into the school system, do you feel that Kindergarten should be a
full-day or half-day program? Parents who currently had preschool-aged children and those with no preschool-
aged children responded. Forty seven percent (47%) thought that the program should be full-day, while
42% felt it should be half-day and 11% were unsure.
When the parents were separated by whether or not they had preschoolers at home, the responses did not
vary significantly. Of the 172 parents of preschoolers, 53% were in favour of full-day sessions, 40% in
favour of half-day sessions, and 7% did not favour one or the other. Of the 557parents with no preschoolers,
45% were in favour of full-day sessions, 43% were in favour of half-day sessions, and 11% did not favour
one or the other.
Parents with children in the Western School Board were more likely to select half-day kindergarten 52% vs
40% of parents with children in the Eastern School District. Forty-one percent (41%) of parents in the
Western region were interested in full-day kindergarten while 49% was reported in the Eastern region.
Approximately 9% of parents in either region did not know whether kindergarten should be full or half-days.

25
WORKS CITED Epstein, J. (1997, September/October). Retrieved from Harvard Education Letter:
http://www.edletter.org/past/issues/1997-so/sixtypes.shtml
Kurial, R. (2005). Excellence in Education - A Challenge for Prince Edward Island - Final Report of the Task Force
on Student Achievement. Charlottetown.
Page 1
Dear Parent,
Thank you for participating in our survey.
As parents, we want our children to receive the best possible education. This survey will tell us more about how we can support
our children's education in meaningful ways.
We welcome input from all parents of school-aged children, whether you are a birth parent, a parent by adoption or a stepparent.
When you complete the survey, you will have the chance to win weekly draws for $50 gift certificates beginning October 15. The
earlier you complete the survey, the more chances you have to win!
The PEI Home and School Federation works hard on your behalf representing parents to government, teachers, administrators, and the public. We need to hear from you.
The results of the survey will be posted on our website at: www.edu.pe.ca/peihsf
****************************************************************************************************************************************
Parent Engagement Paper Survey - Background on Your Experience
Please fill out this survey for any children you have who attended school in grades 1 - 12, last year.
We need you to reflect on a whole school year's worth of experiences. For this survey, please answer the questions as they relate to your during the LAST school
year.
1. My child attended the following school last year
(If your child changed schools during the year, choose the school attended the longest.)
Please start with your oldest child as 1st child, your next child - if any - as 2nd child, and so on. Complete for up to 3 children.
Name of Child’s School In French Immersion?
1st child Yes No
2nd child Yes No
3rd child Yes No
2. Did you feel that you were supported by the school as a partner in your child's education?
Not at all Somewhat A great deal Comments?
1st child's school
2nd child's school
3rd child's school
3. Does your community use the school for activities other than school activities? (like Boy Scouts/Girl Guides or other youth group meetings, Community
School, social events, community sports)
Never Rarely Sometimes Often Don’t Know
1st child's school o o o o o
Online format differed somewhat from this paper version. Paper version layout altered
to fit this document.
2
2nd child's school o o o o o
3rd child's school o o o o o
4. Do you have preschool aged children? Yes
No
5. With Kindergarten moving into the school system, do you feel that Kindergarten should be a full-day or half-day program?
Full-day Half-day Don’t Know Why?:
Communications
In order for parents and teachers to work together for a child's education, communication plays a very important role.
For the following questions, think about your experience during the last school year.
6. The following is a list of ONE -WAY COMMUNICATIONS tools that may have been used by your child's school (or parent's group.)
For all items that reached you, please TELL US IF YOU FOUND THE INFORMATION GENERALLY USEFUL. (Only mark those items that reached you.)
Communications Tool 1st Child’s School 2
nd Child’s School 3
rd Child’s School
school newsletters Yes No Yes No Yes No
fliers from the Home & School Association or School
Council Yes No Yes No Yes No
other fliers Yes No Yes No Yes No
school handbook Yes No Yes No Yes No
school website Yes No Yes No Yes No
school information on a community sign board Yes No Yes No Yes No
information about school through the media (TV,
Radio, newspaper, notices) Yes No Yes No Yes No
school bulletin board Yes No Yes No Yes No
email Yes No Yes No Yes No
Student Achieve Yes No Yes No Yes No
other source Yes No Yes No Yes No
If you received other forms of messaging from the school, please describe it - and was it useful?:
3
7. The following are forms of 2-WAY COMMUNICATIONS used by teachers to communicate with parents.
For the forms of communications that reached you tell us if they were, generally, USEFUL FOR YOU OR NOT. (Only mark those items that reached you.)
Communications Tool 1st Child’s School 2
nd Child’s School 3
rd Child’s School
Student agenda or communication notebook Yes No Yes No Yes No
Homework sheets Yes No Yes No Yes No
Sending notes with my child Yes No Yes No Yes No
Report cards Yes No Yes No Yes No
Phone call/voice mail Yes No Yes No Yes No
Parent-teacher interviews Yes No Yes No Yes No
Email Yes No Yes No Yes No
Regular mail Yes No Yes No Yes No
Visit to the school Yes No Yes No Yes No
Fax Yes No Yes No Yes No
I didn’t communicate with my child’s teacher Yes No Yes No Yes No
Were there other forms used? Were they useful?
8. In what ways were you involved in your child's school? (Mark all that apply
to you.)
Attended parent-teacher interviews
Attended events and activities at the school
Participated in Home and School / parent council
Fundraised
Volunteered to help with school events and activities
Other (please describe):
9. Which of the following activities did you attend - at the school - during the
last school year? (Please mark all that apply to you.)
Band concerts
School plays/performances
Parent events (like parenting sessions or information on your child and the
internet)
Parent / child fun day event
Sports events
Cultural event
Long-range School or School Board planning sessions
Teacher appreciation week activities
I did not attend any events at the school
4
Thanks so much for hanging in there, you’re almost done. We really need to hear from you and appreciate the thought you are putting into your responses!
Other (please describe):
10. Did you attend ANY parent-teacher meetings in the last school year?
Yes {Go to question 11}
No, I did not have a child in school {Go to question 14}
No, I had a child in school but did not attend a meeting with the teacher {Go to question 13}
************************************************************************************************************************************
Parent-Teacher Meetings
11. How many parent-teacher meetings did YOU attend?
(Please complete a separate line for each child; where "1st child" refers to your oldest child, "2nd child" refers to the next oldest - if any, and so on for up to 3 children.)
none some most all
1st child
2nd child
3rd child
12. Overall, how satisfied are YOU with these parent-teacher meetings?
very dissatisfied somewhat dissatisfied satisfied very satisfied
1st child
2nd child
3rd child
Non-attendance at Parent-Teacher Meetings
13. If YOU were unable to attend ALL the parent-teacher meetings, please tell us why. (Please mark all that applied to your situation.)
I was able to attend ALL meetings
Didn’t know about the meeting
Felt my child was getting along well and did not need to meet with the teacher
Felt that a meeting with the teacher would not improve a poor situation
Did not have time to meet due to personal or work commitments
Other parent/guardian attended the meeting
Did not have time to see all the teachers that I wanted to see
Could not find childcare in order to attend the meeting
Other (please describe):
5
Special Needs
14. Do you feel that you have a child with special needs?
Special needs may include physical limitations (such as needing a
walker to walk), health challenges (such as severe allergies or
asthma), learning challenges, or intellectual challenges.
Yes {Go to Question 15}
No {Go to Question 17}
Don't know or unsure {Go to Question 17}
15. If your child has special needs, do any of the needs require attention while at
school? (Check all that apply.)
Yes, my child has a physical challenge requiring special assistance
Yes, my child has a health challenge requiring special attention or assistance
Yes, my child has an intellectual challenge requiring special assistance
Yes, my child has a learning challenge requiring special assistance
No
16. Again, reflecting on the experience you had over the last school year...
Overall, how satisfied were you with the school's response to your child's special needs?
Very dissatisfied
Somewhat dissatisfied
satisfied
very satisfied
Where Learning Occurs
Children learn about their world and themselves when they interact with their family, friends, community, and school. In this section, we would like to know more about
how you would like to see your child's education supported.
Please think about the coming years when answering the following question.
17. Our children's learning takes place in many settings, including in the school.
Where do you think children should be taught about:
(Please choose only one answer per row.)
only at school mostly at
school
a balance between
home and school
mostly at
home
only at
home
no preference
reading and language skills
math skills
science - biology, chemistry, physics
social skills (getting along with others)
communications skills
protecting the environment
arts appreciation (like music, painting, dance)
morals and values
religions
6
Where do you think children should be taught about:
(Please choose only one answer per row.)
only at school mostly at
school
a balance between
home and school
mostly at
home
only at
home
no preference
physical and mental health
physical fitness (team sport or individual)
sexual activity and its impacts
career guidance
employment skills (like writing resumes, job interviews)
independent living skills (like budgeting, cooking,
childcare)
18. Parents can support their child's school-based education by extending the lessons to everyday life.
Thinking again about the LAST school year - did you do the following with your child? (please check all that apply)
Went to a museum, art gallery, play, or historic site
As a family, joined a club or group
Enrolled my child in a sports activity (like a soccer team)
Enrolled my child in classes (like dance, swimming, or other physical class)
Enrolled my child in a community group (like 4-H, Girl Guides, or Scouts)
Became more physically active as a family
Took an environmental walk
Focused on recycling at home
Changed our eating habits
Quit smoking in the home
Bought a toy or game to support reading, math, or science
Planned a family trip based on exploring a new area or culture
Visited an historic site
Other? (please explain):
Instructional Time & Homework
The time needed to teach subjects to your child and the amount of homework needed, can vary for each child. For the following questions, please try to remember LAST
YEAR's experience.
19. Do you think that your child received enough "instructional time" during school hours?
Instructional time is the time teaching your child the course content and can include fieldtrips, guest speakers, or videos that relate to that course content.
Yes No Don't know
1st child
2nd child
3rd child
Comments?:
20. Do you feel that your child is challenged enough at school?
7
Yes No Don’t Know
1st child
2nd child
3rd child
21. Now thinking of an average week of homework (not during exams): How much time was spent on homework (include weekends)? How much of a struggle was
homework for your child? How much time did you spend encouraging or assisting with homework? Was the amount of homework appropriate?
Time spent each week How much of a struggle was it? Parent support time Enough homework assigned?
1st
child less than 1 hour
1-3 hours
more than 3 but
less than 5 hours
5 or more hours
Usually completed all
homework
Usually completed most
homework
Usually completed some
Rarely completed homework
I only had to remind them to do homework
I sometimes had to assist with homework
I often had to assist with homework
I always had to assist with homework
I was not involved in my child's homework
The amount of homework was
about right
There was too much homework for
this child
There was not enough homework
I don' know
2nd
child less than 1 hour
1-3 hours
more than 3 but
less than 5 hours
5 or more hours
Usually completed all
homework
Usually completed most
homework
Usually completed some
Rarely completed homework
I only had to remind them to do homework
I sometimes had to assist with homework
I often had to assist with homework
I always had to assist with homework
I was not involved in my child's homework
The amount of homework was
about right
There was too much homework for
this child
There was not enough homework
I don' know
3rd
child less than 1 hour
1-3 hours
more than 3 but
less than 5 hours
5 or more hours
Usually completed all
homework
Usually completed most
homework
Usually completed some
Rarely completed homework
I only had to remind them to do homework
I sometimes had to assist with homework
I often had to assist with homework
I always had to assist with homework
I was not involved in my child's homework
The amount of homework was
about right
There was too much homework for
this child
There was not enough homework
I don' know
Is there anything about "homework" you would like to say?
Comments:
22. How often did your child say that homework was completed at school?
(Please start with your oldest child and complete information for up to 3 of the oldest children in your home.)
rarely sometimes often most times
1st child
2nd child
3rd child
8
23. How comfortable were you with assisting your child with homework? (Please choose what best represents how you USUALLY felt.)
Very comfortable
Mostly comfortable
Not very comfortable because I was not familiar with the information
Not very comfortable because I had limited reading and/or math skills
Not very comfortable because I did not have the time to help
Not very comfortable because I don't speak or read the language of instruction
Not very comfortable for other reasons
None of the above
Volunteering at School
24. How often did you volunteer for your child's school?
never
rarely
sometimes
often
25. I volunteered for my child's school by: (please check all that apply)
helping out with classroom activities
helping with food programs (like breakfast or lunch programs)
helping out on field trips
helping out with school ground improvement projects
helping with fundraisers
helping with sporting activities
serving on the School Board or Dept of Education committees
planning or coordinating special school events (like Spring Fling, Fun
Days, Carnivals)
assisting with cultural or arts activities
assisting with school clubs (like orienteering, arts cafes)
driving students (other than my own) to school events
I did not volunteer for my child's school
Other (please specify):
Barriers to Volunteering with Parent Groups
26. What are some of the barriers to YOUR becoming more involved in your Home and School Association or School Council? (Mark all that apply.)
I did not know there was a parent group at the school
I did not know how to contact the parent group
Not sure what I could do with the group
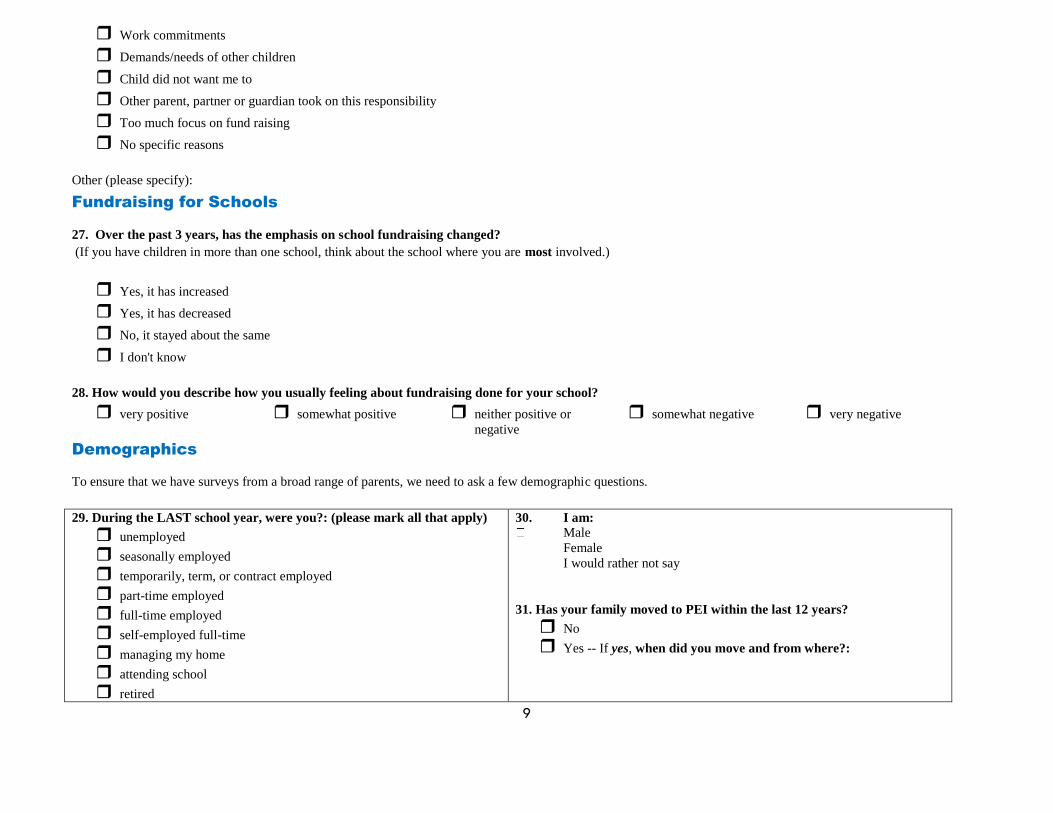
9
Work commitments
Demands/needs of other children
Child did not want me to
Other parent, partner or guardian took on this responsibility
Too much focus on fund raising
No specific reasons
Other (please specify):
Fundraising for Schools
27. Over the past 3 years, has the emphasis on school fundraising changed?
(If you have children in more than one school, think about the school where you are most involved.)
Yes, it has increased
Yes, it has decreased
No, it stayed about the same
I don't know
28. How would you describe how you usually feeling about fundraising done for your school?
very positive
somewhat positive
neither positive or
negative
somewhat negative
very negative
Demographics
To ensure that we have surveys from a broad range of parents, we need to ask a few demographic questions.
29. During the LAST school year, were you?: (please mark all that apply)
unemployed
seasonally employed
temporarily, term, or contract employed
part-time employed
full-time employed
self-employed full-time
managing my home
attending school
retired
30. I am:
Male
Female
I would rather not say
31. Has your family moved to PEI within the last 12 years?
No
Yes -- If yes, when did you move and from where?:
10
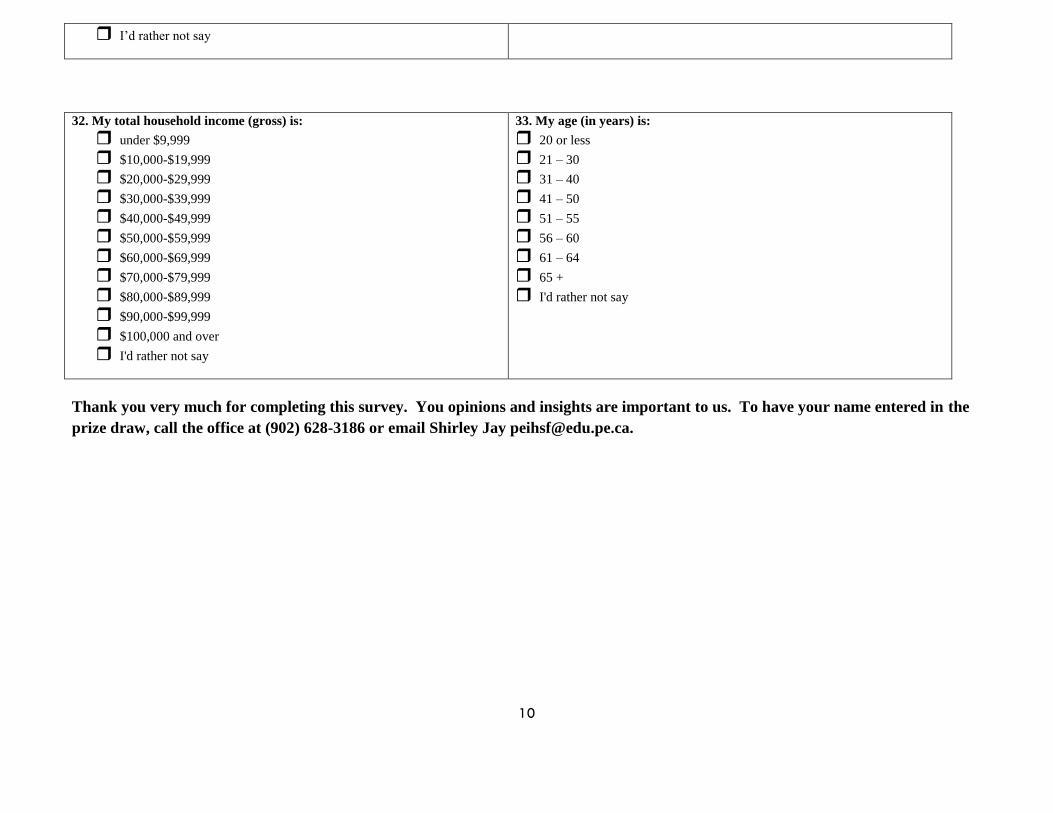
I’d rather not say
32. My total household income (gross) is:
under $9,999
$10,000-$19,999
$20,000-$29,999
$30,000-$39,999
$40,000-$49,999
$50,000-$59,999
$60,000-$69,999
$70,000-$79,999
$80,000-$89,999
$90,000-$99,999
$100,000 and over
I'd rather not say
33. My age (in years) is:
20 or less
21 – 30
31 – 40
41 – 50
51 – 55
56 – 60
61 – 64
65 +
I'd rather not say
Thank you very much for completing this survey. You opinions and insights are important to us. To have your name entered in the
prize draw, call the office at (902) 628-3186 or email Shirley Jay [email protected].