parent and teacher perceptions of naplan in a sample of
TRANSCRIPT

Parent and teacher perceptions of NAPLAN in a sampleof Independent schools in Western Australia
S. L. Rogers1 • L. Barblett2 • K. Robinson1
Received: 20 December 2016 / Accepted: 28 March 2018 / Published online: 3 April 2018
� The Author(s) 2018, corrected publication 2019
Abstract Stories appear frequently in the Australian media regarding parent and
teacher perceptions and attitudes towards the National Assessment Program—Lit-
eracy and Numeracy. However, thorough empirical investigations of parent per-
ceptions are sparse. This study presents a survey of 345 parents across Years 3 and 5
from a sample of Independent schools in Western Australia. A representative
sample of teachers from these schools were also surveyed in order to compare and
contrast parent and teacher perspectives about the transparency and accountability
associated with testing, the usefulness of results for helping individual students, and
the perceived clarity of communication of results. Findings reveal mixed positive
and negative views that reside within an overall prevailing low opinion of the
testing. Some ways for improving the perception of the testing with the general
public are discussed.
Keywords NAPLAN � Standardised testing � Parent perspectives � Teacher
perspectives � Transparency � Accountability � Communication of results
Introduction
Australia’s national standardised testing initiative, the National Assessment
Program—Literacy and Numeracy (NAPLAN) was implemented to foster trans-
parency and accountability within the Australian education system (ACARA 2015).
& S. L. Rogers
1 School of Arts and Humanities, Edith Cowan University, 270 Joondalup Drive, Joondalup,
WA 6027, Australia
2 School of Education, Edith Cowan University, 270 Joondalup Drive, Joondalup, WA 6027,
Australia
123
Aust. Educ. Res. (2018) 45:493–513
https://doi.org/10.1007/s13384-018-0270-2

The information obtained via NAPLAN has been claimed to be of benefit to all
stakeholders, such as policy makers, schools, teachers, parents, and of course
students.1 With NAPLAN testing now a standard feature of the Australian education
landscape, do stakeholders believe that NAPLAN lives up to expectations? There
have been very few investigations of stakeholder perceptions of NAPLAN
considering that NAPLAN has been running since 2008. In the United Kingdom
and United States of America, where standardised testing has a longer history
compared to Australia, research shows negative unintended consequences associ-
ated with standardised testing such as a narrowing of the curriculum, negative
impacts upon stakeholder well-being, and general negative attitudes toward testing
(Brockmeier et al. 2014; Smith 1991; Segool et al. 2013; Au 2011, 2013).
In the Australian context, the research to date is largely consistent with the
studies from overseas. That is, concerns have been raised regarding a negative
impact of NAPLAN upon curriculum, and stakeholder well-being (Polesel et al.
2012; Dulfer et al. 2012; Klenowski and Wyatt-Smith 2012; Harris et al. 2013;
Lingard et al. 2016). In a recently published study, we reported findings that were
somewhat contrary to the prevailing view. Our results indicated only minimal
impact of NAPLAN testing upon student, parent, and teacher well-being in a sample
of relatively affluent (i.e. high ICSEA) Independent schools in Western Australia
(Rogers et al. 2016). These results suggested that standardised testing in Australia is
not necessarily associated with a negative impact upon well-being in all contexts,
and that more research is required to understand when and how standardised testing
might have a negative impact upon well-being across different schools.
In the present study, we report more data from our study of Independent schools,
specifically regarding parent and teacher perceptions of NAPLAN testing. As
previously mentioned, few published studies have explored parent and teacher
attitudes towards the testing in the Australian context. In the largest study to date,
the Whitlam Institute surveyed over eight thousand educators (50% primary
teachers, 30% secondary teachers, and 20% principals or assistant principals) from
around the country via collaboration with the Australian and Independent Education
Unions (Polesel et al. 2014; Dulfer et al. 2012). It was reported that most educators
agreed that NAPLAN narrows the curriculum and teaching practices by taking focus
away from other subjects (around 70%). Additionally, there was more agreement
that the purpose of NAPLAN was to act as a school ranking tool and a method of
policing school performance (around 70%) compared to assisting individual
teachers and students (around 50%). A clear majority believed that poorer than
expected NAPLAN results would have negative consequences for the school’s
reputation (around 90%).
In another large survey of teachers from government (n = 472), Independent
(n = 111), and Catholic (n = 184) schools across Western and South Australia,
Thompson and Harbaugh (2013) found generally unfavourable attitudes towards
NAPLAN testing. Results suggested that most teachers believed that NAPLAN
testing was associated with a narrowing of the curriculum, whilst not providing an
1 See ACARA infographic: http://www.nap.edu.au/verve/_resources/Acara_NAPLAN_Infographic(V4-
2).pdf.
494 S. L. Rogers et al.
123

effective way to increase literacy and numeracy proficiency. However, while 67%
of coded responses were negatively themed, the authors also noted that 21% were
positively themed. The authors also reported that negative attitudes appeared more
pronounced in government schools and schools located in lower socio-economic
areas. Similarly, a large survey of over one thousand primary school principals
produced findings to suggest that large variation existed across schools in how the
NAPLAN results are communicated to teachers, parents, and students (APPA 2013).
The same study also reported a stronger perceived curriculum impact of NAPLAN
associated with lower SES schools (APPA 2013). In contrast, one small-scale
survey of 84 teachers engaged in a professional development programme found
generally favourable attitudes towards NAPLAN as providing useful information
for individual teachers (Pierce and Chick 2011). However, Pierce and Chick (2011)
also found that many of these teachers reported difficulties in interpreting and using
the NAPLAN results effectively.
The only survey of parents reported in the literature was commissioned by the
Whitlam Institute and carried out by NEWSPOLL, consisting of 568 parents (Wyn
et al. 2014; Newspoll 2013). In contrast with surveys of teachers, results suggested
that parents generally held more positive than negative attitudes towards NAPLAN
testing. When asked if they are in favour of, or against the testing, 56% of parents
reported being ‘‘in favour’’, 34% ‘‘against’’, and 10% ‘‘undecided’’. When asked if
they perceived their child’s NAPLAN results to be useful, 68% stated ‘‘useful’’,
30% ‘‘not useful’’, and 2% ‘‘undecided’’. While a clear majority of parents were
found to hold a relatively positive attitude towards the testing, there also existed a
substantial proportion with a negative attitude. In recent years Australian Senate
Enquiries have been carried out to investigate the use and experience of NAPLAN
testing across a broad range of stakeholders. Submissions were obtained from
individuals and also large organisations such as the Australian Education Union
(Australian Senate Enquiry 2010, 2014). The Senate reports produced themes
generally consistent with the studies summarised in this introduction. That is, the
public appears open to the idea of a national testing programme, yet not entirely
satisfied with the implementation. Furthermore, educators are typically more critical
of the programme than parents. The over-arching consistent theme within the
research literature to date has been that since inception in 2008 the proponents of the
NAPLAN testing initiative have been unable to convince some stakeholders of the
utility of the initiative.
The present study contributes to the understanding of public experience and
opinion of NAPLAN by reporting the perspectives of parents and teachers from
Independent schools on NAPLAN regarding themes identified in the prior literature:
(a) impact on pedagogy and stress reported by teachers (Dulfer et al. 2012; Polesel
et al. 2014; Thompson and Harbaugh 2013); (b) transparency and accountability
afforded by NAPLAN (Thompson 2013); (c) usefulness of NAPLAN for helping
individual students (Wyn et al. 2014; Newspoll 2013); and (d) communication of
NAPLAN results (Pierce and Chick 2011; APPA 2013). The aim is to provide a
description of parent and teacher perspectives from a sample of Independent schools
to add to the limited evidence base regarding how Australian parents and teachers
perceive NAPLAN.
Parent and teacher perceptions of NAPLAN in a sample of… 495
123
Method
Participants
The research was funded by the Association of Independent Schools of Western
Australia (AISWA) and our sample was obtained solely from the Independent
school sector in Western Australia. Eighteen AISWA member schools were
contacted by the research team to request participation approximately 2 months
prior to NAPLAN testing. Eleven school principals agreed to participate. Most of
the schools declining participation were from rural areas. We acknowledge that our
results are limited by a potential self-selection bias of schools that all hold student
well-being as a high priority, and are likely not to be representative of schools
generally, nor for all Independent schools. As may be expected, all participating
schools were above the median level (1000) of socio-educational advantage as
determined by the Index of Community Socio-educational Advantage (ICSEA) that
is published on the My School website (www.myschool.edu.au), values ranging
from 1051 to 1182 (mean = 1148). Participants consisted of 347 parents (mean
age = 42.70 years; 92.5% female), and 40 teachers (mean age = 37 years; 82.5%
female) across Years 3 and 5 from the participating Independent schools. Two
parents did not provide answers to all items and were excluded from the dataset,
making the final sample size 345 parents. While the sample of teachers is com-
paratively small to other large surveys of educators, it serves as an adequate rep-
resentative sample of teachers across the year groups in the schools surveyed by the
present research to provide a comparison between parent and teacher perspectives.
Prior to commencement of the study institutional ethics approval was obtained.
Procedure
Consenting parents and teachers could elect to fill out a paper survey, be telephoned,
or complete an online version of the survey at their convenience over a 6-week
period after NAPLAN testing finished, in 2015. A wide range of questions were
asked of both parents and teachers regarding their attitudes towards, and perceptions
of, NAPLAN testing. The specific questions are provided throughout the
tables presented in the results section. The results section is separated into sub-
sections to provide a more orderly structure and presentation of the survey results by
grouping related questions. All questions were asked using the same six-point
response scale: ‘‘not at all’’, ‘‘slightly’’, ‘‘somewhat’’, ‘‘moderately’’, ‘‘very much’’,
‘‘extremely’’. Prior research in this area has predominantly used agree–disagree type
response scales (Thompson and Harbaugh 2013; Dulfer et al. 2012; Polesel et al.
2014). An agree–disagree scale can result in skew towards either general agreement
or disagreement, with most responses falling into either slightly agree/disagree, or
strongly agree/disagree categories. In practice, this means the response scale may
only provide a 2-point scale (i.e. slightly and strongly) that does not provide much
differentiation between individual responses. We therefore decided to use the ‘‘not
at all’’—‘‘extremely’’ scale to provide a more nuanced understanding regarding the
496 S. L. Rogers et al.
123

extent of endorsement for the questions asked. At the end of the parent survey,
participants were also asked to volunteer an open-ended text response. Specifically,
they were asked to ‘‘please write anything you would like to say about NAPLAN
testing in the space below’’.
Analytical approach
This research presents quantitative descriptive statistics, and correlations between
survey items. Descriptive statistics are provided regarding how participants have
responded to questions, and Spearman correlations are examined regarding the
correlation between certain items. A Spearman correlation is a non-parametric
alternative to the more commonly used parametric Pearson correlation. A Spearman
correlation can be used when data is skewed or ordinal, but can still be interpreted in
the same way as a Pearson correlation. Just like the Pearson correlation a Spearman
correlation can potentially range from - 1 to ? 1. In this article we interpret the
magnitude of correlations according to the commonly used guidelines suggested by
Cohen (1988, 1992): .1 (weak), .3 (moderate), and .5 (strong). Participant responses
to the single open-ended question were coded and sorted by first using key words in
context, and then through a process of constant comparison, as described by Strauss
and Corbin (1990).
Results
Teacher perceptions of impact upon pedagogy and practice
The first three questions presented in Table 1 asked about the teacher’s perceptions
of the impact NAPLAN was having upon their pedagogy (e.g. does NAPLAN
narrow the focus of the curriculum?). It was found that 40–50% answered ‘‘not at
all’’ or ‘‘slightly’’ to these questions which suggests that little impact of NAPLAN
was perceived by a substantial proportion of the teachers. However, there was also a
reasonable proportion (albeit much less) reporting a significant impact, with
15–30% stating ‘‘very much’’ or ‘‘extremely’’. While our sample is limited to
teachers from Independent schools, the results are consistent with prior studies
suggesting that teachers from Independent schools do not tend to experience such a
large impact on their curriculum as what may be the experience of teachers in
government and/or lower SES contexts (Thompson and Harbaugh 2013; APPA
2013).
In previous work we presented evidence to suggest that the parents and teachers
surveyed in the present study reported ‘‘a little bit’’ of emotional distress during
NAPLAN testing (Rogers et al. 2016). Consistent with those previously reported
results, as shown in Table 1, around 50% of the teachers responded ‘‘not at all’’ or
‘‘slightly’’ to a question asking how stressed NAPLAN makes them feel.
Additionally, around 70% reported ‘‘not at all’’ or ‘‘slightly’’ to a question asking
if NAPLAN makes them want to teach in another year level that does not have
NAPLAN. Therefore, most teachers did not report much impact to their general
Parent and teacher perceptions of NAPLAN in a sample of… 497
123

well-being due to NAPLAN testing. However, it must also be noted that around
10% answered ‘‘very much’’ or ‘‘extremely’’ to these two questions.
The final few questions reported in Table 1 asked about some potential uses of
NAPLAN. Results show that most teachers surveyed are sceptical that NAPLAN
testing can ensure a consistent experience for all students, that NAPLAN can be
used to identify strengths and weaknesses for individual students, and that
NAPLAN provides useful feedback regarding their own teaching performance.
Therefore, while the results from the present study suggest most teachers did not
report any large impact on their curriculum or any great deal of stress associated
with the testing, neither did they appear to perceive the testing as particularly useful.
When examining Spearman correlations between the question items presented in
Table 1, it was revealed that teachers reporting more stress associated with the
testing also tended to report a stronger desire to teach in a different year without
NAPLAN (Spearman r = .62, p\ .01). Both questions were also positively
associated with the items that asked if NAPLAN narrows the focus of the
Table 1 Teacher (n = 40) perceptions regarding the impact and use of NAPLAN
Not at all Slightly Somewhat Moderately Very
much
Extremely
TP1: Narrows the focus of
the curriculum
8 (20%) 11 (28%) 5 (13%) 3 (8%) 9 (23%) 4 (10%)
TP2: Places too much
emphasis on literacy and
numeracy to the detriment
of other learning areas
9 (23%) 6 (15%) 11 (28%) 7 (18%) 5 (13%) 2 (5%)
TP3: Has meant that getting
ready for NAPLAN has
been the main focus of my
teaching for term 1
10 (25%) 10 (25%) 11 (28%) 2 (5%) 3 (8%) 4 (10%)
TP4: Makes me feel stressed 4 (10%) 17 (43%) 5 (13%) 9 (23%) 2 (5%) 3 (8%)
TP5: Makes me want to teach
in another year level that
does not have NAPLAN
21 (53%) 6 (15%) 4 (10%) 4 (10%) 2 (5%) 3 (8%)
TP6: Enables me to ensure
my students receive a
learning experience that is
consistent with other
students
11 (28%) 11 (28%) 14 (35%) 4 (10%) 0 (0%) 0 (0%)
TP7: Provides information I
can use to identify some
strengths and weaknesses
of my students
7 (18%) 9 (23%) 13 (33%) 8 (20%) 3 (8%) 0 (0%)
TP8: Provides me with useful
feedback regarding my own
teaching performance
13 (33%) 14 (35%) 11 (28%) 2 (5%) 0 (0%) 0 (0%)
Teachers were asked to indicate their extent of agreement with items that started with: ‘‘Having NAPLAN
in the year that I teach…’’
498 S. L. Rogers et al.
123

curriculum (Spearman rs = .45 and .61, ps\ .01, respectively), and the extent that
NAPLAN is perceived to place too much emphasis on literacy and numeracy to the
detriment of other areas (Spearman rs = .61 and .45, ps\ .01, respectively).
Therefore, a teacher reporting more impact upon their curriculum also tended to
report more stress associated with NAPLAN. The relationship between stress and
perceived curriculum impact suggests there may be greater stress associated with
NAPLAN in other contexts where the impact of NAPLAN is felt more intensely. It
has been suggested that curriculum impact is greater in non-Independent schools
(APPA 2013; Thompson and Harbaugh 2013). No other correlations between items
listed in Table 1 reached statistical significance.
Parent and teacher perceptions of transparency and accountability
From the beginning of implementation to the present day, NAPLAN testing has
been claimed to serve the Australian public by providing increased transparency and
accountability across primary and secondary schooling (Australian Senate Enquiry
2010, 2014). These kind of perceptions have been investigated in the context of
other testing regimes in other parts of the world (Brockmeier et al. 2014). However,
a nuanced understanding of teacher and parent beliefs about how well NAPLAN
achieves these over-arching transparency and accountability goals is lacking in the
Australian context. In the present study, we directly asked teachers and parents if
NAPLAN results are an indicator of how well schools are doing, and how well
teachers can teach (i.e. transparency). We also asked about their perceptions
regarding the perceived extent that NAPLAN increases accountability of schools,
teachers, and parents. Responses to these questions are presented in Tables 2
(parents) and 3 (teachers).
For parents, responses were evenly spread across the response scale. While about
1/5 reported a belief that NAPLAN fosters transparency and accountability ‘‘not at
all’’, another 1/5 reported ‘‘very much’’ or ‘‘extremely’’ (see Table 2). A strong
positive association was found between all items. Compared with the parents,
overall the teachers tended to report less endorsement of NAPLAN as fostering
transparency and accountability (see Table 3). The teachers largely did not endorse
NAPLAN as an indicator of teacher performance, as around 60% reported ‘‘not at
all’’. Both parents and teachers perceived NAPLAN as fostering accountability of
teachers and schools more than fostering any accountability of parents. For teachers,
correlations between all items were moderate-strong, except for the ‘accountability
of parents’ item. Therefore, an overall transparency and accountability measure was
created by averaging across the first four items (this excludes the ‘accountability of
parents’ item). This composite measure is further discussed later in the results
section (Section ‘‘Summary of composite variables’’).
Parent and teacher perceptions of usefulness, validity, and fairnessof the testing
The Australian Senate NAPLAN enquiries reported that stakeholders generally
perceive NAPLAN as a useful initiative for providing broad-scale comparisons
Parent and teacher perceptions of NAPLAN in a sample of… 499
123

across schools at the state and national levels (Australian Senate Enquiry
2010, 2014). However, the senate enquiries also reported that stakeholder
perceptions regarding the usefulness of NAPLAN for serving the needs of
individual teachers and students were mixed. Mixed positive and negative parent
and teacher perceptions are also evident in the research literature (Polesel et al.
2012). As shown in Tables 4 and 5 (see the first three items in each table) it is
evident that mixed positive/negative perceptions also existed within our sample of
parents and teachers regarding the usefulness of NAPLAN to help individual
students. The inter-correlations between items reveal strong positive associations
between the ‘usefulness’ items for both parents and teachers. We therefore created a
composite ‘usefulness’ score from these items that is discussed later in the results
section (Section ‘‘Summary of composite variables’’).
Concerns have also previously been raised about the validity and fairness of
NAPLAN testing (Australian Senate Enquiry 2010, 2014; Polesel et al. 2012). We
asked respondents their perception of the extent that NAPLAN measures all aspects
of maths and reading (validity type question), and the extent that it is a fair form of
testing for children from all cultural backgrounds (fairness type question). Again,
Table 2 Parent (n = 345) responses to survey items asking about the perceived transparency and
accountability of NAPLAN
Not at all Slightly Somewhat Moderately Very
much
Extremely
PA1: Shows how well
schools are doing.
50 (15%) 64 (19%) 109 (32%) 74 (21%) 37 (11%) 11 (3%)
PA2: Shows how well
teachers can teach.
87 (25%) 80 (23%) 87 (25%) 55 (16%) 28 (8%) 8 (2%)
PA3: Increases the
accountability of
schools.
54 (16%) 63 (18%) 94 (27%) 72 (21%) 43 (12%) 19 (6%)
PA4: Increases the
accountability of
teachers.
63 (18%) 66 (19%) 91 (26%) 71 (21%) 41 (12%) 13 (4%)
PA5: Increases the
accountability of
parents.
139 (40%) 64 (19%) 68 (20%) 46 (13%) 23 (7%) 5 (1%)
PA1 PA2 PA3 PA4 PA5
PA1 1
PA2 .74* 1
PA3 .73* .70* 1
PA4 .71* .73* .92* 1
PA5 .51* .56* .58* .65* 1
Parents were asked to indicate their extent of agreement with items that started with: ‘‘How much do you
believe NAPLAN…’’
*Spearman correlations, p\ .05
500 S. L. Rogers et al.
123

there are mixed responses to these items; however, participants expressed more
doubt about these validity and fairness questions compared to the questions
targeting usefulness. For the validity question, approximately 35% of both parent
and teacher groups responded ‘‘not at all’’. A similar proportion of parents
responded ‘‘not at all’’ for the fairness question, and approximately 60% of the
teachers responded ‘‘not at all’’ to this question. This suggests that more work needs
to be done by the test administrators to convince stakeholders of the validity and
appropriateness of widespread usage of the testing. Our data are however limited to
only single questions regarding validity and fairness, with a specific population of
respondents (i.e. parents and teachers from Independent schools). Future research
with a wider set of items and a broader sample would be useful. The validity and
fairness questions were found to be strongly (for parents) and moderately (for
teachers) positively associated with one another. This suggests that a respondent
perceiving the test to be more appropriate for widespread use also tended to
perceive the test as encompassing most aspects of maths and reading. For parents,
items were also positively associated with the usefulness items. This suggests that
parents perceiving the test as more valid and fair also tended to perceive the testing
as more useful for comparing across/within students and helping individual students
Table 3 Teacher (n = 40) responses to survey items asking about the perceived transparency and
accountability of NAPLAN
Not at all Slightly Somewhat Moderately Very
much
Extremely
TA1: Shows how well
schools are doing
10 (25%) 12 (30%) 12 (30%) 4 (10%) 2 (5%) 0 (0%)
TA2: Shows how well
teachers can teach
23 (58%) 8 (20%) 6 (15%) 3 (8%) 0 (%) 0 (%)
TA3: Increases the
accountability of schools
4 (10%) 17 (43%) 8 (20%) 3 (8%) 7 (18%) 1 (3%)
TA4: Increases the
accountability of teachers
8 (20%) 15 (38%) 8 (20%) 2 (5%) 5 (13%) 2 (5%)
TA5: Increases the
accountability of parents
24 (60%) 12 (30%) 2 (5%) 1 (3%) 1 (3%) 0 (0%)
TA1 TA2 TA3 TA4 TA5
TA1 1
TA2 .56* 1
TA3 .58* .37* 1
TA4 .47* .43* .88* 1
TA5 .27 .11 .24 .31 1
Teachers were asked to indicate their extent of agreement with items that started with: ‘‘How much do
you believe NAPLAN…’’
*Spearman correlations, p\ .05
Parent and teacher perceptions of NAPLAN in a sample of… 501
123

learn. Low-moderate positive associations among these variables were observed for
teachers.
Parent and teacher perceptions of the clarity of communication of NAPLANresults
In this section the results from parents are from Year 5 parents (n = 198) only, since
they had prior experience regarding the communication of NAPLAN results when
their child was in Year 3. In contrast, the surveyed Year 3 parents would not have
had sufficient prior experience to answer the items with any confidence. Previous
discussion about the communication of NAPLAN results has largely focused upon
the presentation of results on the My School website (Australian Senate Enquiry
2010, 2014; Ragusa and Bousfield 2015). Pierce and Chick (2011) have reported
findings that teachers may experience difficulties interpreting results of their
students as provided to them by the governing body of NAPLAN, the Australian
Curriculum and Assessment Reporting Authority (ACARA). In the present study,
Table 4 Parent (n = 345) responses to survey items asking about the perceived usefulness of NAPLAN
Not at all Slightly Somewhat Moderately Very
much
Extremely
PU1: Results help teachers
to identify what areas
students need help in.
43 (12%) 68 (20%) 63 (18%) 81 (23%) 60 (17%) 31 (9%)
PU2: Results are useful for
monitoring children’s
performance over years.
51 (15%) 61 (18%) 76 (22%) 79 (23%) 59 (17%) 20 (6%)
PU3: Results are useful for
comparing a child’s
performance with other
children.
56 (16%) 87 (25%) 77 (22%) 73 (21%) 39 (11%) 14 (4%)
PU4: Measures all aspects
of MATHS and
READING.
127 (37%) 63 (18%) 69 (20%) 57 (17%) 16 (5%) 13 (4%)
PU5: Is a fair form of
testing for children from
all cultural backgrounds.
121 (35%) 62 (18%) 73 (21%) 47 (14%) 32 (9%) 10 (3%)
PU1 PU2 PU3 PU4 PU5
PU1 1
PU1 .79* 1
PU1 .58* .65* 1
PU1 .54* .61* .52* 1
PU1 .54* .56* .52* .70* 1
Parents were asked to indicate their extent of agreement with items that started with: ‘‘How much do you
believe NAPLAN…’’
*Spearman correlations, p\ .05
502 S. L. Rogers et al.
123

we focus on perceptions regarding how well the results of students are
communicated to the students and parents by the teacher and the school report.
Parent and teacher responses were similar with around 50% responding ‘‘not at all’’
or ‘‘slightly’’ and around 15% responding ‘‘very much’’ or ‘‘extremely’’ to these
items, from both groups (see Tables 6, 7). Therefore findings reveal some mixed
perceptions situated within a prevailing negativity regarding the communication of
results to students and parents (by the teacher and school report). Strong
associations were found between the first four items for both parents and teachers.
An overall communication appraisal score was created by averaging across these
items that will be discussed further in Section ‘‘Summary of composite variables’’.
A single question was also asked to gauge parent and teacher perception
regarding how well results are communicated via the My School website. As can be
seen in Tables 6 and 7, perceptions were very mixed with relatively even responses
across the response scale. Another question asked if respondents believed NAPLAN
results were communicated in a timely manner, and not surprisingly the most
frequent response by both parents and teachers was ‘‘not at all’’ (around 35%
Table 5 Teacher (n = 40) responses to survey items asking about the perceived usefulness of NAPLAN
Not at all Slightly Somewhat Moderately Very
much
Extremely
TU1: Results help teachers to
identify what areas students
need help in
4 (10%) 12 (30%) 15 (38%) 5 (13%) 4 (10%) 0 (0%)
TU2: Results are useful for
monitoring children’s
performance over years
2 (5%) 10 (25%) 10 (25%) 11 (28%) 5 (13%) 2 (5%)
TU3: Results are useful for
comparing a child’s
performance with other
children
5 (13%) 13 (33%) 8 (20%) 9 (23%) 5 (13%) 0 (0%)
TU4: Measures all aspects of
MATHS and READING
15 (38%) 14 (35%) 4 (10%) 4 (10%) 3 (8%) 0 (0%)
TU5: Is a fair form of testing
for children from all
cultural backgrounds
25 (63%) 8 (20%) 4 (10%) 1 (3%) 3 (8%) 0 (0%)
TU1 TU2 TU3 TU4 TU5
TU1 1
TU2 .47* 1
TU3 .61* .63* 1
TU4 .41* .31 .47* 1
TU5 .26 .21 .43* .54* 1
Teachers were asked to indicate their extent of agreement with items that started with: ‘‘How much do
you believe NAPLAN…’’
*Spearman correlations, p\ .05
Parent and teacher perceptions of NAPLAN in a sample of… 503
123

parents, and around 60% teachers). One reason behind the upcoming switch to
online NAPLAN assessment is to improve the turnaround time for the reporting of
results to address criticisms regarding the long wait for results that has plagued the
testing initiative since inception (Australian Senate Enquiry 2014).
Summary of composite variables
While prior sections have provided the frequency response data for individual
survey items, in this section we examine composite variables. The composite
variables represent an overall measure of the perception of the ‘transparency and
accountability’ afforded by NAPLAN (see Section ‘‘Parent and teacher perceptions
of transparency and accountability’’, questions A1–A4), the ‘usefulness of
NAPLAN for helping individual students’ (see Section ‘‘Parent and teacher
perceptions of usefulness, validity, and fairness of the testing’’, questions U1–U3),
and the ‘clarity of the communication of NAPLAN results to parents and students
by the teacher and school report’ (see Section ‘‘Parent and teacher perceptions of the
clarity of communication of NAPLAN results’’, questions C1–C4). To statistically
justify the appropriateness of our composite variables we conducted confirmatory
Table 6 Year 5 Parent (n = 198) responses to survey items asking about how well NAPLAN results are
communicated
Not at all Slightly Somewhat Moderately Very
much
Extremely
PC1: To students by the
teacher
73 (37%) 33 (17%) 38 (19%) 24 (12%) 26 (13%) 4 (2%)
PC2: To students by the
school report
75 (38%) 44 (22%) 27 (14%) 25 (13%) 23 (12%) 4 (2%)
PC3: To parents by the
teacher
71 (36%) 31 (16%) 40 (20%) 28 (14%) 25 (13%) 3 (2%)
PC4: To parents by the
school report
47 (24%) 38 (19%) 35 (17%) 29 (15%) 37 (19%) 12 (6%)
PC5: To the general public
by the MySchool website
27 (14%) 33 (17%) 42 (21%) 49 (25%) 41 (21%) 6 (3%)
PC6: In a timely manner 72 (36%) 35 (18%) 43 (22%) 29 (15%) 17 (9%) 2 (1%)
PC1 PC2 PC3 PC4 PC5 PC6
PC1 1
PC2 .66* 1
PC3 .76* .62* 1
PC4 .42* .66* .52* 1
PC5 .30* .30* .28* .40* 1
PC6 .52* .51* .47* .46* .35* 1
Parents were asked to indicate their extent of agreement with items that started with: ‘‘I believe that
NAPLAN results are clearly communicated…’’
*Spearman correlations, p\ .05
504 S. L. Rogers et al.
123

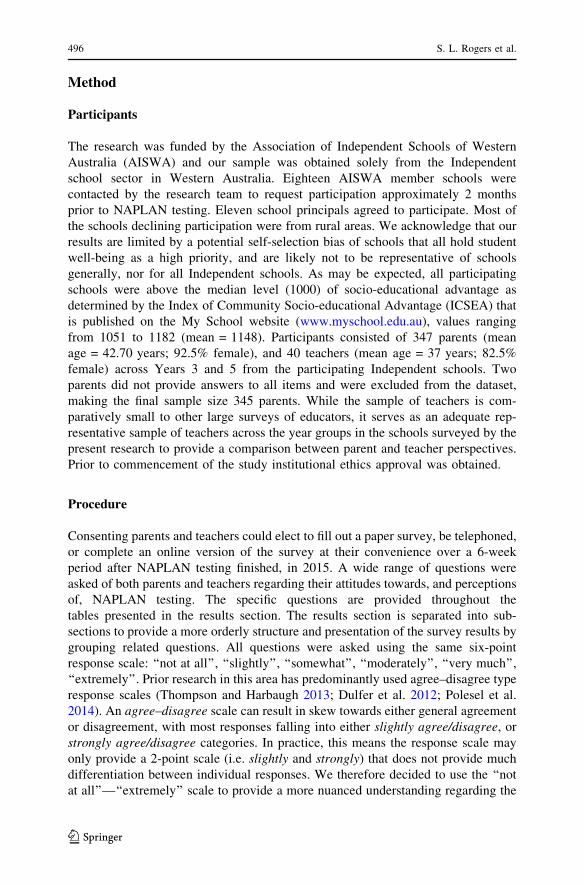
factor analysis (CFA) using a structural equation modelling (SEM) approach (Acock
2013; Rubio and Gillespie 1995), see Fig. 1. The parent models acquired adequate
goodness of fit indices, but the teacher model did not as this group has a relatively
low sample size. Across all groups the reliability of all factors was high (i.e. equal to
or greater than .79). A strong positive association was found between perceptions of
accountability/transparency and usefulness for individual students for parents (Year
5 parents r = .81, Year 3 parents r = .77), and a moderate association for teachers
(r = .46). These data suggest that continued work to foster engagement with
NAPLAN results will likely help to improve NAPLAN’s image as a testing
initiative that promotes a more transparent and accountable primary and secondary
Australian education system. For Year 5 parents, a positive association was found
between perceptions surrounding the clarity of communication of results with
perceptions of transparency/accountability (r = .38), and usefulness of the testing
(r = .44). These results suggest that increasing parental sense of the clarity of
communication may promote their general attitudes towards the testing. These same
associations were not observed for teachers.
Table 7 Teacher (n = 40) responses to survey items asking about how well NAPLAN results are
communicated
Not at all Slightly Somewhat Moderately Very
much
Extremely
TC1: To students by the
teacher
19 (48%) 5 (13%) 6 (15%) 4 (10%) 6 (15%) 0 (0%)
TC2: To students by the
school report
17 (43%) 4 (10%) 7 (18%) 3 (8%) 7 (18%) 2 (5%)
TC3: To parents by the
teacher
13 (33%) 8 (20%) 6 (15%) 9 (23%) 3 (8%) 1 (3%)
TC4: To parents by the
school report
12 (30%) 6 (15%) 7 (18%) 8 (20%) 5 (13%) 2 (5%)
TC5: To the general public
by the MySchool website
4 (10%) 10 (25%) 10 (25%) 4 (10%) 11 (28%) 1 (3%)
TC6: In a timely manner 24 (60%) 6 (15%) 6 (15%) 2 (5%) 2 (5%) 0 (0%)
TC1 TC2 TC3 TC4 TC5 TC6
TC1 1
TC2 .68* 1
TC3 .73* .56* 1
TC4 .54* .65* .69* 1
TC5 .24 .25 .36* .31* 1
TC6 .30 .27 .37* .30 .49* 1
Teachers were asked to indicate their extent of agreement with items that started with: ‘‘I believe that
NAPLAN results are clearly communicated…’’
*Spearman correlations, p\ .05
Parent and teacher perceptions of NAPLAN in a sample of… 505
123
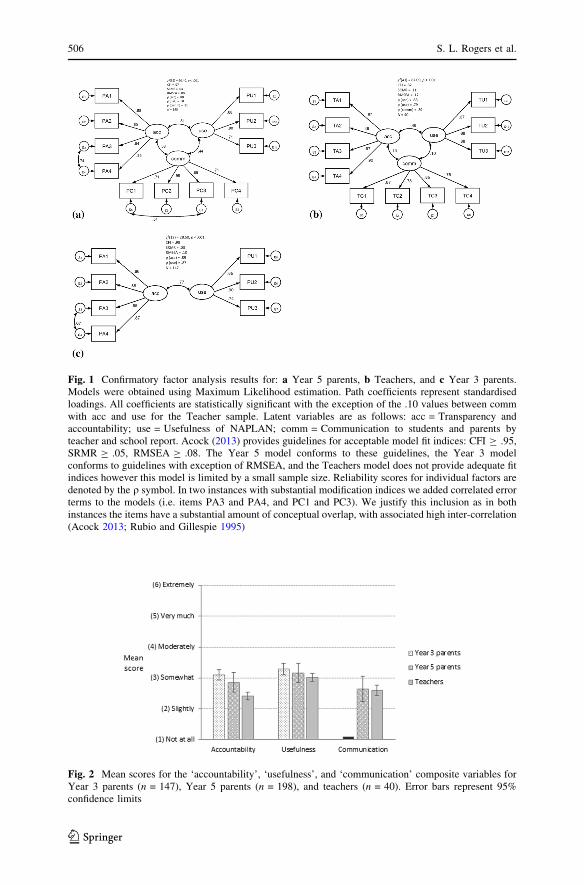
Fig. 1 Confirmatory factor analysis results for: a Year 5 parents, b Teachers, and c Year 3 parents.Models were obtained using Maximum Likelihood estimation. Path coefficients represent standardisedloadings. All coefficients are statistically significant with the exception of the .10 values between commwith acc and use for the Teacher sample. Latent variables are as follows: acc = Transparency andaccountability; use = Usefulness of NAPLAN; comm = Communication to students and parents byteacher and school report. Acock (2013) provides guidelines for acceptable model fit indices: CFI C .95,SRMR C .05, RMSEA C .08. The Year 5 model conforms to these guidelines, the Year 3 modelconforms to guidelines with exception of RMSEA, and the Teachers model does not provide adequate fitindices however this model is limited by a small sample size. Reliability scores for individual factors aredenoted by the q symbol. In two instances with substantial modification indices we added correlated errorterms to the models (i.e. items PA3 and PA4, and PC1 and PC3). We justify this inclusion as in bothinstances the items have a substantial amount of conceptual overlap, with associated high inter-correlation(Acock 2013; Rubio and Gillespie 1995)
Fig. 2 Mean scores for the ‘accountability’, ‘usefulness’, and ‘communication’ composite variables forYear 3 parents (n = 147), Year 5 parents (n = 198), and teachers (n = 40). Error bars represent 95%confidence limits
506 S. L. Rogers et al.
123

While previous sections highlight the existence of mixed negative and positive
perceptions, the average perception as obtained by the composite scores obtained by
averaging across items for each factor for both parents and teachers, is around
‘‘somewhat’’, see Fig. 2. The only exception is the average teacher perception of
transparency and accountability that is closer to ‘‘slightly’’. The transparency and
accountability measure was the only measure of the three that yielded a statistically
significant difference between parent and teacher perceptions, t(384) = 2.65,
p\ .01, d = .48. As can be seen in Fig. 2 results suggest that parents typically
report a stronger perception of transparency and accountability than teachers,
although the mean level for parents is still low on the scale (i.e. ‘‘somewhat’’).
Open-ended responses from parents
As part of the survey an optional open-ended response box was available for
parents. One hundred and eighty-five (54%) of the parents provided a written
response. The frequency of occurring themes is summarised in Table 8. This
qualitative data complements the variation that was noted in the quantitative data.
While a substantial proportion provided comments that suggested they can see the
potential of NAPLAN as a tool to help individual students (19%), a similar
proportion also adamantly stated a belief that NAPLAN was not a good measure of
a child’s ability (16%). It was also expressed that too much emphasis is placed upon
NAPLAN by the general community (10%), and that the additional pressure placed
upon stakeholders was not needed or helpful (17%). Therefore, similar to the
quantitative findings, a mix of generally ‘positive’ and ‘negative’ attitudes are
evident.
Discussion and conclusions
Since its inception in 2008, NAPLAN has received ongoing criticism regarding
negative impacts upon teaching and stakeholder well-being from scholars
(Klenowski and Wyatt-Smith 2012; Harris et al. 2013; Polesel et al. 2012), and
the media (Shine 2015). These criticisms have resulted in two separate Australian
Senate enquiries that conceded there are several negative unintended consequences
associated with the testing. However at the same time NAPLAN is perceived by the
Australian government to be a valuable initiative that with ongoing development
and refinement can aid in improving the primary and secondary school system
(Australian Senate Enquiry 2010, 2014). To date, surveys of educators and parents
have provided evidence to suggest that while some believe in the usefulness of the
testing, there are just as many people that perceive the testing as counter-productive
and a waste of time and resources (Thompson and Harbaugh 2013; Dulfer et al.
2012; Polesel et al. 2014; Newspoll 2013; Pierce and Chick 2011; Wyn et al. 2014;
Ragusa and Bousfield 2015; APPA 2013).
The present study sought to add to the existing literature by reporting findings
from a survey of teachers and parents from a sample of Independent schools in
Western Australia. Results were consistent with prior studies as responses to survey
Parent and teacher perceptions of NAPLAN in a sample of… 507
123

items were typically spread across the ‘‘not at all’’ to ‘‘extremely’’ response scale,
highlighting the presence of mixed attitudes towards NAPLAN. Survey questions
targeted four broad themes:
Table 8 Frequencies of different themes present within the open-ended comments provided by parents
Theme Number of parents
mentioning this
theme
Percentage of responses
containing this theme
Praise for the ‘low key’ approach of the school
towards NAPLAN that helped minimise student
distress
36 19
Can see that NAPLAN can be of use for helping
individual students
36 19
The additional pressure placed upon students,
teachers, and parents is not needed or helpful
32 17
My child/ren was not stressed by the testing 31 17
NAPLAN is not a good measure of a child’s ability 30 16
Large delay in notification of results severely reduces
the utility of the testing
27 15
In general, too much emphasis is placed on NAPLAN
by schools, the media, and the general public
19 10
My child/ren was stressed by the testing 17 9
NAPLAN only constitutes a ‘one-off snapshot’ of
ability that limits the usefulness of the testing
16 9
NAPLAN testing is a ‘waste of time’ and/or a ‘waste
of taxpayer’s money’
15 8
Can see that NAPLAN may be useful for comparing
across schools, but not necessarily of use for
individual students
12 6
Concern that students ‘in general’ may experience
distress from the testing
12 6
The testing can serve as a good ‘testing experience’
that will better equip students to deal with their final
year 12 exams
10 5
More traditional feedback from teachers and school
reports is superior to what is obtained via NAPLAN
9 5
Communication of results to parents is not very clear 9 5
Concern that the testing is not appropriate for very
young children
9 5
Belief that it would be better for communication of
results to be more private
6 3
The testing is not appropriate for children with a
learning disability as it is an unfair assessment of
their performance
6 3
More well-off schools are advantaged over less well-
off schools
6 3
Pay little attention to it 5 3
508 S. L. Rogers et al.
123

– Teacher perceptions of impact upon pedagogy and practice (Section ‘‘Teacher
perceptions of impact upon pedagogy and practice’’).
– Parent and teacher perceptions of transparency and accountability (Section ‘‘Par-
ent and teacher perceptions of transparency and accountability’’).
– Parent and teacher perceptions of usefulness, validity, and fairness of the testing
(Section ‘‘Parent and teacher perceptions of usefulness, validity, and fairness of
the testing’’).
– Parent and teacher perceptions of the clarity of communication of NAPLAN
results (Section ‘‘Parent and teacher perceptions of the clarity of communication
of NAPLAN results’’).
While not unanimous, results suggest that the teachers surveyed in the present
study experience only a relatively minor impact of the testing upon their curriculum
and stress levels. This finding is consistent with a prior publication reporting the
teachers from these schools generally only experience a minor increase in emotional
distress associated with the testing (Rogers et al. 2016). Additionally, the findings of
the present study are consistent with other research suggesting that there are people
who do not perceive a great deal of impact on curriculum due to NAPLAN (APPA
2013; Thompson and Harbaugh 2013). Further research is required to fully
understand the impact of NAPLAN on pedagogy, and what potential stress might be
related to this. In particular it would be useful to compare and contrast educators in
different contexts, such as relative affluence, and whether the school is Independent
or government funded. In the present study, a moderate positive association was
found between perceived impact of NAPLAN on curriculum with stress. This
provides tentative evidence to support arguments made by Hardy that curriculum
changes perceived to be associated with NAPLAN can be stressful for individuals
who might be opposed to standardised testing due to their own personal
philosophical stance towards education policy and practice (Hardy 2014, 2015).
While results suggest that the impact on curriculum and well-being in the
surveyed schools is generally low, perceptions regarding the usefulness of the
testing were not as encouraging. Teachers generally reported that NAPLAN was not
particularly useful for identifying strengths and weaknesses of individual students;
nor was it seen to provide useful feedback on their own teaching. Other questions
asking about the usefulness of NAPLAN for helping individual students and
providing useful comparative data were however rated slightly more positively.
Both teacher and parent responses to these questions were mixed with some
respondents quite negative and others very positive; however, on average, the
perception was that NAPLAN is only ‘‘somewhat’’ useful for helping individual
students. Participants were particularly critical of the lengthy time lapse (i.e.
months) between sitting the test and notification of results. Teachers and parents
perceiving the timing of notification of results as more adequate also tended to
report NAPLAN as more useful for helping individual students. This suggests that
improving this long-standing problem with testing administration (i.e. timely release
of results) will likely help to improve general attitudes regarding the usefulness of
NAPLAN. This is a hoped for outcome of changing to online administration of the
testing (Australian Senate Enquiry 2014). It will be interesting for future research to
Parent and teacher perceptions of NAPLAN in a sample of… 509
123

revisit teacher and parent perceptions sometime after the initiation of the online
testing and compare with findings of the present study and the few other similar pre-
online studies of NAPLAN attitudes to examine if an increased appreciation of the
usefulness of the testing is borne out.
The online administration and associated faster turnaround of results may also
help to lift perceptions of the clarity of communication of results. In the present
study, while the survey revealed mixed perceptions, the average perception of both
parents and teachers regarding the clarity of communication of results to the
students and parents by the teacher and school report was only ‘‘somewhat’’.
Interviews with the school principals (to be fully reported and discussed in detail in
a subsequent publication) revealed different approaches regarding the communica-
tion of results to students and parents. However, a common practice among all
principals was a concerted effort to minimise the hype around the testing via a low-
key approach to NAPLAN communication. On the one hand, a low-key approach
may minimise hype, and on the other hand it may reduce perceptions of the
usefulness of the testing. It may be helpful if schools were to debrief parents on how
they used the NAPLAN results to improve the education of their children. In our
study we found a positive association between parent perception of the clarity of
communication of results and perceived usefulness of the testing. This suggests that
fostering a sense of clearer communication of results with parents may help to
bolster attitudes towards the testing. A risk that communicating more clearly about
NAPLAN might increase pressure and stress associated with testing is an
assumption that requires further research. We argue that a communication strategy
that includes more precise information about how the results are used to help
children learn would be useful.
The present research focused on communication of NAPLAN results to the
students and parents by the teacher and school report. However, Pierce and Chick
(2011) have noted that the use of NAPLAN results by teachers within their
individual classrooms is dependent upon quality of communication between test
administration (i.e. ACARA) and schools. Where the primary responsibility for the
communication of individual NAPLAN results to students and parents sits is an
issue for debate (e.g. ACARA, schools, or teachers). ACARA provides individual
student reports (see: http://www.nap.edu.au/results-and-reports/student-reports.
html). Is this enough information to fully inform and/or engage students and par-
ents to utilise the results? How can information be communicated and used within
the student–teacher–parent triad that maximises student gains for both knowledge
and skills? How can NAPLAN results be further utilised by teachers to help indi-
vidual students? Are results communicated adequately to teachers to enable them to
get the most use from results? These kinds of questions require future consideration
and study.
From the outset a major drive behind the NAPLAN initiative has been to foster
an increased sense of transparency and accountability within the Australian primary
and secondary education sector (ACARA 2015). In the present study, we directly
asked teachers and parents their perceptions regarding the transparency and
accountability afforded by NAPLAN. We found evidence for mixed negative and
positive attitudes, with the average response ‘‘somewhat’’ for parents, and
510 S. L. Rogers et al.
123

‘‘slightly’’ for teachers. However, as noted, despite a fairly low average opinion of
the ability of NAPLAN to meet transparency/accountability goals, approximately
10–20% of both parents and teachers responded ‘‘very much’’.
In the present study both parents and teachers that perceived NAPLAN as useful
for helping individual students also tended to perceive NAPLAN as fostering more
transparency and accountability. Therefore, a challenge for the administrators of
NAPLAN is to improve the perceptions regarding the usefulness of the testing. We
have suggested that improving the turnaround time for the release of results, and the
communication of results, should help to improve perceptions of usefulness.
Furthermore, more research is required to provide evidence of the reliability and
validity of the testing. As an example, Grasby et al. (2015) recently provided
evidence of convergent validity between NAPLAN and other established reading
and numeracy tests. Another example that has provided some evidence for
predictive validity, Year 9 NAPLAN scores have been found to be a significant
predictor of final Year 12 results (Houng and Justman 2014). More research of this
kind needs to be conducted, and communicated to the public, to provide a solid
empirical evidence base that will help to bolster the perception of NAPLAN by both
educators and parents.
The present research adds to the existing body of knowledge regarding educator
and parent perceptions of NAPLAN testing. Consistent with prior work we found
evidence for an overall low average opinion of NAPLAN, yet at the same time it
must be acknowledged that attitudes measured by both survey items and an open-
ended response ranged from very poor to very positive. We have suggested some
challenges for test administrators and schools moving forward to lift the perception
of the NAPLAN initiative. The upcoming switch to online testing should afford a
much faster turnaround of results that will likely facilitate the use of the testing to be
used as a tool for helping individual students. This will hopefully improve the
perception of the usefulness of the testing for both educators and parents. The online
testing is however far from a magic bullet in this regard, and further development of
the testing process and communication and use of results will need to occur over the
coming years to effectively lift the profile of NAPLAN in the eyes of the public.
While online testing should help improve the turnaround of results feedback, it
potentially creates other issues such as inequities that could arise via different
opportunities for learning with computers across different school contexts. We
acknowledge that the results presented in the present study are very limited to a
specific context (i.e. relatively affluent Independent schools in Western Australia
with a strong focus on student well-being), and the attitudes uncovered may
therefore not be generalizable to the wider teacher/parent community. However, as
suggested by prior research (Thompson and Harbaugh 2013), the context we
investigated is arguably where more positive attitudes toward NAPLAN would
reside. Therefore, that we found a lot of room for improvement in attitudes in this
specific population suggests there is likely just as much, if not more, room for
improvement in the attitudes towards NAPLAN in the wider population.
Acknowledgements This research was funded by The Association of Independent Schools of Western
Australia (AISWA). The authors would like to acknowledge the participation of all the principals,
Parent and teacher perceptions of NAPLAN in a sample of… 511
123

teachers, parents, and students that made this research possible. We would also like to thank the feedback
from three anonymous reviewers and the editor to help improve the article prior to publication.
Open Access This article is distributed under the terms of the Creative Commons Attribution 4.0
International License (http://creativecommons.org/licenses/by/4.0/), which permits use, duplication,
adaptation, distribution and reproduction in any medium or format, as long as you give appropriate
credit to the original author(s) and the source, provide a link to the Creative Commons license and
indicate if changes were made.
References
ACARA. (2015). Measurement Framework for Schooling in Australia 2015. Assessment and Reporting
Authority: Australian Curriculum.
Acock, A. C. (2013). Discovering structural equation modeling using stata. Texas, USA: Stata Press.
APPA. (2013). Primary Principals: Perspectives on NAPLAN testing and assessment. Report conducted
by CANVASS strategic opinion research: Comissioned by The Australian Primary Principals
Association (APPA)
Au, W. (2011). Teaching under the new Taylorism: high-stakes testing and the standardization of the 21st
century curriculum. Journal of Currculum Studies, 43(1), 25–45.
Au, W. (2013). Hiding behind high-stakes testing: Meritocracy, objectivity and inequality in U.S.
education. The International Education Journal: Comparative Perspectives, 12(2), 7–19.
Australian_Senate_Enquiry (2010). Administration and reporting of NAPLAN testing. Australian
Education, Employment, and Workplaces Relations References Committee.
Australian_Senate_Enquiry. (2014). Effectiveness of the National Assessment Program—Literacy and
Numeracy. Australian Education and Employment References Committee.
Brockmeier, L. L., Green, R. B., Pate, J. L., Tsemunhu, R., & Bockenko, M. J. (2014). Teachers’ beliefs
about the effects of high stakes testing. Journal of Education and Human Development, 3(4),
91–104.
Cohen, J. (1988). Statistical power analysis for the behavioral sciences (2nd ed.). Hillsdale, NJ: Erlbaum.
Cohen, J. (1992). A power primer. Psychological Bulletin, 112(1), 155–159.
Dulfer, N., Polesel, J., & Rice, S. (2012). The experience of education: The impacts of high stakes testing
on school students and their families: An educator’s perspective. Whitlam Institute within the
University of Western Sydney.
Grasby, K. L., Byrne, B., & Olson, R. K. (2015). Validity of large-scale reading tests: A phenotypic and
behaviour-genetic analysis. Australian Journal of Education, 59(1), 5–21.
Hardy, I. (2014). A logic of appropriation: Enacting national testing (NAPLAN) in Australia. Journal of
Education Policy, 29(1), 1–18.
Hardy, I. (2015). A logic of enumeration: The nature and effects of national literacy and numeracy testing
in Australia. Journal of Education Policy, 30(3), 335–362.
Harris, P., Chinnappan, M., Castleton, G., Carter, J., De Courcey, M., & Barnett, J. (2013). Impact and
consequence of Australia’s national assessment program—literacy and numeracy (NAPLAN)—
using research evidence to inform improvement. TESOL in Context, 23(1/2), 30–52.
Houng, B., & Justman, M. (2014). NAPLAN scores as predictors of access to higher education in
Victoria, (pp. 33). University of Melbourne.
Klenowski, V., & Wyatt-Smith, C. (2012). The impact of high stakes testing: The Australian story.
Assessment in Education: Principles, Policy & Practice, 19(1), 65–79.
Lingard, B., Thompson, G., & Sellar, S. (2016). National testing in schools: An Australian assessment.
Abingdon, OX: Routledge.
Newspoll. (2013). The experience of education: The impacts of high stakes testing on school students and
their families. Parental attitudes and perceptions concerning NAPLAN.
Pierce, R., & Chick, H. (2011). Teachers’ intentions to use national literacy and numeracy assessment
data: A pilot study. The Australian Educational Researcher, 38, 433–447.
Polesel, J., Dulfer, N., & Turnbull, M. (2012). The experience of education: The impacts of high stakes
testing on school students and their families: Literature review. Whitlam Institute within University
of Western Sydney.
512 S. L. Rogers et al.
123

Polesel, J., Rice, S., & Dulfer, N. (2014). The impact of high-stakes testing on curriculum and pedagogy:
A teacher perspective from Australia. Journal of Education Policy, 29(5), 640–657.
Ragusa, A. T., & Bousfield, K. (2015). ‘It’s not the test, it’s how it’s used!’ Critical analysis of public
response to NAPLAN and MySchool Senate Inquiry. British Journal of Sociology of Education,
1–22.
Rogers, S. L., Barblett, L., & Robinson, K. (2016). Investigating the impact of NAPLAN on student,
parent and teacher emotional distress in Independent schools. The Australian Educational
Researcher, 43(3), 327–343.
Rubio, D. M., & Gillespie, D. F. (1995). Problems with error in structural equation models. Structural
Equation Modeling: A Multidisciplinary Journal, 2(4), 367–378.
Segool, N. K., Carlson, J. S., Goforth, A. N., Von Der Embse, N., & Barterian, J. A. (2013). Heightened
test anxiety among young children: Elementary school students’ anxious responses to high-stakes
testing. Psychology in the Schools, 50(5), 489–499.
Shine, K. (2015). Are Australian teachers making the grade? A study of news coverage of NAPLAN
testing. Media International Australia, 154(1), 25–33.
Smith, M. L. (1991). Put to the test: The effects of external testing on teachers. Educational Researcher,
20(5), 8–11.
Strauss, A., & Corbin, J. (1990). Basics of qualitative research: Grounded theory procedures and
techniques. Newbury Park, CA: Sage.
Thompson, G. (2013). NAPLAN, MySchool and accountability: Teacher perceptions of the effects of
testing. The International Education Journal: Comparative Perspectives, 12(2), 62–84.
Thompson, G., & Harbaugh, A. G. (2013). A preliminary analysis of teacher perceptions of the effects of
NAPLAN on pedagogy and curriculum. The Australian Educational Researcher, 40, 299–314.
Wyn, J., Turnbull, M., & Grimshaw, L. (2014). The experience of education: the impacts of high stakes
testing on school students and their families. A qualitative study. Sydney, NSW: Whitlam Institute.
Dr Shane L. Rogers is a lecturer in Psychology at Edith Cowan University, Perth, Australia. He teaches
introductory psychology and cognition. His research interests include: Interpersonal communication, and
well-being.
Dr Lennie Barblett is an Associate Dean, Early Childhood Studies in the School of Education at Edith
Cowan University, Perth, Australia. Her research interests include: Children’s social and emotional
development, early childhood practices and curriculum development. Other areas of research include
children’s play and Indigenous family literacy practices.
Dr Ken Robinson is leading initiatives on student well-being and motivation, employability, retention
and persistence at Edith Cowan University, Perth, Australia. He is a community psychologist, and his
professional practice is focused upon emotional regulation, attachment, and relational therapy.
Parent and teacher perceptions of NAPLAN in a sample of… 513
123