parched prospects ii: a revised long-term water supply and ... · 2 parched prospects ii: a revised...
TRANSCRIPT
Parched prospects IIA revised long-term water supply and demand forecast for South AfricaSteve Hedden
South AfricA iS overexploiting its water resources at the national level. this means that national
water withdrawals for municipal, industrial and agricultural sectors exceed levels of sustainable
supply. this is based on best estimates of current water withdrawals and current water supply.
‘in many parts of the country, we are fast approaching the point at which all of our easily
accessible freshwater resources are fully utilised. All South Africans must recognise this situation
so that necessary steps are taken to assess current and future demands for water. this will not
be an easy task, but with the necessary resolve to plan and implement the required interventions,
a secure water future can be achieved.’ – NWrS2, 2013, page 4
overexploitation occurs when more water is withdrawn from a water source than is sustainable.
the amount of water that can be reliably or sustainably extracted from a resource is called the yield.
this is determined using a level of assurance. for example, a river may have a yield of 1 km3/year
at a 98% assurance of supply. this means that one cubic kilometre can be extracted from this river
for 98 out of 100 years. if there is above-average rainfall in a given year, more than 1 km3 of water
may be extracted without immediate consequence. But when withdrawals exceed reliable supply,
the system is being overexploited and becomes more vulnerable – this is especially a problem when
there is below-average rainfall.
According to the NWrS2, ‘as at 2012, South Africa has had 16 consecutive years of above-
average rainfall in the majority of summer rainfall areas and in these areas the last major drought
Summaryit is likely that South Africa is overexploiting its water resources at the national
level, as water withdrawals currently exceed reliable supply. using the international
futures forecasting system, this paper forecasts that withdrawals in all three sectors
(municipal, industrial and agricultural) will increase over the next 20 years. Proposed
interventions for increasing supply and reducing demand are not enough to reconcile
the gap between withdrawals and supply. More must be done to bring the South
African water sector into balance and reconcile future national water withdrawals with
future national supply.
AfricAn futureS PAPer 16 | MArcH 2016

2 Parched ProsPects II: a revIsed long-term water suPPly and demand forecast for south afrIca
AfricAn futures PAPer
was more than two decades ago. this trend is unlikely
to continue.’1
Although droughts are inevitable, a stable water sector can
mitigate the negative consequences of droughts. South Africa
is a dry country but through integrated long-term planning, it is
possible to maintain a reliable supply of water for all.
Scope
this paper is an update to an earlier publication, ‘Parched
prospects: the emerging water crisis in South Africa’,2
which was published by the African futures Project (AfP) in
September 2014 (henceforth ‘Parched prospects’). this revised
paper is a product of a collaboration between the AfP and the
Water research commission (Wrc). the AfP is a partnership
between the institute for Security Studies (iSS) and the fredrick
S Pardee center for international futures, at the university
of Denver. Parched prospects estimated current levels of
water supply and demand (withdrawals) in South Africa, and
forecasted them to 2035 using the international futures (ifs)
forecasting system. the ‘Parched prospects’ paper found that
South Africa is currently overexploiting its water resources at the
national level and that the gap between withdrawals and supply
will increase until 2035. the paper presented a reasonable
growth forecast (Mandela Magic Lite), which demonstrated
that increased economic growth would be likely to exacerbate
the water challenges already facing South Africa. it also
presented a closing the Gap scenario, where the gap between
withdrawals and supply is closed by 2035. this positive future
scenario requires additional increases in supply and decreases
in withdrawals beyond the existing interventions outlined in the
latest National Water resource Strategy (NWrS2).
the aim of this study is to forecast quantities of renewable
fresh water. this study is not currently able to forecast
quality of water, nor is the ifs forecasting model (see annex)
able to do so. contaminated water as a result of untreated
municipal wastewater and acid mine drainage is a challenge
for South Africa, but those challenges are outside the scope
of this paper.
it is also outside the scope of this study to outline the exact
reconciliation measures that will be most suitable and cost-
effective for each water catchment. there are, however,
some interventions that could contribute to closing the gap
above and beyond the plans outlined in the large-scale
reconciliation strategies. Existing strategies focus mainly
on increased use of surface water through large-scale
infrastructure projects, like dams and water-relocation
schemes. use of groundwater, wastewater treatment and
municipal water demand management will also be needed to
close the gap between supply and demand.
Current water withdrawals
to estimate current levels of water withdrawals,6 this paper
uses data from the uN food and Agriculture organization’s
Aquastat database. it is important to prioritise Aquastat
data because the withdrawal categories in this dataset –
agriculture, municipal and industrial – are mutually exclusive.
By estimating and forecasting these categories separately,
the model ensures that withdrawals are not double-counted
or under-counted. Since much of the data in Aquastat for
South Africa is outdated, this paper estimates current water
withdrawals based on the changes in underlying variables
(see appendix). the paucity of water withdrawal data also
speaks to the need for more research on quantifying current
levels of water demand.
the largest user of water in South Africa is the agricultural
sector. the most recent data available on agricultural water
withdrawals in the Aquastat database come from 2000, at
7.836 km3.7 the 2004 NWrS estimated that agricultural
water withdrawals for irrigation were 7.92 km3 in 2000.8
Aquastat also has data on the area of land equipped for
irrigation, which is strongly correlated with agricultural water
demand. the area of land equipped for irrigation in South
Africa in 2000 was 1.498 million hectares. irrigation levels
have increased in South Africa and Aquastat estimates
that in 2012, 1.601 million hectares of South African land
were equipped for irrigation. therefore, agricultural water
withdrawals are likely to have increased since 2000. this
paper estimates current agricultural water withdrawals to be
8.9 km3 in 2014.
South Africa is a dry country but it is possible to maintain a reliable water supply for its population
Since the publication of the initial paper, water challenges in
South Africa have become more pronounced. South Africa
is facing its worst drought episode in several decades and in
November 2015, five provinces were declared disaster areas.3
Looking to the future, the intergovernmental Panel on climate
change (iPcc) forecasts a downward trend in precipitation in
western South Africa and that the south-western region will be
at high risk of severe drought over the 21st century.4 that said,
many of the water resource stresses caused by climate change
can be mitigated through the long-term adaptation and planning
approaches outlined in this paper.5

african futures paper 16 • MarcH 2016 3
the second largest user of water in South Africa is the municipal sector. Municipal
water withdrawals are usually calculated as the total water withdrawn by the public
distribution network.9 the latest data for South Africa on municipal water withdrawals
from Aquastat is from 2005. it is estimated that 4.893 km3 of water was withdrawn for
municipal use in that year.10 Since 2005 the South African population has grown from
48.24 to 54 million people. in addition, incomes have increased, many more people
have been connected to piped water and more people have moved to urban areas.
for these reasons, municipal water withdrawals are likely to have increased since then.
using the same assumptions used to forecast municipal water demand, this paper
estimates municipal water withdrawals to be 5.6 km3 in 2014.
EStiMAtED totAL voLuME of WAtEr WithDrAWAL iN
South AfricA iN 2014
15•6 km3
South Africa’s water challenges have become more pronounced and the country is facing its worst drought in several decades
the third largest user of water is the industrial sector. Aquastat defines industrial
water demand as self-supplied industries not connected to the public distribution
network. if an industry is connected to the public distribution network, it falls under the
municipal water demand category. the latest data on industrial water demand from
Aquastat is from 2005 and the estimate is that 0.9475 km3/year was withdrawn by
industry.11 the 2004 NWrS estimated that 0.755 km3/year went towards ‘mining and
bulk industrial’ and that 0.297 km3/year went towards power generation.12 the size of
the manufacturing sector and the amount of thermo-electric power generation have
increased since 2005, so this paper estimates that 1.1 km3 was withdrawn in 2014 for
industrial purposes.
therefore, the total volume of water withdrawal in 2014 in South Africa is estimated to
be 15.6 km3.
Agriculture industrial Municipal
cub
ic k
ilom
etre
s
12
10
8
6
4
2
0
1990
1995
2000
2005
2010
2014
Source: Historical data (solid lines) comes from the Aquastat database; forecasted values (dashed lines) are based on the authors’ calculations.
figure 1: Water withdrawals for the three sectors
4 Parched ProsPects II: a revIsed long-term water suPPly and demand forecast for south afrIca
AfricAn futures PAPer
Current water supply
Most water in South Africa is surface water – in other words, water that flows on
the surface of the earth and is held in dams. Not all surface water is available for
withdrawal, however. Some surface water must be retained in dams and rivers
to maintain the ecological health of the water system or because of downstream
requirements. Additionally, the level of water available varies throughout the year,
and from year to year. therefore, the amount of water that can be reliably extracted
depends on this variability. using these criteria, Aquastat estimates levels of exploitable
annual surface water, or yield.13 Aquastat estimates that there is 10.93 km3/year of
exploitable regular renewable surface water in South Africa, and this is the figure used
to initialise the ifs model.14 the model forecasts that annual exploitable surface water
increased to 11.14 km3/year by 2014, largely due to the construction of infrastructure,
like dams. this figure, however, does not take into account any seasonal variation in
water supply, such as droughts.
Over 80% of South Africans will live in urban areas by 2035, which should lead to better water-efficiency policies and technologies over time
treated municipal wastewater is the second largest source of renewable water
in South Africa. of the 3.541 km3 of municipal wastewater that was produced in
2009, 1.919 km3 was treated.15 the model estimates that the amount of treated
wastewater has increased and that the volume came to 2.1 km3 in 2014.16 Some of
this wastewater is directly reused and some is released back into the system for use
downstream. the portion of treated municipal wastewater that is not directly reused is
considered secondary discharge and contributes to increases in surface-water yield.
Exploitable regular renewable groundwater was estimated by Aquastat to be
1.042 km3/year in 2012. According to the NWrS2,
the most recent estimate of sustainable potential yield of groundwater resources
at high assurance is 7.5 km3/[annum], while current groundwater use is estimated
at around 2 km3/[annum]. Allowing for an underestimation on groundwater use,
about 3.5 km3/[annum] could be available for further development.17
this research estimates that current groundwater use is 2.04 km3/year in South Africa
in 2014.
Desalination of seawater is the final source of renewable water in South Africa,
though it constitutes a small portion of the total. this paper estimates/calculates that
0.024 km3 of desalinated water was produced in 2014.
therefore, the overall annual water supply in South Africa is estimated to be 15.3 km3.
Forecasting water demand
Municipal
Since the publication of the ‘Parched prospects’ paper, further refinements have been
made to the water sub-module of the ifs forecasting system. Along with using the size
of the urban population to forecast municipal water withdrawals, the model also now
EStiMAtED ovErALL ANNuAL WAtEr SuPPLy
iN South AfricA
15•3 km3
african futures paper 16 • MarcH 2016 5
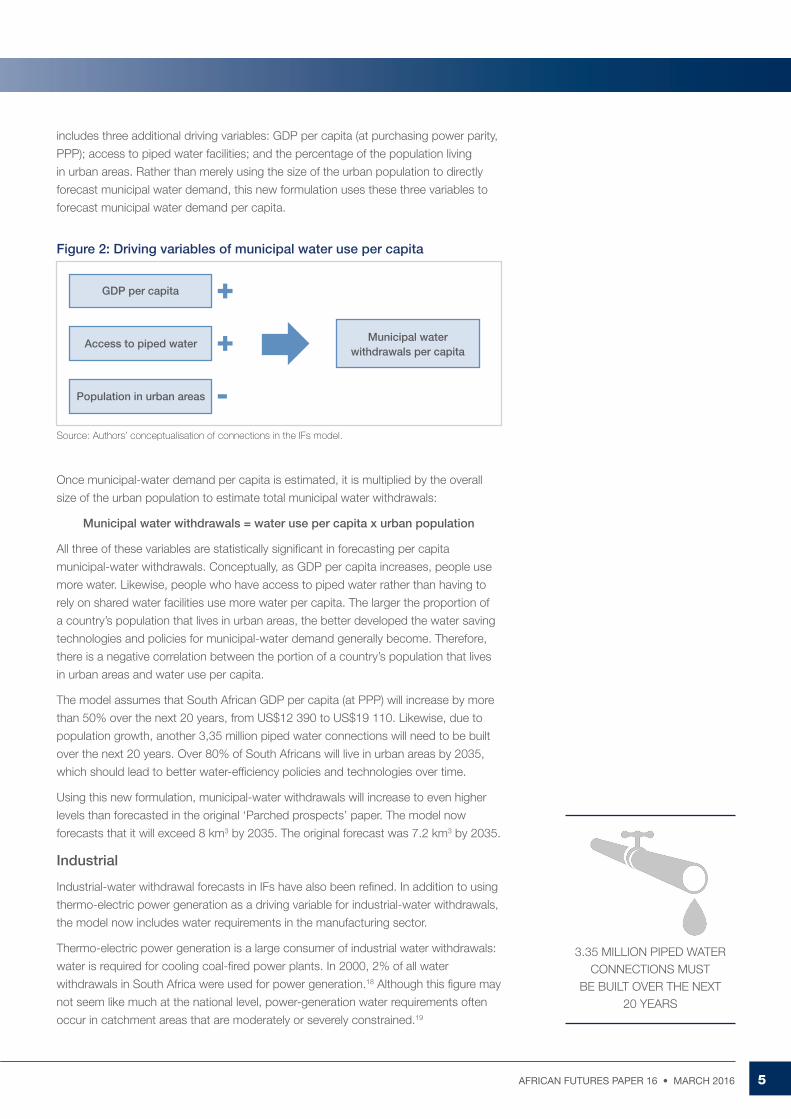
includes three additional driving variables: GDP per capita (at purchasing power parity,
PPP); access to piped water facilities; and the percentage of the population living
in urban areas. rather than merely using the size of the urban population to directly
forecast municipal water demand, this new formulation uses these three variables to
forecast municipal water demand per capita.
figure 2: Driving variables of municipal water use per capita
Source: Authors’ conceptualisation of connections in the IFs model.
once municipal-water demand per capita is estimated, it is multiplied by the overall
size of the urban population to estimate total municipal water withdrawals:
Municipal water withdrawals = water use per capita x urban population
All three of these variables are statistically significant in forecasting per capita
municipal-water withdrawals. conceptually, as GDP per capita increases, people use
more water. Likewise, people who have access to piped water rather than having to
rely on shared water facilities use more water per capita. the larger the proportion of
a country’s population that lives in urban areas, the better developed the water saving
technologies and policies for municipal-water demand generally become. therefore,
there is a negative correlation between the portion of a country’s population that lives
in urban areas and water use per capita.
the model assumes that South African GDP per capita (at PPP) will increase by more
than 50% over the next 20 years, from uS$12 390 to uS$19 110. Likewise, due to
population growth, another 3,35 million piped water connections will need to be built
over the next 20 years. over 80% of South Africans will live in urban areas by 2035,
which should lead to better water-efficiency policies and technologies over time.
using this new formulation, municipal-water withdrawals will increase to even higher
levels than forecasted in the original ‘Parched prospects’ paper. the model now
forecasts that it will exceed 8 km3 by 2035. the original forecast was 7.2 km3 by 2035.
industrial
industrial-water withdrawal forecasts in ifs have also been refined. in addition to using
thermo-electric power generation as a driving variable for industrial-water withdrawals,
the model now includes water requirements in the manufacturing sector.
thermo-electric power generation is a large consumer of industrial water withdrawals:
water is required for cooling coal-fired power plants. in 2000, 2% of all water
withdrawals in South Africa were used for power generation.18 Although this figure may
not seem like much at the national level, power-generation water requirements often
occur in catchment areas that are moderately or severely constrained.19
3.35 MiLLioN PiPED WAtEr coNNEctioNS MuSt
BE BuiLt ovEr thE NExt 20 yEArS
GDP per capita
Access to piped water
Population in urban areas
Municipal water withdrawals per capita
+
+
-
6 Parched ProsPects II: a revIsed long-term water suPPly and demand forecast for south afrIca
AfricAn futures PAPer
this updated industrial water withdrawal forecast has also taken into account research
done by the Wrc, published as ‘Long term forecasts of water usage for electricity
generation: South Africa 2030’.20 the model assumes that thermo-electric power
generation in South Africa consumes 1,85 litres/kWh (kilowatt-hours). this is assumed
to decrease to 1,78 litres/kWh by 2035 due to the implementation of dry-cooling
water-saving technologies.21
According to the 2010 integrated resource Plan, the national long-term energy
plan, electricity-generating capacity will double by 2030, and nearly half of the new
capacity will be from thermo-electric power plants (coal, gas and nuclear).22 the
model estimates that current water consumption for thermo-electric power generation
is 0.46 km3 and that it will rise to nearly 0.5 km3 by 2020.23 Due to the onset of
renewable energy and the increased penetration of dry-cooling technologies, water
consumption for electricity generation will decrease after 2020. this is based on the
assumptions used to forecast industrial water demand for electricity generation
(see Appendix).
According to the 2010 Integrated Resource Plan, electricity-generating capacity in South Africa will double by 2030
Another component of industrial water withdrawals is the manufacturing sector.
Although the size of the manufacturing sector in South Africa is likely to decrease
in relative terms (i.e. as a percentage of total GDP), it is likely to grow in absolute
terms. this translates into an overall increase in industrial water withdrawals for
manufacturing purposes.
While the uptake of renewable energy will mitigate industrial water demand increases,
the growth in thermo-electric power generation along with the increasing absolute
size of the manufacturing sector will result in industrial water withdrawals to increase
from 1.1 km3 in 2014 to 1.2 km3 by 2035.
Agriculture
the National Development Plan (NDP) sets a target of increasing the land under
irrigation by 500 000 hectares.24 the latest National Water resource Strategy
(NWrS2), however, has set a target of more than a 50% increase of land under
irrigation in South Africa – which would be even greater than 500 000 hectares.25 yet
the NWrS2 also states that ‘additional water for increase in irrigation in South Africa
is very limited and moving some water from irrigation to other use must already be
considered in certain areas’.26 Due to the constraints on water use, the scenarios in
the NWrS2 do not foresee any increase in agricultural water demand.27
Since irrigation is the largest driver of agricultural water withdrawals in the ifs model,
increasing the area of land equipped for irrigation leads to an increase in agricultural
water withdrawals. in the current Path scenario, agricultural water withdrawals
increase to 9.7 km3 by 2035.
overall water withdrawals will therefore increase from 15.6 km3 in 2014 to 18.9 km3
by 2035.
NEArLy hALf of South AfricA’S NEW ELEctricity
cAPAcity WiLL BE froM thErMo-ELEctric
PoWEr PLANtS

african futures paper 16 • MarcH 2016 7
Forecasting water supply
to refine the water-supply forecast the authors have looked at not only the NWrS2,
but also every published large-scale water reconciliation strategy from the Department
of Water and Sanitation (DWS) and other departments.28 the NWrS2 includes
reconciliation strategies for some large-scale water catchments, but additional studies
have been conducted by the DWS since 2012. this research includes all of the
available completed reconciliation strategies for all large-scale water catchments.
Although these reconciliation strategies do not cover the entire land area of South
Africa, they do cover all of the main urban areas as well as the major sources of
water supply (i.e. all major rivers). therefore, while the sum of these interventions
does not constitute a complete national water reconciliation plan, it does provide a
good approximation.29
compiling all of the reconciliation strategies, the DWS plans for an increase in yield
of over 3.5 km3/year by 2035. this increase would be achieved by implementing a
number of large-scale infrastructure projects, like the LhWP2, as well as by raising
and constructing dams throughout South Africa. this means the total system yield in
2035 will be 17.8 km3 (see figure 4).
figure 3: total water withdrawals in 2014 and 2035 in the current Path scenario
Municipal
industrial
Agriculture
2014 – 15,6 km3
8,9 km3
5,6 km3
1,1 km3
2035 – 18,9 km3
9,7 km3
8 km3
1,2 km3
Source: IFs version 7.13. Area of pie charts scaled to overall water withdrawals.
South Africa’s latest National Water Resource Strategy has set a target of more than a 50% increase of land under irrigation
this supply forecast is considerably higher than the supply forecast presented in
‘Parched prospects’. in that paper, supply was expected to increase only to 16.4 km3
by 2035. the original supply forecast relied on information explicitly outlined in the
NWrS2, while the supply forecast in this paper relies on information extracted from
every large-scale reconciliation strategy. it is important to recognise that this supply
forecast is compiled using every single explicit yield increase from the reconciliation
strategies and that some of these planned increases are actually only options, which
may or may not be pursued.30
ovErALL WAtEr WithDrAWALS WiLL
iNcrEASE froM 15.6 kM3 iN 2014 to 18.9 kM3 By 2035

8 Parched ProsPects II: a revIsed long-term water suPPly and demand forecast for south afrIca
AfricAn futures PAPer
in addition to the planned yield increases, the reconciliation strategies also identify
WcWDM interventions. these interventions occur in most catchments and account
for a demand reduction of 0.571 km3 by 2035. these interventions are not included in
figure 4.
The Current Path scenario
the current Path is a scenario in which water demand increases in line with the
assumptions made above in Section 3.1, ‘forecasting water demand’, and supply
increases in line with all large-scale water reconciliation strategies. in this scenario,
every single intervention aimed at increasing supply and every intervention aimed at
reducing demand is successfully implemented on time. Although commendable, the
proposed supply increases are not enough to meet rising withdrawals, however. using
the model assumptions described above, water withdrawals increase in the current
Path scenario to 18.9 km3 by 2035 (indicated by the blue line in figure 5). All of the
yield increases outlined in all of the water reconciliation strategies amount to a total of
over 3.5 km3 by 2035, but after factoring in yield decreases, the total yield increases
to 17.8 km3 by 2035 (indicated by the grey line in figure 5). these yield decreases are
largely due to increased ecological water requirements as well as yield loss sustained
by the filling of dams.
figure 4: Planned yield increases extracted from all published large-scale reconciliation strategies
Source: All large-scale reconciliation strategies, see endnotes for sources.
Note: The decrease in yield in 2024 is due to the completion of the LHWP2. It will initially decrease the yield as the dam is filled. It will also allow for more water to be used for ecological water requirements, further reducing existing yield.31
catchment
Algoa
Amatole
kZN coastal metro area
Luvuvhu and Letaba
Mangaung
Mbombela
oliphants
orange
richards Bay
vaal
Western cape
Existing yield
cub
ic k
ilom
etre
s
18,5
18,0
17,5
17,0
16,5
16,0
15,5
15,0
14,5
2006
2007
2008
2009
2010
2011
2012
2013
2014
2015
2016
2017
2018
2019
2020
2021
2022
2023
2024
2025
2026
2027
2028
2029
2030
2031
2032
2033
2034
2035

african futures paper 16 • MarcH 2016 9
in addition to water supply increases, the large-scale water reconciliation strategies
include interventions aimed at water conservation and water demand management
(WcWDM). these interventions total about 0.57 km3 of water ‘savings’ by 2035.
After accounting for the WcWDM interventions and the yield increases, the model
still forecasts a gap between withdrawals and supply of 0.57 km3 by 2035. this
forecasted gap between withdrawals and supply in 2035 is a significant decrease from
the previous paper’s forecast, largely due to an updated supply forecast. the supply
forecast used in this paper relies on all the large-scale reconciliation strategies that
have been published, as opposed to relying on just the NWrS2.
thE EStiMAtED WAtEr WithDrAWALS By 2035 uNDEr thE currENt
PAth ScENArio
total withdrawals total supply
cub
ic k
ilom
etre
s
20
19
18
17
16
15
14
2014
2015
2016
2017
2018
2019
2020
2021
2022
2023
2024
2025
2026
2027
2028
2029
2030
2031
2032
2033
2034
2035
Source: IFs version 7.13.
figure 5: total water withdrawals for all sectors forecasted to 2035 and total water supply, including yield increases from all large-scale water reconciliation strategies
total withdrawals total supplyWithdrawals from WcWDM
cub
ic k
ilom
etre
s
20
19
18
17
16
15
14
2014
2015
2016
2017
2018
2019
2020
2021
2022
2023
2024
2025
2026
2027
2028
2029
2030
2031
2032
2033
2034
2035
Source: IFs version 7.13.
figure 6: total water withdrawals, including WcWDM, and total water supply
18•9 km3

10 Parched ProsPects II: a revIsed long-term water suPPly and demand forecast for south afrIca
AfricAn futures PAPer
StatsSA conducted a similar forecast in 2010, also based on
data from 2000. they found that water deficits at the catchment
level will increase by 2025 and that catchment-level surpluses
will diminish. they forecasted that the national deficit will range
from 0.234 to 2.044 km3 by 2025.32
The Closing the Gap scenario
As shown, even with the successful implementation of every
intervention in every large-scale reconciliation strategy, the
gap between national water withdrawals and available water
supply persists. this indicates that additional measures –
above and beyond the interventions outlined in the large-scale
reconciliation strategies – will be required to close the gap
by 2035. in the closing the Gap scenario, not only is every
intervention in every reconciliation strategy pursued, but
additional interventions entailing groundwater development,
wastewater treatment and WcWDM are implemented.
a potential reason why groundwater is not prominent in these
reconciliation strategies, which focus primarily on urban areas.
there is, however, a Wrc project (k5/2158) aimed at
‘producing research that will support Local Municipalities
in developing groundwater resources for water supply,
and at informing others in the field.’33 this project has
found that groundwater is a reliable source when managed
properly, and that the costs are comparable with those of
surface-water resources. the project argues that ‘the main
reason groundwater sources fail is because of mechanical
breakdowns and other issues related to operations and
management (o&M), and not a failure of the groundwater
resource itself’.
Wastewater treatment
treating wastewater increases the available supply of water
(through direct reuse) and also the quality of water. According
to the latest Aquastat data on wastewater treatment (from
2009), however, only 54% of municipal wastewater is treated in
South Africa.
South Africa is at a ‘tipping point’ in terms of wastewater
treatment.34 Although the state of wastewater-treatment
facilities in South Africa has been improving, according to the
2014 Green Drop Report, nearly one quarter of all wastewater-
treatment systems are in a ‘critical state’.35 Seven of the
large-scale reconciliation strategies reviewed for this paper set
explicit targets for increasing the use of treated wastewater.
these interventions amount to 0.22 km3 of increased yield
by 2035.
the ifs model, however, forecasts that nearly 5.1 km3 of
municipal wastewater will be produced in 2035, so there is
certainly the possibility of increasing available yield through
the treatment of municipal wastewater. failure to treat this
wastewater will endanger the quality of water resources in
South Africa.
Water conservation and water demand management
Non-revenue water is both a challenge and an opportunity in
South Africa. Non-revenue water refers to water that is either
unbilled or ‘lost’ before it reaches the consumer. the DWS
has instituted a ‘War on Leaks’ campaign to reduce municipal
water that is lost annually through leaks. the recent drought is
likely to further incentivise water-conservation policies.
According to a 2012 Wrc report, the proportion of non-
revenue water in South Africa is 36,8%,36 most of which is the
result of physical losses, or leaks. in fact, 25,4% of municipal
water is lost through leaks. Although this level of non-revenue
The main reason groundwater sources fail is because of mechanical breakdowns
the largest increases in water supply outlined in the
reconciliation strategies come from large-scale surface-water
infrastructure projects, such as the Lesotho highlands Water
Project Phase 2 (LhWP2), the vioolsdrift and Gariep Dams
in the orange river catchment, the Mielietuin Dam in the
richards Bay catchment, along with many others. increases in
yield from surface-water infrastructure account for about 86%
of all planned increases in yield. Although such large-scale
infrastructure projects are often necessary, there are additional
ways to reconcile supply and demand rather than just by
building dams. Additional measures must be taken to both
increase available water supply and decrease demand.
Groundwater
Groundwater is an overlooked renewable water resource.
this research (Parched prospects ii) estimates that current
groundwater use was 2.04 km3/year in South Africa in 2014.
there is the potential to increase the sustainable extraction of
groundwater to increase national water supply.
there are only three explicit targets for increasing groundwater
extraction in the large-scale reconciliation strategies, which
account for just 0.08 km3 by 2035. Groundwater is particularly
well suited to meet agricultural demand and is therefore often
ignored in large-scale urban reconciliation strategies. this is

african futures paper 16 • MarcH 2016 11
water is in line with the global average, there is significant room for improvement.
According to the report, ‘when comparing the unit water use per capita, South Africa
appears to have a relatively high per capita water use, which suggests consumers
waste water, and there is significant scope to reduce the unit consumption’.37
An additional reason for concern is the fact that only 45% of municipalities could
provide sufficient information to assess their level of non-revenue water. this means
that 55% of municipalities are not even aware of whether or not they have a problem.
Nine of the large-scale reconciliation strategies outline WcWDM interventions,
which amount to a 0.571 km3 reduction in demand by 2035. Much of this reduction
(0.22 km3) is expected to come from WcWDM in the vaal river catchment, which
includes the cities of tshwane and Johannesburg. the 2007 WcWDM potential
assessment for the vaal river system aimed for a reduction in demand by 15% by
2025, reducing the per capita per day consumption of water from 330 to 290 litres
per capita per day (l/c/d).38 Nevertheless, this consumption is still well above the
international average of 173 l/c/d.39
Achieving aggressive targets for reducing water demand will require collective action
and a change in the mindset of water consumers. there is, however, huge potential
to reconcile the water system through WcWDM interventions.40
thE DEPArtMENt of WAtEr AND SANitAtioN hAS
iNStitutED A ‘WAr oN LEAkS’ cAMPAiGN to rEDucE WAtEr LoSS
Only 45% of municipalities could provide enough information to assess their non-revenue water level, meaning 55% are not even aware if they have a problem
Conclusion
from the most recently available national data, it is evident that national water
withdrawals in South Africa exceed national reliable supply. this does not mean that
water is being overexploited everywhere – some areas of the country are in balance.
But it is impossible to have a national water deficit without some areas overexploiting
their resources.
using the ifs forecasting system, this paper has forecast water withdrawals for three
key sectors: municipal, industrial and agricultural. According to the assumptions in the
model, withdrawals will increase in each of these sectors over the next 20 years.
to create a plausible water-supply forecast, the research for this paper has turned
to the latest available large-scale reconciliation strategies conducted by the DWS.
the AfP has gone through every one of these reconciliation strategies to identify and
quantify every planned increase in water supply and every intervention designed to
reduce water withdrawals.
this paper then presented the current Path scenario. in this scenario, water
withdrawals increase in all three sectors, municipal, industrial and agricultural. in an
attempt to reconcile water supply and demand, South Africa increases its available
water supply by nearly 2.5 km3 and reduces withdrawals by 0.57 km3 by 2035.
this is in line with all of the planned interventions from all of the large-scale water
reconciliation strategies from the DWS. Even with all of these interventions, however,
withdrawals exceed supply every year through to 2035.

12 Parched ProsPects II: a revIsed long-term water suPPly and demand forecast for south afrIca
AfricAn futures PAPer
this paper then presents the closing the Gap scenario. this
scenario is identical to the current Path, except that additional
measures are taken to reconcile national water withdrawals
with available supply. in the closing the Gap scenario,
water withdrawals increase in all three sectors and all of the
planned interventions from the large-scale water-reconciliation
strategies are implemented on time. Additional measures are
required to close the gap, however. Since most of the planned
supply increases come from an increase in surface-water
supply, these additional measures must come from use of
groundwater, wastewater treatment and WcWDM. With these
additional interventions, withdrawals decrease and supply
increases enough to close the gap by 2035.
Recommendations
the large-scale water-reconciliation strategies analysed for this
research plan to increase national water supply by nearly
2.5 km3 by 2035. Much of this increase in supply will come from
the construction and raising of dams to increase reliable
surface-water yield. these interventions are necessary, as
water demand is growing rapidly. Even with the successful
implementation of these interventions, however, the demand
forecasts explained in this paper indicate that withdrawals
will exceed reliable supply every year through to 2035. this
means that additional interventions on top of the large-
scale reconciliation strategies will be required to bring
withdrawals and supply into balance. this paper makes the
following recommendations:
• Alloftheplannedinterventionsoutlinedinallofthelarge-
scale reconciliation strategies must be completed on time.
•Groundwaterisanunder-usedresourceinSouthAfrica.
research indicates that the main constraint on groundwater
use is not the availability of the resource but problems related
to operation and maintenance.
•Only54%ofmunicipalwastewateristreatedinSouthAfrica
and nearly a quarter of wastewater treatment facilities are in a
critical state. Growing municipal water demand will translate
into growing municipal wastewater, and facilities must be put
in place to treat this wastewater. this will increase the overall
supply of water in South Africa along with water quality.
There is a thriving water-research community in South Africa and an abundance of data
• Thereissignificantroomforimprovementintermsof
WcWDM. this can be achieved by reducing non-revenue
water and by reducing per capita water use.
• Settingandachievingthenecessarytargetstoclosethe
gap between withdrawals and supply require strategic
foresight based on plausible forecasts. Strategic foresight is
an iterative process, and the forecasts in this paper must be
analysed and improved as more data becomes available and
assumptions change.
• Plausibleforecastsrequiretimelydata.Thereisathriving
water-research community in South Africa and an abundance
of data, but this data is often not in a standardised format
that can be easily analysed. Studies done at the municipal,
provincial and catchment levels are not directly comparable
because of differences in geographic scope. furthermore,
it is difficult to aggregate this data to create a national water
balance. More research is required to create a coherent
national water balance using all available research at all
geographic levels of analysis. this paper is a first step in
that direction.

african futures paper 16 • MarcH 2016 13
Appendix: Model documentation41
the international futures (ifs) forecasting model is a long-term, global forecasting
system. ifs uses over 3 000 datasets to forecast over 500 variables for 186 countries
up to 2100. ifs is highly integrated, with each module interacting with every other
module. the main modules in ifs are population, economics, health, education,
infrastructure, governance, agriculture, energy, international-political and the
environment. the water sub-module is a component of the environment module.
Since the water sub-module of the ifs model is in a nascent stage, it is not as
integrated with the other modules. this is a potential area of future research and one
of the aims of future collaboration with the Wrc. ifs is housed at the frederick S.
Pardee center for international futures at the university of Denver.
the water sub-module disaggregates demand into three sectors: municipal, industrial
and agriculture. Supply is disaggregated into five components: surface water,
groundwater, fossil (non-renewable) groundwater, direct reuse of treated wastewater
and desalination. the main driver of municipal water demand is the size of the urban
population. the main drivers of industrial water demand are thermo-electric power
generation and the size of the manufacturing sector. the main driver of agricultural
water demand is the area of land equipped for irrigation.
the model defines surface water and groundwater as exploitable renewable
resources, which accounts for technical-economic, environmental and geopolitical
criteria. this data is calculated at a 98% assurance of supply. Surface-water and
groundwater data comes from the Aquastat database.
fossil groundwater data comes from Aquastat, as well as from other peer-reviewed
articles.42 fossil water is not considered in South Africa however. this portion of supply
follows a simple stock–flow dynamic, with total estimated fossil water being the stock
and annual withdrawals being the flow.
figure 7: conceptualisation of the water sub-module within ifs
Source: Steve Hedden and Jakkie Cilliers, Parched prospects: The emerging water crisis in South Africa, September 2014.
totalrenewable
water resources
Precipitation
Surface
Ground
infrastructure
Supply Demand
return flowsSecondary water
reliable yield
Desalinated
fossil water
Municipal
industrial
Agriculture

14 Parched ProsPects II: a revIsed long-term water suPPly and demand forecast for south afrIca
AfricAn futures PAPer
Direct use of treated municipal wastewater is a portion of
total treated municipal wastewater, which is itself a portion of
total produced municipal wastewater. total municipal water
demand is used to estimate produced municipal wastewater.
the proportion of this produced wastewater that is treated is a
function of GDP per capita.
Desalinated water is driven using a growth rate that diminishes
over time as the gap between demand and supply (if there is
one) decreases.
Since the publication of the original ‘Parched prospects’ paper,
improvements have been made to the water-demand forecasts
in the ifs model. these model updates used feedback from a
two-day water-expert workshop held at the iSS in conjunction
with the Wrc in october 2015.
Municipal water demand update
Previously, ifs used the size of a country’s urban population
to forecast municipal water demand. this relied on a linear
regression between municipal water demand and urban
population. this implicitly assumed that per capita municipal
water demand remains constant. research, however, has
shown that the most important factor in increasing municipal
water demand is income, which drives per capita water use.43
to forecast changes in municipal water demand per capita
over time this paper has used a new equation. the dependent
variable in this equation is municipal water demand per capita.
the independent variables are GDP per capita (at purchasing
power parity); size of the urban population; and the percentage
of the population served with piped water.
Industrial water demand
industrial water demand is calculated as the sum of water
demand for thermo-electric power generation (cooling) and
water demand for the manufacturing sector.
thermo-electric power generation
to forecast water consumption for thermo-electric power
generation, we multiply total non-renewable electricity
generation (in kWh) by a calculated value of water
consumption per kWh. Water use per kWh is calculated as a
function of both water scarcity within a country and the GDP
per capita of the country. the more water-scarce a country is,
the lower the desired water use per kWh. the actual water use
per kWh is determined by this desired value together with the
GDP per capita (PPP) of the country. industrial water demand
for electricity is thus a function of non-renewable electricity
generation, water scarcity and GDP per capita (PPP).
Manufacturing
Although we do not have data on water demand for the
manufacturing sector, using the calculations above for
industrial water demand for electricity generation, we can
estimate the portion of industrial water demand that is
required for the manufacturing sector.
We use the size of a country’s manufacturing sector to
drive industrial water demand for manufacturing. there
is a correlation between this calculated industrial water
demand for manufacturing and the size of the country’s
manufacturing sector.
industrial water demand for manufacturing is calculated
by using the annual growth rate in the size of the
manufacturing sector, adjusted by an elasticity of 0,45. this
elasticity figure (0,45) was calculated using country-specific
elasticities between manufacturing value-added growth
rates and manufacturing water demand growth rates
weighted by GDP.
this new formulation means that industrial water use
per unit of value added from the manufacturing sector
decreases for all income groups.

african futures paper 16 • MarcH 2016 15
Notes
the author would like to thank Barry hughes, Jakkie cilliers,
Zachary Donnenfeld, inga Jacobs, Eiman karar, isa thompson,
Jonathan Moyer, Julia Schuenemann, Amelia Broodryk,
Mark ronan, roger Dickinson, Anu klaassens, and all of the
participants of the two-day expert water workshop for their
valuable feedback and comments.
1 Department of Water Affairs, National Water resource Strategy (NWrS), 2013, p. 4 https://www.dwa.gov.za/nwrs/NWrS2013.aspx, accessed
29 November 2015.
2 Steve hedden and Jakkie cilliers, Parched prospects: the emerging water crisis in South Africa, September 2014, https://www.issafrica.org/publications/papers/parched-prospects-the-emerging-water-crisis-in-south-africa.
3 See the high cost of SA’s worst drought in 23 years, City Press, 8 July 2015, www.news24.com/SouthAfrica/News/the-high-cost-of-SAs-worst-drought-in-23-years-20150708, accessed 1 December 2015; 5 provinces declared drought disaster areas, News 24, 13 November 2015, www.news24.com/SouthAfrica/News/5-provinces-declared-drought-disaster-areas-20151113, accessed 1 December 2015; record-crushing october keeps Earth on track for hottest year in 2015, The Washington Post, 17 November 2015, https://www.washingtonpost.com/news/capital-weather-gang/wp/2015/11/17/record-crushing-october-keeps-earth-on-track-for-hottest-year-in-2015/?source=socnet_fb_cc_20151120_bo_captial-weather_climate_1, accessed 1 December 2015.
4 iPcc, Climate change 2014: Impacts, adaptation, and vulnerability, www.ipcc.ch/report/ar5/wg2/ (see Part B: regional Aspects, chapter 22:
Africa, 1199).
5 ibid., 1237. in response to the risk of compounded stress on water resources from overexploitation, degradation and increased drought stress, the iPcc suggests reducing non-climate stressors on water resources, strengthening institutional capacities for demand management, groundwater assessment, integrated water-wastewater planning, integrated land and water governance, and sustainable urban development (see Part B: regional Aspects, chapter 22: Africa, 1237).
6 for a full description of the water sub-module of ifs see the model documentation at http://pardee.du.edu/ifs-environment-model-documentation.
7 fAo, Aquastat main database, http://www.fao.org/nr/water/aquastat/main/index.stm, accessed 13 November 2015.
8 Department of Water Affairs, National Water resource Strategy, 2004, chapter 2, 29, https://www.dwa.gov.za/nwrs/NWrS2004.aspx, accessed 29 November 2015.
9 fAo, Aquastat main database, http://www.fao.org/nr/water/aquastat/main/index.stm, accessed 13 November 2015. See the Aquastat glossary, www.fao.org/nr/water/aquastat/data/glossary/search.html, accessed 10 November 2015. By this definition, industries that are connected to the municipal network are included in municipal water demand rather than industrial water demand.
10 fAo, Aquastat main database, http://www.fao.org/nr/water/aquastat/main/index.stm, accessed 13 November 2015. this datapoint is modelled in the Aquastat model.
11 ibid.
12 Department of Water Affairs, National Water resource Strategy, 2004, chapter 2, 29, https://www.dwa.gov.za/nwrs/NWrS2004.aspx, accessed 29 November 2015. the sum of these two categories is greater than industrial water withdrawal data in Aquastat for the same year (2000) because some of this is actually part of the public distribution network
and therefore included in the municipal water withdrawal category rather than industrial.
13 Aquastat uses a 90% assurance of supply to assess exploitable regular renewable surface water.
14 this is roughly in line with StatsSA data and therefore with the figures used in the National Water resource Strategy.
15 fAo, Aquastat main database, http://www.fao.org/nr/water/aquastat/main/index.stm, accessed 13 November 2015.
16 ibid.
17 Department of Water Affairs, National Water resource Strategy (NWrS), 2013, https://www.dwa.gov.za/nwrs/NWrS2013.aspx, accessed
29 November 2015.
18 NWrS, National Water resource Strategy, 2004, https://www.dwa.gov.za/nwrs/NWrS2004.aspx, accessed 29 November 2015.
19 for a full detailed report on water use for electricity generation in South Africa, see, A Pouris and GA thopil, Long term forecasts of water usage for electricity generation: South Africa 2030, Wrc report no. 2383/1/14.
20 ibid.
21 this excludes all renewable electricity generation – in other words, the model assumes that only non-renewable electricity generation
consumes water.
22 Steve hedden, Gridlocked: A long-term look at South Africa’s electricity sector, African futures Project, https://www.issafrica.org/futures/papers/gridlocked-a-long-term-look-at-south-africas-electricity-sector.
23 this is roughly in line with the Wrc forecast of electrical water demand increasing from 332 gigalitres in 2013 to 370.5 gigalitres in 2035, A Pouris and GA thopil, Long term forecasts of water usage for electricity generation: South Africa 2030, Wrc report no. 2383/1/14, pg ii.
24 National Development Plan: our future, make it work, 34, www.gov.za/sites/www.gov.za/files/Executive%20Summary-NDP%202030%20- %20our%20future%20-%20make%20it%20work.pdf, accessed 10 November 2015.
25 Department of Water Affairs, National Water resource Strategy (NWrS), 2013, https://www.dwa.gov.za/nwrs/NWrS2013.aspx, accessed
29 November 2015, page 10.
26 ibid. page 11.
27 See Department of Water Affairs, National Water resource Strategy (NWrS), 2013, https://www.dwa.gov.za/nwrs/NWrS2013.aspx, accessed 29 November 2015. ‘for future scenarios, the DWA assumes that the amount of water allocated for agriculture remain the same; all land reform projects and revitalisation of smallholder irrigation schemes will use the same amount of water as before. An increase in irrigation will be effected through water use efficiency, and selected new development, such as in the Mzimvubu.’
28 these include:
J Beumer, Dr M van veelen, S Mallory, D timm, Dr M Levin and team, Development of a reconciliation strategy for the Olifants River Water Supply System, Department of Water Affairs, South Africa, final reconciliation strategy report, December 2011, report no. P WMA 04/B50/00/8310/14.
kornelius riemann, Jaco human and rowena hay, Support to the continuation of the water reconciliation strategy for the Western Cape Water Supply System, Department of Water and Sanitation, status report, october 2014.
DWS, South Africa, Support to the continuation of the water reconciliation strategy for the Western Cape Water Supply System, status report, october 2015, prepared by umvoto Africa (Pty) Ltd in association with WorleyParsons rSA on behalf of the Directorate, National Water
resource Planning.
16 Parched ProsPects II: a revIsed long-term water suPPly and demand forecast for south afrIca
AfricAn futures PAPer
Department of Water Affairs, South Africa, Algoa reconciliation strategy, prepared by E van der Berg and Dr MJ Shand of Aurecon, as part of the Water reconciliation strategy study for the Algoa water supply area, 2011, DWA report no. WMA 15/M00/00/1409/04.
PG van rooyen and study team, Department of Water Affairs, South Africa, Amatole Water Supply System reconciliation strategy, status report, September 2015,
Water reconciliation strategy for the KwaZulu-Natal coastal metropolitan areas, final version, November 2009, DWA report no. PWMA 11/000/00/1107.
Department of Water Affairs, Amatole Water Supply System reconciliation strategy, status report 2012, rev 3, https://www.dwa.gov.za/projects.aspx, accessed 29 November 2015.
Department of Water Affairs, Final reconciliation strategy, water requirements and availability reconciliation strategy for the Mbombela municipal area, february 2014.
Department of Water Affairs, South Africa, Reconciliation strategy report for the large bulk water supply systems of the Greater Bloemfontein area, prepared by Aurecon in association with Ght consulting Scientists and iLiSo consulting as part of the Water reconciliation strategy study for the large bulk water supply systems: Greater Bloemfontein area, 2012, DWA report no. PWMA 14/c520/00/0910/05.
Department of Water Affairs, South Africa, Development of a reconciliation strategy for the Luvuvhu and Letaba Water Supply System: Final reconciliation strategy, executive summary, 2014.
DWS, South Africa, Water reconciliation strategy for Richards Bay and surrounding towns, interventions report, prepared by Aurecon South Africa (Pty) Ltd as part of the Water reconciliation strategy for richards Bay and surrounding towns, 2015.
Department of Water Affairs and forestry, South Africa, Vaal River system: Large bulk water supply reconciliation strategy, second stage reconciliation strategy, March 2009, prepared by DMM Development consultants, Golder Associates Africa, Srk, WrP consulting Engineers and Zitholele consulting, DWAf report no. PrSA c000/00/4406/08.
Department of Water Affairs, South Africa, Development of reconciliation strategies for large bulk water supply systems Orange River: Surface water hydrology and system analysis report, August 2013, prepared by WrP consulting Engineers, Aurecon, Golder Associates Africa and Zitholele consulting, report no. PrSA D000/00/18312/7.
Department of Water Affairs, South Africa, Development of reconciliation strategies for large bulk water supply systems Orange River, 2015.
Department of Water Affairs and forestry, South Africa, The development of a reconciliation strategy for the Crocodile West water supply system, version 1, July 2008, DWAf report no. PWMA 03/000/00/3608.
Department of Water Affairs and forestry, Support to the implementation and maintenance of the reconciliation strategy of the Crocodile West Water Supply System, crocodile West reconciliation strategy, December 2012, DWAf report no. PWMA 03/A31/00/6110/4.
29 the researchers are aware of the All towns Strategies conducted by the DWS but it was not in the scope of this paper to aggregate the reconciliation strategies for all 814 towns.
30 for full documentation of the extracted data from the large-scale reconciliation strategies and metadata, please contact the author at [email protected].
31 StatsSA, National accounts: Water management areas in South Africa, discussion document no. Do405.8, Statistics South Africa, 2010.
32 Department of Water Affairs, National Water resource Strategy (NWrS), 2013, https://www.dwa.gov.za/nwrs/NWrS2013.aspx, accessed
29 November 2015.
33 J cobbing, k Eales, J Gibson, k Lenkow and t rossouw, An appraisal of diverse factors influencing long-term success of groundwater schemes for domestic water supplies, focusing on priority areas in South Africa, Water research commission, September 2014, Wrc report no. 2158/1/14.
34 Wrc, Drivers for wastewater technology selection – Assessment of the selection of wastewater technology by municipalities in relation to the management capability and legislative requirements, 1 December 2012, www.wrc.org.za/Pages/Displayitem.aspx?itemiD=10197&fromurL=%2fPages%2fkh_DocumentsList.aspx%3fdt%3D1%26ms%3D4%3B15%3B%26d%3DDrivers+for+Wastewater+technology+Selection+%E2%80%93+Assessment+of+the+selection+of+wastewater+technology+by+
municipalities+in+relation+to+the+management+capability+and+ legislative+requirements%26start%3D1.
35 See the 2014 Green drop report, https://www.dwa.gov.za/dir_ws/gds/Docs/DocsDefault.aspx.
36 r Mckenzie, ZN Siqalaba and WA Wegelin, the state of non-revenue water in South Africa, Water research commission, 12 August 2012, Wrc report no. tt 522/12.
37 ibid., xiv.
38 this is the latest available report on the DWS website, https://www.dwa.gov.za/Projects/vaal/documents.aspx, accessed 16 December 2015. See also Department of Water Affairs and forestry, South Africa, Potential savings through Wc/WDM in the upper and Middle vaal Water Management Areas, project team: WrP consulting Engineers (Pty) Ltd, DMM Development consultants, and PD Naidoo & Associates, october 2007, report no. PrSA c000/00/4406/02.
39 r Mckenzie, ZN Siqalaba and WA Wegelin, the state of non-revenue water in South Africa, Water research commission, 12 August 2012, Wrc report no. tt 522/12.
40 it is important to note that water supply and demand do not yet equilibrate within the ifs model. WcWDM interventions may have unintended consequences that the model is not yet able to forecast. for example, increasing the efficiency of the system through the ‘war on leaks’ could lead to a reduction in the cost of water supply and an increase in overall water demand. Likewise, water scarcity may lead to more incentives for WcWDM than the model currently forecasts. the 2015/16 drought, for example, may lead to more water efficiency than is currently planned. these interactions will be incorporated into the model in the future.
41 Lr Brown, f christopher and h kane, Vital signs, New york: WW Norton, 1996.
f christopher, facing up to the risks of climate change, in Lr Brown et al (eds), State of the world 1996, New york: WW Norton, 1996, 21–39.
iPcc, Several volumes by various working groups, cambridge university Press, 1995. (See the iPcc web page: www.unep.ch/ipcc/ipcc-0.html.)
J Alcamo, M flörke and M Märker, future long-term changes in global water resources driven by socio-economic and climatic changes, Hydrological Sciences Journal, 52: 2, 2007, 247–275, Doi: 10.1623/hysj.52.2.247.
J kaivo-oja, J Luukhanen and P Malaski, Methodology for the analysis of critical industrial ecology trends: An advanced sustainability analysis of the finnish economy, turku: finland futures research centre, 2002.
S Mori, and M takahaashi, An integrated assessment model for the evaluation of new energy technologies and food production, accepted by International Journal of Global Energy Issues, 1997.
National renewable Energy Laboratory, Consumptive water use for US power production, NrEL/tP-550-33905, www.nrel.gov/docs/fy04osti/33905.pdf.
S Postel, Dividing the waters: food security, ecosystem health, and the new politics of scarcity, Worldwatch Paper 132, Washington, D.c.: Worldwatch institute, September 1996.
robert repetto and Duncan Austin, The costs of climate protection, Washington, D.c.: World resources institute, 1997.

african futures paper 16 • MarcH 2016 17
42 uNESco, Non-renewable groundwater resources, 2006, http://portalsostenibilidad.upc.edu/archivos/fichas/informes/aguassubterraneasnorenovables.guiagestion.pdf. AM MacDonald, Quantitative maps of groundwater resources in Africa, Environmental Research Letters, http://iopscience.iop.org/1748-9326/7/2/024009/pdf/1748-9326_7_2_024009.pdf.
43 J Alcamo, M flörke and M Märker, future long-term changes in global water resources driven by socio-economic and climatic changes, Hydrological Sciences Journal, 52: 2, 2007, 247–275, Doi: 10.1623/hysj.52.2.247.

AfricAn futures PAPer
© 2016, institute for Security Studies
copyright in the volume as a whole is vested in the institute for Security Studies, and no part may be reproduced in whole or in part without the express permission, in writing, of both the author and the publishers.
the opinions expressed do not necessarily reflect those of the iSS, its trustees, members of the Advisory council or donors. Authors contribute to iSS publications in their personal capacity.
iSS PretoriaBlock c, Brooklyn court,
361 veale Street
New Muckleneuk,
Pretoria, South Africa
tel: +27 12 346 9500
fax: +27 12 460 0998
the frederick S. Pardee center for international futuresJosef korbel School of
international Studies
university of Denver
2201 South Gaylord Street
Denver, co 80208-0500
tel: 303-871-4320
www.issafrica.org/futures
http://pardee.du.edu
@Africanfutures
www/facebook.com/
AfricafuturesProject
About the author
Steve hedden is research system developer at the frederick S Pardee
center for international futures at the university of Denver. he was a
researcher at the institute for Security Studies in the African futures and
innovation section until December 2015.
About the African Futures Projectthe African futures Project is a collaboration between the institute
for Security Studies (iSS) and the frederick S. Pardee center for
international futures at the Josef korbel School of international Studies,
university of Denver. the African futures Project uses the international
futures (ifs) model to produce forward-looking, policy-relevant analysis
based on exploration of possible trajectories for human development,
economic growth and socio-political change in Africa under varying
policy environments over the next four decades.
About the ISSthe institute for Security Studies is an African organisation that aims
to enhance human security on the continent. it does independent and
authoritative research, provides expert policy analysis and advice, and
delivers practical training and technical assistance.
African Futures Paper 16
Acknowledgements
this paper was made possible with support from the Water
research commission. the iSS is also grateful for support
from the following members of the iSS Partnership forum: the
governments of Australia, canada, Denmark, finland, Japan,
Netherlands, Norway, Sweden and the uSA.