parameters quantitative parameter - overall pass percentage or pass percentage in a particular...
Post on 18-Dec-2015
222 views
TRANSCRIPT


PARAMETERS
• Quantitative parameter - Overall Pass percentage or Pass percentage in a particular subject is taken as quantitative parameter.
• Qualitative parameter – Summation of marks divided by number of children appeared is taken as qualitative parameter. This is basically mean or average marks obtained by the children.

Units of Analysis and comparison
• State
• District
• Zone
• Govt. Schools
• Private Schools
• All Schools taken together

Highest ever Result
in Pass Percentage
78.05%Pass % in 2004-05 is 76.445

Number of appeared candidates
increased by 6%

Govt. Schools in Top 100 Over All(QI)
• 2004-05 One
• 2005-06 Four

• 100% Result 30 Schools
• 90% and above 169 Schools
In 2005-06
In 2004-05• 100% Result 18 Schools
• 90% and above 150 Schools

Less than 25% Result in Govt. School in 2005-06
NILLess than 25% Result in Govt. School in 2004-05 Four

Top Govt. School in Overall (QI)
R.P.V.V. Gandhi Nagar
Rank 21st
In Overall Delhi Region

7 6 . 4 5 7 5 . 2 9
8 9 . 4 7
7 8 . 0 77 6 . 6 1
8 8 . 6 9
6 5 . 0 0
7 0 . 0 0
7 5 . 0 0
8 0 . 0 0
8 5 . 0 0
9 0 . 0 0
9 5 . 0 0
G O V T A I D E D P U B L
2 0 0 5 2 0 0 6
CBSE CLASS-XII RESULT COMPARISON WITH 2005'S
Sch Type 2005 2006
GOVT 76.45 78.07
AIDED 75.29 76.61
PUBL 89.47 88.69

YearNo. of Students
appearedPass %
1997-98 38033 63.45
1998-99 44918 68.11
1999-00 41828 72.54
2000-01 44044 70.2
2001-02 51560 71.23
2002-03 47849 76.96
2003-04 54341 77.8
2004-05 57616 76.44
2005-06 60570 78.07
CBSE Class-XII Result for the last Nine Years
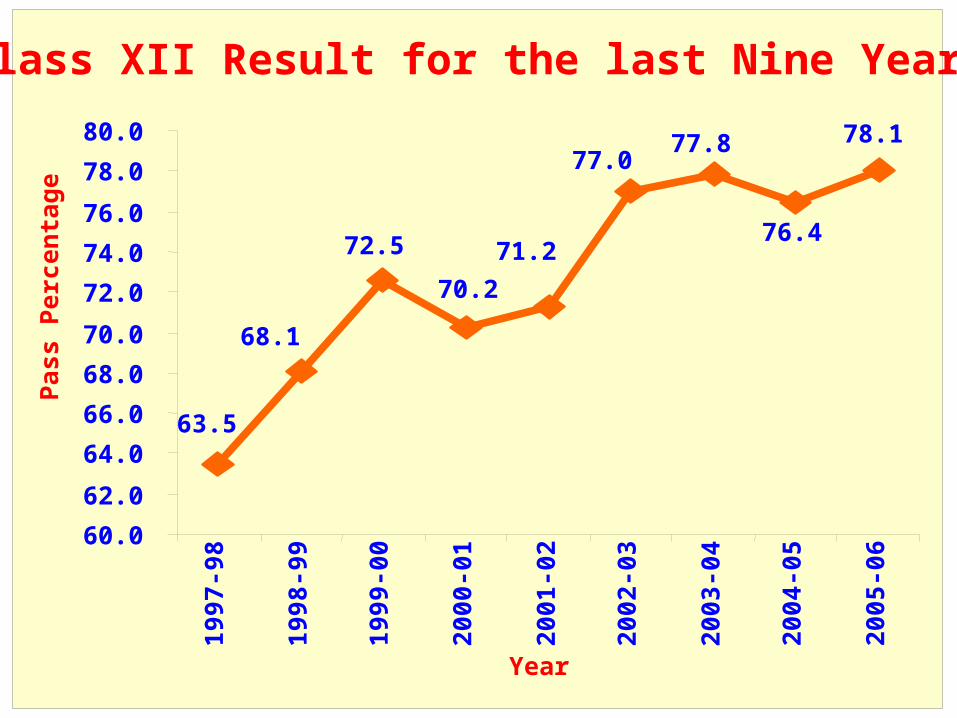
Class XII Result for the last Nine Years
63.5
68.1
72.5
70.2
71.2
77.077.8
76.4
78.1
60.0
62.0
64.0
66.0
68.0
70.0
72.0
74.0
76.0
78.0
80.0
1997
-98
1998
-99
1999
-00
2000
-01
2001
-02
2002
-03
2003
-04
2004
-05
2005
-06
Year
Pas
s P
erce
nta
ge

Result according to category of schools
Sch Type App Pass PP%Total Marks
QI
RPVV 1154 1130 97.92 413297 358
Sarvodaya 31834 25507 80.13 8491919 267
Sen. Sec. 27162 20351 74.92 6974061 257

Like last year, North Delhi has done the best in terms of actual pass percentage.
North West-B follows.

Region-wise CBSE Result comparison with 2005's - Class XII
Region
2006 2005 increase
in PP%
Name of the RDEApp Pass PP% App Pass
PP%
WEST 10050 7996 79.6 9764 7590 77.7 1.8 Sh. R.S. Khokhar
NORTH 12207 9865 80.8 11809 9003 76.2 4.6 Sh. R.S. Khokhar
SOUTH 15936 12223 76.7 14609 11020 75.4 1.3 SH D R TAMTA
EAST 17224 12877 74.8 16352 12376 75.7 -0.9 Dr. M.C. Mathur
Central 5153 4324 83.9 5068 4050 79.9 4.0 Sh. R.S. Khokhar
Total 60570 47285 78.1 57602 44039 76.5 1.6
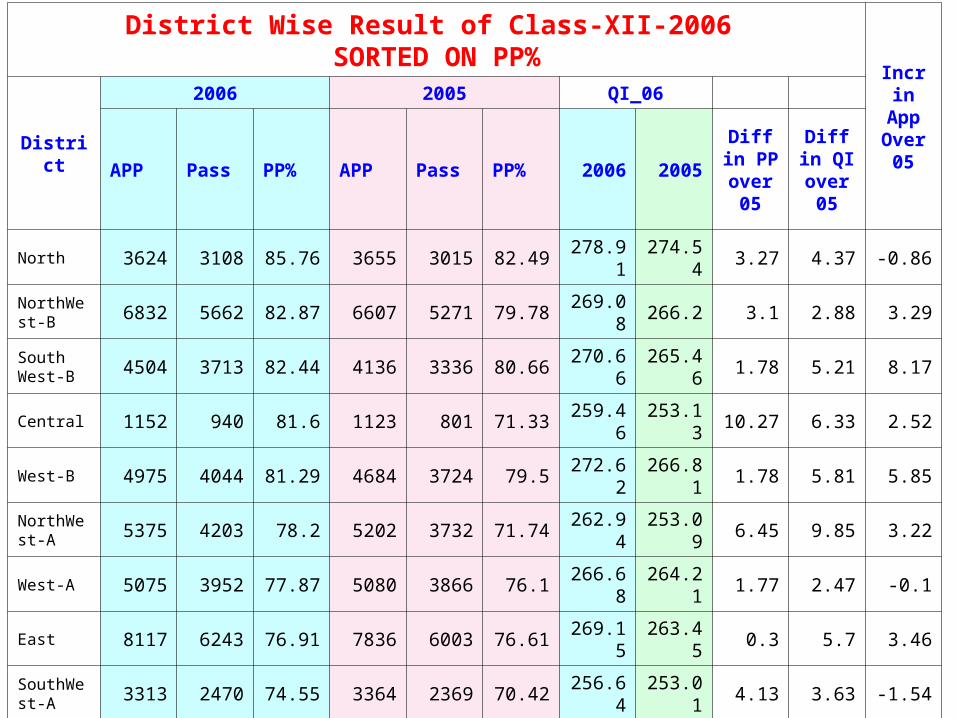
District Wise Result of Class-XII-2006 SORTED ON PP%
Incr in App Over
05District
2006 2005 QI_06
APP Pass PP% APP Pass PP% 2006 2005
Diff in PP
over 05
Diff in QI
over 05
North 3624 3108 85.76 3655 3015 82.49 278.91 274.54 3.27 4.37 -0.86
NorthWest-B 6832 5662 82.87 6607 5271 79.78 269.08 266.2 3.1 2.88 3.29
South West-B 4504 3713 82.44 4136 3336 80.66 270.66 265.46 1.78 5.21 8.17
Central 1152 940 81.6 1123 801 71.33 259.46 253.13 10.27 6.33 2.52
West-B 4975 4044 81.29 4684 3724 79.5 272.62 266.81 1.78 5.81 5.85
NorthWest-A 5375 4203 78.2 5202 3732 71.74 262.94 253.09 6.45 9.85 3.22
West-A 5075 3952 77.87 5080 3866 76.1 266.68 264.21 1.77 2.47 -0.1
East 8117 6243 76.91 7836 6003 76.61 269.15 263.45 0.3 5.7 3.46
SouthWest-A 3313 2470 74.55 3364 2369 70.42 256.64 253.01 4.13 3.63 -1.54
South 8119 6040 74.39 7109 5315 74.76 255.04 255.24 -0.37 -0.2 12.44
New Delhi 377 276 73.21 290 234 80.69 264.75 269.49 -7.48 -4.73 23.08
NorthEast 9107 6634 72.85 8516 6373 74.84 251.12 250.31 -1.99 0.82 6.49
TOTAL 60570 47285 78.07 57602 44039 76.45 263.87 260.28 1.61 3.59 4.9
District 2006 2005
Name of the DDEAPP Pass PP% APP Pass PP% Diff in over 05
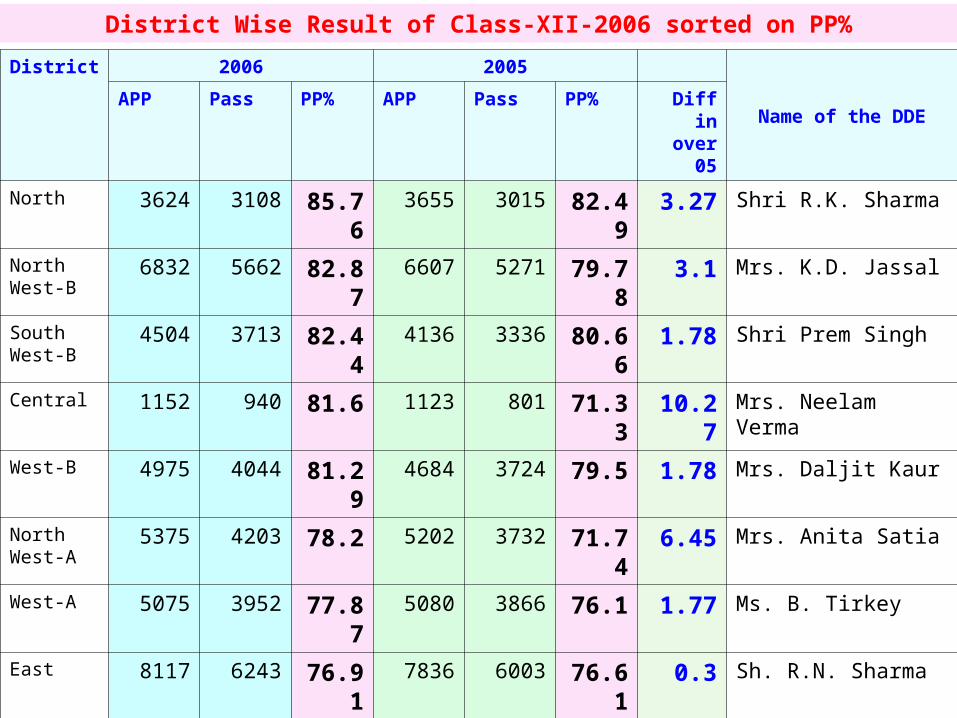
North 3624 3108 85.76 3655 3015 82.49 3.27 Shri R.K. Sharma
North West-B
6832 5662 82.87 6607 5271 79.78 3.1 Mrs. K.D. Jassal
South West-B
4504 3713 82.44 4136 3336 80.66 1.78 Shri Prem Singh
Central 1152 940 81.6 1123 801 71.33 10.27 Mrs. Neelam Verma
West-B 4975 4044 81.29 4684 3724 79.5 1.78 Mrs. Daljit Kaur
North West-A
5375 4203 78.2 5202 3732 71.74 6.45 Mrs. Anita Satia
West-A 5075 3952 77.87 5080 3866 76.1 1.77 Ms. B. Tirkey
East 8117 6243 76.91 7836 6003 76.61 0.3 Sh. R.N. Sharma
South West-A
3313 2470 74.55 3364 2369 70.42 4.13 Sh. R.A. Yadav
South 8119 6040 74.39 7109 5315 74.76 -0.37 Sh. B. N. Bajpai
New Delhi 377 276 73.21 290 234 80.69 -7.48 Mrs.Neelam Verma
North East 9107 6634 72.85 8516 6373 74.84 -1.99 Sh. Dharam Vir Singh
TOTAL 60570 47285 78.07 57602 44039 76.45 1.61
District Wise Result of Class-XII-2006 sorted on PP%

D i s t r i c t w i s e r a n k i n g o n a c t u a l p a s s p e r c e n t a g e
82
.87
82
.44
81
.60
81
.29
78
.20
77
.87
76
.91
74
.55
74
.39
73
.21
72
.85
85
.76
6 5 . 0 0
7 0 . 0 0
7 5 . 0 0
8 0 . 0 0
8 5 . 0 0
9 0 . 0 0N
ort
h
No
rth
We
st-
B
So
uth
We
st-
B
Ce
ntr
al
We
st-
B
No
rth
We
st-
A
We
st-
A
Ea
st
So
uth
We
st-
A
So
uth
Ne
wD
elh
i
No
rth
Ea
st
D i s t r i c t
PP
%

R a n k i n g o n t h e b a s i s o f i n c r e a s e i n p a s s p e r c e n t a g e
1 0 . 2 7
6 . 4 5
4 . 1 3 3 . 2 7 3 . 1 01 . 7 8 1 . 7 8 1 . 7 7
0 . 3 0
- 0 . 3 7- 1 . 9 9
- 7 . 4 8- 1 0 . 0 0
- 8 . 0 0- 6 . 0 0
- 4 . 0 0
- 2 . 0 00 . 0 0
2 . 0 04 . 0 0
6 . 0 0
8 . 0 01 0 . 0 0
1 2 . 0 0
Cen
tral
Nor
thW
est
-A
Sou
thW
est
-A Nor
th
Nor
thW
est
-B
Wes
t-B
Sou
thW
est
-B
Wes
t-A
Eas
t
Sou
th
Nor
thE
ast
New
Del
hi
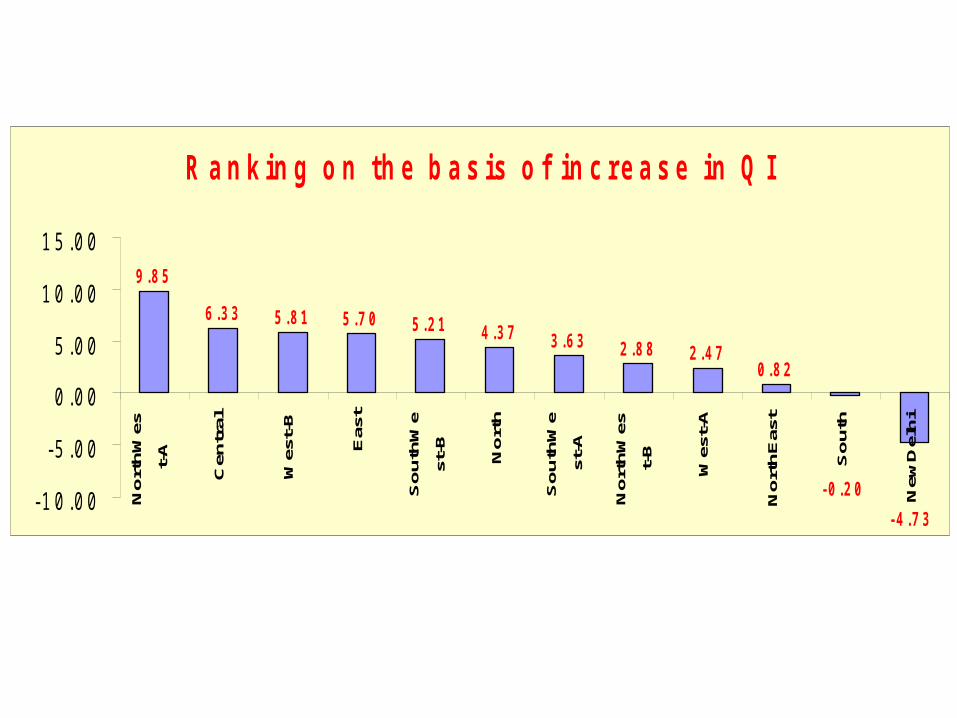
R a n k i n g o n t h e b a s i s o f i n c r e a s e i n Q I
9 . 8 5
6 . 3 3 5 . 8 1 5 . 7 0 5 . 2 1 4 . 3 7 3 . 6 3 2 . 8 8 2 . 4 70 . 8 2
- 0 . 2 0
- 4 . 7 3- 1 0 . 0 0
- 5 . 0 0
0 . 0 0
5 . 0 0
1 0 . 0 0
1 5 . 0 0
No
rth
Wes
t-A
Cen
tral
Wes
t-B
Eas
t
So
uth
We
st-B No
rth
So
uth
We
st-A
No
rth
Wes
t-B
Wes
t-A
No
rth
Eas
t
So
uth
New
Del
hi

D i s t r i c t w i s e c o m p a r i s o n o f C l a s s X I I R e s u l t w i t h 2 0 0 5 ' s
73
.21 8
2.4
4
81
.29
85
.76
74
.39 8
2.8
7
77
.87
81
.60
76
.91
74
.55
78
.20
72
.858
0.6
9
80
.66
79
.50
82
.49
74
.76
79
.78
76
.10
71
.33
76
.61
70
.42
71
.74
74
.84
5 0 .0 0
6 0 .0 0
7 0 .0 0
8 0 .0 0
9 0 .0 0
Ne
w
De
lhi
So
uth
We
st-
B
We
st-
B
No
rth
So
uth
No
rth
We
st-
B
We
st-
A
Ce
ntr
al
Ea
st
So
uth
We
st-
A
No
rth
We
st-
A
No
rth
Ea
st
D is t r ic t
PP
%
2 0 0 6 2 0 0 5
Pass percentage of New Delhi, North East and South Districts, has decreased over 2005 by 7.48%, 1.99% and 0.37 respectively, while remaining districts have increased their pass percentage

Rank ZoneAPP_06
Pass_06 PP_06
1 7 2977 2593 87.10
2 12 1719 1473 85.69
3 13 2476 2094 84.57
4 22 2187 1834 83.86
5 27 631 526 83.36
6 17 2197 1798 81.84
7 14 2065 1688 81.74
8 21 2317 1879 81.10
9 18 2778 2246 80.85
10 1 2072 1672 80.69
11 9 2374 1912 80.54
12 15 1834 1469 80.10
13 8 647 515 79.60
14 28 521 414 79.46
Rank ZoneAPP_06
Pass_06 PP_06
15 11 2637 2095 79.45
16 5 2053 1593 77.59
17 23 2883 2207 76.55
18 10 3001 2291 76.34
19 20 1355 1033 76.24
20 3 2362 1799 76.16
21 2 3683 2772 75.26
22 24 1721 1275 74.08
23 19 1958 1437 73.39
24 6 2994 2196 73.35
25 26 377 276 73.21
26 25 3515 2558 72.77
27 4 4060 2845 70.07
28 16 1176 795 67.60
Ranking of zones on the basis of actual pass percentage
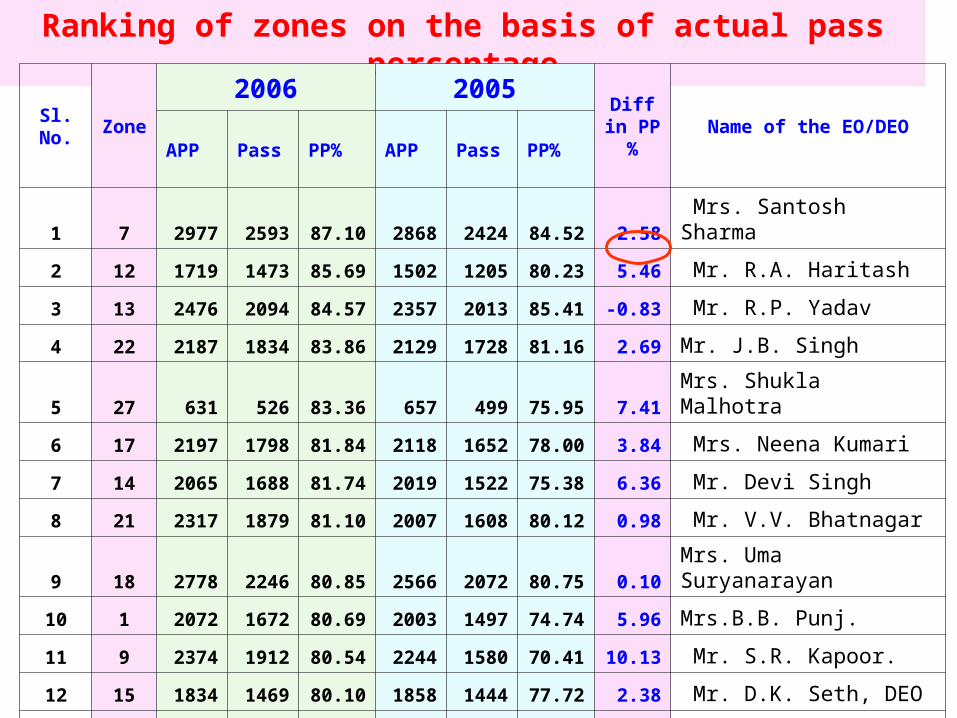
Ranking of zones on the basis of actual pass percentage
Sl. No.
Zone2006 2005
Diff in PP%
Name of the EO/DEOAPP Pass PP% APP Pass PP%
1 7 2977 2593 87.10 2868 2424 84.52 2.58 Mrs. Santosh Sharma
2 12 1719 1473 85.69 1502 1205 80.23 5.46 Mr. R.A. Haritash
3 13 2476 2094 84.57 2357 2013 85.41 -0.83 Mr. R.P. Yadav
4 22 2187 1834 83.86 2129 1728 81.16 2.69 Mr. J.B. Singh
5 27 631 526 83.36 657 499 75.95 7.41 Mrs. Shukla Malhotra
6 17 2197 1798 81.84 2118 1652 78.00 3.84 Mrs. Neena Kumari
7 14 2065 1688 81.74 2019 1522 75.38 6.36 Mr. Devi Singh
8 21 2317 1879 81.10 2007 1608 80.12 0.98 Mr. V.V. Bhatnagar
9 18 2778 2246 80.85 2566 2072 80.75 0.10 Mrs. Uma Suryanarayan
10 1 2072 1672 80.69 2003 1497 74.74 5.96 Mrs.B.B. Punj.
11 9 2374 1912 80.54 2244 1580 70.41 10.13 Mr. S.R. Kapoor.
12 15 1834 1469 80.10 1858 1444 77.72 2.38 Mr. D.K. Seth, DEO
13 8 647 515 79.60 787 591 75.10 4.50 Mr. J.C. Sharma
14 28 521 414 79.46 466 302 64.81 14.66 Mr. Khan Chand

Sl. No. Zone
2006 2005Diff in PP% Name of the EO/DEO
APP Pass PP% APP Pass PP%
15 11 2637 2095 79.45 2748 2053 74.71 4.74 Mrs. P.D. Yadav
16 5 2053 1593 77.59 1972 1536 77.89 -0.30 Mr. R.P. Garg
17 23 2883 2207 76.55 2415 1933 80.04 -3.49 Mrs. Bimla Singh
18 10 3001 2291 76.34 2958 2152 72.75 3.59 Mr. Kshetra Pal
19 20 1355 1033 76.24 1419 976 68.78 7.46 Mr. M.V. S. Thakur.
20 3 2362 1799 76.16 2275 1719 75.56 0.60 Mr. L.R. Sailo
21 2 3683 2772 75.26 3558 2787 78.33 -3.07 Mrs. Savita Kalra
22 24 1721 1275 74.08 1661 1197 72.07 2.02 Mrs. Ritu Marwah
23 19 1958 1437 73.39 1945 1393 71.62 1.77 Mrs. Kullu
24 6 2994 2196 73.35 2917 2139 73.33 0.02 Mrs. Usha Kumari
25 26 377 276 73.21 290 234 80.69 -7.48 Mrs. Mona Sawhney
26 25 3515 2558 72.77 3033 2185 72.04 0.73 Dr. Suman Rekha
27 4 4060 2845 70.07 3627 2698 74.39 -4.31 Mr. A.P. Dondiyal
28 16 1176 795 67.60 1203 900 74.81 -7.21 Mrs. Usha Sahawney
Ranking of zones on the basis of actual pass percentage
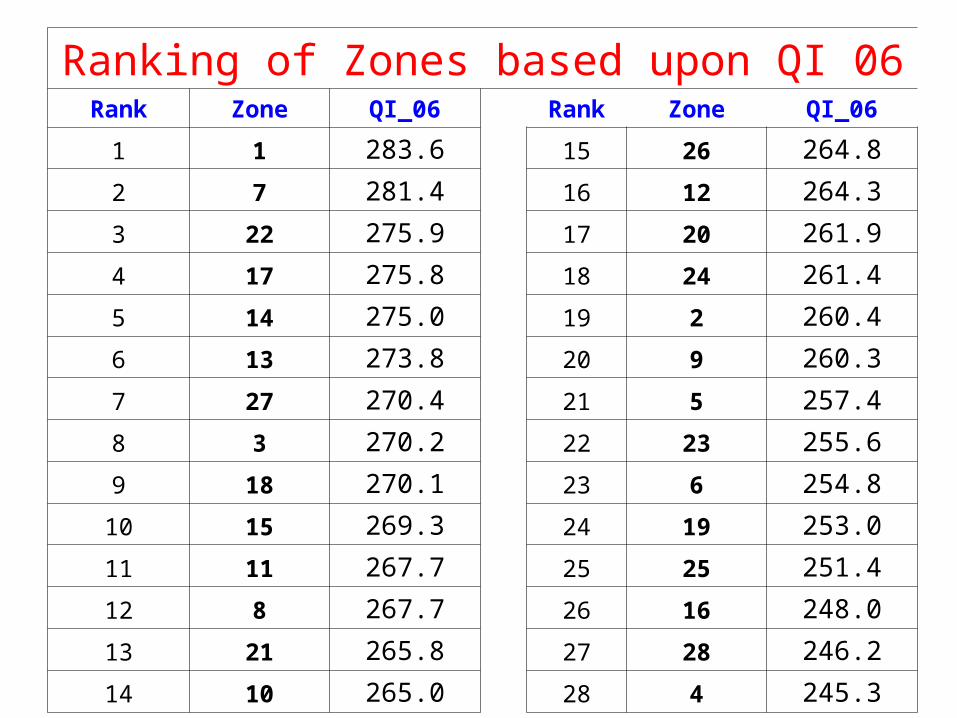
Ranking of Zones based upon QI 06Rank Zone QI_06 Rank Zone QI_06
1 1 283.6 15 26 264.8
2 7 281.4 16 12 264.3
3 22 275.9 17 20 261.9
4 17 275.8 18 24 261.4
5 14 275.0 19 2 260.4
6 13 273.8 20 9 260.3
7 27 270.4 21 5 257.4
8 3 270.2 22 23 255.6
9 18 270.1 23 6 254.8
10 15 269.3 24 19 253.0
11 11 267.7 25 25 251.4
12 8 267.7 26 16 248.0
13 21 265.8 27 28 246.2
14 10 265.0 28 4 245.3
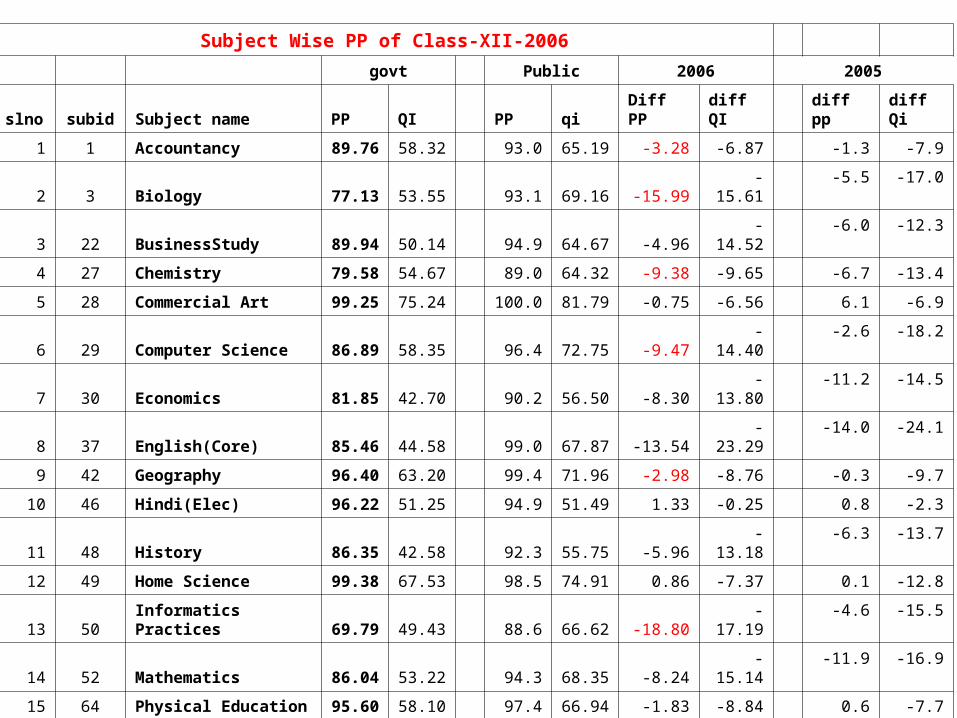
Subject Wise PP of Class-XII-2006
govt Public 2006 2005
slno subid Subject name PP QI PP qi Diff PP diff QI diff pp diff Qi
1 1 Accountancy 89.76 58.32 93.0 65.19 -3.28 -6.87 -1.3 -7.9
2 3 Biology 77.13 53.55 93.1 69.16 -15.99 -15.61 -5.5 -17.0
3 22 BusinessStudy 89.94 50.14 94.9 64.67 -4.96 -14.52 -6.0 -12.3
4 27 Chemistry 79.58 54.67 89.0 64.32 -9.38 -9.65 -6.7 -13.4
5 28 Commercial Art 99.25 75.24 100.0 81.79 -0.75 -6.56 6.1 -6.9
6 29 Computer Science 86.89 58.35 96.4 72.75 -9.47 -14.40 -2.6 -18.2
7 30 Economics 81.85 42.70 90.2 56.50 -8.30 -13.80 -11.2 -14.5
8 37 English(Core) 85.46 44.58 99.0 67.87 -13.54 -23.29 -14.0 -24.1
9 42 Geography 96.40 63.20 99.4 71.96 -2.98 -8.76 -0.3 -9.7
10 46 Hindi(Elec) 96.22 51.25 94.9 51.49 1.33 -0.25 0.8 -2.3
11 48 History 86.35 42.58 92.3 55.75 -5.96 -13.18 -6.3 -13.7
12 49 Home Science 99.38 67.53 98.5 74.91 0.86 -7.37 0.1 -12.8
13 50 Informatics Practices 69.79 49.43 88.6 66.62 -18.80 -17.19 -4.6 -15.5
14 52 Mathematics 86.04 53.22 94.3 68.35 -8.24 -15.14 -11.9 -16.9
15 64 Physical Education 95.60 58.10 97.4 66.94 -1.83 -8.84 0.6 -7.7
16 65 Physics 81.47 56.60 93.3 70.63 -11.86 -14.03 -3.7 -13.4
17 68 Political Science 93.61 51.92 96.1 61.61 -2.52 -9.70 -0.4 -7.3
18 101 Punjabi 96.76 49.33 93.2 49.68 3.60 -0.35 11.0 7.3
19 301 Sanskrit(Core) 94.36 48.12 100.0 59.12 -5.64 -11.00 -4.2 -10.0
20 302 Sociology 98.38 53.55 95.5 63.53 2.84 -9.98 3.1 -8.1
21 322 Urdu(Elec) 98.21 56.04 98.2 63.41 0.00 -7.37 3.3 3.1

Govt(2006) Govt(2005) Diff in PP
Diff in QI
Subject name Appear Pass PP QI Appear
Passed
pp QI
Hindi(Elec) 37530 36112 96.2 51.2 35240 33741 95.7 50.2 0.5 1.0
History 24183 20882 86.3 42.6 22569 19894 88.1 45.1 -1.8 -2.5
Political Science 34019 31845 93.6 51.9 32013 29939 93.5 49.2 0.1 2.8
Geography 8981 8658 96.4 63.2 8234 8193 99.5 63.0 -3.1 0.2
Economics 36064 29520 81.9 42.7 33301 27146 81.5 43.0 0.3 -0.3
Sociology 3337 3283 98.4 53.6 2816 2752 97.7 55.7 0.7 -2.2
Mathematics 19666 16921 86.0 53.2 18355 14856 80.9 47.1 5.1 6.2
Physics 6423 5233 81.5 56.6 6558 6223 94.9 55.3 -13.4 1.3
Chemistry 6409 5100 79.6 54.7 6523 5885 90.2 53.3 -10.6 1.4
Biology 4347 3353 77.1 53.6 4197 3886 92.6 52.9 -15.5 0.7
Physical Education 17675 16898 95.6 58.1 15851 15604 98.4 56.2 -2.8 1.9
Commercial Art 265 263 99.2 75.2 284 283 99.6 71.5 -0.4 3.7
BusinessStudy 17424 15672 89.9 50.1 16335 14644 89.6 49.1 0.3 1.1
Accountancy 16941 15207 89.8 58.3 15723 14956 95.1 58.7 -5.4 -0.3
Home Science 15925 15826 99.4 67.5 14925 14860 99.6 61.6 -0.2 5.9
Informatics Practices
2029 1416 69.8 49.4 3007 2775 92.3 54.4 -22.5 -4.9
Computer Science 1586 1378 86.9 58.3 1924 1843 95.8 57.5 -8.9 0.8
Punjabi 370 358 96.8 49.3 318 312 98.1 51.9 -1.4 -2.5
English(Core) 50561 43209 85.5 44.6 48657 41099 84.5 44.0 1.0 0.5
URDU CORE 51 51 100.0 64.1 384 377 98.2 60.9 1.8 3.2
Sanskrit(Core) 9506 8970 94.4 48.1 8635 8164 94.5 49.1 -0.2 -1.0
Subject wise Result CBSE-2006

Stream wise PP
Stream PP_06 PP_05
Science 69.92 65.1
Arts 79.25 77.7
Commerce 78.48 77.2
vocational 80.08 81.2

zone
science arts commerce vocational
app pass pp app pass pp app pass pp app pass pp
1 472 355 75.21 772 616 79.79 789 669 84.79 64 50 78.13
2 341 200 58.65 2020 1600 79.21 1164 847 72.77 61 46 75.41
3 326 229 70.25 968 706 72.93 979 809 82.64 149 122 81.88
4 377 213 56.50 2657 1864 70.15 717 529 73.78 64 56 87.50
5 271 202 74.54 1186 929 78.33 464 362 78.02 42 29 69.05
6 359 207 57.66 1700 1306 76.82 745 541 72.62 225 170 75.56
7 613 497 81.08 1248 1096 87.82 885 798 90.17 60 57 95.00
8 32 31 96.88 452 351 77.65 184 145 78.80 17 14 82.35
9 255 201 78.82 1168 927 79.37 804 651 80.97 89 74 83.15
10 216 131 60.65 2151 1674 77.82 384 302 78.65 266 206 77.44
11 400 301 75.25 1069 873 81.67 1117 887 79.41 88 73 82.95
12 41 35 85.37 1448 1255 86.67 211 167 79.15 61 49 80.33
13 243 216 88.89 1415 1204 85.09 756 630 83.33 87 77 88.51
14 218 167 76.61 858 707 82.40 854 698 81.73 195 174 89.23
Stream wise zone wise pp

Stream wise zone wise pp
15 214 178 83.18 820 651 79.39 753 606 80.48 91 69 75.82
16 77 41 53.25 579 396 68.39 492 329 66.87 119 78 65.55
17 153 140 91.50 1495 1177 78.73 456 410 89.91 124 104 83.87
18 153 109 71.24 1561 1264 80.97 995 815 81.91 221 192 86.88
19 386 200 51.81 877 728 83.01 662 481 72.66 196 157 80.10
20 124 82 66.13 836 628 75.12 294 241 81.97 90 74 82.22
21 209 140 66.99 1589 1326 83.45 502 400 79.68 47 40 85.11
22 191 137 71.73 1557 1328 85.29 380 312 82.11 43 36 83.72
23 101 41 40.59 1900 1490 78.42 740 570 77.03 78 55 70.51
24 199 153 76.88 696 528 75.86 732 523 71.45 115 81 70.43
25 347 217 62.54 2037 1532 75.21 1006 699 69.48 175 122 69.71
26 45 21 46.67 161 140 86.96 94 56 59.57 55 46 83.64
27 39 27 69.23 429 362 84.38 80 63 78.75 15 11 73.33
28 20 19 95.00 332 271 81.63 160 114 71.25 9 9 100.00
Science Arts Commerce Vocational
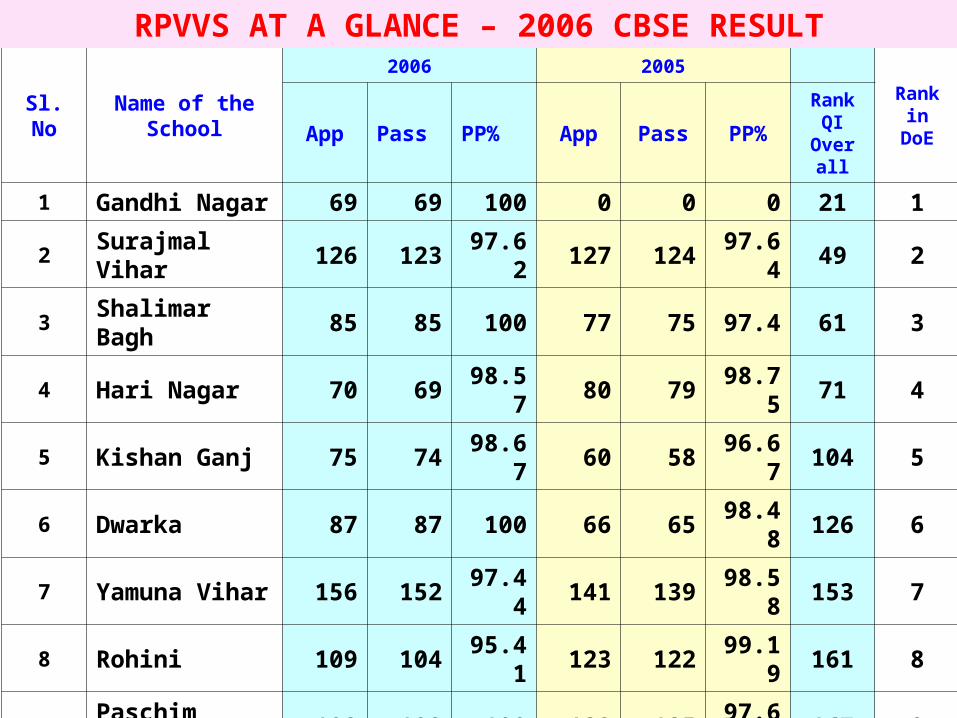
Sl. NoName of the
School
2006 2005
Rank in DoEApp Pass PP% App Pass PP%
Rank QI
Over all
1 Gandhi Nagar 69 69 100 0 0 0 21 1
2 Surajmal Vihar 126 123 97.62 127 124 97.64 49 2
3 Shalimar Bagh 85 85 100 77 75 97.4 61 3
4 Hari Nagar 70 69 98.57 80 79 98.75 71 4
5 Kishan Ganj 75 74 98.67 60 58 96.67 104 5
6 Dwarka 87 87 100 66 65 98.48 126 6
7 Yamuna Vihar 156 152 97.44 141 139 98.58 153 7
8 Rohini 109 104 95.41 123 122 99.19 161 8
9 Paschim Vihar 108 108 100 128 125 97.66 167 9
10 Karol Bagh 20 19 95 25 22 88 177 10
11 Nand Nagri 82 80 97.56 0 0 0 190 11
12 Lodhi Road 53 53 100 48 45 93.75 195 12
13 Vasant Kunj 84 79 94.05 85 78 91.76 233 13
14 Lajpat Nagar 30 28 93.33 0 0 0 309 21
RPVVS AT A GLANCE – 2006 CBSE RESULT

Ludlow Castle Schools CBSE Class-XII Result 2006
Name of the School App pass PP% QI
diff in pp
over 05
diff in QI
over 05
S B B M SARVODAYA VID. SHANKARACHARYA MARG DL
189 181 95.8 310.3 4.42 5.26
S B K V SARVODAYA VIDYALAYA CIVIL LINES DELHI
136 130 95.6 308.2 0.38 -5.48
S A B GOVT SARVODAYA VIDYALAYA LUDLOW CASTLE DLI
119 107 89.9 318.8 -6.05 5.40
S AMIR CHAND SARVODAYA VID SHAM NATH MARG DLI
120 106 88.3 309.8 -4.91 8.00
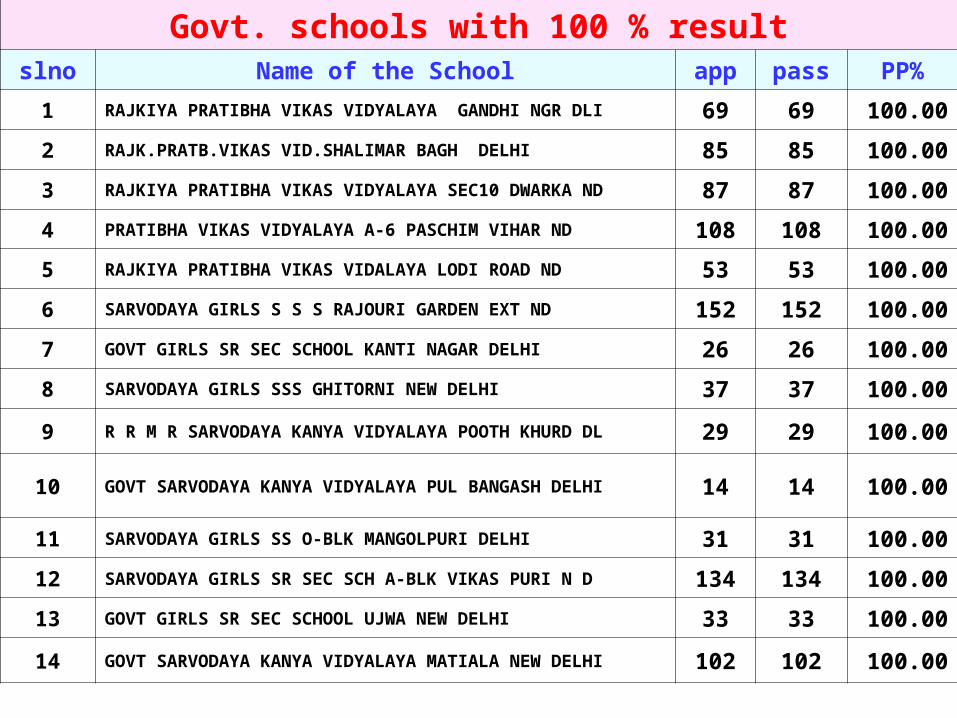
Govt. schools with 100 % resultslno Name of the School app pass PP%
1 RAJKIYA PRATIBHA VIKAS VIDYALAYA GANDHI NGR DLI 69 69 100.00
2 RAJK.PRATB.VIKAS VID.SHALIMAR BAGH DELHI 85 85 100.00
3 RAJKIYA PRATIBHA VIKAS VIDYALAYA SEC10 DWARKA ND 87 87 100.00
4 PRATIBHA VIKAS VIDYALAYA A-6 PASCHIM VIHAR ND 108 108 100.00
5 RAJKIYA PRATIBHA VIKAS VIDALAYA LODI ROAD ND 53 53 100.00
6 SARVODAYA GIRLS S S S RAJOURI GARDEN EXT ND 152 152 100.00
7 GOVT GIRLS SR SEC SCHOOL KANTI NAGAR DELHI 26 26 100.00
8 SARVODAYA GIRLS SSS GHITORNI NEW DELHI 37 37 100.00
9 R R M R SARVODAYA KANYA VIDYALAYA POOTH KHURD DL 29 29 100.00
10 GOVT SARVODAYA KANYA VIDYALAYA PUL BANGASH DELHI 14 14 100.00
11 SARVODAYA GIRLS SS O-BLK MANGOLPURI DELHI 31 31 100.00
12 SARVODAYA GIRLS SR SEC SCH A-BLK VIKAS PURI N D 134 134 100.00
13 GOVT GIRLS SR SEC SCHOOL UJWA NEW DELHI 33 33 100.00
14 GOVT SARVODAYA KANYA VIDYALAYA MATIALA NEW DELHI 102 102 100.00
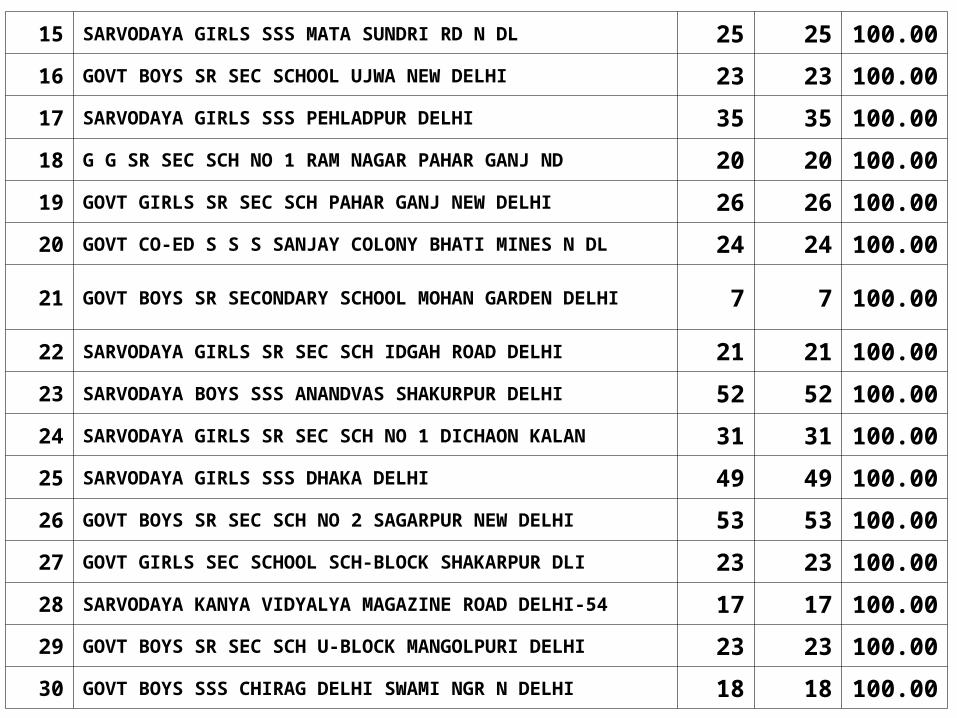
15 SARVODAYA GIRLS SSS MATA SUNDRI RD N DL 25 25 100.00
16 GOVT BOYS SR SEC SCHOOL UJWA NEW DELHI 23 23 100.00
17 SARVODAYA GIRLS SSS PEHLADPUR DELHI 35 35 100.00
18 G G SR SEC SCH NO 1 RAM NAGAR PAHAR GANJ ND 20 20 100.00
19 GOVT GIRLS SR SEC SCH PAHAR GANJ NEW DELHI 26 26 100.00
20 GOVT CO-ED S S S SANJAY COLONY BHATI MINES N DL 24 24 100.00
21 GOVT BOYS SR SECONDARY SCHOOL MOHAN GARDEN DELHI 7 7 100.00
22 SARVODAYA GIRLS SR SEC SCH IDGAH ROAD DELHI 21 21 100.00
23 SARVODAYA BOYS SSS ANANDVAS SHAKURPUR DELHI 52 52 100.00
24 SARVODAYA GIRLS SR SEC SCH NO 1 DICHAON KALAN 31 31 100.00
25 SARVODAYA GIRLS SSS DHAKA DELHI 49 49 100.00
26 GOVT BOYS SR SEC SCH NO 2 SAGARPUR NEW DELHI 53 53 100.00
27 GOVT GIRLS SEC SCHOOL SCH-BLOCK SHAKARPUR DLI 23 23 100.00
28 SARVODAYA KANYA VIDYALYA MAGAZINE ROAD DELHI-54 17 17 100.00
29 GOVT BOYS SR SEC SCH U-BLOCK MANGOLPURI DELHI 23 23 100.00
30 GOVT BOYS SSS CHIRAG DELHI SWAMI NGR N DELHI 18 18 100.00
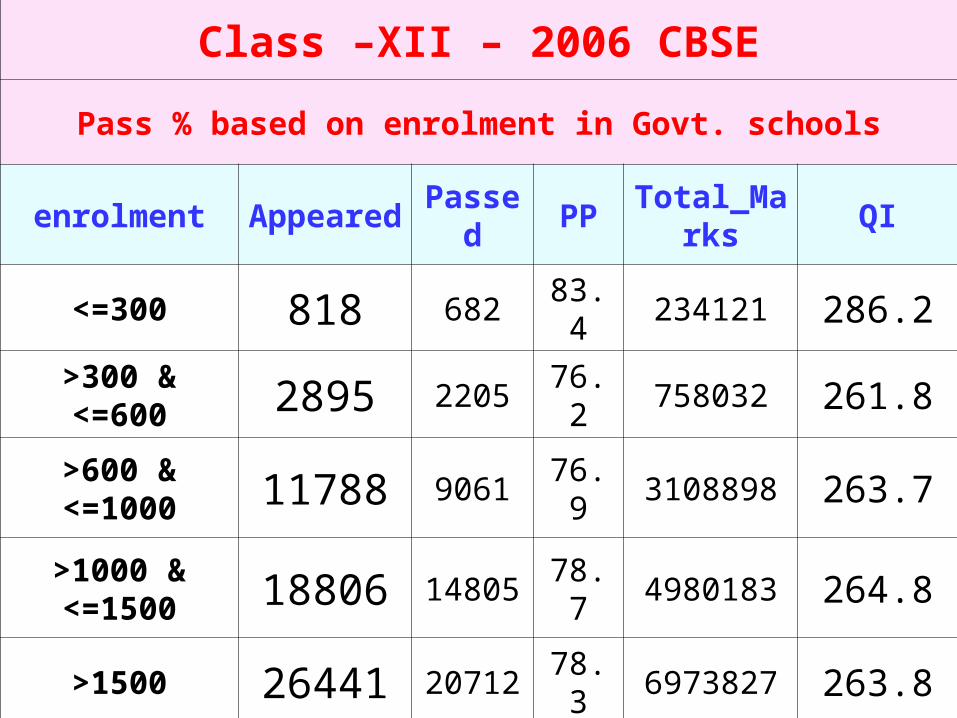
Class –XII – 2006 CBSE
Pass % based on enrolment in Govt. schools
enrolment AppearedPasse
dPP
Total_Marks
QI
<=300 818 682 83.4 234121 286.2
>300 & <=600 2895 2205 76.2 758032 261.8
>600 & <=1000 11788 9061 76.9 3108898 263.7
>1000 & <=1500 18806 14805 78.7 4980183 264.8
>1500 26441 20712 78.3 6973827 263.8
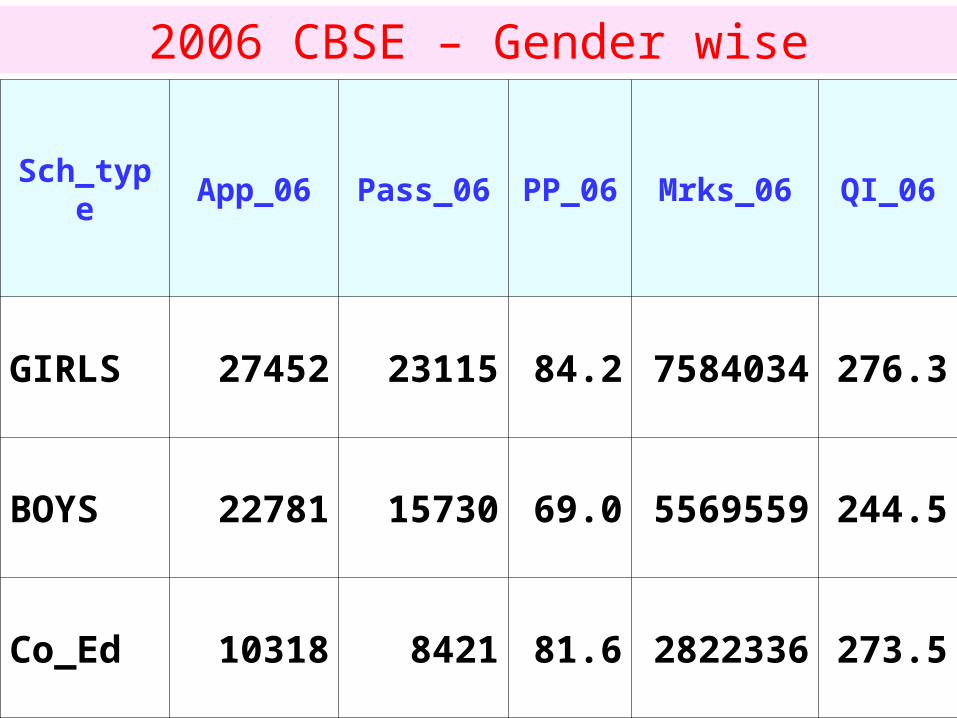
Sch_type App_06 Pass_06 PP_06 Mrks_06 QI_06
GIRLS 27452 23115 84.2 7584034 276.3
BOYS 22781 15730 69.0 5569559 244.5
Co_Ed 10318 8421 81.6 2822336 273.5
2006 CBSE – Gender wise

Shift APP Pass PP% Marks QI
Single 22554 18214 80.8 6088876 270.0
Double 36737 28141 76.6 9570234 260.5
2006 CBSE – Single Shift Vs. Double Shift

Shift APP Pass PP% Marks QI
Morning 42251 34666 82.0 11494677 272.1
Evening 17363 11888 68.5 4224062 243.3
2006 CBSE – Morning Shift Vs. Evening Shift

Merged Schools
Appeared Passed PP%
Before merger - 2005
195 123 63.08
After Merger -2006
145 112 77.24

Adopted Schools Result- Class XII
Appeared Passed PP%
Before Adoption - 2005
1990 1235 62.06
After Adoption -2006
1760 1167 66.31

Top 10 adopted Schools result comparison with 2005's - Calss XIISl. No
Name of the School 2006 2005 Increase in
PP
Name of the adopted officer
App
Pass
PP% APP
Pass PP%
1 GOVT BOYS SR SEC SCH K BLOCK JAHANGIR PURI DELHI
30 28 93.33 47 38 80.85 12.48 Sh. Malkhan Singh, DDE(CN)
2 GOVT BOYS SR SEC SCHOOL R P BAGH DELHI
15 14 93.33 22 11 50 43.33 Sh. G.T. Zakarde, DDE(Voc)
3 GOVT BOYS SR SEC SCH PHASE II ASHOK VIHAR DL
57 52 91.23 60 41 68.33 22.9 Sh. B.L. Yadav, DDE(PLg.)
4 GOVT BOYS SR SEC SCHOOL KHICHRIPUR DELHI
33 30 90.91 26 10 38.46 52.45 Shri Tula Ram, ADE(Plg.)
5 GOVT GIRLS SR SEC SCH NICHOLSON ROAD DELHI
28 25 89.29 17 16 94.12 -4.83 Shri S.A. Ali, DDE(Patrachar)
6 GOVT BOYS SR SEC SCH SECTOR VI RK PURAM ND
25 22 88 68 44 64.71 23.29 Sh. C.Minz, DDE(*HQ)
7 GOVT BOYS SR SEC SCHOOL NO 2 MODEL TOWN DELHI
32 28 87.5 55 29 52.73 34.77 Smt. Rita Sharma, DDE(Welfare)
8 GOVT. GIRLS SR SEC SCH NO 3 ROOP NAGAR DELHI
46 39 84.78 48 45 93.75 -8.97 Sh.G.T. Zakarde ,DDE(Voc.)
9 V BHAVE SARVODAYA GIRLS S S S NEW SEEMAPURI DLI
38 32 84.21 41 20 48.78 35.43 Sh. V.C. Pachouri, ADE(Estate)
10 SARVODAYA COED SSS GHEVRA DELHI
29 24 82.76 37 21 56.76 26 Sh. O.P. Arora, ADE(Text book)

Sl.No zone enrolment Teachers PTR A_06 P_06 PP_06
1 8 1262 95 13 647 515 79.6
2 28 965 67 14 521 414 79.5
3 27 1429 90 16 631 526 83.4
4 20 2553 146 17 1355 1033 76.2
5 19 3931 212 19 1958 1437 73.4
6 16 2370 127 19 1176 795 67.6
7 26 905 48 19 377 276 73.2
Average: 13415 785 17 6665 4996 75.0
8 11 5587 291 19 2637 2095 79.4
9 24 3576 178 20 1721 1275 74.1
10 22 4565 224 20 2187 1834 83.9
11 15 3744 182 21 1834 1469 80.1
12 3 4809 228 21 2362 1799 76.2
13 2 7341 345 21 3683 2772 75.3
14 14 4265 198 22 2065 1688 81.7
Average: 33887 1646 21 16489 12932 78.4
Zone wise PTR and Pass Percent
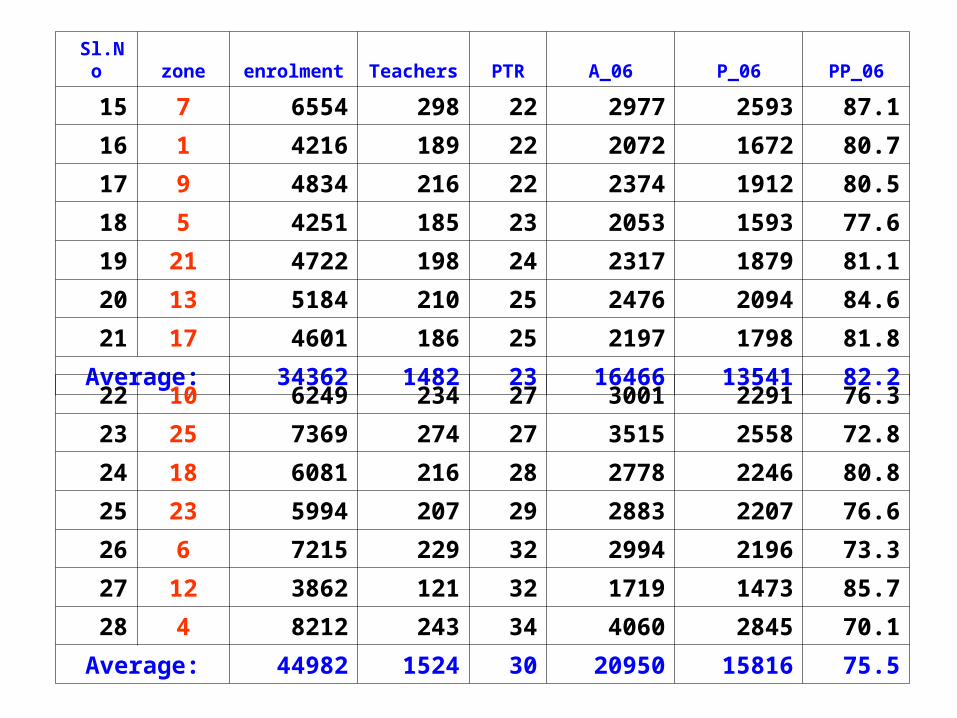
Sl.No zone enrolment Teachers PTR A_06 P_06 PP_06
15 7 6554 298 22 2977 2593 87.1
16 1 4216 189 22 2072 1672 80.7
17 9 4834 216 22 2374 1912 80.5
18 5 4251 185 23 2053 1593 77.6
19 21 4722 198 24 2317 1879 81.1
20 13 5184 210 25 2476 2094 84.6
21 17 4601 186 25 2197 1798 81.8
Average: 34362 1482 23 16466 13541 82.2
22 10 6249 234 27 3001 2291 76.3
23 25 7369 274 27 3515 2558 72.8
24 18 6081 216 28 2778 2246 80.8
25 23 5994 207 29 2883 2207 76.6
26 6 7215 229 32 2994 2196 73.3
27 12 3862 121 32 1719 1473 85.7
28 4 8212 243 34 4060 2845 70.1
Average: 44982 1524 30 20950 15816 75.5

P T R & P a s s p e r c e n t a g e 2 0 0 6
3 43 23 22 92 82 72 72 52 52 42 32 22 22 22 12 12 12 02 01 91 91 91 91 71 61 41 3
2 2
8 6
7 37 78 1
7 37 6
8 28 58 17 8
8 18 18 78 2
7 57 68 0
8 4
7 47 9
7 36 87 37 6
8 37 98 0
7 0
0
2 0
4 0
6 0
8 0
1 0 0
8 2 8 2 7 2 0 1 9 1 6 2 6 1 1 2 4 2 2 1 5 3 2 1 4 7 1 9 5 2 1 1 3 1 7 1 0 2 5 1 8 2 3 6 1 2 4
Z o n e N u m b e r
P T R P a s s P e r c e n t a g e

Top 10 Non-Pratibha Schools based on Quality Index
Sl. No.
Name of the School APP Pass
PP% QI Rank QI
1 GOVT GIRLS SR SEC SCHOOL 1 SHAKTI NAGAR DELHI
201 194 96.5 327.4 15
2 SARVODAYA G SSS HARI NGR CLOCK TOWER ND
32 29 90.6 323.4 16
3 SARVODAYA GIRLS SR SEC SCH ALIPUR DELHI
58 57 98.3 321.3 17
4 SARVODAYA GIRLS SSS MUNDKA DELHI 94 90 95.7 320.8 18
5 SARVODAYA GIRLS S S S RAJOURI GARDEN EXT ND
152 152 100.0 320.6 19
6 GOVT GIRLS SR SEC SCH KHAIRA NEW DELHI
46 44 95.7 319.5 20
7 GOVT GIRLS SR SEC SCH NO 1 ROOP NAGAR DELHI
230 213 92.6 319.4 21
8 S A B GOVT SARVODAYA VIDYALAYA LUDLOW CASTLE DLI
119 107 89.9 318.8 23
9 GOVT GIRLS SR SEC SCHOOL VIVEK VIHAR DELHI
301 291 96.7 318.1 24
10 GOVT GIRLS SR SEC SCHOOL KANTI NAGAR DELHI
26 26 100.0 317.3 25

Top Five Non-Pratibha Schools 2006
Name of the School A_06QI_7
0QIRk_70
GOVT GIRLS SR SEC SCHOOL VIVEK VIHAR DELHI
301381.
51
GOVT GIRLS SR SEC SCHOOL 1 SHAKTI 0GAR DELHI
201379.
22
S B B M SARVODAYA VID. SHANKARACHARYA MARG DL
189371.
63
GOVT GIRLS SR SEC SCH NO 1 ROOP 0GAR DELHI
230370.
14
SARVODAYA CO-ED SR SEC SCH SARASWATI VIHAR DL
149360.
25
Top Five Pratibha Schools 2006
Name of the School QI
RAJKIYA PRATIBHA VIKAS VIDYALAYA GANDHI NGR DLI
389.77
PRATIBHA VIKAS VIDYALAYA SURAJMAL VIHAR DELHI
377.10
RAJK.PRATB.VIKAS VID.SHALIMAR BAGH DELHI
372.87
RAJKIYA PRATIBHA VIKAS VIDYALAYA HARI NAGAR ND
372.41
RAJKIYA PRATIBHA VIKAS VIDYALYA KISHAN GUNJ DL
364.44

THANKS